^lc.^.^^q^^^^ - tdl
TRANSCRIPT

CALCIUM TRANSPORT IN THE PHOTOSYNTHETIC PURPLE
BACTERIUM CHROMATIUM VINOSUM
by
CINDY RENE' PEACH, B.S.
A THESIS
IN
CHEMISTRY
Submitted to the Graduate Faculty of Texas Tech University in Partial Fulfillment of the Requirements for
the Degree of
MASTER OF SCIENCE
Approved
• C - ' ^ ^ ^ - j ^ ^ U«t-^
'^Lc.^.^^Q^^^^ Accepted
Dean o ^ t h e Graduate School
May, 1986

FOREWORD
Kalzium macht alles.
L.V. Heilbrunn (1883)
We dance round in a ring and suppose
But the Secret sits in the middle and knows
Robert Frost
11
ACKNOWLEDGMENTS
My deepest gratitude and love to my parents, brothers,
and grandparents, with whose love and constant encouragement
made this accomplisment possible.
I wish to thank the members of my committee. Dr. John
A. Anderson and Dr. Richard A. Bartsch, for their assistance
in the preparation of this thesis. I would like to thank
Dr. Charlotte Kampf for her assistance in growing the
Chromatium vinosum,, advice, and many helpful discussions.
I offer my admiration and heart felt gratitude to Dr.
David B. Knaff for his guidence and assistance throughout my
research and graduate studies.
Ill

CONTENTS
FOREWORD ii
ACKNOWLEDGMENTS iii
TABLES V
FIGURES vi
NOMENCLATURE vii
CHAPTER
I. INTRODUCTION 1
II. MATERIALS AND METHODS 5
Materials 5
Growth of Chromatium vinosum 5
Calcium Transport Experiments 5
Methods 6
Reagent and Solution Preparation 6
Growth and Preparation of Q.. vinosum Whole Cells 7
Preparation of Q.. vinosum Chromatophores . . 9
Filter Assay Technique 9
Flow Dialysis Technique 11
III . RESULTS AND DISCUSSION 15
Ca "*" Uptake Experiments with Whole Cells.... 15
Ca "*" Efflux Experiments with Illuminated Whole Cells 34
Ca Uptake Experiments with Illuminated Chromatophores 42
IV. SUMMARY, CONCLUSION AND DISCUSSION 60
Summary 60
Conclusion and Discussion 62
REFERENCES 64
IV

TABLES
Defined Synthetic Culture Medium for the Growth of the Photosynthetic Bacterium Chromatium vinosum 8
The Effect of Ruthenium Red on 204r[.3 + ^^^ 22 ^ + Uptake by Q.. vinosum Cells in the Dark 27
The Effect of La " on 204rp-L+ ^^^ ^^ua+ Uptake by £. vinosum Cells in the Dark 31
The Effect of Inhibitors and lonophores on ^ Ca2''" Uptake by £. vinosum Cells in the Dark 32
The Effect of Phenothiazine Drugs on ^ Ca2''" Uptake by C. vinosum Cells in in the Dark 35
The Effect of Ruthenium Red and La-"*" on ^^Ca2"^ Efflux from Illuminated Q.. vinosum Cells 37
The Effect of Phenothiazine Drugs on 204.p-j + ^ ^ ^^Na"^ Efflux by Illuminated Q.. vinosum Cells 40
V

FIGURES
1. Schematic representation of the flow dialysis apparatus 12
2. Time course for ^^Ca2'^ uptake by Q.. vinosum cells in the dark 16
3. Lineweaver-Burk Plot for ^ Ca2''" uptake by £. vinosum cells in the dark 19
4. The structures of four calcium antagonists: A. Ruthenium Red, B. Phenothiazine, C. Chlorpromazine, and D. Trifluoperazine 21
5. The effect of ruthenium red on ^ Ca "*" uptake by Q.. vinosum cells in the dark 24
6. The effect of La""*" on ^ Ca "*" uptake by £. vinosum cells in the dark 28
7. The effect of phenothiazine drugs on ^ Ca2''' efflux from illuminated Q. vinosum cells 38
8. The effect of Ca' on proton efflux from £. vinosum chromatophores 43
9. Light-dependent ^ Ca2''" uptake by Q.. vinosum chromatophores 4 6
10. The effect of chlorpromazine on ^ Ca2''' uptake by illuminated Q.. vinosum chromatophores 48
11. The effect of phenothiazine on ^ Ca2''" uptake by illuminated £.. vinosum chromatophores 50
12. The effect of trifluoperazine on ' Ca2''" uptake by illuminated £. vinosum chromatophores 52
13. The effect of ruthenium red on ^^Ca^'^ uptake by illuminated C vinosum chromatophores 55
14. The effect of La3+ on ^ Ca "*" uptake by illuminated Q.. vinosum chromatophores 57
VI
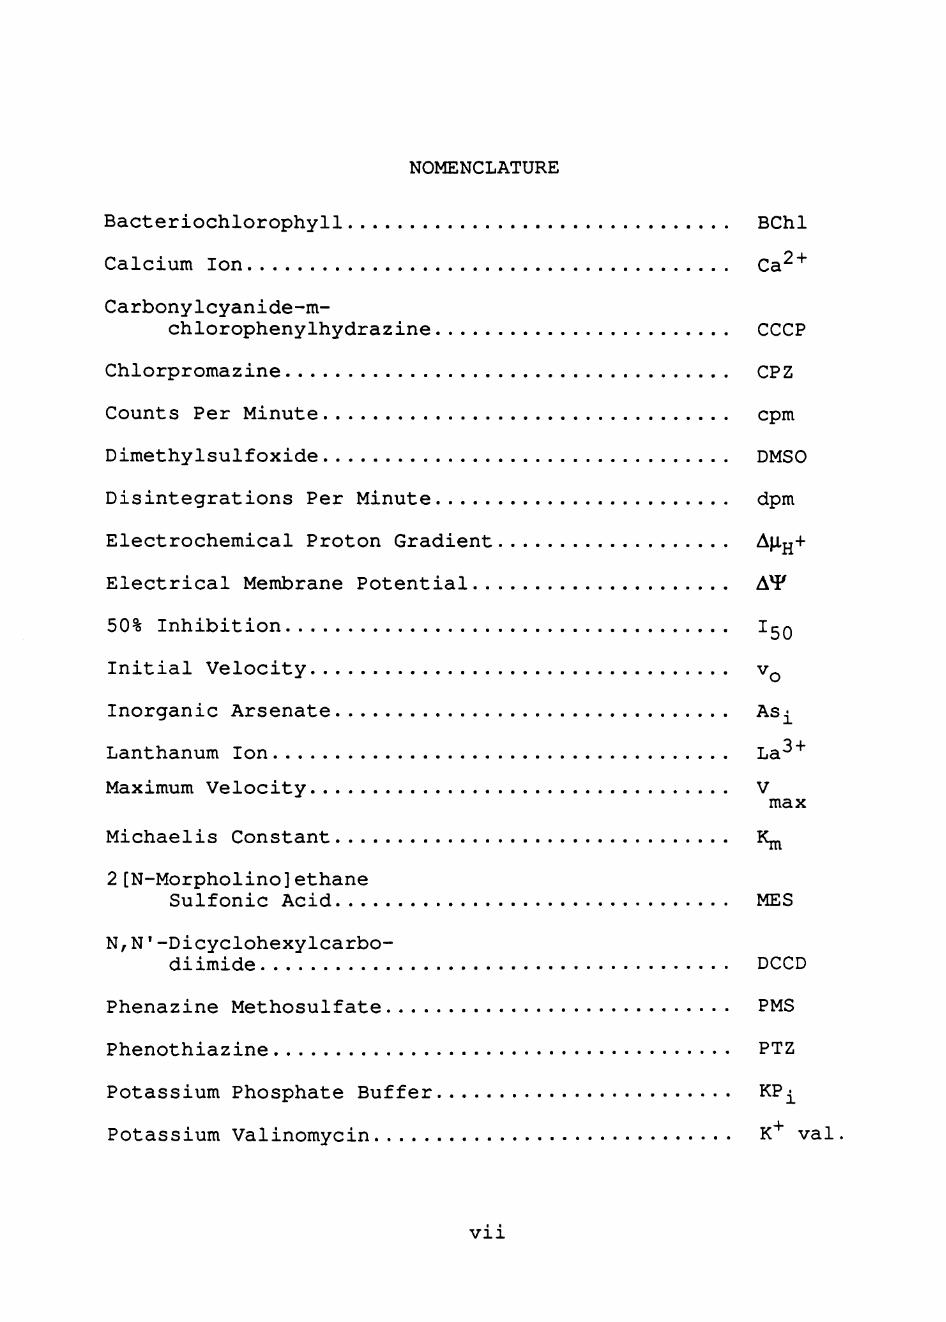
NOMENCLATURE
Bacteriochlorophyll BChl
Calcium Ion Ca "*"
Carbonylcyanide-m-
chlorophenylhydrazine CCCP
Chlorpromazine CPZ
Counts Per Minute cpm
Dimethylsulf oxide DMSO
Disintegrations Per Minute dpm
Electrochemical Proton Gradient M-H"*"
Electrical Membrane Potential A ^
50% Inhibition I^Q
Initial Velocity v^
Inorganic Arsenate Asj^
Lanthanum Ion La^"^
Maximum Velocity V max
Michaelis Constant Kj^
2[N-Morpholino]ethane Sulfonic Acid MES
N,N'-Dicyclohexylcarbo-
diimide DCCD
Phenazine Methosulfate PMS
Phenothiazine PTZ
Potassium Phosphate Buffer KPj_
Potassium Valinomycin K"*" val
Vll
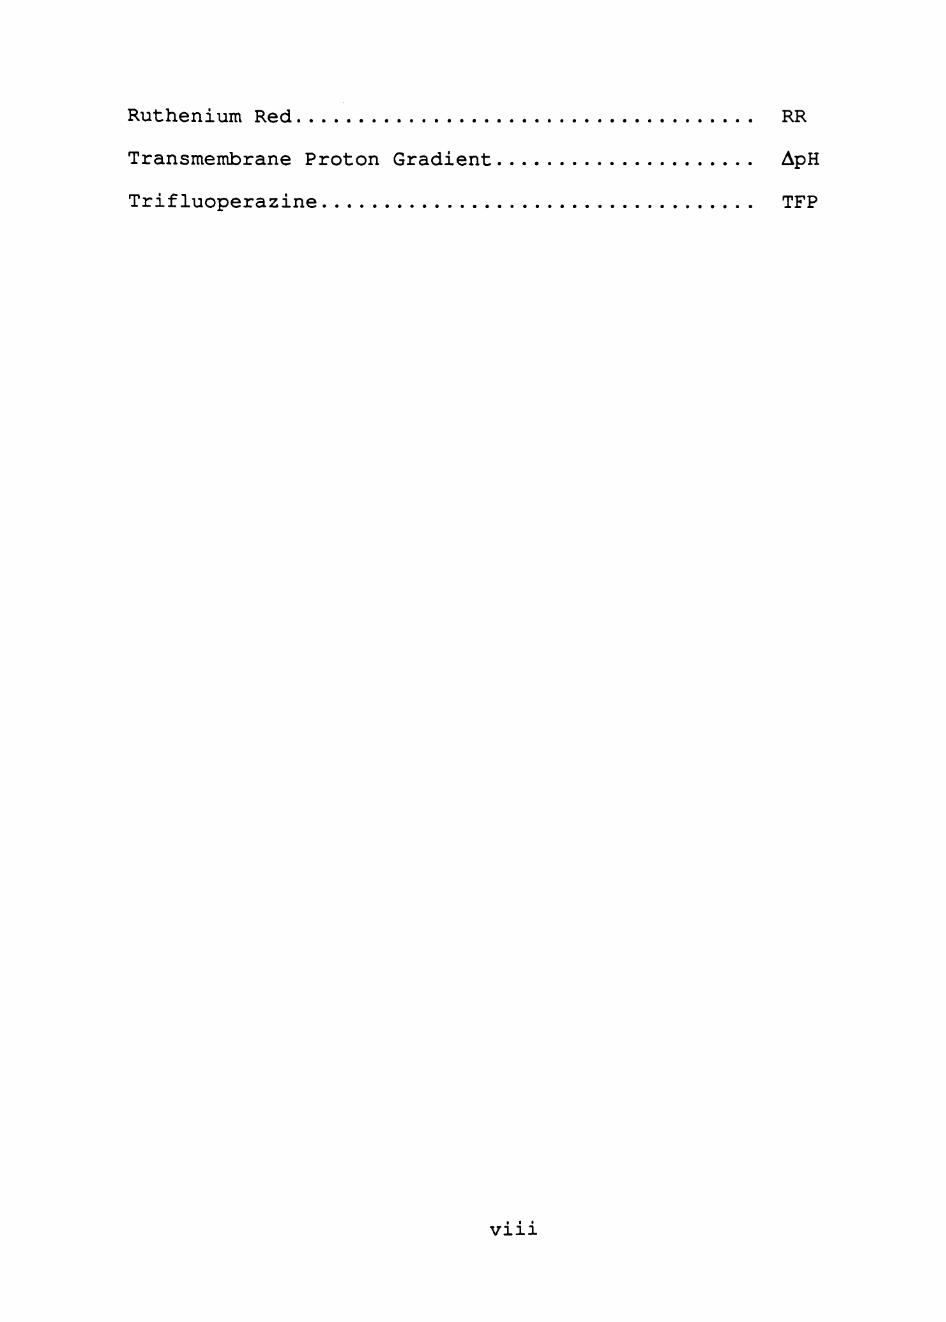
Ruthenium Red RR
Transmembrane Proton Gradient ApH
Trifluoperazine TFP
Vlll
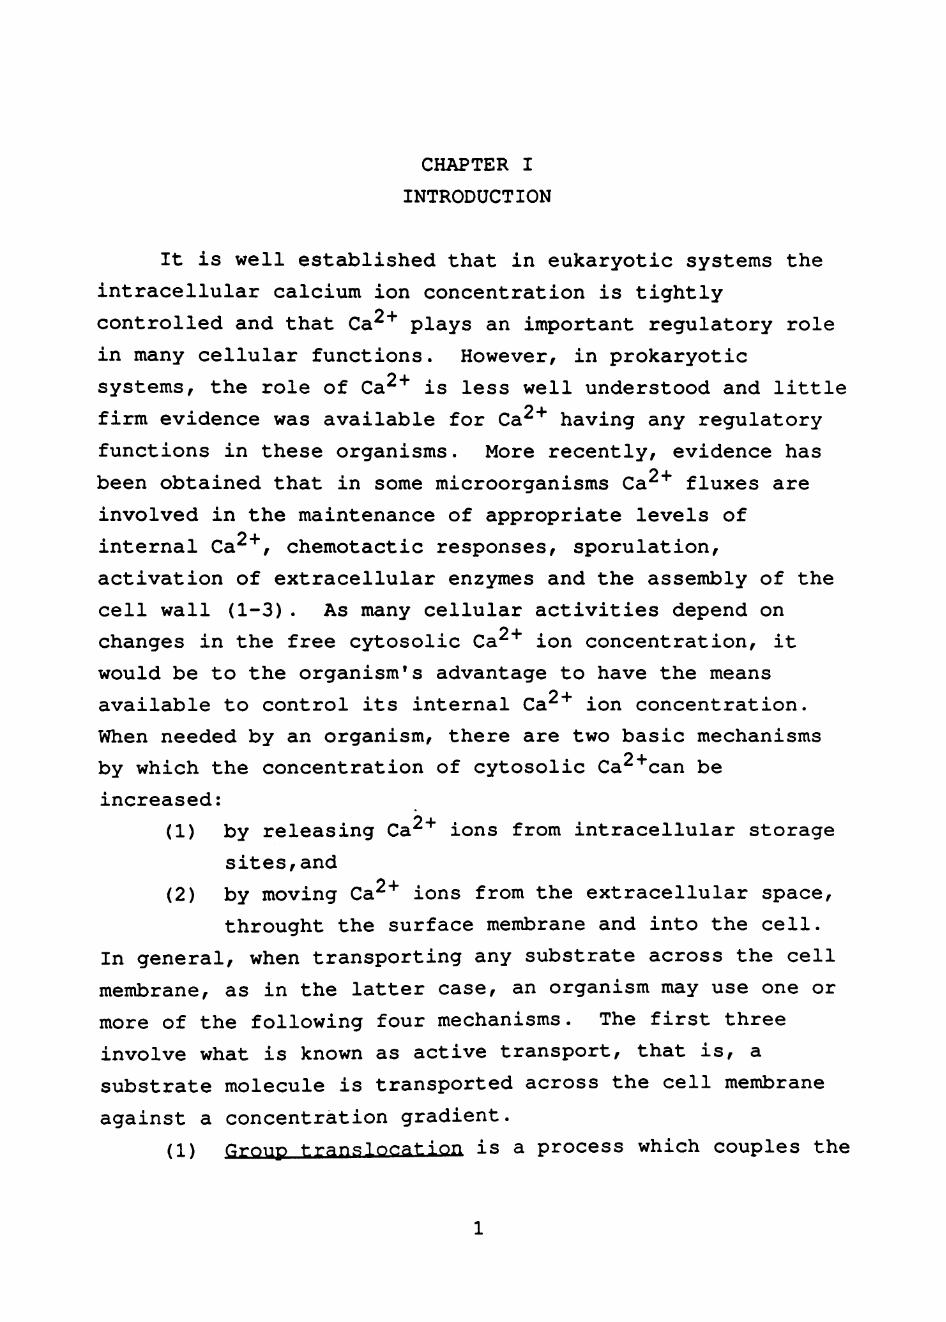
CHAPTER I
INTRODUCTION
It is well established that in eukaryotic systems the
intracellular calcium ion concentration is tightly
controlled and that Ca2"*' plays an important regulatory role
in many cellular functions. However, in prokaryotic
systems, the role of Ca "*" is less well understood and little
firm evidence was available for Ca "*" having any regulatory
functions in these organisms. More recently, evidence has
been obtained that in some microorganisms Ca2"'" fluxes are
involved in the maintenance of appropriate levels of O I
internal Ca^ , chemotactic responses, sporulation,
activation of extracellular enzymes and the assembly of the
cell wall (1-3). As many cellular activities depend on
changes in the free cytosolic Ca "*" ion concentration, it
would be to the organism's advantage to have the means O 1
available to control its internal Ca^ ion concentration.
When needed by an organism, there are two basic mechanisms
by which the concentration of cytosolic Ca2''"can be
increased:
(1) by releasing Ca2"'' ions from intracellular storage
sites,and
(2) by moving Ca "*" ions from the extracellular space,
throught the surface membrane and into the cell.
In general, when transporting any substrate across the cell
membrane, as in the latter case, an organism may use one or
more of the following four mechanisms. The first three
involve what is known as active transport, that is, a
substrate molecule is transported across the cell membrane
against a concentration gradient. (1) Group tr n.qi oration is a process which couples the

2
transport of molecules across the cell membrane to a
chemical modification.
(2) Membrane-bound transport systems involve proteins
or permeases firmly bound to the cell membrane. Substrate
molecules are transported with no modification against a
concentration gradient.
(3) Binding protein transport systems also transport
substrate molecules against a concentration gradient with no
change; however, these transport systems require a soluble
protein component or components which specifically bind the
substrate to be transported. Processes (2) and (3) are
called carrier-mediated transport processes because the
molecular transport is facilitated by a protein carrier.
(4) Simple diffusion involves moving a molecule from
higher concentration to an area of lower concentration
through the cellular membrane. This requires that the
molecule transported be somewhat hydrophobic to enable it to
be soluble in the lipid bilayer. The first three can be
differentiated from the fourth by transport kinetics
utilizing double-reciprocal (Lineweaver-Burk) plots.
The most important structures controlling transport
systems of the second type are the proteins embedded in the
lipid bilayer of the membrane, which function as channels or
pores through which substrate may move. These pores or
channels which transport substrate may also co-transport
another substrate in a variety of manners. If the substrate
of interest is transported into the organism while another
is simultaneously exported, then the channel is considered
to be an antiport (anti=opposite, port=to carry). However,
if the substrate is obligatorily co-transported into the
cell along with another substrate or ion, then the channel
is called a symport (sym=same, port=to carry). In some
cases, the substrate may be moved into the organism without
an additonal substrate or ion involved, in this situation
the channel is named an uniport (uni=one, port=to carry).

3
It has been known for some time that there exists a whole
variety of substrate-specific transport systems for a number
of amino acids, dicarboxylic acids, sugars, cations, and
protons in several different types of bacteria (4).
Recently, many substrate-specific transport systems have
been well characterized in the photosynthetic purple sulfur
bacterium Chromatium vinosum (5-7).
The chemiosmotic hypothesis suggests that bacteria use
an electrochemical proton gradient (A|j.jj+) to drive active
transport. In phototrophic bacteria, A\i^+ is created by
electron flow through the photosynthetic apparatus which is
obligatorily coupled to proton extrusion. The
electrochemical proton gradient consists of two components:
(1) the transmembrane proton gradient (ApH), and
(2) the electrical membrane potential (A^) .
There is strong evidence that most of the membrane-bound
transport systems in bacteria utilize one or both of the two
components of A}ijj+ to supply energy for active transport
(8-14). Antiports, symports and uniports were proposed by
Mitchell (15) as a means of coupling transport to Aiijj+.
Relatively little information is available concerning
the mechanism or mechanisms of cation transport in
photosynthetic bacteria (16,17). There is substantial
evidence demonstrationg the existence of sodium dependent
transport systems in several bacteria (for a detailed review
see reference 4) . Sodium-proton antiports, driven by A\i^+,
have been discovered in the non-photosynthetic bacterium
Barillus alrolophilus (18-20) and the photosynthetic
bacterium Alteromonas baloplanktis (21,22). The presence of
a potassium proton antiport has also been demonstrated in E.
alcolophilus (23).
Recently it has become clear that there exists a number
of potential-dependent Ca "*" channels, each with distict
properties (24). Evidence has been obtained for the
presence of Na' '/H'*' and Ca ' '/H' antiports in the

4
photosynthetic purple non-sulfur bacterium Rhodospirillium
rub rum (25,26). A Ca2"'"/H"'' antiport, as well as Na''"/H' and
K /H"'" antiports, have been shown to be present in Q.. vinosum
(25-27) . In previous experiments performed in this
laboratory, the £. vinosum Ca ' /H''' antiport was shown to be
driven by the electrochemical proton gradient (A|XH+) (2 6) .
Q.. vinosum^ a facultative anaerobe and autotroph (28) ,
was the organism utilized in these studies. The purpose of
the work was further characterization of the Ca2''"/H'*"
antiporter, in particular its inhibitor sensitivity.
Evidence was also obtained to suggest that Q.. vinosum has a
second Ca2'^ transport system, distinct from the Ca2''"/H''"
antiporter. This second tranport system provides a
mechanism for Ca2" entry into the cells. The work presented
in this thesis will address these two Ca "*" transport
systems.

CHAPTER II
MATERIALS AND METHODS
Materials
Growth of Chromatium vinosnm
Potassium phosphate (K2HPO4 and KH2PO4), potassium
chloride (KCl), ammonium chloride (NH4CI), magnesium sulfate
(MgS04•7H2O), disodium ethylenediaminetetraacetic acid
(Na2-EDTA), ferrous chloride (FeCl2*4H2O), zinc chloride
(ZnCl2) f zinc sulfate (ZnS04 •7H2O) , "manganese chloride
(MnCl2•6H2O), boric acid (BH3O3), nickel chloride
(NiCl2*6H2O), sulfuric acid (H2SO4), sodium bicarbonate
(NaHC03), and sodium thiosulfate (Na2S203*5H2O) were
obtained from Fisher Scientific. Calcium chloride
(CaCl2*7H20), sodium molybdate (Na2Mo04•2H2O) and sodium
sulfide (Na2S•9H2O) were purchased from MCB Reagents.
Cobalt chloride (CoCl2*6H20) was purchased from American
Drug and Chemical Company. Cupric chloride (CuCl2'2H20) was
obtained from Merck and Company. DL-Malic acid was obtained
from Sigma Chemical Company.
Membrane filters (0.2 |Xm) used for membrane filtration
sterilization were purchased from Millipore Corporation.
Nitrogen gas (N2) was purchased from Liquid Air Corporation.
Calcium Transport Experiments
[" Ca] Calcium chloride (CaCl2) specific activity, 36.2
mCi/mg Ca, was obtained from ICN Radioisotope Division.
[^^Na]Sodium chloride (NaCl), specific activity, 200 mCi/mg
Na, and [^^^11] thallium sulfate (TI2SO4), specific
activity, 5.3 mCi/mg Tl, were obtained from Amersham
Corporation. [^^C]Methylamine hydrochloride, specific
activitry, 40.0 mCi/mmol, was obtained from New England

6
Nuclear. Ruthenium red (RR) and lanthanum chloride (LaCl3)
were generous gifts from Prof. Pill-Soon Song.
Chlorpromazine (CPZ), trifluoperazine(TFP), phenothiazine
(PTZ), carbonylcyanide-m-chlorophenylhydrazine (CCCP),
N,N'-dicyclohexylcarbodiimide (DCCD), phenazine methosulfate
(PMS) , potassium valinomycin (K"*" valinomycin) , sodium
arsenate (As^), dimethylsulfoxide (DMSO), potassium
phosphate (K2HPO4 and KH2PO4), calcium chloride
(CaCl2*7H20), lithium chloride (LiCl), lithium nitrate
(LiN03), 2[N-morpholino]ethane sulfonic acid (MES), and
choline were purchased from Sigma Chemical Company and used
without futher purification.
Membrane filters (0.45 |im) were purchased from
Millipore Corporation or Amicon. Packard "Filter Count" or
National Diagnostics "Filtron-X" was used as the
scintillation cocktail for filter assays. Spectropore No. 2
dialysis tubing was purchased from Sigma Chemical Company.
Packard "Picofluor" or INC Radiochemicals "Universol" was
used as the scintillation cocktail for aqueous samples.
Methods
Reagent and Solution Preparation
All solutions were made using doubly-distilled water.
All chemicals were reagent grade and obtained from
commercial sources. In transport assays, inhibitors were
added as small aliquots of concentrated stock solutions
using either water or dimethylsulfoxide (DMSO) as the
solvent. The final volume of DMSO was always < 2% (v/v), at
which concentrations DMSO itself was shown to have no effect
on cation transport.

7 Growth and Preparation of C. vinosum Whole Cells
Chromatium vinosum was grown on a malate-containing
medium described by Pfennig at. ai- (2 9) as modified by Kampf
(30) . This method utilizes a medium with increased sulfide
concentration compared to that (31) previously utilized in
our laboratory. With increased sulfide, contaminants such
as Rhodospri11ium rubrum find the environment too harsh for
growth. Table 1 shows the defined synthetic culture medium
used to grow £. vinosum cells. New cultures were inoculated
with 6% of a log phase culture. These cultures were then
allowed to equilibrate for 6 hours in the dark after which
they were placed in the light. All experiments were carried
out on cultures near the end of log phase, that is, cells
that were harvested after illumination at a light intensity
of 7.5 X 10"^ erg'cm~^*s~^ for 2.5 days after inoculation.
Cells were harvested using a Beckman J-21B preparative
centrifuge with a type JA-20 rotor at 4,000 x g for 5
minutes at 5*C. Cells were washed twice and resuspended in
a minimum volume of the buffer to be used in the subsequent
experiment. The resuspended cells were then stored on ice
under a N2 atmosphere prior to experimental use.
The bacteriochlorophyll (BChl) concentration was
determined by the method of Clayton (32), using a 7:2 (v/v)
acetone:methanol solution for extraction. A 0.1 mL volume
of cells was extracted with 4.9 mL of solvent and filtered
through a Whatman No. 1 analytical grade filter paper. The
absorbance of the filtrate was measured at 772 nm using a
Bausch and Lomb Model 710 UV-Visable 710 Spectrophotometer.
BChl concentrations were calculated from the Beer-Lambert
Law, using an extinction coefficient for BChl of 75
mM"^-cm"^ (33).

8
Table 1. Defined Synthetic Culture Medium for the of the Photosynthetic vinosum
Component
1. Macroelements
2. Trace Elements
3. Buffer
4. Reducing
•
Ion
(P04)3" K+ (NH.) + Mg2^ (SQ4)2-Ca2^
Fe2 + Zn2 + Mn2 + (BQ^)^-
Ni2 + Cu2 + (Mo04)2-
(HCO3)"
S2-
Growth : Bacterium Chromatium
Chemical Source Concentration
KH2PO4 KCl NH4CI MgS04-7H20 MgS04*7H20 CaCl2*2H20
FeCl2*4H20 ZnCl2 MnCl2 H3BO3 CoCl2'6H20 NiCl2*6H20 CuCl2*2H20 Na2Mo04•2H2O
NaHC03
Na2S'9H20
2 mM 4 mM 6 mM 2 mM 2 mM 1 mM
7.5 |iM 0.5 \iM 0.5 |XM 1.0 \m 0.8 p.M 0.1 }iM 0.1 |XM 0.15 IM
60 mM
1-2 mM Agent
5. Vitamin
6. Substrates
Cyanocobalamine 15 nM
(S2O3) Malate
2- Na-Na'
1^203' • -Mali
•5H2O c Acid
10 mM 10 mM
All solutions were made from reagent grade chemicals and doubly-distilled water under sterile conditions. Reducing agent (S ) stock solution was replinished every 2 months.
Preparation of C. vinosum rhromatophores
Chromatophores (inside-out vesicles of photosynthetic
bacterial whole cells) were prepared essentially as
described by Knaff and Buchanan (33). £. vinosum cells,
washed twice with potassium phosphate buffer and resuspended
to a concentration of approximately 5 mg cell weight/mL
buffer, were sonicated using a Branson Model 200 Sonifier at
50% duty cycle at a power setting of 7 for a total of 6
minutes, alternating 30 seconds with power on and 30 seconds
with power off. To prevent overheating during sonication,
the cells were placed in an ice bath. Sonicated cells were
centrifuged at 16,000 x g for 10 minutes. The supernatant
was then centrifuged at 300,000 x g for 35 minutes using a
Beckman L5-65 Ultracentrifuge and type 65 rotor. The
resulting chromatophore pellet was resuspended in a minimum
volume of buffer to be used in the flow dialysis experiment.
The resuspended chromatophores maintained activity for up to
2 hours when kept at ice temperature.
Filter Assay Technique
A filter assay technique (85) was used, where
indicated, as a means of monitoring calcium, sodium or
thallium transport in cells. Transport studies were
performed under anaerobic conditions in stoppered test tubes
flushed with water-saturated N2. In dark uptake
experiments, £. vinosum cells (ecjuivalent to [BChl] = 150
|XM) were placed in a reaction mixture (final volume = 100
|XL) with the appropriate assay buffer, inhibitors,
uncouplers or ionophores, and allowed to incubate for 5
minutes (except for samples containing arsenate which were
allowed to incubate for 30 minutes) in the dark under
water-saturated N2 prior to the onset of the experiment.
The experiment was initiated by the addition of 10 mM cation
( Ca"*", 22jjQ+ 204rj,2+j Reaction samples were allowed a 75
minute dark-loading period, after which the internal content

10
of a particular cation was determined by trapping cells on
membrane filters. A 1.0 mL aliquot of 0.1 M LiCl in the
cases of Ca "*" and Na"*", or 0.1 M LiN03 in the case of Tl" ,
was added to each tube to quench the reaction. The reaction
mixture was then filtered using a Millipore filter assay
apparatus fitted with either a Millipore or Amicon 0.45 |im
pore size filter. An additional 1.0 mL alicjuot of LiCl or
LiN03 solution was then used to rinse the test tube and
filter. The filter was then dissolved in 4.5 mL of either
Packard "Filter Count" or National Diagnostics "Filtron-X"
scintillation cocktail. The samples were counted using a
Beckman LS-7000 Liquid Scintillation Counter. To determine
nonspecific binding of radioactive cations to the filter,
samples were prepared as described previously, except the
first 1.0 mL of lithium salt solution was added prior to the
addition of the radionuclide, followed by immediate
filtration of the reaction mixture.
The percent counting efficiency was calculated from the
equation:
(measured cpm/dpm) x 100 = % efficiency.
This correction factor was then used to convert counts to
moles of cation transported. In samples containing
[ Ca "*"], [ Na" ] , or [204^1+], counting efficiency was
determined in this fashion: Samples were prepared in an
identical manner to the actual reaction mixtures, except no
radionuclide was added prior to filtration. The filter was
treated as before and a known amount of isotope, with known
dpm (disintegrations per minute) was added to the
scintillation vial.
Kj and V^^^ values for dark uptake experiments were
determined using Lineweaver-Burk, double-reciprocal plots.
Initial velocity was measured as a function of substrate
concentration. Values were determined by averaging the

11
results of repeated experiments, using uptake during the
first 40 minutes to estimate VQ, and calculated using a
linear least-squares graphics program.
Prior to the calcium efflux experiments, cells were
loaded with ^ Ca "*" by incubation with 10 mM [' Ca]CaCl2
(specific activity of 1 x 10^ dpm/nmol Ca) for 75 minutes in
the dark. Prior to the sodium efflux measurements, cells
were loaded with ^^Ua"^ by incubation with 10 mM [22Na]NaCl
(specific activity of 4.4 x 10" dpm/nmol Na) for 75 minutes
in the dark. Prior to the thallium efflux measurements,
cells were loaded with 204rj,2_+ j-y incubation with 10 mM
[204^1]TISO4 (specific activity of 3.7 x 10^ dpm/nmol Tl)
for 75 minutes in the dark. All reaction mixtures were kept
on ice under a water-saturated N2 atmosphere. After the 75
minute dark loading period, samples were illuminated by a 75
watt bulb to provide a light intensity of 7.5 x 10"^
ergs'cm'^'s" , for 20 minutes. Light intensities were
measured using a Yellow Springs Instruments Model 65A
Radiometer. All inhibitors, uncouplers, or ionophores were
added directly after the 75 minute pre-incubation, prior to
the 20 minute illumination period. Samples were quenched
and counted as described for dark uptake experiments.
Flow Dialysis Technique
Flow dialysis was performed as described by Ramos ot.
al. (9), except that the sample chamber was continuously
flushed with water-saturated N2 gas. Figure 1 shows a
schematic representation of the flow dialysis apparatus.
This technique was used to monitor the light-dependent
uptake of calcium by £. vinosum chromatophores. The upper
sample chamber of the flow dialysis cell contained
chromatophores (equivalent to 150 IM BChl) along with the
appropriate inhibitor, cation and buffer. The total
reaction volume was 500 L. Because £. vinosum
chromatophores lose the soluble electron carrier, cytochrome

12
rD„:

Upper Chamber: Chromatophores, Ra(Jionucli(de and Inhibitor
13
Buffer bubbled with Water-saturated Nitrogen
Dialysis Membrane
Fraction Collector
1 cm

14
^551' during preparation (34,35), it was necessary to add
the non-physiological electron carrier phenazine
methosulfate (PMS) in order to restore cyclic electron flow.
The lower chamber contained the flow-through buffer, which
was continually flushed with N2 gas, as was the upper
chamber which contained the reaction mixture. The
flow-through buffer also contained PMS (5 \iM) and the
inhibitor in a concentration equivalent to that in the
reaction mixture. Approximately, 30 fractions were
collected before turning on the light to start uptake.
These fractions were collected to establish an adequate
baseline prior to the initiation of uptake. Illumination
was provided by a Unitron Microscope lamp at an intensity of
7.5 X 10"^ erg'cm"- • s"-'-. Fractions of 1.5 mL were taken at
a flow rate of 6.0 mL/min. From the fractions collected,
1.0 mL aliquots were taken and combined with 3.0 mL of
"Universol" or "Picofluor" scintillation cocktail for
aqueous samples and counted as described. Uptake in
chromatophores would be represented as a deviation from the
established baseline.

CHAPTER III
RESULTS AND DISCUSSION
^a^"^ Uptake Experiments with Wholf C^lls
Whole cells of purple photosynthetic bacteria show
light-dependent proton ejection (34,36,37), leading to the
formation of a ApH (outside acidic) and a membrane potential
A^ (outside positive). It has been shown previously in this
laboratory, that Chromatium vinosum possesses a
calcium-proton antiport (2 6). It was also found that the
operation of this antiport is electrogenic, with H"'":Ca2'*" >
2. Electrogenic transport processes are those in which net
electrical charge is transported across the membrane (4,38).
In these prior experiments, Q.. vinosum cells were loaded
with ^ Ca2''" using [^^Ca]CaCl2f during a 75 minute
pre-incubation in the dark under a N2 atmosphere. It was
not known whether this loading occurred through a O I
non-specific, limited Ca permeability across the membrane O 1
or was catalyzed by a specific Ca transport system. In
order to investigate this question, one of the methods used
involved transport kinetics. Transport proteins, like
enzymes, take part in substrate binding and release and are
therefore saturable [the rate of substrate transport
increases with increasing substrate concentration from an
initial velocity (VQ) to a maximum velocity (V ^ ^ ) ] , and
substrate-specific (39,40). If a particular substrate is
transported by a number of transport systems, as appears to
be the case with Ca "*", then multiple Kj values may be
obtained.
To examine the Ca2" loading mechanism, the effect of
varying the Ca " concentration on the initial rate of Ca
uptake in the dark was studied. The data presented in
Figure 2, represent the results of a time course study of
15

16

17
180
160
140
120
100
o 00
o CO
o
o CM
(min)
Time
Dark
(gOl X Ludo)
(l/NjLUOl) ep!JO|M0 ujnioiBO (BQ^^J

18
the uptake of ^^Ca2+ by Q. vinosum cells in the dark. As
can be seen, the uptake is appreciable and becomes saturated
with increased time in the dark. The uptake was observed to
be linear with time for approximately 60 minutes. The
initial velocity (v^) was estimated from the uptake at 40
minutes. In a subsequent experiment, the initial velocity
was measured as a function of ^^Ca2''" concentration. It was
found that the rate became saturated with increasing Ca2"^
concentration. The property of saturation is indicative of
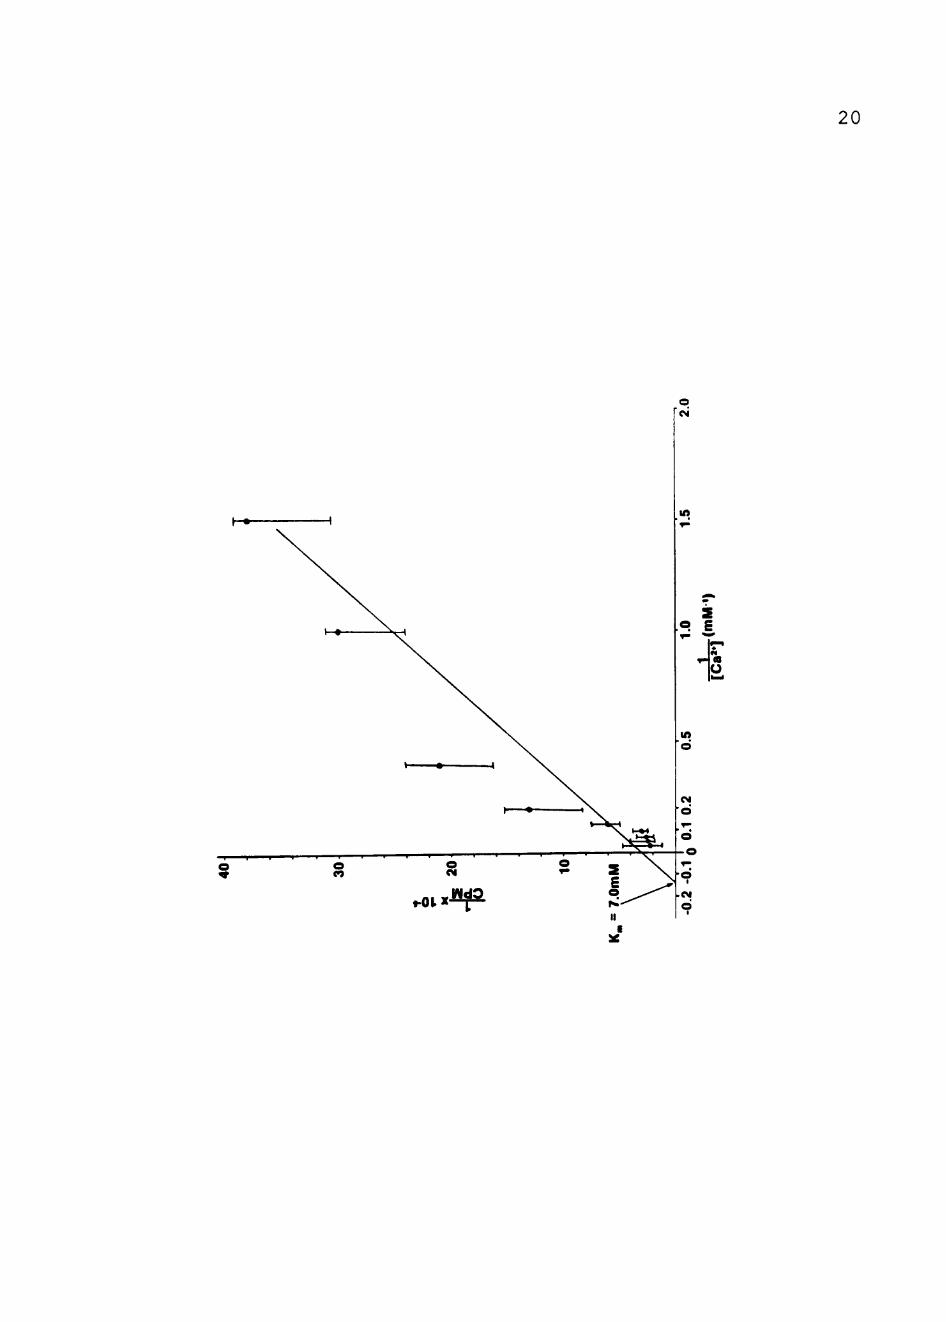
a carrier-mediated process. Figure 3 shows the data in the
form of a Lineweaver-Burk, double-reciprocal plot. As can
be seen, the uptake of ^^Ca2'*" in the dark obeyed
Michaelis-Menten kinetics . Kj^ and Vj^^^^ values were
determined by averaging the results of repeated experiments
and using a linear least-squares graphics program. The
values of Kj^ and Vj^^^^ were calculated to be 7.0 ± 0.7 mM and
150 ± 25 nmol Ca2'^-min"-^ "ixmol BChl"-'-, respectively.
Sensitivity to inhibitors of a transport system is also
a property of a carrier-mediated system. Utilized in this
study were a class of inhibitors often referred to as
calcium antagonists (41), but also called calcium entry
blockers, calcium influx blockers, slow channel blockers,
and calcium blockers. Figure 4 shows the structures of the
four calcium antagonists employed in this work. They
include ruthenium red (RR)(42) and three antipyschotic
drugs, chlorpromazine (CPZ) (43), phenothiazine (PTZ) (43),
and trifluoperazine (TFP) (43) . Each of these reagents
provides a powerful tool in the study of the translocation
of Ca2''" across biological membranes.
Ruthenium red has become a fundamental tool for 2 +
functional separation of the pathway for Ca"" uptake from
that for Ca "*" release (44) . The dye is a hexavalent cation 2 +
which interferes specifically with components of the Ca
uptake system (45). It has been shown to be an inhibitor of
Ca "*" fluxes through Ca^'^'-specific channels in eukaryotic
19
!7> *i'
it KJ
20
. 0 1 . J i ^

21

22
A. Ruthen- jnm PP^H
[(NH3)5 Ru - O • Ru(NH3)4 • O - Ru(NH3)5]6+
B. Phenothiazinp
Q^ Chlorpromazine
D_. Trifluoperazine
(GH2)3N(CH3).
(CH2)3N NCH
I
23
membranes (46-48). Ruthenium red is known to be a powerful
inhibitor of Ca2+ transport in mitochondria (45-51). It is
also a specific inhibitor of (Ca2++ Mg2+)-ATPase of red
blood cells (52,53) and of Ca2+ binding of the (Ca2++ 2 +
Mg^ )-ATPase of sarcoplasmic reticulum (54-56). In
mitochondria, the uptake of Ca2"'" is mediated by a specific
ruthenium red-sensitive uniporter (52,57-59); however the
nature of the inhibition of the Ca2+ transport mechanism is
uncertain.
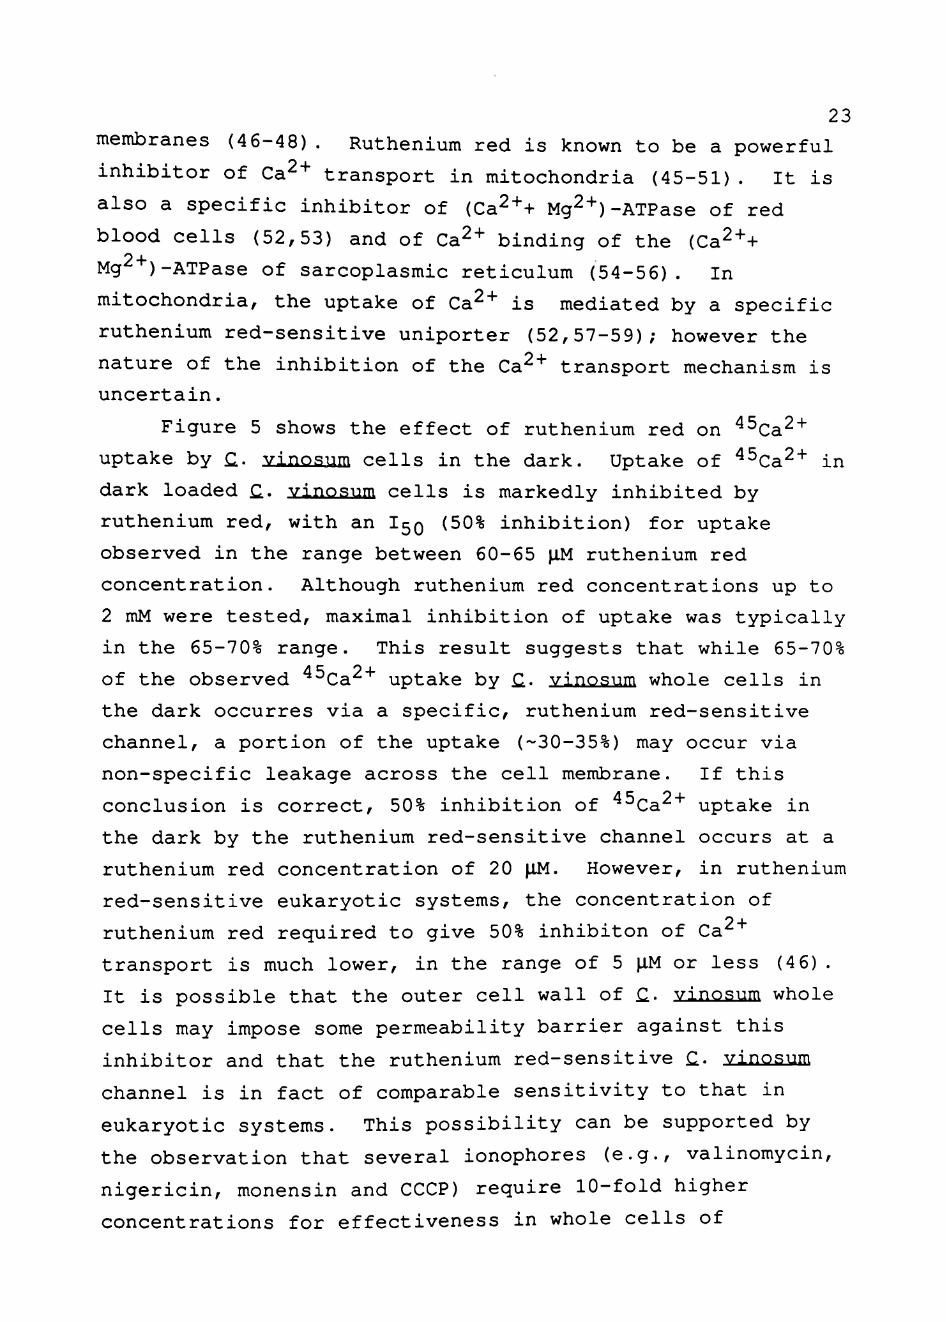
Figure 5 shows the effect of ruthenium red on ' Ca2 +
uptake by Q. vinosum cells in the dark. Uptake of ^^Ca2+ in
dark loaded jQ. vinosiim cells is markedly inhibited by
ruthenium red, with an I50 (50% inhibition) for uptake
observed in the range between 60-65 p,M ruthenium red
concentration. Although ruthenium red concentrations up to
2 mM were tested, maximal inhibition of uptake was typically
in the 65-70% range. This result suggests that while 65-70%
of the observed ^ Ca2'*' uptake by Q.. vinosum whole cells in
the dark occurres via a specific, ruthenium red-sensitive
channel, a portion of the uptake (-30-35%) may occur via
non-specific leakage across the cell membrane. If this
conclusion is correct, 50% inhibition of ^ Ca2"'" uptake in
the dark by the ruthenium red-sensitive channel occurs at a
ruthenium red concentration of 20 |XM. However, in ruthenium
red-sensitive eukaryotic systems, the concentration of
ruthenium red required to give 50% inhibiton of Ca
transport is much lower, in the range of 5 |IM or less (4 6) .
It is possible that the outer cell wall of £. vinosum whole
cells may impose some permeability barrier against this
inhibitor and that the ruthenium red-sensitive £. vinosum
channel is in fact of comparable sensitivity to that in
eukaryotic systems. This possibility can be supported by
the observation that several ionophores (e.g., valinomycin,
nigericin, monensin and CCCP) require 10-fold higher
concentrations for effectiveness in whole cells of

24
u.

25
loaiNoo %

26
£. vinosum compared to that in cell wall-free chromatophores
(26,27,33) .
Although, ruthenium red had been shown to be specific 2 + for Ca'' transport in eukaryotic systems, it seemed
important to test its specificity in a prokaryotic system.
Table 2 presents the effect of ruthenium red on 204rp-|_+ ^^^
^ Na"*" uptake by £. vinosum cells in the dark. C. vinosum
has been previously shown to possess both a Na"*'/H''" antiport
and a K'*"/H''" antiport (25-27) . Tl"*" serves as a K"*" analog in
the Q.. vinosum K''"/H''' antiport and in an ATP-energized K"*"
uptake system (27,60). As can be seen, ruthenium red had no
effect (< 10% inhibition), even at a concentration of 1 mM,
on the uptake of either 22 ^ + ^^ 204rp-j_+ ^^ £^ vinosum cells
in the dark. These results suggest that ruthenium red is
inhibiting a Ca2''"-specific transport system in Q.. vinosum
cells.
La" " is another well-investigated inhibitor of
carrier-mediated Ca2''" fluxes (46,61,62) and has been used to
probe biological systems that normally bind Ca^ ions.
Lanthanides, like ruthenium red, are inhibitors of Ca'
transport because they are structural Ca'' analogs which can
mimic the substrate and compete for binding (63). In most
instances, the lanthanide ions displace membrane-bound Ca^
and inhibit Ca2''"-mediated membrane fuction, but unlike Ca2"'",
these ions do not appear to be transported across cellular
membranes (64). Lanthanum ion has been shown to
specifically destroy the permeselectivity for calcium ion 2 +
(65) and it appears to fuction in the same manner as Ca 2 +
because it has an ionic radius very near that of Ca (63).
Figure 6 shows the effect of La " on ' Ca "'" uptake by (I.
vinosum cells in the dark. It appears that La "*" effects
" Ca " transport by £. vi nosum cells in the dark in a manner
similar to that observed for ruthenium red. LaCl3 is a
potent inhibitor of Ca " uptake in the dark, but as was the
case with ruthenium red, 100% inhibition of Ca uptake in

27
Table 2. 204,p2_+ The Effect of Ruthenium Red on Uptake by £. vinosum Cells in the Dark.
and 22Na''"
Sample Percent of Control for Uptake
A.
B.
204
1 . 2 . 3 . 4 . 5 .
22
1 . 2 . 3 . 4 . 5 .
Tl"^
C o n t r o l II
II
II
II
Na"*"
C o n t r o l II
II
II
II
+ + + +
+ + + +
100|XM RR 150|IM RR 200^M RR
ImM RR
lOOjXM RR 1 5 0 p ^ RR 200^M RR
ImM RR
100 94
105 96 97
(±4) (±2) (±2) (±2)
100 90 94
101 98
(±3) (±4) (±2) (±0)
Transport was assayed using the filter assay technique described in Methods. Cells were harvested and washed twice with 50 mM potassium phosphate (pH 6.5) for ^ a ^ transport experiments or 50 mM MES-choline (pH 6.5) for 204 .j.3_+ transport experiments. The reaction mixtures (100 |IL)
[22NalNaCl (specific acivity = 4.4 x mM [^^^T1]T1S04 (specific activity = , 50 mM buffer and cells ecjuivalent
contained either 10 mM 10* dpm/nmol Na) or 10 3.7 X 10- dpm/nmol Tl) to 150 \iM. BChl. Cells atmosphere for 75 minnutes. The results represent the average of three experiments with the standard diviations given in parenthesis.
were pre-incubated at O'C under a N2

?SWf;
28

29
o o o o o o o o o o O 0 ) 0 0 r * - < 0 U > ^ C 0 C M r-
10H1N00 %

30
the dark could not be obtained, even at La "*" concentrations
as high as 500 iM. However, in typical experiments, 80 to
85% inhibition was observed with half-maximal inhibition
observed at 35 |IM La- "'"concent rat ion. These results are
consistent with the earlier hypothesis that the majority of
the observed uptake (-80%) occurs via a Ca2''"-specific
carrier and the remainder (-20%) occurs through a
non-specific leak across the membrane.
The data in table 3 examine the effect of La-"*" on
204.j.j_+ ^j^^ 22j + uptake by C- vinosum cells in the dark. It
was necessary to ascertain the effect of La "*" on the Na' '/H'
and K"**/H"'" antiports known to exist in £. vinosum (25-27) .
As can be seen, La""*" had no effect (<10% inhibition) , even
at a concentration far above that which is needed to produce
50% Ca2''" inhibition on the uptake of either 22 "*" or 204rp-L+
by Q.. vinosum cells in the dark. These results imply that
La "*" inhibits a Ca -specific transport system in H. vinosum
cells in the dark.
Ca2'^ uptake via ruthenium red-sensitive channels in
eukaryotes is electrogenic (46) and thus can be driven by a
membrane potential (A^) , outside positive. Since Q.. vinosum
cells can utilize ATP hydrolysis via a DCCD-sensitive
F^F^^-ATPase (66) to maintain a A^ of +80 mV (outside
positive) in the dark (34,66), it was of interest to
investigate the effect of reagents known to eliminate A^ in
£. vinosum cells on " Ca " uptake in the dark. It has been
previously shown in work from this laboratory that CCCP,
valinomycin (in the presence of K"*") , as well an DCCD will
collapse A^ in £. vinosum (16) . Table 4 shows the effect of
inhibitors and ionophores known to collapse A^ in £. vinosum
on Ca "*" uptake by £. vinsoum cells in the dark. Valinomycin
is an ionophore which catalyzes K"*" equilibrium across the
plasma membrane (67,68). The equilibration of positively
charged potassium ions collapses both the potassium ion
gradient ([K" ]in > [K lout ^^^ ^® membrane potential.

31
Table 3. The Effect of La "*" on 204. 3 + ^nd 22^3+ Uptake by C vinosum Cells in the Dark.
Sample Percent of Control for Uptake
A.
B.
204.j,3_+
1. Control 2. " + 3. " + 4. " +
22Na" 1. Control 2. " + 3. " + 4. " +
100 150 200
100 150 200
IM ^M IM
^M ^M llM
La La La
3+ 3+ 3+
La La La
3-f 3+ 3+
100 92 94 91
100 98 95
102
(±2) (±1) (±3)
(±1) (±1) (±3)
Transport was assayed using the filter assay technique described in Methods. Reaction conditions were the same as those given in Table 2, except that various concentrations of LaCl3 were added, as indicated.

32
Table 4. The Sffect of Inhibitors and lonophores on ^Ca-' Uptake by £. vinosum Cells in the Dark.
Sample Percent of Control for Uptake
1. Control 100
2. " + 20 LM valinomycin 75 (±6)
3. " + 30 |IM CCCP 7 9 (±8)
4. " + 300 ^M DCCD 84 (±5)
5. " + 5 mM arsenate 73 (±2)
Transport was assayed using the filter assay technique described in Methods. Reaction conditions were the same as those given in Figure 2, except that the inhibitors in the indicated concentrations were added and the specific activity of[^^Ca]CaCl2 was 2.97 x lo" dpm/nmol Ca. Uptake was measured after 75 minutes. The results represent the average of five experiments with the standard deviations given in paratheses.

33
Carbonylcyanide-m-chlorophenylhydrazine (CCCP) is an
uncoupler. CCCP is a lipophilic weak acid which catalyzes
proton equilibration across the bacterial plasma membrane
(69). Proton equilibration abolishes both components of the
electrochemical proton gradient (A^IH+) , the proton gradient
(ApH, outside acidic) and the membrane potential (A^,
outside positive) (27) . In the dark, A jj+ is generated by
ATP hydrolysis coupled to proton efflux by the
membrane-bound ATPase (27,34). Arsenate depletes the ATP
pool in £. vinosum (26), thereby depleting the cell of its
energy source for proton efflux.
N,N'-Dicyclohexylcarbodiimide (DCCD) has been shown to
form adducts with proton-translocating glutamate residues in
the membrane-bound ATPase (16,27), thereby blocking
ATP-driven proton efflux. Table 4 shows that elimination of
A^ by inhibition of the ATPase with DCCD, by depleting the
internal pool of ATP with arsenate or by using ionophores
that collapse AT in £. vinosum (16,34) by rendering the cell
membranes permeable to either protons (CCCP) or K"*"
(valinomycin)(68,69), had only a small inhibitory effect on
Ca2"'' uptake in Q.. vinosum cells in the dark. These
observations suggest little if any involvement of the
membrane potential (AT) in providing the energy for Ca2"*"
uptake in the dark. The other component of the
electrochemical proton gradient (A}Xjj+) is the transmembrane
proton gradient (ApH). It has been shown previously that Q.
vinosum cells do not maintain a ApH in the dark (16).
Therefore ApH cannot serve as a possible energy source for
Ca "*" uptake in £. vinosum whole cells in the dark. It thus 2 +
appears the A jj+ plays little part in dark uptake of Ca by
Q.. vinosum cells. 2 +
In an attempt to provide further evidence for a Ca
transport system in £. vi nosum distinct from the Ca /H 2 +
antiport, the effect of other inhibitors on Ca uptake in
the dark was investigated. Three phenothiazine drugs were
34
tested: Chlorpromazine (CPZ), phenothiazine (PTZ) and
trifluoperazine (TFP). These antipsychotic drugs are
well-known for blocking the calcium-binding protein
calmodulin (70-74). Table 5 presents the effect of
phenothiazine drugs on ^ Ca2''' uptake by Q.. vinosum cells in
the dark. These drugs have been shown to influence Ca2"'"
movements in other organisms, but their mechanisms are still
unknown (64,7 6). It has been suggested by Fleischer ot. 2±-
that these drugs inhibit Ca2''" loading and (Ca2'''+ 2 + Mg )-ATPase activity in sarcoplasmic reticulum, yet have no
effect on unidirectional Ca2"'" efflux from vesicles loaded
either activtely or passively with Ca2''' (64,76). The data
presented in Table 5 shows that even at very high
concentrations [100 }XM], these drugs did not inhibit (< 5%
inhibition) Ca'' uptake by £. vinosum cells in the dark. In
fact, one of the phenothiazines, PTZ actually produced an
approximate 3-fold stimulation in the observed extent of
Ca2"'' uptake. This is in contrast to their effect on Ca2"'"
efflux in the light (vide infra).
Ca "*" Efflux Experiments with niuminated Whole Cells
Whole cells of Q.. vinosum have been shown to exhibit
energy-dependent Ca2''" efflux via the Ca2' /H''" antiport (2 6)
and the properties of the Ca "'"/H"'" antiport have been well
documented in earlier studies from this laboratory. It has
been observed that the driving force for Ca " efflux arises
from the A|ijj+ which, in turn, results form the proton efflux
coupled to light-dependent cyclic electron flow, [see
Davidson and Knaff (26)]. It would be, therefore,
interesting to ascertain the effect of the inhibitors (e.g.,
ruthenium red, La " , phenothiazines) on light-dependent Ca
efflux from £. vinosum whole cells.
£. vinosum cells were allowed to pre-incubate for 75
minutes in the dark at O'C under a N2 atmosphere with 10 mM

35
Table 5. The Effect of by £. vinosnm
Phenothiazine Drugs Cells in the Dark.
on 45ca2+ Uptake
Sample Percent of Control for Uptake
A. Chlorpromazine (CPZ)
Control 1, 2 3 4 5 6 7 8
B. Phenothiazine (PTZ)
+ " + " + " + " + " + " +
5 ^M CPZ 10 \m CPZ 15 IXM CPZ 20 lM CPZ 25 |iM CPZ 50 |1M CPZ 100 ^M CPZ
1. 2. 3. 4. 5. 6. 7.
Control II
II
II
II
II
II
+ + + + + +
5 \1JA PTZ 10 |iM PTZ 15 JIM PTZ 20 ^M PTZ 25 ^M PTZ 100 ^M PTZ
C. Trifluoperazine (TFP)
1. 2. 3. 4. 5. 6. 7.
Control II
It
•1
tl
It
It
+ + + + + +
5 lM TFP 10 |IM TFP 15 IM TFP 20 M.M TFP 25 lM TFP 100 |XM TFP
100 99 102 100 102 100 101 98
100 177 297 273 269 305 287
100 96 95 98 94 96 104
(±2) (±1) (±0) (±1) (±2) (±3) (±2)
(±13) (±17) (±24) (±15) (±31) (±29)
(±4) (±2) (±2) (±3) (±2) (±4)
Transport was assayed using the filter assay technique described in Methods. Reaction conditions were as in Figure 2, except that various concentrations of chlorpromazine (CPZ), phenothiazine (PTZ) and trifluoperazine (TFP) were added as indicated. Uptake was measured after 75 minutes. The results represent the average of four experiments with the standard deviations given in parenthesis.

36
[ Ca]CaCl2 in the absence of inhibitors. Inhibitors, at
the specified concentrations, were then introduced into the
rection mixtures and allowed to incubate for 5 minutes
before the light was turned on. The reaction mixtures,
still under a N2 atmosphere, were illuminated for 20 minutes
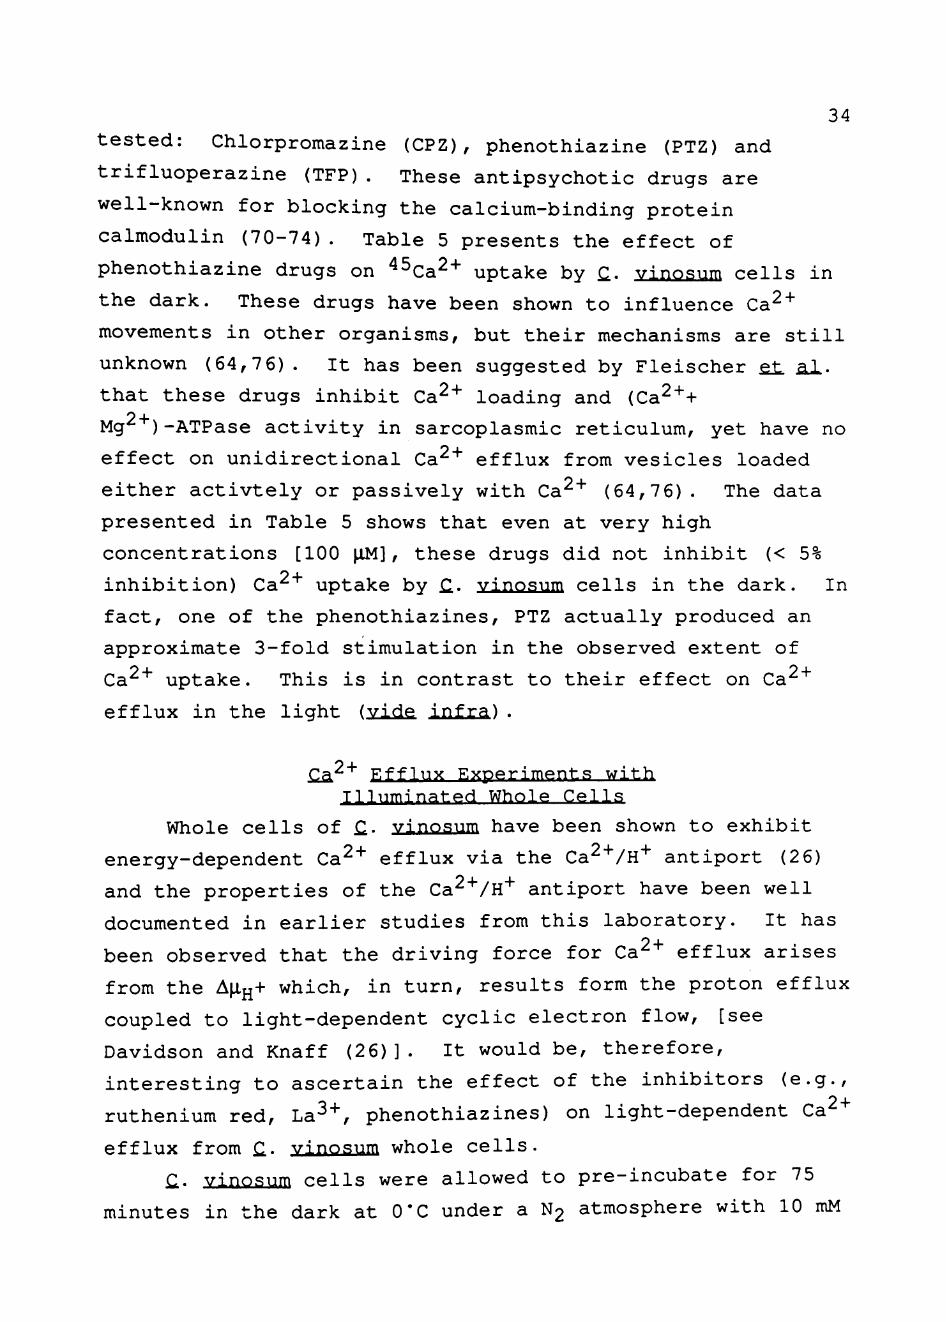
in the light. Table 6 shows the effect of ruthenium red and
La " on ' 5ca2+ efflux from Q.. vinosum cells in the light.
As can be seen, neither ruthenium red nor La-"*" had any
inhibitory effect on ^^Ca^'^ efflux from pre-loaded £.
vinosum cells in the light. These inhibitors were tested at
concentrations where they had shown potent inhibition of
Ca "*" uptake in the dark. The observation that La""*" and
ruthenium red inhibit Ca2"*" uptake without affecting Ca2'''
efflux strongly suggests that two separate Ca2''' systems
exist in C vinosum: One system sensitive to La "*" and
ruthenium red that results in Ca2''" uptake in the dark and a
second system, unaffected by ruthenium red or La-"*", that
catalyzes Ca^ efflux during illumination. As light-driven
Ca2" efflux from Q. vinosum cells had previously been shown
to occur via an electrogenic Ca'' /H antiport (26) , it can pi 1
be concluded that the Q.. vinosum Ca^ /H antiport is -3 J.
inhibited neither by ruthenium red nor La~' .
The effect of several phenothiazine drugs on the £..
vinosum Ca2"'"/H" antiport was examined next. Figure 7
illustrates the effect of these various phenothiazine drugs
on ^^Ca^"^ efflux from illuminated £. vinosum whole cells.
The three phenothiazines (PTZ, TFP, CPZ) were potent
inhibitors of Ca "*" efflux from pre-loaded £. vinosum cells
in the light, with 50% inhibition of efflux being observed
at 12 |J,M, 14|XM, and 25 |i.M concentrations of phenothiazine,
trifluoperazine, and chlorpromazine, respectively. Table 7
summarizes the effect of the phenothiazine drugs on ° Tl"*"
and 22^3+ efflux from illuminated Q.. vinosum cells. Even at
concentrations as high as 100 |IM, the three phenothiazine
drugs, had no inhibitory effect (< 5% inhibition) on either
37
Table 6. ,3+ The Effect of Ruthenium Red and La-'' on Efflux from Illuminated Q. vinosum Cells.
45ca2+
Sample Percent of Control for Efflux
Ruthenium Red (RR) 1 2 3 4 5 6 7
Control
B. Lanthanum Ion (La* )
+ 100 nM RR + 500 nM RR + 50 ^M RR + 100 ^M RR + 500 lM RR + 1 mM RR
3 + . 1 2 3 4 5
C o n t r o l
I t
I t
+ 25 ^M La + 50 lM La + 100 jiM La + 200 \IM La
3 + 3 + 3 + 3 +
100 100 95
104 103 102 105
100 82 78 90 92
(±1) (±3) (±2) (±1) (±0) (±2)
(±4) (±6) (±3) (±4)
Transport was assayed using the filter assay technique described in Methods. Reaction conditions were as Figure 7, except ruthenium red (RR) and LaCl3 (La^"^) m various concentrations replaced the phenothiazine drugs. The results represent the average of three experiments with the standard deviations given in parenthesis.

38
It'
. 1 •' •

39
lU
z ^^ N < s o GC Q. flC o z o
UJ z N < cc Ul CL O 3
IFL
oc 1-
UJ
z N < Z H O z UJ
z Q. O D <
h* (O LO ^
noaiNOO %

40
Table 7 . The Effect of Phenothiazine Drugs on 204,j.i+ nd 22Na''" Efflux by Illuminated £. vinosum Cells.
Sample Percent of Control for Efflux
A. 204^1+
1. Chlorpromazine (CPZ) i) Control ii) " + 25 ^M CPZ iii) " + 50 IM CPZ iv) " + 100 \iM CPZ
2. Phenothiazine (PTZ) i) Control 11) " + 25 |XM PTZ iii) " + 50 |XM PTZ iv) " + 100 ^M PTZ
3. Trifluoperazine (TFP) i) Control ii) " + 10 IM TFP iii) " + 25 H^ TFP iv) " + 100 |1M TFP
100 99 100 98
100 100 97 100
100 100 99 100
(±1) (±1) (±2)
(±2) (±0) (±3)
(±2) (±1) (±2)
B. 22jj^+
1. Chlorpromazine (CPZ) i) Control ii) " + 25 IM CPZ iii) " + 50 |XM CPZ iv) " + 100 IM CPZ
2. Phenothiazine (PTZ) i) Control ii) " + 25 lM PTZ iii) " + 50 lM PTZ iv) " + 100 ^M PTZ
100 99 101 100
100 98 98 99
(±3) (±0) (±1)
(±0) (±1) (±1)

41
Table 7. Continued.
Sample Percent of Control for Efflux
3. Trifluoperazine (TFP) i) Control 100 ii) " + 10 M TFP 99 (±2) iii) " + 25 IM TFP 99 (±1) iv) " + 100 M.M TFP 102 (±2)
Transport was assayed using the filter assay technique described in Methods. Reaction conditions were the same as those given in Figure 7, except either 10 mM [22Na]NaCl (specific activity = 4.4 x 10^ dpm/nmol Nal or 10 mM [2'J4TI]T1S04 (specific activity = 3.7 x 10- dpm/nmol Tl) replaced the 10 mM [ Ca]CaCl2- The results represent the average of three experiments with the standard deviations given in parenthesis.

42
light-driven Na" efflux via the £. vinosum Na' /H" antiport
(25) or Tl" efflux via the £. vinosum K" /H" antiport (27) .
These results are expected if a Ca2+-specific system was
being inhibited by the phenothiazines.
The observation that light-driven Ca2'*" efflux via the
£.. vinosum Ca2"'"/H"'" antiport is affected by the phenothiazine
drugs, while Ca2+ uptake in the dark shows the opposite
response to the two classes of inhibitors, further supports
the presence of two separate Ca2"'' transport systems in £.
vinosum.
ila"*" Uptake Experiments with Illuminat-f ri Chromatophores
The demonstration that whole cells of £. vinosum can
exchange internal Ca2''" for external protons though the
Ca ' /H" antiport (26), leads to the prediction that
chromatophores prepared from these bacteria, because of
their opposite membrane sidedness compared to intact cells
(36,37), should be able to exchange external Ca2'*' for
internal protons. This prediction was investigated by pi
following the effect of Ca" on transmembrane proton
movements in £. vinosum chromatophores. Flow dialysis was
performed with Q.. vinosum chromatophores using the membrane
permeable weak base [^^C]methylamine to monitor the
transmembrane proton gradient (ApH)(75). In order to
discern the effect of ApH from A^, 2 fiM K"*" valinomycin was
also added to the reaction chamber, in order to completely
collapse A^ in the chromatophores (81,82). The results of
one such experiment are shown in Figure 8. Upon
illumination, the chromatophores generate ApH (inside
acidic), as demonstrated by the uptake of methylamine. In
flow dialysis experiments, a decrease in the amount of
[ " C]-label in the dialysate, which indicates uptake of the
labeled material by the chromatophores, is reflected in a
deviation below the baseline. With the addition of CaCl2

43

44
O
o
o CO
E
C
o
o cc
o CM
_ O
Q T CO
( luclo 6o|)
9;BsA|B!a Uj 9U!LUB|Aq;9|/\j | Q ^ J

45
(10 mM), where indicated, there results an efflux of
protons, as indicated by an efflux of methylamine. This is
as expected, for if a Ca2+/H"'" antiport existed in £.
vinosum, the addition of Ca2+ to the external medium would
create [Ca2+]^^^^^^^^ > [Ca2+] internal' thereby Ca2+ would
enter the chromatophores down the electrochemical gradient. 2 +
As Ca enters the chromatophores there would be
simultaneous proton efflux. This provides further evidence p i I
for the Ca'' /H antiport operating in Q.. vinosum cells.
With the demonstration of Ca2"'"-dependent H"*" efflux in
£. vinosum chromatophores, Ca2''" uptake was next
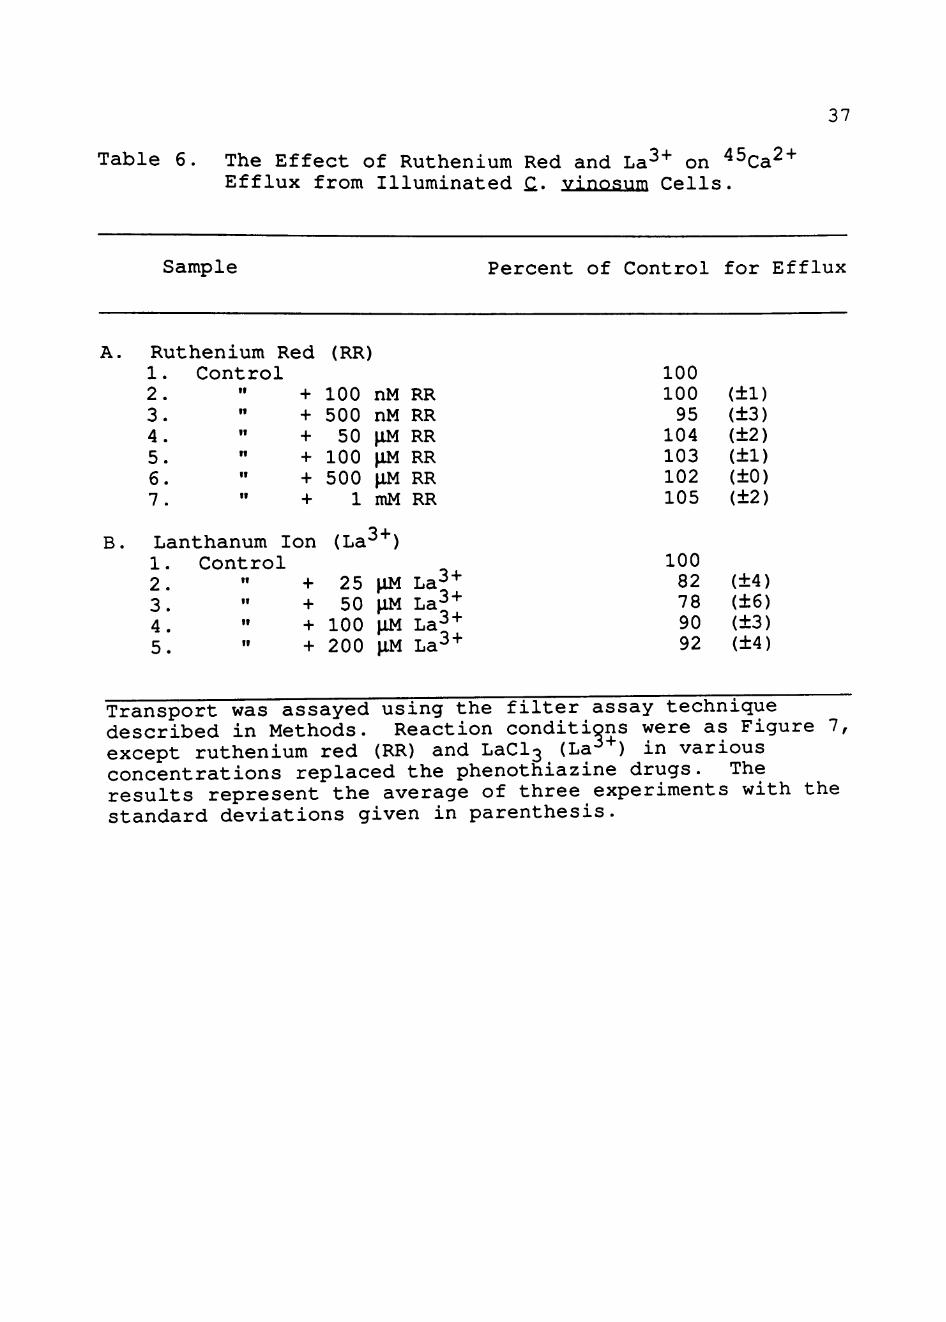
re-investigated (27) . Figure 9 shows light-dependent ^ Ca2"'"
uptake by £.. vinosum chromatophores. As can be seen,
energization of the chromatophores by illumination, results pi
in Ca uptake by the chromatophores. Again, in flow
dialysis experiments, a decrease in the amount of
['* Ca2" ]-label in the dialysate is reflected in a deviation
below the baseline, which indicates uptake by the
chromatophores. This again demonstrates the operation of
the Ca2'*'/H"'" antiport in Q.. vinosum chromatophores.
With direct evidence of the light-dependent Ca2"'"/H"'"
antiport operating in £.. vinosum chromatophores, it seemed
of interest to examine the effects of the phenothiazine
drugs which had been found to be potent inhibitors of that
antiport in whole cells, in £. vinosum chromatophores. The
results of such experiments are shown in Figures 10, 11 and
12, for CPZ, PTZ and TFP, respectively. As can be seen, it
appears that the three phenothiazines (CPZ, PTZ, TFP)
indeed, have an inhibitory effect on light-driven Ca2+ ion
uptake in £. vinosum chromatophores. Figure 10 shows the
effect of chlorpromazine on ^^Ca^"^ uptake by illuminated £. 2 +
vinosum chromatophores. While complete inhibition of Ca
uptake in the light is not seen, the amount of uptake is
substantially less than in the control experiment without
chlorpromazine (see Figure 9). The effect of phenothiazine

46

47
O
o
o CO
0)
n E
C O
o CO k .
LL O CM
«o
1 ^
CO
i
o CO
1 ^
CM
T 00 CM
(uudo Bo|)
9;BsA|B!a U! 9PUOIM0 LunioiBQ (^Og^)

48
49
O
o
o CO
0
n E
C O
"o CO
o CM
CO o CO
1 ^
CM
r CM
(uudo Bo | )

50

51
O
o
o CO
o CM
0)
E
C O
o CO
I CM
CO
T—
CO o CO
(oido 6o| )
eiBsAiBiQ u! 9P!J0|L|0 uunioiBQ pOg^j

52

53
. O
o
o CO
CD
n E
C O
o CO
o CM
. O
1
CO
1
o CO
1 G) CM
1 00 CM CM
CD CM
(Oido B o | )
9 ; B s A | B ! a u! 9p!JO|L|o lunjOiBQ (^Og^j

54
on Ca uptake by illuminated £. vinosum chromatophores is
seen in Figure 11. Again, there is much less uptake of Ca2"*'
than in controls. Figure 12 examines the effect of
trifluoperazine on " ^ 2+ uptake by illuminated C- vinosum
chromatophores. As can be seen, there is nearly complete
inhibition of Ca2''" uptake by the chromatophores. All of the
results obtained from flow dialysis experiments with the
phenothiazine drugs are the results expected.
Chlorpromazine, trifluoperazine and phenothiazine were
observed to be potent inhibitors of the Ca2"'"/H"'" antiport in
£. vinosum whole cells as well as inhibitors of the p 1
light-driven Ca^ uptake in inside-out vesicles. These
results lend further evidence to the hypothesis that the
phenothiazine drugs which are known to influence
light-driven Ca2''" fluxes in other organisms (64,70-74,76),
also affect light-driven Ca2'*" movements via the Ca2'''/H"
antiport in Q.. vinosum.
As a last control, the effect of ruthenium red and La""*" p 1
on light-driven Ca'' uptake by Q.. vinosum chromatophores was
examined. Figure 13 shows the effect of ruthenium red on
^ Ca "'" uptake in illuminated Q.. vinosum chromatophores.
While ruthenium red has been shown to be a potent inhibitor
of Ca "*" uptake in Q.. vinosum whole cells in the dark, it had
no effect on light-dependent Ca2' efflux via the Ca2''"/H'
antiport in illuminated £. vinosum whole cells (77) . As is
evident, ruthenium red had no effect on light-driven Ca2'
uptake in Q.. vinosum chromatophores. This is further P I 1
evidence that ruthenium red does not inhibit the Ca^ /H
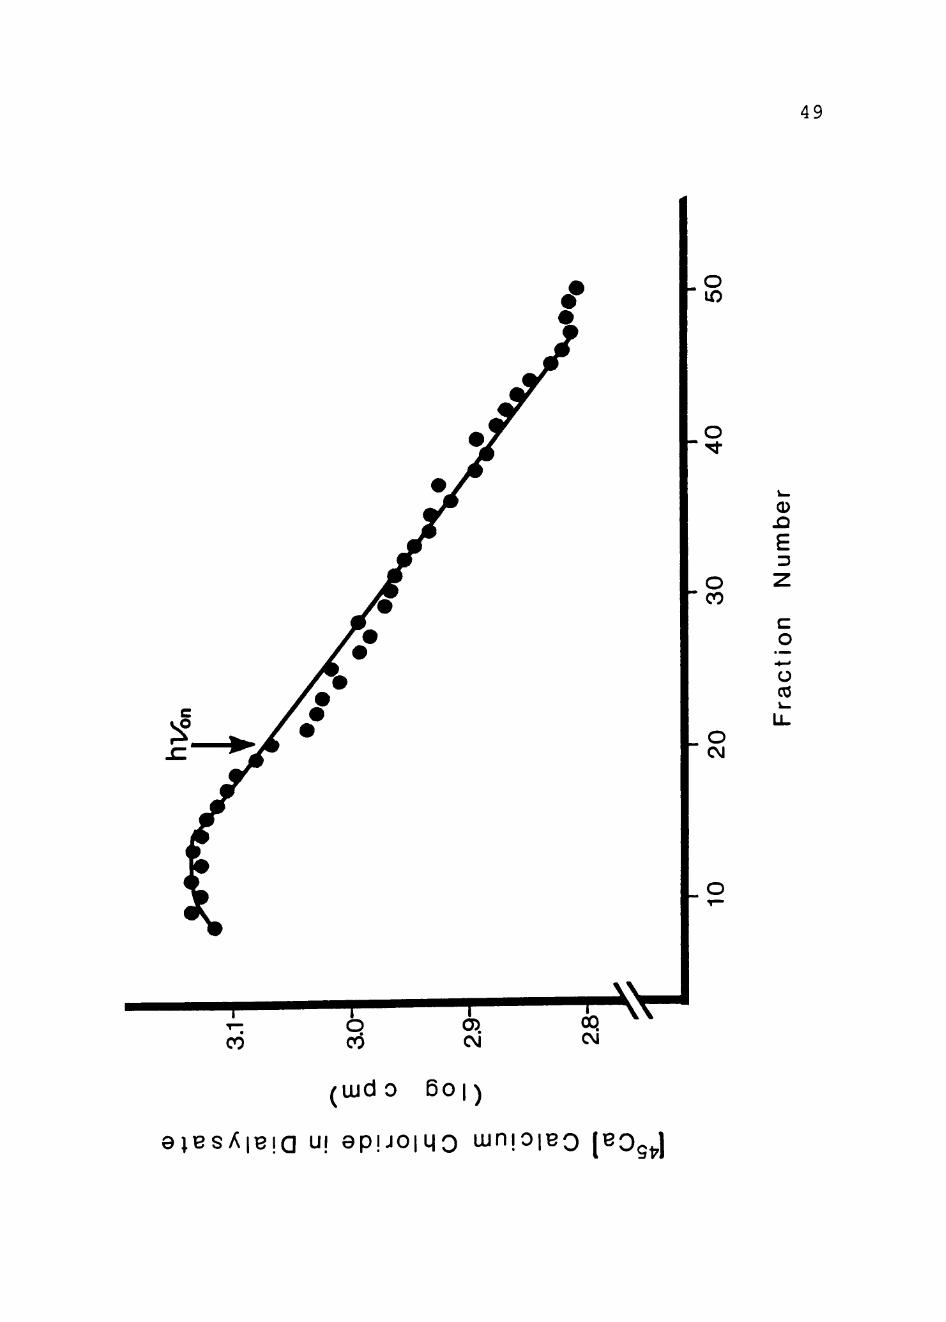
antiport previously described (26). Figure 14 establishes
the effect of La""*" on ^^Ca^"^ uptake by illuminated £.
vinosum chromatophores. Again, La " had been shown to be an
effective inhibitor of Ca "*" uptake in whole cells, but had
no effect on light-dependent Ca "*" efflux from whole cells.
La " had no inhibitory effect on the light-driven Ca "*" 2 + uptake in £.. vinosum chromatophores. The amount of Ca

55

56
O
o
o CO
o CM
_o
0
n E
C O
o CO
1 T
(Oido Bo|)
9;BSA|B!a U! 9PU01LJ0 LUnplBQ [BQg^)

57
58
O LO
o
o CO
0)
n E
C
q o CO
CM rl= ' ^
1 O Tt
1 o>. CO
£• CO
o u-CM
_o
^
I
CO
1 ^
CO
9JBSA|B!a Uj
(ludo 6o|)
9PU0IM0 uunioiBQ (BOgt.1
59
uptake seen in Figures 13 and 14 is comparable to the
control experiment where no ruthenium red or La-"*" was added
(Figure 9). All of the above evidence suggests that there
are two separate calcium transport systems in the purple
phototrophic bacterium Chromatium vinosum. One of the
systems is the previously described Ca^'^/R'^ antiport which
is sensitive to phenothiazine drugs, but insensitve to
ruthenium red and La "*". The second system appears to be a pi
Ca^ uptake system in the dark, which is insensitive to the o J.
phenothiazines, but sensitive to ruthenium red and La" .

CHAPTER IV
SUMMARY, CONCLUSIONS AND DISCUSSION
Summary
1. Substantial evidence has been presented (see Figure
2) to document the fact that Chromatium vinosum possesses a
Ca uptake system unique to the Ca2"'"/H"'" antiport previously
described (2 6). The uptake system obeyed Michaelis-Menten
kinetics with Kj^=7.0±0.7mM and Vj^^^ = ^^O ± 25 nmol
Ca2'^-m"^-^mol BChl"^ (see Figure 3) and the uptake could be
inhibited by calcium antagonists. All of the above
observations are indicative of a carrier-mediated transport
system.
2. Ruthenium red and LaCl3, both of which are known to p 1
influence Ca^ fluxes in eukaryotic membranes (44-48,51,
57-59,61-63), were shown to markedly inhibit Ca2"'" uptake in
the dark by £. vinosum cells (see Figures 5 and 6).
However, neither ruthenium red nor La* had any inhibitory
effect on the uptake of either Na"*" or the K"*" analog Tl"*" by
Q.. vinosum cells in the dark (see Tables 2 and 3) . This
suggests that both ruthenium red as well as La-'
specifically inhibit a calcium transport system.
3. It has been demonstrated that A^, the membrane
potential, plays little or no part in driving the Ca2"'"
uptake by Q., vinosum cells in the dark. It had been shown
that elimination of A^ by depleting the internal pool of ATP
with arsenate (16,34), inhibiting the ATPase with DCCD
(16,27), or by using ionophohores that collapes A^ in Q.
vinosum cells (16,34) by rendering the membrane permeable to
either H"*" ion (CCCP) (69) or K"*" (K" valinomycin) (68), had
only a small inhibitory effect on Ca " uptake by Q.. vinosum
cells in the dark (see Table 4). These results suggest
little if any involvement of A^ in providing the energy for
60

61 2 +
Ca uptake in the dark. Previosly, the other component of
AHjj+, ApH has been shown to be zero in £. vinosum cells in
the dark (27), which eliminates ApH as a possible Ca2"*"
uptake energy source.
4. The phenothiazine drugs (chlorpromazine,
phenothiazine, trifluoperazine) were shown not to inhibit p I
the Ca uptake system in the dark in £. vinosum cells (see Table 5). These results suggest that the antipsychotic
phenothiazines have little effect on the Ca2+ uptake in £.
vinosum cells.
5. The £. vinosum Ca2" /H"*" antiport previously
identified in this laboratory (26), was further
characterized. Light-dependent Ca2''' efflux via the Ca2''"/H'
antiport in £. vinosum whole cells was shown to be inhibited
by three phenothiazines: Chlorpromazine, trifuoperazine and
phenothiazine (see Figure 7). Also examined was the effect
of the phenothiazine drugs on the previously described
Na"'"/H"'" and K"*"/H"*' antiports which are also found in Q..
vinosum (25-27), (see Table 7). Evidence presented in this
thesis suggests there is no effect of phenothiazines on the
light-dependent efflux of either Na"*" or Tl"*" catalyzed by the
£. vinosum Na"'"/H"'" or K"'"/H''" antiports, respectively. This
suggests that the phenothiazine drugs studied work
specifically on the Ca "'"/H"'" antiport and not on other
cation/H"*" antiports found in Q.. vinosum-
6. Neither ruthenium red nor La "*" inhibit Ca2''" efflux
via the Ca2"'"/H' antiport in £. vinosum cells (see Table 6) .
This evidence lends further support to the hypothesis that
separate systems catalyze Ca "*" uptake and efflux.
7. The inside-out vesicles (chromatophores) of C-
vinosum were observed to pump protons out of the membrane as
Ca "*" was added to the external medium (see Figure 8) . Also P 1
it was shown that the chromatophores will take up Ca in an energy-dependent fashion. This was further evidence that
the Ca2"'"/H"*" antiport was operative in £. vinosum

62 chromatophores (see Figure 9) .
8. The effects of the three phenothiazine drugs on the p i 1
Ca /H antiport in £. vinosnm chromatophores was examined.
Chlorpromazine, phenothiazine, and trifluoperazine were
shown to inhibit the light-driven Ca2''" efflux from Q..
vinosum whole cells as well as light-driven Ca2"'" uptake in
£. vinosum chromatophores (see Figures 10, 11 and 12). The
data provide additional evidence for the inhibition of the p i 1
Ca*' /H" antiport by these drugs.
9. As a last control, the effect of ruthenium red and
La" " on the Q.. vinosum Ca2'*"/H"'" antiport in chromatophores
was examined. It was shown that while these compounds
produced potent inhibition of Ca2"*" uptake in the dark, they
had no effect on Ca2"'" efflux by the Ca2'*"/H"'" antiport in
whole cells. The same situation was observed for pi
light-dependent Ca^ uptake in chromatophores (see Figures
13 and 14) . Ruthenium red and lanthanum ion had no effect
on Ca uptake via the Ca2" /H"*" antiport shown to be
operative in chromatophores.
Conolusion and Discussion
The results presented above provide strong evidence
that the photosynthetic purple bacterium Chromatium vinosum
has two calcium transporting systems available to transport
Ca2"*" ions across the lipid bilayer. One is a phenothiazine-
sensitive, but ruthenium red and La- "*'-insensitive Ca2''"/H"'"
antiport for Ca "*" efflux in the light. The second is a
ruthenium red and La^"^-sensitive, but phenothiazine-
insensitive, Ca "*" uptake system.
The data presented provide the first evidence for
multiple Ca2" transport systems in a photosynthetic
bacterium. However, there is precedent for a similar
situation in a non-photosynthetic bacterium as well as
mitochrondria. For example, fi7,n-t-nhar.ter vlnel^andii contains
a ruthenium red-insensitive Ca^'^/n'^ antiport that catalyzes

63
energy-dependent Ca2+ efflux and a ruthenium red and La "
sensitive transport system that catalyzes Ca2- uptake (83) .
Unlike the case with £. vinosum, the ruthenium
red-sensitive, A. vinelandii Ca2- uptake system appeared to
be driven by A^ (outside positive) . The data in Table 4,
suggest that while A^ may make a small contribution to
driving Ca uptake by £. vinosum in the dark, the ruthenium •3 I
red. La -sensitive system in Q. vinosum may catalyze Ca2"
equilibration across the membrane without coupling A^ to
Ca2''" accumulation.
The sensitivity of the £. vinosum Ca2" /H" antiport to
phenothiazine drugs suggests that the antiport may have some
structural similarities to other proteins involved in Ca2"*"
transport or binding such as the Ca2''" ATPase of the
sarcoplasmic reticulum and calmodulin, since these proteins
are also affected by phenothiazines (78-80). Calmodulin is
a heat stable, acidic polypeptide that contains four 2 + Ca'' -binding sites. The protein appears ubiquitous in
eukaryotes and mediates many of the Ca2''" effects (84) . The
binding of Ca2"*" alters the conformation of calmodulin,
increasing its helical content and exposing hydrophic
regions. It appears that the hydrophobic phenothiazines act
by competing with calcodulin's normal target enzymes for
hydrophobic portions of calmodulin (79,80). It may be
possible that these inhibitors act in a similar fashion in
so far as the £. vinosum Ca2"'"/H"*" antiport in concerned.
REFERENCES
• ' ^rV^^f' ^' ^ " " ^ in Microorganisms anH Minerals (Weinberg, E.D., ed.), p. 49-103, Mercel Dekker, New York.
2. Ordal, G.W. (1977) Nature 270, 66-67.
3. Eckert, R. (1972) Science 176, 473-481.
4. Lanyi, J.K. (1979) Biochim. Biophys. Acta 5ia, 377-397.
5. Cobb, A.D. and Knaff, D.B. (1983) Arch. Biochem. Biophys. 22^, 86-94.
6. Cobb, A.D. and Knaff, D.B. (1984) Arch. Biochem. Biophys. 223.f 97-110.
7. Cobb, A.D. and Knaff, D.B. (1984) Biochim. Biophys. Acta 221, 117-122.
8. Kaback, H.R. (1976) J. Cell Physiol. M , 575-594.
9. Ramos, S. and Kaback, H.R. (1977) Biochem. 1£, 854-859.
10. Ramos, S., Schuldinger, S. and Kaback, H.R. (1976) Proc. Natl. Acad. Sci. USA 21, 1892-1896.
11. Kaback, H.R. (1982) in Membranf^s and Transport, (Martinosi, A.N., ed.), p. 21-26, Plelnum Press, New York.
12. Rosen, B.D. and Kashket, E.R. (1978) in Bacterial Transport (Rosen, B.D., ed.), p.559-620, Mercel Dekker, New York.
13. Knaff, D.B. and Whetstone, R. (1980) Arch. Biochem. Biophys. 203, 697-701.
14. Williams, R.J.P. (1978) Biochim. Biophys. Acta 5115., 1-44.
15. Mitchell, P. (1961) Nature 1 ^ , 144-148.
16. Knaff, D.B. and Davidson, V.L. (1983) Photochem. Photobiol. M , 721-724.
17. Knaff, D.B. (1986) Photosyn. Res., in press.
64

1Q o 65 i». Bonner, S., Mann, M.J., Guffanti, A.A. and Krulwich,
T.A. (1982) Biochim. Biophys. Acta 679, 315-322.
19. Kitada, M. and Horikoshi, K. (1982) Agric. Biol. Chem. A3.r 1115-1120.
20. Guffanti, A.A., Cohn, D.E., Kaback, H.R. and Krulwich, T.A. (1981) Proc. Natl. Acad. Sci. 2a, 1481-1484.
21. Niven, D.F. and MacLeod, R.A. (1980) J. Bacterid. 112, 603-607.
22. Niven, D.F. and MacLeod, R.A. (1978) J. Bacterid. I M , 737-743.
23. Mandel, K.G., Guffanti, A.A. and Krulwich, T.A. (1980) J. Biol. Chem. 255, 7391-7396.
24. Nowyeky, M.C., Fox, A.P. and Tsien, R.W. (1985) Nature 213., 440.
25. Knaff, D.B., Davidson, V.L. and Pettitt, C.A.(1981) Arch. Biochem. Biophys. 211, 234-239.
26. Davidson, V.L. and Knaff, D.B. (1981) Biochim. Biophys. Acta 637, 53-60.
27. Davidson, V.L. and Knaff, D.B. (1982) Photobiochem. Photobiophys. 2., 167-174.
28. Pfennig, N. and Kampf, C. (1980) Arch. Microbiol. 122/ 125-135.
29. Pfennig, N. and Truper, H.G. (1981) in The Prokaryotes (Starr, M.P. ot, a±-, eds.) , p. 279-289, Springer, Berlin.
30. Kampf, C. (198 6) personal communication.
31. Arnon, D.I., Das, V.S.R. and Anderson, J.D. (1963) in Studies on Mioroalgae and Photosynthetic Bacteria, p. 529-545, University of Toyko Press, Toyko.
32. Clayton, R.K. (1963) in Raoterial Photosynthesis (Gest, H., San Pietro, A. and Vernon, L.P., eds.), p. 498, Antioch Press, Yellow Springs.
33. Knaff, D.B. and Buchanan, B.B. (1975) Biochim. Biophys. Acta 223., 549-560.

. . 66 34. Knaff, D.B., Whetstone, R. and Carr, J.W. (1979) FEBS
Lett. M , 283-296.
35. Van Grondell, R., Duysens, L.N.M., Van der Wei, J.A. and Van der Wal, N.H. (1977) Biochim. Biophys. Acta A31, 188-201.
36. Knaff, D.B. and Carr, J.W. (1979) Arch. Biochem. Biophys. 193, 379-384.
37. Michels, P.A.M. and Konings, W.N. (1978) Eur. J. Biochem. Q3., 147-155.
38. Mitchell, P. (1966) Biol. Rev. 41, 445-502.
39. West, I.e. (1981) in Chemiosmot,io Prot.on Circuits in Biological Membranes (Skulachev, V.P. and Hinkler, P.O., eds.), p.509-524, Addison-Wesley Publishing Co., Reading, MA.
40. West, I.e. (1980) Biochim. Biophys. Acta 559, 91-126.
41. Flectenstein, A. (1984) in Calcium Antagonists and Cardiovascular Disease (Opie, L.H., ed.), p. 28, Raven Press, New York.
42. Fletch, J.M., Greenfield, B.F., Hardy, C.J., Scargilli, D. and Woodhead, J.L. (1961) J. Chem. Soc. London a, 2000-2006.
43. Buchman, O. and Shimoni, M. (1980) in Phenothiazines and Structurally Related Drugs: BaSJC and Clinical Studies (Usdin, E., Eckert, H. and Forrest, I.S., eds.), p. 29-44, Elsevier Science Publisher, Amsterdam.
44. Carafdi, E. (1982) in Membrane Transport of Calcium (Carafdi, E., ed.), p. 109-139, Academic Press, New York.
45. Niggli, V., Gazzotti, P. and Carafdi, E. (1978) Experientia 2A, 1136-1137.
46. Carafdi, E. and Sottocasa, G. (1984) in Rioenerqetics (Ernster, L., ed.), p. 269-289, Elsevier Science Publisher, Amsterdam.
47. Moore, C L . (1971) Biochem. Biophys. Res. Commun. A2, 298-305.
48. Vasington, F.D., Gazzotti, P., Tiozzo, R. and Carafdi, E. (1972) Biochim. Biophys. Acta 2^i3, 43-54.

67 49. Reed, K.C. and Bygrave, F.L. (1974) Biochem. J.
i m , 143-155.
50. Rossi, C.S., Vasington, F.D. and Carafdi, E. (1973) Biochem. Biophys. Res. Commun. ^ , 846-852.
51. Sordahl, C A . (1974) Arch. Biochem. Biophys. 167, 104-115.
52. Fiskum, G. (1984) in Metal Ions in Biological Systems: Calcium and Its Role in Biology (Sigel, H., ed.). Vol. 12, p. 187-214, Marcel Dekker, New York.
53. Watson, E.L., Vincenzi, F.F. and Davis, P.W. (1971) Biochim. Biophys. Acta 249, 606-610.
54. Vole, M.G.P. and Carvalho, A.P. (1973) Biochim. Biophys. Acta 325, 2 9-37.
55. Madeira, V.M.L. and Antunes-Madeira, M.C (1974) J. Membrane Biol. 12, 41-50.
56. Chiesi, N, and Carafdi, E. (1982) J. Biol. Chem. 252, 984-991.
57. Saris, N.E.L. and Akerman, K.E.O (1980) Curr. Top. Bioenerg. IQ, 103-179.
58. Nichdls, D. and Akerman, K.E.O. (1982) Biochim. Biophys. Acta M l / 57-88.
59. Bernardi, P., Paradisi, V., Pozzan, T. and Azzone, G.F. (1984) Biochem. 22., 1645-1651.
60. Davidson, V.L. and Knaff, D.B. (1982) Arch. Biochem. Biophys. 211/ 358-362.
61. Mela, L. (1968) Arch. Biochem. Biophys. 121/ 286-293.
62. Mela, L. (1969) Biochem. 1, 2481-2486.
63. dos Renedios, C G . (1981) Cell Calcium 2, 29-51.
64. Volpe, P., Costello, B., Chu, A' f^^^J^^^f^^' ^• (1984) Arch. Biochem. Biophys. 22A, i/4-i/y.
65. von Breeman, C (1968) Biochem. Biophys. Res. Commun.
12, 977.
66. Gephstein, A., Carmeli, C and Nelson, N. (1978) FEBS Lett. 15, 219-223.

68 b7. Pressman, B. (1976) Ann. Rev. Biochem. A^, 501-527.
68. Reed, R.W. (1979) in Methods in Enzymology (Fleischer, S. and Packer, L., eds.). Vol. 55, p. 435-444, Academic Press, New York.
69. Heytler, P.G. (1977) in Methods in En7.ymo1oay (Fleischer, S. and Packer, L., eds.). Vol. 55, 463-472, Academic Press, New York.
70. Levin, R.M. and Weiss, B. (1977) M d . Pharmacol. 11, 690-697.
71. Cheung, W.Y. (1984) Fed. Proc. 41, 2995-2999.
72. Jarrett, H.W. (1984) J. Biol. Chem. 259, 10136-10144.
73. Prozialeck, W.C (1984) J. Pharmacol. Exp. Ther. 211, 473-479.
74. Tanokura, M. and Yamada, K. (1985) J. Biol. Chem. 260. 8680-8682.
75. Rottenberg, H. (1979) in Methods in Enzymdogy (Fleischer, S. and Packer, L., eds.). Vol. 55, p. 547-569, Academic Press, New York.
76. Bindoli, A. and Fleischer, S. (1983) Arch. Biochem. Biophys. 221, 458-466.
77. Peach, CR., Cobb, A.D., Smith, J.A. and Knaff, D.B. (1986) FEBS Lett., in press.
78. La Porte, D.C, Wierman, B.M. and Storm, D.R. (1980) Biochem. H , 3814-3819.
79. Vogel, H.G., Lindahl, L. and Thulin, E. (1983) FEBS Lett. 152/ 241-246.
80. Krebs, J., Buerkler, J., Guerini, D., Brunner, J. and Carafdi, E. (1984) Biochem. 22., 400-403.
81. Cirillo, V.P. and Gromet-Elhanan, Z. (1981) Biochim. Biophys. Acta 63 6, 244-253.
82. Leiser, M. and Gromet-Elhanan, Z. (1977) Arch. Biochem. Biophys. 178, 79-88.
83. Zimniak, P. and Barnes, E.M. (1980) J. Biol. Chem. 255, 10140-10143.

69 84. Cheung, W.Y. (1982) Federation Proc. 41, 2253-2257.
85. Knaff, D.B. (1978) Arch. Biochem. Biophys. 189, 225-230.
PERMISSION TO COPY
In presenting this thesis in partial fulfillment of the
requirements for a master's degree at Texas Tech University, I agree
that the Library and my major department shall make it freely avail
able for research purposes. Permission to copy this thesis for
scholarly purposes may be granted by the Director of the Library or
my major professor. It is understood that any copying or publication
of this thesis for financial gain shall not be allowed without my
further written permission and that any user may be liable for copy
right infringement.
Disagree (Permission not granted) Agree (Permission granted)
^ . !>/?// inC^^ti K . IMi/J^ Student 's signature Student 's /signature
Date Date ^-I2'f)&

