leadership and motivation in hospitalityeprints.bournemouth.ac.uk/20767/1/boyne,steven phd thesis...
TRANSCRIPT
1
LEADERSHIP AND MOTIVATION IN HOSPITALITY
STEVEN BOYNE
A thesis submitted in partial fulfilment of the requirements of Bournemouth University for the degree of Doctor of Philosophy
March 2012

2

3
This copy of the thesis has been supplied on condition that
anyone who consults it is understood to recognise that its
copyright rests with its author and due acknowledgement
must always be made of the use of any material contained in,
or derived from, this thesis.

2
3
ABSTRACT
Steven Boyne
Leadership and motivation in hospitality
Customer contact service employees in hospitality organisations have a
critical role to play in satisfying customers’ expectations. However, it is
recognised that hospitality service jobs are often associated with low pay,
long and anti-social hours, unstable and seasonal employment, low job status,
a lack of career opportunities and poor levels of benefits. In the light of
factors such as these, which are likely to militate against high levels of
motivation - and consequently to reduce the quality of customer service -
addressing hospitality customer service employees’ motivation can be viewed
as a priority for hospitality management.
Inspirational, motivational leaders can motivate employees to ‘perform
beyond expectations’ and previous studies of leadership in hospitality have
demonstrated a number of positive outcomes related to the presence of
inspirational leaders. No studies have been identified, however, that have
measured the specific influence of motivational leadership on hospitality
service employees’ job performance.
To evaluate the contribution of motivational leadership to employee work
motivation, work motivation was measured using both employee attitudes and
job performance. Data were collected from a sample of non-supervisory
waiting staff in hotel businesses in the UK. In total, two hundred and thirteen
usable survey forms were returned from twenty seven UK hotels with table
service restaurants. All of the participating organisations were rated as three
or four stars and the mean number of non-supervisory waiting staff in these
hotels was twenty three.
The study finds that motivational leadership, alongside employee perceptions
of empowerment and employees’ work orientations, contributes positively to
both work attitudes and job performance.
The research also finds that motivational leadership enhances employees’
work meaning and understanding of organisational goals (mission clarity).
In addition to its empirical dimensions, the research contributes to hospitality
studies theory by critically appraising the leadership-related hospitality
literature and making recommendations for the future progress of hospitality
leadership studies.
4
List of Contents
1 INTRODUCTION.......................................................................... 17
1.1 Background and rationale .......................................................... 17
1.2 Aims, objectives and research design .......................................... 19
1.3 Structure of the thesis .............................................................. 22
2 LEADERSHIP .............................................................................. 24
2.1 Definitions of leadership ............................................................ 24
2.2 Reviewing the reviews: complexity and contestation in leadership
studies ............................................................................................. 27
2.2.1 Summary of paradigmatic progression in leadership studies .... 31
2.3 Major theories of leadership ....................................................... 33
2.3.1 Trait theories ..................................................................... 33
2.3.2 Behavioural theories ........................................................... 34
2.3.3 Situational or contingency approaches .................................. 40
2.3.4 Relational theory: Leader-Member Exchange (LMX) ................ 47
2.3.5 Antonakis et al.’s Schools: Skeptics, Information-Processing,
Contextual and New Leadership ....................................................... 48
2.4 Transformational leadership ....................................................... 50
2.4.1 Origins and essence ............................................................ 50
2.4.2 Transformational leadership in organisations ......................... 51
2.4.3 The evolution of transformational leadership theory for
organisations ................................................................................. 52
2.4.4 Transformational leadership outcomes .................................. 58
3 LEADERSHIP IN HOSPITALITY ................................................... 61
3.1 Review strategy and analytical framework ................................... 61
3.2 Early research (1970s) .............................................................. 65
3.3 Behavioural theory work ........................................................... 66
3.3.1 Initiating structure / consideration focused studies ................. 68
3.3.2 Leadership competencies approaches ................................... 69
3.3.3 Implicit leadership theory (ILT) approaches ........................... 71
3.4 Contingency theory work ........................................................... 73
3.5 Leader-Member Exchange (LMX) theory work .............................. 74
3.6 Transformational leadership theory work ..................................... 76
3.6.1 Transformational leadership in hospitality: rationales and
outcomes ...................................................................................... 79
3.7 Miscellaneous studies ................................................................ 82
3.8 Summary of hospitality leadership findings .................................. 84
3.9 Leadership in hospitality: the state of the art ............................... 85
3.10 Evolution of leadership studies in hospitality ............................. 87
3.11 Pittaway et al.’s (1998) paradigmatic framework ....................... 89
3.11.1 Pittaway et al.’s paradigms: a critique .................................. 91
3.11.2 The trouble with the taxonomy ............................................ 93
3.12 Reconceptualising the research agenda .................................... 97
5
4 DEVELOPING THE THEORETICAL FRAMEWORK ......................... 101
4.1 Work motivation research ........................................................ 103
4.1.1 Making sense of work motivation ........................................ 109
4.2 I/O Psychology and Organisational Behaviour ............................ 110
4.3 Motivation research in hospitality studies ................................... 117
4.3.1 Core articles from Simons’ review ....................................... 119
4.4 Exposition of the latent variables and hypotheses ....................... 125
5 MEASURING THE LATENT VARIABLES ....................................... 130
5.1 Dispositional factors / individual values ..................................... 131
5.2 Interpersonal, group and organisational processes...................... 135
5.3 Primary organisational outcomes: employee attitudes ................. 146
5.4 Secondary organisational outcomes: individual, group and organisational outcomes ................................................................... 159
5.5 Summary of Chapters 4 and 5.................................................. 168
6 METHODS FOR DATA COLLECTION AND ANALYSIS ................... 170
6.1 Structural equation modelling .................................................. 170
6.2 Modelling approach ................................................................. 173
6.3 Data assumptions and software ................................................ 174
6.4 Modelling strategy .................................................................. 176
6.4.1 Building the models .......................................................... 178
6.5 Instrumentation ..................................................................... 179
6.5.1 Questionnaire design and refinements ................................ 180
6.5.2 Administration of the full survey ......................................... 188
6.6 Data screening ....................................................................... 197
6.6.1 Treatment of missing data ................................................. 197
6.6.2 Distributional normality ..................................................... 206
7 ANALYSIS ................................................................................. 208
7.1 Re-statement of the analytical framework ................................. 208
7.2 Model 1, Step 1: the measurement model ................................. 208
7.2.1 Measurement model specification ....................................... 209
7.2.2 Measurement model identification ...................................... 210
7.2.3 Measurement model estimation .......................................... 212
7.2.4 Measurement model testing ............................................... 212
7.2.5 Assessment of construct validity ......................................... 213
7.2.6 Assessment of model fit .................................................... 217
7.2.7 Testing the measurement model (CFA 1:1) .......................... 221
7.2.8 Measurement model modification ....................................... 223
7.2.9 Measurement model: first respecification (CFA 1:2) .............. 227
7.2.10 Measurement model: second respecification (CFA 1:3) .......... 228
7.3 Model 1, Step 2: the structural model ....................................... 230
7.4 Model 2 ................................................................................. 234
7.5 Model 3 ................................................................................. 242
7.6 Model 3b ............................................................................... 248
6
7.6.1 Model 3 / Model 3b summary ............................................. 259
7.7 Model 4 ................................................................................. 261
7.8 Model 5 ................................................................................. 267
7.9 Model 5b ............................................................................... 277
7.9.1 Employee attitudes and discretionary service behaviour ........ 284
7.9.2 Model 5 / Model 5b summary ............................................. 286
7.10 Model 6 .............................................................................. 286
7.11 Model 7 .............................................................................. 287
7.12 Post-development validation of the model .............................. 288
7.13 Post-modification construct identities ..................................... 294
7.14 Construct relationships and effect sizes .................................. 298
7.15 Multi-group analyses............................................................ 302
7.15.1 Demographic variables ...................................................... 303
7.15.2 Supervisor contact, training and information ........................ 307
7.15.3 Work values .................................................................... 308
7.15.4 Summary of multi-group moderator analyses ...................... 311
7.16 Model 8: Mission Clarity ....................................................... 312
8 REVIEW, DISCUSSION AND CONCLUSION ................................ 314
8.1 Précis of the research ............................................................. 314
8.2 The model development process .............................................. 319
8.2.1 Additional analyses ........................................................... 328
8.3 Contributions, new conceptualisations and areas for further research . ............................................................................................ 334
8.3.1 Work motivation: behavioural measures ............................. 337
8.3.2 Work motivation: attitudinal measures ................................ 341
8.3.3 Work Values .................................................................... 346
8.3.4 Motivational leadership ..................................................... 348
8.3.5 Employee Empowerment ................................................... 348
8.3.6 Limitations of the current study ......................................... 352
8.3.7 Implications of the data collection outcomes for the research
findings ...................................................................................... 355
8.3.8 Other areas for further research ......................................... 357
8.4 Conclusions ........................................................................... 357
9 LIST OF REFERENCES ............................................................... 360
10 APPENDICES ......................................................................... 393
10.1 Appendix I: Complete list of hypotheses following model developments ................................................................................. 393
10.2 Appendix II: Univariate normality for all item scale variables .... 394
10.3 Appendix III: SEM estimates and matrices ............................. 396
10.4 Appendix IV: Bootstrap estimates and distributional normality .. 403
10.5 Appendix V: Hospitality leadership literature ........................... 411
10.6 Appendix VI: The pre-test survey form .................................. 413
10.7 Appendix VII: The pilot survey form ...................................... 420
10.8 Appendix VIII: The full survey form ....................................... 424
7
List of Figures
Figure 2-1 Van Seters and Field’s Evolutionary Tree .................................. 29
Figure 2-2 Situational Favourability in the LPC Contingency Model .............. 41
Figure 2-3 The full range model of transformational leadership ................... 54
Figure 2-4 The augmentation model of transactional and transformational
leadership ............................................................................................ 54
Figure 3-1 Summary of hospitality leadership LMX research findings ........... 76
Figure 3-2 Summary of Pittaway et al.’s paradigms ................................... 91
Figure 3-3 Hospitality leadership studies categorised according to Pittaway et
al.’s framework .................................................................................... 94
Figure 4-1 Example of a variable as both dependent and independent ....... 112
Figure 4-2 Organising framework for the identified factors ....................... 113
Figure 4-3 Organising framework with hypothesised causal links .............. 114
Figure 4-4 Latent variables identified from the reviews of literature .......... 125
Figure 4-5 Organising framework including the DSB construct .................. 126
Figure 5-1 The source of the Work Values indicator variables ................... 133
Figure 5-2 The Work Values construct ................................................... 134
Figure 5-3 The Motivational Leadership construct .................................... 137
Figure 5-4 The Empowerment construct ................................................ 141
Figure 5-5 The Social Support construct ................................................ 145
Figure 5-6 The Job Satisfaction construct ............................................... 149
Figure 5-7 Wollack et al.’s domains and constructs ................................. 153
Figure 5-8 The Work Meaning construct ................................................. 154
Figure 5-9 The Affective Organisational Commitment construct ................ 159
Figure 5-10 The Job Performance construct ............................................ 161
Figure 5-11 The Discretionary Service Behaviour construct ...................... 162
Figure 5-12 Analysis of Bitner et al.’s customer/employee data ................ 165
Figure 5-13 The Service Quality construct .............................................. 167
Figure 6-1 Example structural equation model ........................................ 171
Figure 7-1 Organising framework including the DSB construct .................. 208
Figure 7-2 Specification for the measurement model CFA 1:1 ................... 210
Figure 7-3 Summary of acceptable threshold levels ................................. 221
Figure 7-4 The structural model specification SEM 1:1 ............................. 231
Figure 7-5 Estimates for SEM 1:1 ......................................................... 231
Figure 7-6 Structural specification for Model 2 ........................................ 234
Figure 7-7 Estimates for SEM 2:1 ......................................................... 239
Figure 7-8 Constrained model SEM 2:1b ................................................ 240
Figure 7-9 Constrained model SEM 2:1c ................................................ 241
Figure 7-10 Structural specification for Model 3 ...................................... 243
Figure 7-11 Structural specification for Model 3b .................................... 248
Figure 7-12 Interpretations for the Employee Attitudes construct .............. 255
Figure 7-13 Wollack et al.’s Work Meaning domains ................................ 256
Figure 7-14 Parameter estimates and model fit for SEM 3b ...................... 258
8
Figure 7-15 The original Model 3 specification ........................................ 259
Figure 7-16 Model 3b structure, estimates and fit statistics ...................... 260
Figure 7-17 Structural specification for Model 4 ...................................... 262
Figure 7-18 Estimates for Model 4 (SEM 4:2) ......................................... 265
Figure 7-19 Structural specification for Model 5 ...................................... 268
Figure 7-20 Estimates and model fit for SEM 5:2 .................................... 272
Figure 7-21 Structural specification for Model 5b .................................... 277
Figure 7-22 Estimates and model fit for SEM 5b:2 .................................. 280
Figure 7-23 SEM 5b:3 with the EPA→DSB path ....................................... 285
Figure 7-24 Summary of modified construct definitions ........................... 298
Figure 7-25 Contact, training and information statements ........................ 307
Figure 7-26 Distribution of the Work Values summated scale variable ....... 310
Figure 7-27 Estimates for Model 8: Mission Clarity .................................. 313
Figure 8-1 Organising framework for the research .................................. 318
Figure 8-2 Model 2.............................................................................. 321
Figure 8-3 Model 3b ............................................................................ 323
Figure 8-4 Model 5b ............................................................................ 325
Figure 8-5 Job Satisfaction predicting Job Performance ........................... 331
9
List of tables
Table 2-1 Mintzberg’s Management Roles ................................................ 25
Table 2-2 Thematic reviews of leadership studies...................................... 28
Table 2-3 Antonakis et al.’s Major schools of leadership ............................. 30
Table 2-4 Common themes and problem areas ......................................... 31
Table 2-5 Production- and employee-centred leadership orientation in various
theoretical contexts .............................................................................. 36
Table 2-6 Situational variables within potential significance for catering server
performance ........................................................................................ 46
Table 2-7 Bass’s (1985) major factors of transformational leadership .......... 52
Table 2-8 The Idealized Influence Factor ................................................. 56
Table 3-1 Primary theoretical foci of leadership in hospitality papers ........... 63
Table 3-2 Summary of hospitality leadership studies by primary theoretical
focus ................................................................................................... 64
Table 3-3 Miscellaneous behavioural approach studies ............................... 67
Table 3-4 Leadership-competencies approaches ....................................... 70
Table 3-5 Implicit leadership theory (ILT) approaches ............................... 72
Table 3-6 Transformational leadership hospitality studies: foci and findings . 77
Table 3-7 Leadership outcomes measured in the (empirical) hospitality studies
utilising transformational leadership ........................................................ 79
Table 3-8 Rationales for employing transformational leadership .................. 81
Table 4-1 Research hypotheses derived from the literature reviews of generic
and hospitality-specific leadership research ............................................ 115
Table 4-2 Description and background for the research hypotheses .......... 127
Table 4-3 Description and background for the Service Quality hypotheses . 128
Table 5-1 Hospitality studies employing Organisational Commitment......... 156
Table 5-2 Allen and Meyer’s (1990) Affective Commitment scale .............. 158
Table 6-1 Descriptive statistics for the sample ........................................ 195
Table 6-2 Comparison of sample characteristics with known population values
........................................................................................................ 196
Table 6-3 Distribution of missing values by variable ................................ 203
Table 6-4 Distribution of missing values by case ..................................... 204
Table 7-1 Estimates for the measurement model CFA 1:1 ........................ 222
Table 7-2 Factor correlations and squared correlation estimates for the initially
specified measurement model (CFA 1:1) ............................................... 224
Table 7-3 Discriminant validity estimates for CFA 1:1 .............................. 224
Table 7-4 Modifications made to the initially specified measurement model
(CFA 1:1) .......................................................................................... 226
Table 7-5 Estimates for CFA 1:2 ........................................................... 227
Table 7-6 Estimates for CFA 1:3 ........................................................... 228
Table 7-7 Correlation estimates for CFA 1:3 ........................................... 229
Table 7-8 Discriminant validity estimates for CFA 1:3 .............................. 229
Table 7-9 Estimates for CFA 2:1 ........................................................... 235
10
Table 7-10 Modifications to CFA 2:1 ...................................................... 236
Table 7-11 Estimates for CFA 2:2 ......................................................... 237
Table 7-12 Estimates for CFA 2:3 ......................................................... 238
Table 7-13 Total (standardised) effects for Model 2 ................................. 241
Table 7-14 Estimates for CFA 3:1 ......................................................... 244
Table 7-15 Estimates for CFA 3:2 ......................................................... 245
Table 7-16 Estimates for CFA 3:3 ......................................................... 246
Table 7-17 Estimates for CFA 3:4 ......................................................... 247
Table 7-18 Estimates for CFA 3b:1 ....................................................... 249
Table 7-19 Estimates for CFA 3b:8 ....................................................... 254
Table 7-20 Discriminant validity estimates for CFA3b:8 ........................... 254
Table 7-21 Total (standardised) effects for Model 3b ............................... 260
Table 7-22 Modification steps for CFA 4:1 to 4:7 .................................... 263
Table 7-23 Estimates and construct validity for the final measurement model
specification CFA 4:7........................................................................... 264
Table 7-24 Total (standardised) effects for Model 4 ................................. 267
Table 7-25 Modification steps for CFA 5:1 to 5:7 .................................... 269
Table 7-26 Estimates and model fit for CFA 5:7 ...................................... 270
Table 7-27 Chi square difference test for SEM 5:1 and SEM 5:11 .............. 276
Table 7-28 Modification steps for CFA 5b:1 to 5b:8 ................................. 278
Table 7-29 Estimates and model fit for CFA 5b:8 .................................... 279
Table 7-30 Total (standardised) effects for Model 5b ............................... 282
Table 7-31 Comparison of Models 5 and 5b ............................................ 283
Table 7-32 Post-development comparisons for Model 5b .......................... 289
Table 7-33 Model fit for the baseline and constrained models ................... 292
Table 7-34 Chi-square difference tests for Model 5b validation ................. 293
Table 7-35 Research hypotheses and research findings ........................... 299
Table 7-36 Sample demographics comparison with known population values
........................................................................................................ 303
Table 7-37 Distribution of the respondent characteristics data .................. 304
Table 7-38 Moderator analysis for Model 2 ............................................. 305
Table 7-39 Moderator analysis for Model 5b ........................................... 306
Table 7-40 Group distributions for work characteristic categories .............. 308
Table 7-41 Distribution of the Work Values reduced and recoded summated
scale variable ..................................................................................... 310
Table 7-42 Summary of findings from moderator analyses ....................... 311
Table 8-1 Summary of hypotheses tested and effect sizes ....................... 336
Table 8-2 Comparison of DSB factor loadings with Simons and Roberson
(2003) .............................................................................................. 340
Table 8-3 Servant and transformational leadership compared .................. 351
Table 8-4 Effects of data collection outcomes on the research findings ...... 356
11
ACKNOWLEDGEMENTS
Thanks are due firstly to my wife, Caroline, for encouraging (and supporting!)
this venture. Further encouragement and support has also been forthcoming
from my parents, Evelyn and John, and from my wife’s parents, Graham and
Barbara.
At Bournemouth University, my supervisory team, Adam (Blake) and Peter
(Lugosi), have each provided excellent insight and guidance, and thanks must
also go to Dr Jonathan Edwards of the School of Tourism for liaising between
myself and the School during the scholarship application process.
Acknowledgement is due, of course, to Bournemouth University and the
School of Tourism for providing the scholarship to undertake this research.
A number of organisations and individuals provided assistance with the data
collection process. Many of these are hotel general managers who remain
anonymous here for reasons of confidentiality. Individuals not associated
with specific commercial businesses and to whom thanks are due are: Alan
Cutler (Hospitality Leadership Ltd), Mark Maltby (Hospitality Skills Academy),
Stella Callaghan (VisitScotland), Graeme Gibson (Greater Glasgow Hotel
Association), Alastair Galbraith (People 1st), Stephen Williamson, Gillian
Swanney and Margaret McNeil (Scottish Enterprise), Colin Paton (Edinburgh
Hotels Association) and Rosie McReadie (Skills Development Scotland).
Thanks are also due to the respondents who took the time to complete the
survey forms.
This thesis is dedicated to our wonderful daughters, Lowena and Iona, who
arrived just as the final edits were being made.

12
DECLARATION
Figure 2-1 from Van Seters and Field (1990: 33) is reproduced with
permission from Emerald Group Publishing Ltd.
13
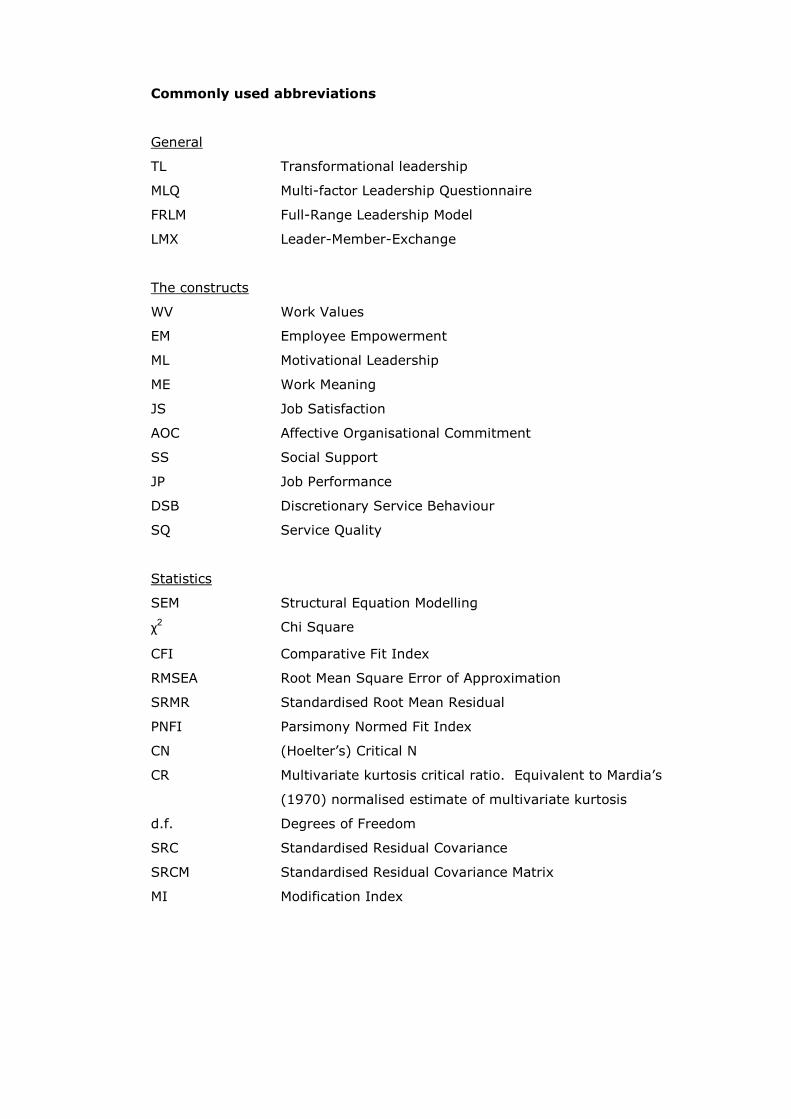
Commonly used abbreviations
General
TL Transformational leadership
MLQ Multi-factor Leadership Questionnaire
FRLM Full-Range Leadership Model
LMX Leader-Member-Exchange
The constructs
WV Work Values
EM Employee Empowerment
ML Motivational Leadership
ME Work Meaning
JS Job Satisfaction
AOC Affective Organisational Commitment
SS Social Support
JP Job Performance
DSB Discretionary Service Behaviour
SQ Service Quality
Statistics
SEM Structural Equation Modelling
χ2 Chi Square
CFI Comparative Fit Index
RMSEA Root Mean Square Error of Approximation
SRMR Standardised Root Mean Residual
PNFI Parsimony Normed Fit Index
CN (Hoelter’s) Critical N
CR Multivariate kurtosis critical ratio. Equivalent to Mardia’s
(1970) normalised estimate of multivariate kurtosis
d.f. Degrees of Freedom
SRC Standardised Residual Covariance
SRCM Standardised Residual Covariance Matrix
MI Modification Index

17
1 INTRODUCTION
1.1 Background and rationale
The performance of front-line staff has been recognised as being critical for
service-orientated organisations in general (e.g. Schneider et al. 1980: 423) and
also for hospitality organisations (e.g. Hartline and Ferrell 1996: 52-53; Lashley
1996: 334; Wilkins et al. 2007). Concerns surrounding service employees’ job
performance and service quality are at the heart of hospitality management (e.g.
Davidson 2003: 72; Wilkins et al. 2007: 841), not least owing to the inseparable
nature of production and consumption in services. This concept describes how,
unlike goods, services are produced and consumed simultaneously; services,
therefore, cannot readily be quality-assured prior to delivery. This means that, to
a large extent, the quality of the customer’s experience is determined at the point
of delivery and based on the performance of the service delivery employee (Go et
al. 1996: 5). Carlzon (1987) described these service encounters between
employees and customers as ‘moments of truth’, the point at which the success
or failure of a service organisation is determined.
In addition to customer satisfaction, Buttle (1996: 8) describes a number of other
productive organisational outcomes associated with quality of service in
hospitality such as profitability, costs, customer retention and positive word-of-
mouth customer evaluations. Given the critical role of hospitality service
personnel, there is some irony that many front-line hospitality service jobs offer
relatively low pay, long and unsociable hours, poor levels of job stability and a
lack of promotional opportunities (Hesselink et al. 2004: 11; Wildes 2007: 5-6;
Wong and Ko 2009: 195). Wood provided a particularly unflattering picture,
describing hospitality work as often being:
...largely exploitative, degrading, poorly paid, unpleasant, insecure
and taken as a last resort or because it can be tolerated in the light of
wider social and economic commitments and constraints
(Wood 1997: 198)
According to Herzberg’s Two-Factor theory of motivation (Herzberg 1966),
characteristics such as these militate against employees enjoying high levels of
motivation and Keegan, with reference to improving hospitality jobs through
18
redesign and enrichment, writes that:
...most of the jobs in the hospitality industry do not lend themselves to
such improvements. The challenge for us is not so much to change
the job, but to provide the managerial leadership that would create an
environment in which the employee’s real needs are satisfied.
(1983: 92-93)
Against this background, it is argued that inspirational, motivational leaders are a
key organisational resource for motivating service staff in hospitality
organisations.
Within the broader field of organisational psychology, researchers have been
studying leadership for around 100 years (Antonakis et al. 2004a: 4) generating a
body of work containing thousands of empirical studies (Alvesson and
Sveningsson 2003: 359), hundreds of definitions (Rost 1991), dozens of theories
(see e.g. Lowe and Gardner 2000; Yukl 2010) and several overarching research
paradigms (Van Seters and Field 1990; Bryman 1992).
In recent years considerable attention has focused on the ‘new leadership’
approaches (charismatic / transformational leadership theories) (Lowe and
Gardner 2000; Antonakis et al. 2004a) that emerged during the 1980s and have
focused on leader charisma, vision and inspiration. The pattern of leadership
research in hospitality contexts has followed this trend with transformational
leadership theory emerging as the dominant research approach in this area.
Transformational leadership valorises (among other leader attributes)
inspirational-motivational behaviour and posits this as a key platform from which
leaders can engender improved employee performance.
This research aims to evaluate the role of motivational leadership in enhancing
hospitality service staff motivation and performance. Conceptually and
empirically (through the use of structural equation modelling with latent
variables), motivational leadership is located within a wider organisational /
motivational context. In this way the research seeks to build a nuanced
understanding of the role of motivational leaders in influencing employee work
motivation (measured using both employee work attitudes and job performance)
in hospitality services. Such an approach also addresses calls in the broader
leadership (Lowe and Gardner 2000: 496-498) and organisational studies (Johns
2001; Rousseau and Fried 2001) literature for more integrated research
19
approaches that can improve our understanding of the linkages between
phenomena in the workplace (see also Antonakis et al. 2004b: 60). Measuring
the relationship between leadership and job performance also addresses a
significant knowledge gap in the hospitality leadership literature (Section 3.8
describes how no published studies have measured the relationship between
leadership and job performance in a hospitality context).
1.2 Aims, objectives and research design
Against this background, the research aims to:
explore and evaluate the contribution of motivational leadership to employee
work motivation in hospitality services.
The research design locates motivational leadership within the broader
organisational / motivational context by also measuring how a number of non-
leadership phenomena contribute to employee work motivation.
The specific objectives of the research are to:
1. critically evaluate the field of hospitality leadership studies to identify relevant
issues and inform the research design;
2. develop a theoretical framework to:
a. locate the variables of interest in relation to existing organisational
psychology theories;
b. articulate the likely linkages between variables; and
c. guide the formulation of specific hypotheses;
3. identify/generate measurement scales for the latent variables;
4. refine the measurement scales; and
5. test and evaluate the relationships between variables using survey data
collected from hotel restaurant waiting staff.
Literature reviews of the generic and hospitality-specific leadership literatures
satisfy the requirements for Objective 1. The theoretical framework (Objective 2)
is developed by integrating the identified variables of interest within the broader
frameworks of work motivation and organisational psychology / organisational
behaviour research. With regard to Objective 3, the applied hospitality and
services-related leadership and organisational studies literatures are interrogated
20
to: guide the operationalisation and measurement of the latent variables; identify
additional relevant variables; and further inform the development of hypotheses
for the survey research.
The work undertaken in pursuit of Objectives 1 to 3 (a) contributes to the
selection of the variables of interest and the methods for measuring these, and
(b) underpins the development of the theoretical framework that is used to guide
the specification of the causal relationships between variables i.e. the formulation
of the research hypotheses.
Ambrose and Kulik (1999: 232) describe how work motivation can be measured
using both attitudinal (e.g. job satisfaction) and behavioural (e.g. job
performance) measures. This research employs both attitudinal (job satisfaction,
affective organisational commitment and work meaning) and behavioural
measures of work motivation.
Two principal job performance measures are employed, the first - Job
Performance (JP) - is a respondent self-assessment measure of extra effort and
the second - Discretionary Service Behaviour (DSB) - is a peer-assessment of
extra effort based on earlier work by Blancero and Johnson (1997, 2001) and by
Simons and Roberson (2003). An exploratory third measure of job performance
is included that utilises a specially-developed scale which attempts to measure
performance based on service quality.
Aside from motivational leadership, the research assess the role of employee
work orientations and employee perceptions of empowerment as predictors of
employee attitudes. Social support (peer support) is also assessed as a predictor
of job performance.
Objectives 4 and 5 are achieved through the use of data collected using a
respondent-completed postal questionnaire distributed to a range of UK hotels
that agreed to assist with the research. The population of interest is non-
supervisory foodservice employees (waiting staff) working in hotels with table
service restaurants. Hotel businesses were chosen as a focus for this research
owing to the opportunities hotels provide for access to: (i) large numbers of
foodservice employees in relatively few sites; (ii) businesses with existing
connections to Bournemouth University’s School of Tourism; and (iii) a population
21
working in a relatively homogenous service context (restaurants in commercial
hotels).
The research design follows a positivistic organisational psychology /
organisational behaviour approach wherein relevant variables and psychometric
methods of quantifying these are identified from reviews of the relevant literature.
The key variables in this research are latent (unobservable) constructs (also
referred to as latent variables, latent factors, or factors) which are operationalised
and measured using multiple indicator variables. Structural equation modelling
(SEM) is chosen as the analytical method because this technique makes it
possible to measure relationships between latent variables. Further advantages
of SEM include its capacity to (i) estimate models containing multiple dependent
and independent variables and (ii) to incorporate mediating variables (see e.g.
Raykov and Marcolides 2006: 7).
Analysis of data is undertaken using IBM SPSS and AMOS (the IBM SPSS module
for SEM analysis; both SPSS and AMOS Version 18) using structural regression
models (Kline 2005: 209). The modelling method is based on Anderson and
Gerbing’s (1988) two-step procedure (measurement model followed by structural
model) with each step following the five stages (specification, identification,
estimation, testing and modification) described by Schumaker and Lomax (2004).
The research employs a Model Generating (MG) approach in which the model is
modified and tested again using the same data (Jöreskog 1993: 295; Raykov and
Marcolides 2006: 7). Whilst structural equation models are specified and tested
in a hypothetico-deductive manner – that is, each causal or correlational
relationship is posited in the form of an a priori hypothesis which is then tested
statistically – the Model Generating or theory development approach means that
at a broader level the research operates in a somewhat exploratory mode. On
this matter, Raykov and Marcolides write:
In theory development, repeated applications of SEM are carried out,
often on the same data set, in order to explore potential relationships
between variables of interest. In contrast to the confirmatory mode of
SEM applications, theory development assumes that no prior theory
exists—or that one is available only in a rudimentary form—about a
phenomenon under investigation.
(Raykov and Marcolides 2006: 6-7)
22
Theory being ‘available only in a rudimentary form’ describes well the situation
(described later in this research) regarding the nature of social scientific
knowledge on the specific relationships that exist between leadership, motivation
and job performance in hospitality service contexts.
Against this background, and using the Model Generating approach, the research
can be viewed as contributing towards a middle-range theory of leadership and
motivation in a hospitality service context. Middle range theories predict / explain
only a subset of all organizational phenomena, or focus only on a sub-set of
organisations or individuals (Pinder and Moore 1979: 2).
1.3 Structure of the thesis
Following this introductory chapter, the work begins with an examination of the
field of generic leadership studies in order to provide a framework for categorising
the studies identified in the subsequent review of the applied hospitality
leadership research. Chapter 2, therefore, focuses on describing the major
theoretical developments in the generic leadership studies field, while also
drawing out relevant issues for this study. Chapter 3 then describes and critically
evaluates the applied (hospitality) leadership research literature with respect to
the core leadership theories described in Chapter 2.
Throughout Chapters 2 and 3, a number of variables related to employee work
motivation are identified. It is the task of Chapter 4 to identify a theory-based
organising framework to inform the development of research hypotheses linking
these variables. Accordingly, Chapter 4 begins with a review of the major
theories in the field of work motivation research. This review of work motivation
studies finds that no integrated framework of work motivation theory exists. As a
consequence of this, the overarching field of industrial and organisational (I/O)
psychology is examined and, from this, an organising framework for the research
is developed within which it is possible to (i) locate the variables of interest and
(ii) inform the development of specific research hypotheses.
Having developed a theoretical framework to guide the specifications of the
hypothesised linkages between the variables of interest, Chapter 4 concludes by
reviewing the applied (hospitality and service-related) organisational studies
literature to: (i) identify precedents for measuring the selected latent variables;
23
(ii) identify any additional relevant variables for inclusion in the study; and (iii)
further inform the development of hypotheses for the survey research.
Chapter 5 elaborates the rationale for the inclusion of each of the latent
constructs and, with reference to the published research, describes and justifies
the development of the indicator variables for each of these constructs.
Chapter 6 introduces the structural equation modelling (SEM) analytical technique
and also describes the refinement of the measurement scales, the development of
the survey instrument, the administration of the survey and the specifics of the
data screening procedures prior to the development of the SE (structural
equation) models.
Chapter 7 deals with data analysis and begins with a general description of
structural equation modelling (SEM) followed by the specific modelling strategy to
be employed in the research. The specific methods for undertaking the SEM
analyses are described throughout the development of Model 1; the development
of the remaining models is then carried out following the same methods.
Chapter 8 concludes the thesis by discussing the research findings in terms of the
contributions made, the new conceptualisations that are generated, the
theoretical and practical implications of the research findings and how future
research might build upon these.
24
2 LEADERSHIP
This section introduces and examines the field of generic leadership studies in
order to provide a framework for categorising the hospitality leadership studies
that are identified in Chapter 3. The development of the field of leadership
studies is described, as are the central tenets of the major theories to have
emerged during the 20th Century. Where appropriate, linkages are made
between core concepts in leadership theory and the aims of the current research.
2.1 Definitions of leadership
There are a great many definitions of leadership; Rost, for example, found 221 for
his 1991 publication Leadership for the twenty-first century. Yukl (1989: 252-
253) provided an excellent overview of the progress of the debate about how to
define leadership and, perhaps the most illuminating point which he makes
therein is that some commentators argue that ‘leaders’ (as opposed to
‘managers’) are able to influence people by means other than the ‘more
traditional’, ‘carrot and stick’ / ‘reward and punishment’ approaches. Leaders are
able to influence people by instilling/creating empathy for work goals, appealing
to people’s higher-order social and self-esteem needs – that is, leaders do not
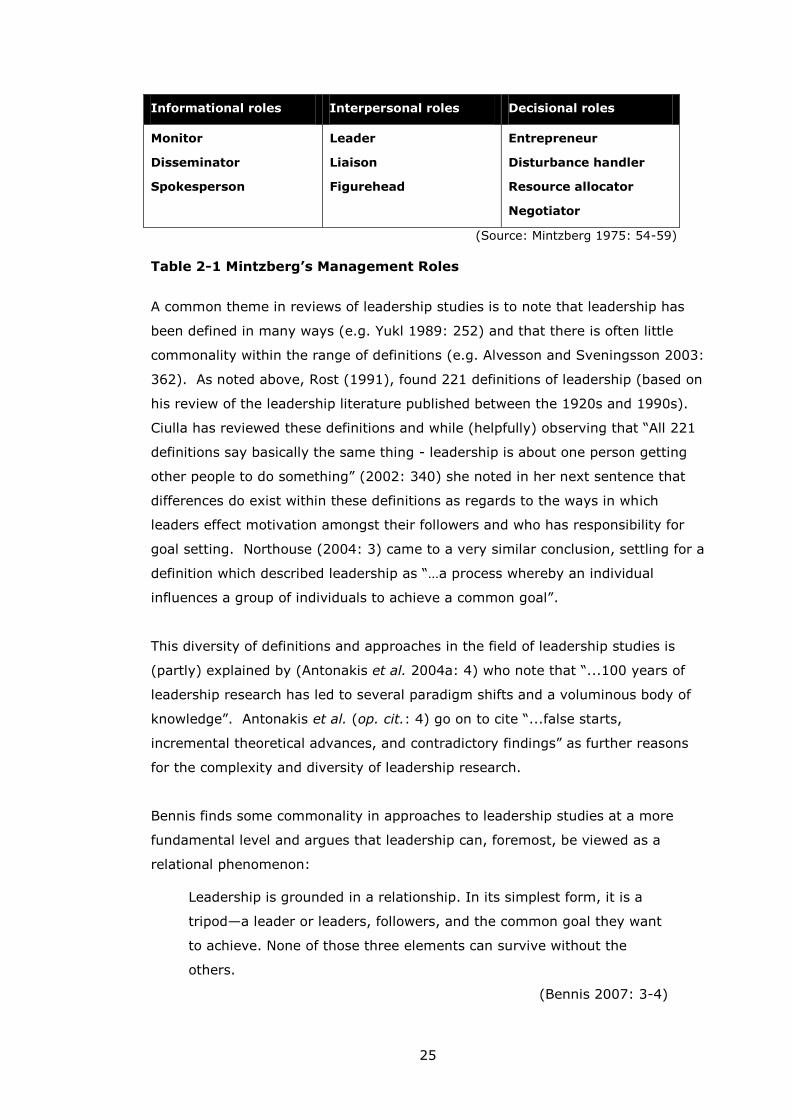
coerce their colleagues/subordinates into action, rather, they inspire. Mintzberg’s
(1973) The Nature of Managerial Work identified 10 managerial roles, one of
which is leadership, which Mintzberg defined as, “...responsible for the motivation
and activation of subordinates; responsible for staffing, training, and associate
duties” (1973: 92). Elsewhere, Shortt describes Mintzberg’s leader role thus:
In the role of leader, managers encourage and motivate subordinates
to achieve organisational objectives. This role may be seen as a
supervisory one, in which the manager selects, trains, promotes and
dismisses subordinates.
(Shortt 1989: 122)
The Mintzbergian approach, therefore, is not to position leaders apart from
managers, but to include leadership as an aspect of management. Table 2-1
illustrates Mintzberg’s categorisation of his ten management roles.
25
Informational roles Interpersonal roles Decisional roles
Monitor
Disseminator
Spokesperson
Leader
Liaison
Figurehead
Entrepreneur
Disturbance handler
Resource allocator
Negotiator
(Source: Mintzberg 1975: 54-59)
Table 2-1 Mintzberg’s Management Roles
A common theme in reviews of leadership studies is to note that leadership has
been defined in many ways (e.g. Yukl 1989: 252) and that there is often little
commonality within the range of definitions (e.g. Alvesson and Sveningsson 2003:
362). As noted above, Rost (1991), found 221 definitions of leadership (based on
his review of the leadership literature published between the 1920s and 1990s).
Ciulla has reviewed these definitions and while (helpfully) observing that “All 221
definitions say basically the same thing - leadership is about one person getting
other people to do something” (2002: 340) she noted in her next sentence that
differences do exist within these definitions as regards to the ways in which
leaders effect motivation amongst their followers and who has responsibility for
goal setting. Northouse (2004: 3) came to a very similar conclusion, settling for a
definition which described leadership as “…a process whereby an individual
influences a group of individuals to achieve a common goal”.
This diversity of definitions and approaches in the field of leadership studies is
(partly) explained by (Antonakis et al. 2004a: 4) who note that “...100 years of
leadership research has led to several paradigm shifts and a voluminous body of
knowledge”. Antonakis et al. (op. cit.: 4) go on to cite “...false starts,
incremental theoretical advances, and contradictory findings” as further reasons
for the complexity and diversity of leadership research.
Bennis finds some commonality in approaches to leadership studies at a more
fundamental level and argues that leadership can, foremost, be viewed as a
relational phenomenon:
Leadership is grounded in a relationship. In its simplest form, it is a
tripod—a leader or leaders, followers, and the common goal they want
to achieve. None of those three elements can survive without the
others.
(Bennis 2007: 3-4)
26
Drath et al. (2008: 635) contend that Bennis’s ‘tripod’ describes an underlying
ontology of leadership studies (and one which is “virtually beyond question in the
field”). However, while leadership studies may have been conducted based upon
a uniform ontological platform, Alvesson and Sveningsson (2003: 362) doubt that
“…a common definition is practically possible”. They support their argument with
a selection of shortcomings which have been raised with regard to the lack of
progress in realising a unified theory of leadership; these include:
Alvesson and Deetz (2000, cited in Alvessen and Sveningson 2003: 362): “The
commitment to an objectivist paradigm promising the accumulation of
knowledge through development and verification of hypothesis has not led to
the delivery of the goods”;
Fiedler (1996: 241), who noted skeptics’ concerns that: “…leadership theories
and research lacked focus and were chaotic, and some writers asked even
whether there is such a thing as leadership”;
Sashkin and Garland (1979: 65): ‘‘By any objective measure, the study of
leadership has failed to produce generally accepted, practically useful, and
widely applied scientific knowledge’’; and
Yukl (1989: 253): “ the field . . . is presently in a state of ferment and
confusion. Most of the theories are beset with conceptual weaknesses and lack
strong empirical support. Several thousand empirical studies have been
conducted on leadership effectiveness, but most of the results are
contradictory and inconclusive”.
The section above has introduced the heterogeneity of definitions and theory in
leadership research and paints something of a bleak picture as regards
positivistic-mode progress towards a unified theory of leadership. More recently,
however, Mackenzie and Barnes (2007) have suggested that leadership studies
are ‘evolving’ along a positivistic path. Firstly, they reiterate the complex nature
of leadership studies and leadership theory:
Each new “Leadership Theorist” and every “Supervisor Student”
eventually struggles to reconcile and synthesize different viewpoints
about leading and leadership. This is a daunting task, given the
immense quantity of writing in their literatures. The diversity of
opinion, the many competing purposes, the different foci of attention,
the variety of leadership approaches, and the fuzziness of terms and
conceptual relationships makes reconciliation and synthesis a task of
well-informed, expert, and diligent scholars.
(Mackenzie and Barnes 2007: 99)
27
They then go on to describe how emergent texts (compendia) contribute to
the advancement of theory through each author’s (or authors’) attempts to
valorise their own synthesis of leadership theories and paradigms:
Each compendia creates a synthesizing narrative to establish a story
line for the author's particular approach. Each new approach is similar
to an invention. The invention attracts followers. Eventually, followers
beget dissenters. Divergence grows between the argued leadership
approach and the accumulating opinion. Next, new typologies are
invented to reduce and organize the divergence. This leads to a new
convergent synthesis.
(Mackenzie and Barnes 2007: 99)
House and Aditya (1997: 409) also argue that “...the development of knowledge
concerning leadership phenomena has been truly cumulative”. We can see then
that not only are definitions of leadership contested, the nature of the
development of leadership as an area of study is also contested. Accordingly, the
following section briefly examines some prominent perspectives on the
development of leadership studies. The thesis then moves on to critically
examine the major leadership studies approaches and theories.
2.2 Reviewing the reviews: complexity and contestation in leadership
studies
A number of reviews of leadership research have been published during the
‘modern leadership era’ (i.e. post 1970s, following the emergence of the
new/charismatic/transformational approaches). Some of these employ a thematic
categorisation while others combine thematic with chronological methods of
categorisation.
The different reviews each tend to emphasise certain aspects of leadership
research and employ more or less nuanced categorisations. For example: Bass,
writing in 1981 lists 10 separate sets of leadership theories containing a further
11 discrete ‘sub-theories’ (1981: 26-37); Yukl (1989) provides a detailed review
emphasising trends and developments during the 1980s (situational and
transformational approaches); Van Seters and Field (1990) propose ten ‘eras’ of
leadership research and illustrate the evolutionary linkages between the various
theories which emerged during these eras; Bryman (1992) offers a pared-down
28
framework containing the essential four (trait, behavioural, situational and
transformational) approaches; House and Aditya (1997) use a similar
categorisation to Bryman (1992) and include detailed discussion on ten emergent
leadership research approaches; Lowe and Gardner (2000) provide an excellent
and detailed review of studies, theoretical approaches and methods employed in
articles published in the Leadership Quarterly journal during the 1990s; and, most
recently, Antonakis et al. (2004a) provide a fresh categorisation along with an
evaluation of the current levels of activity in each of their ‘schools’ of leadership
research.
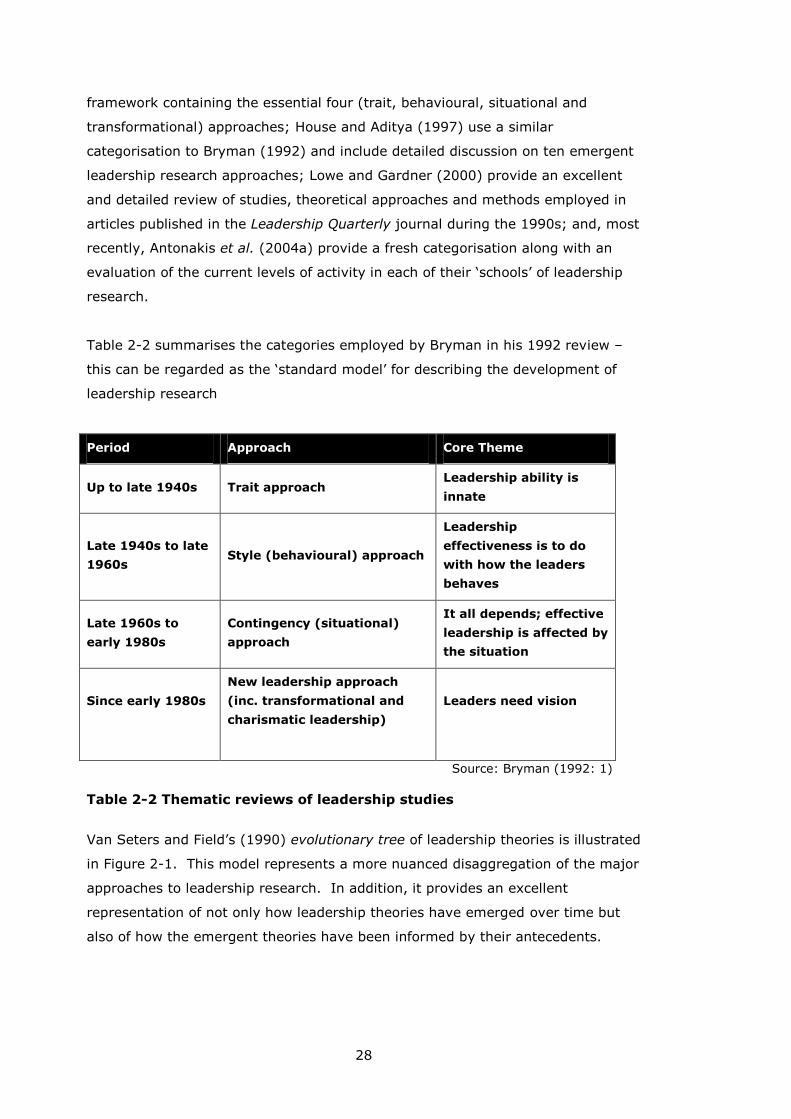
Table 2-2 summarises the categories employed by Bryman in his 1992 review –
this can be regarded as the ‘standard model’ for describing the development of
leadership research
Period Approach Core Theme
Up to late 1940s Trait approach Leadership ability is
innate
Late 1940s to late
1960s Style (behavioural) approach
Leadership
effectiveness is to do
with how the leaders
behaves
Late 1960s to
early 1980s
Contingency (situational)
approach
It all depends; effective
leadership is affected by
the situation
Since early 1980s
New leadership approach
(inc. transformational and
charismatic leadership)
Leaders need vision
Source: Bryman (1992: 1)
Table 2-2 Thematic reviews of leadership studies
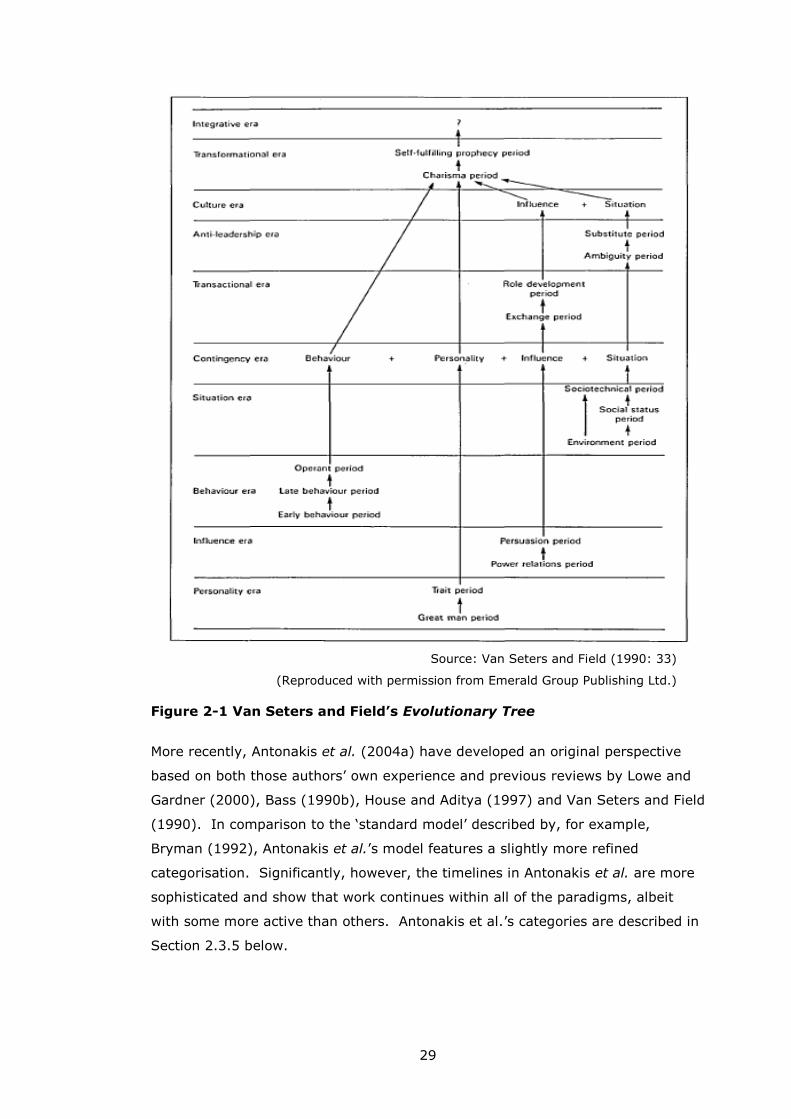
Van Seters and Field’s (1990) evolutionary tree of leadership theories is illustrated
in Figure 2-1. This model represents a more nuanced disaggregation of the major
approaches to leadership research. In addition, it provides an excellent
representation of not only how leadership theories have emerged over time but
also of how the emergent theories have been informed by their antecedents.
29
Source: Van Seters and Field (1990: 33)
(Reproduced with permission from Emerald Group Publishing Ltd.)
Figure 2-1 Van Seters and Field’s Evolutionary Tree
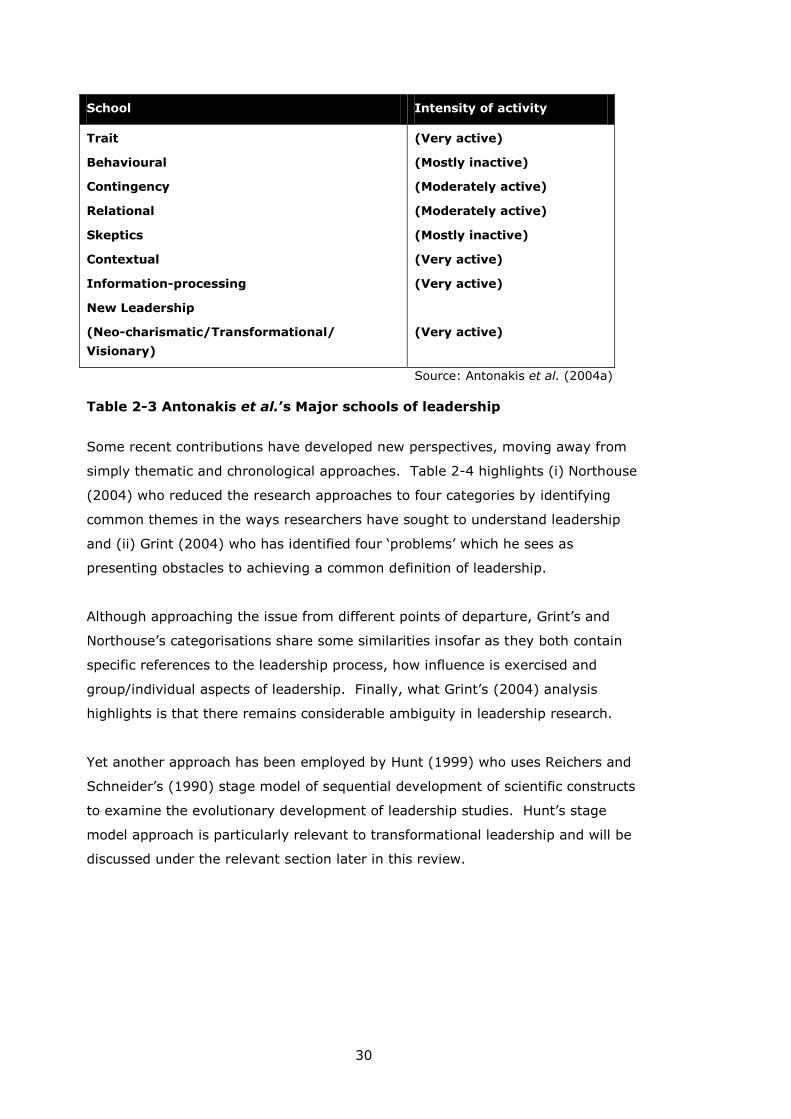
More recently, Antonakis et al. (2004a) have developed an original perspective
based on both those authors’ own experience and previous reviews by Lowe and
Gardner (2000), Bass (1990b), House and Aditya (1997) and Van Seters and Field
(1990). In comparison to the ‘standard model’ described by, for example,
Bryman (1992), Antonakis et al.’s model features a slightly more refined
categorisation. Significantly, however, the timelines in Antonakis et al. are more
sophisticated and show that work continues within all of the paradigms, albeit
with some more active than others. Antonakis et al.’s categories are described in
Section 2.3.5 below.
30
School Intensity of activity
Trait
Behavioural
Contingency
Relational
Skeptics
Contextual
Information-processing
New Leadership
(Neo-charismatic/Transformational/
Visionary)
(Very active)
(Mostly inactive)
(Moderately active)
(Moderately active)
(Mostly inactive)
(Very active)
(Very active)
(Very active)
Source: Antonakis et al. (2004a)
Table 2-3 Antonakis et al.’s Major schools of leadership
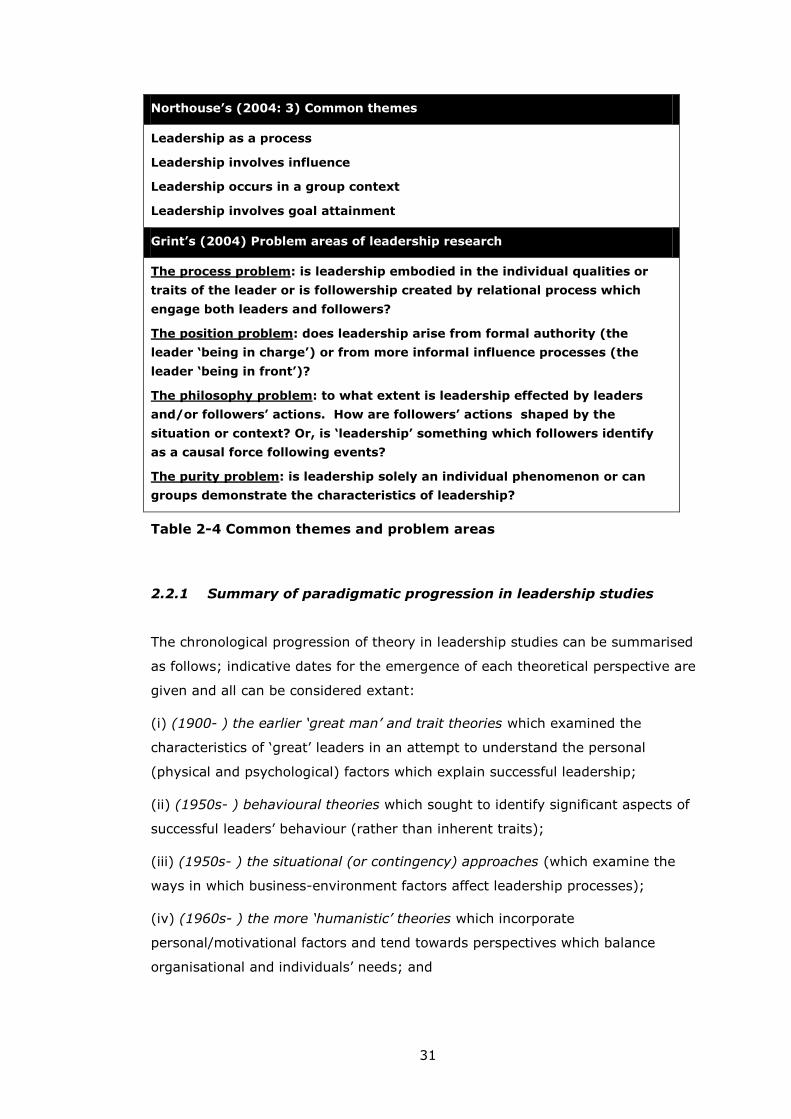
Some recent contributions have developed new perspectives, moving away from
simply thematic and chronological approaches. Table 2-4 highlights (i) Northouse
(2004) who reduced the research approaches to four categories by identifying
common themes in the ways researchers have sought to understand leadership
and (ii) Grint (2004) who has identified four ‘problems’ which he sees as
presenting obstacles to achieving a common definition of leadership.
Although approaching the issue from different points of departure, Grint’s and
Northouse’s categorisations share some similarities insofar as they both contain
specific references to the leadership process, how influence is exercised and
group/individual aspects of leadership. Finally, what Grint’s (2004) analysis
highlights is that there remains considerable ambiguity in leadership research.
Yet another approach has been employed by Hunt (1999) who uses Reichers and
Schneider’s (1990) stage model of sequential development of scientific constructs
to examine the evolutionary development of leadership studies. Hunt’s stage
model approach is particularly relevant to transformational leadership and will be
discussed under the relevant section later in this review.
31
Northouse’s (2004: 3) Common themes
Leadership as a process
Leadership involves influence
Leadership occurs in a group context
Leadership involves goal attainment
Grint’s (2004) Problem areas of leadership research
The process problem: is leadership embodied in the individual qualities or
traits of the leader or is followership created by relational process which
engage both leaders and followers?
The position problem: does leadership arise from formal authority (the
leader ‘being in charge’) or from more informal influence processes (the
leader ‘being in front’)?
The philosophy problem: to what extent is leadership effected by leaders
and/or followers’ actions. How are followers’ actions shaped by the
situation or context? Or, is ‘leadership’ something which followers identify
as a causal force following events?
The purity problem: is leadership solely an individual phenomenon or can
groups demonstrate the characteristics of leadership?
Table 2-4 Common themes and problem areas
2.2.1 Summary of paradigmatic progression in leadership studies
The chronological progression of theory in leadership studies can be summarised
as follows; indicative dates for the emergence of each theoretical perspective are
given and all can be considered extant:
(i) (1900- ) the earlier ‘great man’ and trait theories which examined the
characteristics of ‘great’ leaders in an attempt to understand the personal
(physical and psychological) factors which explain successful leadership;
(ii) (1950s- ) behavioural theories which sought to identify significant aspects of
successful leaders’ behaviour (rather than inherent traits);
(iii) (1950s- ) the situational (or contingency) approaches (which examine the
ways in which business-environment factors affect leadership processes);
(iv) (1960s- ) the more ‘humanistic’ theories which incorporate
personal/motivational factors and tend towards perspectives which balance
organisational and individuals’ needs; and
32
(v) (1970s- ) the ‘new’ leadership approaches (e.g. transformational and
charismatic leadership) which emphasise the importance of leader charisma and
influence and followers’ concomitant willing co-operation in achieving
organisational goals.
As noted above, all of these theories and approaches can be regarded as extant.
Underlining the contested nature of debate surrounding the charting of the
development of leadership studies, while Vroom and Jago (2007: 18) have
described ‘most early research on leadership’ (referring to the trait theory
approaches) as ‘largely discredited’, Antonakis et al. (2004a: 7) suggest that trait
theory research has re-entered a period of relatively intense activity. Borgatta et
al. (1954: 756) describe how the ‘great man’ approach is underpinned by a belief
that organisational outcomes (such as performance or effectiveness) can be
significantly influenced by a “single person in the top position”. Regardless of the
current volume of scholarly effort going into the trait/great man approach, during
the course of this doctoral study, it has been observed that in conversations with
tourism and hospitality academics and practitioners (and indeed with non-
leadership experts in general) that the majority of individuals immediately relate
to the ‘great man’ paradigm when leadership is mentioned. That is, when
leadership is mentioned, many people tend to think of executive-level leadership
and a ‘single person in the top position’. Responses such as this can be
understood using the lens of the Implicit Leadership Theory (ILT), which examines
the roles of individuals preconceptions of leadership. ILTs are discussed later in
Section 3.3.3.
The empirical work in this thesis focuses, however, on leadership in organisations
(rather than leadership of organisations) - the remainder of the review of generic
leadership research provides an overview of the major leadership theories from
the great man, executive-level conceptualisations of leadership through to the
‘new leadership’ approaches that underpin more contemporary approaches to
leadership studies. more contemporary modes of more ‘distributed leadership’
(such as transformational) where leaders are to be found at all levels of an
organisation.
33
2.3 Major theories of leadership
This section of the review is structured according to the trait, style/behaviour and
situational categorisation described by Bryman (1992) in Table 2-2. Antonakis et
al.’s ‘major schools’ review is then drawn upon to examine the Relational,
Skeptics, Contextual, Information-Processing and New Leadership approaches to
studying leadership. The discussion of the New Leadership school, which
Antonakis et al. also refer to as the Neo-charismatic/ Transformational/Visionary
schools, provides a lead into the following section specifically discussing
transformational leadership approaches.
Transformational leadership is examined in particular depth owing to the
centrality of its Inspirational Motivation (IM) dimension to this research and
because it is found (in Chapter 3) to be the most frequently utilised theoretical
approach in hospitality leadership studies.
2.3.1 Trait theories
The premise of the great man theory is that certain people are born stronger,
more intelligent and more able to lead; leadership was thought to be a personal
quality (based on an individual’s traits) and independent of the environment in
which the leader was operating. A hereditary link was thought to exist, as
Kirkpatrick and Locke (1991: 48) explain, "great men were born, not made". Van
Seters and Field (1990) provide a distinction between the great man and trait
theories, describing how leadership studies moved from the ‘great man’ (focusing
on individuals’ personalities) to ‘trait’ approaches (that focus on traits rather than
personalities):
…attempts were made to remove the links with specific individuals and
simply to develop a number of general traits which, if adopted, would
enhance leadership potential and performance.
(Van Seters and Field 1990: 30)
During the early 20th Century, the development of psychological measures led to
the testing of the great man / trait theory of leadership (Vroom and Jago 2007:
18). In order to identify those traits associated with successful leadership, a
variety of aptitude and personality tests were applied, these included:
intelligence, extroversion, dominance, gender, masculinity, class and race.
34
In 1948 Stogdill published a review of findings in studies employing trait
approaches and concluded that “It becomes clear that an adequate analysis of
leadership involves not only a study of leaders, but also of situations” (1948: 64-
65). More recently Vroom and Jago (2007: 18) (who refer to these approaches as
‘heroic conceptions’ of leadership) wrote “...early research on leadership was
based on an assumption that has been largely discredited”
By the 1950s, leadership studies research began move away from the focus
primarily on leader traits (based on the premise that leadership is innate) towards
a perspective which posited that leadership could be observed in leaders’
behaviours. One aspect of this approach was the notion that, if specific
behaviours differentiated leaders from non-leaders, then it may be possible for
these behaviours to be taught.
2.3.2 Behavioural theories
The behaviour approach focuses on what managers and leaders actually do in the
workplace and how their behaviour relates to managerial effectiveness (Yukl
1989: 257). The behavioural paradigm was initially based on the premise that it
would be possible to observe (either in experimental settings or through surveys
of subordinates) universally effective leader behaviours (House and Aditya 1997:
421).
Enduring themes: Initiating Structure and Consideration
Underpinning much of the theory informing post 1960s leadership research has
been the distinction between task- and relations-oriented leadership. This
dichotomy was initially developed by researchers at the University of Michigan
(Katz et al. 1950; Katz et al. 1951) and subsequently strengthened by
researchers at the Ohio State University (Stogdill and Coons 1957). These
studies were based on behavioural-based approaches to leadership.
The Michigan research sought to identify relationships among a variety of leader /
work-group processes and performance measures. Three categories of leadership
behaviour were resolved: (i) task-orientated/production-centred behaviour
(supervisors emphasise technical- and performance-related employee attributes
35
and workplace dimensions); (ii) relations-oriented/employee-centred behaviour
(supervisors focus on the creation of employee motivation); and (iii) participative
leadership (Kahn and Katz 1960: 562).
The later Ohio State studies established two dimensions of leadership which
Stogdill and Coons (1957) referred to as: (i) initiating structure (similar to task-
orientated leadership); and (ii) consideration (similar to relations-oriented
leadership). Initiating structure is measured by the degree to which
leaders/managers focus on the task and job-related workplace requirements while
consideration is measured by leaders’/managers’ supportiveness towards, and
concern for, their subordinates.
Although the aims and findings of the Ohio and Michigan were different in a
number of ways, both sets of studies identified two basic categories of leaders’
behaviour:
(1) leader emphasis on task accomplishment, and
(2) leader concern for group maintenance, or a concern for the needs
of subordinates.
(Griffin et al. 1987: 201)
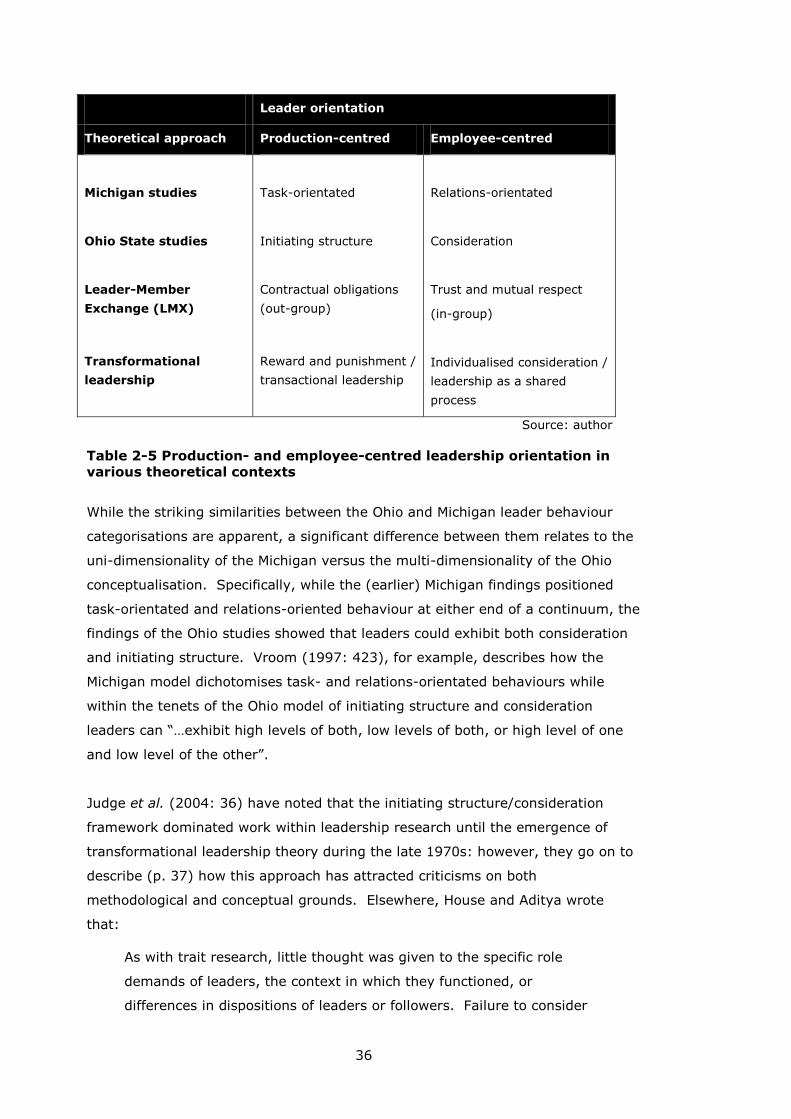
Both the Ohio State (initiating structure/consideration) and University of Michigan
(task-/relations-orientated) nomenclatures remain in use – as do the concepts.
Table 2-5 illustrates how this broad distinction in leader orientation is reflected
within the two main theoretical perspectives which have been consistently applied
in hospitality-leadership studies (Leader-Member Exchange (LMX) and
transformational leadership theories; both of these theoretical approaches will be
examined in greater detail below).
Yukl (2006: 52) writes that, since their introduction in the 1950s and early 1960s,
the Ohio State leadership questionnaire instruments (and derivatives thereof)
have been used many hundreds of times in a variety of contexts, however, the
findings have not been consistent. Some subordinates have reported greater
satisfaction with, and performed better with, a structuring leader while in other
studies the findings indicated a reversed relationship or no relationship at all. The
relationship between leader consideration and subordinate satisfaction has,
however, been consistently observed.
36
Leader orientation
Theoretical approach Production-centred Employee-centred
Michigan studies
Ohio State studies
Leader-Member
Exchange (LMX)
Transformational
leadership
Task-orientated
Initiating structure
Contractual obligations
(out-group)
Reward and punishment /
transactional leadership
Relations-orientated
Consideration
Trust and mutual respect
(in-group)
Individualised consideration /
leadership as a shared
process
Source: author
Table 2-5 Production- and employee-centred leadership orientation in
various theoretical contexts
While the striking similarities between the Ohio and Michigan leader behaviour
categorisations are apparent, a significant difference between them relates to the
uni-dimensionality of the Michigan versus the multi-dimensionality of the Ohio
conceptualisation. Specifically, while the (earlier) Michigan findings positioned
task-orientated and relations-oriented behaviour at either end of a continuum, the
findings of the Ohio studies showed that leaders could exhibit both consideration
and initiating structure. Vroom (1997: 423), for example, describes how the
Michigan model dichotomises task- and relations-orientated behaviours while
within the tenets of the Ohio model of initiating structure and consideration
leaders can “…exhibit high levels of both, low levels of both, or high level of one
and low level of the other”.
Judge et al. (2004: 36) have noted that the initiating structure/consideration
framework dominated work within leadership research until the emergence of
transformational leadership theory during the late 1970s: however, they go on to
describe (p. 37) how this approach has attracted criticisms on both
methodological and conceptual grounds. Elsewhere, House and Aditya wrote
that:
As with trait research, little thought was given to the specific role
demands of leaders, the context in which they functioned, or
differences in dispositions of leaders or followers. Failure to consider
37
these factors was subsequently thought to be the reason for the
researchers’ inability to identify leader behaviors that had universal or
near universal effectiveness.
(House and Aditya 1997: 421)
Elsewhere, Yukl (1989: 258-259) has noted the importance of situational
considerations: he describes how Misumi (1985) and Misumi and Peterson (1985)
in their studies of leadership behaviours in Japan found (using concepts of
leadership behaviour similar to the Ohio initiating structure and consideration)
that significant amounts of both task- and relationship-orientated behaviour are
required for leadership effectiveness. Yulk stressed (p. 259) the significance of
the fact that Misumi and Misumi and Peterson’s research emphasised the
contextual (situational) relevance of the observed behaviours.
Late behaviour period and humanistic theories
Located within in the Late Behaviour Period of Van Seters and Field’s (1990: 31-
32) ‘Leadership Eras’ framework is the work of McGregor (1960, 1966) and Blake
and Mouton (1964). Bass (1981: 33) described McGregor’s Theory X / Theory Y,
Blake and Mouton’s Managerial Grid work and Likert’s (1961, 1967) management
systems theory as belonging to the humanistic tradition of organisational studies.
These theories propose that by ‘humanising’ the work environment, individuals
can meet organisational and personal objectives at the same time. In this way, it
is hoped that individual and organisational needs can be balanced. Although
Anderson (1997: 273) believes that while this approach can contribute much to
our understanding of human needs in the workplace and can help valorise the
importance of “...personal meaning and purpose at work”, he also notes that such
approaches have been criticised for promoting human, rather than organisational,
values to the detriment of the ‘bottom line’.
Prominent examples of humanistic theories include Blake and Mouton (1964) who
found that leaders who scored well on both people (consideration) and production
(initiating structure) dimensions were most effective. Blake and Mouton also
developed one of the first leadership-style assessment instruments: their
Managerial Grid (1964) uses a 9 x 9 grid with degrees of initiating structure along
one axis and degrees of consideration marked along the other. The model
presents leaders who are rated 9 on both axes to be the most effective.
38
McGregor (1966) developed a continuum of leadership orientations from Theory X
– which describes ‘traditional’ leaders who believe individuals are self-serving,
rather than organisation-serving, and therefore require inducements to perform to
achieve organisational goals - to Theory Y, where leaders instead believe that by
facilitating an organisational environment in which individuals can realise their
own self-actualising and self-motivational natures they can contribute successfully
to the success of their organisation.
Humanisation and motivation in a hospitality context
McGregor’s X/Y Theory raises an important issue for this research, specifically
that catering service workers are likely to exhibit a range of work-orientations.
Indeed, many catering service employees may be significantly lacking in
organisational-orientation; as Stamper and Van Dyne describe:
…a study of hospitality executives conducted by Enz (2001) indicated
that the number-one problem in this [the hospitality] industry is the
care and motivation of human capital. …service-sector jobs are often
lowpay, high-stress vocations - two factors that typically work against
the quality of employee performance. In addition, the service industry
employs a large number of nontraditional employees, such as part-
time and temporary workers, who may not have strong organizational
loyalty or dedication to work, since such employees often tend to view
their jobs as short-term commitments.
(Stamper and Van Dyne 2003: 33)
Bennis (1961: 26-27) described this issue in a more general context, pointing out
the “…uneasy balance between individual and organizational needs” and
highlighting the mismatch between individuals’ aspirations and the goals of
‘supra-individual entities’. As a caveat, however, while Bennis’s sentiments are
certainly germane, they are based neither on empirical research nor research in
workplaces: Bennis’s footnotes (op. cit.: 150), however, indicate that he was
extrapolating from “…earlier writings [which] deal with the relationship of man to
the state, the church, and the nation, [while] our present-day concern appears to
be mainly with man and the organization”.
So, the issue of employees’ work-orientations appears in the leadership literature
with McGregor’s X/Y Theory and is related to the hospitality context by the work
39
of Enz (2001) and Stamper and Van Dyne (2003). This research will investigate
how work values – alongside motivational leadership – influence employee
attitudes and job performance.
Humanistic theories, then, propose that by ‘humanising’ the work environment,
individuals can meet organisational and personal objectives at the same time. In
this way, it is hoped that individual and organisational needs can be balanced.
Once again, a link can be identified between transformational leadership and the
humanising paradigm; specifically, in the form of transformational leadership’s
contribution to personal objectives through its provision of ‘work meaning’ for
individuals (further discussion of work meaning is provided below in Section 2.4.4
on transformational leadership). The relevance of this point centres, once again,
on concerns that hospitality service work (in comparison with less manual work)
may not hold a great deal of intrinsic ‘meaning’ (a feeling that the work itself is
important and the extent to which employees experience positive attitudinal
responses to their work).
In summary, drawing upon the humanistic leadership theories, this research will:
seek to measure the influence of hospitality service employees’ work
orientation (work values) on employee attitudes (and the subsequent influence
of attitudes on job performance);
assess the extent to which employees’ work values moderate the relationships
between leadership and a range of individual and organisational outcomes; and
assess the contribution of motivational leadership to employees’ work meaning.
Once again, a fuller discussion of work meaning is provided in the section on
transformational leadership (Section 2.4.4).
As with the earlier trait and behaviour theories, humanistic perspectives have
come to be regarded by some as generating useful key principles but suffering
from being relatively simplistic (see, for example Anderson 1997: 273). Such
criticisms perhaps reflects the emergence (during the 1960s, around the same
time as the humanistic theories were being developed) of more pluralistic
approaches that have subsequently become increasingly favoured over the
previous monothetic conceptualisations (based on either traits or behaviour).
The following section examines how the situational/contingency approaches
demonstrate plurality in attempting to account for attributes of specific work
40
environments as well as attributes of individual leaders. These approaches tend
to accommodate the recognition that different types of leadership can contribute
effectively in different contexts (situations) and that the choice of leadership
approach can depend (be contingent) on a wide range of variables.
2.3.3 Situational or contingency approaches
The situational or contingency approaches reflect the emergence of more
pluralistic approaches and explicitly account for a range of ‘situational’ or
‘environmental’ variables – sometimes referred to as ‘situational moderators’.
Put another way, it was recognised that leadership effectiveness may be
‘contingent’ on a variety of factors aside from leaders’ traits or behaviours.
Basing their argument on a selection of five journal papers published during the
1990s, Judge et al. (2004: 37) suggest that most researchers consider the
initiating structure/consideration dichotomy (the behavioural approach) of leader
behaviours to be outmoded and go on to write (also acknowledging Korman
(1966)) that:
Given the inconsistencies in the validity of Consideration and Structure
that were concluded to exist, researchers have argued that a way to
advance the literature is to investigate situational moderators
Judge et al. (2004: 37)
The LPC Contingency theory
Fiedler (1964, 1967, 1971) developed the LPC (Least preferred co-worker)
Contingency Model which is concerned with improving organisational performance
by focussing at the level of the leader. Fiedler identified leader-member relations,
task-structure and the leader’s position power as determinants of effectiveness of
leadership style. The least preferred co-worker measurement scale is used to
provide an indicator of leadership style and a central tenet of the model is that
individual leader’s styles are relatively fixed and it is the ‘situation’ or
organisational context which needs to adapted to effect improvements in
performance.
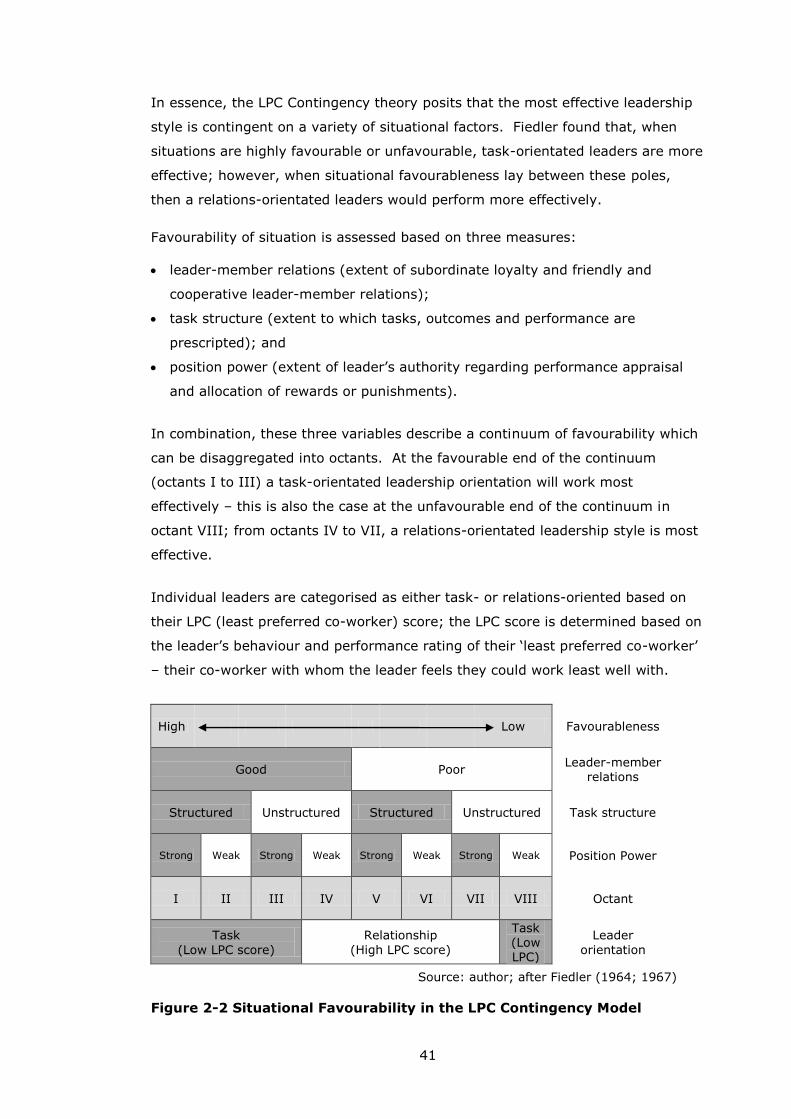
41
In essence, the LPC Contingency theory posits that the most effective leadership
style is contingent on a variety of situational factors. Fiedler found that, when
situations are highly favourable or unfavourable, task-orientated leaders are more
effective; however, when situational favourableness lay between these poles,
then a relations-orientated leaders would perform more effectively.
Favourability of situation is assessed based on three measures:
leader-member relations (extent of subordinate loyalty and friendly and
cooperative leader-member relations);
task structure (extent to which tasks, outcomes and performance are
prescripted); and
position power (extent of leader’s authority regarding performance appraisal
and allocation of rewards or punishments).
In combination, these three variables describe a continuum of favourability which
can be disaggregated into octants. At the favourable end of the continuum
(octants I to III) a task-orientated leadership orientation will work most
effectively – this is also the case at the unfavourable end of the continuum in
octant VIII; from octants IV to VII, a relations-orientated leadership style is most
effective.
Individual leaders are categorised as either task- or relations-oriented based on
their LPC (least preferred co-worker) score; the LPC score is determined based on
the leader’s behaviour and performance rating of their ‘least preferred co-worker’
– their co-worker with whom the leader feels they could work least well with.
High Low Favourableness
Good Poor Leader-member
relations
Structured Unstructured Structured Unstructured Task structure
Strong Weak Strong Weak Strong Weak Strong Weak Position Power
I II III IV V VI VII VIII Octant
Task
(Low LPC score)
Relationship
(High LPC score)
Task (Low LPC)
Leader
orientation
Source: author; after Fiedler (1964; 1967)
Figure 2-2 Situational Favourability in the LPC Contingency Model
42
Combining all these variables produces a matrix which describes 8 octants:
octants 1-3 are regarded as describing very favourable leadership situations,
octants 4-7 are regarded as intermediate leadership situations; and octant 8
describes a very unfavourable leadership situation. The LPC Contingency Model
octants are described in Figure 2-2.
Yukl has identified a number of shortcomings with the LPC Contingency theory
including (i) Ashour’s (1973) critique that the LPC theory does not explain the
causal connections between traits, behaviours, situations, and outcomes and (ii)
the lack of a ‘medium’ LPC category for leaders (the model is based on leaders
being measured as either high or low LPC) (Yukl 2010: 167-168).
Elsewhere, Yukl (1989: 266) discusses problems with the LPC scale’s reliance on
measuring a single leader trait and the lack of clarity regarding the phenomena
actually measured by the LPC scale. Yukl (2010: 168) concludes that the major
contribution of the LPC Contingency theory may lie in its stimulation of interest in
examining situational / contingency approaches to studying leadership.
The Path-Goal Model
Another significant contribution came in the form of House’s (1971) Path-Goal
Model that focused on how leaders could enhance organisational effectiveness by
clarifying the paths that would lead to followers realising the goals that had been
set for/by them. The theory is built upon Georgopoulos et al.’s (1957) path-goal
hypothesis and “...the broad class of expectancy theory of motivation” (House
1971: 322) (including Vroom’s (1964) expectancy-value theory of work
motivation). The path-goal model describes a situation where the leader: (i)
increases the rewards for individuals achieving organisational goals; (ii) clarifies
the paths to these goals; (iii) removes obstacles to the achievement of these
goals; and (iv) behaves in a way which increases subordinate satisfaction which in
turn results in improved subordinate performance. The situational component of
the path-goal theory relates to several specific situational moderators (job
autonomy and job scope) that can influence the effects of specific leader
behaviours.
43
Knight et al.succinctly describe the model thus:
...path-goal leadership theory suggests that an effective leader directs
followers’ behavior by changing followers’ perceptions of the
relationship between behaviors and outcomes.
Knight et al. (2004: 1164)
For this research, the path-goal model is interesting as it: (i) builds heavily on
Vroom’s Expectancy Theory of Motivation (see Section 4.1), thus linking
leadership and motivation studies; and (ii) the focus on leaders’ goal clarification
can be seen re-emerging in the transformational leadership literature (see Section
2.4).
Expectancy theories (also known as valence-instrumentality-expectancy or
expectancy-valence theories) of work motivation (Georgopoulos et al. 1957;
Vroom 1964) broadly describe an individual’s level of work motivation (the degree
of effort they make) as being a product of (i) the perceived probability that
expending a certain degree of extra effort1 will be sufficient to achieve a particular
outcome (expectancy) and (ii) the degree of desirability that the individual places
on that outcome (valence). Put another way, if an employee believes that a
desirable outcome can be achieved by expending extra effort, and they believe
that such an effort is likely to succeed, then they are likely to make that effort. In
path-goal leadership theory, it is the leader’s role to modify these perceptions and
beliefs (Yukl 2010: 169).
Yukl (2010: 170) illustrates how in House’s path-goal theory (House 1971; House
and Mitchell 1974) leader behaviour (the causal variable) and the characteristics
of task, environment and employees (the situational variables) act on
subordinates’ expectations and valences (the intervening variables) to influence
subordinate effort and satisfaction (the end-result or outcome variables). Four
types of leader behaviour are described in the path-goal model: supportive
(similar to consideration); directive (similar to initiating structure); participative
(employee consultation); and achievement-orientated (setting challenging targets
and seeking and encouraging excellent performances).
1 Productivity behaviour, the extra effort, can also be referred to as instrumentality, or
the path component in the path-goal approach (Georgopoulos et al. 1957: 345)
44
A number of propositions are made based on the theory – these propositions
describe the circumstances (based on combinations of situational and subordinate
characteristics) in which the different leader behaviours will produce the most
desirable results (see Yukl 2010: 170-171 for a summary).
Despite considerable empirical work base on the path-goal theory, meta analyses
have found that results are inconclusive (Wofford and Liska 1993; Podsakoff et al.
1995) and Yukl (2010: 172) identifies a number of methodological weaknesses
with the majority of empirical studies which may account for this shortcoming. In
addition, Yukl describes a number of conceptual deficiencies in the path-goal
theory. Foremost of these deficiencies is the path-goal theory’s reliance on the
underpinning expectancy theory of motivation which itself is described as
providing “...an overly complex and seemingly unrealistic description of human
behaviour” (Yukl 2010: 172).
While this research does not explicitly draw upon path-goal theory, the role of
leaders in clarifying goals and encouraging employee effort towards these goals is
embodied within the Inspirational Motivational (IM) dimension of transformational
leadership (TL) theory. This research does, however, draw upon the concept of
Inspirational Motivational leader behaviour and, in this way, linkages with the
path-goal theory and expectancy theories of motivation can be seen.
Other situational approaches
Vroom and Yetton’s (1973) Normative Decision Theory uses decision tree
modelling to identify, for particular situations, the decision procedures which will
contribute most positively to effective decisions. Vroom and Yetton’s decision
theory stresses the importance of the ‘right amount of participation’. Yukl (2006:
95) regards this model as “...probably the best supported of the contingency
theories” owing to its (i) focus on specific (rather than broad) aspects of
behaviour, (ii) meaningful intervening variables and (iii) its successful
identification of important situational moderator variables. On the other hand,
Yukl (2006: 94) notes several criticisms of the model such as the model’s partial
coverage of leadership issues and its lack of parsimony, simplification of decision-
making processes, and its (implicit) assumption that in practice managers possess
the skills required to implement the decision procedures described.
45
Hersey and Blanchard’s (1969, 1988) Situational Leadership Theory (SLT)
proposes that subordinate readiness (Blank et al. 1990) determines the optimal
degree of task and relations behaviour; accordingly, subordinate's task-related
confidence and skill are used to describe patterns of leaders’ task and relations
behaviour. Yukl (1989: 264) notes, however, that while this theory has been
popular within management workshops, its use amongst social science
researchers has been limited and only partial support of the theory has been
found by the few studies which have tested its validity. More recently, Cairns et
al. (1988) used SLT in an empirical study of senior executives within a large
company’s service and manufacturing operations and found “little support for
SLT” (p. 116).
By the mid-1970s, researchers had identified a number of variables moderating
the relationships between leader behaviour, predictors, and measures of
satisfaction and performance. Kerr et al. (1974) undertook a comprehensive
review of the Consideration-Initiating Structure literature review; this review
revealed a number of significant moderator variables. Kerr and Schriesheim
(1974) subsequently grouped these significant moderator variables as follows:
- Subordinate considerations. Expertise, experience, competence, job
knowledge, hierarchical level of occupied position, expectations
concerning leader behaviour, perceived organizational independence,
and various psychological aspects.
- Supervisor considerations. Similarity of attitudes and behaviour to
those of higher management, and upward influence.
- Task considerations. Degree of time urgency, amount of physical
danger, permissible error rate, presence of external stress, degree of
autonomy, importance and meaningfulness of work, and degree of
ambiguity.
(Kerr and Schriesheim 1974: 558)
Considering these situational moderator variables in the catering service context,
it can be seen how that several of these may be significant in influencing catering
service performance. Table 2-6 presents a selection of these potentially
significant variables.
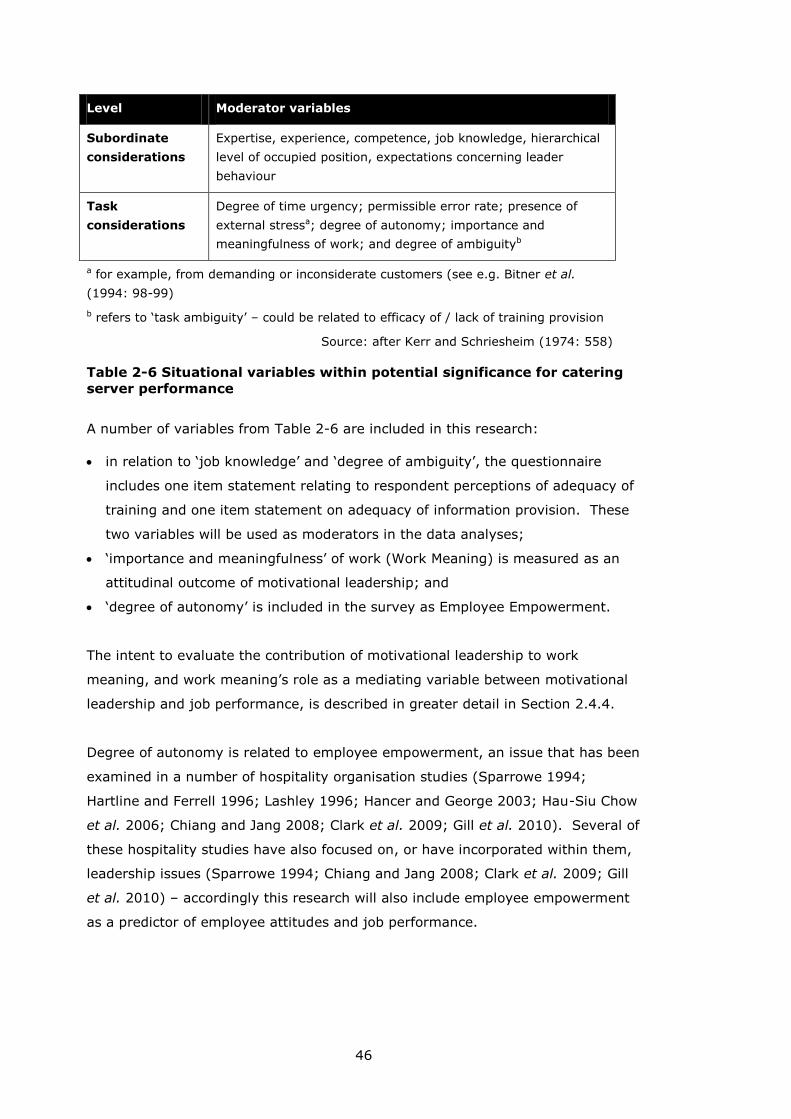
46
Level Moderator variables
Subordinate
considerations
Expertise, experience, competence, job knowledge, hierarchical
level of occupied position, expectations concerning leader
behaviour
Task
considerations
Degree of time urgency; permissible error rate; presence of
external stressa; degree of autonomy; importance and
meaningfulness of work; and degree of ambiguityb
a for example, from demanding or inconsiderate customers (see e.g. Bitner et al.
(1994: 98-99)
b refers to ‘task ambiguity’ – could be related to efficacy of / lack of training provision
Source: after Kerr and Schriesheim (1974: 558)
Table 2-6 Situational variables within potential significance for catering
server performance
A number of variables from Table 2-6 are included in this research:
in relation to ‘job knowledge’ and ‘degree of ambiguity’, the questionnaire
includes one item statement relating to respondent perceptions of adequacy of
training and one item statement on adequacy of information provision. These
two variables will be used as moderators in the data analyses;
‘importance and meaningfulness’ of work (Work Meaning) is measured as an
attitudinal outcome of motivational leadership; and
‘degree of autonomy’ is included in the survey as Employee Empowerment.
The intent to evaluate the contribution of motivational leadership to work
meaning, and work meaning’s role as a mediating variable between motivational
leadership and job performance, is described in greater detail in Section 2.4.4.
Degree of autonomy is related to employee empowerment, an issue that has been
examined in a number of hospitality organisation studies (Sparrowe 1994;
Hartline and Ferrell 1996; Lashley 1996; Hancer and George 2003; Hau-Siu Chow
et al. 2006; Chiang and Jang 2008; Clark et al. 2009; Gill et al. 2010). Several of
these hospitality studies have also focused on, or have incorporated within them,
leadership issues (Sparrowe 1994; Chiang and Jang 2008; Clark et al. 2009; Gill
et al. 2010) – accordingly this research will also include employee empowerment
as a predictor of employee attitudes and job performance.
47
2.3.4 Relational theory: Leader-Member Exchange (LMX)
Antonakis et al. (2004: 8) describe the relational school as emerging during the
mid 1970s and generating a substantial volume of research. This avenue of
leadership research grew out of Dansereau et al.’s (1975) vertical dyad linkage
(VDL) theory which has since developed into the popular and productive leader-
member exchange (LMX) theory (Graen and Uhl-Bien 1995; Uhl-Bien et al. 2000).
The basis of the vertical dyad linkage (VDL) approach is that leadership
relationship are based on discrete relationships between individual subordinates
and the supervisor/leader, rather than leader-group relationships, which are
measured using averaged rating scores from all team members. It was following
observations of significant variances between individual followers’ rating of the
same leaders that the VDL and LMX theories were developed (Schyns et al. 2008:
773).
LMX theory describes high-quality leader-member relationships as being based on
mutual respect and trust while low-quality leader-member relationships are
characterised more by ‘traditional’ contractually-based, supervisor-led fulfilment
of obligations. High-quality LMX relationships are theoretically beneficial for
subordinates who develop high-quality leader-member relationships as those
subordinates are accorded greater status, influence and benefits. This groups is
often referred to as the ‘in-group’, in contrast to the less-favoured ‘out-group’.
The in-group may also receive more interesting tasks, greater responsibility and a
more participative role in decision-making. Meanwhile, for leaders and
organisations, benefits accrue as, in exchange for the benefits outlined above,
subordinates are expected to work harder and with greater commitment and to
have increased of levels of loyalty to their leader (Yukl 2006: 118).
The specific measurements used to determine the quality of the LMX exchange
relationship have changed considerably since the earlier studies in the mid 1970s
(Graen and Uhl-Bien 1995: 236). Aside from the ‘core’ measurement units of
mutual trust, respect, affection, support and loyalty, other measures such as
negotiating latitude, incremental influence and shared values have also been used
(Yukl 2006: 118). In Yukl’s (1989) review, LMX theory is located, albeit
somewhat tentatively, within the situational group of leadership theories “...in the
sense that leaders treat subordinates differently depending on whether they are
part of the in-group or out-group” (Yukl 1989: 266).
48
2.3.5 Antonakis et al.’s Schools: Skeptics, Information-Processing,
Contextual and New Leadership
In describing the skeptics school of leadership research Antonakis et al. (2004:
8) are referring to the crisis of validity faced by leadership research during the
1970s and 1980s. This crisis of validity was embodied by three separate and
significant critiques of leadership studies: (i) that questionnaire ratings were
biased by the implicit leadership theories2 held by raters; (ii) that notions of
leadership were simply conceptual artefacts created by employees to explain and
provide a causal basis for organisational outcome; and (iii) that understanding
leadership was actually irrelevant to the performance of organisations. Rather
than folding in the face of these criticisms, however, Antonakis et al. suggest that
the field of studies has benefitted from and been strengthened by the challenges
mounted during this period. They cite: the adoption of more rigorous methods;
the differentiating of supervisor and top-level leadership; and the emergent
increased focus on followers’ perceptions (2003: 8) and describe how the
followers’ perceptions of work gave rise to the theoretically fruitful information-
processing perspective.
The information-processing perspective is described by Antonakis et al. as
focusing on:
understanding why a leader is legitimized by virtue of the fact that his
or her characteristics match the prototypical expectation that followers
have of the leader
(Antonakis et al. 2004a: 9)
The ‘prototypical expectation’ dimension of this definition is reminiscent of the
implicit leadership theories (ILTs) described in the skeptics section above; in fact,
Lowe and Gardner (2000: 476) directly link these two branches of research in
their classification of articles which appeared in the Leadership Quarterly journal
between 1990 and 1999. Lowe and Gardner go on to credit Lord et al. (1984) for
developing this area of research and also note that its popularity amongst
leadership scholars suggests that it is a theory of substantial significance.
2 Implicit leadership theories (ILTs) refer to people’s everyday ideas about traits
and behaviour of leaders (Schyns et al. 2008: 774)
49
While Antonakis et al. allocate the contextual school its own place in the
framework of major schools, they do not provide a discrete section of text for it.
It is mentioned rather briefly (2004a: 10) and is described as being strongly
related to the contingency movement. Contextual factors influencing (giving rise
to or inhibiting) leadership are cited as: leader hierarchical level, national culture,
leader-follower gender and organizational characteristics. The authors go on to
note that this perspective goes back several decades and began with
investigations of the role of national culture in leadership. In hospitality studies,
Testa (2002, 2004, 2007 and 2009) has examined the role of nationality and
culture in hospitality-context leadership. Testa found differences in employees’
perceptions of leader behaviour when comparing culturally congruent and
incongruent leader-member dyads. Sections 3.4 and 3.5 below reports Testa’s
work in greater detail.
Antonakis et al. (2004a: 9) describe the new leadership school as emerging
during the 1980s and being pioneered by the work of Bass (1985), Avolio et al.
(1991), Bass (1998), Bass and Avolio (1994) and Hater and Bass (1988).
Encapsulating the transformational, charismatic and visionary traditions of
leadership research, the new leadership paradigm built is based on the
recognition that a theory of leadership which transcends the transactionally-
orientated (reward and punishment based on contractual obligations) is required
to explain and understand follower behaviour that seemed to based on shared
vision and sense of purpose. The transformational dimension drew upon Burns’
(1978) work examining the political, social, and psychological dimensions of
leadership.
Elsewhere, Bryman (1992) suggests transformational and charismatic leadership
approaches emerged to address dynamic organisational environments. That is,
while the situational theories such as those of Fiedler (1967) and Vroom and
Yetton (1973) had identified a variety of significant situational moderator
variables, these situational moderators did not provide any insight into leadership
effectiveness when business and organisational environments were in states of
extended change.
Regardless of which particular forces drove the emergence of charismatic /
transformational leadership theories, these approaches have become among the
most popular in generic leadership research (Lowe and Gardner 2000; Gardner et
al. 2010). In hospitality leadership studies, as this research reports below,
50
transformational leadership has become the most frequently utilised theory.
Transformational leadership is also significant for this research, in particular, the
analysis draws upon the Inspirational Motivational dimension of Bass and Avolio’s
(2004a) transformational leadership theory. Owing to the significance of
transformational leadership for hospitality leadership studies and for this
research, the following section provides a detailed description of the emergence
and evolution of transformational leadership theory.
2.4 Transformational leadership
2.4.1 Origins and essence
The transformational/transactional leadership dichotomy was introduced by
Downton (1973) in his study of political leadership; for Downton, transformational
leadership was characterised by a mutually-motivational relationship between
leader and follower. Downton contrasted transformational and transactional
leadership in his study of the differences among revolutionary, rebellious, reform-
oriented and ‘ordinary’ leaders. This distinction between transformational and
transactional leadership orientations was later utilised by Burns in his seminal
(1978) work Leadership which examined the political, social, and psychological
dimensions of leadership and examined its moral dimensions using Kohlberg’s
(e.g. Kohlberg 1963) hierarchy of moral development. Barnett et al. (2001)
summarised Burns’ conceptualisation of transformational and transactional
leadership thus:
(1) Transactional (ordinary) leadership is based on an exchange
relationship in which follower compliance (effort, productivity, loyalty)
is exchanged for expected rewards; and
(2) Transformational (extraordinary) leaders raise followers'
consciousness levels about the importance and value of designated
outcomes and ways of achieving them.
(Barnett et al. 2001: 25)
51
2.4.2 Transformational leadership in organisations
Podsakoff et al. (1990: 108) have described how a number of organisational
studies researchers (e.g: House 1977; Bradford and Cohen 1984; Bass 1985;
Bennis and Nanus 1985; Tichy and Devanna 1986; Conger and Kanungo 1987;
Kouzes and Posner 1987) were engaged in developing theories of the ‘new’
transformational and charismatic leadership for the business organisation context
during the late 1970s and 1980s.
While the various research teams developed individual models, Podsakoff et al.
(1990: 114) were able to identify a number of behavioural components common
to these models. These leader behaviours are, specifically:
identifying and articulating a vision;
providing an appropriate role model;
fostering the acceptance of group goals;
having high performance expectations;
providing individualised support;
recognising accomplishments; and
providing intellectual stimulation.
Among these studies, the works of Bass (and later Bass and Avolio) have
emerged to provide the most well-known and most-used theoretical (the Full-
Range Model of Transformational leadership) and applied (the Multi-factor
Leadership Questionnaire) frameworks for transformational leadership. In
hospitality leadership studies, transformational leadership has been the most
frequently utilised of the range of leadership theories (see Table 3-1 below) and
every transformational leadership hospitality article has employed the
approaches of either Bass (1990a) or Avolio and Bass (2004a).
Accordingly, the following section describes the key points in the evolution of
Bass/Bass and Avolio’s model for transformational leadership in organisations.
These key points are: (i) the initial factor structure of the transformational
leadership model (Bass 1985); and (ii) the development of the Full-Range
Leadership Model and the Multi-factor Leadership Questionnaire (MLQ) (Bass and
Avolio 1990; 1995; 1997).
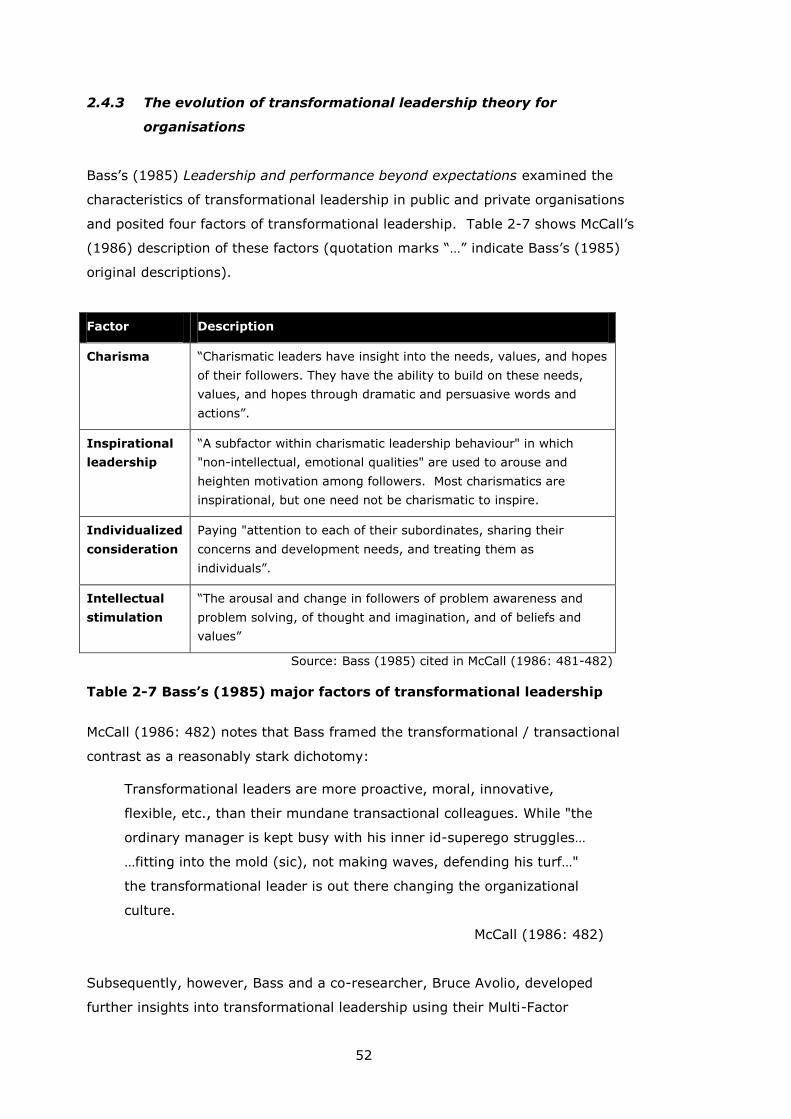
52
2.4.3 The evolution of transformational leadership theory for
organisations
Bass’s (1985) Leadership and performance beyond expectations examined the
characteristics of transformational leadership in public and private organisations
and posited four factors of transformational leadership. Table 2-7 shows McCall’s
(1986) description of these factors (quotation marks “…” indicate Bass’s (1985)
original descriptions).
Factor Description
Charisma “Charismatic leaders have insight into the needs, values, and hopes
of their followers. They have the ability to build on these needs,
values, and hopes through dramatic and persuasive words and
actions”.
Inspirational
leadership
“A subfactor within charismatic leadership behaviour" in which
"non-intellectual, emotional qualities" are used to arouse and
heighten motivation among followers. Most charismatics are
inspirational, but one need not be charismatic to inspire.
Individualized
consideration
Paying "attention to each of their subordinates, sharing their
concerns and development needs, and treating them as
individuals”.
Intellectual
stimulation
“The arousal and change in followers of problem awareness and
problem solving, of thought and imagination, and of beliefs and
values”
Source: Bass (1985) cited in McCall (1986: 481-482)
Table 2-7 Bass’s (1985) major factors of transformational leadership
McCall (1986: 482) notes that Bass framed the transformational / transactional
contrast as a reasonably stark dichotomy:
Transformational leaders are more proactive, moral, innovative,
flexible, etc., than their mundane transactional colleagues. While "the
ordinary manager is kept busy with his inner id-superego struggles…
…fitting into the mold (sic), not making waves, defending his turf…"
the transformational leader is out there changing the organizational
culture.
McCall (1986: 482)
Subsequently, however, Bass and a co-researcher, Bruce Avolio, developed
further insights into transformational leadership using their Multi-Factor
53
Leadership Questionnaire (MLQ) to measure the various factors of
transformational leadership (Bass and Avolio 1990). They found that
transformational and transactional leadership, rather than being mutually
exclusive (as Burns (1978) had argued, and Bass himself (1985) had implicitly
supported), were able to be simultaneously observed in individual leaders.
The Full-Range Model and the Multi-factor Leadership Questionnaire
This characteristic of leaders – to simultaneously demonstrate characteristics of
both transformational and transactional leadership, that is, demonstrate the full
range of leadership behaviours led to the naming of the Full Range Leadership
Model, or Full Range Model. Bass (1999) described this situation as follows:
The full range of leadership, as measured by the Multifactor Leadership
Questionnaire (MLQ), implies that every leader displays a frequency of
both the transactional and transformational factors, but each leader’s
profile involves more of one and less of the other. Those leaders who
are more satisfying to their followers and who are more effective as
leaders are more transformational and less transactional
(Bass 1999: 11)
Over time the full range model has been developed and modified and now
contains five factors representing transformational leadership styles, three
representing transactional leadership styles, the laissez-faire style, which is
equivalent to non-leadership, and a further three factors describing ‘leadership
outcomes’. These factors are described in Figure 2-3.
While transactional leadership can provide a model of effective leadership,
transformational leadership, through its stimulus of extra effort, can lead to what
Bass and Avolio (2004a: 21-24) call ‘performance beyond expectations’. This
augmentation effect of transformational leadership behaviour is illustrated in
Figure 2-4

54
Factor / components Description
Transformational leadership
Idealized influence attributed (IIA) Builds trust
Idealized influence behaviour (IIB) Acts with integrity
Inspirational motivation (IM) Inspires others
Intellectual stimulation (IS). Encourages innovative thinking
Individualized consideration (IC). Coaches people
Transactional leadership
Contingent reward (CR) Rewards achievements
Management-by-exception active
(MBE-A) Monitors mistakes
Management-by-exception passive
(MBE-P) Fights fires
Non-leadership
Laissez-faire (LF) Avoids involvement
Leadership outcomes
Effectiveness leader's efficacy in achieving organizational
outcomes
Satisfaction degrees to which subordinates are satisfied
with their leader's behaviour
Extra Effort degrees to which the leader can increase
subordinates' desire to succeed and
subordinates exert effort higher than their
normal rate
Source: (Bass and Avolio 2008; Limsila and Ogunlana 2008: 167)
Figure 2-3 The full range model of transformational leadership
Source: (Avolio and Bass 2004a: 21)
Figure 2-4 The augmentation model of transactional and transformational
leadership
55
Avolio and Bass go on to describe the augmentation process in greater detail:
Transformational leadership is associated with motivating associates to
do more than they originally thought possible. The original expectation
for performance is linked to an initial level of confidence or efficacy in
the associates' perceived ability and motivation. Thus, associates'
perceptions of self efficacy or confidence, as well as their
developmental potential, are enhanced through the transformational
leadership process.
(Avolio and Bass 2004a: 26-27)
Development of the theory: idealized influence and inspirational motivation
One of the more fundamental changes in Bass’s (1985) model of transformational
leadership has been with regard to the original charisma and inspirational
leadership factors. As described in Table 2-7, inspirational leadership was initially
considered by Bass (1985) to be a sub-set of charisma. Since then, charisma has
been substituted with the idealized influence factor and inspirational motivation
has been established as an independent factor (see sub-section immediately
below). Writing in 1999, Bass described the substitution of the charisma factor
with idealized influence:
Idealized influence encompasses influence over ideology, influence
over ideals, and influence over “bigger-than-life” issues. It was
conceived as a substitute for the term charismatic for several reasons.
First, charismatic had come to represent many meanings in the media
and the public mind: celebrated, flamboyant, exciting, rabble-rousing,
magnetic, and awe-inspiring. Second, charisma was too much
associated with dictatorship and pseudotransformational leaders such
as Huey Long, Benito Mussolini, and Adolf Hitler. Third, for researchers
such as House (1995) and Conger and Kanungo (1988a), charisma
was an all-inclusive term for transformational leadership taking in
inspiration, intellectual stimulation, and individualized consideration.
And so, for training and some research purposes, the term idealized
influence was substituted for the charismatic factor (Bass and Avolio
1990)
(Bass 1999: 19)
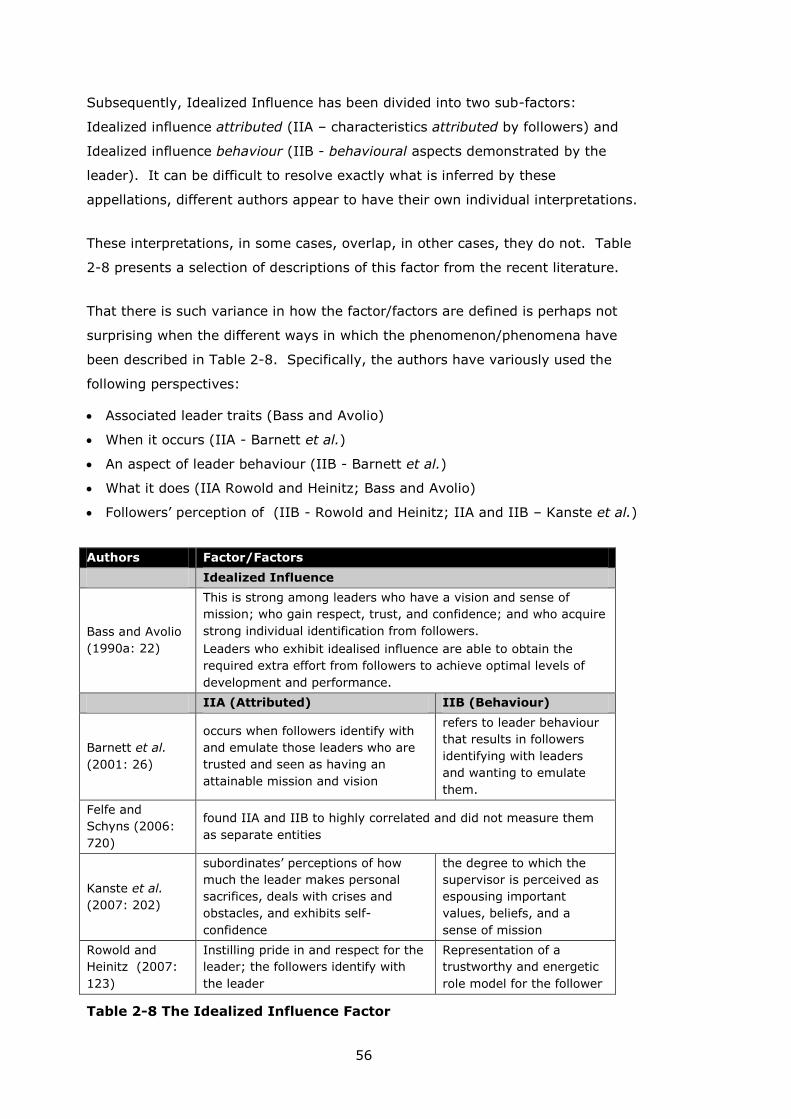
56
Subsequently, Idealized Influence has been divided into two sub-factors:
Idealized influence attributed (IIA – characteristics attributed by followers) and
Idealized influence behaviour (IIB - behavioural aspects demonstrated by the
leader). It can be difficult to resolve exactly what is inferred by these
appellations, different authors appear to have their own individual interpretations.
These interpretations, in some cases, overlap, in other cases, they do not. Table
2-8 presents a selection of descriptions of this factor from the recent literature.
That there is such variance in how the factor/factors are defined is perhaps not
surprising when the different ways in which the phenomenon/phenomena have
been described in Table 2-8. Specifically, the authors have variously used the
following perspectives:
Associated leader traits (Bass and Avolio)
When it occurs (IIA - Barnett et al.)
An aspect of leader behaviour (IIB - Barnett et al.)
What it does (IIA Rowold and Heinitz; Bass and Avolio)
Followers’ perception of (IIB - Rowold and Heinitz; IIA and IIB – Kanste et al.)
Authors Factor/Factors
Idealized Influence
Bass and Avolio
(1990a: 22)
This is strong among leaders who have a vision and sense of
mission; who gain respect, trust, and confidence; and who acquire
strong individual identification from followers.
Leaders who exhibit idealised influence are able to obtain the
required extra effort from followers to achieve optimal levels of
development and performance.
IIA (Attributed) IIB (Behaviour)
Barnett et al.
(2001: 26)
occurs when followers identify with
and emulate those leaders who are
trusted and seen as having an
attainable mission and vision
refers to leader behaviour
that results in followers
identifying with leaders
and wanting to emulate
them.
Felfe and
Schyns (2006:
720)
found IIA and IIB to highly correlated and did not measure them
as separate entities
Kanste et al.
(2007: 202)
subordinates’ perceptions of how
much the leader makes personal
sacrifices, deals with crises and
obstacles, and exhibits self-
confidence
the degree to which the
supervisor is perceived as
espousing important
values, beliefs, and a
sense of mission
Rowold and
Heinitz (2007:
123)
Instilling pride in and respect for the
leader; the followers identify with
the leader
Representation of a
trustworthy and energetic
role model for the follower
Table 2-8 The Idealized Influence Factor
57
While we should expect the two perspectives (IIA – characteristics attributed by
followers and IIB - behavioural aspects demonstrated by the leader) which
underpin the factor/factors to be present in the descriptions, there seem to be
more than the two perspectives present. That is, even if we group together:
(i) Associated leader traits (Bass and Avolio) and Followers’ perception of
(Rowold and Heinitz; Kanste et al.) as attributed characteristics; and
(ii) An aspect of leader behaviour (IIB - Barnett et al.) as a behavioural
characteristic.
When it occurs and What it does remain as incongruities in the framework.
Given such non-standardised approaches to describing these particular factors, it
is perhaps not surprising that the full range model has been criticised in the past
on the basis of:
its structural validity; that is, the uniqueness of the individual factors - e.g.
Muenjohn and Armstrong (2008: 5) and Tracey and Hinkin (1998); and
its measurement quality - e.g. Tepper and Percy (1994).
Inspirational motivation
Motivational leadership is a key focus of this research. Hospitality service jobs are
associated with low pay, long and antisocial hours, unstable and seasonal
employment and low job status (Wildes 2007: 5), as well as a lack of career
opportunities and poor levels of benefits (Olsen 1999: cited in Wildes 2007: 5).
Lee-Ross (1998a), Lundberg et al. al. (2009) and Simons (2003) have all drawn
attention to the critical requirement to address hospitality customer service
employees’ motivation in the light of such factors.
As noted above, following its initial status as a sub-set of charisma, inspirational
motivation (IM) has become established as a discrete factor in the Full-Range
Leadership Model. Avolio and Bass describe inspirational motivational leaders as
follows:
These leaders behave in ways that motivate those around them by
providing meaning and challenge to their followers' work. Individual
and team spirit is aroused. Enthusiasm and optimism are displayed.
58
The leader encourages followers to envision attractive future states,
which they can ultimately envision for themselves.
Talk optimistically about the future
Talk enthusiastically about what needs to be accomplished
Articulate a compelling vision of the future
Express confidence that goals will be achieved
Avolio and Bass (2004a: 96)
Examining this description we can see that the IM dimension is focused on
leaders’ articulation of organisational / departmental / team vision and goals, and
their provision of encouragement for employees who are working towards
achieving these goals. The IM dimension describes how transformational leaders
articulate a compelling vision and encourage employees to work towards
achieving this vision; transformational leaders are able to provide positive
challenge for employees who also experience greater levels of work meaning.
2.4.4 Transformational leadership outcomes
The Full-Range Model of transformational leadership (Figure 2-3) incorporates
three leadership outcomes factors, each of which is measured in the Multi-factor
Leadership Questionnaire (MLQ) (Bass and Avolio 1990; 1995; 1997):
(i) extra effort which describes employees’ raised levels of performance in seeking
to achieve organisational goals;
(ii) efficiency which reflects leaders’ and groups’ efficacy in achieving
organisational goals; and
(iii) satisfaction, which relates to employees’ satisfaction with the leader.
Extra effort and efficiency describe ways in which transformational leadership
promotes behaviour that in turn contributes to organisational or team goals
(organisational- and team-level outcomes), while employee satisfaction with their
leader describes an intra-group outcome of transformational leadership.
Although not measured in the MLQ, enhanced work meaning for followers is
discussed in Avolio and Bass’s (2004a) description of Inspirational Motivation
above and is referred to frequently in Bass and Riggio (2006: see e.g. 6, 28, 91
59
and 151). In a hospitality context, Hinkin and Tracey (1994) relate work meaning
to leaders’ provision of goal clarity and organisational objectives:
It is the responsibility of the transformational leader to provide for
followers a clear and accurate understanding of their task and purpose
(Atwater and Bass 1993). The vision provided by a transformational
leader inspires followers by giving their work meaning and making
them feel a part of the enterprise. It helps people understand what is
good or bad, important or unimportant in the organization, and serves
to enhance the speed and quality of decision making, increase
initiative, and broaden employee discretion (Bennis and Nanus 1985).
(Hinkin and Tracey 1994: 51)
Subsequently, Tracey and Hinkin (1996) cite Bass and Avolio (1994) to describe
how:
transformational leaders engender feelings of trust, loyalty, and
respect from followers by: (1) generating awareness and acceptance of
the purpose and mission of the organization, (2) inducing them to
transcend their own selfinterest (sic) for the sake of the organization,
and (3) activating their higher-order needs. The clear vision provided
by a transformational leader inspires followers by giving their work
meaning and making them feel a part of the enterprise.
(Tracey and Hinkin 1996: 166)
Throughout these texts, however, work meaning remains unclearly defined.
Enhanced work meaning may have particular resonance for employees in
hospitality service jobs, given that the range of factors described above (long
hours, low pay etc.) that militate against high levels of work motivation likely also
militate against high levels of work meaning. Accordingly, this research will
attempt to operationalise and measure work meaning as an attitudinal outcome
(an attitudinal measure of work motivation, see Ambrose and Kulik 1999:232) of
motivational leadership and assess work meaning as a partial mediator of
motivational leadership’s effect on employee job performance (a behaviour-based
measure of work motivation).
To measure job performance (a behavioural measure of work motivation, see
Ambrose and Kulik 1999:232), the research draws upon the extra effort concept
60
used in the Multi-Factor Leadership Questionnaire (MLQ) and adds a service
focused component to make the construct to the hospitality service context.
In a hospitality service context, the extra effort outcome of transformational
leadership can very clearly be viewed as an organisational- or team-level
outcome, since positive customer-focused effort – the moment of truth (Carlzon
(1987) - is a key goal for hospitality organisations. Work meaning, on the other
hand, can be conceptualised as an individual-level outcome. Accordingly, this
research seeks to evaluate the contribution of motivational leadership to both
organisational- and individual-level outcomes.
Measuring employee work meaning and evaluating its relationships with
motivational leadership and employee performance is intended to contribute not
only to social scientific understanding of leadership in hospitality contexts, but
also to our understanding of leadership outcomes in general since no studies
attempting to operationalise and measure work meaning in a leadership context
were identified during the course of this research.
In the following chapter, the research moves on to describe and critically evaluate
the applied (hospitality) leadership research literature. Identified articles are
classified according to their theoretical focus and the applied field is characterised
in order to create a state-of-the-art appraisal and to reveal knowledge gaps for
this and future research to address.
61
3 LEADERSHIP IN HOSPITALITY
A structured literature search identified a range of peer-reviewed relevant journal
articles and several book chapters. These have been categorised and critically
reviewed to establish the state of the art of leadership knowledge in the
hospitality context. Following a short description of the literature search strategy
and analytical framework for the review, the remainder of this section critically
evaluates the state of knowledge with regard to leadership studies in the
hospitality sectors.
The findings from the review are then considered alongside Pittaway et al.’s
(1998) recommendations for a framework for future leadership research in the
hospitality sectors.
3.1 Review strategy and analytical framework
During December 2009 a range of bibliographical databases relevant to hospitality
(CAB Abstracts, Emerald Insight, Hospitality & Tourism Complete), business and
management studies (Business Source® Complete) and social science /
psychology (Academic Search™ Complete) were interrogated using the search
term “leadership AND hospitality”. This revealed 21 titles and subsequent
analysis of these texts identified the existence of a further 35 relevant titles. The
search was updated during October 2010 resulting in the identification of a further
16 articles. In total 66 peer-reviewed journal articles, 5 book chapters and one
serial contribution (Tsai 2008) focusing on leadership issues in hospitality
contexts were found. A detailed analysis of each of these 72 contributions was
undertaken to identify their respective theoretical foci and findings. Appendix V
provides a categorised listing the 72 contributions and the bibliographical details
for each can be found in the list of references.
The first stage of analyses identified that, of the 72 identified studies, 46 (64 per
cent) had utilised a theoretical perspective from within the range of leadership
theories described in the leadership studies literature (see e.g. Yukl 1989; Van
Seters and Field 1990; Lowe and Gardner 2000; and Antonakis et al. 2004a for
reviews of leadership theories).
62
Of the 26 studies which did not utilise a ‘core’ leadership theory, seven (Nebel
1978; Mullins 1992; Wood 1994; Go et al. 1996; Gillet and Morda 2003; Olsen
2004; Lim 2008) were literature reviews (i.e. not primary research) and among
the 20 other papers:
two papers (Ley 1980; Arnaldo 1981) used a Mintzbergian framework (where
leadership is recognised as one of a range of managerial tasks);
three papers (Hill and Vanhoof 1997; Scheule and Sneed 2001; Naipaul and
Wang 2009) were curriculum focused – i.e. discussing leadership in the context
of college/university hospitality education programmes;
six papers (Testa 2001; Tesone et al. 2003; Testa 2007; Maier 2009; Minett et
al. 2009; O'Gorman and Gillespie 2010) studied leadership in hospitality
without the use of a core leadership theory; and
a further eight papers (Berger et al. 1989; Cichy et al. 1992a; Cichy et al.
1992b; Cichy et al. 1993; Bond 1998; Greger and Peterson 2000; Saunders
2004; Calloway and Awadzi 2008) were classified as ‘industry narratives’ – that
is, papers communicating leadership-relevant findings to industry audiences
rather than reporting primary research or examining conceptual issues in
leadership.
The remainder of this section focuses on the studies that utilised core leadership
theories. This is not to say that the non-core leadership theory studies have no
value; however, to generate (leadership) theory-relevant findings, it was deemed
appropriate to restrict the analysis accordingly. A categorised listing of the 26
non-core leadership theory literature is provided in Appendix V(b), and the
literature review contributions in Appendix V(c).
Table 3-1 describes the chronological appearance of the 46 identified studies
which utilised a core leadership theory. It shows that (i) the frequency of
leadership-focused hospitality studies has increased significantly since the first
one identified (White 1973). In percentile terms, transformational leadership has
been the most-utilised theoretical approach (26 per cent of all papers),
particularly in recent years where transformational leadership theory has
accounted for: (i) 40 per cent of all hospitality-leadership studies during the
1990s; and (ii) 26 per cent during 2000-2010 (amalgamating the 2000s and
2010- columns) period. Leader-Member Exchange (LMX) theory is the second
most utilised theoretical approach accounting for 17 per cent of all studies. The
behavioural approaches category accounts for 41 per cent of all hospitality–
leadership studies, however, unlike transformational leadership and LMX, this
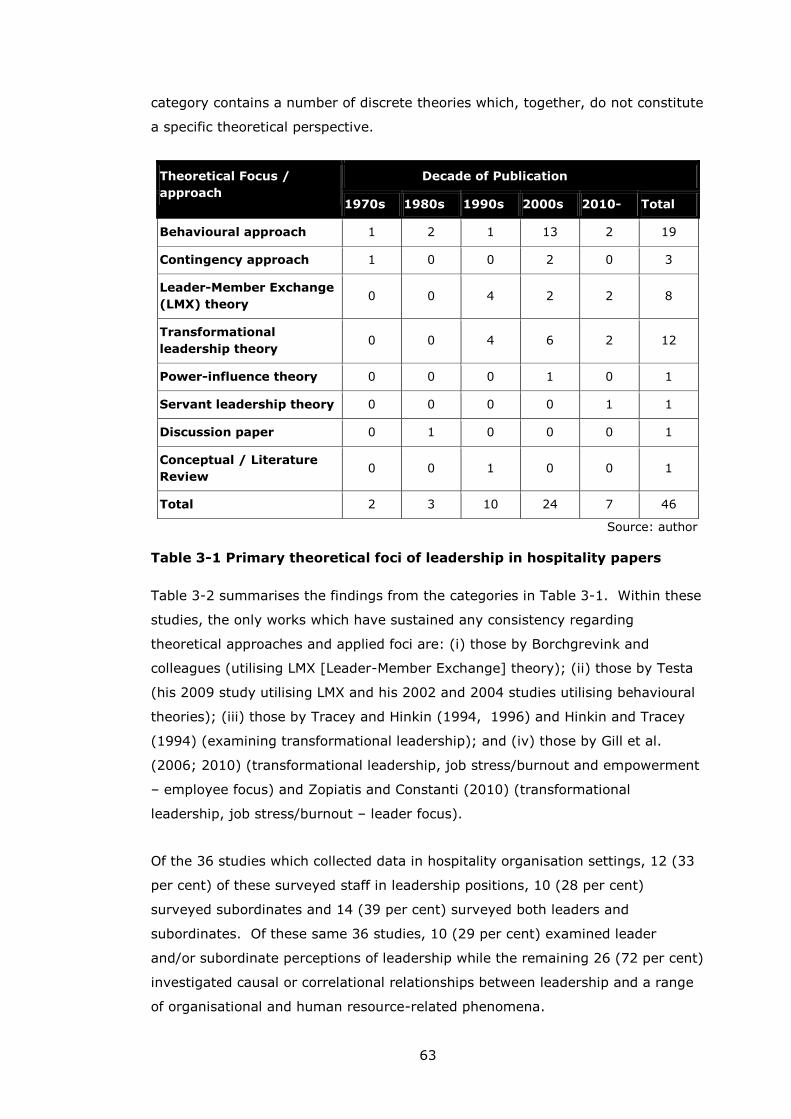
63
category contains a number of discrete theories which, together, do not constitute
a specific theoretical perspective.
Source: author
Table 3-1 Primary theoretical foci of leadership in hospitality papers
Table 3-2 summarises the findings from the categories in Table 3-1. Within these
studies, the only works which have sustained any consistency regarding
theoretical approaches and applied foci are: (i) those by Borchgrevink and
colleagues (utilising LMX [Leader-Member Exchange] theory); (ii) those by Testa
(his 2009 study utilising LMX and his 2002 and 2004 studies utilising behavioural
theories); (iii) those by Tracey and Hinkin (1994, 1996) and Hinkin and Tracey
(1994) (examining transformational leadership); and (iv) those by Gill et al.
(2006; 2010) (transformational leadership, job stress/burnout and empowerment
– employee focus) and Zopiatis and Constanti (2010) (transformational
leadership, job stress/burnout – leader focus).
Of the 36 studies which collected data in hospitality organisation settings, 12 (33
per cent) of these surveyed staff in leadership positions, 10 (28 per cent)
surveyed subordinates and 14 (39 per cent) surveyed both leaders and
subordinates. Of these same 36 studies, 10 (29 per cent) examined leader
and/or subordinate perceptions of leadership while the remaining 26 (72 per cent)
investigated causal or correlational relationships between leadership and a range
of organisational and human resource-related phenomena.
Theoretical Focus /
approach
Decade of Publication
1970s 1980s 1990s 2000s 2010- Total
Behavioural approach 1 2 1 13 2 19
Contingency approach 1 0 0 2 0 3
Leader-Member Exchange
(LMX) theory 0 0 4 2 2 8
Transformational
leadership theory 0 0 4 6 2 12
Power-influence theory 0 0 0 1 0 1
Servant leadership theory 0 0 0 0 1 1
Discussion paper 0 1 0 0 0 1
Conceptual / Literature
Review 0 0 1 0 0 1
Total 2 3 10 24 7 46
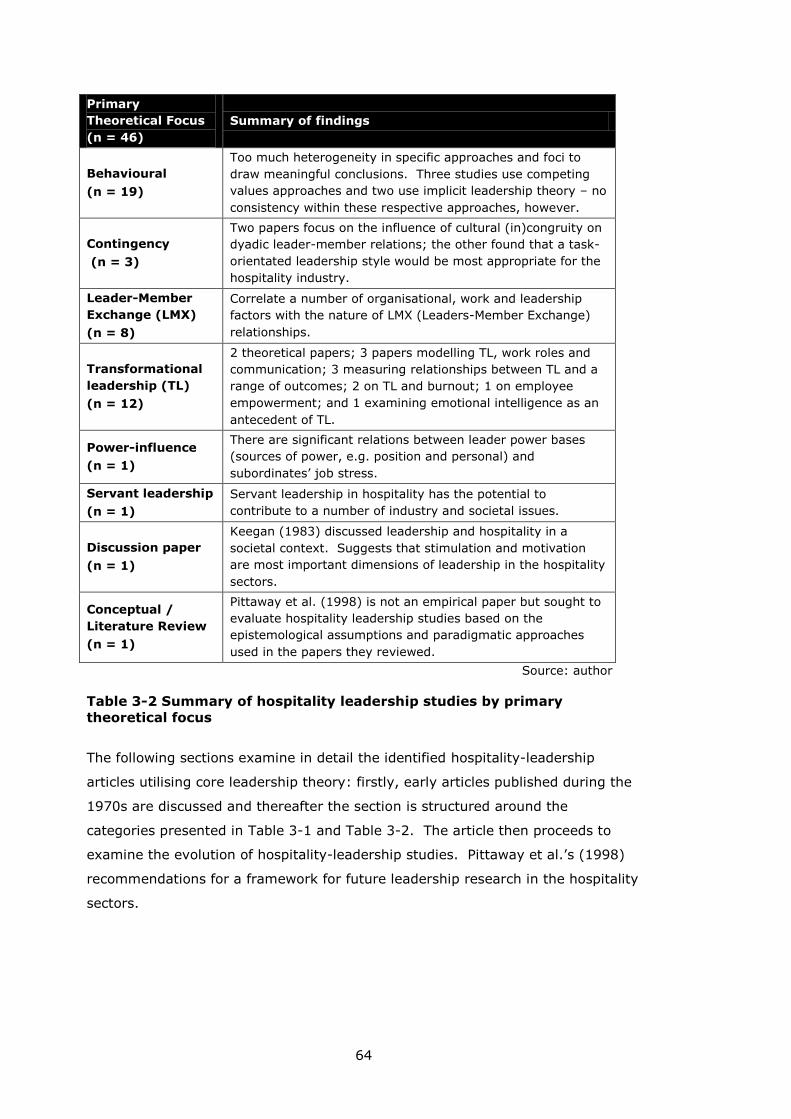
64
Primary
Theoretical Focus
(n = 46)
Summary of findings
Behavioural
(n = 19)
Too much heterogeneity in specific approaches and foci to
draw meaningful conclusions. Three studies use competing
values approaches and two use implicit leadership theory – no
consistency within these respective approaches, however.
Contingency
(n = 3)
Two papers focus on the influence of cultural (in)congruity on
dyadic leader-member relations; the other found that a task-
orientated leadership style would be most appropriate for the
hospitality industry.
Leader-Member
Exchange (LMX)
(n = 8)
Correlate a number of organisational, work and leadership
factors with the nature of LMX (Leaders-Member Exchange)
relationships.
Transformational
leadership (TL)
(n = 12)
2 theoretical papers; 3 papers modelling TL, work roles and
communication; 3 measuring relationships between TL and a
range of outcomes; 2 on TL and burnout; 1 on employee
empowerment; and 1 examining emotional intelligence as an
antecedent of TL.
Power-influence
(n = 1)
There are significant relations between leader power bases
(sources of power, e.g. position and personal) and
subordinates’ job stress.
Servant leadership
(n = 1)
Servant leadership in hospitality has the potential to
contribute to a number of industry and societal issues.
Discussion paper
(n = 1)
Keegan (1983) discussed leadership and hospitality in a
societal context. Suggests that stimulation and motivation
are most important dimensions of leadership in the hospitality
sectors.
Conceptual /
Literature Review
(n = 1)
Pittaway et al. (1998) is not an empirical paper but sought to
evaluate hospitality leadership studies based on the
epistemological assumptions and paradigmatic approaches
used in the papers they reviewed.
Source: author
Table 3-2 Summary of hospitality leadership studies by primary
theoretical focus
The following sections examine in detail the identified hospitality-leadership
articles utilising core leadership theory: firstly, early articles published during the
1970s are discussed and thereafter the section is structured around the
categories presented in Table 3-1 and Table 3-2. The article then proceeds to
examine the evolution of hospitality-leadership studies. Pittaway et al.’s (1998)
recommendations for a framework for future leadership research in the hospitality
sectors.
65
3.2 Early research (1970s)
Only two studies were undertaken during the 1970s and both focused on
identifying the most appropriate leadership style for the hospitality sector. White
(1973) found in his UK (behavioural-based) study that more consultative
leadership approaches would be welcomed in the hotel and catering sectors while
Nebel and Stearns (1977) found (using a contingency approach) that a task-
orientated leadership style would be the most effective in the North American
hospitality industry.
White (1973) compared preferred and perceived leadership style amongst
supervisory and managerial staff in UK hotels. Leadership styles were
categorised as A = Autocratic, B = Persuasive, C = Consultative and D =
Participatory. Although White’s article does not contain any specific references or
citations, his descriptions of the four styles is very similar to Likert’s (1961) ‘four
management systems’ where 1 = Exploitive Authoritative; 2 = Benevolent
Authoritative; 3 = Consultative; and 4 = Participative Group Management.
White found that the majority of respondents perceived their managers as using
an autocratic management style, and that a significant proportion of those
respondents said they would prefer a more consultative management style.
Accordingly, White recommended a change from the prevailing autocratic style,
towards a more consultative approach. He also noted, however, that there is no
panacea for leadership style and that to a great extent, what works best will
depend upon a variety of situational factors including size and nature of hotel, age
of staff and length of service of staff.
The second of the 1970s studies, Nebel and Stearns (1977) employed Fiedler's
(1967) LPC (Least Preferred Co-worker) Contingency Theory in their survey of
first line supervisors in hospitality businesses in the New Orleans (USA) area. A
significant amount of the analyses reported by Nebel and Stearns focus on
differences relating the race of the respondents – although they do not report why
this particular demographic characteristic was chosen as an independent variable.
Significant differences were found relating to the educational levels achieved by
white and black respondents and also with regard to levels of psychological
independence (the desire to be more or less supervised while at work). Relating
their findings to Fiedler’s LPC model, Nebel and Stearns suggest that a task-
66
orientated management style would be the most effective in the North American
hospitality industry.
Although differing theoretical approaches mean that the White (1973) and Nebel
and Stearns (1977) studies are not directly comparable, the somewhat
contradictory findings (White’s consultative leadership can be broadly equated
with relations-orientated, contrasting with Nebel and Stearn’s task-orientated
conclusion) can be read as an early indication of the complexity which is inherent
in organisational leadership research.
A third leadership-related article from this period was Nebel’s (1978) literature
review of (generic) organisational theory linking leadership, motivation and
employee performance. Because this article does not provide a detailed analysis
linking these concepts with hospitality contexts, it is not included here as one of
the ‘core hospitality-leadership’ research articles . Nevertheless, this paper
deserves mention as an early and significant theoretical contribution to this area
of hospitality studies. Also worthy of note – and reflecting the general paucity of
motivation-focused hospitality-leadership research - is that following its
publication in 1978, none of the identified journal articles reporting primary
research on leadership-related hospitality issues have cited that paper.
3.3 Behavioural theory work
In total, nineteen (41 per cent) of the hospitality-leadership studies utilising
theory drawn from generic leadership studies used theories which can be
classified as behavioural.
Although grouped together under the banner of behaviour theory work, thirteen
of the nineteen behavioural-focused articles employ a variety of discrete theories
and address a diverse range of research themes and questions. Table 3-3
summarises the context, aims and findings for each of these thirteen articles.
Five of these thirteen articles broadly address the initiating structure /
consideration dichotomy (from the Michigan and Ohio State work described above
in Section 2.3.2) and these studies are examined below in Section 3.3.1.
Of the remaining six articles, four utilise leadership competencies approaches and
two utilise the implicit leadership theory approach – these articles are described in
Sections 3.3.2 and 3.3.3.
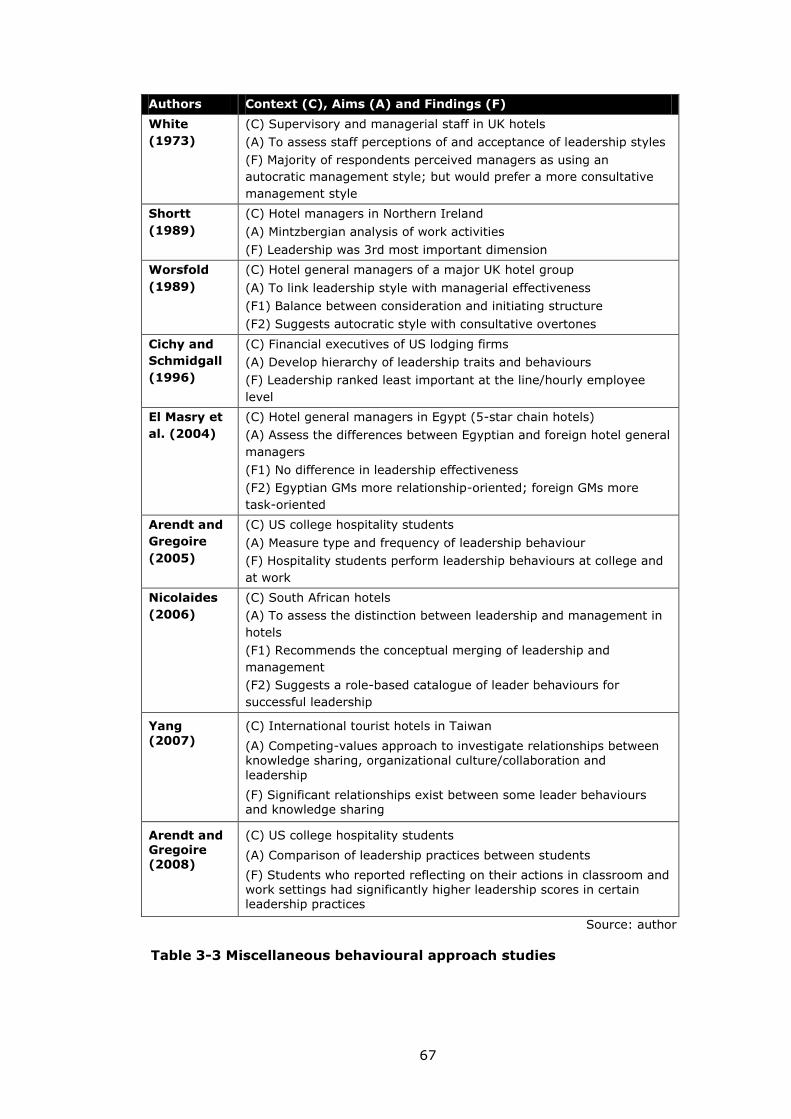
67
Authors Context (C), Aims (A) and Findings (F)
White
(1973)
(C) Supervisory and managerial staff in UK hotels
(A) To assess staff perceptions of and acceptance of leadership styles
(F) Majority of respondents perceived managers as using an
autocratic management style; but would prefer a more consultative
management style
Shortt
(1989)
(C) Hotel managers in Northern Ireland
(A) Mintzbergian analysis of work activities
(F) Leadership was 3rd most important dimension
Worsfold
(1989)
(C) Hotel general managers of a major UK hotel group
(A) To link leadership style with managerial effectiveness
(F1) Balance between consideration and initiating structure
(F2) Suggests autocratic style with consultative overtones
Cichy and
Schmidgall
(1996)
(C) Financial executives of US lodging firms
(A) Develop hierarchy of leadership traits and behaviours
(F) Leadership ranked least important at the line/hourly employee
level
El Masry et
al. (2004)
(C) Hotel general managers in Egypt (5-star chain hotels)
(A) Assess the differences between Egyptian and foreign hotel general
managers
(F1) No difference in leadership effectiveness
(F2) Egyptian GMs more relationship-oriented; foreign GMs more
task-oriented
Arendt and
Gregoire
(2005)
(C) US college hospitality students
(A) Measure type and frequency of leadership behaviour
(F) Hospitality students perform leadership behaviours at college and
at work
Nicolaides
(2006)
(C) South African hotels
(A) To assess the distinction between leadership and management in
hotels
(F1) Recommends the conceptual merging of leadership and
management
(F2) Suggests a role-based catalogue of leader behaviours for
successful leadership
Yang
(2007)
(C) International tourist hotels in Taiwan
(A) Competing-values approach to investigate relationships between
knowledge sharing, organizational culture/collaboration and
leadership
(F) Significant relationships exist between some leader behaviours and knowledge sharing
Arendt and Gregoire (2008)
(C) US college hospitality students
(A) Comparison of leadership practices between students
(F) Students who reported reflecting on their actions in classroom and work settings had significantly higher leadership scores in certain leadership practices
Source: author
Table 3-3 Miscellaneous behavioural approach studies
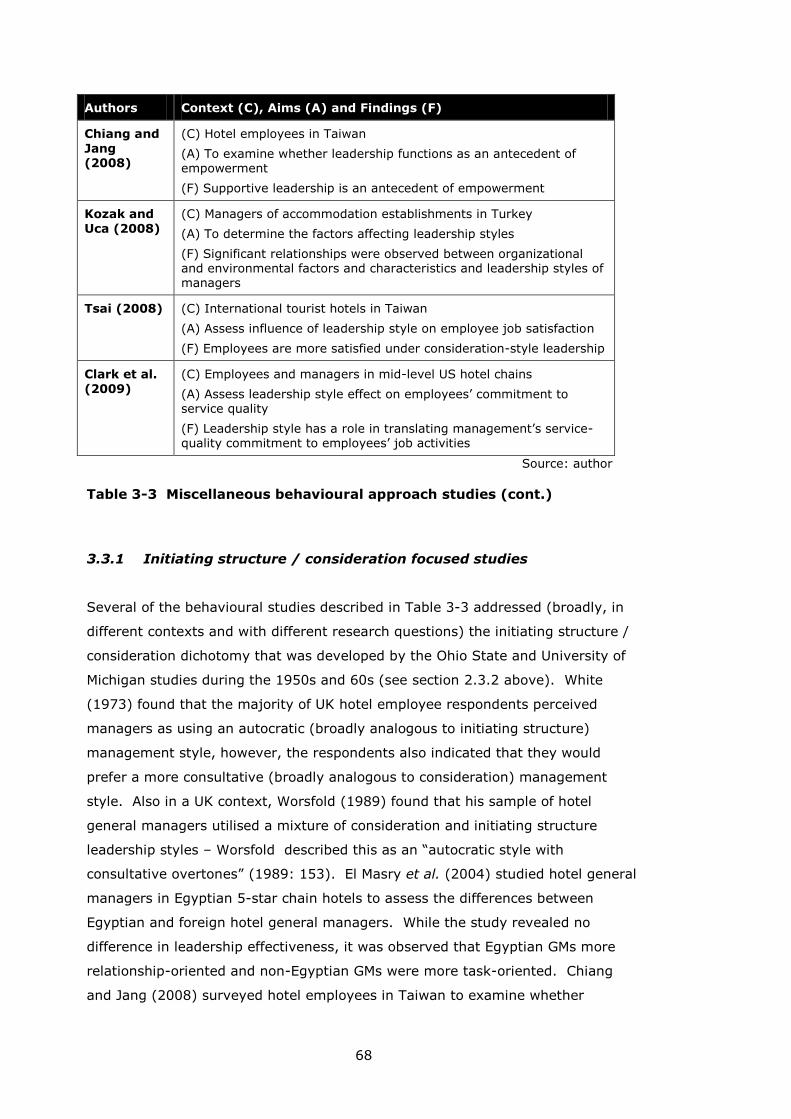
68
Authors Context (C), Aims (A) and Findings (F)
Chiang and
Jang (2008)
(C) Hotel employees in Taiwan
(A) To examine whether leadership functions as an antecedent of empowerment
(F) Supportive leadership is an antecedent of empowerment
Kozak and
Uca (2008)
(C) Managers of accommodation establishments in Turkey
(A) To determine the factors affecting leadership styles
(F) Significant relationships were observed between organizational and environmental factors and characteristics and leadership styles of managers
Tsai (2008) (C) International tourist hotels in Taiwan
(A) Assess influence of leadership style on employee job satisfaction
(F) Employees are more satisfied under consideration-style leadership
Clark et al.
(2009)
(C) Employees and managers in mid-level US hotel chains
(A) Assess leadership style effect on employees’ commitment to service quality
(F) Leadership style has a role in translating management’s service-quality commitment to employees’ job activities
Source: author
Table 3-3 Miscellaneous behavioural approach studies (cont.)
3.3.1 Initiating structure / consideration focused studies
Several of the behavioural studies described in Table 3-3 addressed (broadly, in
different contexts and with different research questions) the initiating structure /
consideration dichotomy that was developed by the Ohio State and University of
Michigan studies during the 1950s and 60s (see section 2.3.2 above). White
(1973) found that the majority of UK hotel employee respondents perceived
managers as using an autocratic (broadly analogous to initiating structure)
management style, however, the respondents also indicated that they would
prefer a more consultative (broadly analogous to consideration) management
style. Also in a UK context, Worsfold (1989) found that his sample of hotel
general managers utilised a mixture of consideration and initiating structure
leadership styles – Worsfold described this as an “autocratic style with
consultative overtones” (1989: 153). El Masry et al. (2004) studied hotel general
managers in Egyptian 5-star chain hotels to assess the differences between
Egyptian and foreign hotel general managers. While the study revealed no
difference in leadership effectiveness, it was observed that Egyptian GMs more
relationship-oriented and non-Egyptian GMs were more task-oriented. Chiang
and Jang (2008) surveyed hotel employees in Taiwan to examine whether
69
leadership functions as an antecedent of empowerment. Supportive leadership
(which contains the essence of consideration/relations-oriented leadership) was
found to be an antecedent of empowerment. Finally, Tsai (2008), also working in
Taiwan found that employees in international tourist hotels were more satisfied
under consideration-style leadership.
It is not possible to characterise the international hotel based on the findings of
these five studies – what we can say is that: (i) all of these studies found both
initiating structure and consideration styles in use; and (ii) three of the five
studies (White 1973; Chiang and Jang 2008; Tsai 2008) provide evidence to
support the use of initiating structure (relations-oriented) leadership style.
In contrast to the studies reported in Table 3-3, it was possible to classify the
remaining 6 behavioural theory studies into two sub-sets: leadership-
competencies (4 studies) and implicit leadership theories (2 studies). These
studies are examined in detail in the following sections.
3.3.2 Leadership competencies approaches
Leadership competencies approaches were developed from organisational
behaviour and human resource work in the 1970s which focused on individuals’
knowledge, skills and abilities (KSAs) and were intended to help identify
individuals who could effectively perform specific leadership functions (Hollenbeck
et al. 2006: 401).
Based on a literature review and consultation with (globally-based) senior-level
hospitality managers, Chung-Herrera et al. (2003) developed a competencies-
based model for leadership in the hospitality industry. Their model contained
eight domains: communication, critical thinking, implementation, industry
knowledge, interpersonal skills, leadership, self-management, and strategic
positioning. Each domain contained up to six dimensions; leadership, for
example, consisted of: developing others, embracing change, fortitude, fostering
motivation, leadership versatility, and teamwork orientation. The empirical stage
of their study allowed these domains and dimensions to be rated by a second
sample of globally-based senior-level hospitality managers.
The competencies ratings indicated that leadership of employees is regarded as a
less-important skills domain while the most-important competencies for
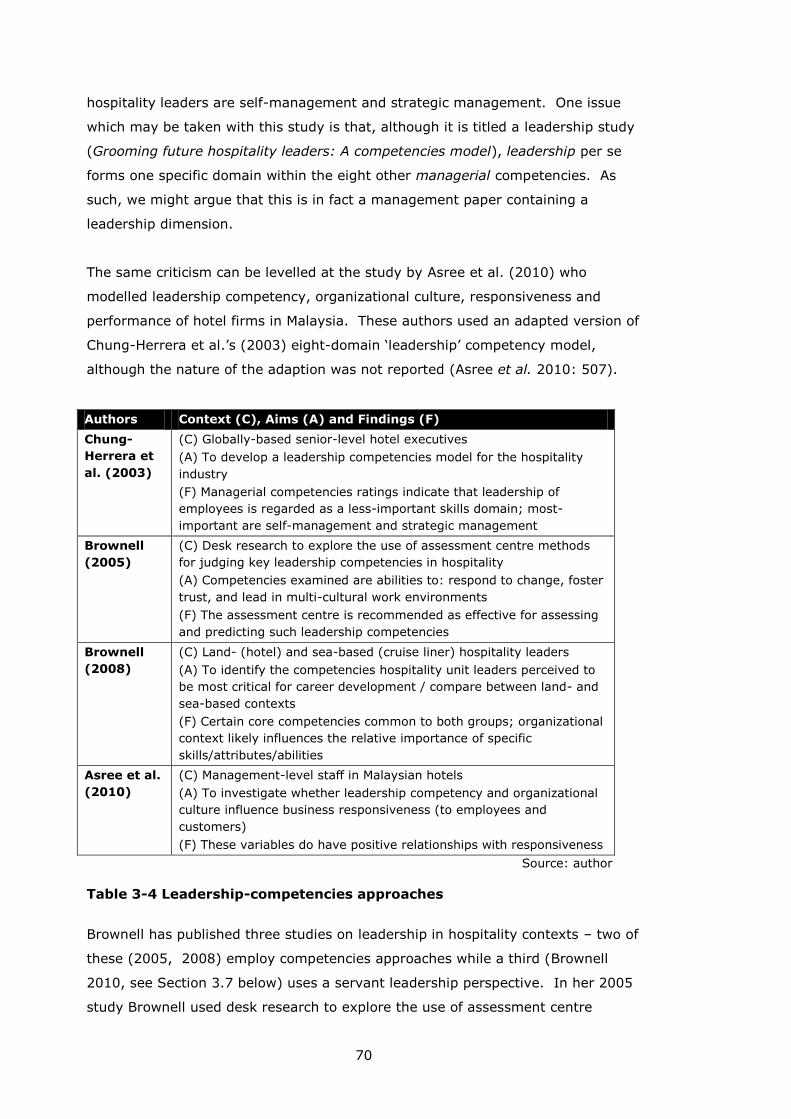
70
hospitality leaders are self-management and strategic management. One issue
which may be taken with this study is that, although it is titled a leadership study
(Grooming future hospitality leaders: A competencies model), leadership per se
forms one specific domain within the eight other managerial competencies. As
such, we might argue that this is in fact a management paper containing a
leadership dimension.
The same criticism can be levelled at the study by Asree et al. (2010) who
modelled leadership competency, organizational culture, responsiveness and
performance of hotel firms in Malaysia. These authors used an adapted version of
Chung-Herrera et al.’s (2003) eight-domain ‘leadership’ competency model,
although the nature of the adaption was not reported (Asree et al. 2010: 507).
Authors Context (C), Aims (A) and Findings (F)
Chung-
Herrera et
al. (2003)
(C) Globally-based senior-level hotel executives
(A) To develop a leadership competencies model for the hospitality
industry
(F) Managerial competencies ratings indicate that leadership of
employees is regarded as a less-important skills domain; most-
important are self-management and strategic management
Brownell
(2005)
(C) Desk research to explore the use of assessment centre methods
for judging key leadership competencies in hospitality
(A) Competencies examined are abilities to: respond to change, foster
trust, and lead in multi-cultural work environments
(F) The assessment centre is recommended as effective for assessing
and predicting such leadership competencies
Brownell
(2008)
(C) Land- (hotel) and sea-based (cruise liner) hospitality leaders
(A) To identify the competencies hospitality unit leaders perceived to
be most critical for career development / compare between land- and
sea-based contexts
(F) Certain core competencies common to both groups; organizational
context likely influences the relative importance of specific
skills/attributes/abilities
Asree et al.
(2010)
(C) Management-level staff in Malaysian hotels
(A) To investigate whether leadership competency and organizational
culture influence business responsiveness (to employees and
customers)
(F) These variables do have positive relationships with responsiveness
Source: author
Table 3-4 Leadership-competencies approaches
Brownell has published three studies on leadership in hospitality contexts – two of
these (2005, 2008) employ competencies approaches while a third (Brownell
2010, see Section 3.7 below) uses a servant leadership perspective. In her 2005
study Brownell used desk research to explore the use of assessment centre
71
methods for judging key leadership competencies in hospitality. The assessment
centre method is described by Brownell as “…a method of evaluating individuals’
knowledge and skills using a series of exercises or activities designed to elicit a
range of responses. Starting with a thorough job analysis, key competencies are
identified” (2005: 9). The specific competencies examined are leaders’ abilities
to: respond to change, foster trust, and lead in multi-cultural work environments.
The study concludes by recommending assessment centre methods as being
effective for assessing and predicting such leadership competencies.
The second leadership-competencies study by Brownell (2008) incorporates a
situational perspective by comparing perceived leadership competencies for land-
(hotel) and sea-based (cruise liner) hospitality leaders. The study found that
while senior hotel and ship practitioners share a need for certain core
competencies (positive attitude and effective listening), organizational context
likely influences the relative importance of specific skills and attributes/ abilities
required for effective leadership in each industry segment. In comparison with
Chung-Herrera et al.’s (2003) study, the range of leadership competencies
employed by Brownell more typically reflects the type of leadership behaviours
commonly reported in the generic leadership literature, although a number of
these competencies (such as conducting meetings, memos and letters, using
technology and preparing reports) can be considered more general-managerial
than leadership-specific.
3.3.3 Implicit leadership theory (ILT) approaches
The second sub-set within the behavioural thread of studies is represented by two
studies utilising implicit leadership theory. Implicit Leadership Theories (ILTs)
refer to people’s everyday ideas about traits and behaviour of leaders (Schyns et
al. 2008: 774): people have preconceived ideas – implicit theories - about
leadership and these preconceived ideas have been shown to display remarkable
similarity to constructs of leadership characteristics obtained through practical
leadership assessment studies (Eden and Leviatan 1975).
Marnburg (2007) studied the implicit leadership conceptions of 148 newly-
inducted hospitality management programme students in Norway with the aim of
developing insights into how students’ ILTs might inform the nature of hospitality
curricula with leadership content. The study found that there were significant
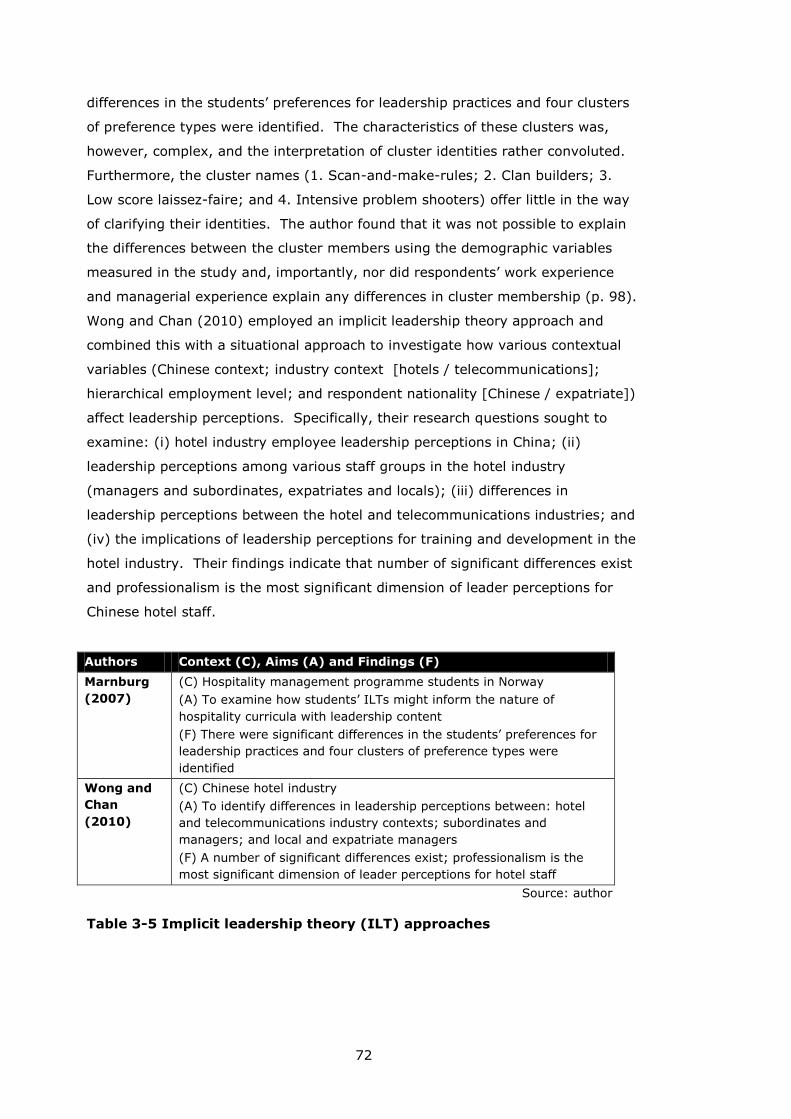
72
differences in the students’ preferences for leadership practices and four clusters
of preference types were identified. The characteristics of these clusters was,
however, complex, and the interpretation of cluster identities rather convoluted.
Furthermore, the cluster names (1. Scan-and-make-rules; 2. Clan builders; 3.
Low score laissez-faire; and 4. Intensive problem shooters) offer little in the way
of clarifying their identities. The author found that it was not possible to explain
the differences between the cluster members using the demographic variables
measured in the study and, importantly, nor did respondents’ work experience
and managerial experience explain any differences in cluster membership (p. 98).
Wong and Chan (2010) employed an implicit leadership theory approach and
combined this with a situational approach to investigate how various contextual
variables (Chinese context; industry context [hotels / telecommunications];
hierarchical employment level; and respondent nationality [Chinese / expatriate])
affect leadership perceptions. Specifically, their research questions sought to
examine: (i) hotel industry employee leadership perceptions in China; (ii)
leadership perceptions among various staff groups in the hotel industry
(managers and subordinates, expatriates and locals); (iii) differences in
leadership perceptions between the hotel and telecommunications industries; and
(iv) the implications of leadership perceptions for training and development in the
hotel industry. Their findings indicate that number of significant differences exist
and professionalism is the most significant dimension of leader perceptions for
Chinese hotel staff.
Authors Context (C), Aims (A) and Findings (F)
Marnburg
(2007)
(C) Hospitality management programme students in Norway
(A) To examine how students’ ILTs might inform the nature of
hospitality curricula with leadership content
(F) There were significant differences in the students’ preferences for
leadership practices and four clusters of preference types were
identified
Wong and
Chan
(2010)
(C) Chinese hotel industry
(A) To identify differences in leadership perceptions between: hotel
and telecommunications industry contexts; subordinates and
managers; and local and expatriate managers
(F) A number of significant differences exist; professionalism is the
most significant dimension of leader perceptions for hotel staff
Source: author
Table 3-5 Implicit leadership theory (ILT) approaches
73
3.4 Contingency theory work
Three contingency theory studies were identified: Nebel and Stearns’ 1977 article
has been discussed above (Section 3.2) and the remaining two are those of Testa
(2002, 2004).
The 2002 and 2004 studies undertaken by Mark Testa are among the few
hospitality-leadership studies to demonstrate consistency of aims and approach.
The studies focused specifically on the influence of nationality on observed
differences in subordinates’ perceptions of leadership relationships
(consideration/initiating structure, trust and satisfaction). Nationality was chosen
as an important independent variable owing to a “…vital need to understand how
national culture impacts important organizational variables” in general and also in
a specific leadership context (Testa 2002: 425-426). For Testa’s studies, the
setting is US-based cruise liners where a wide range of nationalities are
represented in both supervisory and subordinate positions.
Testa (2002) found that subordinates in congruent (same nationality) dyads
(individual leader-member relationships) evaluated their leaders significantly
higher on consideration behaviours, and reported higher levels of trust and
satisfaction with their leader, than those in the incongruent group.
Testa’s 2004 paper sought to further explore these differences. In particular the
2004 paper reported on research which aimed to evaluate differences (between,
once again, congruent and incongruent dyads) of subordinates’ perceptions of
their leader’s behaviour, level of goal clarity and overall satisfaction regarding
their work organization. The findings were that: (i) congruent dyad respondents
reported that their supervisors exhibited higher levels of consideration
behaviours; (ii) no significant difference in goal clarity was observed between
congruent and incongruent dyads; and (iii) congruent dyad respondents reported
higher levels of organizational satisfaction.
Both the 2002 and 2004 studies discussed the merits of the LMX (Leader-Member
Exchange) approach although neither paper explicitly included any LMX constructs
in their data analysis. A later study by Testa (2009) did, however, use an LMX
approach and is discussed in the following section.
74
3.5 Leader-Member Exchange (LMX) theory work
Between 1994 and 2001 five studies (Borchgrevink and Boster 1994; Sparrowe
1994; Borchgrevink and Boster 1997, 1998; and Borchgrevink et al. 2001)
utilising the LMX leadership theory were published in hospitality journals; since
then a further three LMX-centred studies have been published (Testa 2009; Kim,
B. et al. 2010; Kim, S. et al. 2010).
With the exception of Kim, B. et al. (2010), all of the LMX studies were
undertaken in a USA business organisation context: Testa’s (2009) study, while
based on US cruise companies, specifically examined relationships between
employees from a variety of different countries.
Borchgrevink and colleagues - with Boster (1994, 1997, 1998) and with Cichy
and Mykeltun (2001) - established the construct validity of the LMX relationship
model in a hospitality context and measured the correlations between high- and
low-quality leader-member relationships and a number of causal factors
(antecedents) and outcomes (consequents). In addition to establishing the
construct validity of the LMX model, Borchgrevink and Boster (1998) were also
able to demonstrate (within their sample of hospitality employees drawn from US
university students) that the LMX provided a measure of work-based relationships
which is distinct from other measures of interpersonal relationships.
Across the range of hospitality organisations studied by Borchgrevink and
colleagues, increases in LMX quality were associated with the following outcomes
(consequents):
decreases in staff turnover and burnout;
increases in members’ commitment, job satisfaction, job performance, esteem,
and role quality (members’ satisfaction with their respective work roles); and
increases in leaders’ levels of referent power (which encourages subordinates’
identification with and desire to emulate a superior).
While specific factors accounting for (antecedents) higher-quality LMX
relationships were found to be:
good leader-member communications (Borchgrevink et al. 2001);
mutual leader-member respect and trust (Borchgrevink and Boster 1998);
leaders’ championing of subordinates (Borchgrevink and Boster 1998);
leaders’ high use of reward power and low use of coercive power (Borchgrevink
and Boster 1997); and
75
leaders’ high levels of social support (Borchgrevink and Boster 1994).
Sparrowe’s (1994) paper examining antecedents and outcomes of empowerment
in a hospitality context found that organisational culture and LMX relationships
had positive and significant effects on employee empowerment levels. Sparrowe’s
research also found that employees reporting greater levels of empowerment
were more likely to be satisfied with promotional opportunities and less likely to
report an intention to leave their current job.
Testa’s (2009) study investigated the relationship between cultural congruence in
leader-member dyads, perceived leadership style, LMX and employee citizenship
behaviours. Along with several other of Testa’s leadership-related hospitality
publications (Testa 2001, 2002, 2004, 2007), this paper examines the influence
of cultural congruence/incongruence (situations where leader and member have
different nationalities) on leader-member relations.
Testa’s 2009 study used multivariate analysis of variance (MANOVA) to test for
relationships between organisational citizenship behaviour (OCB), initiating
structure and consideration, and the nature of LMX relationships. The results
showed that subordinates within congruent dyads reported higher levels of LMX
quality and organisational citizenship behaviours. Otherwise, while subordinates
in culturally congruent dyads reported greater perceived consideration-type
leadership behaviours, higher levels of initiating structure were not reported by
subordinates in culturally incongruent dyads.
Kim, S. et al. (2010) modelled the relationships between LMX quality, employee
envy and organisational citizenship behaviour (in particular, voluntary helping
behaviour towards co-workers). They found that low-quality LMX relationships
correlated with higher levels of employee envy and lower levels of voluntary
helping behaviours towards co-workers.
In the only non-USA study utilising LMX theory, Kim, B. et al. (2010) investigated
the relationship between LMX quality and turnover intent in South Korean hotels.
Their results showed that, for supervisory employees, there was a linear inverse
relationship between LMX quality and turnover intent (low LMX quality correlates
with higher turnover intent). For non-supervisory employees, however, a
curvilinear association between LMX quality and turnover intention was observed.
Specifically, non-supervisory employees with both low- and high-quality of LMX
tended to have higher levels of turnover intent. The authors speculate that it
may be the case that high-quality LMX relationships contribute to employee
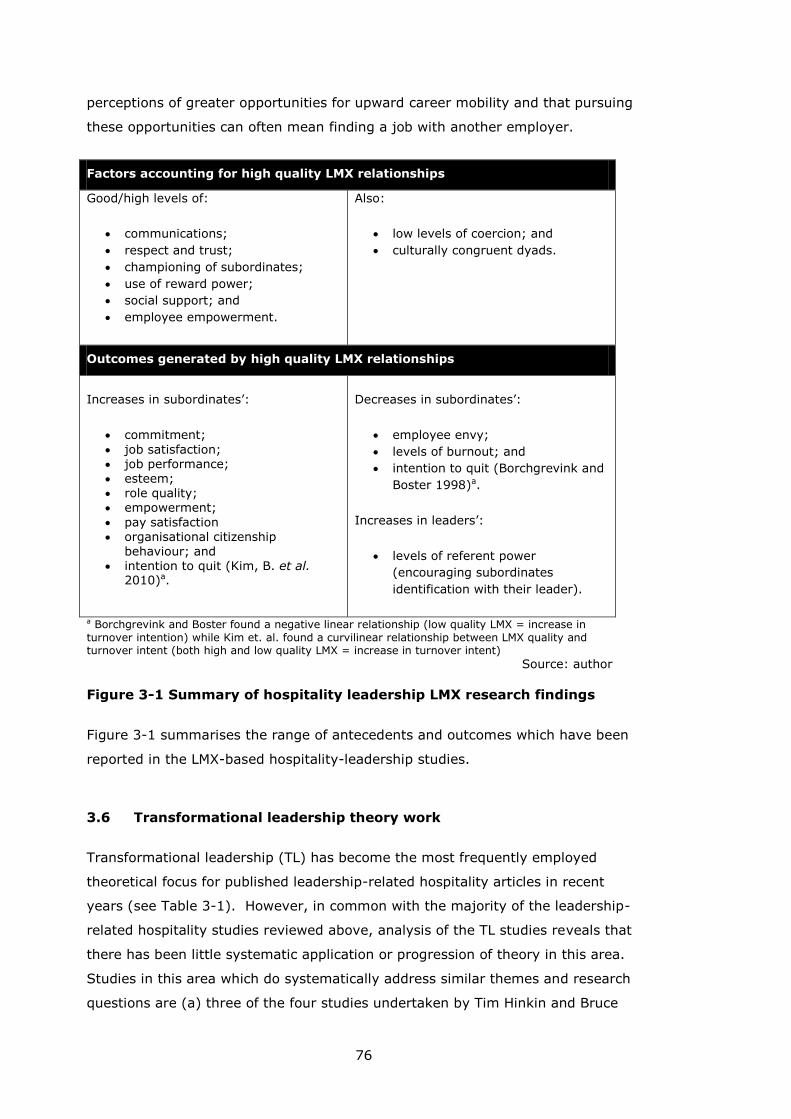
76
perceptions of greater opportunities for upward career mobility and that pursuing
these opportunities can often mean finding a job with another employer.
Factors accounting for high quality LMX relationships
Good/high levels of:
communications;
respect and trust;
championing of subordinates;
use of reward power;
social support; and
employee empowerment.
Also:
low levels of coercion; and
culturally congruent dyads.
Outcomes generated by high quality LMX relationships
Increases in subordinates’:
commitment;
job satisfaction; job performance; esteem; role quality; empowerment;
pay satisfaction organisational citizenship
behaviour; and intention to quit (Kim, B. et al.
2010)a.
Decreases in subordinates’:
employee envy;
levels of burnout; and
intention to quit (Borchgrevink and
Boster 1998)a.
Increases in leaders’:
levels of referent power
(encouraging subordinates
identification with their leader).
a Borchgrevink and Boster found a negative linear relationship (low quality LMX = increase in
turnover intention) while Kim et. al. found a curvilinear relationship between LMX quality and turnover intent (both high and low quality LMX = increase in turnover intent)
Source: author
Figure 3-1 Summary of hospitality leadership LMX research findings
Figure 3-1 summarises the range of antecedents and outcomes which have been
reported in the LMX-based hospitality-leadership studies.
3.6 Transformational leadership theory work
Transformational leadership (TL) has become the most frequently employed
theoretical focus for published leadership-related hospitality articles in recent
years (see Table 3-1). However, in common with the majority of the leadership-
related hospitality studies reviewed above, analysis of the TL studies reveals that
there has been little systematic application or progression of theory in this area.
Studies in this area which do systematically address similar themes and research
questions are (a) three of the four studies undertaken by Tim Hinkin and Bruce
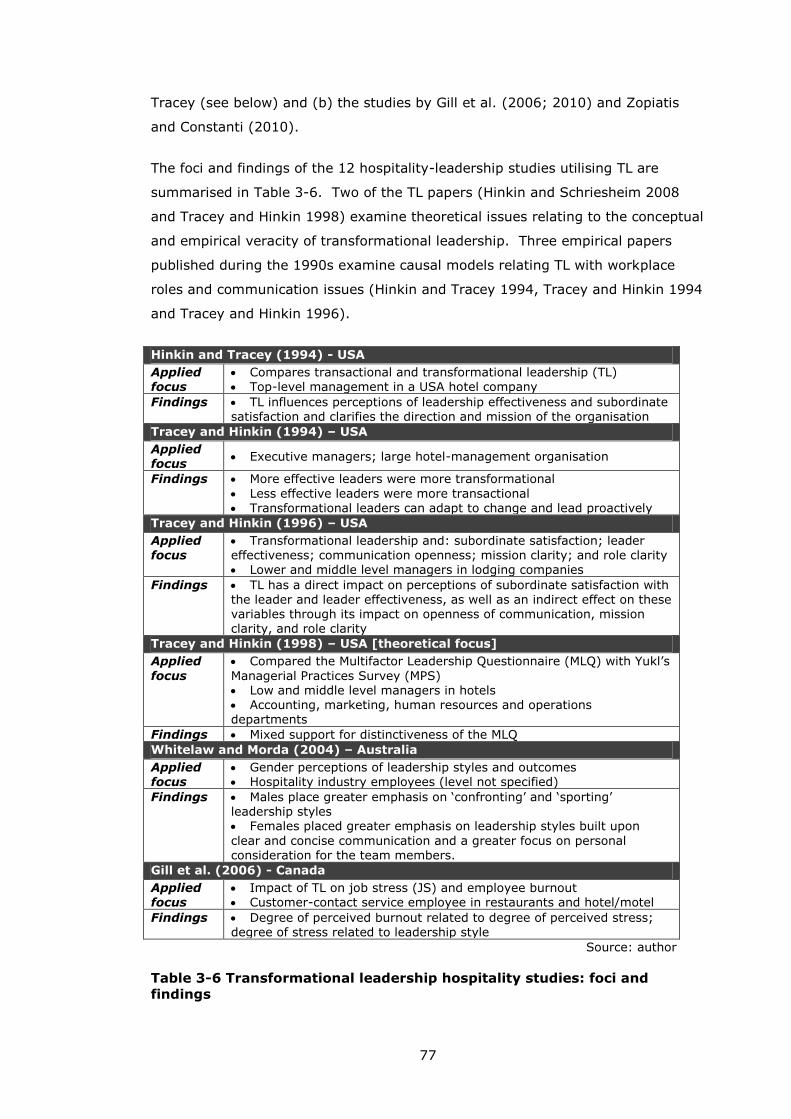
77
Tracey (see below) and (b) the studies by Gill et al. (2006; 2010) and Zopiatis
and Constanti (2010).
The foci and findings of the 12 hospitality-leadership studies utilising TL are
summarised in Table 3-6. Two of the TL papers (Hinkin and Schriesheim 2008
and Tracey and Hinkin 1998) examine theoretical issues relating to the conceptual
and empirical veracity of transformational leadership. Three empirical papers
published during the 1990s examine causal models relating TL with workplace
roles and communication issues (Hinkin and Tracey 1994, Tracey and Hinkin 1994
and Tracey and Hinkin 1996).
Hinkin and Tracey (1994) - USA
Applied focus
Compares transactional and transformational leadership (TL) Top-level management in a USA hotel company
Findings TL influences perceptions of leadership effectiveness and subordinate satisfaction and clarifies the direction and mission of the organisation
Tracey and Hinkin (1994) – USA
Applied focus
Executive managers; large hotel-management organisation
Findings
More effective leaders were more transformational
Less effective leaders were more transactional Transformational leaders can adapt to change and lead proactively
Tracey and Hinkin (1996) – USA
Applied focus
Transformational leadership and: subordinate satisfaction; leader effectiveness; communication openness; mission clarity; and role clarity Lower and middle level managers in lodging companies
Findings TL has a direct impact on perceptions of subordinate satisfaction with the leader and leader effectiveness, as well as an indirect effect on these variables through its impact on openness of communication, mission clarity, and role clarity
Tracey and Hinkin (1998) – USA [theoretical focus]
Applied
focus
Compared the Multifactor Leadership Questionnaire (MLQ) with Yukl’s
Managerial Practices Survey (MPS) Low and middle level managers in hotels Accounting, marketing, human resources and operations departments
Findings Mixed support for distinctiveness of the MLQ
Whitelaw and Morda (2004) – Australia
Applied focus
Gender perceptions of leadership styles and outcomes Hospitality industry employees (level not specified)
Findings Males place greater emphasis on ‘confronting’ and ‘sporting’ leadership styles Females placed greater emphasis on leadership styles built upon
clear and concise communication and a greater focus on personal consideration for the team members.
Gill et al. (2006) - Canada
Applied focus
Impact of TL on job stress (JS) and employee burnout Customer-contact service employee in restaurants and hotel/motel
Findings Degree of perceived burnout related to degree of perceived stress; degree of stress related to leadership style
Source: author
Table 3-6 Transformational leadership hospitality studies: foci and
findings
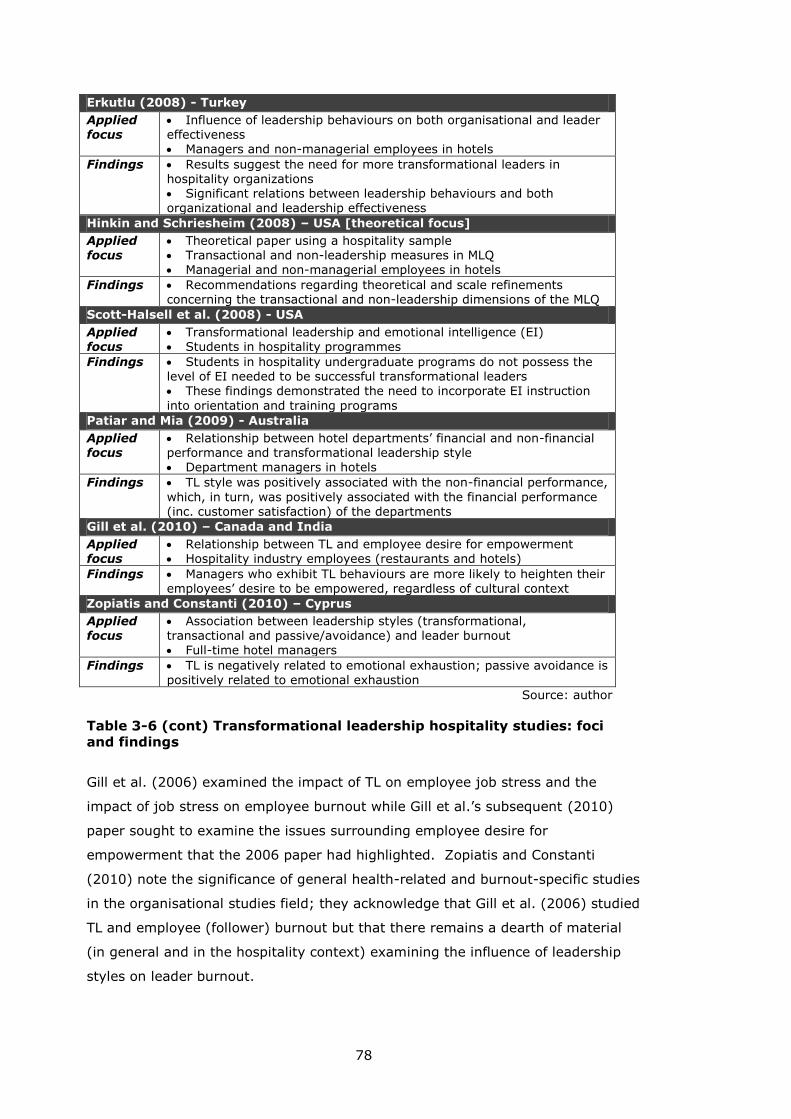
78
Erkutlu (2008) - Turkey
Applied focus
Influence of leadership behaviours on both organisational and leader effectiveness Managers and non-managerial employees in hotels
Findings Results suggest the need for more transformational leaders in hospitality organizations Significant relations between leadership behaviours and both organizational and leadership effectiveness
Hinkin and Schriesheim (2008) – USA [theoretical focus]
Applied focus
Theoretical paper using a hospitality sample Transactional and non-leadership measures in MLQ Managerial and non-managerial employees in hotels
Findings Recommendations regarding theoretical and scale refinements concerning the transactional and non-leadership dimensions of the MLQ
Scott-Halsell et al. (2008) - USA
Applied focus
Transformational leadership and emotional intelligence (EI) Students in hospitality programmes
Findings Students in hospitality undergraduate programs do not possess the level of EI needed to be successful transformational leaders These findings demonstrated the need to incorporate EI instruction
into orientation and training programs
Patiar and Mia (2009) - Australia
Applied focus
Relationship between hotel departments’ financial and non-financial performance and transformational leadership style Department managers in hotels
Findings TL style was positively associated with the non-financial performance,
which, in turn, was positively associated with the financial performance (inc. customer satisfaction) of the departments
Gill et al. (2010) – Canada and India
Applied focus
Relationship between TL and employee desire for empowerment Hospitality industry employees (restaurants and hotels)
Findings Managers who exhibit TL behaviours are more likely to heighten their employees’ desire to be empowered, regardless of cultural context
Zopiatis and Constanti (2010) – Cyprus
Applied focus
Association between leadership styles (transformational, transactional and passive/avoidance) and leader burnout Full-time hotel managers
Findings TL is negatively related to emotional exhaustion; passive avoidance is positively related to emotional exhaustion
Source: author
Table 3-6 (cont) Transformational leadership hospitality studies: foci
and findings
Gill et al. (2006) examined the impact of TL on employee job stress and the
impact of job stress on employee burnout while Gill et al.’s subsequent (2010)
paper sought to examine the issues surrounding employee desire for
empowerment that the 2006 paper had highlighted. Zopiatis and Constanti
(2010) note the significance of general health-related and burnout-specific studies
in the organisational studies field; they acknowledge that Gill et al. (2006) studied
TL and employee (follower) burnout but that there remains a dearth of material
(in general and in the hospitality context) examining the influence of leadership
styles on leader burnout.
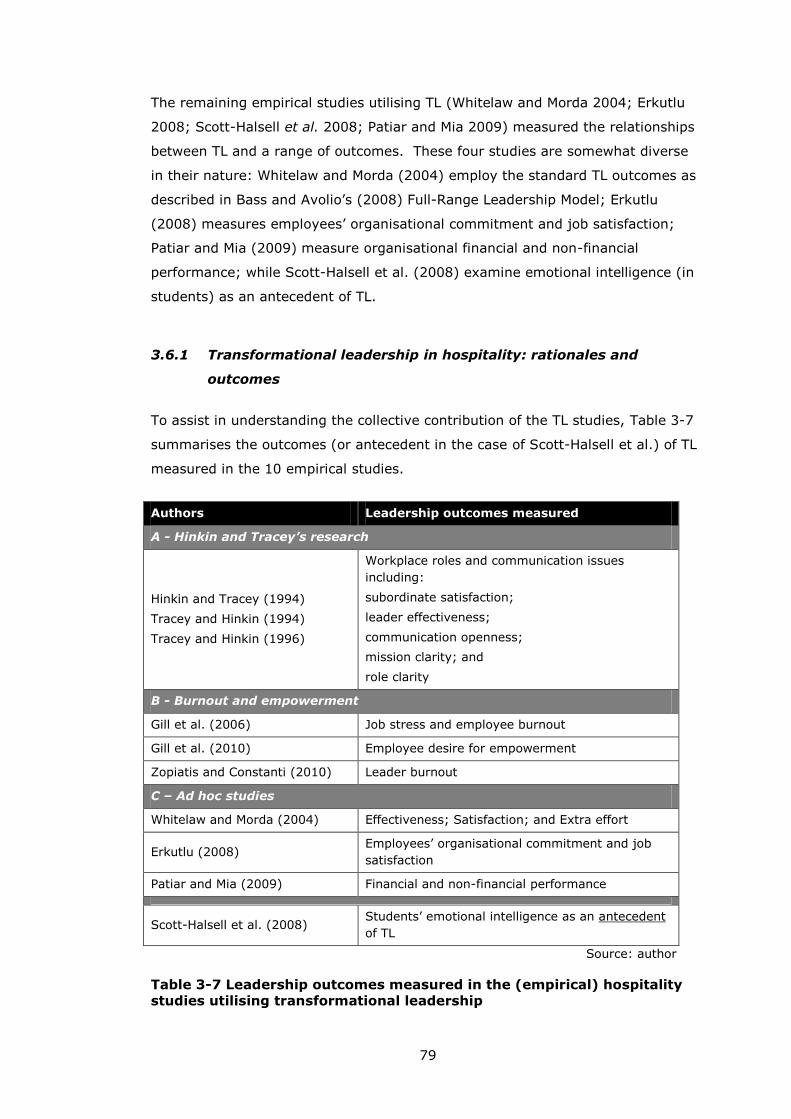
79
The remaining empirical studies utilising TL (Whitelaw and Morda 2004; Erkutlu
2008; Scott-Halsell et al. 2008; Patiar and Mia 2009) measured the relationships
between TL and a range of outcomes. These four studies are somewhat diverse
in their nature: Whitelaw and Morda (2004) employ the standard TL outcomes as
described in Bass and Avolio’s (2008) Full-Range Leadership Model; Erkutlu
(2008) measures employees’ organisational commitment and job satisfaction;
Patiar and Mia (2009) measure organisational financial and non-financial
performance; while Scott-Halsell et al. (2008) examine emotional intelligence (in
students) as an antecedent of TL.
3.6.1 Transformational leadership in hospitality: rationales and
outcomes
To assist in understanding the collective contribution of the TL studies, Table 3-7
summarises the outcomes (or antecedent in the case of Scott-Halsell et al.) of TL
measured in the 10 empirical studies.
Authors Leadership outcomes measured
A - Hinkin and Tracey’s research
Hinkin and Tracey (1994)
Tracey and Hinkin (1994)
Tracey and Hinkin (1996)
Workplace roles and communication issues
including:
subordinate satisfaction;
leader effectiveness;
communication openness;
mission clarity; and
role clarity
B - Burnout and empowerment
Gill et al. (2006) Job stress and employee burnout
Gill et al. (2010) Employee desire for empowerment
Zopiatis and Constanti (2010) Leader burnout
C – Ad hoc studies
Whitelaw and Morda (2004) Effectiveness; Satisfaction; and Extra effort
Erkutlu (2008) Employees’ organisational commitment and job
satisfaction
Patiar and Mia (2009) Financial and non-financial performance
Scott-Halsell et al. (2008) Students’ emotional intelligence as an antecedent
of TL
Source: author
Table 3-7 Leadership outcomes measured in the (empirical) hospitality
studies utilising transformational leadership
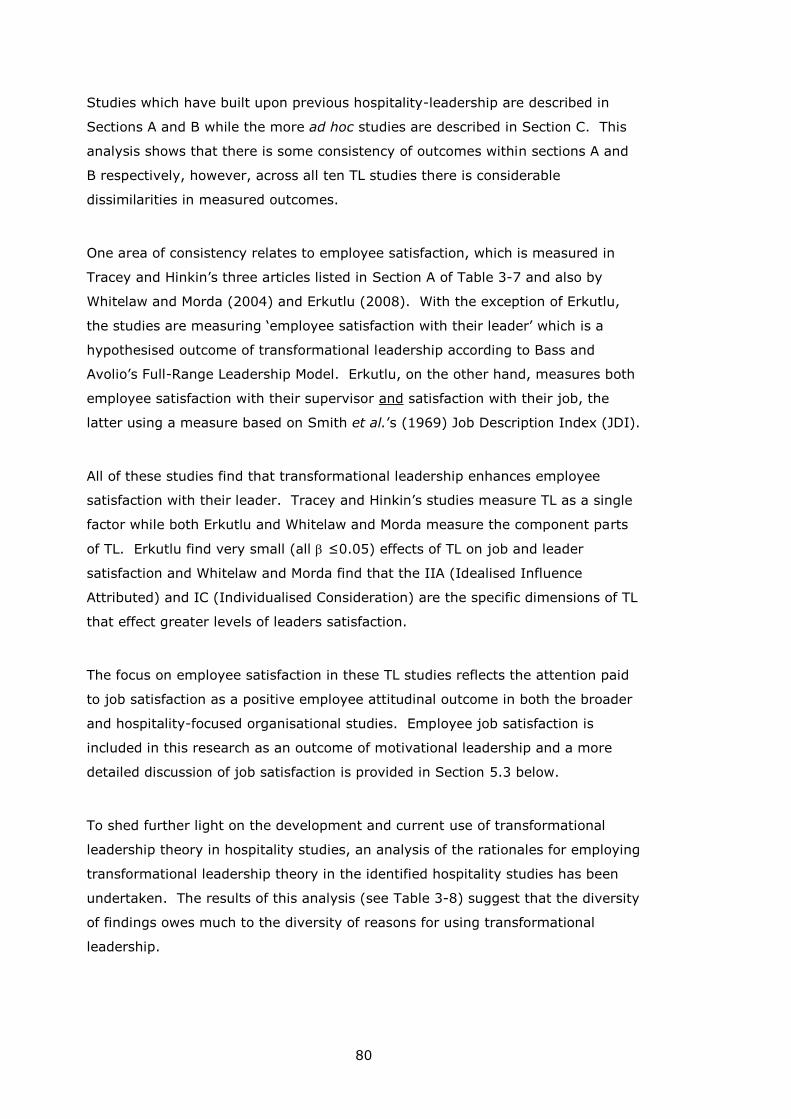
80
Studies which have built upon previous hospitality-leadership are described in
Sections A and B while the more ad hoc studies are described in Section C. This
analysis shows that there is some consistency of outcomes within sections A and
B respectively, however, across all ten TL studies there is considerable
dissimilarities in measured outcomes.
One area of consistency relates to employee satisfaction, which is measured in
Tracey and Hinkin’s three articles listed in Section A of Table 3-7 and also by
Whitelaw and Morda (2004) and Erkutlu (2008). With the exception of Erkutlu,
the studies are measuring ‘employee satisfaction with their leader’ which is a
hypothesised outcome of transformational leadership according to Bass and
Avolio’s Full-Range Leadership Model. Erkutlu, on the other hand, measures both
employee satisfaction with their supervisor and satisfaction with their job, the
latter using a measure based on Smith et al.’s (1969) Job Description Index (JDI).
All of these studies find that transformational leadership enhances employee
satisfaction with their leader. Tracey and Hinkin’s studies measure TL as a single
factor while both Erkutlu and Whitelaw and Morda measure the component parts
of TL. Erkutlu find very small (all ≤0.05) effects of TL on job and leader
satisfaction and Whitelaw and Morda find that the IIA (Idealised Influence
Attributed) and IC (Individualised Consideration) are the specific dimensions of TL
that effect greater levels of leaders satisfaction.
The focus on employee satisfaction in these TL studies reflects the attention paid
to job satisfaction as a positive employee attitudinal outcome in both the broader
and hospitality-focused organisational studies. Employee job satisfaction is
included in this research as an outcome of motivational leadership and a more
detailed discussion of job satisfaction is provided in Section 5.3 below.
To shed further light on the development and current use of transformational
leadership theory in hospitality studies, an analysis of the rationales for employing
transformational leadership theory in the identified hospitality studies has been
undertaken. The results of this analysis (see Table 3-8) suggest that the diversity
of findings owes much to the diversity of reasons for using transformational
leadership.
81
Article/s Rationale/s for employing transformational leadership
Hinkin and
Tracey (1994)
Tracey and
Hinkin (1994)
Tracey and
Hinkin (1996)
Transformational leadership most effective for dynamic, changing
environment
Improvements in performance and service quality will have to be
made through strong (transformational) leadership
Whitelaw and
Morda (2004)
Review of leadership research in the hospitality sector indicates
that traits consistent with transformational leadership are more
highly valued
Gill et al.
(2006)
Transformational leadership may help to ameliorate or reduce
employee job stress and burnout
Erkutlu (2008)
Transformational leadership promotes ‘performance beyond
expectations’
Follow Tracey and Hinkin (1994, 1996) citing the benefits of
transformational leadership in the dynamic hospitality business
environment
Transformational leadership has been correlated with subordinates’
satisfaction with leadership and levels of organisational
commitment
Scott-Halsell et
al. (2008)
Teamwork, collaboration and excellent interpersonal
communication are traits of successful leaders
Transformational leaders, utilizing their emotional intelligence (EI)
abilities, are successful in employing these effective leadership
skills
Patiar and Mia
(2009)
Wide range of reasons for hospitality businesses utilising
transformational leadership are provided
These essentially drawn from the Four I’s (see Avolio et al. 1991)
Additionally, transformational leadership is beneficial for dealing
with intense market competition
Gill et al.
(2010)
To address the knowledge gap regarding transformational
leadership’s influence on employee desire for empowerment
Zopiatis and
Constanti
(2010)
To address the knowledge gap regarding transformational
leadership’s influence on leaders’ stress and burnout levels (c.f. Gill
et al. 2006 on followers’ stress and burnout)
Theoretically-focussed studies
Tracey and
Hinkin (1998)
Is transformational leadership as measured by Bass and Avolio’s
(1990b) MLQ conceptually distinct from Yukl’s (1990) Managerial
Practices Survey (MPS)?
Hinkin and
Schriesheim
(2008)
To examine the theoretical and empirical properties of the
transactional components of Bass and Avolio’s (1993) MLQ
Source: author
Table 3-8 Rationales for employing transformational leadership
82
With the exception of the two theoretically-focused studies, Table 3-8 presents
the articles in chronological order. The review of rationales shows that
transformational leadership theory has been applied to address a range of
organisational issues including: change management; stress and burnout (in
leaders and followers); organisational and individuals’ performance; subordinate
empowerment; organisational commitment; and general management issues
encompassed within TL theory.
In summary, studies on hospitality leadership utilising transformational leadership
theory have addressed a broad range of leadership outcomes for a broad range of
reasons. In common with the wider field of hospitality leadership studies, there is
no unifying theme or set of research questions that have been addressed by
researchers who have adopted transformational leadership as their theoretical
focus. Researchers’ motivations for employing transformational leadership theory
appear to be diverse, as evidenced by the wide range of rationales for employing
this approach that are described. Such diversity of rationales further contributes
to the diversity of foci and findings in this sub-theme of hospitality leadership
research.
3.7 Miscellaneous studies
Three individual studies detailed in Table 3-2 are categorised separately: (i)
Erkutlu and Chafra (2006) which used power-influence leadership theory; (ii)
Brownell (2010) who examined servant leadership in the context of hospitality
and hospitality education; and (iii) Keegan’s (1983) discussion paper on the
societal context for hospitality-leadership.
Using French and Raven’s (1959) ‘social bases of power’ framework and Rahim’s
(1988) Leader Power Inventory, Erkutlu and Chafra (2006) sought to examine the
influence of leadership power bases on subordinates’ job stress in Turkish
boutique hotels. They found significant correlations between leader power bases
and subordinates’ job stress and recommended that organisations that aim to
proactively manage leadership-related issues should recognise the influence of
power bases. French and Raven’s power base framework was also utilised by
Borchgrevink and Boster (1997, see above) who found (i) leaders’ high use of
reward power and low use of coercive power as causal factors for high-quality
LMX relationships and (ii) leaders’ levels of referent power increasing as a

83
consequence of high-quality LMX relationships. However, despite being the only
other hospitality-leadership study to employ French and Raven’s power bases
framework, Borchgrevink and Boster’s study was not cited in Erkutlu and Chafra’s
2006 study.
Brownell (2010) examines the potential contribution of servant leadership
approaches in hospitality industry and hospitality education contexts. In common
with Burns’ (1978) earlier conceptions of transforming leadership, servant
leadership emphasises the moral and ethical aspects of leadership; with servant
leadership, however, leaders are motivated by a desire to serve rather than to
lead (Bolden 2004: 12). As Brownell puts it, “…influence is achieved through the
act of service itself. This characteristic is key, and it results in an egalitarian
leader-follower relationship” (2010: 366). Brownell’s desk-based study explored
servant leadership’s potential to positively contribute to both the hospitality
industry and to hospitality education. The study concludes that servant
leadership in the hospitality industry has the potential to contribute to
empowering hospitality employees and also to workplace trust, respect and
personal integrity. Brownell argues that, since all of these factors can help
underpin ethical practices in values-based organisational culture hospitality, then
educators should address servant leadership in hospitality curricula.
Keegan’s (1983) discussion paper examined leadership and hospitality in a
societal context with the rationale that managerial leadership cannot be studied in
isolation from wider leadership debates, which themselves are located within the
context of changing societal conditions. Keegan’s thesis concludes with the
recommendation that the way forward for managerial leadership in the hospitality
sectors would be to create a work environment “...in which the employee’s real
needs are satisfied” (1983: 92-93). Keegan also reports (p. 78) on the findings of
his informal research with hotel managers (in the USA) who were asked to
hierarchically rank a set of five prescriptive statements about the nature of
leadership in hospitality. The managers reported that effective leadership in
hospitality organisations is typified by leaders’ abilities to: (i) stimulate employees
to understand organisational goals and motivate employees to seek to achieve
these goals; and (ii) gain the respect of employees to effect their willing co-
operation. Interestingly, these leadership behaviours are accurately described
using the transformational leadership factors of Inspirational Motivation (IM) and
Idealised Influence (IIa and IIb).
84
3.8 Summary of hospitality leadership findings
The review above has found that within the identified studies that have utilised
leadership theory to investigate leadership-related phenomena in hospitality
contexts, there have been a broad range of approaches taken and a wide range of
findings.
The research questions that have been addressed are so diverse that it is not
possible to meaningfully reduce these into groups for the purpose of summarising
the collected findings. There is, however, one notable area that has not been
addressed in the hospitality leadership research. Specifically, that link between
leadership and job performance.
Only two hospitality leadership studies have addressed the link between
leadership and job performance. However, in both of these studies, the link
between leadership and employee performance is somewhat indirect: Clark et al.
measured employee commitment to service quality (rather than actual job
performance / service quality) while in Patiar and Mia’s study, service quality was
only one of four ‘non-financial performance’ components in the factor (alongside
repeat business, staff development and staff morale).
Clark et al. (2009) found that participative and empowering leadership styles had
an effect (β = 0.082 for participative and β = 0.088 for empowering) on
employees’ commitment to service-quality. Patiar and Mia (2009) found that
transformational leadership had a positive (β = 0.309) effect on a ‘non-financial
performance’ factor containing a customer service component.
Seventeen of the hospitality leadership studies had incorporated job satisfaction
as a variable of interest (Hawkins and Lee 1990; Borchgrevink and Boster 1994;
Ross and Boles 1994; Susskind et al. 2000a; Susskind et al. 2000b; Carbery et al.
2003; Testa 2004; Kim et al. 2005; Tutuncu and Kozak 2007; Chiang and Jang
2008; Deery 2008; Erkutlu 2008; Øgaard et al. 2008; Tsai 2008; Fei-Chuan et al.
2009; Kuruüzüm et al. 2009; Yang 2010).
These studies have measured the relationships between job satisfaction and a
number of other variables including organisational commitment (Hawkins and Lee
1990; Susskind et al. 2000b; Chiang and Jang 2008; Kuruüzüm et al. 2009),
85
turnover (Susskind et al. 2000a; Carbery et al. 2003), empowerment (Chiang and
Jang 2008) and leadership (Tutuncu and Kozak 2007).
No hospitality studies, however, have addressed what Landy (1985: 410) and
Weiss (2002: 184) have referred to as the ‘holy grail’ relationship of
organisational studies – the positive relationship between job satisfaction and job
performance.
Based on the findings from the review above, this research will measure (i) the
effect of motivational leadership on job satisfaction and job performance and (ii)
the effect of job satisfaction on job performance. Other relevant variables
highlighted from review of leadership in hospitality are organisational commitment
and empowerment (empowerment has already been noted as relevant in Section
2.3.3 above).
3.9 Leadership in hospitality: the state of the art
The research findings from the identified leadership-focused hospitality studies
cannot be aggregated in such a way that a coherent framework of
knowledge/understanding emerges.
There are several strands of research which build upon previous approaches and
findings: Borchgrevink and colleagues in the LMX area; Testa’s (2002 and 2004)
contingency studies; Tracey and Hinkin’s transformational leadership research;
and the work by Gill et. al. (2006; 2010) and Zopiatis and Constanti (2010)
examining stress/burnout and empowerment. However, these studies (excepting
Zopiatis and Constanti) build upon the findings and experience of each discrete
research team rather than drawing upon the wider hospitality-leadership literature
for research questions and research designs.
The remaining studies are largely disparate in their approaches, research designs
and research questions. In some cases studies have similar foci but, owing to the
different conceptual and analytical approaches, it is not straightforward to
compare the respective findings. An example of such incommensurability of
findings can be found in three studies which all examine leadership and
empowerment; Sparrowe (1994) using LMX theory, Chiang and Jang (2008) using
a behavioural approach (supportive leadership) and Gill et al. (2010) using
transformational leadership theory. Nevertheless, the findings of these studies do
86
provide consistent support for the existence of relationships between leadership
styles and employee empowerment.
A further example can be found considering three of the earlier hospitality
leadership studies:
(i) White (1973) utilised a categorisation of leadership styles similar to
that of Likert (1961) and recommended a shift from the observed
autocratic style to a more consultative leadership style (UK-based);
(ii) Nebel and Stearns (1977) utilised Fiedler's LPC (Least Preferred
Co-worker) Contingency Theory and found that a task-orientated
management style would be the most effective (US-based); while
(iii) Worsfold (1989) employed the measuring instruments developed
from the Ohio State University leadership studies and – acknowledging
the findings of both White and Nebel and Stearns - recommended that
effective hospitality leadership should employ an ‘autocratic style with
consultative overtones’ (p. 153) (UK-based).
While all three of these studies seek to answer a similar question (what is the
most effective leadership style for the hospitality sector?) and conceptualise
leadership styles using measures broadly analogous to the ‘consideration –
initiating structure’ continuum, their respective findings are difficult to consolidate
into a meaningful and overarching understanding of the issue since they all have
used different conceptual frameworks and methods.
Taking a broader view, the diversity of the foci, aims and rationales employed
across the leadership in hospitality field provides an explanation for the difficulty
in synthesising or consolidating the knowledge generated by hospitality leadership
studies.
To put this fragmented view of hospitality leadership studies into a wider
perspective, we can consider the following from Yukl (1989) with reference to the
development of generic leadership studies:
In 1974, after making an extensive review of more than 3000
leadership studies, Stogdill (p. vii) concluded: "Four decades of
research on leadership have produced a bewildering mass of
findings.... the endless accumulation of empirical data has not
produced an integrated understanding of leadership." The confused
state of the field can be attributed in large part to the disparity of
87
approaches, the narrow focus of most researchers, and the absence of
broad theories that integrate findings from the different approaches.
Leadership has been studied in different ways, depending on the
researcher's conception of leadership and methodological preferences.
(1989: 253-254)
So, even after four decades of leadership for Stogdill (writing in 1974), and five
and half decades for Yukl (writing in 1989), mainstream leadership studies was
still fragmented and – albeit with a far greater volume of studies – in a similar
situation to hospitality leadership studies today.
The observations above are not intended as a critique of individual researchers or
research teams – indeed, when there are so many unexplored aspects of a field to
pursue, it is natural that a wide range of research questions will emerge. Even
within the relatively focused area of empowerment, as the first example above
illustrates, there exist a range of specific research questions and, of course, any
number of leadership theories with which to pursue these questions.
The current situation, however, presents a significant challenge to our current and
future understanding of hospitality-leadership issues. Specifically, in the absence
of an integrated / cohesive framework of research knowledge, there is no
hospitality-specific conceptual-level guidance for researchers with regard to how
they identify knowledge gaps, construct future research questions and design
future research projects.
Nevertheless, hospitality scholars can, at least, take some encouragement from
the fact that leadership studies in hospitality are at an early stage of evolutionary
development. The following section draws upon Hunt’s (1999) examination of the
evolution of generic leadership studies to consider the early evolutionary stage of
leadership research in hospitality. Following that, Pittaway et al.’s (1998) review
of leadership research in hospitality and their framework for future research is
critically evaluated.
3.10 Evolution of leadership studies in hospitality
The historical development of the generic leadership studies field has been
examined by Hunt (1999) who drew upon Reichers and Schneider's (1990)
88
evolution of concepts framework that describes three stages for outlining
predictable ‘evolutionary’ paths with regard to the development of scientific
constructs. The stages are:
(1) concept introduction/elaboration;
(2) concept evaluation/augmentation; and
(3) concept consolidation/accommodation.
Reichers and Schneider’s first stage, concept introduction / elaboration, is
characterised by the introduction and legitimisation of a new or borrowed concept.
Stage 2, the concept evaluation / augmentation stage is characterised by (a)
critical evaluations of the concepts, supporting literature and empirical
approaches, (b) work attempting to address these criticisms and (c) subsequent
reconceptualisations. During the concept consolidation/accommodation (Stage
3), the debates and controversy in Stage 2 tend to give way to more descriptive
literature reviews, definitions are consolidated and the concept begins to be
utilised as a moderator or mediator in wider research studies (Hunt 1999: 131-
132).
Leadership research in hospitality demonstrates characteristics associated with
Stage 1 but also some of those associated with Stage 2. With regard to Stage 2
characteristics, there have been reviews of the field containing elements of critical
evaluation (e.g. Keegan 1983, Mullins 1994, Wood 1994, Pittaway et al. 1998 and
Gillet and Morda 2004) and, additionally, Tracey and Hinkin (1998) and Hinkin
and Schriesheim (2008) have used hospitality samples to conduct their enquiries
into the theoretical and empirical properties of transformational leadership.
However, thus far, there has been no empirical work containing a significant
critical dimension. For example, there is typically no critical discussion of why one
particular leadership theory has been selected over alternative theories – this
suggests that researchers have tended to draw upon generic leadership theories
which suit their particular research topic or research questions.
It appears that, with a small number of exceptions, research in this field has been
undertaken on an ad hoc basis. This situation is not, however, surprising: on the
one hand, only a small number of hospitality-leadership studies (utilising core
leadership theory) have been undertaken (only 46 identified for this review since
1973) while, on the other hand, there is a wide diversity of hospitality contexts
and large volume of relevant research topics. Put another way, without a
hospitality-based precedent in a given researcher’s leadership-related study area,
89
that researcher will have little option but to look to the wider leadership studies
literature.
Because of the lack of volume and depth of leadership-related hospitality studies,
it is argued here that hospitality-leadership studies remain in Stage 1 of Reichers
and Schneider's (1990) evolution of concepts framework – the concept
introduction / elaboration stage. Stage 2 has not been reached because, although
there have been some critical evaluations, there has been no empirical work
specifically undertaken to address the criticisms and no subsequent
reconceptualisations.
Further evidence for the Stage 1 position – albeit from the late 1990s - can be
found in Pittaway et al.’s (1998) review of the field. They observed that:
“...the majority of research within the hospitality industry has limited
itself to the identification of the importance of leadership. It has not
contributed significantly to a greater understanding of leadership”
(1998: 412).
This observation is entirely consistent with Hunt’s (1999) description of Reichers
and Schneider's (1990) Stage 1,
“Here [in Stage 1], the attempt is to legitimize a new concept or a
newly borrowed concept... Early data are presented to bolster the
argument that the concept represents a real phenomenon”
(Hunt 1999: 131).
It is to Pittaway et al.’s (1998) review that this work now turn its attention.
Pittaway et al.’s article is the only previous work to have attempted to make
recommendations for the future direction of leadership studies in the hospitality
field. Because the current research also seeks to make recommendations for the
future development of the field, it is important to review Pittaway et al.’s work for
any relevant findings or insights.
3.11 Pittaway et al.’s (1998) paradigmatic framework
The early evolution stage of hospitality leadership studies has significant
implications for the deductive development of new research questions in the field.
90
Specifically, until a greater number of studies covering a wider range of
hospitality contexts and research questions have been published, it will remain
difficult to draw upon precedents from within hospitality studies to inform the
design of new research – or indeed, to draw upon any kind of conceptual
framework of hospitality-leadership studies to frame new and relevant research
topics and questions.
The only prior review of hospitality leadership studies was undertaken by Pittaway
et al. (1998) who were concerned that leadership as a topic of research within
hospitality studies had been neglected and, accordingly, set out to construct a
research agenda for the future development of the field. They developed a
paradigmatic taxonomy derived from their analysis of a cross-sectional sample of
generic leadership studies. The fourfold taxonomy was created by firstly
establishing the ontological perspective of each paper as regards the human
nature dimension – that is, the assumptions made regarding the extent to which
human behaviour is influenced by voluntary (i.e. autonomous) or deterministic
(i.e. governed by external environmental) factors. Secondly, the organisational
level (executive versus lower levels) at which each study had been applied (the
leadership type dimension) was assessed. Thirdly, the authors combined these
analyses to identify four paradigmatic approaches to leadership studies. The
characteristics of the generic leadership studies which had been pursued within
each of these paradigms was then described and, based on these characteristics,
appropriate research themes and questions for future hospitality leadership
studies were proposed.
The specific purpose of the paradigms is to ‘...present a clearer view of leadership
and identify how further leadership research could benefit the hospitality industry’
(Pittaway et al. 1998: 408). Figure 3-2 summarises the key aspects of each of
the four paradigms of leadership research identified by Pittaway et al.
However, while the taxonomy generated useful and apposite research questions
for hospitality leadership studies, it does not contribute to the field in a way which
assists future researchers to build on previous (applied) research and advance the
field through progressive, critical and augmentative evolution. This shortcoming
of the paradigmatic taxonomy is largely due to the fact that it is based primarily
on ontological differences between studies in the generic leadership studies field;
in contrast, a process of deductive-orientated development requires a critical and
iterative interaction with applied (context-specific) studies.
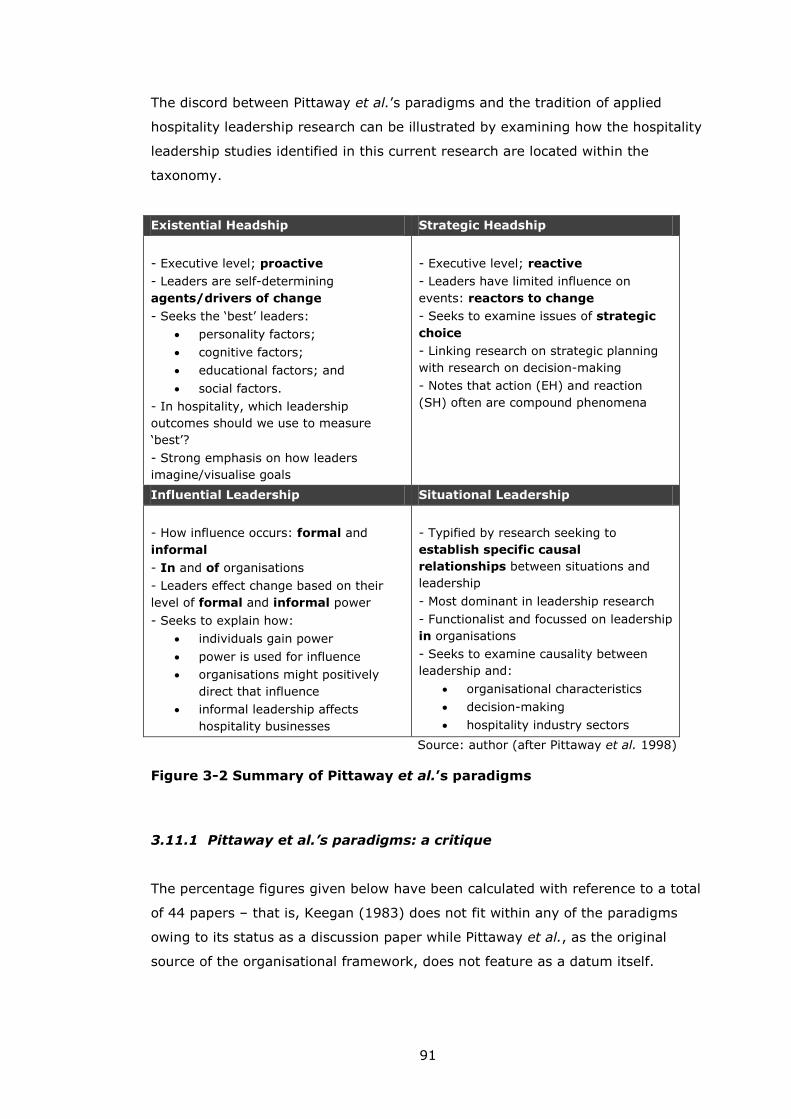
91
The discord between Pittaway et al.’s paradigms and the tradition of applied
hospitality leadership research can be illustrated by examining how the hospitality
leadership studies identified in this current research are located within the
taxonomy.
Existential Headship Strategic Headship
- Executive level; proactive
- Leaders are self-determining
agents/drivers of change
- Seeks the ‘best’ leaders:
personality factors;
cognitive factors;
educational factors; and
social factors.
- In hospitality, which leadership
outcomes should we use to measure
‘best’?
- Strong emphasis on how leaders
imagine/visualise goals
- Executive level; reactive
- Leaders have limited influence on
events: reactors to change
- Seeks to examine issues of strategic
choice
- Linking research on strategic planning
with research on decision-making
- Notes that action (EH) and reaction
(SH) often are compound phenomena
Influential Leadership Situational Leadership
- How influence occurs: formal and
informal
- In and of organisations
- Leaders effect change based on their
level of formal and informal power
- Seeks to explain how:
individuals gain power
power is used for influence
organisations might positively
direct that influence
informal leadership affects
hospitality businesses
- Typified by research seeking to
establish specific causal
relationships between situations and
leadership
- Most dominant in leadership research
- Functionalist and focussed on leadership
in organisations
- Seeks to examine causality between
leadership and:
organisational characteristics
decision-making
hospitality industry sectors
Source: author (after Pittaway et al. 1998)
Figure 3-2 Summary of Pittaway et al.’s paradigms
3.11.1 Pittaway et al.’s paradigms: a critique
The percentage figures given below have been calculated with reference to a total
of 44 papers – that is, Keegan (1983) does not fit within any of the paradigms
owing to its status as a discussion paper while Pittaway et al., as the original
source of the organisational framework, does not feature as a datum itself.
92
Existential Headship and Strategic Headship paradigms
Pittaway et al.’s Existential and Strategic Headship paradigms are closely related
(Pittaway et al. 1998: 419), both being concerned with executive-level leadership
of organisations. The significant distinction between these paradigms is that in
Existential Headship leaders are conceptualised as drivers of change (proactive)
while leaders in the Strategic Headship are conceptualised as having less control
over internal and external environmental change – they are responders to change
rather than drivers of it.
Of the 44 relevant hospitality leadership research studies, only eight (18 per cent)
have been concerned with executive-level leadership of organisations and, of
these, only four (9 per cent) have focussed solely on executive level leadership
(Worsfold 1989; Hinkin and Tracey 1994; Tracey and Hinkin 1994; Chung-Herrera
et al. 2003). Studies which have examined both executive-level leadership and
leadership within organisations are: Shortt (1989), Cichy and Schmidgall (1996),
Nicolaides (2006) and Zopiatis and Constanti (2010).
Although Zopiatis and Constanti (2010) contained a focus on executive-level
leadership of organisations, their research also focused leadership in organisations
and aimed to investigate the (hypothesised) causal relationship between
leadership style and leader burnout. For these reasons this paper was placed in
the Situational Leadership category.
Influential leadership paradigm
Three hospitality leadership studies (6.8 per cent) have been published which are
relevant to the Influential Leadership paradigm. Borchgrevink and Boster (1997)
drew upon French and Raven’s ‘social bases of power’ framework to incorporate
coercive, reward, expert and referent power along with interdyadic
communication into their causal model of LMX (Leader-Member Exchange)
relationships in a hospitality setting. Elsewhere, Erkutlu and Chafra (2006)
sought to examine the influence of leadership power bases on subordinates’ job
stress at boutique hotels in Turkish boutique hotels. To do this the authors used
French and Raven’s (1959) ‘social bases of power’ framework and Rahim’s (1988)
Leader Power Inventory. Significant correlations between leader power bases and
subordinates’ job stress were found and the authors recommended that
93
organisations which aim to proactively manage leadership-related issues should
recognise the influence of power bases.
The third hospitality leadership study which can be located in the Influential
Leadership paradigm is the desk-based study of Brownell (2010). Brownell
describes how “…influence is achieved through the act of service itself. This
characteristic is key, and it results in an egalitarian leader-follower relationship”
(2010: 366) and the study finds that servant leadership in the hospitality industry
has the potential to contribute to empowering hospitality employees and also to
workplace trust, respect and personal integrity.
Borchgrevink and Boster (1997) was classified in Table 3-1 and Table 3-2 as an
LMX paper rather than in the power-influence category. It was categorised this
way because LMX is the primary theoretical approach used in the study, however,
the significance of the power-related constructs in Borchgrevink and Boster’s LMX
model is sufficient to categorise the paper within Pittaway et al.’s Influential
Leadership paradigm.
Situational leadership paradigm
The Situational Leadership paradigm is typified by positivistic research focussing
on leadership in organisations and which seeks to examine the causal
relationships between leadership and number of other variables including
organisational characteristics, decision-making processes and hospitality industry
sector. The majority of the identified hospitality leadership studies (34 of the
total 44, or 77 per cent) fit within this paradigm, reflecting Pittaway et al.’s
finding that it is the most dominant paradigm in generic leadership studies.
3.11.2 The trouble with the taxonomy
Figure 3-3 illustrates how only a very small minority (4 papers representing 9.1
per cent) of empirical hospitality leadership studies focus solely on leadership of
organisations while a further three papers focus on both leadership in and of
organisations (6.8 per cent).
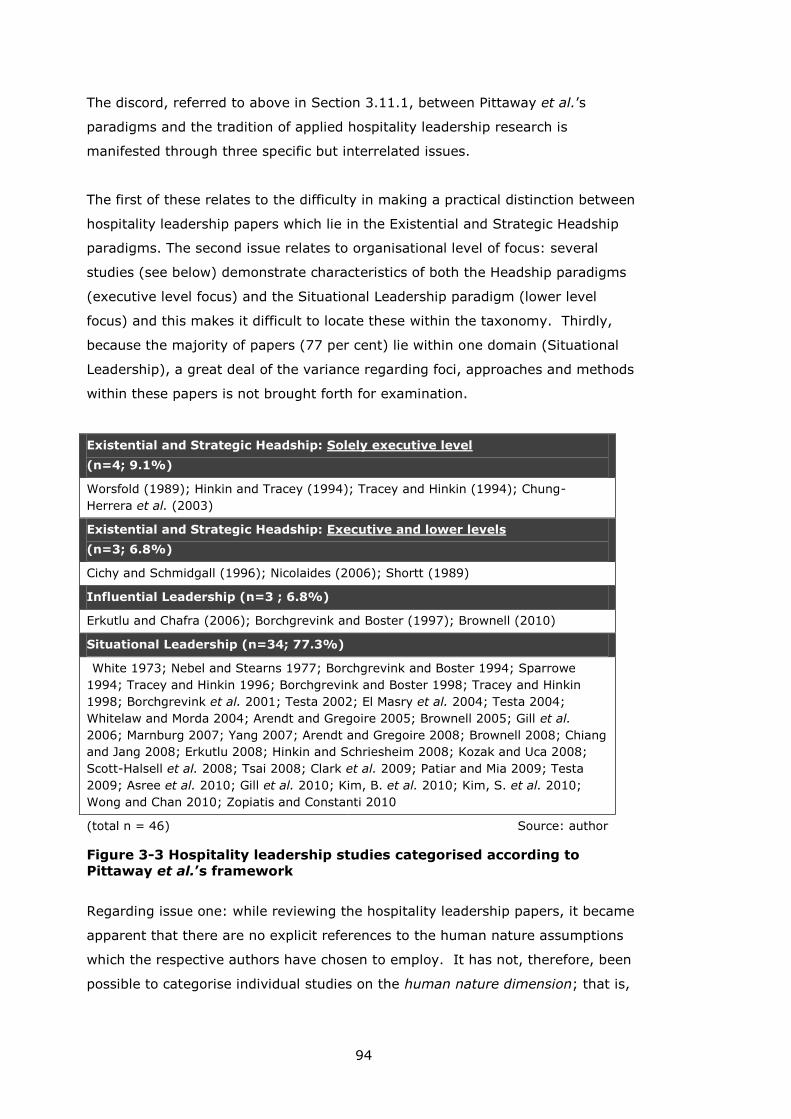
94
The discord, referred to above in Section 3.11.1, between Pittaway et al.’s
paradigms and the tradition of applied hospitality leadership research is
manifested through three specific but interrelated issues.
The first of these relates to the difficulty in making a practical distinction between
hospitality leadership papers which lie in the Existential and Strategic Headship
paradigms. The second issue relates to organisational level of focus: several
studies (see below) demonstrate characteristics of both the Headship paradigms
(executive level focus) and the Situational Leadership paradigm (lower level
focus) and this makes it difficult to locate these within the taxonomy. Thirdly,
because the majority of papers (77 per cent) lie within one domain (Situational
Leadership), a great deal of the variance regarding foci, approaches and methods
within these papers is not brought forth for examination.
Existential and Strategic Headship: Solely executive level
(n=4; 9.1%)
Worsfold (1989); Hinkin and Tracey (1994); Tracey and Hinkin (1994); Chung-
Herrera et al. (2003)
Existential and Strategic Headship: Executive and lower levels
(n=3; 6.8%)
Cichy and Schmidgall (1996); Nicolaides (2006); Shortt (1989)
Influential Leadership (n=3 ; 6.8%)
Erkutlu and Chafra (2006); Borchgrevink and Boster (1997); Brownell (2010)
Situational Leadership (n=34; 77.3%)
(White 1973; Nebel and Stearns 1977; Borchgrevink and Boster 1994; Sparrowe
1994; Tracey and Hinkin 1996; Borchgrevink and Boster 1998; Tracey and Hinkin
1998; Borchgrevink et al. 2001; Testa 2002; El Masry et al. 2004; Testa 2004;
Whitelaw and Morda 2004; Arendt and Gregoire 2005; Brownell 2005; Gill et al.
2006; Marnburg 2007; Yang 2007; Arendt and Gregoire 2008; Brownell 2008; Chiang
and Jang 2008; Erkutlu 2008; Hinkin and Schriesheim 2008; Kozak and Uca 2008;
Scott-Halsell et al. 2008; Tsai 2008; Clark et al. 2009; Patiar and Mia 2009; Testa
2009; Asree et al. 2010; Gill et al. 2010; Kim, B. et al. 2010; Kim, S. et al. 2010;
Wong and Chan 2010; Zopiatis and Constanti 2010)
(total n = 46) Source: author
Figure 3-3 Hospitality leadership studies categorised according to
Pittaway et al.’s framework
Regarding issue one: while reviewing the hospitality leadership papers, it became
apparent that there are no explicit references to the human nature assumptions
which the respective authors have chosen to employ. It has not, therefore, been
possible to categorise individual studies on the human nature dimension; that is,
95
humans as autonomous drivers of change (Existential Headship) or humans as
responding mechanisms (Strategic) paradigm.
Pittaway et al. themselves had recognised this difficulty in delineating between
the two paradigms, writing that:
...research in this paradigm [Strategic Headship] may not need to be
completely separated from the ‘existential headship’ paradigm. It is
evident that the two paradigms apply different assumptions but in
many ways the paradigms are two heads of the same coin.
(1996: 419)
To overcome this difficulty, in Figure 3-3 Existential and Strategic Headship have
been joined at the ontological level (i.e. no difference in assumptions about
human nature). It was not possible to compare the hospitality leadership studies
which fit within the Existential and Strategic Headship paradigms with the generic
studies which Pittaway et al. used to generate these domains. In a rather
significant failing of Pittaway et al.’s paper, none of the source studies from which
the taxonomy was generated were cited by the authors – the authors simply state
that the studies were taken from “A cross section of literature...” (1998: 408).
The second issue relates to Pittaway et al.’s leadership type dimension (which is
concerned with the organisational level at which the research has been applied).
Specifically seven of the papers (Shortt 1989; Worsfold 1989; Cichy and
Schmidgall 1996; Nicolaides 2006; Marnburg 2007; Scott-Halsell et al. 2008;
Zopiatis and Constanti 2010) focussed on executive and lower level leadership.
Because of this, those papers could not faithfully be placed in either of the
Headship paradigms (both of which relate to studies which focus solely on
executive level leadership). Of course, the reciprocal problem with these six
papers is that they can neither be placed faithfully in the Situational Leadership
paradigm, as they do not focus solely on leadership in organisations.
The third and final problematic issue is that the majority of hospitality leadership
papers (77 per cent) are concerned with establishing causal relationships at the
leadership in organisations level and therefore fit within the Situational Leadership
paradigm. By placing so many (34 of 44) papers in one paradigm, the model
masks the variance of aims, theoretical approaches, analytical methods and, of
course, findings which are to be found amongst these 34 studies.
96
In summary then, the first two shortcomings of Pittaway et al.’s taxonomy stem
from the difficulty in allocating hospitality leadership studies across the paradigms
and the third relates to the taxonomy’s lack of explanatory/analytical ability given
that the majority of (themselves diverse) studies are grouped together.
It is important to recognise that Pittaway et al.’s paradigmatic framework (i) was
not generated from hospitality leadership studies (rather it was generated from
generic leadership studies) and, significantly (ii) was intended to inform future
rather than describe previous hospitality leadership studies. Nevertheless, the
author here questions the efficacy of the paradigms for identifying ‘...how further
leadership research could benefit the hospitality industry’ (Pittaway et al. 1998:
408). The approach taken by Pittaway et al. is not being dismissed – it was a
valid approach and generated some useful insights regarding further research
themes and questions for hospitality leadership studies. However, the fact that
applied leadership studies cannot be usefully disaggregated using this framework
means that it is of limited efficacy for guiding hospitality leadership studies based
on previous applied studies in the field. That is, Pittaway et al.’s framework does
little to address the progressive, iterative and deductive development of the field.
The argument here is for a reconceptualisation of the paradigms in order that a
future research agenda for leadership in hospitality be based (i) to some extent
on the preceding tradition of research and (ii) in a way which addresses the
hospitality context, rather than being based on ontological considerations which
are more deeply rooted in the underpinning philosophy of science issues.
As this critical analysis has shown, by adopting an ontological orientation for the
construction of the paradigms, we arrive in a position where (a) a majority studies
lie in the same paradigm and (b) there are some significant difficulties in
allocating studies within the paradigmatic taxonomy. While Pittaway et al. have
utilised the ontological approach to demonstrate how hospitality leadership
studies might progress, their approach does not encompass the collective findings
and epistemological and methodological lessons which can be gleaned from the
tradition of applied hospitality leadership studies. Pittaway et al.’s approach,
therefore, neglects to account for previous applied hospitality studies. This is a
significant shortcoming because positivistic social science is based to a large
extent on the progressive, iterative and deductive development of knowledge.
97
3.12 Reconceptualising the research agenda
As described in Section 3.8 above, this review has determined that the collected
findings from across the range of leadership-focussed hospitality studies cannot
be aggregated to provide a holistic, or even partial, theoretical framework of
hospitality leadership. This is largely due to the ad hoc way in which individual
hospitality leadership studies have been designed and undertaken. It is also likely
to be the case, considering the ongoing absence of a critical mass of hospitality
leadership knowledge, that hospitality leadership researchers have been forced to
draw upon generic leadership theory and practice. The fragmentary nature of the
collected findings of hospitality leadership studies may, therefore, stem from the
broad nature of the generic field which contains a vast array of theories, sub-
theories and alternative theories.
The lack of (i) depth of applied knowledge and (ii) of an integrated theoretical
framework in the hospitality leadership field further serves to hamper the
deductive development of new research questions and themes for investigation.
The evolution of concepts - in terms of both theory and application, and as
described within Reichers and Schneider's (1990) framework – is based on an
iterative, augmentative development of ideas through continual critique and re-
evaluation. Currently, the evolution of hospitality leadership studies remains at
an early stage and will continue to do so until a range of different researchers
begin to adopt augmentative approaches which draw upon and progress the
findings and theoretical developments of existing hospitality studies.
Pittaway et al.’s (1998) approach to developing a future research agenda did not
draw upon the existing body of (theoretical or applied) hospitality leadership
knowledge, but rather drew upon the generic leadership literature. They
categorised studies based on each study’s ontological assumptions about human
behaviour and the organisational-level at which the studies were focussed. While
this approach was used successfully to generate a range of future research
themes and questions, the fact that these were not grounded on existing
hospitality-specific theory and knowledge may have hindered the development of
the field.
The critical examination of Pittaway et al.’s framework has shown that it does not
align well with the existing tradition of hospitality leadership research.
Accordingly, it is argued that this is not the most appropriate model for hospitality
98
leadership scholars to use in building a stronger tradition of theoretical and
applied research. Specifically, this is because (following the evolutionary of
concepts process) a robust applied body of studies must (in addition to drawing
knowledge from overarching and more general theories and findings) draw upon a
critical augmentation of applied theory and findings and continual re-evaluation of
concepts from that field.
So where does all this leave hospitality leadership research and how does it help
inform the rationale for and design of the current research? The conclusions
reached here are that transformational leadership should be employed as a
theoretical orientation, both by hospitality leadership scholars in general and for
this particular study (albeit in a limited way, by drawing upon its Inspirational
Motivational (IM) and Extra Effort (EE) components). The arguments and related
questions that frame these conclusions are summarised below, following which
the choice of transformational leadership is elaborated in greater detail.
The arguments and questions generated from the review are as follows:
1. Following Reichers and Schneider's (1990) evolution of concepts framework,
to develop into a robust field of research with a holistic (or at least, inter-
linked) theoretical framework, a deductive-led process of augmentation of
theory and findings and re-evaluation of concepts should occur.
2. With the exception of a small number of specific areas of study
(transformational leadership by Hinkin and Tracey and LMX by Borchgrevink
and colleagues and by Testa) hospitality leadership studies do not currently
provide the critical mass of knowledge for such a progressive, augmentative
process to occur (i.e. as yet there is little evidence of a holistic or inter-linked
theoretical framework).
3. Pittaway et al.’s attempt to provide a research agenda for the field does not
provide an agenda based on such an augmentative approach because of the
ontological, rather than applied (or theoretical), basis of their taxonomy.
4. In the absence of a holistic or inter-linked theoretical framework, how should
hospitality leadership studies progress as a field of applied research?
5. How can the findings of this review inform the selection of the theoretical
approach for this current work?
Points (questions) 4 and 5 above articulate the two main strands to emerge from
the review of hospitality leadership studies. The first strand (#4) relates to the
99
wider context of hospitality leadership studies and how this area can be
progressed; the second strand (#5) is specific to this current research. These
strands are closely related insofar as adopting transformational leadership
concepts as a theoretical orientation is the common recommended response to
both.
For hospitality leadership studies, transformational leadership (TL) offers the
greatest potential as a theoretical perspective which can assist in generating a
critical mass of cohesive understanding. There are four key reasons for this:
1. contribution to hospitality leadership studies: TL is the leadership theory
which has most frequently been utilised in hospitality leadership studies –
thus providing the largest theoretical and empirical base upon which to build
an augmentative tradition of hospitality leadership research;
2. context applicability: its applicability to a wide range of sectoral contexts,
including hospitality, has been empirically validated by a large number of
studies (Antonakis et al. 2003);
3. accommodation of the full range of leader behaviours: TL conceptualises both
transformational and transactional leader behaviours; and
4. capacity to address key hospitality management issues: this last point is
elaborated in greater detail immediately below.
Transformational leadership - in particular as measured by the Full Range
Leadership Model (see Section 2.4.3) – has the capacity to address a key
management issues in hospitality – that of job performance for service quality.
Specifically, hospitality services are typified by Zeithaml and Bitner’s (1996: 19)
simultaneous nature of production and consumption found in services provision.
This ‘inseparability’ of production and consumption means that service delivery
staff have a critical role in determining service quality through their job
performance and stresses the importance of human resource management in the
hospitality sector (Go et al. 1996: 5).
Reflecting this key staff role in service delivery, Go et al. (1996) proceed to
observe that many organisations with hospitality service functions rely on
“…employees to implement improved service delivery processes” (1996: 1).
However, hospitality service staff are often employed in jobs that offer relatively
low pay, long and unsociable hours, poor levels of job stability and a lack of
promotional opportunities (Hesselink et al. 2004: 11; Wildes 2007: 5-6; Wong
100
and Ko 2009: 195) and there is evidence that factors such as these negatively
affect employees’ motivation levels (Kivela and Go 1996).
An important dimension of the transformational leadership model is that of
Inspirational Motivation (IM) which describes the capacity of transformational
leaders to inspire, motivate and provide and shape meaning for employees by
emphasising priorities, purpose and a vision for goal achievement (Avolio et al.
1991; Bass 1999). For service staff experiencing challenging employment
characteristics such as those described above, the presence and influence of an
inspirational leader who can provide or enhance work meaning, motivate them to
perform well and increase their levels of job satisfaction may be welcomed.
The potential importance of the inspirational motivational dimension of leadership
for enhancing service staff experience of their jobs is captured by the sentiments
of Keegan, who, with reference to improving jobs through redesign, enrichment or
automation, writes that:
...it is my belief, (...) that most of the jobs in the hospitality industry
do not lend themselves to such improvements. The challenge for us is
not so much to change the job, but to provide the managerial
leadership that would create an environment in which the employee’s
real needs are satisfied.
(1983: 92-93)
The current research aims to evaluate the extent to which motivational leadership
(based on the IM component of transformational leadership theory) contributes to
hospitality catering employees’ levels of work motivation (measured as attitudes
to work and job performance). In a wider hospitality context, there is the
potential for hospitality researchers to use the transformational leadership
conceptual framework to examine a wide range of specific job performance and
motivational research questions. In this way, the agenda is set for hospitality
researchers to generate new understandings of how employee work motivation
can be enhanced at attitudinal and behavioural levels. For hospitality
organisations, enhanced employee work motivation and improved job
performance can bring positive benefits in terms of improved customer service.
101
4 DEVELOPING THE THEORETICAL FRAMEWORK
Chapters 2 and 3 have identified a number of relevant motivation-related
variables. Antecedents of work motivation include:
the Inspirational Motivation (IM) dimension of the Full-Range Leadership
Model (FRLM) (Bass 1985: 214; 1999: 19-20; Avolio and Bass 2004a: 28);
emerging from the mid-20th Century humanistic tradition of
organisational/leadership studies, Work Values (WV) may influence
employees’ work attitudes (Section 2.3.2); and
following Kerr and Schriesheim’s (1974) review of situational moderator
variables, ‘degree of autonomy’ is linked with Employee Empowerment (EM)
and empowerment has featured in a number of hospitality leadership studies
(Sparrowe 1994; Chiang and Jang 2008; Clark et al. 2009; Gill et al. 2010)
Social Support (SS) can be a positive factor for hospitality employees
(Borchgrevink and Boster 1994; Ross and Boles 1994; Lee-Ross 1998b;
Susskind et al. 2000a)
Motivation-related outcome variables identified are:
the Extra Effort (EE) dimension suggests a useful behavioural (job
performance) measure of work motivation (Avolio and Bass 2004a: 98);
Work Meaning (ME) is an attitude-based work motivation outcome of
transformational leadership (Avolio and Bass 2004a: 96) and is proposed
above as a partial mediator of motivational leadership’s effect on job
performance;
Job Satisfaction (JS) is a frequently utilised attitudinal variable in hospitality
leadership studies (see e.g. Borchgrevink and Boster 1994; Sparrowe 1994;
Borchgrevink and Boster 1997; Testa 2004; Erkutlu 2008; Tsai 2008);
Organisational Commitment (OC) is a attitudinal outcome variable
associated with motivated employees (Erkutlu 2008; Cichy et al. 2009; Kim, B.
et al. 2010); and
Service Quality (SQ) has been identified as a core positive organisational
outcome for hospitality organisations (Go et al. 1996: 1; Hartline and Ferrell
1996: 52-53).
Each of the variables found in the sources above has been measured as a latent
(existing but not manifest) construct. Because concepts such as, for example,
work meaning or organisational commitment are typically not amenable to
accurate measurement using just one variable, researchers have employed a
102
range of indicator, or manifest, variables to ‘construct’ these latent variables.
Structural equation modelling (SEM) has been chosen as the data analytical
method for this research owing to its capacity to both (i) measure latent
constructs using a range of indicator variables and (ii) evaluate the relationships
between latent constructs. In SEM parlance, these two processes are referred to
as (i) the measurement model and (ii) the structural model.
To proceed with the measurement model it is necessary to identify and select a
range of indicator variables for each latent construct. This process is described in
Chapter 5 where a range of relevant organisational research studies (both
hospitality-specific and more general) are examined to identify precedents for
measuring these constructs.
Regarding the structural relations modelling dimension: prior to measuring the
relationships between latent constructs, it is necessary to specify, based on
theory, the hypothesised linkages between the various constructs. While it is
possible to look to the generic and hospitality-specific leadership literatures to
develop some hypotheses (e.g. motivational leadership may be a predictor of
both work meaning and extra effort/motivation) many of the constructs of
interest are not specific to leadership. All of the identified constructs are,
however, related to employee motivation and, accordingly, attention is now
turned to the generic and applied (hospitality) work motivation literature to
ensure that the research takes account of, and can be informed by, those bodies
of research knowledge.
This chapter firstly provides (Section 4.1) an overview of the generic work
motivation research to identify a theory-based organising framework to inform
the development of research hypotheses linking the latent variables. This review
finds that the field of work motivation does not operate under a unifying
theoretical framework (see e.g. Ambrose and Kulik 1999: 280; Mitchell and
Daniels 2002: 227), but that there are a variety of contrasting theories and
research approaches. As a consequence, the chapter goes on (in Section 4.2) to
briefly examine the overarching field of industrial and organisational (I/O)
psychology. At this level it is possible to identify an organising framework which
is capable of both (a) satisfactorily accommodating the range of identified latent
variables and (b) providing insights regarding the likely causal relations between
them.
103
The final section (4.3) of the chapter reviews the applied hospitality motivation
literature to:
(i) establish the scope of the existing research in this area;
(ii) identify any additional relevant variables for inclusion in the study;
(iii) identify precedents for measuring the selected latent variables;
(iv) help inform the development of hypotheses for the survey research.
Chapter 5 goes on to systematically describe the development of measures for
each of the latent variables.
4.1 Work motivation research
Like leadership, work motivation research has a long history within the social
sciences: it has been studied (mainly by work/organisational psychologists) since
around the 1930s (Locke and Latham 2004) and, also in common with leadership,
owing to its complex, multidimensional nature, motivation has proved difficult to
define.
More recent attempt to define the concept have focused on internal and external
forces shaping work motivation. Pinder (1984, 1998), for example, drew upon a
number of earlier works to develop the following definition:
Work motivation is a set of energetic forces that originate both within
as well as beyond an individual’s being, to initiate work-related
behavior, and to determine its form, direction, intensity, and duration
(Pinder 1984: 8; and see also Pinder 1998)
Ambrose and Kulik (1999: 231) examine this definition and describe (i)
organizational reward systems and the nature of the work being performed as
examples of Pinder’s external forces and (ii) individual needs and motives as
examples of internal forces. Elsewhere, Locke and Latham (2004: 388) provide a
similar definition to Pinder’s, describing internal forces that “impel action” and
external factors that “can act as inducements to action”. Moynihan and Pandey
(2007: 804) describe the multidimensional nature of work motivation in terms of
employee interaction with, and understanding of, their organisation. Once again
it is possible to see the internal (employee understanding) and external
(employee interaction) dichotomy within Moynihan and Pandey’s perspective.
104
Significant reviews of organisational psychology research into work motivation
published during the last three decades include Korman et al. (1977), Pinder
(1984) and Latham and Pinder (2005).
In the first of these reviews, Korman et al. (1977) described four theoretical
frameworks in use in work motivation research during the 1960s and early 1970s.
Specifically, they described: (i) the needs-hierarchy model following the work of
Maslow (1954); (ii) the expectancy-value (EV) framework originally popularised
by Vroom (1964; also informing House's 1971 path-goal theory of leadership);
(iii) equity theory (proposing that equitable outcomes are more satisfying than
inequitable ones, see e.g. Adams 1963); and (iv) self esteem consistency
approaches (which relate performance/outcomes to levels of individuals' self
esteem; see Korman 1974).
In comparison with Korman et al., Pinder’s (1984) review encompassed a wider
range of discrete theories and placed specific work motivation theories within a
four-fold classification. The classification described (i) needs theories, (ii)
cognitive theories, (iii) behaviourist theories and (iv) work/job design theories.
These categories are described briefly below.
Needs theories such as those developed by Maslow (1954), McClelland (1961),
Herzberg (1966) and Alderfer (1969) are concerned with employees’ motives and
needs; such theories can also be described as intrinsic motivation theories.
Needs theories are based around how peoples’ needs motivate them to act in
ways which will satisfy these needs. Different people have different needs and
the same people will have different needs at different times and in different
contexts (such as at work). Writing in 1999, Ambrose and Kulik (1999: 233)
described how research interest in needs theories had reached its peak during the
late 1970s and early 1980s.
The cognitive theories of work motivation assume that people’s beliefs,
attitudes and intentions are the ultimate determinants of their behaviour. Locke
and Latham (1984) describe these cognitive theories as being broadly made of:
(i) equity theories; (ii) expectancy; and (iii) goal-setting theory. Each of these
are described in greater detail below.
The behaviourist approach does not assume the existence of needs, nor the
influence of invisible internal cognitive factors. Pinder (1984: 16) describes how
105
the behaviourists’ reject notions of motivation and argue instead that behaviour is
determined by its consequences with people learning from their experiences.
Lastly, job or work design theories such as Hackman and Oldham’s Job
Characteristics Model (Hackman and Oldham 1975, 1976, 1980) which focus on
characteristics of people’s jobs (such as skill variety, task identity, task
significance, feedback, and autonomy), how these interact with employees’
psychological states and the relationships with consequent individual (e.g.
motivation, job satisfaction) and organizational outcomes.
Most recently, Latham and Pinder’s (2005) Dawn of the Twenty-First Century
review provides a detailed analysis of the field and concludes that the social
cognitive, goal-setting and organisational justice theories currently dominate the
field of work motivation. With reference to the theories described in Korman et
al.’s (1977) review, Latham and Pinder (2005: 506) write that: expectancy theory
has been supplanted with goal-setting and social cognitive theories; and equity
theory has given way to organisational justice (noting that social cognitive and
organisational justice theories have emerged subsequent to Korman et al. al’s
1977 review).
Latham and Pinder go on to describe the later 20th century research having
focused on cognition while, in more recent years, attention has turned more
towards affect (emotion) and behaviour (and on how these interact with
cognition). Latham and Pinder’s findings also note how work motivation research
in general had expanded to encompass the study of a wide range of antecedents
and consequents3 and also to take greater account of contextual factors including
(inter)national contexts (which contrast with the previous North American focus of
work motivation research). Descriptions of the social cognitive, goal-setting and
organisational justice theories are provided below.
Social-cognitive theory (SCT) was developed largely by Albert Bandura
(Bandura 1977) following on from earlier work social learning theories emanating
from that of Miller and Dollard (1941) which focused on the ways in which people
learn socially, i.e. from each other (Ten Eyck 2007). Bandura’s theory
emphasises the role of cognitive variables (such as an individual’s knowledge,
3 This point reflects Ambrose and Kulik’s (1999) conclusions relating to the
‘abandonment’ of motivation as researchers focus on increasingly specific aspects of
employee behaviour related to motivation (details below in Section 4.1.1).
106
expectations and attitudes) in mediating the relationships between environmental
phenomena (e.g, in a workplace context, organisational structures, norms and
processes) and their behavioural outcomes (such as skills and self-efficacy leading
to task-achievement). The concept of self-efficacy is centrally-placed: Bandura
defined self-efficiacy as the (individual’s) ‘beliefs in one’s capabilities to organize
and execute the courses of action required to produce given attainments’’ (1997:
3). In a work motivation context, because SCT postulates that cognitive variables
have a significant mediating role in the relationship between organisational factors
and behavioural outcomes (e.g. task achievement) this opens the way for
interventions such as learning and training to modify cognitive variables and thus
enhance behavioural outcomes.
The social dimension of SCT refers to the role of learning in a social context – that
is, the way in which individuals learn from each other (through observation). It is
possible to relate the Full-Range Leadership Model (FRLM) of transformational
leadership to social learning concepts through the Idealised Influence dimension –
in particular the IIB (Idealised Influence – Behavioural) where the leader “...sets
an example to be followed, sets high standards of performance, and shows
determination and confidence” (Bass 1999: 11).
Goal-setting theory belong in the general class of cognitive theories and centres
on understanding how work goals can influence employees’ motivation and
performance. Locke (1976) discusses four ways in which goals can influence
employee performance:
directing attention and effort in a specific direction;
providing an impetus to increase effort;
providing an impetus for employees to maintain their effort over time;
stimulating employees to develop strategies for goal attainment.
Millward (2005: 208) notes that a key dimension underpinning the effectiveness
of goal setting as a motivation technique is that specific goals that ‘focus on
achieving something finite and manageable, with tangible consequences’ is
typically more effective than the more nebulous ‘do the best you can’ approach.
Variables that can predict and mediate motivation and performance include: (i)
the nature of goal setting (assigned versus participatively set goals) and
employee commitment to goals (positively influenced by participative goal setting
and individuals’ agreement with the nature of the goals) (Latham and Pinder
107
2005: 496-497); (ii) positive leader feedback on goal completion (assisting in
clarifying expectations, modifying goal difficulty and allowing a means for
employees to gain recognition for their efforts) (Jex and Britt 2008: 247); (iii)
goal complexity (related to the attainability of the goal – organisations/leaders
should account for greater challenge by allowing more time for goal completion
and/or providing training) (Locke and Latham 1990); and employee perceptions
of self-efficacy / competence (Williams and Lillibridge 1992: 169-170; Latham and
Pinder 2005: 496-497).
Latham and Pinder’s third dominant area - organisational justice theory -
stems from another branch of the cognitive group, equity theory. Equity Theory
is a form of social exchange theory concerned with people’s perceptions of
fairness in social exchanges (Adams 1965). In a workplace context, equity theory
proposes that as employees deliver a range of inputs for their employer (e.g. an
individual’s time, skills, effort, prior and current education and training) then they
also consider the ratio of inputs to outputs (i.e. outputs accruing to the employee)
such as pay, benefits, leave entitlement, pension arrangements etc. – supervisor
feedback has also been identified as a salient output in the context of leadership
and equity theory (e.g. Sparr and Sonnentag 2008). Fairness or equity can be
evaluated relative to a number of criteria such as outputs accrued by other
members of the same organisation, members of other organisations in similar
roles or peers with similar qualifications. Where an individual is not satisfied with
their perceived input-output balance then they may attempt to increase the level
of outputs they receive or reduce levels of their own inputs.
Organizational justice theory draws upon equity theory and contains several
strands: distributive justice relating to the comparative input-output assessment
described above; procedural justice is based on the premise that fair procedures
and processes within the organisation contribute positively to employee
acceptance of outcomes and have a positive influence on employee work
motivation; and interactional justice concerns employee perceptions of fair
treatment, dignity and respect in specific interpersonal interactions (Jex and Britt
2008: 243)
Latham and Pinder (2005: 505) write that organizational justice is significant not
only in work motivation terms but also in the leadership context – specifically,
leaders should be perceived as being fair with regard to outcomes and processes.
108
Where employees feel unfairly treated they can respond affectively, for example,
by demonstrating reduced organisational commitment and/or behaviourally e.g.
finding employment elsewhere.
Although Latham and Pinder found that expectancy theory (see Section 2.3.3)
has largely been replaced in motivation studies by goal-setting and social-
cognitive theories, it is interesting to note how the themes of goals and leadership
run through the various theories from expectancy theories of work motivation
(Georgopoulos et al. 1957; Vroom 1964), to path-goal leadership theory (House
1971; House and Mitchell 1974) and more recently into transformational
leadership theory (Bass and Riggio 2006).
Section 2.3.3 introduced the expectancy / valence-instrumentality-expectancy
(VIE) theories of motivation and described how work motivation can be viewed as
a product of (i) an individual’s perception of the likelihood of achieving a goal
based on a particular degree of effort and (ii) the desirability of that outcome.
Path-goal leadership theory essentially focuses on the leader’s role in modifying
these perceptions and beliefs (Yukl 2010: 169) and a key leader behaviour for the
positive modification of employee perceptions and beliefs is clarifying the
method/s of achieving the goals – i.e. clarifying the path to the goal. Elsewhere,
Jex and Britt (2008: 316) describe how the leader behaving in the directive
paradigm “...focuses on making sure that subordinates know what they are
supposed to be doing, and perhaps clarifying task responsibilities”.
These goal- and effort-focused characteristics of the expectancy (motivation) and
path-goal (leadership) theories can be seen as reflecting the goal-related
Inspirational Motivation (IM) dimension of the Full-Range Leadership Model
(FRLM) which describes how leaders: (i) talk optimistically about the future; (ii)
talk enthusiastically about what needs to be accomplished; (iii) articulate a
compelling vision of the future; and (iv) express confidence that goals will be
achieved (Avolio and Bass 2004a: 96).
Two discrete theories of work motivation which have not yet been discussed are
Hackman and Oldham’s Job Characteristics Theory (Hackman and Oldham 1976,
1980) and Herzberg’s (1966; 1968) Two-Factor / Motivation-Hygeine Theory.
These theories are essentially needs-based theories but are set apart from many
other approaches to understanding work motivation in that these were developed
109
specifically for the workplace context rather than being general theories of
motivation applied to the work context (Jex and Britt 2008: 235, 256). These
theories will be discussed in Section 4.3.1 where the identifed hospitality
motivation studies are introduced.
4.1.1 Making sense of work motivation
The three reviews of work motivation covered here (Korman et al. 1977; Pinder
1984; and Latham and Pinder 2005) highlight the variety of differing
conceptualisations that have been employed in the work motivation field. Since
the application of Maslow’s needs-hierarchy to work contexts and the wide-
ranging implementation of Vroom’s (1964) expectancy-value meta-theory, work
motivation theory has tended to focus on more specific areas. Ambrose and Kulik
(1999) have gone as far as to describe this as the ‘abandonment’ of the use of
motivation:
Organizational behavior research has largely abandoned the concept of
“motivation” and has replaced this broad concept with more specific
measures of employee behavior... Research on motivation during the
1990s was largely done through the “back-door.”
(Ambrose and Kulik 1999: 278)
The wide range of theoretical approaches which have been employed by
researchers to understand work motivation make it difficult, or even impossible,
to reconcile these into a unified theoretical framework and – indeed - there is
neither an “agreed-upon integrative theory of motivation” nor a “universally
accepted way of presenting the various approaches to motivation” (Mitchell and
Daniels 2002: 227). Because work motivation research is located within the
’parental’ discipline of I/O (Industrial and Organisational) Psychology (see e.g.
Borman et al. 2003; Millward 2005; Jex and Britt 2008) and more specifically
within the area of Organisational Behaviour (OB) (Alliger 1992: 9), the chapter
turns now to examine the I/O Psychology and Organisational Behaviour fields to
seek insights in order to formulate an organising framework to help inform the
development of specific hypotheses for the research design.
110
4.2 I/O Psychology and Organisational Behaviour
Work motivation research is located within the broader framework of industrial
and organisational (I/O) psychology - also referred to in Europe as work and
organisational (W/O) psychology (Salgado 2006). Huelsman (2007) describes the
two strands, industrial and organisational, as being distinctive but with a
considerable overlap.
Industrial psychology – also known as personnel psychology - predates
organisational psychology and to an extent focuses on people- /individual-related
themes rather than wider organisational issues. For example, Huelsman (2007)
describes four major themes in industrial psychology as being: (i) job analysis –
characterising a specific job towards identifying the best-suited individual for that
job; (ii) prediction and selection – identifying best-suited individuals by means of
a range of assessment techniques; (iii) performance criteria and appraisal –
developing criteria and criterion measurement methods for employees’
performance appraisal; and (iv) training – employees’ training needs,
organisational resources, training methods and evaluation of training.
Organisational psychology, on the other hand, is described by Aamodt (2010: 4)
as generally relating to broader organisational issues such as organisational
structures and processes and how these influence, and are influenced by,
employees’ attitudes, perceptions and behaviours. Elsewhere, Jex and Britt
(2008), however, differentiate organisational psychology (OP) from organisational
behaviour (OB). They define organisational psychology as:
...the scientific study of individual and group behavior in formal
organizational settings
(Jex and Britt 2008: 2)
Organisational behaviour, according to Jex and Britt (2008: 4, citing Moorhead
and Griffin 1998: 4), differs in that it moves beyond individual and group
behaviour to also examine the both the interface between humans and the
organisation and the organisation itself.
Hueselman (2007) offers an attractively simple conceptual framework for
organisational psychology where organisational outcomes can be regarded as a
function of psychological processes at individual, interpersonal, group and
111
environmental (organisational) levels. This framework can be summarised as
follows:
Organisational outcomes = f of psychological processes at different levels
(individual processes x interpersonal and group processes x environmental
processes).
Organisational outcomes include:
productive behaviours (job performance, organisational citizenship behaviour)
counterproductive behaviours (turnover, absenteeism)
attitudes (job satisfaction, organisational commitment)
Huelseman’s framework is problematic at the detailed level however. This is
because some variables are conceptualised in more than one way. For example:
motivation appears as a process in the overall framework (section headed
Individual Processes: Motivation) but within the Job-based approaches sub-
section (para. 2), motivation appears as a work (organisational) outcome;
secondly, Employee Attitudes are contained (alongside Productive and Counter-
Productive Organisational Behaviours) within the Organisational Outcomes
section, but then job satisfaction (one of the employee attitudes) is cited as a
causal factor for job performance.
The first of these difficulties has likely arisen because motivation can be
considered both as an outcome and as a process. In the second example, the
cause of confusion may be the capacity of some of variables to act as both
dependent (outcome) and independent (predictor) variables within the same
model. To exemplify this situation, Figure 4-2 illustrates the proposed
relationships described in Patiar and Mia (2009: 255) where non-financial
performance is hypothesised as being both a dependent variable (in relation to
transformational leadership and market competition) and an independent variable
(in relation to financial performance).
In a more generalised commentary, Millward (2005: 19-20) has noted that
difficulties such as these are inherent when trying to conceptualise, within a
coherent integrated frame, an area of study (organisational psychology) which is
recognised as being somewhat piecemeal and difficult to distil or integrate.
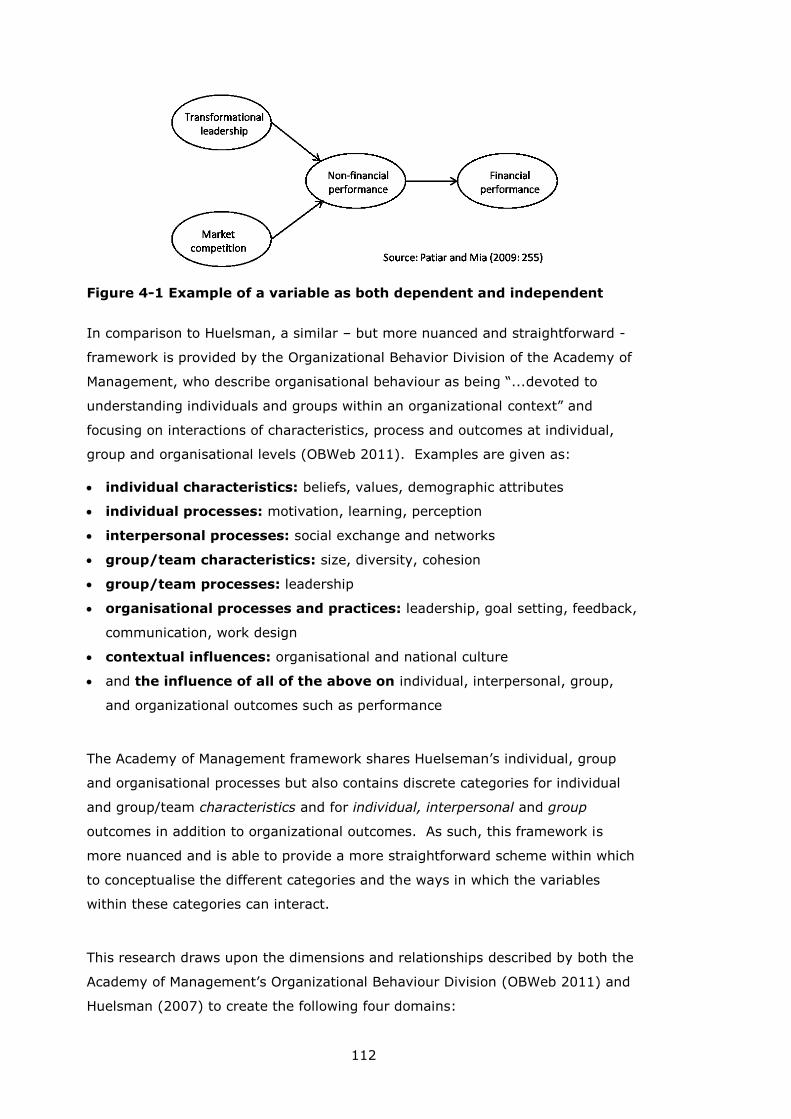
112
Figure 4-1 Example of a variable as both dependent and independent
In comparison to Huelsman, a similar – but more nuanced and straightforward -
framework is provided by the Organizational Behavior Division of the Academy of
Management, who describe organisational behaviour as being “...devoted to
understanding individuals and groups within an organizational context” and
focusing on interactions of characteristics, process and outcomes at individual,
group and organisational levels (OBWeb 2011). Examples are given as:
individual characteristics: beliefs, values, demographic attributes
individual processes: motivation, learning, perception
interpersonal processes: social exchange and networks
group/team characteristics: size, diversity, cohesion
group/team processes: leadership
organisational processes and practices: leadership, goal setting, feedback,
communication, work design
contextual influences: organisational and national culture
and the influence of all of the above on individual, interpersonal, group,
and organizational outcomes such as performance
The Academy of Management framework shares Huelseman’s individual, group
and organisational processes but also contains discrete categories for individual
and group/team characteristics and for individual, interpersonal and group
outcomes in addition to organizational outcomes. As such, this framework is
more nuanced and is able to provide a more straightforward scheme within which
to conceptualise the different categories and the ways in which the variables
within these categories can interact.
This research draws upon the dimensions and relationships described by both the
Academy of Management’s Organizational Behaviour Division (OBWeb 2011) and
Huelsman (2007) to create the following four domains:
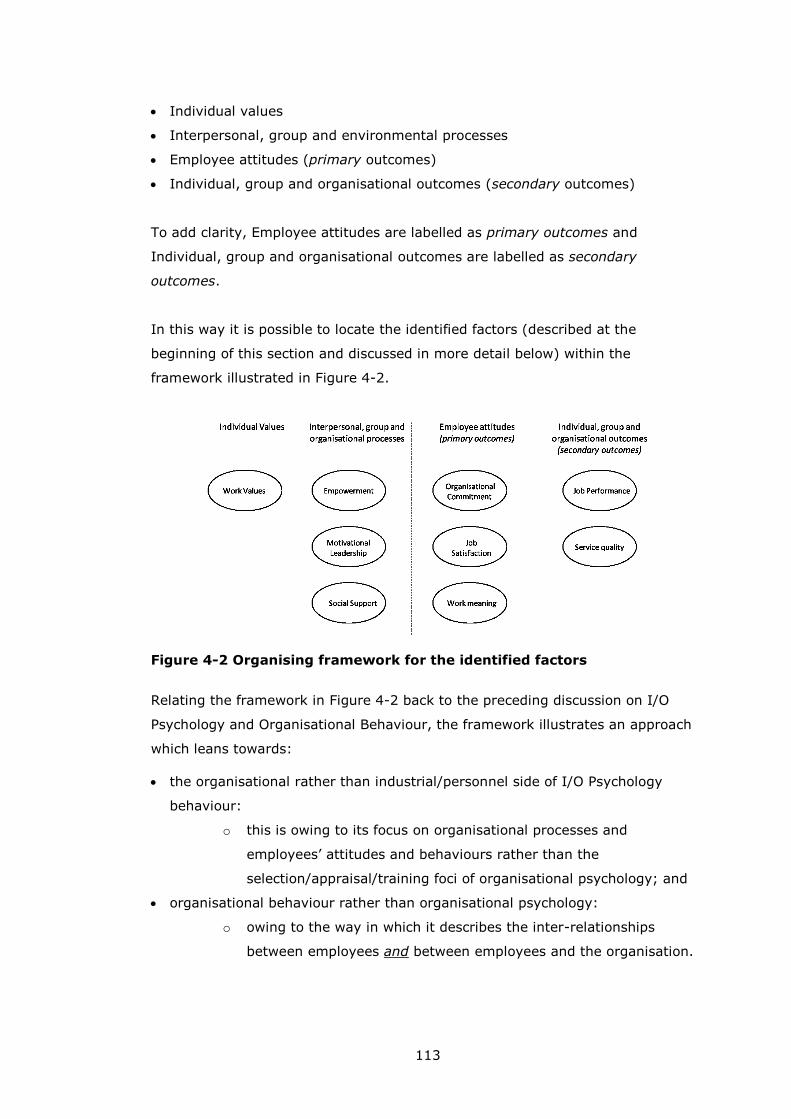
113
Individual values
Interpersonal, group and environmental processes
Employee attitudes (primary outcomes)
Individual, group and organisational outcomes (secondary outcomes)
To add clarity, Employee attitudes are labelled as primary outcomes and
Individual, group and organisational outcomes are labelled as secondary
outcomes.
In this way it is possible to locate the identified factors (described at the
beginning of this section and discussed in more detail below) within the
framework illustrated in Figure 4-2.
Figure 4-2 Organising framework for the identified factors
Relating the framework in Figure 4-2 back to the preceding discussion on I/O
Psychology and Organisational Behaviour, the framework illustrates an approach
which leans towards:
the organisational rather than industrial/personnel side of I/O Psychology
behaviour:
o this is owing to its focus on organisational processes and
employees’ attitudes and behaviours rather than the
selection/appraisal/training foci of organisational psychology; and
organisational behaviour rather than organisational psychology:
o owing to the way in which it describes the inter-relationships
between employees and between employees and the organisation.
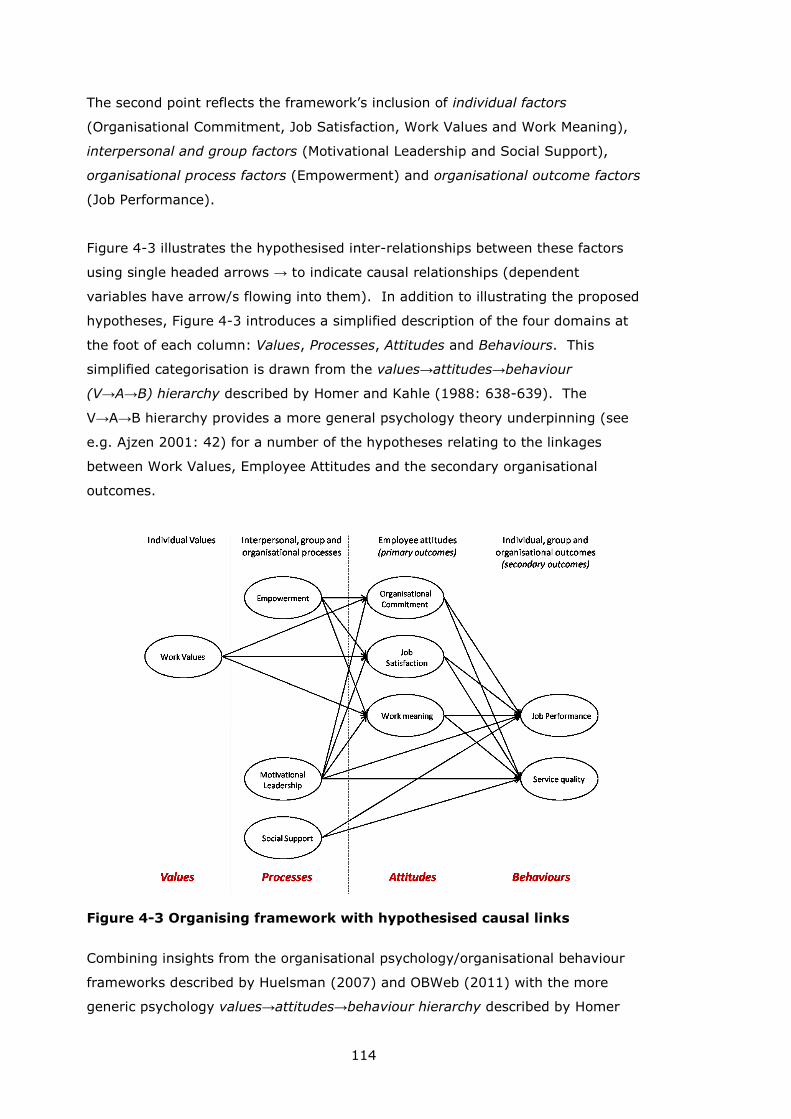
114
The second point reflects the framework’s inclusion of individual factors
(Organisational Commitment, Job Satisfaction, Work Values and Work Meaning),
interpersonal and group factors (Motivational Leadership and Social Support),
organisational process factors (Empowerment) and organisational outcome factors
(Job Performance).
Figure 4-3 illustrates the hypothesised inter-relationships between these factors
using single headed arrows → to indicate causal relationships (dependent
variables have arrow/s flowing into them). In addition to illustrating the proposed
hypotheses, Figure 4-3 introduces a simplified description of the four domains at
the foot of each column: Values, Processes, Attitudes and Behaviours. This
simplified categorisation is drawn from the values→attitudes→behaviour
(V→A→B) hierarchy described by Homer and Kahle (1988: 638-639). The
V→A→B hierarchy provides a more general psychology theory underpinning (see
e.g. Ajzen 2001: 42) for a number of the hypotheses relating to the linkages
between Work Values, Employee Attitudes and the secondary organisational
outcomes.
Figure 4-3 Organising framework with hypothesised causal links
Combining insights from the organisational psychology/organisational behaviour
frameworks described by Huelsman (2007) and OBWeb (2011) with the more
generic psychology values→attitudes→behaviour hierarchy described by Homer

115
and Kahle (1988) has provided the means to accommodate the identified factors
of interest within a categorised framework and to use the overarching
relationships between these categories to help inform the generation of the
hypotheses for this research.
These hypotheses can be summarised as follows:
Work Values, Motivational Leadership and Empowerment each predict an
increase in the three Employee Attitude variables (nine hypotheses in total)
the three Employee Attitude variables each predict an increase in Job
Performance and in Service Quality (six hypotheses in total)
both Motivational Leadership and Social Support directly predict increases in
Job Performance and in Service Quality (4 hypotheses in total)
Table 4-1 summarises each of these 19 hypotheses. The hypotheses are
variously informed by both empirical findings and/or theory in the reviewed
literature. Additionally, the values→attitudes→behaviour hierarchy lends support
to H1 to H3, H6 and H7, and H12 to H17.
Hypothesis
number
Description
1 Motivational Leadership → Job Performance
2 Motivational Leadership → Work Meaning
3 Work Meaning → Job Performance
4 Motivational Leadership → Job Satisfaction
5 Job Satisfaction → Job Performance
6 Motivational Leadership → Affective Organisational Commitment
7 Affective Organisational Commitment → Job Performance
8 Work Values → Organisational Commitment
9 Work Values → Job Satisfaction
10 Work Values → Work Meaning
11 Empowerment → Affective Organisational Commitment
12 Empowerment → Job Satisfaction
13 Empowerment → Work Meaning
14 Social Support → Job Performance
15 Social Support → Service Quality
16 Affective Organisational Commitment → Service Quality
17 Job Satisfaction → Service Quality
18 Work Meaning → Service Quality
19 Motivational Leadership → Service Quality
Table 4-1 Research hypotheses derived from the literature reviews of
generic and hospitality-specific leadership research
116
The empirical and theoretical foundations of the hypotheses are described
following the review of motivation research in hospitality studies which seeks,
among other things, to identify any additional relevant variables for inclusion in
the study and to further inform the development of the hypotheses for the survey
research.
Linkages with work motivation theory
Although the organising framework has been constructed at the overarching
industrial and organisational psychology level, it is worthwhile relating the current
research back the various work motivation theories described in Section 4.1 to
consider what linkages exist with the major theories of work motivation.
Needs theories: the current research does not relate to needs theories. For this
work, motivation is measured as individual (employee attitudes) and
organisational (job performance) outcomes. The measured antecedents of work
motivation are individual values and interpersonal, group and environmental
processes; individual needs as antecedents of motivation are not considered in
this research.
Cognitive theories: the Work Values factor embodies some aspects of the
cognitive theories tradition as it relates to employees’ values/beliefs.
Behaviourist approach: this is touched upon if we consider leader feedback (see
the Motivational Leadership factor) as a means of determining behaviour through
employees learning from their experiences.
Job or Work Design theories: job characteristics do feature in this research, being
manifest in three of the four antecedent factors (Empowerment, Motivational
Leadership and Social Support).
Social-cognitive theory: although not measured in this research, it is possible to
relate the Full-Range Leadership Model (FRLM) of transformational leadership to
social learning concepts through the Idealised Influence dimension – in particular
the IIB (Idealised Influence – Behavioural) where the leader “...sets an example
to be followed, sets high standards of performance, and shows determination and
confidence” (Bass 1999: 11).
Goal-setting theory: shares many themes with the expectancy theories of
motivation and the focus on goals can be seen running through from the
expectancy theories of motivation, path-goal leadership theory and on into the
117
inspirational motivational (IM) dimension of the Full-Range Leadership Model
(FRLM).
Another linkage with work motivation studies is revealed through the positioning
of both employee attitudes (column 3) and behaviours (column 4) as outcomes of
motivational leadership. Specifically, this reflects Ambrose and Kulik’s (1999:
232) description of how work motivation can be measured using both attitudinal
(e.g. job satisfaction) and behavioural (e.g. job performance) measures.
This short comparison shows that the research does relate somewhat (in varying
degrees) to core motivation theories. However, the lack of significant linkages
with the major work motivation theories reflects the fact that the organising
framework and the relationships that are being examined/explored are driven to a
greater degree by generic and hospitality-focused leadership studies.
Section 4.3 below goes on to review the applied hospitality motivation literature
to: (i) establish the scope of the existing research in this area; (ii) identify any
additional relevant variables for inclusion in the study; (iii) identify hospitality-
related precedents for measuring the selected latent variables; and (iv) further
inform the development of the hypotheses for the survey research.
4.3 Motivation research in hospitality studies
The earliest academic article discussing motivation in a hospitality context is that
of Nebel (1978). Published in The Cornell Hotel and Restaurant Administration
Quarterly, this paper titled Motivation, Leadership, and Employee Performance: A
Review is essentially descriptive and covers (i) motivation theory (describing
Herzberg’s, Maslow’s and Vroom’s theories), (ii) organisational management
approaches to motivation and productivity, and (iii) leadership and motivation
(Fiedler’s LPC model, House’s Path-Goal and a description of various leadership
styles from the behavioural tradition of leadership studies). The article does not,
however, provide any substantive analysis linking these concepts with hospitality
contexts. Perhaps it is for this reason that the article has received little attention
in the empirical studies that have been subsequently published – in fact, none of
the identified journal articles relating to either leadership or motivation issues in
hospitality organisations have cited that paper.
118
Simons’ (2003) review of hospitality motivation studies is significantly more useful
than Nebel’s – not least because the intervening 25 years hospitality researchers
had actually undertaken a number of motivation-related hospitality studies (Nebel
cited no hospitality-motivation studies and this review has not identified any such
research pre-dating the Nebel review).
Simons identified some 48 published hospitality articles describing empirical work
related to motivation either directly or tangentially. Studies that were
tangentially related to work motivation included articles describing: antecedents
of motivation such as incentives and service climate; outcomes of motivation such
as organisational commitment, job satisfaction, job performance; and counter-
productive behaviours such as employee turnover/intention to quit. Of these 48
identified studies, 17 are directly/primarily focused on motivation issues and draw
upon theories of work motivation. Of this 17, four were deemed not relevant to
this study as they focused on travel product sales (Bartkus et al. 1994; Bartkus et
al. 1997; Bartkus and Howell 1999) and hotel sales and marketing professionals
(Hawkins and Lee 1990). The remaining ten articles are discussed below.
The method used by Simons (see below) to structure his article - and thus,
perhaps also influencing the selection of keywords for the literature search - may
have contributed to the nature of the articles recovered. Specifically, to generate
an organising framework for his review, Simons used Mitchell’s (1997) summary
of generalisable findings to have emerged from the body of (generic) work
motivation studies. Mitchell (1997: 58) found that, in general, people are more
motivated in work situations where: (i) their needs are met; (ii) goals are set; (iii)
good performance is rewarded; (iv) there is fairness and equity; (v) jobs are
stimulating and engaging; (vi) hard-working friends and team members are
present; and (vii) there is an organisational culture of effort and commitment. It
may be that using these categories to guide a literature search has shaped
Simons’ review in such a way while that many of the articles deal with
antecedents and outcomes of motivation, fewer of the identified studies deal
specifically with work motivation processes and/or employ work- (or general-)
motivation theories.
Otherwise, that such a large proportion of the papers identified by Simons do not
have a primary focus on ‘core’ motivation issues (i.e. studies employing
constructs and/or theory drawn from the work motivation literature) may in part
119
reflect the ‘abandonment’ of motivation as a core concept in favour of more
specific measures of employee behaviour (Ambrose and Kulik 1999: 278).
4.3.1 Core articles from Simons’ review
Charles and Marshall (1993), Simons and Enz (1995), Siu et al. (1997) and Wong
et al. (1999) all employ a method of assessing the discrepancy between what
employees consider as important job characteristics and what those employees’
supervisors consider to important for those employees. This method is based
around a forced heirarchical ranking of ten job characteristics (Appreciation and
praise for work done; Higher wages; Feeling of being involved or in on things;
Interesting work; Good working conditions; Job security; Promotion in the
company; Supervisor's loyalty towards the worker; Tactful or considerate
disciplining; and Help or understanding with personal problems) which were
originally reported in Foreman Facts (Labor Relations Insitute 1946) and then
again by Lindahl (1949). Kovach reported results from the use of the same
method (1980; and 1987) and it is these studies that the hospitality articles have
drawn upon. The enduring theme of the original and follow-up studies has been
that monetary remuneration is not the most important job characteristic for many
segements of employees. Kovach (1987) found that ‘good wages’ is important for
younger emplyees, and those who are on lower wages. As remuneration levels
improve, employees typically report ‘interesting work’ and ‘full appreciation for
work done’ as being of high importance.
This technique - refered to as Kovach’s ten job-related factors by Siu et al. (1997:
45) – is essentially a needs-based approach, however the rationale for the
selection of the ten items is not discussed in either of Kovach’s articles (nor in any
of the hospitality articles). The authors of the hospitality articles using this
approach each draw conclusion based on a number of analyses where their
respective hierarchical rankings are examined to reveal differences based on a
number of demograhic and organisational-based independent variables.
Meudell and Rodham (1998) draw ‘loosely’ (p. 130) on both Kovach’s (1980; and
1987) work and on Herzberg’s two-factor theory in their study of factors that
motivate managers and employees of a licenced house operator in the UK. More
recently Lundberg et al. (2009) have also utilized Herzberg’s two-factor theory in
a hospitality motivation study.
120
Hezberg’s (1966) Two-Factor Theory of motivation belongs within the needs
group of motivation theories and resembles the Labor Relations
Institute/Lindahl/Kovach work insofar as it diminishes the influence of money as a
significant motivation in workplace contexts. Herzberg’s Two-Factor Theory (also
refered to as the Motivator-Hygiene Theory) posits that there are two sets of
needs-related factors affecting employees’ motivation; importantly, the theory
holds that these factors operate independetly of each other.
The first set - the hygiene factors – relates not to the work itself, to the conditions
surrounding/underpinning the job such as pay, promotional opportunities, inter-
personal relations, job security and non-salary benefits. When these factors are
regarded positively by employees, they do not specifically result in satisfied,
motivated employees. However, if some or all of these factors are regarded
negatively, then they can cause dissatisfaction/de-motivation.
The second set of factors – the motivators, or growth factors – includes variables
such as achievement, recognition, the work itself, responsibility, advancement
and growth. The positive presence of these motivators creates an increase in
satisfaction, but their absence does not neccessarily create dissatisfaction, simply
an absence of satisfaction.
Meudell and Rodham (1998) found that younger respondents (typically young,
18-24 years, itinerant ‘travelling’ bar workers) placed monetary and money-
related rewards highly in their hierarchy of motivators. This confirms Kovach’s
(1987) findings and draws attention to the role of employee age in the hospitality
sectors where many service staff are in the younger age categories (People 1st
2011a; 2011b describe this situaiton for the UK). Lundberg et al. (2009 nb -
published after Simons' review) in their study of seasonal workers at a Swedish
ski resort found support for Herzberg’s theory, with hygiene factors contributing
less to satisfaction than motivation/growth factors. Interestingly, however,
Lundberg’s findings are contrary to those of Meudell and Rodham with regard to
the importance of wages to younger employees. Specifically, Lundberg et al.
found that wage levels were less important as positive motivators to the migrant
workers, who were typically younger than the resident workers (average 25 years
vis-a-vis 29 years old). Lundberg et al. suggest that this might be the case as the
migrant workers feel compensated in some way for the lack of high wages
through having the opportunity to enjoy the social experience of meeting new
people during their time working at the resort.
121
The positive influence of hospitality employees’ job-related social
experiences/social interactions has been further highlighted (at least for some
groups of workers) by Lee-Ross (1995, 1998a, 1998b). Lee-Ross’s study used
Hackman and Oldham’s Job Characteristics Model (JCM) and the related Job
Diagnostic Survey (JDS – the survey instrument used to measure the constructs
articulated in the Job Characteristics Model) to examine the relationships between
job characteristics and the attitudes and behaviours of seasonal hotel workers in
UK hotels.
Hackmand and Oldham’s JCM posits that a number of Core Job Dimensions (skill
variety, task identity, task significance, autonomy and feedback) influence three
Critical Psychology States (experienced meaningfulness, experienced
responsibility and knowledge of results) which in turn influence a range of
employee attitudes and behaviours (work motivation, job performance, job
satisfaction, absenteeism and turnover) (Hackman and Oldham 1975).
Blancero and Johnson (1997) introduced the Discretionary Service Behaviour
(DSB) concept and further developed it in Blancero and Johnson (2001). The
DSB construct (latent variable / factor) is intended to conceptualise customer-
directed behaviours of customer contact service employees, on particular with
respect to the extent to which employees satisfy, or go beyond, the minimum
standards of service quality (to satisfy customers) that are established by
organisations (Blancero and Johnson 1997: 3). The original concept was related
to organisational justice with employee perceptions of both organisational support
and fairness positively influencing DSB. A related concept is organisational
citizenship behaviour (OCB) which is described by Organ (1988: 4) as
“...individual behavior that is discretionary, not directly or explicitly recognized by
the formal reward system, and that in the aggregate promotes the effective
functioning of the organization”. Blancero and Johnson (2001: 310, 312) note
that DSB has some similarities with OCB but can be differentiated based on DSB’s
external (customer) focus in contrast to OCB’s general intra-organisational focus.
Simons and Roberson (2003) went on to operationalise the DSB construct for
their study of employees’ justice perceptions and the influence of these on
organisational commitment, turnover intentions and discretionary service
behaviour. The original concept and Simons and Roberson’s empirical application
of the DSB construct are of particular relevance to this study for two reasons:
firstly, the construct has been specifically developed for application in service
settings (including hospitality) and, secondly, the DSB construct (as
122
operationalised by Simons and Robertson) provides a useful group-level job
performance outcome.
Accordingly, the DSB construct will be used in this research to measure extra
effort at the group level. In this way, including the DSB construct can help to
validate the findings of the study by providing a peer-assessment of job
performance to sit alongside the self-assessment provided by the Job
Performance construct. Details of the scale developed by Simons and Robertson
are discussed in greater detail in Section 5.4 below.
Of the two remaining articles reviewed by Simons that focused directly on
motivation, neither was particularly robust with regard to articulating the
theoretical grounding for their research designs.
Chitiris (1990) examined levels of work motivation among senior managers in
Greek hospitality organisations and also investigated the influence of a number of
demographic factors had on levels of motivation. The rationale for the focus on
demographic variables is developed from Roberstson and Smith (1985) and
reflects the internal forces from Pinder’s (1984: 8) internal/external definition of
work motivation. Chitiris found that age, education and length of current
employment had a small effect on motivaiton levels.
Upchurch et al. (2000) adopted a needs-based approach to evaluate the
perceived value of non-wage benefits and the importance of a range of internal
and external factors for Russian employees in a five star in St. Petersburg. The
non-wage benefits assessed were those provided by the organisation however no
rationale was provided regarding the selection of the internal and external factors
which were included in the survey. With significant foreign investment in the
Russian hospitality sector at the time, the authors sought to investigate whether
Russian workers had similar work-related needs to those observed in workers of
other nationalities. The study found that wages and other monetary-related
benefits (health care, free meal plans, life assurance and pension plans) were
most significant for motivating the employees of this hotel.
Summary of the core hospitality motivation studies
The review of motivation studies in hospitality settings has revealed a similar
pattern to that found for leadership studies in hospitality settings. Specifically,
123
different researchers (and research teams) have drawn upon different theories of
motivation and applied these to different organisational issues.
Of the 13 hospitality-specific articles identified by Simons that focus directly and
explicitly on motivation and employ theoretical approaches drawn from motivation
studies, six (Charles and Marshall 1993; Simons and Enz 1995; Siu et al. 1997;
Meudell and Rodham 1998; Wong et al. 1999; and Upchurch et al. 2000)
employed need-based approaches, three (Lee-Ross 1995, 1998a, 1998b)
employed Hackman and Oldham’s JCM, three utilised the service-specific
motivation- and performance-related construct of Discretionary Service Behaviour
(Blancero and Johnson 1997, 2001; and Simons and Roberson 2003) and one
(Chitiris 1990) was loosely structured around the standard internal/external
forces definition of work motivation.
Of the approaches and findings described above, two constructs are of particular
relevance for this work. Firstly, as discussed above, the DSB construct will be
used as a measure of group performance. Secondly, following its emergence
from the review of the leadership-related hospitality literature, the re-occurence
of social support as a significant variable in the motivation-related studies of both
Lundberg et al. (2009) and Lee-Ross (1995, 1998a, 1998b) reinforces the
rationale for the inclusion of this as a factor in current study. More details on the
social support factor are provided in Section 5.2 below.
The needs-based, forced hierarchical ranking approach based on Kovach (1980,
1987) and Lindahl (1949) is not relevant to this research because of the
leadership-centric focus of this study. That is, the focus of this research is on
evaluating the de facto contributors (see Figure 4-3) to job performance in
hospitality service work rather than evaluating employees’ desired job
characteristics.
Regarding Herzberg’s Two-Factor Theory, some elements of this are covered in
this research (on the Hygiene side: Supervision, Relationship with Supervisor,
Relationship with Peers; and on the Motivators/Growth side: Recognition,
Advancement and Satisfaction with Work Itself) however the inclusion of these
variables is informed primarily by leadership theory and the individual items which
are used to measure these variables are spread throughout the various factors
being employed in this research.
124
Hackman and Oldham’s JCM (Job Characterisitics Model) was also found not to be
appropriate for this research. It does not have a leadership element and, while
some of the Core Job Dimensions and the Experienced Meaningfulness construct
are of interest, the JDS (Job Diagnostic Survey) contains too many items to
practically complement the existing constructs that have been identifed for use in
this research. Put simply, at 13 pages in length, the JDS is too big!
Nevertheless, the JDS was examined to gain insights into ways of operationalising
the Work Meaning construct for this research. A critical examination of the
methods of measurement for the original Experienced Meaningfulness construct in
the Job Diagnostic Survey (Hackman and Oldham 1974) revealed, however, that
the original construct is somewhat lacking in substantive content. The
Experienced Meaningfulness of the Work construct is defined by Hackman and
Oldham as:
The degree to which the individual experiences the job as one which is
generally meaningful, valuable, and worthwhile
(Hackman and Oldham 1976: 256)
Experienced Meaningfulness is measured using the following two items in the Job
Diagnostic Survey (Hackman and Oldham 1974: 62):
Section 3 item 4: Most of the things I have to do on this job are useless
and trivial (reverse coding)
Section 3 item 7: The work I do on this job is very meaningful to me
The same statements are included again in Section 5 of the JDS but reworded to
evaluate how respondents believe their co-workers feel about their jobs.
Although the description of the construct in Hackman and Oldham (1976: 256)
talks about meaningful, valuable, and worthwhile, the items that operationalise
this construct simply use ‘meaningful’ in a somewhat unsubstantiated way, not
going any further than constrasting ‘meaningfulness’ with ‘useless and trivial’.
Accordingly, a further search for alternative methods of operationalising the Work
Meaning construct were performed, along with similar searches for ways of
measuring the other constructs in the survey. Chapter 5 describes the findings
from these searches.
Reflecting Simons’ (2003: 339) observation that hospitality researchers had
tended to draw on a relatively small pool of motivational concepts (and his
recommendation that hospitality scholars consider the broader scope of work
motivation research to gain a more holistic understanding of the field), the
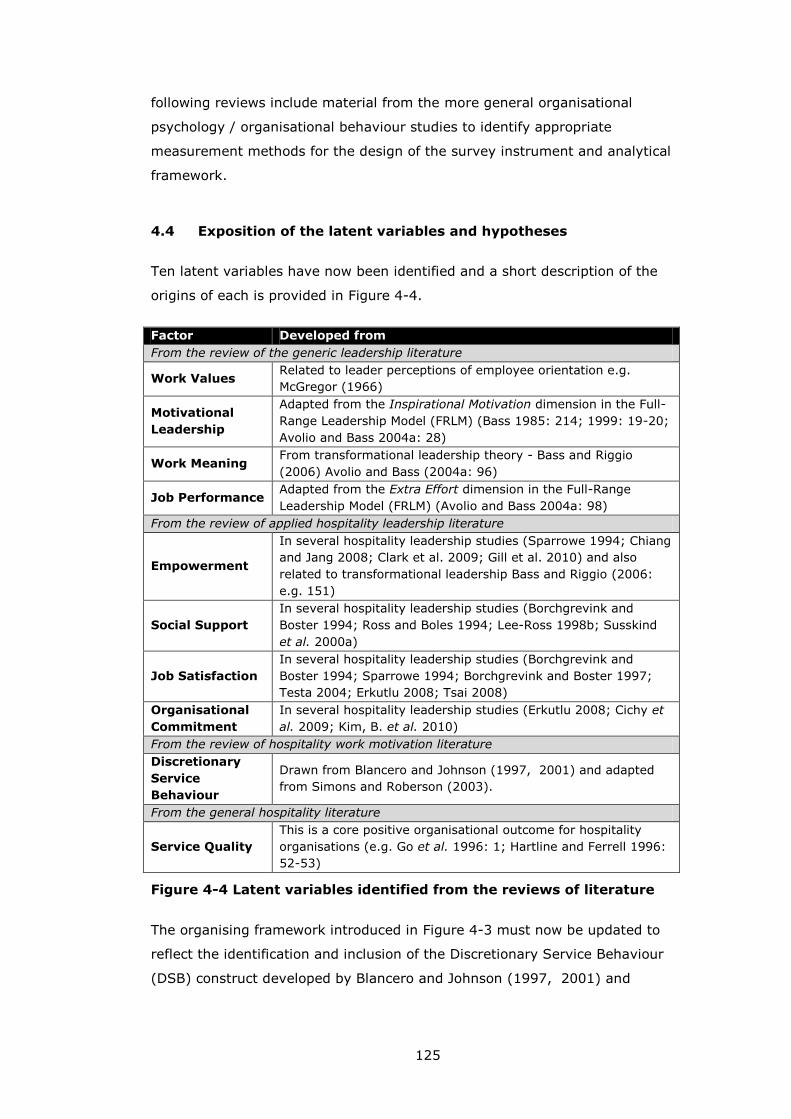
125
following reviews include material from the more general organisational
psychology / organisational behaviour studies to identify appropriate
measurement methods for the design of the survey instrument and analytical
framework.
4.4 Exposition of the latent variables and hypotheses
Ten latent variables have now been identified and a short description of the
origins of each is provided in Figure 4-4.
Factor Developed from
From the review of the generic leadership literature
Work Values Related to leader perceptions of employee orientation e.g.
McGregor (1966)
Motivational
Leadership
Adapted from the Inspirational Motivation dimension in the Full-
Range Leadership Model (FRLM) (Bass 1985: 214; 1999: 19-20;
Avolio and Bass 2004a: 28)
Work Meaning From transformational leadership theory - Bass and Riggio
(2006) Avolio and Bass (2004a: 96)
Job Performance Adapted from the Extra Effort dimension in the Full-Range
Leadership Model (FRLM) (Avolio and Bass 2004a: 98)
From the review of applied hospitality leadership literature
Empowerment
In several hospitality leadership studies (Sparrowe 1994; Chiang
and Jang 2008; Clark et al. 2009; Gill et al. 2010) and also
related to transformational leadership Bass and Riggio (2006:
e.g. 151)
Social Support
In several hospitality leadership studies (Borchgrevink and
Boster 1994; Ross and Boles 1994; Lee-Ross 1998b; Susskind
et al. 2000a)
Job Satisfaction
In several hospitality leadership studies (Borchgrevink and
Boster 1994; Sparrowe 1994; Borchgrevink and Boster 1997;
Testa 2004; Erkutlu 2008; Tsai 2008)
Organisational
Commitment
In several hospitality leadership studies (Erkutlu 2008; Cichy et
al. 2009; Kim, B. et al. 2010)
From the review of hospitality work motivation literature
Discretionary
Service
Behaviour
Drawn from Blancero and Johnson (1997, 2001) and adapted
from Simons and Roberson (2003).
From the general hospitality literature
Service Quality
This is a core positive organisational outcome for hospitality
organisations (e.g. Go et al. 1996: 1; Hartline and Ferrell 1996:
52-53)
Figure 4-4 Latent variables identified from the reviews of literature
The organising framework introduced in Figure 4-3 must now be updated to
reflect the identification and inclusion of the Discretionary Service Behaviour
(DSB) construct developed by Blancero and Johnson (1997, 2001) and
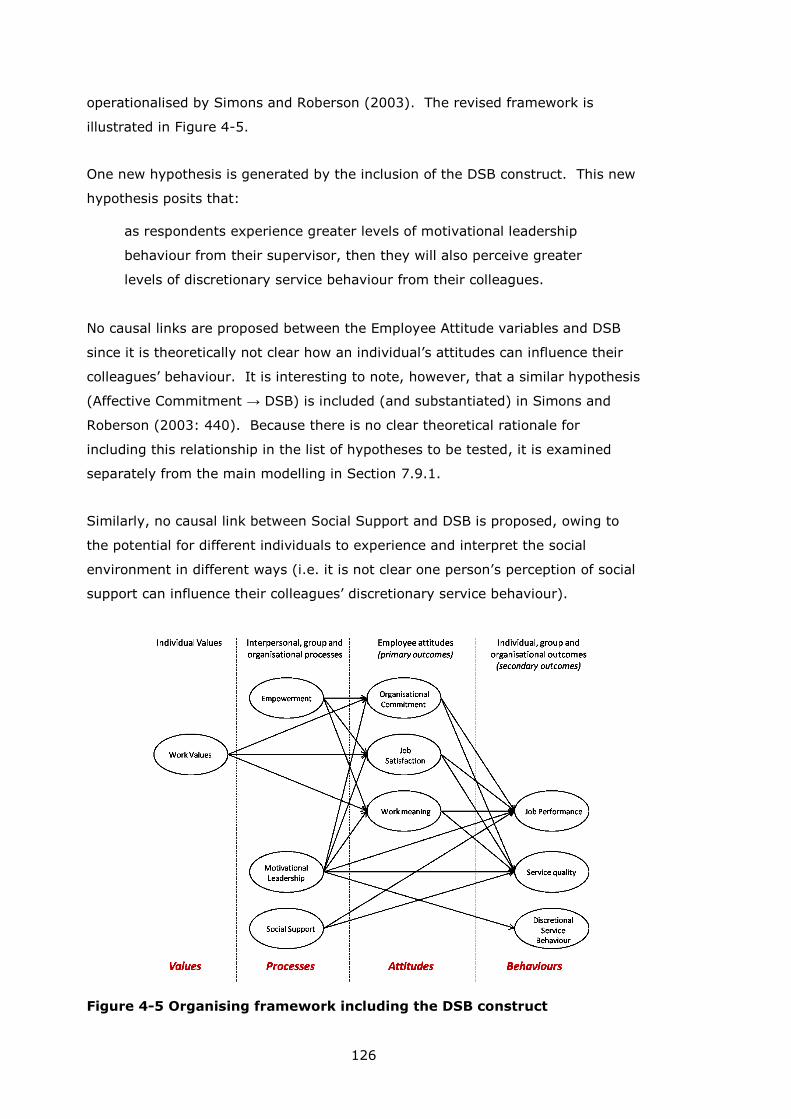
126
operationalised by Simons and Roberson (2003). The revised framework is
illustrated in Figure 4-5.
One new hypothesis is generated by the inclusion of the DSB construct. This new
hypothesis posits that:
as respondents experience greater levels of motivational leadership
behaviour from their supervisor, then they will also perceive greater
levels of discretionary service behaviour from their colleagues.
No causal links are proposed between the Employee Attitude variables and DSB
since it is theoretically not clear how an individual’s attitudes can influence their
colleagues’ behaviour. It is interesting to note, however, that a similar hypothesis
(Affective Commitment → DSB) is included (and substantiated) in Simons and
Roberson (2003: 440). Because there is no clear theoretical rationale for
including this relationship in the list of hypotheses to be tested, it is examined
separately from the main modelling in Section 7.9.1.
Similarly, no causal link between Social Support and DSB is proposed, owing to
the potential for different individuals to experience and interpret the social
environment in different ways (i.e. it is not clear one person’s perception of social
support can influence their colleagues’ discretionary service behaviour).
Figure 4-5 Organising framework including the DSB construct
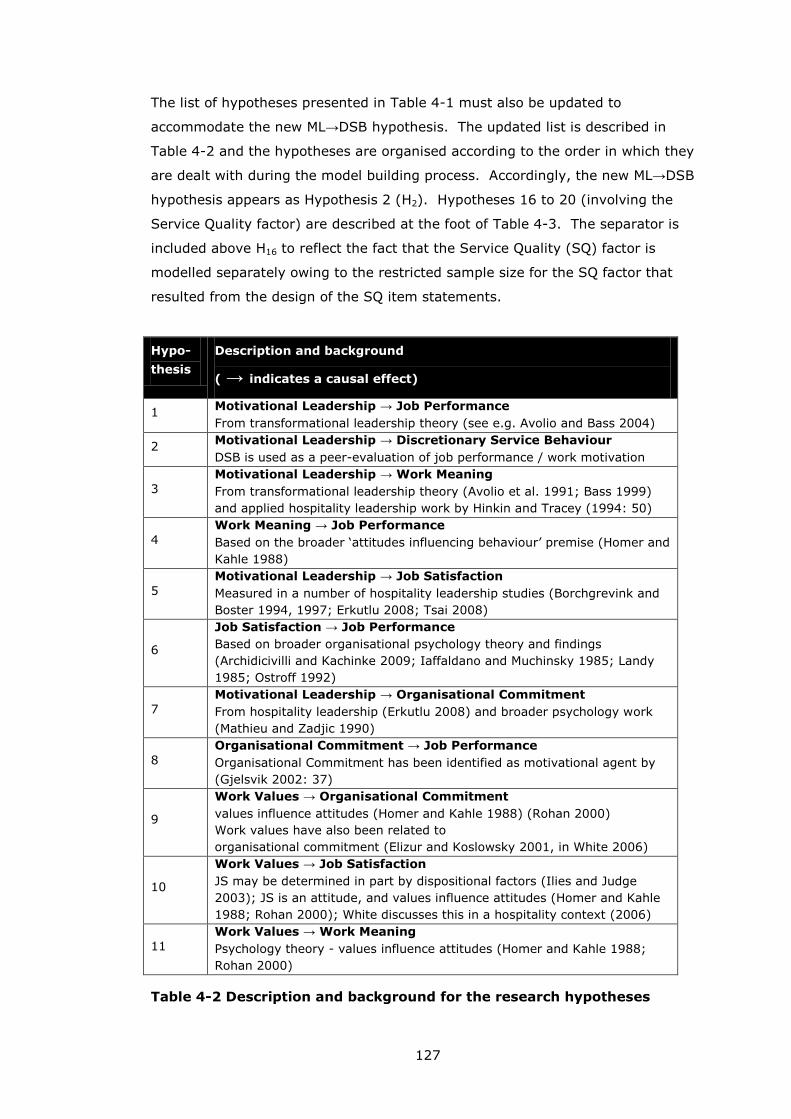
127
The list of hypotheses presented in Table 4-1 must also be updated to
accommodate the new ML→DSB hypothesis. The updated list is described in
Table 4-2 and the hypotheses are organised according to the order in which they
are dealt with during the model building process. Accordingly, the new ML→DSB
hypothesis appears as Hypothesis 2 (H2). Hypotheses 16 to 20 (involving the
Service Quality factor) are described at the foot of Table 4-3. The separator is
included above H16 to reflect the fact that the Service Quality (SQ) factor is
modelled separately owing to the restricted sample size for the SQ factor that
resulted from the design of the SQ item statements.
Hypo-
thesis
Description and background
( → indicates a causal effect)
1 Motivational Leadership → Job Performance
From transformational leadership theory (see e.g. Avolio and Bass 2004)
2 Motivational Leadership → Discretionary Service Behaviour
DSB is used as a peer-evaluation of job performance / work motivation
3
Motivational Leadership → Work Meaning
From transformational leadership theory (Avolio et al. 1991; Bass 1999)
and applied hospitality leadership work by Hinkin and Tracey (1994: 50)
4
Work Meaning → Job Performance
Based on the broader ‘attitudes influencing behaviour’ premise (Homer and
Kahle 1988)
5
Motivational Leadership → Job Satisfaction
Measured in a number of hospitality leadership studies (Borchgrevink and
Boster 1994, 1997; Erkutlu 2008; Tsai 2008)
6
Job Satisfaction → Job Performance
Based on broader organisational psychology theory and findings
(Archidicivilli and Kachinke 2009; Iaffaldano and Muchinsky 1985; Landy
1985; Ostroff 1992)
7
Motivational Leadership → Organisational Commitment
From hospitality leadership (Erkutlu 2008) and broader psychology work
(Mathieu and Zadjic 1990)
8
Organisational Commitment → Job Performance
Organisational Commitment has been identified as motivational agent by
(Gjelsvik 2002: 37)
9
Work Values → Organisational Commitment
values influence attitudes (Homer and Kahle 1988) (Rohan 2000)
Work values have also been related to
organisational commitment (Elizur and Koslowsky 2001, in White 2006)
10
Work Values → Job Satisfaction
JS may be determined in part by dispositional factors (Ilies and Judge
2003); JS is an attitude, and values influence attitudes (Homer and Kahle
1988; Rohan 2000); White discusses this in a hospitality context (2006)
11
Work Values → Work Meaning
Psychology theory - values influence attitudes (Homer and Kahle 1988;
Rohan 2000)
Table 4-2 Description and background for the research hypotheses
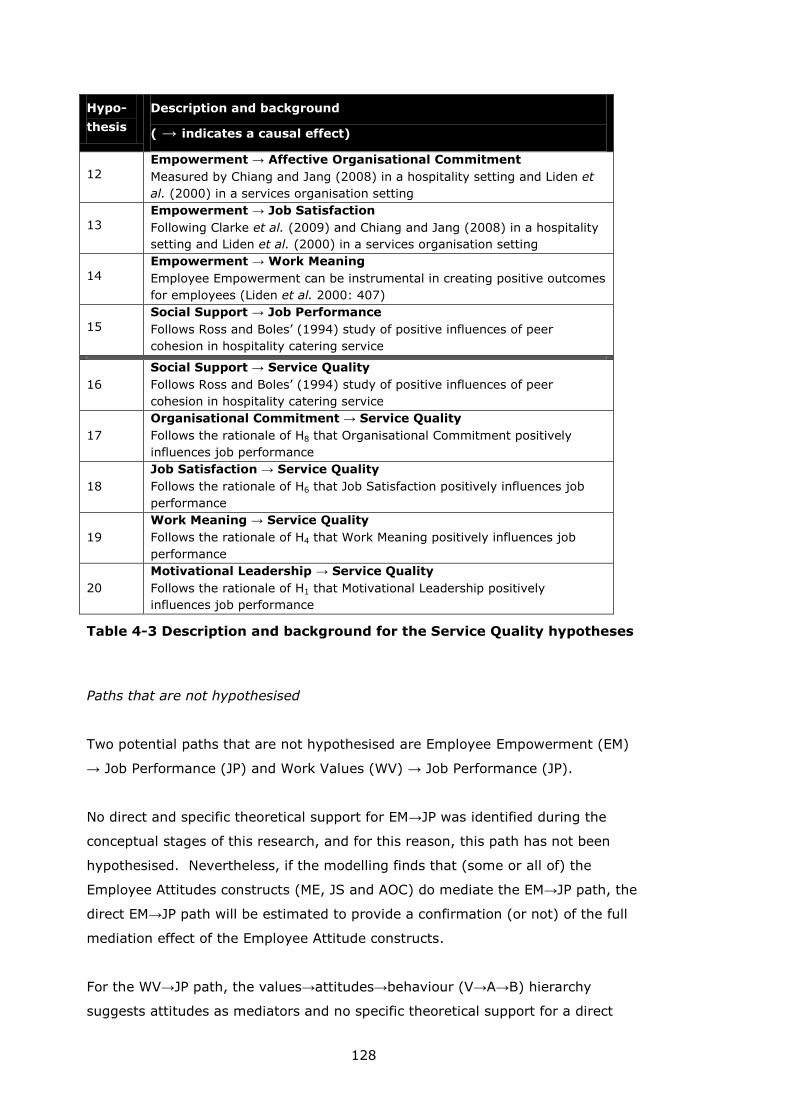
128
Hypo-
thesis
Description and background
( → indicates a causal effect)
12
Empowerment → Affective Organisational Commitment
Measured by Chiang and Jang (2008) in a hospitality setting and Liden et
al. (2000) in a services organisation setting
13
Empowerment → Job Satisfaction
Following Clarke et al. (2009) and Chiang and Jang (2008) in a hospitality
setting and Liden et al. (2000) in a services organisation setting
14
Empowerment → Work Meaning
Employee Empowerment can be instrumental in creating positive outcomes
for employees (Liden et al. 2000: 407)
15
Social Support → Job Performance
Follows Ross and Boles’ (1994) study of positive influences of peer
cohesion in hospitality catering service
16
Social Support → Service Quality
Follows Ross and Boles’ (1994) study of positive influences of peer
cohesion in hospitality catering service
17
Organisational Commitment → Service Quality
Follows the rationale of H8 that Organisational Commitment positively
influences job performance
18
Job Satisfaction → Service Quality
Follows the rationale of H6 that Job Satisfaction positively influences job
performance
19
Work Meaning → Service Quality
Follows the rationale of H4 that Work Meaning positively influences job
performance
20
Motivational Leadership → Service Quality
Follows the rationale of H1 that Motivational Leadership positively
influences job performance
Table 4-3 Description and background for the Service Quality hypotheses
Paths that are not hypothesised
Two potential paths that are not hypothesised are Employee Empowerment (EM)
→ Job Performance (JP) and Work Values (WV) → Job Performance (JP).
No direct and specific theoretical support for EM→JP was identified during the
conceptual stages of this research, and for this reason, this path has not been
hypothesised. Nevertheless, if the modelling finds that (some or all of) the
Employee Attitudes constructs (ME, JS and AOC) do mediate the EM→JP path, the
direct EM→JP path will be estimated to provide a confirmation (or not) of the full
mediation effect of the Employee Attitude constructs.
For the WV→JP path, the values→attitudes→behaviour (V→A→B) hierarchy
suggests attitudes as mediators and no specific theoretical support for a direct
129
values→behaviour path was found in the organisational psychology literature. Of
course, this is not to say that such a relationship cannot exist, therefore, based on
the same rationale described above for the EM→Employee Attitudes→JP path, in
the event that the model confirms the mediated WV→Employee Attitudes→JP
path, then the direct WV→JP path will be estimated to confirm (or refute) the full
mediation effect of the Employee Attitude variables in the hypothesised path.
Having identified the latent variables for inclusion in the study and developed the
research hypotheses to articulate the relationships between these latent
variables, the research goes on to (i) elaborate more fully the rationale for the
inclusion of each of the latent factors and (ii) identify / develop a theoretically
informed set of indicator variables for each of the latent factors.
130
5 MEASURING THE LATENT VARIABLES
Chapter 6 on methods describes the SEM (Structural Equation Modelling) process
of latent variable modelling in detail. Briefly, however, a latent variable is a
hypothesised variable (also referred as a factor or construct) which is not directly
observable, although its ‘presence’ can be revealed by using confirmatory factor
analysis (CFA) to measure the ‘effects’ of that latent variable on a number of
‘indicator variables’. This is achieved (in simple terms) by measuring the amount
of variance (a measure of dispersal around the mean) shared between the
indicator variables (while also accounting for the degree of unobserved - or error -
variance). Where there is a significantly large level of observed shared variance
(called covariance) between these indicator variables, the latent variable, or
factor, is considered to be ‘manifest’ by its effect on the indicator variables. Put
another way, the existence of substantial shared variance (covariance) between
the observable variables ‘indicates’ the (albeit abstract) existence of the factor.
For example, considering the indicator variables for the Inspirational Motivation
(IM) factor in the Full-Range Leadership Model (FRLM) (Avolio and Bass 2004a:
96). The Multifactor Leadership Questionnaire (MLQ) asks subordinate
respondents to rate their supervisor by responding to each of the following four
statements using a five point scale which is bounded by 0 = Not At All and 4 =
Frequently, If Not Always:
The person I am rating...
Talks optimistically about the future
Talks enthusiastically about what needs to be accomplished
Articulates a compelling vision of the future
Expresses confidence that goals will be achieved
The latent variable Inspirational Motivation is not directly observable since there is
no one dimension which can be used to measure it. However, theory (in this case
transformational leadership theory) proposes that where leaders demonstrate
high levels of Inspirational Motivation behaviour, then their subordinates will (a)
observe high frequencies of the four behaviours described in the statements and
(b) correspondingly, report high scores for each of the indicator variables.
Satisfactorily establishing the latent variables is the first stage in SEM analysis
and underpins the second (structural relations) stage where relationships between
latent variables are measured.
131
Unlike exploratory factor analysis (EFA) where there are no specific a priori
restrictions governing which indicators should measure the effects of which latent
variables (or indeed how many latent variables there might be), with the
confirmatory (CFA) method of factor analysis used in SEM analysis, the role of
theory is central. Specifically, with CFA researchers specify, or, hypothesise
based on theory, which latent variables are to be measured with which specific
indicators. The CFA method then confirms (hence its name) or refutes these
hypotheses.
The remainder of this chapter elaborates the rationale for the inclusion of each of
the latent factors and identifies / develops, from theory or from prior empirical
research findings, a set of indicator variables (items) for each of the latent
factors. As described above using the example from the MLQ, in the survey
instrument, each indicator variable takes the form of a statement: the item
statements are generated according to the advice of Hinkin (1998: 107-108) to
(a) keep statements as short as possible and to (b) ensure that the statement
wordings are understandable to the target population.
5.1 Dispositional factors / individual values
Work Values
The rationale for including a factor relating to individuals’ values is grounded in
the work of McGregor (1966) who described the Theory X / Theory Y model of
managers’ / employers’ assumptions of subordinate employees’ work orientation
(see Section 2.3.2). Theory X management tends to view employees as typically
self-serving and not being inclined to enjoy work – this perspective suggests that
initiating structure leadership behaviours may be more effective. Theory Y on the
other hand describes management assumptions which tend towards viewing
employees as enjoying work and seeking challenges and responsibility at work –
an orientation that is suited more to consideration styles of leadership.
Setting aside the question of how management assumptions inform leadership
behaviours, this research seeks to evaluate what effect, if any, employees’ work
orientations / work values have on the attitudinal outcomes of Organisational
Commitment, Job Satisfaction and Work Meaning. The hypothesised causal flow
(illustrated in Figure 4-5) from Work Values → Employee Attitudes → Individual ,
group and organisational level outcomes is drawn from the
values→attitudes→behaviour (V→A→B) hierarchy described by Homer and Kahle
132
(1988: 638-639). The V→A→B hierarchy is reflected in the alternative domain
names (Values, Processes, Attitudes and Behaviours) illustrated at the foot of
Figure 4-5.
The first step in operationalising (i.e. developing a method for measuring) the
construct was to specify a definition for it (see e.g. Hair et al. 2006: 735),
accordingly, the Work Values construct was defined as:
an individual’s disposition toward work in general / set of general beliefs about
work
This definition draws upon the discussion on ‘the meaning of work’ in Ardichvili
and Kuchinke (2009: 157) who also cite Sverko and Vizek-Vidovic’s (1995: 3)
definition of the meaning of work and working as:
the set of general beliefs about work held by an individual, who
acquires them through interaction with social environment
Ardichvili and Kuchinke (2009: 157) acknowledge the imprecise nature of the
meaning of work concept noting that research in this area includes a range of
discrete foci including work attitudes, work values and work
orientation. Indeed, Work Meaning is treated as a separate construct with a
different definition in this research; specifically, Work Meaning is defined here as
an employee’s attitude to their current job. The Work Meaning construct is
discussed in greater detail in Section 5.3 below, however, to summarise:
Work Values reflect an individual’s disposition toward work in general
Work Meaning reflects an individual’s attitude to their current job
Searching the hospitality literature for precedents on methods of measuring work
values revealed several articles that appeared to examine this issue. Ross (1992)
studied job-attainment beliefs and work values among school leavers in Australia
using Pryor’s Work Aspect Preference Scale (WAPS). The WAPS scale, however,
actually measures respondents’ work preferences i.e. it is a measure of individual
work needs rather than how they feel about work in general.
Mok et al. (1998) examined the leadership preferences and work values and of
Hong Kong based Chinese hotel managers. In their study the work values
measures were based on Hofstede’s (1980) Values Survey Module. Once again,
however, the measures in Hofstede’s survey instrument for measuring values
actually measure individuals’ work preferences on a number of different
dimensions.
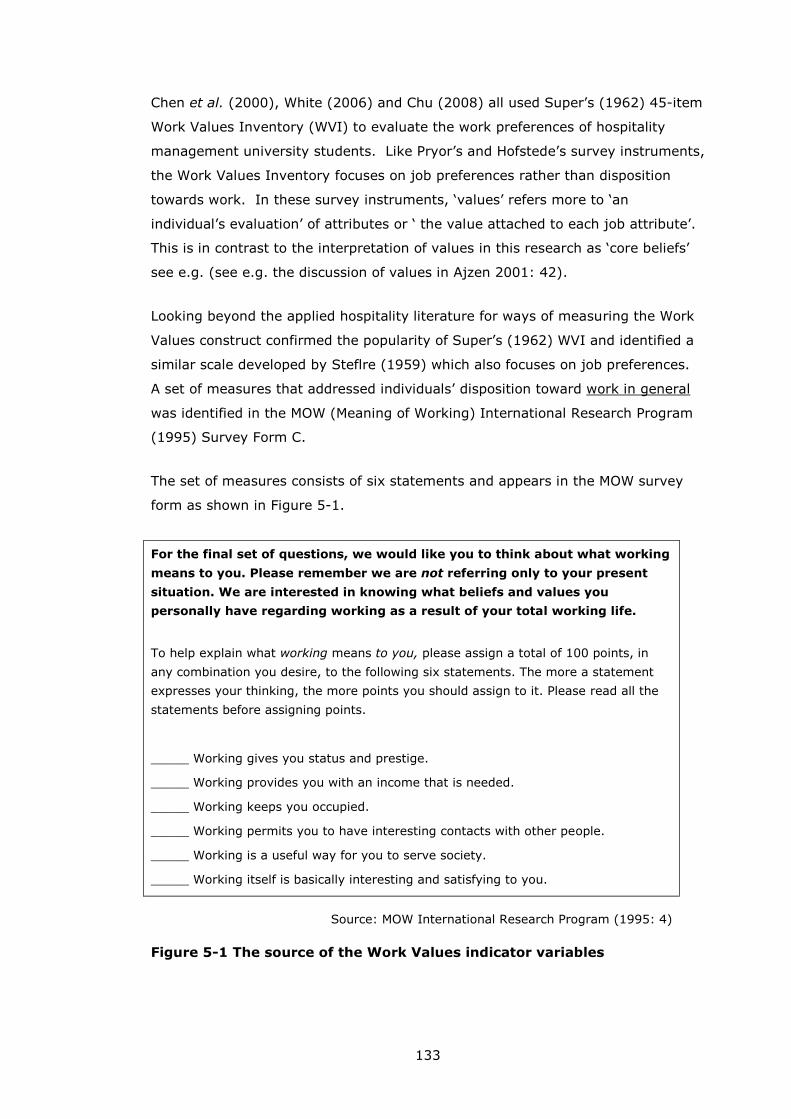
133
Chen et al. (2000), White (2006) and Chu (2008) all used Super’s (1962) 45-item
Work Values Inventory (WVI) to evaluate the work preferences of hospitality
management university students. Like Pryor’s and Hofstede’s survey instruments,
the Work Values Inventory focuses on job preferences rather than disposition
towards work. In these survey instruments, ‘values’ refers more to ‘an
individual’s evaluation’ of attributes or ‘ the value attached to each job attribute’.
This is in contrast to the interpretation of values in this research as ‘core beliefs’
see e.g. (see e.g. the discussion of values in Ajzen 2001: 42).
Looking beyond the applied hospitality literature for ways of measuring the Work
Values construct confirmed the popularity of Super’s (1962) WVI and identified a
similar scale developed by Steflre (1959) which also focuses on job preferences.
A set of measures that addressed individuals’ disposition toward work in general
was identified in the MOW (Meaning of Working) International Research Program
(1995) Survey Form C.
The set of measures consists of six statements and appears in the MOW survey
form as shown in Figure 5-1.
For the final set of questions, we would like you to think about what working
means to you. Please remember we are not referring only to your present
situation. We are interested in knowing what beliefs and values you
personally have regarding working as a result of your total working life.
To help explain what working means to you, please assign a total of 100 points, in
any combination you desire, to the following six statements. The more a statement
expresses your thinking, the more points you should assign to it. Please read all the
statements before assigning points.
_____ Working gives you status and prestige.
_____ Working provides you with an income that is needed.
_____ Working keeps you occupied.
_____ Working permits you to have interesting contacts with other people.
_____ Working is a useful way for you to serve society.
_____ Working itself is basically interesting and satisfying to you.
Source: MOW International Research Program (1995: 4)
Figure 5-1 The source of the Work Values indicator variables
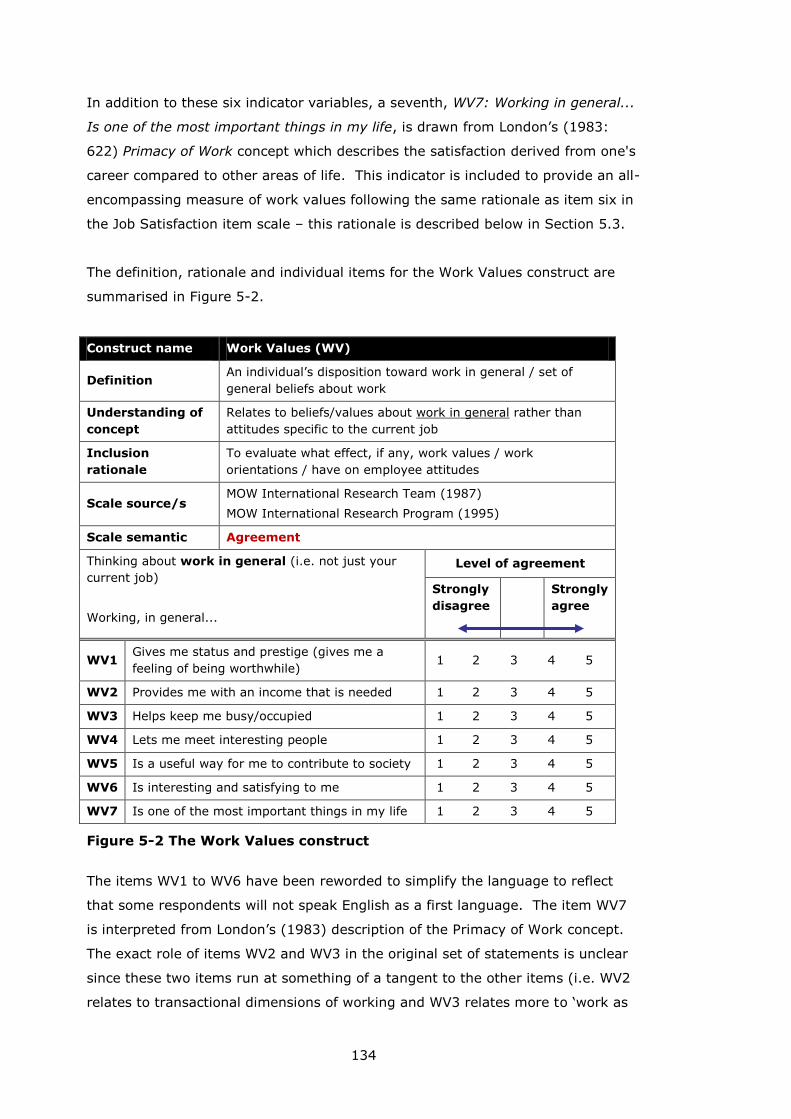
134
In addition to these six indicator variables, a seventh, WV7: Working in general...
Is one of the most important things in my life, is drawn from London’s (1983:
622) Primacy of Work concept which describes the satisfaction derived from one's
career compared to other areas of life. This indicator is included to provide an all-
encompassing measure of work values following the same rationale as item six in
the Job Satisfaction item scale – this rationale is described below in Section 5.3.
The definition, rationale and individual items for the Work Values construct are
summarised in Figure 5-2.
Construct name Work Values (WV)
Definition An individual’s disposition toward work in general / set of
general beliefs about work
Understanding of
concept
Relates to beliefs/values about work in general rather than
attitudes specific to the current job
Inclusion
rationale
To evaluate what effect, if any, work values / work
orientations / have on employee attitudes
Scale source/s MOW International Research Team (1987)
MOW International Research Program (1995)
Scale semantic Agreement
Thinking about work in general (i.e. not just your
current job)
Working, in general...
Level of agreement
Strongly
disagree
Strongly
agree
WV1 Gives me status and prestige (gives me a
feeling of being worthwhile) 1 2 3 4 5
WV2 Provides me with an income that is needed 1 2 3 4 5
WV3 Helps keep me busy/occupied 1 2 3 4 5
WV4 Lets me meet interesting people 1 2 3 4 5
WV5 Is a useful way for me to contribute to society 1 2 3 4 5
WV6 Is interesting and satisfying to me 1 2 3 4 5
WV7 Is one of the most important things in my life 1 2 3 4 5
Figure 5-2 The Work Values construct
The items WV1 to WV6 have been reworded to simplify the language to reflect
that some respondents will not speak English as a first language. The item WV7
is interpreted from London’s (1983) description of the Primacy of Work concept.
The exact role of items WV2 and WV3 in the original set of statements is unclear
since these two items run at something of a tangent to the other items (i.e. WV2
relates to transactional dimensions of working and WV3 relates more to ‘work as
135
drudgery’ in comparison to the other, more transformational-related statements).
Nonetheless, in the absence of any clear rationale for removing them at this
stage, the items are retained and their performance will be monitored during the
modelling.
5.2 Interpersonal, group and organisational processes
Motivational Leadership
The Motivational Leadership (ML) construct is central to this research insofar as a
core aim is to evaluate the contribution of motivational leadership to individual,
group and organisational outcomes related to customer service in hospitality
organisations.
Nine of the 12 hospitality research articles (Hinkin and Tracey 1994; Tracey and
Hinkin 1994, 1996, 1998; Whitelaw and Morda 2004; Erkutlu 2008; Hinkin and
Schriesheim 2008; Patiar and Mia 2009; Zopiatis and Constanti 2010) examining
transformational leadership used the Multi-Factor Leadership Questionnaire (MLQ)
developed by Bass and Avolio (Bass and Avolio 1989; Bass and Avolio 1995; Bass
and Avolio 1997; Avolio and Bass 2004a).
The MLQ is, however, a proprietary survey instrument and its use requires
permission from, and payment to, the publishers (Mind Garden Inc, Menlo Park,
CA, USA). For this research, rather than simply repeat the items relating to the
Inspirational Motivation (IM) construct in the MLQ, the scale which will be used for
measuring the Motivation Leadership construct is developed from conceptual
descriptions (i.e. not from the MLQ) of the Inspirational Motivational (IM)
dimension of transformational leadership in Bass and Avolio (1990a), Avolio et al.
(1999), Bass (1999), Avolio and Bass (2004a), and Bass and Riggio (2006).
Section 2.4.3 describes how the IM dimension in Bass and Avolio’s (2008) Full-
Range Leadership Model is focused on leaders’ enthusiastic articulation of
organisational/departmental/team vision and goals and their encouragement of
employees towards achieving these goals. It is this vision→goal→effort behaviour
set that has guided the development of the scale for this research.
136
The content of the items is not, however, unrelated to the MLQ:
item ML1 combines MLQ items 9 and 26 into a more concise form;
ML2 relates to MLQ item 13
ML3 relates closely to MLQ item 364
In this way, the four Inspirational Motivation items in the MLQ are reflected, but
not reproduced, in this survey instrument. In addition to ML1, ML2 and ML3, the
Motivational Leadership construct for this survey includes – somewhat
speculatively - two items (ML4 and ML5) that arise from published descriptions of
motivational leadership, but are not included in the Inspirational Motivation
dimension of the MLQ.
ML4 relates to positive reinforcement / positive feedback from leaders and taps
various work motivation research theories (goal-setting, equity, work design e.g.
Hackman and Oldham’s (1975) JCM – see Section 4.1 above) which specify
positive feedback as an antecedent of employee motivation (see also Jex and Britt
2008: 247).
Recognition of achievement as a positive force in motivating employees is also
described throughout the transformational leadership literature (see e.g. Bass and
Riggio 2006: 30) albeit often in the context of the Individualised Consideration
(IC) dimension (Bass and Riggio 2006: 84; Bass 1990: 20; and Bass and Avolio
1990: 22).
ML5 is related to the MLQ item 18, which belongs to the Idealized Influence
(Attributes) (IIA) dimension and relates to leaders’ ‘positive role model’
attributes. It is not unfeasible that positive role model behaviour will contribute
to employee motivation and ML5 reflects this contention. The motivating nature
of the leader as role model is also discussed by Avolio and Bass (2002: viii) and
the positive impact of the leader as role model appears as a frequent leitmotif in
(Bass and Riggio 2006).
4 the MLQ items are numbered and described in Avolio and Bass 2004: 106-107. The
actual wordings for the MLQ items is not repeated here for licensing reasons.
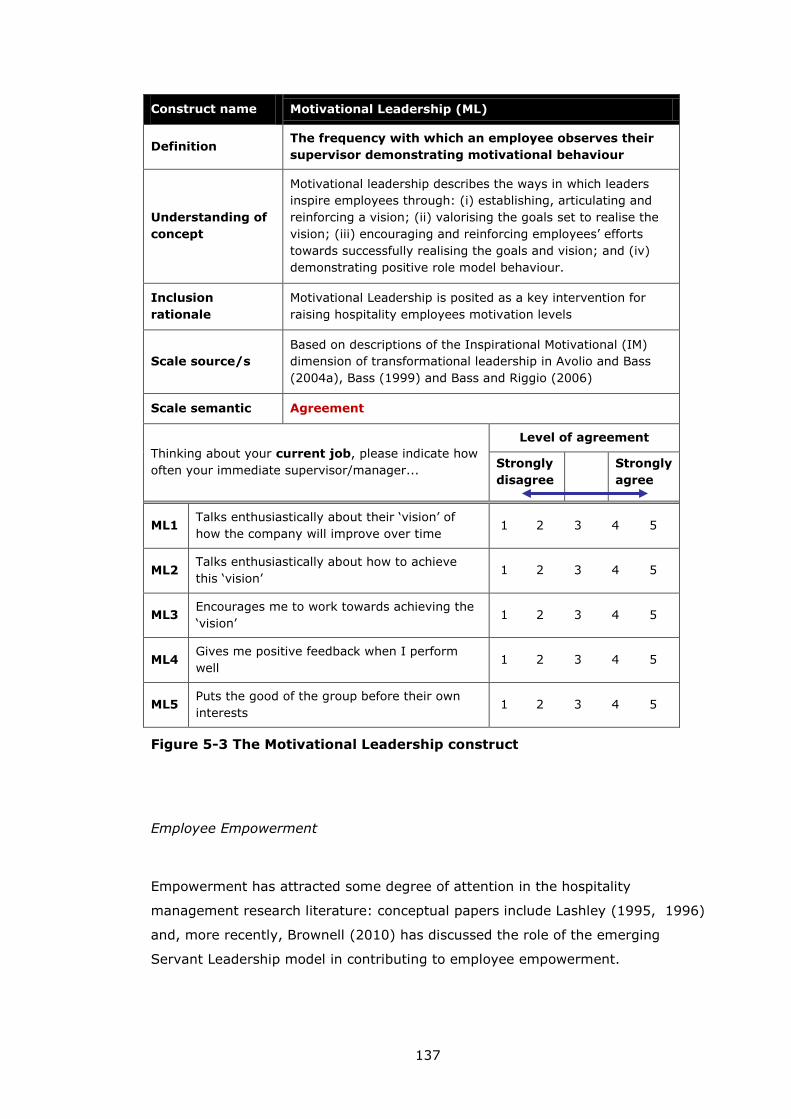
137
Construct name Motivational Leadership (ML)
Definition The frequency with which an employee observes their
supervisor demonstrating motivational behaviour
Understanding of
concept
Motivational leadership describes the ways in which leaders
inspire employees through: (i) establishing, articulating and
reinforcing a vision; (ii) valorising the goals set to realise the
vision; (iii) encouraging and reinforcing employees’ efforts
towards successfully realising the goals and vision; and (iv)
demonstrating positive role model behaviour.
Inclusion
rationale
Motivational Leadership is posited as a key intervention for
raising hospitality employees motivation levels
Scale source/s
Based on descriptions of the Inspirational Motivational (IM)
dimension of transformational leadership in Avolio and Bass
(2004a), Bass (1999) and Bass and Riggio (2006)
Scale semantic Agreement
Thinking about your current job, please indicate how
often your immediate supervisor/manager...
Level of agreement
Strongly
disagree
Strongly
agree
ML1 Talks enthusiastically about their ‘vision’ of
how the company will improve over time 1 2 3 4 5
ML2 Talks enthusiastically about how to achieve
this ‘vision’ 1 2 3 4 5
ML3 Encourages me to work towards achieving the
‘vision’ 1 2 3 4 5
ML4 Gives me positive feedback when I perform
well 1 2 3 4 5
ML5 Puts the good of the group before their own
interests 1 2 3 4 5
Figure 5-3 The Motivational Leadership construct
Employee Empowerment
Empowerment has attracted some degree of attention in the hospitality
management research literature: conceptual papers include Lashley (1995, 1996)
and, more recently, Brownell (2010) has discussed the role of the emerging
Servant Leadership model in contributing to employee empowerment.
138
Conger and Kanungo have defined empowerment as:
...a process of enhancing feelings of self-efficacy among organizational
members through the identification of conditions that foster
powerlessness and through their removal by both formal
organizational practices and informal techniques of providing efficacy
information
(Conger and Kanungo 1988b: 474)
In a services context, Hartline and Ferrell (1996) have described the positive
benefits of empowerment as coming from:
Allowing contact employees to use their discretion in serving
customers has many positive influences on their responses and the
service encounter.
(Hartline and Ferrell 1996: 56)
Empowerment has been also related to transformational leadership theory in Bass
and Riggio (2006: e.g. 151) and has been modelled alongside leadership in
several hospitality leadership studies: Sparrowe (1994) found a correlation
between positive LMX (Leader-Member-Exchange) scores and levels of employee
perceptions of empowerment; Chiang and Jang (2008) found that empowerment
predicted job satisfaction and organisational commitment; Clark et al. (2009) also
found a causal link between empowerment and job satisfaction; and Gill et al. al
(2010) found that transformational leadership predicted higher levels of employee
desire for empowerment.
Empirical hospitality articles focusing on empowerment issues in hospitality have
used a variety of measures for empowerment:
Sparrowe (1994) used a 21 items scale developed by Thomas and Tymon
(1993);
Zohar measured unpredictability and uncontrollability as the inverse of
empowerment using Cohen et al.’s (1983) Perceived Stress Scale;
Hancer and George (2003) used an 11 item version of the 12 item scale
originally constructed by Spreitzer (1992, 1995) and subsequently modified by
Fulford and Enz (1995);
Kim and George used Spreitzer’s (1992, 1995) 12 item scale
Hau-Siu Chow et al. (2006) used an adapted version of Hancer and George’s
11 item scale;
Chiang and Jang (2008) used Spreitzer’s 12 item scale;
139
Clark et al. (2009) used and 8 item empowering leadership style scale from
Cook et al.’s (Cook et al. 1981) Leader Behavior Description Questionnaire
Version 12 (LBDQ XII); and
Gill et al. (2010) focused on employee desire for empowerment -
operationalised as the extent to which hospitality service employees were
‘...willing to have freedom to use their own initiative and judgment in
performing their jobs’ (p. 266) – and drew upon the scales developed by
Hartline and Ferrell (1996)
Spreitzer (1992, 1995) drew upon earlier work by Conger and Kanungo (1988b)
and Thomas and Velthouse (1990) to develop a four-factor model of
empowerment. The four factors are Meaning (the value of work goals or job
purpose), Competence (an individual’s feeling of self-efficacy at work), Self-
Determination (autonomy to make decisions) and Impact (the degree to which
the individual can influence processes and outcomes at work – this factor is
referred to as Personal Control by Fulford and Enz (1995). Fulford and Enz
(1995) employed this model in their study of service and non-service employees
in North American hospitality organisations (private clubs). Fulford and Enz
identified a modified three-factor structure where Self Determination and Impact
merged to form a factor that the authors named Influence.
Hancer and George (2003) used Fulford and Enz’s 12-item / 3-factor model in
their empowerment survey of non-supervisory employees working in full-service
restaurant chains. Hancer and George dropped one of the Competence items to
improve the internal consistency of that factor – the three factors and the 11
related items are described below (Influence = In, Meaning = Me and
Competence = Co).
(In1) I have freedom in determining how to do my job
(In2) I have influence over what happens in my workgroup
(In3) I have a great deal of control over my job
(In4) I have a chance to use personal initiative in my work
(In5) I decide on how to go about doing my job
(In6) My opinion counts in workgroup decision-making
(Me1) My work is very important to me
(Me2) My job activities are meaningful to me
(Me3) I care about what I do on my job
(Co1) I have mastered the skills to do my job
(Co2) I am confident about my ability to do my job
(Hancer and George 2003: 11)
140
The current research draws upon and modifies the hospitality catering-centred
model established by Hancer and George (2003). For this study, Empowerment is
conceptualised primarily as Influence, which embodies Spreitzer’s original
conceptual domains of Self-Determination and Impact and is interpreted as ‘an
individual’s perceptions of (i) autonomy in decision making and (ii) ability to effect
process and outcomes at work’.
Including the Competence and Meaning factors in this study was not desirable for
the following reasons.
Firstly, regarding the Meaning factor, for this study Work Meaning is being
conceptualised as a discrete factor which is not located within the Empowerment
construct. The Work Meaning factor in this research is hypothesised as a
consequent of Empowerment based on the rationale that increased individual
perceptions of influence (self-determination and impact/personal control) may
enhance work meaningfulness. With respect to Spreitzer’s empowerment model,
the current conceptualisation and hypothesis linking Empowerment and Work
Meaning effectively repositions the Work Meaning factor as a consequent of the
Influence factor rather than as a covariate with it. Theoretical and empirical
support for this relationship can be found in organisational psychology literature
on job crafting (e.g. Wrzesniewski and Dutton 2001; Ghitulescu 2006; Berg et al.
2010) where evidence has been found linking employee autonomy in the
workplace to increased perceptions of work meaning (Wrzesniewski and Dutton
2001). Furthermore, the operationalisations of Meaning found in Spreitzer and in
Fulford and Enz/Hancer and George are found to be somewhat nebulous, leading
to a search for an operationalisation of the construct which embodies a more
specific and substantive interpretation of the factor. Details of this critique are
provided in Section 5.3 on Work Meaning below.
Secondly, regarding the Competence factor; while Hancer and George used
principal components analysis (a form of exploratory factor analysis), this study
uses confirmatory factor analysis (CFA). There are specific requirements for CFA
regarding the number of items (indicators) required to adequately measure each
latent factor – this is an aspect of SEM referred to as factor identification and is
described fully in Section 6.1. In short, a single factor (latent construct, or
variable) which is connected to other factors (latent variables) in an SEM model
needs to be measured by at least 2 significant indicator variables – starting off
with only two indicator variables (i.e. as per Hancer and George’s Competence
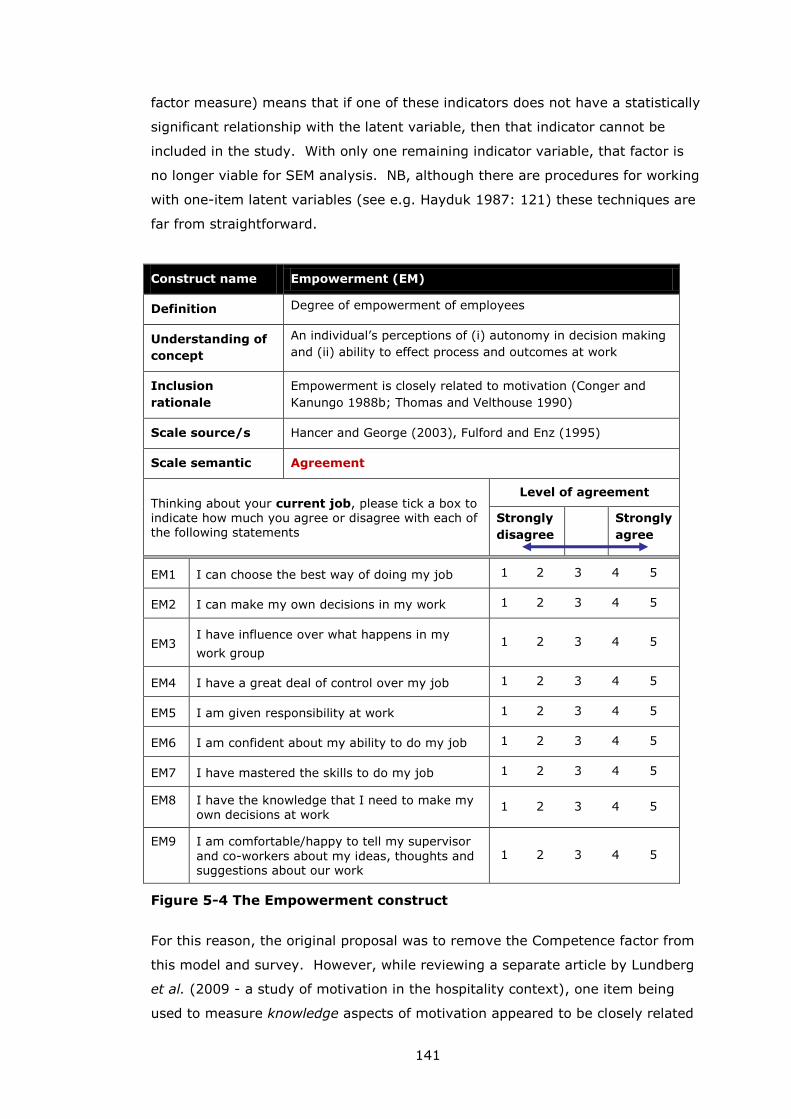
141
factor measure) means that if one of these indicators does not have a statistically
significant relationship with the latent variable, then that indicator cannot be
included in the study. With only one remaining indicator variable, that factor is
no longer viable for SEM analysis. NB, although there are procedures for working
with one-item latent variables (see e.g. Hayduk 1987: 121) these techniques are
far from straightforward.
Construct name Empowerment (EM)
Definition Degree of empowerment of employees
Understanding of
concept
An individual’s perceptions of (i) autonomy in decision making
and (ii) ability to effect process and outcomes at work
Inclusion
rationale
Empowerment is closely related to motivation (Conger and
Kanungo 1988b; Thomas and Velthouse 1990)
Scale source/s Hancer and George (2003), Fulford and Enz (1995)
Scale semantic Agreement
Thinking about your current job, please tick a box to indicate how much you agree or disagree with each of the following statements
Level of agreement
Strongly
disagree
Strongly
agree
EM1 I can choose the best way of doing my job 1 2 3 4 5
EM2 I can make my own decisions in my work 1 2 3 4 5
EM3 I have influence over what happens in my
work group 1 2 3 4 5
EM4 I have a great deal of control over my job 1 2 3 4 5
EM5 I am given responsibility at work 1 2 3 4 5
EM6 I am confident about my ability to do my job 1 2 3 4 5
EM7 I have mastered the skills to do my job 1 2 3 4 5
EM8 I have the knowledge that I need to make my own decisions at work
1 2 3 4 5
EM9 I am comfortable/happy to tell my supervisor
and co-workers about my ideas, thoughts and suggestions about our work
1 2 3 4 5
Figure 5-4 The Empowerment construct
For this reason, the original proposal was to remove the Competence factor from
this model and survey. However, while reviewing a separate article by Lundberg
et al. (2009 - a study of motivation in the hospitality context), one item being
used to measure knowledge aspects of motivation appeared to be closely related
142
to the Competencies factor and was deemed as being a potentially useful
supplement to Hancer and George’s existing two indicators for Competencies (and
increasing the potential for successfully modelling this factor). The item is I have
the knowledge that I need to make my own decisions at work. The item is
included in the survey as EM8 where it complements EM6 and EM7 (which
themselves correspond with Hancer and George’s Co1 and Co2). Figure 5-4
summarises the items for measuring the Employee Empowerment factor.
Items In1 (I have freedom in determining how to do my job) and In5 (I decide on
how to go about doing my job) were considered to be somewhat tautological and
in the interests of parsimony these were combined (and the language simplified)
into one item (EM1) I can choose the best way of doing my job. Regarding the
other Influence items: EM2 corresponds with In4; EM3 with In2; EM4 is
synonymous with In3; and EM5 corresponds with In4. One additional Influence-
related item is included (as EM9 ) - once again drawn from Lundberg et al. (2009)
– I am comfortable/happy to tell my supervisor and co-workers about my ideas,
thoughts and suggestions about our work). This item is included - somewhat
speculatively - on the basis that there was no item reflecting this aspect of
Influence in Fulford and Enz or Hancer and George.
In summary, the Empowerment factor consists of two discrete factors: EM-I
(Empowerment – Influence) and EM-C (Empowerment – Competencies). The
latter, EM-C is proposed as a discrete latent variable somewhat speculatively
since the original factor - derived from exploratory factor analyses by Fulford and
Enz (1995) and Hancer and George (2003) – consisted only of two indicators
(EM6 and EM7). For this research, and to aid identification of the model, the two
original competencies indicators were supplemented with EM8 drawn from
Lundberg et al. (2009). If the measurement model confirms EM-I and EM-C as
distinct and valid constructs that covary significantly with the other constructs in
the measurement model, then EM-I and EM-C will be modelled in the structural
model as sub-factors of a second-level Empowerment construct.
Social Support
In the broader organisational psychology literature, social support / positive social
environments have been found to contribute towards reducing a number of
counterproductive organisational outcomes such as stress (e.g. Fisher 1985;
143
Bliese and Britt 2001), absence (Tamers et al. 2011) and burnout (Winnubst
1993) and to enhancing productive behaviours and organisational outcomes such
as work motivation (Winnubst 1993).
Social support has been defined as "overall levels of helpful social interaction
available on the job from co-workers and supervisors" (Karasek and Theorell
1990: 69) and by Bliese and Britt as a phenomenon that:
...is expected to help individuals cope with the negative effects of
stressors because positive social environments provide confirmation of
social identity, instrumental aid, and various forms of support
(emotional, informational and appraisal) to group members
(Bliese and Britt 2001: 426)
During this study, Social Support was identified as a construct of interest owing to
its inclusion in three hospitality leadership studies. In the first of these,
Borchgrevink and Boster (1994) hypothesised, and found in their sample of North
American foodservice employees, that levels of Co-Worker Social Support were
unrelated to levels of LMX (Leader-Member Exchange) relationship quality (a
findings which supported the hypothesis that supervisor support is unrelated to
co-worker support). Ross and Boles (1994) examined the effects of a range of
supportive work relationships (supervisor support. peer cohesion and work
involvement) on a number of individual-level work outcomes. Based on the
responses of a sample of foodservers in the south east of the United States they
found: (a) no correlation between peer cohesion (Social Support) and (i) job
performance or (ii) extrinsic motivation; (b) that peer cohesion did not predict
either role conflict or role ambiguity; and (c) peer cohesion did not predict job
satisfaction. The authors offer a number of explanations for the poor predictive
ability of Peer Cohesion highlighting (i) the low reliability of the construct (α =
0.57) in their survey, and (ii) low levels of peer networking in food servers
compared with other job contexts in which social support had previously been
measured. Examples of differing characteristics of jobs and employees included
fewer communal lunches and less time socialising after work owing to part-time
employment, staggered shifts and little free time owing to non-work
commitments such as caring for young families and/or education/study. The last
of the identified hospitality leadership studies to include the social support factor
is that of Susskind et al. (2000a) who measured co-worker support as a
144
statistically significant predictor of service standards with a path coefficient of
0.43 (p=<0.001).
Another empirical hospitality study (not one related to leadership) measured the
influence of Social Support on Taiwanese hospitality students during their industry
internship experiences. Fei-Chuan et al. (2009) reported their findings that Social
Support moderated the effect of Emotional Display Rules on Job Satisfaction –
although their SEM model did not demonstrate good model fit on two key
measures (Chi Square and the Comparative Fit Index[CFI]).
In the context of hospitality motivation research, Lee-Ross (1995, 1998a,
1998b) and Lundberg (2009) have measured beneficial effects of positive social
envronments. Finally, although focusing on workers’ experiences rather than
organisational outcomes, recent work by Janta and Ladkin (2009) Janta (2011)
and Janta et al. (in press) focusing on migrant Polish workers in the UK hospitality
industry has also reported the beneficial role of positive social environments.
Simons (2003: 348) also relates broader notions of positive social contexts to
positive organisational outcomes in his review of hospitality motivation studies.
Regarding methods of measuring the social support construct in the hospitality
literature:
Ross and Boles (1994) used a scale from Moos (1981) but did not report
details of all of the statements used to evaluate the indicator variables. It is
likely that, in common with many psychometric scales for use in organisational
studies (e.g. the Multi-Factor Leadership Questionnaire (Avolio and Bass
2004a) for measuring the Full-Range Leadership Model (FRLM) of
transformational leadership) the scale is a proprietary one and restrictions are
in place regarding the publication of the entire set of item statements for any
particular scale;
Borchgrevink and Boster (1994) used a four-item scale from Miller et al.
(1990); and
Susskind et al. (2000a) used a six-item scale developed from previous work by
Litwin and Stringer (1968) and Eisenberger et al. (1986).
The source of Fei-Chuan et al.’s (2009) four-item scale is not clear owing to
erroneous referencing in that article.
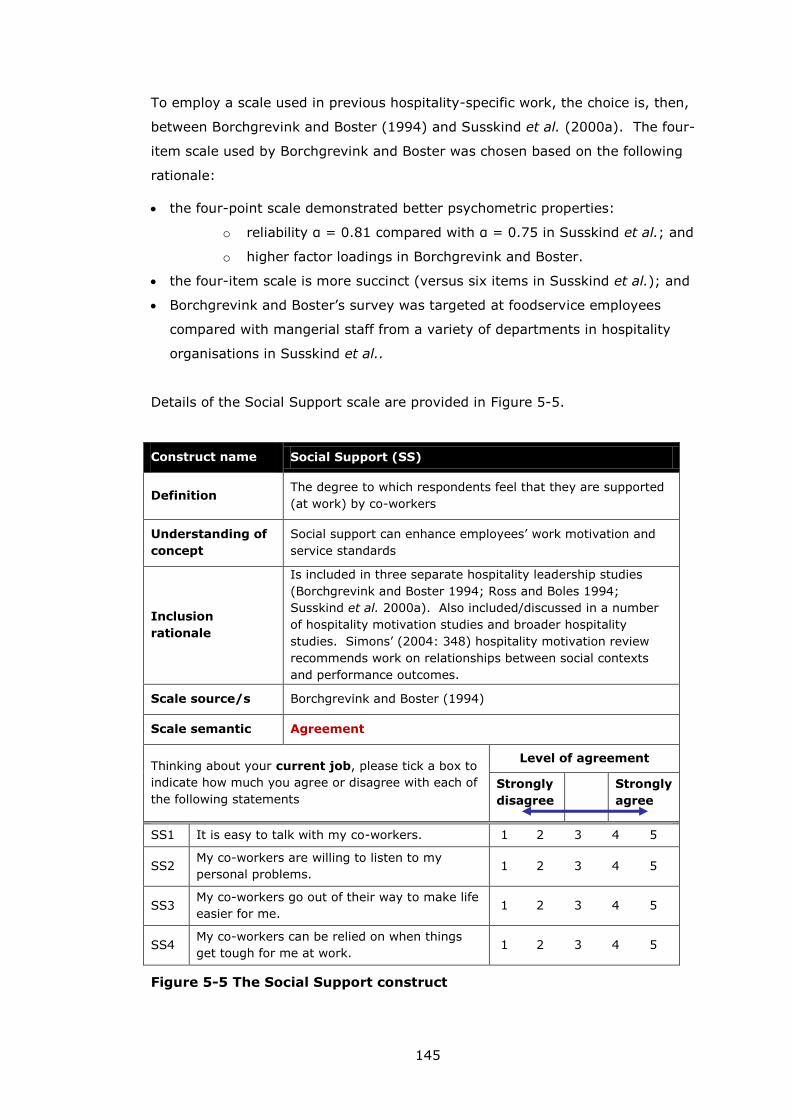
145
To employ a scale used in previous hospitality-specific work, the choice is, then,
between Borchgrevink and Boster (1994) and Susskind et al. (2000a). The four-
item scale used by Borchgrevink and Boster was chosen based on the following
rationale:
the four-point scale demonstrated better psychometric properties:
o reliability α = 0.81 compared with α = 0.75 in Susskind et al.; and
o higher factor loadings in Borchgrevink and Boster.
the four-item scale is more succinct (versus six items in Susskind et al.); and
Borchgrevink and Boster’s survey was targeted at foodservice employees
compared with mangerial staff from a variety of departments in hospitality
organisations in Susskind et al..
Details of the Social Support scale are provided in Figure 5-5.
Construct name Social Support (SS)
Definition The degree to which respondents feel that they are supported
(at work) by co-workers
Understanding of
concept
Social support can enhance employees’ work motivation and
service standards
Inclusion
rationale
Is included in three separate hospitality leadership studies
(Borchgrevink and Boster 1994; Ross and Boles 1994;
Susskind et al. 2000a). Also included/discussed in a number
of hospitality motivation studies and broader hospitality
studies. Simons’ (2004: 348) hospitality motivation review
recommends work on relationships between social contexts
and performance outcomes.
Scale source/s Borchgrevink and Boster (1994)
Scale semantic Agreement
Thinking about your current job, please tick a box to
indicate how much you agree or disagree with each of
the following statements
Level of agreement
Strongly
disagree
Strongly
agree
SS1 It is easy to talk with my co-workers. 1 2 3 4 5
SS2 My co-workers are willing to listen to my
personal problems. 1 2 3 4 5
SS3 My co-workers go out of their way to make life
easier for me. 1 2 3 4 5
SS4 My co-workers can be relied on when things
get tough for me at work. 1 2 3 4 5
Figure 5-5 The Social Support construct
146
5.3 Primary organisational outcomes: employee attitudes
Both employee attitudes and job performance are described by Ambrose and
Kulik’s (1999: 232) as ways of measuring work motivation. Job satisfaction,
affective organisational commitment and work meaning have been identified from
the generic and applied hospitality literatures as employee attitudes that are
relevant to the hospitality context.
Job Satisfaction
Jex and Britt (2008: 131) describe how job satisfaction can be defined as an
individual’s overall evaluation of their job (e.g. Locke 1976; Spector 1997) or as
an employee’s attitude toward his or her job (e.g. Eagly and Chaiken 1993).
Huelsman (2007) echoes Jex and Britt in noting that as an attitude, job
satisfaction can be separated into affective (emotional), cognitive (belief) and
behavioural (job-related behaviours and behavioural tendencies) dimensions.
Elsewhere, however, Weiss (2002) defines job satisfaction as ‘...a positive (or
negative) evaluative judgment one makes about one’s job or job situation’. Weiss
goes on to argue that what is being measured by job satisfaction measurement
scales is in fact ‘evaluation’ rather than ‘affect’, based on the ephemeral nature of
affect in contrast with evaluative judgements which can be rather less transitory.
Whether defined as evaluation or as affect, the relationships between job
satisfaction and its antecedents and consequences are not always straightforward
(Byrne and Neuman 1992: 46-47). A significant volume of job satisfaction
research has sought to identify and evaluate a causal relationship between job
satisfaction and job performance but the identification of this ‘holy grail’
relationship has not been forthcoming (Landy 1985: 410) or, at best, weak
(Iaffaldano and Muchinsky 1985). Byrne and Neuman (1992: 46-47) go on to
cite a number of studies that suggest it is performance which predicts satisfaction
rather than the other way around.
During the course of the literature reviews for this research, seventeen
hospitality-related research studies have been identified where job satisfaction
has been incorporated as a variable of interest (Hawkins and Lee 1990;
Borchgrevink and Boster 1994; Ross and Boles 1994; Susskind et al. 2000a;
Susskind et al. 2000b; Carbery et al. 2003; Testa 2004; Kim et al. 2005; Tutuncu
147
and Kozak 2007; Chiang and Jang 2008; Deery 2008; Erkutlu 2008; Øgaard et al.
2008; Tsai 2008; Fei-Chuan et al. 2009; Kuruüzüm et al. 2009; Yang 2010).
These studies have measured the relationships between job satisfaction and a
number of other variables including organisational commitment (Hawkins and Lee
1990; Susskind et al. 2000b; Chiang and Jang 2008; Kuruüzüm et al. 2009),
turnover (Susskind et al. 2000a; Carbery et al. 2003), empowerment (Chiang and
Jang 2008) and leadership (Tutuncu and Kozak 2007).
The seventeen hospitality studies above utilised a range of psychometric tools to
measure job satisfaction (JS). An analysis of the articles revealed that:
six of the studies had used a measure (drawn from the general organisational
psychology literature) that none of the other hospitality studies had used;
two (Kim et al. 2005; Kuruüzüm et al. 2009) had adapted a five-item scale
from Lytle (1994);
two (Susskind et al. 2000a; Susskind et al. 2000b) had used a three-item JS
scale drawn from Hackman and Oldham’s (1975) Job Diagnostic Survey (JDS);
and
four (Borchgrevink and Boster 1994; Tutuncu and Kozak 2007; Chiang and
Jang 2008; Tsai 2008) had drawn on the Job Descriptive Index (JDI) developed
by (Smith et al. 1969) to create adapted scales with varying numbers of items.
The most frequently-used item scale, then, was Smith et al.’s (1969) Job
Description Index (JDI) and this reflects the JDI’s pre-eminent position as the
most-used measure of job satisfaction in the wider organisational studies
literature (Ironson et al. 1989: 193). In its entirety, the JDI consists of 73 items
which are allocated across 5 sub-scales designed to measure five factors:
Salary: Satisfaction regarding salary
Job: Satisfaction level towards the work itself – the job tasks
Position advancement: Satisfaction regarding promotion opportunities
Supervisor: Satisfaction regarding direct supervisors
Co-workers: Satisfaction level towards co-workers
In the four hospitality studies measuring job satisfaction based on the JDI: Tsai
(2008) used all 73 items; Tutuncu and Kozak (2007) used a 26-item adaption;
Borchgrevink and Boster (1994) used a truncated 8-item version drawn from the
18-item Job sub-scale (see below); and Chiang and Jang (2008) used an even
shorter three-item scale drawn from the JDI.
148
The 73- and 23-item versions are too lengthy for this research and no theory-
based rationale for the choice of the eight-from-eighteen items used by
Borchgrevink and Boster (either in Borchgrevink and Boster (1994) or in their
source (Miller et al. 1990)). Similarly, no theory-based rationale was provided by
Chiang and Jang (2008) for their choice of three items from the JDI (one related
to general job satisfaction, one to empowerment satisfaction and one to
happiness with the organisation). Furthermore, it is difficult to see how Chiang
and Jang’s happiness with the organisation measure relates to any of the original
JDI items.
The challenge, then, is to create a more succinct method of measuring job
satisfaction to keep the questionnaire reasonably short and which relates to Smith
et al.’s JDI. Ironson et al. (1989) developed a method for truncating the JDI to
form a unidimensional (rather than the original five dimensions) measure of job
satisfaction which measured respondents’ evaluation of general rather than
specific job characteristics. Following a similar approach it was decided to use
each of the five sub-scale concepts as an individual item in an attempt to
generate a ‘general job satisfaction’ measure for this study.
This is a somewhat exploratory approach – not least because there is no
guarantee that the five items representing the original sub-scales will covary
sufficiently strongly to demonstrate convergent validity. This concern is
underlined by the fact only moderate correlations (0.25 to 0.45) between the five
sub-scales was oberved by Smith et al. (1969; cited in Ironson et al. 1989: 194).
Different studies using different samples in different contexts do produce different
correlations, however, and Tutuncu and Kozak (2007) reported inter-factor
correlations as high as 0.644 (with many in the 0.300 to 0.600 range) in their
application of a truncated JDI in a hospitality sample.
Nevertheless, because the approach being used here is somewhat tentative and
exploratory, an additional item (JS6 - All things considered, how satisfied are you
with your job?) was added to provide a ‘back-up’ global measure of job
satisfaction. The successful use of such global measures is discussed, specifically
in a job satisfaction context, by Yiing and Ahmad (2009: 62).
A further safety net is provided by the combined inclusion of the items JS1 and
JS6 which, together, correspond directly with two of the three items used by
Susskind et al. (2000a; 2000b). Susskind et al. use three items, one for
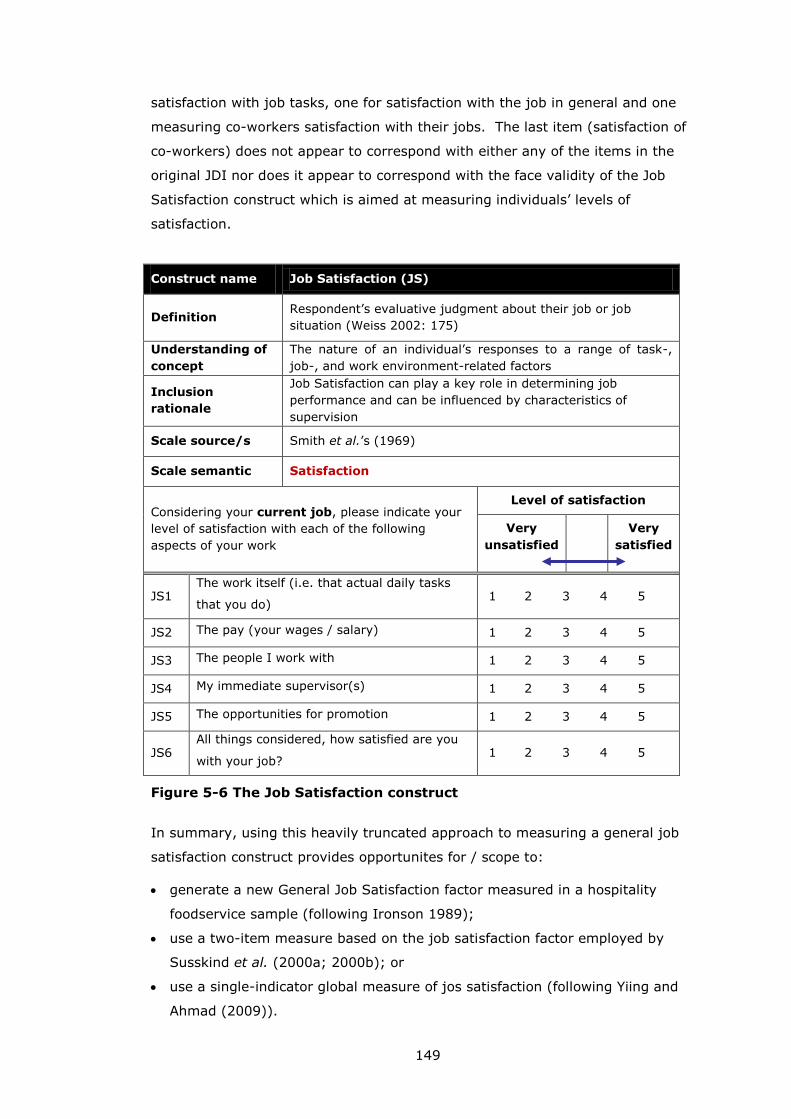
149
satisfaction with job tasks, one for satisfaction with the job in general and one
measuring co-workers satisfaction with their jobs. The last item (satisfaction of
co-workers) does not appear to correspond with either any of the items in the
original JDI nor does it appear to correspond with the face validity of the Job
Satisfaction construct which is aimed at measuring individuals’ levels of
satisfaction.
Construct name Job Satisfaction (JS)
Definition Respondent’s evaluative judgment about their job or job
situation (Weiss 2002: 175)
Understanding of
concept
The nature of an individual’s responses to a range of task-,
job-, and work environment-related factors
Inclusion
rationale
Job Satisfaction can play a key role in determining job
performance and can be influenced by characteristics of
supervision
Scale source/s Smith et al.’s (1969)
Scale semantic Satisfaction
Considering your current job, please indicate your
level of satisfaction with each of the following
aspects of your work
Level of satisfaction
Very
unsatisfied
Very
satisfied
JS1 The work itself (i.e. that actual daily tasks
that you do) 1 2 3 4 5
JS2 The pay (your wages / salary) 1 2 3 4 5
JS3 The people I work with 1 2 3 4 5
JS4 My immediate supervisor(s) 1 2 3 4 5
JS5 The opportunities for promotion 1 2 3 4 5
JS6 All things considered, how satisfied are you
with your job? 1 2 3 4 5
Figure 5-6 The Job Satisfaction construct
In summary, using this heavily truncated approach to measuring a general job
satisfaction construct provides opportunites for / scope to:
generate a new General Job Satisfaction factor measured in a hospitality
foodservice sample (following Ironson 1989);
use a two-item measure based on the job satisfaction factor employed by
Susskind et al. (2000a; 2000b); or
use a single-indicator global measure of jos satisfaction (following Yiing and
Ahmad (2009)).
150
The details of the Job Satisfaction construct and the individual items are shown in
Figure 5-6. The items’ linkages with Smith et al.’s JDI subscales are as follows:
JS1 corresponds with Job (relates to task satisfaction)
JS2 corresponds with Salary
JS3 corresponds with Co-workers
JS4 corresponds with Supervisor
JS5 corresponds with Position advancement
JS6 is not linked with the JDI but reflects a global measurement of job
satisfaction and ‘satisfaction with work in general’
Work Meaning
Transformational leadership theory posits that leaders who demonstrate the
characteristics of transformational leadership in general (Bass and Riggio 2006: 5)
and of the Inspirational Motivation dimension in particular (Avolio and Bass
2004a: 96; Bass and Riggio 2006: 6, 28, 91) and also through setting meaningful
goals (Bass and Riggio 2006: 151) can increase levels of work meaning for
employees.
In reviewing the transformational leadership literature, the interpretation of
‘meaning’ and ‘meaningful ‘ is not always made explicit, however. The implied
interpretations revolve around notions of: meaning = worthwhile; meaning = goal
clarity; and meaning = confluence of the leader’s and followers’ understanding of
vision and goals.
Nebulous conceptualisations and operationalisations of concepts related to Work
Meaning have already been encountered elsewhere during the course of this
research. Firstly, as part of Hackman and Oldham’s Job Diagnostic Survey (JDS –
see Section 4.3.1 above) Experienced Meaningfulness was measured using two
item statements:
Most of the things I have to do on this job are useless and trivial (reverse
coding)
The work I do on this job is very meaningful to me
(Hackman and Oldham 1974: 62)
151
Later, Spreitzer’s (1992, 1995) model of empowerment measured Meaning as a
discrete component of Empowerment using three item statements:
The work I do is very important to me (Meaning 1)
My job activities are personally meaningful to me (Meaning 2)
The work I do is meaningful to me (Meaning 3)
And this operationalisation was then adapted for use in a hospitality context by
Fulford and Enz (1995) and then by Hancer and George
(2003) using the following three item statements:
My work is very important to me
My job activities are meaningful to me
I care about what I do on my job
The core concepts articulated by Hackman and Oldham remain in place
throughout these examples: Work meaning = (a) work which is ‘meaningful to
me’ and (b) work which is non-trivial (‘important to me’). Unfortunately, the
‘meaning of meaning’ remains unclear (a criticism that can also be levelled at
‘importance’, since the characteristics/criteria which define importance are not
articulated either).
In the light of the nebulous nature of the ‘meaning of meaning’ in the
transformational leadership and work motivation literature, a review of the wider
organisational psychology literature was undertaken to provide insights into this
construct. Guiding this search were the definitions for the Work Values and Work
Meaning factors described in Section 5.1 as:
1. Work Values reflect an individual’s disposition toward work in general
2. Work Meaning reflects an individual’s attitude to their current job
In the general organisational psychology field, James and James (1989) specified
and tested a hierarchical confirmatory factor analysis (CFA) ‘model of meaning’
containing four first-order factors: Role Stress and Lack of Harmony (6 items);
Job Challenge and Autonomy (3 items); Leadership Facilitation and Support (5
items); and Workgroup Co-operation, Friendliness, and Warmth (3 items) and
where each of these factors explained some of the variance in a second-order
factor labelled Psychological Climate. Meaning was defined by James and James
as a set of beliefs that are informed by learned responses to, and interpretations
of, environmental stimuli. The model was confirmed using a sample consisting of
152
(US) Navy personnel, systems analysts, manufacturing staff and fire-fighters.
These authors did not, however, report the wording of the individual item
statements.
An earlier study by Wollack et al. (1971) sought to evaluate “the meaning that an
individual attaches to his role at work” using an exploratory factor analysis
procedure. Two core domains of work meanings, intrinsic and extrinsic, were
proposed. The intrinsic domain relates to ‘work as its own reward’ and is
measured by three ‘sub-scales’: Pride in Work – the satisfaction and enjoyment
from doing one’s job well; Job Involvement- the degrees of active interest in co-
workers, company functions and making contributions to job-related decisions;
and Activity Preference – an individual’s preference to remain active and busy
while working. The extrinsic domain is composed of two sub-scales: Attitude
toward Earnings - the value an individual places on work earning; and Social
Status of Job – an individual’s evaluation of the influence their job has on their
friends, relatives, and co-workers. Two sub-scales were included that did not
readily fit into the intrinsic/extrinsic categorisation: Upward Striving – the desire
for promotion and a better standard of living; and Responsibility to Work - the
recognition of an ‘obligation to work’. These domains and sub-scales are
described in Figure 5-7.
The authors’ model was tested using exploratory factor analysis with data
collected from a sample of manufacturing employees and a survey instrument
consisting of 91 items. Forty-five of these item were retained based on the
psychometric properties of the derived factors which relate to the sub-scales
described above (excepting the ‘responsibility to Work’ sub-scale which was
removed owing to poor psychometric values). Only a sample of the actual item
statements were included in the article.
A search of the hospitality studies literature did not identify any studies
measuring ‘work meaning’ or ‘meaning of work’. A choice had to be made,
therefore, between the measures employed by James and James (1989) and by
Wollack et al. (1971). Immediately it was apparent that neither set of measures
was ideal because: (i) the full set of measures in each was too lengthy for this
research; (ii) each contained a number of specific measures in each were not
particularly relevant; and (iii) neither of the studies had reported the full range of
individual item statements (for this research to draw upon).
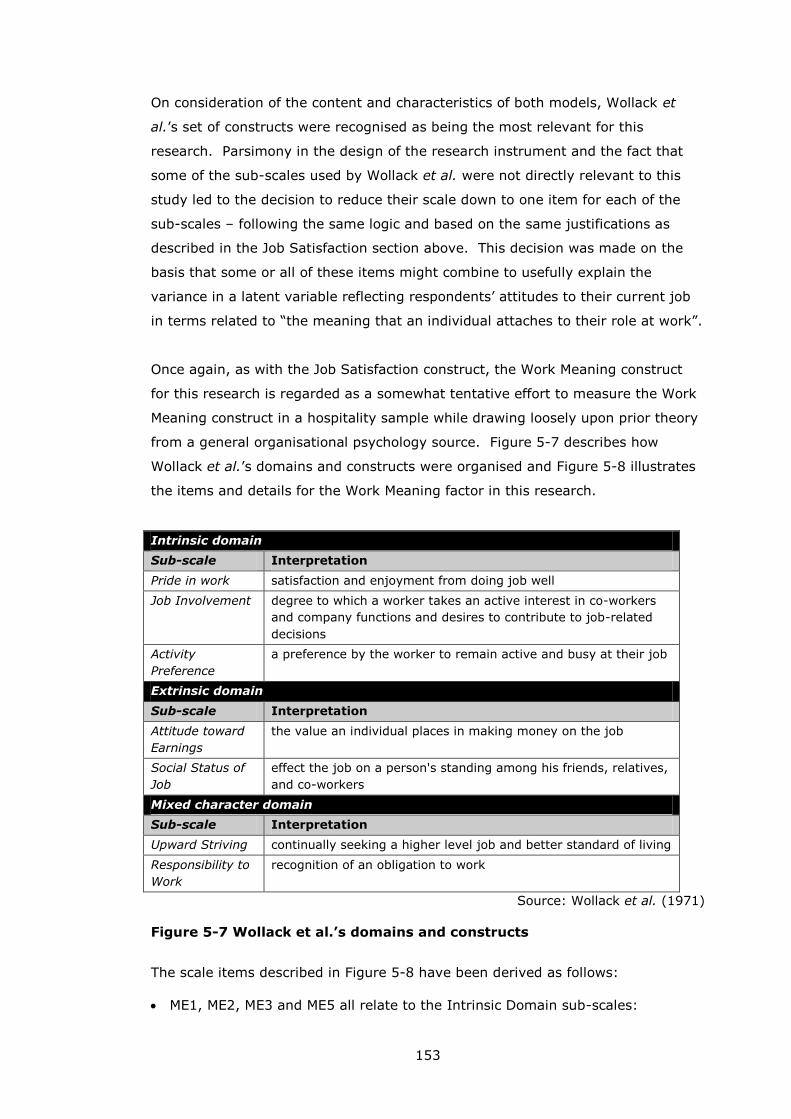
153
On consideration of the content and characteristics of both models, Wollack et
al.’s set of constructs were recognised as being the most relevant for this
research. Parsimony in the design of the research instrument and the fact that
some of the sub-scales used by Wollack et al. were not directly relevant to this
study led to the decision to reduce their scale down to one item for each of the
sub-scales – following the same logic and based on the same justifications as
described in the Job Satisfaction section above. This decision was made on the
basis that some or all of these items might combine to usefully explain the
variance in a latent variable reflecting respondents’ attitudes to their current job
in terms related to “the meaning that an individual attaches to their role at work”.
Once again, as with the Job Satisfaction construct, the Work Meaning construct
for this research is regarded as a somewhat tentative effort to measure the Work
Meaning construct in a hospitality sample while drawing loosely upon prior theory
from a general organisational psychology source. Figure 5-7 describes how
Wollack et al.’s domains and constructs were organised and Figure 5-8 illustrates
the items and details for the Work Meaning factor in this research.
Intrinsic domain
Sub-scale Interpretation
Pride in work satisfaction and enjoyment from doing job well
Job Involvement degree to which a worker takes an active interest in co-workers
and company functions and desires to contribute to job-related
decisions
Activity
Preference
a preference by the worker to remain active and busy at their job
Extrinsic domain
Sub-scale Interpretation
Attitude toward
Earnings
the value an individual places in making money on the job
Social Status of
Job
effect the job on a person's standing among his friends, relatives,
and co-workers
Mixed character domain
Sub-scale Interpretation
Upward Striving continually seeking a higher level job and better standard of living
Responsibility to
Work
recognition of an obligation to work
Source: Wollack et al. (1971)
Figure 5-7 Wollack et al.’s domains and constructs
The scale items described in Figure 5-8 have been derived as follows:
ME1, ME2, ME3 and ME5 all relate to the Intrinsic Domain sub-scales:
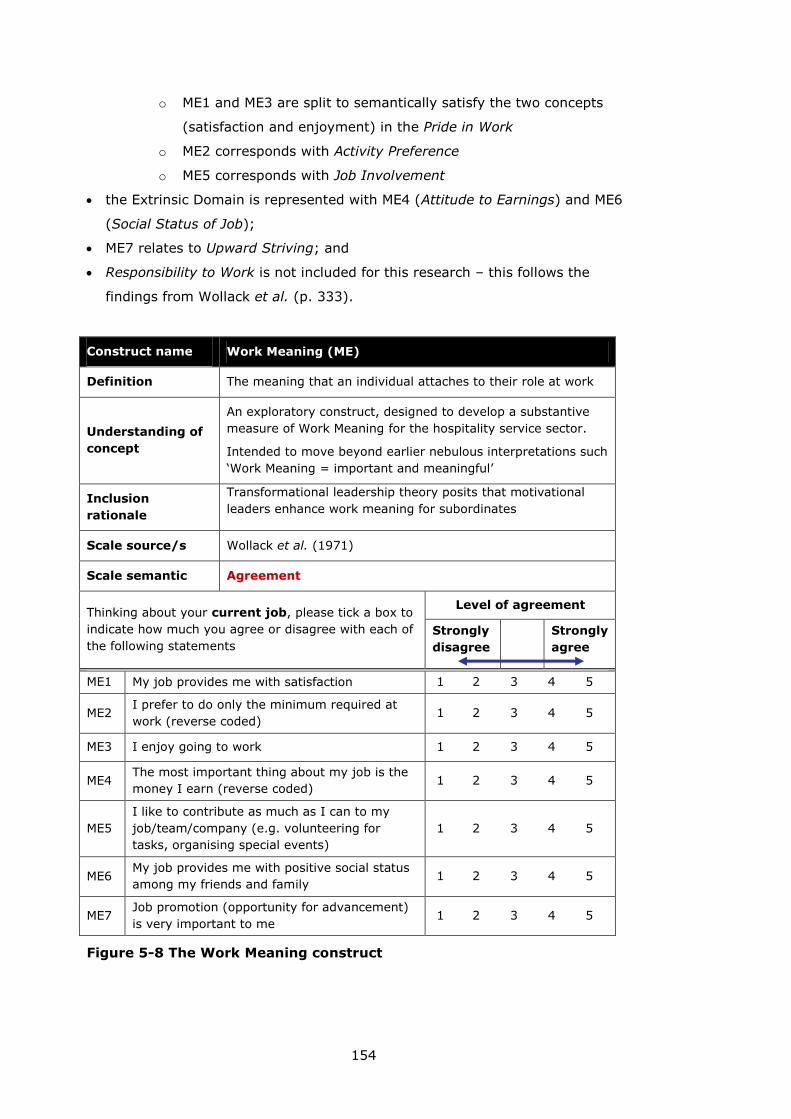
154
o ME1 and ME3 are split to semantically satisfy the two concepts
(satisfaction and enjoyment) in the Pride in Work
o ME2 corresponds with Activity Preference
o ME5 corresponds with Job Involvement
the Extrinsic Domain is represented with ME4 (Attitude to Earnings) and ME6
(Social Status of Job);
ME7 relates to Upward Striving; and
Responsibility to Work is not included for this research – this follows the
findings from Wollack et al. (p. 333).
Construct name Work Meaning (ME)
Definition The meaning that an individual attaches to their role at work
Understanding of
concept
An exploratory construct, designed to develop a substantive
measure of Work Meaning for the hospitality service sector.
Intended to move beyond earlier nebulous interpretations such
‘Work Meaning = important and meaningful’
Inclusion
rationale
Transformational leadership theory posits that motivational
leaders enhance work meaning for subordinates
Scale source/s Wollack et al. (1971)
Scale semantic Agreement
Thinking about your current job, please tick a box to
indicate how much you agree or disagree with each of
the following statements
Level of agreement
Strongly
disagree
Strongly
agree
ME1 My job provides me with satisfaction 1 2 3 4 5
ME2 I prefer to do only the minimum required at
work (reverse coded) 1 2 3 4 5
ME3 I enjoy going to work 1 2 3 4 5
ME4 The most important thing about my job is the
money I earn (reverse coded) 1 2 3 4 5
ME5
I like to contribute as much as I can to my
job/team/company (e.g. volunteering for
tasks, organising special events)
1 2 3 4 5
ME6 My job provides me with positive social status
among my friends and family 1 2 3 4 5
ME7 Job promotion (opportunity for advancement)
is very important to me 1 2 3 4 5
Figure 5-8 The Work Meaning construct
155
ME2 and ME4 are both reverse-worded / reverse-coded in an attempt to avoid
acquiescence bias. There is, however, no consensus on the use or non-use of
reverse-polarity items in psychometric scale design. Ray (1983), for example,
found scales including reverse-polarity items (balanced scales) to perform better
than unbalanced ones containing non-reversed items. Elsewhere, however,
Herche and Engelland (1996) found that using reversed-polarity items negatively
affected scale unidimensionality.
The target population for this research has a mixed geographic origin with 36 per
cent having a non-UK (People 1st 2011a; 2011b; 2011c). Consequently, a
significant proportion of respondents are likely to have a first language other than
English. With regard to the issue of using psychometric scales in cross-cultural
contexts (which includes language differences), (Wong et al. 2003) have found
that using reverse polarity can introduce problems with construct validity in
multivariate modelling. Based on the research above, it was decided to employ a
small number of reverse-polarity items and to monitor the performance of these
in the pilot study.
Organisational Commitment
Organisational commitment is the third employee attitude to be included as a
latent variable in this study and has been defined as '...the relative strength of an
individual's identification with and involvement in a particular organization'
(Mowday et al. 1979: 226).
The organisational commitment construct is a commonly-studied employee
attitude in organisational studies (Huelsman 2007) and was flagged as a variable
of interest during the reviews of generic and applied hospitality leadership work
(e.g. Bartkus et al. 1997; Yousef 2000; Chiang and Jang 2008; Erkutlu 2008;
Yiing and Ahmad 2009). Furthermore, the examination of the applied hospitality
literature revealed a number of studies that had included an organisational
commitment measure.
A summary of these studies is provided in Table 5-1.
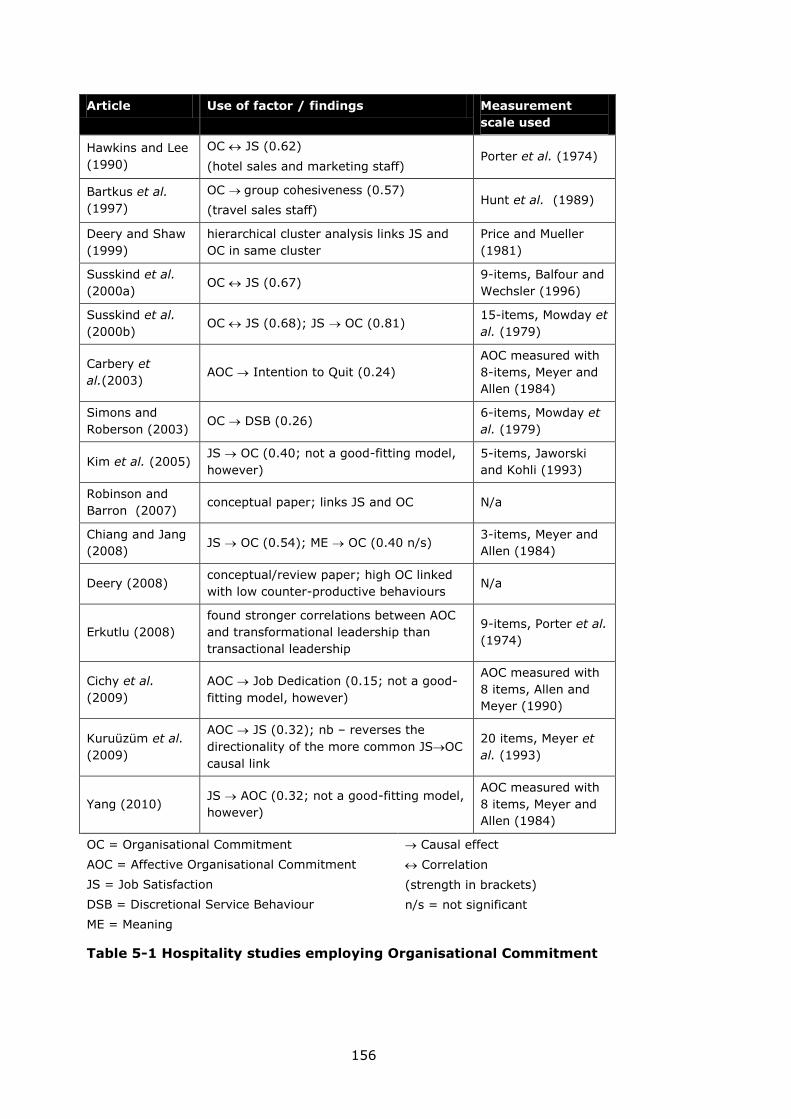
156
Article Use of factor / findings Measurement
scale used
Hawkins and Lee
(1990)
OC JS (0.62)
(hotel sales and marketing staff) Porter et al. (1974)
Bartkus et al.
(1997)
OC group cohesiveness (0.57)
(travel sales staff) Hunt et al. (1989)
Deery and Shaw
(1999)
hierarchical cluster analysis links JS and
OC in same cluster
Price and Mueller
(1981)
Susskind et al.
(2000a) OC JS (0.67)
9-items, Balfour and
Wechsler (1996)
Susskind et al.
(2000b) OC JS (0.68); JS OC (0.81)
15-items, Mowday et
al. (1979)
Carbery et
al.(2003) AOC Intention to Quit (0.24)
AOC measured with
8-items, Meyer and
Allen (1984)
Simons and
Roberson (2003) OC DSB (0.26)
6-items, Mowday et
al. (1979)
Kim et al. (2005) JS OC (0.40; not a good-fitting model,
however)
5-items, Jaworski
and Kohli (1993)
Robinson and
Barron (2007) conceptual paper; links JS and OC N/a
Chiang and Jang
(2008) JS OC (0.54); ME OC (0.40 n/s)
3-items, Meyer and
Allen (1984)
Deery (2008) conceptual/review paper; high OC linked
with low counter-productive behaviours N/a
Erkutlu (2008)
found stronger correlations between AOC
and transformational leadership than
transactional leadership
9-items, Porter et al.
(1974)
Cichy et al.
(2009)
AOC Job Dedication (0.15; not a good-
fitting model, however)
AOC measured with
8 items, Allen and
Meyer (1990)
Kuruüzüm et al.
(2009)
AOC JS (0.32); nb – reverses the
directionality of the more common JSOC
causal link
20 items, Meyer et
al. (1993)
Yang (2010) JS AOC (0.32; not a good-fitting model,
however)
AOC measured with
8 items, Meyer and
Allen (1984)
OC = Organisational Commitment
AOC = Affective Organisational Commitment
JS = Job Satisfaction
DSB = Discretional Service Behaviour
ME = Meaning
Causal effect
Correlation
(strength in brackets)
n/s = not significant
Table 5-1 Hospitality studies employing Organisational Commitment
157
Organisational Commitment (OC) has been conceptualised and operationalised in
a number of different ways: Mathieu and Zajac (1990: 171-172) note that many
researchers follow the model developed by Porter, Mowday, Steers and colleagues
(e.g. Porter et al. 1974; Mowday et al. 1979) which features the three domains
of:
Affective Commitment – AC, which describes an individual’s emotional
attachment to their organisation;
Normative Commitment – NC, which describes the individual’s perceived
obligation to continue with their occupation / organisation; and
Continuance Commitment – CC, which relates to an individual’s assessment of
the relative costs and benefits of staying with or leaving their job/organisation.
Carbery et al. describe these domains neatly:
Employees with strong affective commitment remain because they
want to, those with strong continuance commitment because they
need to, and those with strong normative commitment because they
feel they ought to do so.
(Carbery et al. 2003: 657)
Of these three domains, Affective Commitment is of the greatest interest for this
research as, of the three OC domains, it is this one that is the most amenable to
being positively influenced by leader behaviour. Writing before the term Affective
Commitment was coined, Buchanan (1974) describes this type of commitment as
a:
...partisan, affective attachment to the goals and values of one’s role
in relation to the goals and values, and to the organisation for its own
sake, apart from its purely instrumental worth
(Buchanan 1974: 533)
Within Buchanan’s definition it is possible to see the linkages with the
Inspirational Motivation domain of transformational leadership wherein the
valorisation of vision and goals is central. In contrast, Normative Commitment
describes, in transactional leadership parlance, an obligational or ‘contractual’
commitment, while Continuance Commitment is based on an employee’s rational
assessment based on a range of job-related costs and benefits.
The most popularly-applied measure of OC in the hospitality literature has been
the 24-item scale developed by Meyer and Allen (Meyer and Allen 1984; Allen and
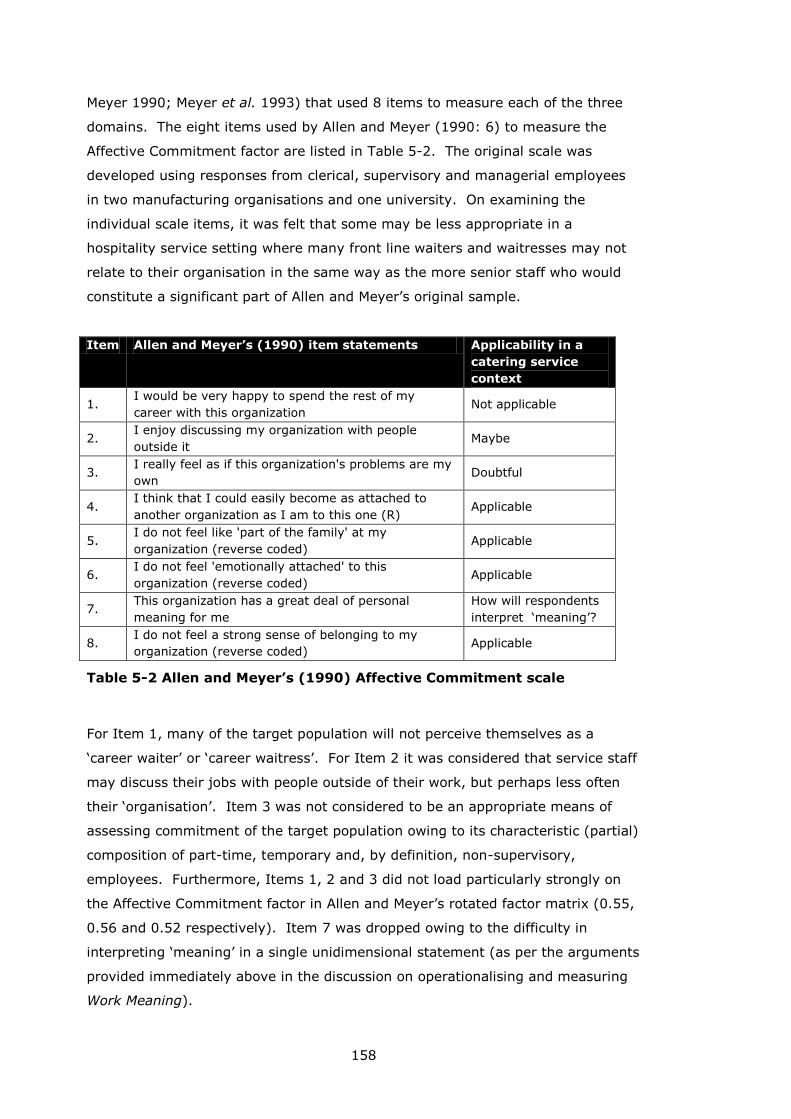
158
Meyer 1990; Meyer et al. 1993) that used 8 items to measure each of the three
domains. The eight items used by Allen and Meyer (1990: 6) to measure the
Affective Commitment factor are listed in Table 5-2. The original scale was
developed using responses from clerical, supervisory and managerial employees
in two manufacturing organisations and one university. On examining the
individual scale items, it was felt that some may be less appropriate in a
hospitality service setting where many front line waiters and waitresses may not
relate to their organisation in the same way as the more senior staff who would
constitute a significant part of Allen and Meyer’s original sample.
Item Allen and Meyer’s (1990) item statements Applicability in a
catering service
context
1. I would be very happy to spend the rest of my
career with this organization Not applicable
2. I enjoy discussing my organization with people
outside it Maybe
3. I really feel as if this organization's problems are my
own Doubtful
4. I think that I could easily become as attached to
another organization as I am to this one (R) Applicable
5. I do not feel like 'part of the family' at my
organization (reverse coded) Applicable
6. I do not feel 'emotionally attached' to this
organization (reverse coded) Applicable
7. This organization has a great deal of personal
meaning for me
How will respondents
interpret ‘meaning’?
8. I do not feel a strong sense of belonging to my
organization (reverse coded) Applicable
Table 5-2 Allen and Meyer’s (1990) Affective Commitment scale
For Item 1, many of the target population will not perceive themselves as a
‘career waiter’ or ‘career waitress’. For Item 2 it was considered that service staff
may discuss their jobs with people outside of their work, but perhaps less often
their ‘organisation’. Item 3 was not considered to be an appropriate means of
assessing commitment of the target population owing to its characteristic (partial)
composition of part-time, temporary and, by definition, non-supervisory,
employees. Furthermore, Items 1, 2 and 3 did not load particularly strongly on
the Affective Commitment factor in Allen and Meyer’s rotated factor matrix (0.55,
0.56 and 0.52 respectively). Item 7 was dropped owing to the difficulty in
interpreting ‘meaning’ in a single unidimensional statement (as per the arguments
provided immediately above in the discussion on operationalising and measuring
Work Meaning).
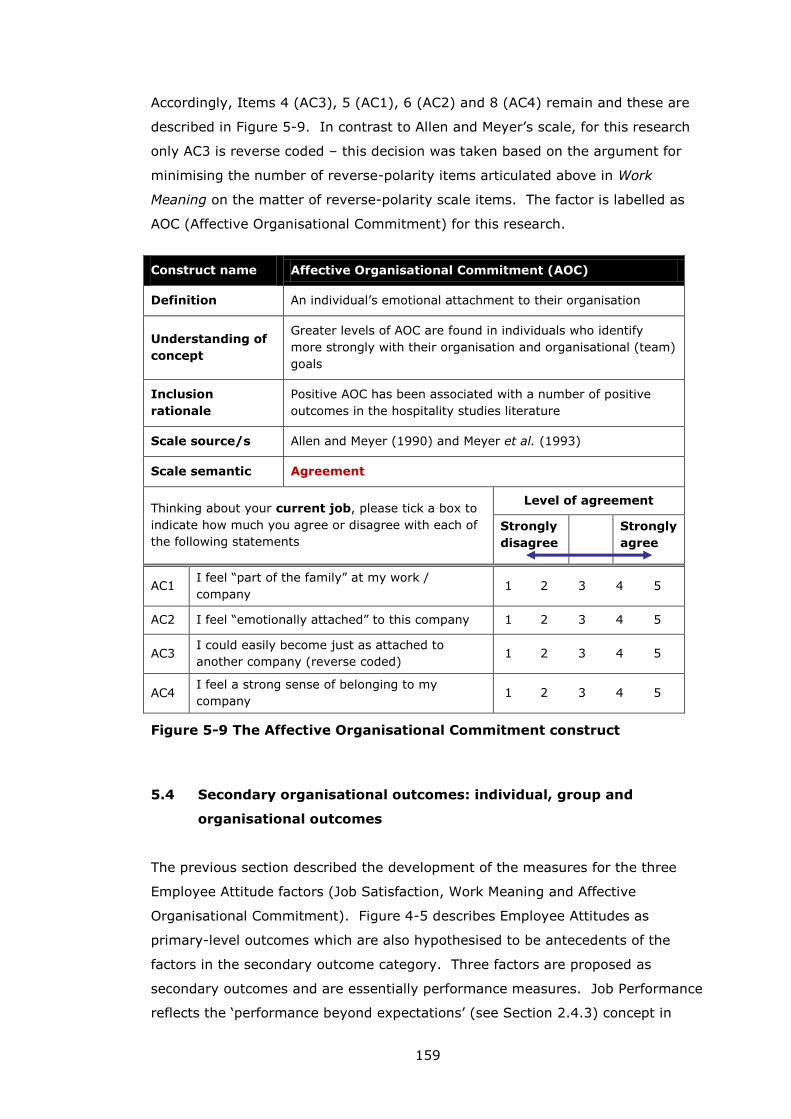
159
Accordingly, Items 4 (AC3), 5 (AC1), 6 (AC2) and 8 (AC4) remain and these are
described in Figure 5-9. In contrast to Allen and Meyer’s scale, for this research
only AC3 is reverse coded – this decision was taken based on the argument for
minimising the number of reverse-polarity items articulated above in Work
Meaning on the matter of reverse-polarity scale items. The factor is labelled as
AOC (Affective Organisational Commitment) for this research.
Construct name Affective Organisational Commitment (AOC)
Definition An individual’s emotional attachment to their organisation
Understanding of
concept
Greater levels of AOC are found in individuals who identify
more strongly with their organisation and organisational (team)
goals
Inclusion
rationale
Positive AOC has been associated with a number of positive
outcomes in the hospitality studies literature
Scale source/s Allen and Meyer (1990) and Meyer et al. (1993)
Scale semantic Agreement
Thinking about your current job, please tick a box to
indicate how much you agree or disagree with each of
the following statements
Level of agreement
Strongly
disagree
Strongly
agree
AC1 I feel “part of the family” at my work /
company 1 2 3 4 5
AC2 I feel “emotionally attached” to this company 1 2 3 4 5
AC3 I could easily become just as attached to
another company (reverse coded) 1 2 3 4 5
AC4 I feel a strong sense of belonging to my
company 1 2 3 4 5
Figure 5-9 The Affective Organisational Commitment construct
5.4 Secondary organisational outcomes: individual, group and
organisational outcomes
The previous section described the development of the measures for the three
Employee Attitude factors (Job Satisfaction, Work Meaning and Affective
Organisational Commitment). Figure 4-5 describes Employee Attitudes as
primary-level outcomes which are also hypothesised to be antecedents of the
factors in the secondary outcome category. Three factors are proposed as
secondary outcomes and are essentially performance measures. Job Performance
reflects the ‘performance beyond expectations’ (see Section 2.4.3) concept in
160
Bass and Avolio’s Full-Range Leadership Model (FRLM) (Bass 1988, 1999; Avolio
and Bass 2004a; Bass and Avolio 2008) and is included in the model to measure
performance at an individual level. The DSB (Discretionary Service Behaviour)
factor was developed by (Blancero and Johnson 1997, 2001) and operationalised
by Simons and Roberson (2003) and is included in this research as a measure of
performance at the group level (following Simons and Roberson DSB is measured
using respondents’ perceptions of co-worker performance). Lastly, the Service
Quality factor was developed specifically for this research as an exploratory factor
designed to measure service quality based on employees’ responses regarding the
frequency of selected service failures.
Both Job Performance (JP) and Discretionary Service Behaviour (DSB) measure
employees’ job performance. Job Performance (JP) is developed from the
research narratives that posit extra effort as a measure of motivated employees
(e.g. Georgopoulos et al. 1957: 345) and leadership theory where extra effort is
one outcome of transformational leadership (e.g. Bass and Avolio 2008; Limsila
and Ogunlana 2008: 167). By employing these two measures, the research is
specifically attempting to evaluate the influence of motivational leadership on
employee performance. By using JP as a self-assessment and DSB as a peer-
assessment, it is hoped that any self-reporting bias can be accounted for (or even
that the existence of inflated self-assessment scores can be refuted).
Job Performance (individual-level outcome)
At the heart of Bass’s theory of transformational leadership is the proposal that
transformational leaders inspire and motivate their subordinates to expend ‘extra
effort’ and ‘perform beyond expectations’ (Bass 1985; Bass and Riggio 2006, see
especially Ch 4). Performance Beyond Expectations is measured using a three-
item factor called Extra Effort in the Multi-Factor Leadership Questionnaire (MLQ;
Avolio and Bass 2004a). The MLQ is, however, a proprietary survey instrument
and, accordingly, an alternative four-item measure of job performance was
developed for this research by drawing out the key components of ‘extra effort’
from the published literature on Bass’s transformational leadership theory (Bass
1988; Bass and Avolio 1990a; Bass 1990a; Bass and Riggio 2006)
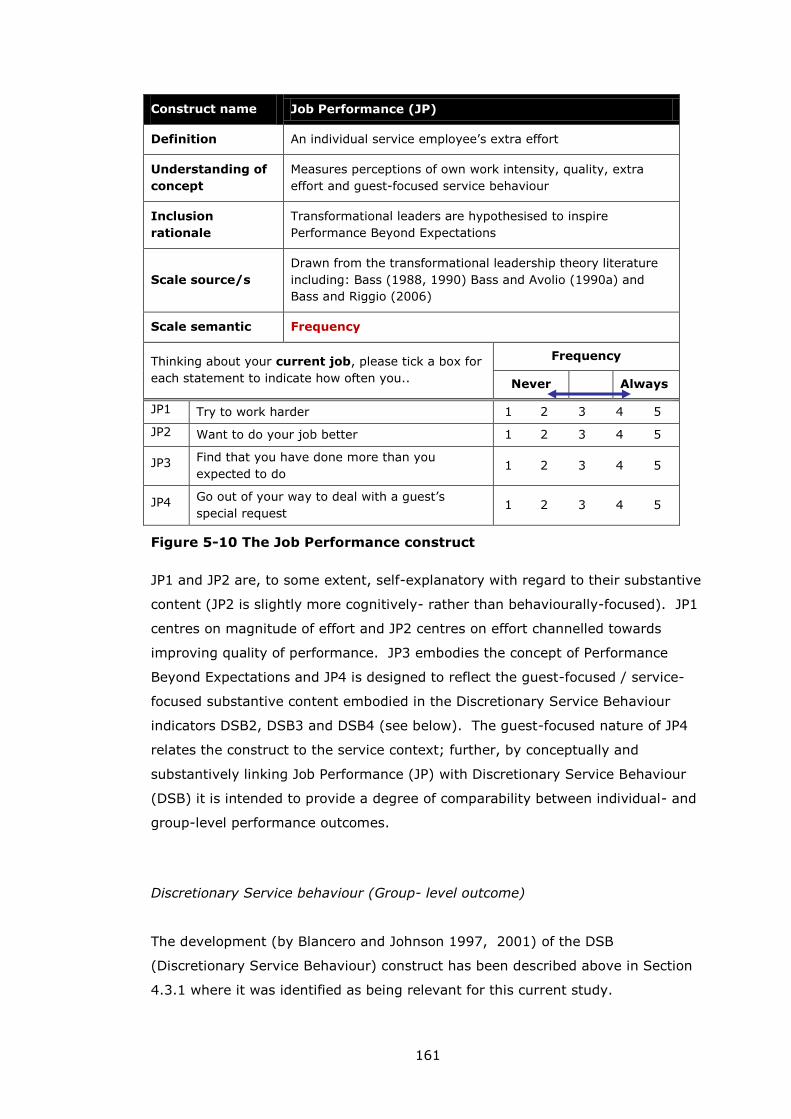
161
Construct name Job Performance (JP)
Definition An individual service employee’s extra effort
Understanding of
concept
Measures perceptions of own work intensity, quality, extra
effort and guest-focused service behaviour
Inclusion
rationale
Transformational leaders are hypothesised to inspire
Performance Beyond Expectations
Scale source/s
Drawn from the transformational leadership theory literature
including: Bass (1988, 1990) Bass and Avolio (1990a) and
Bass and Riggio (2006)
Scale semantic Frequency
Thinking about your current job, please tick a box for
each statement to indicate how often you..
Frequency
Never Always
JP1 Try to work harder 1 2 3 4 5
JP2 Want to do your job better 1 2 3 4 5
JP3 Find that you have done more than you
expected to do 1 2 3 4 5
JP4 Go out of your way to deal with a guest’s
special request 1 2 3 4 5
Figure 5-10 The Job Performance construct
JP1 and JP2 are, to some extent, self-explanatory with regard to their substantive
content (JP2 is slightly more cognitively- rather than behaviourally-focused). JP1
centres on magnitude of effort and JP2 centres on effort channelled towards
improving quality of performance. JP3 embodies the concept of Performance
Beyond Expectations and JP4 is designed to reflect the guest-focused / service-
focused substantive content embodied in the Discretionary Service Behaviour
indicators DSB2, DSB3 and DSB4 (see below). The guest-focused nature of JP4
relates the construct to the service context; further, by conceptually and
substantively linking Job Performance (JP) with Discretionary Service Behaviour
(DSB) it is intended to provide a degree of comparability between individual- and
group-level performance outcomes.
Discretionary Service behaviour (Group- level outcome)
The development (by Blancero and Johnson 1997, 2001) of the DSB
(Discretionary Service Behaviour) construct has been described above in Section
4.3.1 where it was identified as being relevant for this current study.

162
To employ the DSB construct for empirical research requires it to be
operationalised and this process has been undertaken by Simons and Roberson
(2003). Simons and Roberson (2003: 436) describe using the DSB concept for
the development of a four item scale for structural equation modelling. They
designed these items for a peer evaluation of co-worker behaviour based on Van
Dyne and LePine’s (1998) finding that peer evaluations were more representative
of actual behaviour then self-assessment.
Construct name Discretionary Service Behaviour (DSB)
Definition Co-workers’ guest-directed extra effort
Understanding of
concept
DSB describes a service employee’s discretionary (i.e. beyond
expectations) guest-focused service behaviour
Inclusion rationale
(A) to test the DSB construct in an independent sample
following the work of Simons and Roberson (2003); and
(B) to provide a performance measure at the group level
Scale source/s Blancero and Johnson (1997, 2001); Simons and Roberson
(2003)
Scale semantic Frequency
Looking at each of the four statements below, please
tick a box to describe how often you have seen this
behaviour in your current workplace.
Frequency
Never Always
DSB1 My co-workers show they take guests'
concerns very seriously 1 2 3 4 5
DSB2
If one of my co-workers does not know the
answer to a guest's question, he or she makes
an effort to find out
1 2 3 4 5
DSB3 My co-workers go out of their way to deliver a
guest's special request 1 2 3 4 5
DSB4
If a guest approaches when one of my co-
workers is busy, he or she stops whatever they
are doing and talks with the guest
1 2 3 4 5
Figure 5-11 The Discretionary Service Behaviour construct
Only two of the four items were reported in Simons and Roberson (2003) –
accordingly, the first author was contacted and he provided details of all of the
items along with a brief background and rationale for their design (Simons 2010,
personal communication). The four items developed and used by Simons and
Robertson (Simons and Roberson 2003; Simons 2010) are described in Figure
5-11 alongside summary details of how the contruct relates to the current
research.
163
For the purposes of this research, the DSB construct is attractive because:
(i) it corresponds closely with the concept of Performance Beyond Expectations
and, therefore, with the Job Performance factor developed above; but
(ii) it measures a group-level organisational outcome (rather than the individual-
level as is the case for the Job Performance construct above); and
(ii) it can contribute to the research by providing an additional behavioural
measure of work motivation/extra effort which:
a. avoids self-reporting bias; and
b. is specifically designed for customer contact service encounters.
Service Quality (Organisational-level outcome)
Service Quality (SQ) has been identified as a core positive organisational outcome
for hospitality organisations (Go et al. 1996: 1; Hartline and Ferrell 1996: 52-53;
Wilkins et al. 2007) and of key importance in a more general organisational
context as a key contributor to a number productive organisational outcomes
including profitability, costs, customer satisfaction and retention, and positive
word-of-mouth customer evaluations (Buttle 1996: 8). Service Quality has been
measured using the SERVQUAL instrument developed by Parasuraman, Berry and
Zeithaml (Parasuraman et al. 1985, 1988; Parasuraman et al. 1991) and the
SERVQUAL instrument has been employed in a number of hospitality research
studies (e.g. Lee and Hing; Armstrong et al. 1997; Atilla 2006; Murphy et al.
2007; Nam and Lee 2011). Elsewhere, Stevens et al. (1995) have adapted the
22-item, five-factor SERVQUAL instrument for the catering context, creating a 29-
item, five-factor measurement scale called DINESERV.
Both SERVQUAL and DINESERV are based on assessments of discrepancies
between customers’ service expectations and their subsequent evaluations of the
service provided. For this research, however, accessing customer evaluations of
service quality is not a practical method. Specifically, this research involves
gaining the support of hospitality organisations (hotels) in order to collect data
from the population of interest (non-supervisory service employees in table
service restaurants) within the participating hotels. In practice it was extremely
difficult to secure the support of an adequate number of hotels – such difficulties
were anticipated (although not to the extent that they were actually experienced!)
and accordingly, during the research design stage it was considered that
attempting a concurrent customer survey alongside the employee survey would:
164
result in fewer hotels agreeing to participate; and
of those who did agree to participate, fewer would return both employee and
customer surveys.
Further problematic issues surrounding the idea of a customer survey included the
practical consideration that hotel businesses would likely be resistant to
customers being burdened with requests to participate in (i) any survey and (ii)
particularly one that was not part of the business’s own quality assessment
programme. A further (methodological) consideration was that it would be
extremely difficult to ensure that the surveyed customers were responding to the
service they had from the responding employees (in order that the research could
claim to examine the leadership motivation → customer service causal link).
Based on the arguments and concerns discussed above, a method for measuring
service quality based on employee perceptions was sought. A search of the social
science literature revealed a study by Schneider et al. (1980) that found strong
correlations between customer and employee perceptions of a number of service-
related variables in 23 retail banks including general service quality (r = 0.67;
p<0.01); this finding was replicated by Schneider and Bowen (1985) in a follow-
up study also based on banking organisations. Another banking-sector study to
evaluate correlations between employee perceptions of service climate and
customer perceptions of service quality was undertaken by Johnson (1996) and
found that employee perceptions of service climate correlated with overall
customer satisfaction (r = 0.40; p<0.01).
Bitner et al. (1994) interviewed employees in hotel, restaurant and airline
organisations and asked these employees to describe critical service encounters
that caused satisfaction or dissatisfaction for their customers. These data were
then compared with data from an earlier survey of hotel, restaurant and airline
organisations’ customers by the same research team (Bitner et al. 1990) where
customers were asked to describe critical service encounters that caused them
satisfaction or dissatisfaction. The 1994 study was designed to examine whether
‘...customers and employees report the same kinds of events and behaviors
leading to satisfaction and dissatisfaction in service encounters’ (Bitner et al.
1994: 97).
Bitner et al. (1994) sorted customer and employee responses into three
categories for comparison:
Group 1. Employee Response to Service Delivery and System Failures
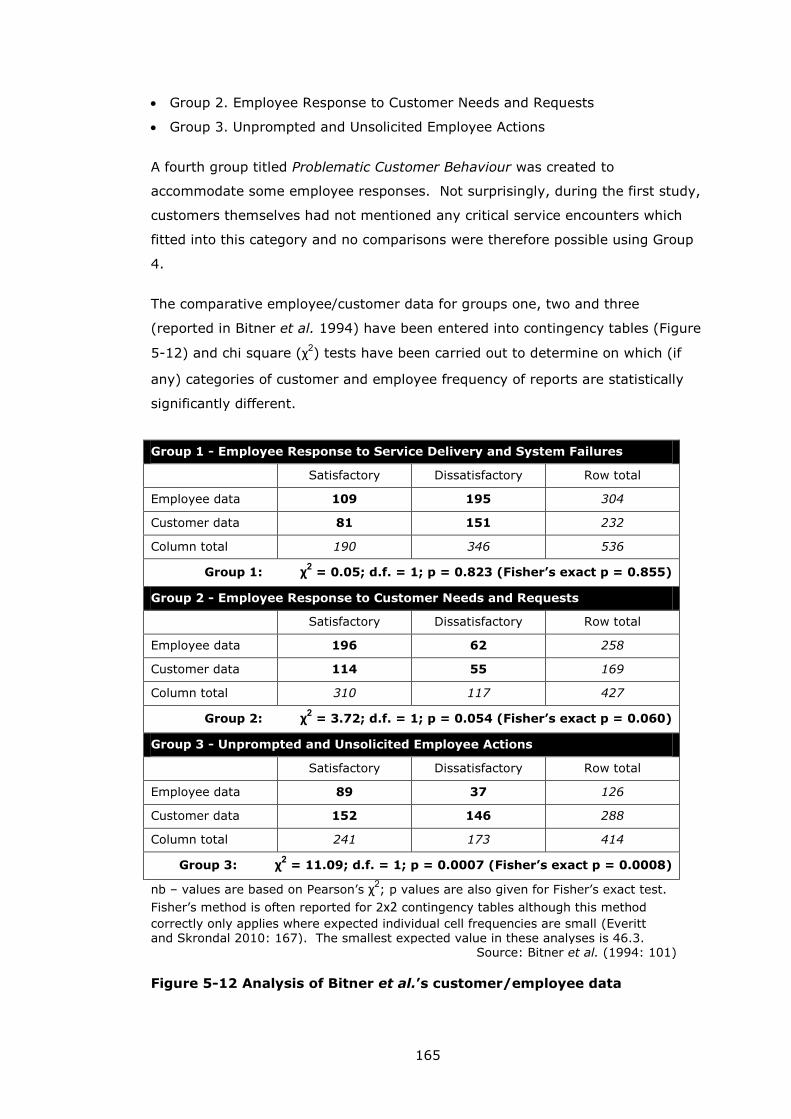
165
Group 2. Employee Response to Customer Needs and Requests
Group 3. Unprompted and Unsolicited Employee Actions
A fourth group titled Problematic Customer Behaviour was created to
accommodate some employee responses. Not surprisingly, during the first study,
customers themselves had not mentioned any critical service encounters which
fitted into this category and no comparisons were therefore possible using Group
4.
The comparative employee/customer data for groups one, two and three
(reported in Bitner et al. 1994) have been entered into contingency tables (Figure
5-12) and chi square (χ2) tests have been carried out to determine on which (if
any) categories of customer and employee frequency of reports are statistically
significantly different.
Group 1 - Employee Response to Service Delivery and System Failures
Satisfactory Dissatisfactory Row total
Employee data 109 195 304
Customer data 81 151 232
Column total 190 346 536
Group 1: χ2 = 0.05; d.f. = 1; p = 0.823 (Fisher’s exact p = 0.855)
Group 2 - Employee Response to Customer Needs and Requests
Satisfactory Dissatisfactory Row total
Employee data 196 62 258
Customer data 114 55 169
Column total 310 117 427
Group 2: χ2 = 3.72; d.f. = 1; p = 0.054 (Fisher’s exact p = 0.060)
Group 3 - Unprompted and Unsolicited Employee Actions
Satisfactory Dissatisfactory Row total
Employee data 89 37 126
Customer data 152 146 288
Column total 241 173 414
Group 3: χ2 = 11.09; d.f. = 1; p = 0.0007 (Fisher’s exact p = 0.0008)
nb – values are based on Pearson’s χ2; p values are also given for Fisher’s exact test.
Fisher’s method is often reported for 2x2 contingency tables although this method
correctly only applies where expected individual cell frequencies are small (Everitt and Skrondal 2010: 167). The smallest expected value in these analyses is 46.3.
Source: Bitner et al. (1994: 101)
Figure 5-12 Analysis of Bitner et al.’s customer/employee data
166
Bitner et al.’s 1994 article examined differences between groups so it was
necessary to undertake a new analysis to examine with-group differences. The
rationale for the current analysis is that categories where there is no statistically
significant difference between frequencies of employee and customer responses
will be suitable for use in measuring employee-based assessments of service
quality. The chi square analysis shows that only in Group 3 is there a statistically
significant difference between frequencies of employee and customer reports on
satisfactory and unsatisfactory service encounters. The p value for Group 2 is
reasonably close to the 0.05 cut-off reflecting the discrepancy between
frequencies of customer and employee reports of Satisfactory critical service
encounters that fall into the Group 2 category. There is no statistically significant
difference, however, between employee and customer reports in Group 2’s
Dissatisfactory category.
Based on these analyses, it was decided to use the individual classifications found
in Groups 1 and 2 of Bitner et al.’s (1990, 1994) studies. The specific service
encounters reported by employees and customers that were classified into Groups
1 and 2 are as follows:
Group 1. Employee Response to Service Delivery and System Failures
1. To unavailable service
2. To unreasonably slow service
3. To other core service failures
Group 2. Employee Response to Customer Needs and Requests
4. To ‘special needs’ customers
5. To customer preferences
6. To admitted customer error
7. To potentially disruptive others
These service encounters were adapted for this study by altering the wording in
an attempt to present a clear concept of the type of situation each of the service
encounters refers to. The item wordings are described in Figure 5-13 and the
order of items follows the descriptions of Group 1 items 1 to 3 and Group 2 items
4 to 7 above.
One shortcoming of this approach to measuring service quality is that is based on
the frequency that each respondent is able to deal with each type of service
failure / negative situation while maintaining customer satisfaction. Of course, it
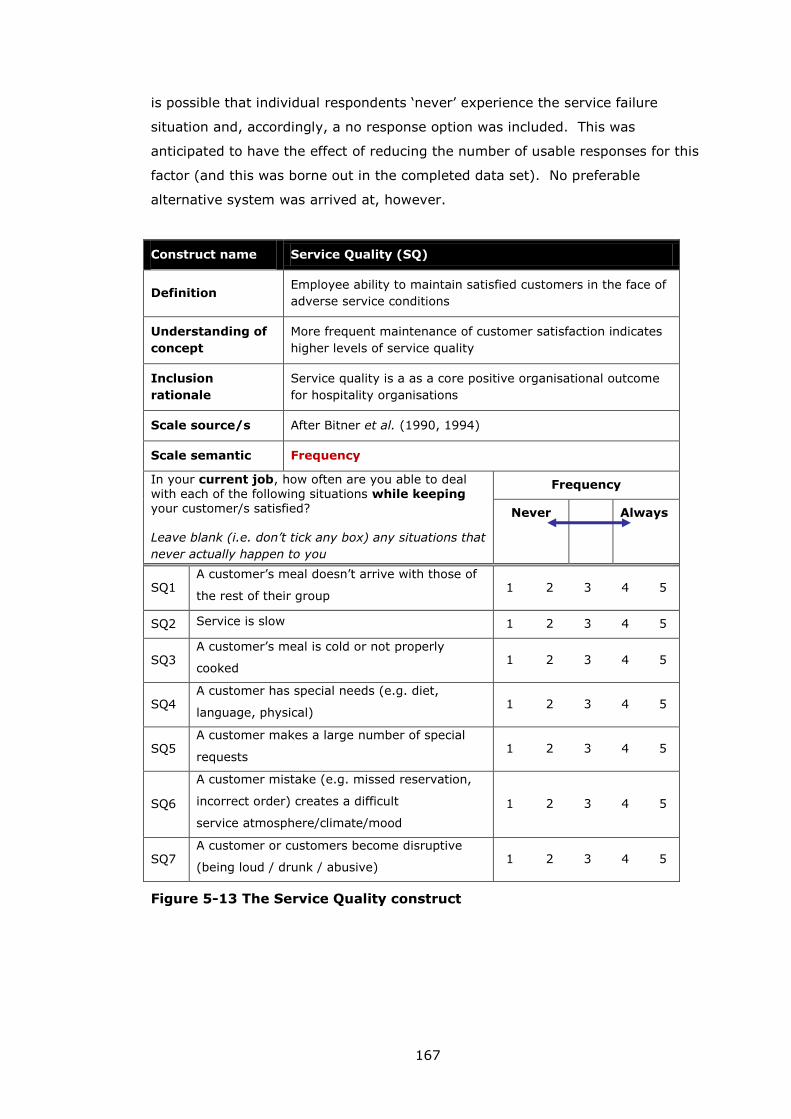
167
is possible that individual respondents ‘never’ experience the service failure
situation and, accordingly, a no response option was included. This was
anticipated to have the effect of reducing the number of usable responses for this
factor (and this was borne out in the completed data set). No preferable
alternative system was arrived at, however.
Construct name Service Quality (SQ)
Definition Employee ability to maintain satisfied customers in the face of
adverse service conditions
Understanding of
concept
More frequent maintenance of customer satisfaction indicates
higher levels of service quality
Inclusion
rationale
Service quality is a as a core positive organisational outcome
for hospitality organisations
Scale source/s After Bitner et al. (1990, 1994)
Scale semantic Frequency
In your current job, how often are you able to deal with each of the following situations while keeping your customer/s satisfied?
Leave blank (i.e. don’t tick any box) any situations that
never actually happen to you
Frequency
Never Always
SQ1 A customer’s meal doesn’t arrive with those of
the rest of their group 1 2 3 4 5
SQ2 Service is slow 1 2 3 4 5
SQ3 A customer’s meal is cold or not properly
cooked 1 2 3 4 5
SQ4 A customer has special needs (e.g. diet,
language, physical) 1 2 3 4 5
SQ5 A customer makes a large number of special
requests 1 2 3 4 5
SQ6
A customer mistake (e.g. missed reservation,
incorrect order) creates a difficult
service atmosphere/climate/mood
1 2 3 4 5
SQ7 A customer or customers become disruptive
(being loud / drunk / abusive) 1 2 3 4 5
Figure 5-13 The Service Quality construct
168
5.5 Summary of Chapters 4 and 5
Chapter 4 set out to develop a framework to accommodate and organise the
latent variables (Figure 4-2) and to assist (alongside the findings from the reviews
of the generic and hospitality leadership literature) in theoretically informing the
development of the hypotheses for the design of the survey instrument and
analytical framework (Figure 4-3 and Figure 4-5).
The work described in Section 4.1 revealed that the work motivation literature is
somewhat fragmented, meaning that it was necessary (in Section 4.2) to shift the
focus of the analysis to the broader industrial and organisational psychology level
to develop this framework. That it was necessary to draw upon the overarching
domain of industrial and organisational psychology reflects the fact that this
research contains elements of leadership and work motivation studies, both of
which are sub-areas of industrial and organisational psychology (see e.g. Alliger
1992).
Section 4.3 reviews the applied hospitality motivation literature and identifies
Discretionary Service Behaviour (DSB) (Blancero and Johnson 1997, 2001;
Simons and Roberson 2003) as a construct of interest and also finds support for
the inclusion of the Social Support construct. A significant finding from Section
4.3 is that, like hospitality leadership studies, hospitality motivation studies
remain at an early stage where researchers are utilising a range of available
theoretical approaches and applying these to a number of specific organisational
foci.
Chapter 5 elaborates the rationale for the inclusion of each of the latent factors
and, with reference to the published research, describes and justifies the
development of the indicator variables for each of the latent factors.
A common theme in developing the indicators for the factors has been the
adaption of existing scales for use in this work. In some cases this has been
undertaken to truncate a very large scale (e.g. Smith et al.’s Job Description
Index [for the Job Satisfaction factor] at 73 items and Wollack et al.’s Survey of
Work Values) and in others to focus on one or more sub-scales of interest from
within a larger measurement instrument (as with Allen and Meyer’s (1993)
Organisational Commitment scale and Hancer and George’s (2003) Empowerment
scale). Restricting the length of the survey form is important for (a) minimising
169
non-responses due to respondent question fatigue and (b) demonstrating the
brevity of the survey to hotel senior managers who in this case are ‘gatekeepers’
to the population of interest. The Service Quality construct stands somewhat
separately in terms of how it was developed. Specifically, this construct is
entirely exploratory having been developed from concepts and findings from a
non-psychometric source study (Bitner et al. 1990, 1994).
It is entirely normal to make adaptions to existing scales to render them more
appropriate for a specific context, either in relation to reducing the number of
items or adjusting the substantive content. For examples of scale adaptions in
the hospitality organisational studies context see the discussions above on
previous work on Organisational Commitment and Employee Empowerment.
Nevertheless, such a course of action does bring epistemological / methodological
implications for the research. Specifically, an exploratory element is introduced to
the research and, as a consequence, the confirmatory factor analysis (which
provides the analytical method for the measurement model in SEM analyses) is no
longer strictly confirmatory and the broader SEM process enters a model
development mode.
Accordingly, under these conditions the researcher must prepare for the
eventuality that some of the factors may not converge on a statistically
acceptable solution and may therefore have to be removed from the model.
Somewhat less severely, it may the case that one or more indicators have to be
dropped from a latent factor in order to achieve statistical convergence and this
may affect the substantive content of the factor. Such modifications may also
have implications for the broader structural model where causal relations between
factors are evaluated. The issues are examined in greater detail in the following
section.
170
6 METHODS FOR DATA COLLECTION AND ANALYSIS
This research aims to explore and evaluate the contribution of motivational
leadership to employee work motivation in hospitality services and to do this
within the broader organisational / motivational context by also measuring how a
number of non-leadership phenomena contribute to employee work motivation.
Structural equation modelling provides a method to empirically examine and
evaluate these inter-relationships.
Following a general introduction to SEM, this chapter goes on to discuss the
chosen modelling approach, the specific type of SEM analysis that will be
performed and details of how the models will specified, estimated and tested.
The data requirements for SEM analysis inform the survey design in general and
the design of the survey instrument in particular. This chapter also describes the
concomitant development of the survey instrument and refinement of the
measurement scales following which the procedure for the administration of the
survey instrument is detailed.
A more detailed description of, and justification for, the specific methods
employed in the SEM analyses is provided in Chapter Error! Reference source
not found. alongside the development of the first SEM model. The development
of the subsequent models is then reported in a less exhaustive manner with new
techniques introduced as appropriate.
6.1 Structural equation modelling
Structural equation modelling (SEM) is a multivariate statistical procedure for
providing insights into the relationships between phenomena. SEM is particularly
useful when the phenomena of interest cannot readily be measured using a single
variable – that is, when dealing with multifaceted phenomena that can be more
accurately measured (and more adequately represented) using a range of
variables rather than just one. SEM achieves this by using the confirmatory factor
analysis (CFA) technique to measure these unobservable (latent) variables based
on the ‘effect’ that the latent variable has on the observable (indicator) variables.
Latent variables can also be referred to as factors, or constructs, and indicator
variables are also referred to as items.
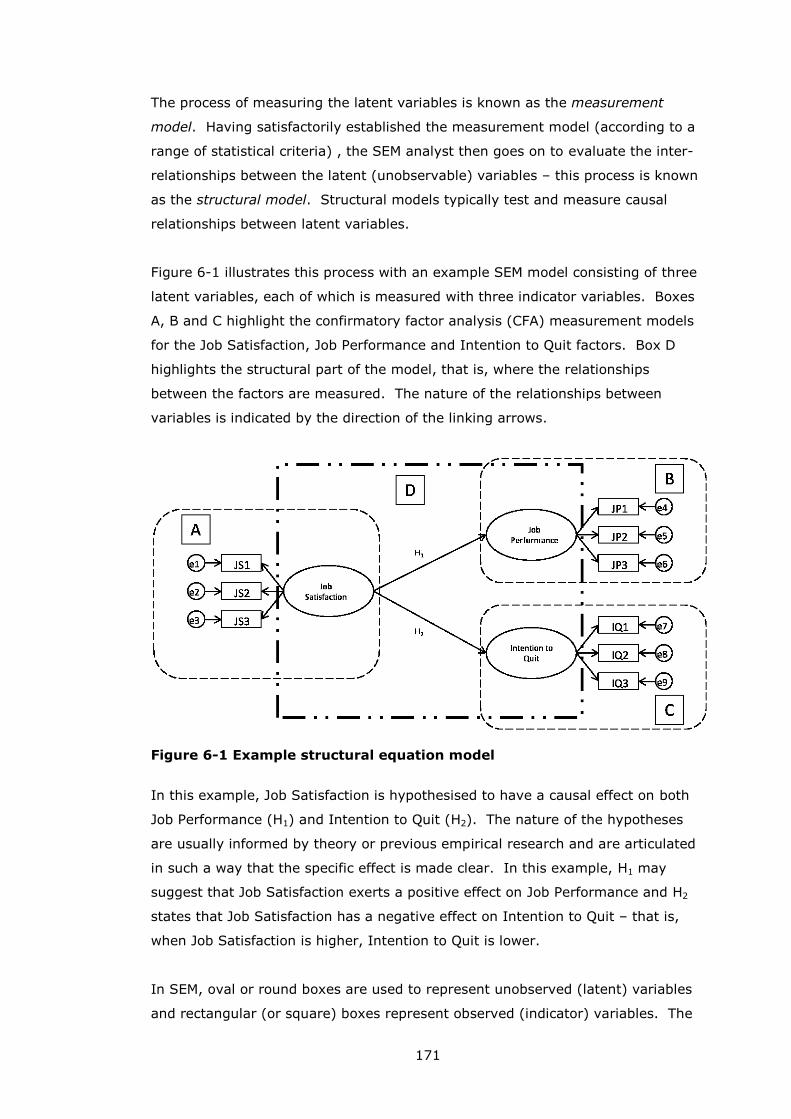
171
The process of measuring the latent variables is known as the measurement
model. Having satisfactorily established the measurement model (according to a
range of statistical criteria) , the SEM analyst then goes on to evaluate the inter-
relationships between the latent (unobservable) variables – this process is known
as the structural model. Structural models typically test and measure causal
relationships between latent variables.
Figure 6-1 illustrates this process with an example SEM model consisting of three
latent variables, each of which is measured with three indicator variables. Boxes
A, B and C highlight the confirmatory factor analysis (CFA) measurement models
for the Job Satisfaction, Job Performance and Intention to Quit factors. Box D
highlights the structural part of the model, that is, where the relationships
between the factors are measured. The nature of the relationships between
variables is indicated by the direction of the linking arrows.
Figure 6-1 Example structural equation model
In this example, Job Satisfaction is hypothesised to have a causal effect on both
Job Performance (H1) and Intention to Quit (H2). The nature of the hypotheses
are usually informed by theory or previous empirical research and are articulated
in such a way that the specific effect is made clear. In this example, H1 may
suggest that Job Satisfaction exerts a positive effect on Job Performance and H2
states that Job Satisfaction has a negative effect on Intention to Quit – that is,
when Job Satisfaction is higher, Intention to Quit is lower.
In SEM, oval or round boxes are used to represent unobserved (latent) variables
and rectangular (or square) boxes represent observed (indicator) variables. The
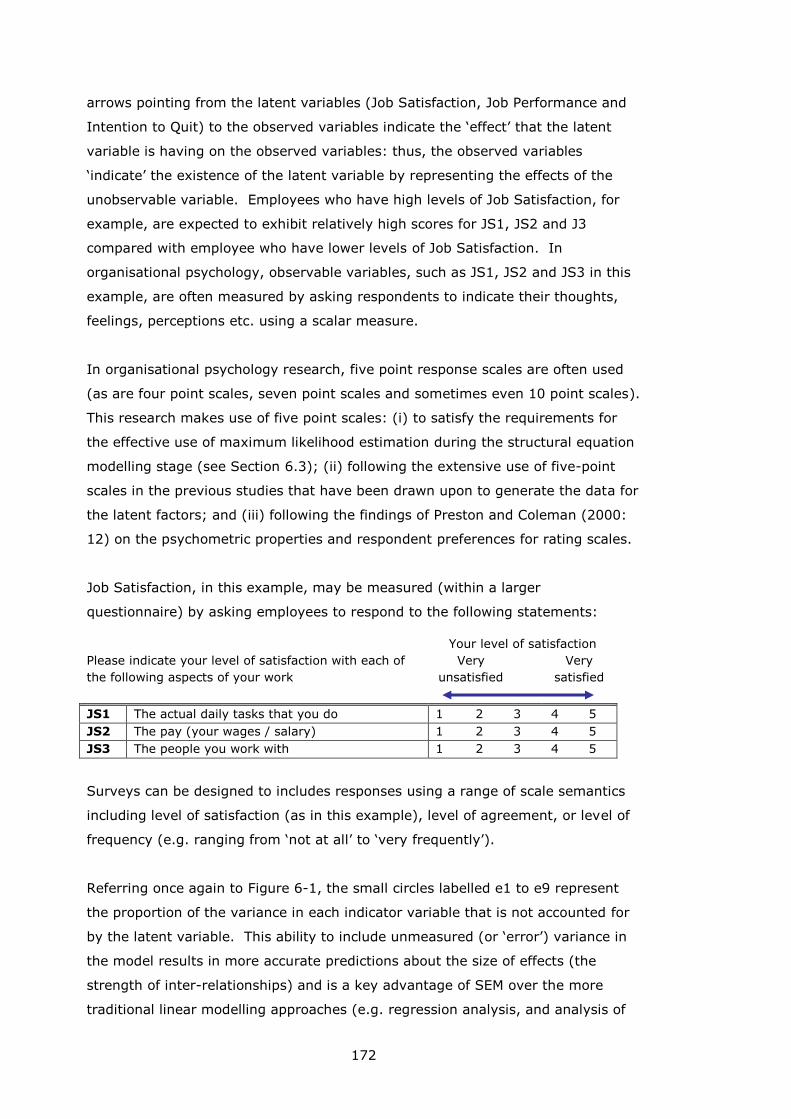
172
arrows pointing from the latent variables (Job Satisfaction, Job Performance and
Intention to Quit) to the observed variables indicate the ‘effect’ that the latent
variable is having on the observed variables: thus, the observed variables
‘indicate’ the existence of the latent variable by representing the effects of the
unobservable variable. Employees who have high levels of Job Satisfaction, for
example, are expected to exhibit relatively high scores for JS1, JS2 and J3
compared with employee who have lower levels of Job Satisfaction. In
organisational psychology, observable variables, such as JS1, JS2 and JS3 in this
example, are often measured by asking respondents to indicate their thoughts,
feelings, perceptions etc. using a scalar measure.
In organisational psychology research, five point response scales are often used
(as are four point scales, seven point scales and sometimes even 10 point scales).
This research makes use of five point scales: (i) to satisfy the requirements for
the effective use of maximum likelihood estimation during the structural equation
modelling stage (see Section 6.3); (ii) following the extensive use of five-point
scales in the previous studies that have been drawn upon to generate the data for
the latent factors; and (iii) following the findings of Preston and Coleman (2000:
12) on the psychometric properties and respondent preferences for rating scales.
Job Satisfaction, in this example, may be measured (within a larger
questionnaire) by asking employees to respond to the following statements:
Please indicate your level of satisfaction with each of
the following aspects of your work
Your level of satisfaction
Very
unsatisfied
Very
satisfied
JS1 The actual daily tasks that you do 1 2 3 4 5
JS2 The pay (your wages / salary) 1 2 3 4 5
JS3 The people you work with 1 2 3 4 5
Surveys can be designed to includes responses using a range of scale semantics
including level of satisfaction (as in this example), level of agreement, or level of
frequency (e.g. ranging from ‘not at all’ to ‘very frequently’).
Referring once again to Figure 6-1, the small circles labelled e1 to e9 represent
the proportion of the variance in each indicator variable that is not accounted for
by the latent variable. This ability to include unmeasured (or ‘error’) variance in
the model results in more accurate predictions about the size of effects (the
strength of inter-relationships) and is a key advantage of SEM over the more
traditional linear modelling approaches (e.g. regression analysis, and analysis of
173
variance) where models are fitted to raw data based on the assumption that there
is no error in the measurement of the independent variable/s (Raykov and
Marcolides 2006: 2-3).
Other major advantages of SEM analyses are the ability to test complex
multivariable models and to test hypotheses about both direct and indirect
effects.
SEM analyses can be used in both confirmatory mode (for the purposes of theory-
testing) and in exploratory mode (for theory-building). In theory-building, the
operation is exploratory insofar as models are tested, modified and tested again
in the search for an optimal model (Kline 2005: 10-11).
6.2 Modelling approach
This research employs Jöreskog’s (1993: 295) Model Generating (MG) approach in
which the model is modified and tested again using the same data. Raykov and
Marcolides (2006: 7) write that:
In contrast to the confirmatory mode of SEM applications, theory
development assumes that no prior theory exists—or that one is
available only in a rudimentary form—about a phenomenon under
investigation.
This describes very well the context for this research. While a number of
hospitality studies focussing on leadership, and on motivation, and several linking
leadership with motivation/job performance have been published, the overall
state of knowledge remains rudimentary. This situation is largely due to the wide
ranges of (a) theoretical approaches adopted and (b) specific foci chosen by
individual researchers/research teams (as described in Chapter 3 for hospitality
leadership studies and section 4.3 for hospitality motivation studies).
While the broad approach to the SEM analyses is model generating, the specific
type of SE (structural equation) model to be used is the structural regression
model (Kline 2005: 209). The strategy for developing and testing the structural
regression models is based on Anderson and Gerbing’s (1988) two-step procedure
with each step following the five-stage development procedure described by
Schumaker and Lomax (2004).
174
6.3 Data assumptions and software
Regarding data assumptions for SEM. Section 6.6.1 (below) describes in detail
how the choice of maximum likelihood (ML) estimation is driven by the
requirement to use a model estimation technique that provides diagnostic
information for the iterative development of models (in particular, the estimation
of modification indices to guide model modifications). The ML estimation method
assumes that data are continuous; because, however, a large proportion of
psychometric data are collected using attitudinal (Likert-type) scales that
generate ordinal-level data, a number of studies have been undertaken to
evaluate the performance of ML estimation techniques when applied using such
ordinal scaled data. Byrne (2001: 83; 2010: 148) cites a number of such studies
(Muthén and Kaplan 1985; Babakus et al. 1987; Bentler and Chou 1987; Atkinson
1988; West et al. 1995) which have demonstrated that where ordinal data
approximate a normal distribution and variables use four or more data points then
continuous methods (such as ML estimation) ‘...can be used with little need for
concern’ (Byrne 2001: 83, and see also Raykov and Marcolides 2006: 31 for a
similar assessment).
Regarding issues of distributional normality, both skewness and kurtosis can
influence the model fit diagnostics and parameter estimates in SEM analyses.
Byrne (2010: 330) and West et al. (1995: 56-57) note that it is not uncommon
for psychometric data being used in SEM analyses to depart from the normal
distribution. This is because responses to scaled data can often cluster around
one two scale points, thus creating deviations from normal kurtosis and possibly
also deviations from normal skewness.
In relation to model fit, West et al. (1995: 59) note that significant multivariate
non-normality can impact on model χ2 (chi-square) values by biasing χ2
upward,
resulting in the rejection of too many models that should have good fit (i.e. with
model χ2 p>0.05). For model development this situation can give rise to models
being simplified (indicator variables being removed) beyond the point where good
fit might have been achieved.
In relation to parameter estimates, Byrne (2010: 103; 148-149) describes the
influence of skewness and kurtosis in some detail. Briefly, skewness typically has
an impact on the measurement of means while kurtosis has an influence on the
measurement of variances and covariances. Because the latter (variances and
175
covariance) are central to SEM analysis, problems with kurtosis are generally
regarded as being of greater importance.
Raykov and Marcolides (2006: 29) suggest that researchers first check univariate
normality and then multivariate normality. Curran et al. (1996) examined the
issue of distributional non-normality when estimating CFA models and found that
univariate skewness values of less than 2 and univariate kurtosis values of less
than 7 are acceptable (i.e. had no impact on parameter estimates and model fit
statistics). Those authors were, however, unable to determine at what point
multivariate non-normality becomes a problem. More recently, Bentler (2005,
cited in Byrne 2010: 104) has suggested that when Mardia’s coefficient for
multivariate non-normality (Mardia 1970) is greater than 5, then a departure from
multivariate normality is indicated. Elsewhere, Raykov and Marcolides (2006: 30)
and Hair et al. (2006: 743) have both cited a number of empirical studies
demonstrating that ML estimation is robust in the face of minor deviations from
normality.
For this research, none of the measured variables depart (or even approach
departing) from Curran et al.’s (1996: 26) bounds of 2 for univariate skewness or
7 for univariate kurtosis (Appendix II reports the univariate skewness and
kurtosis estimates for all of the observed variables). Accordingly, following the
arguments detailed by Byrne (2001: 83 and 2010: 148), ML estimation methods
are employed for this research.
Multivariate normality is measured using AMOS’s critical ratio (C.R) for
multivariate kurtosis which is equivalent to Mardia’s (1970) normalised estimate
of multivariate kurtosis (Byrne 2010: 104). Where an optimal model specification
demonstrates a multivariate kurtosis C.R. value greater than 5, the model is re-
estimated (following the procedure described by Byrne 2010: 329-352) using
AMOS’s bootstrap procedure for estimating models with multivariate non-normal
data. The bootstrap estimation procedure generates confidence intervals for each
estimated parameter allowing these to be checked for robustness to multivariate
non-normality as required. The relevant estimates for multivariate normality and
associated bootstrapped parameter estimates are reported in Appendix IV.
Structural equation modelling is undertaken using the IBM AMOS Version 18
software for SEM analysis and the data screening and other analyses are
undertaken using IBM SPSS Statistics Version 18.
176
6.4 Modelling strategy
The two-step SEM modelling procedure described by Anderson and Gerbing
(1988) firstly (during Step 1) establishes a confirmatory factor analysis (CFA)
measurement model in which:
(a) the relationships between the observed variables (also referred to as items, or
indicators) and the latent factors are specified (according to theory or previous
empirical research findings); and
(b) all of the latent factors are allowed to intercorellate freely (indicated with bi-
directional connecting arrows that specify a non-causal correlation).
Where each observed variable (indicator) is linked only to one latent factor, the
CFA is described as being unidimensional or congeneric. In multidimensional
CFAs, indicators can have loadings on two or more latent factors. In practice, it is
more usual for CFAs to be specified in unidimensional formats since this allows for
more exact estimates of convergent and discriminant validity to be made (Kline
2005: 167-168). Convergent and discriminant validity are both aspects of
construct validity and will be discussed in greater depth below.
Step 2 of Anderson and Gerbing’s two-step approach proceeds when a
measurement model with satisfactory fit has been established. Step 2 involves
respecifying the model by replacing, as dictated by the theory to be tested, the
bi-directional (non-causal) arrows with uni-directional arrows indicating causal
relations between latent factors. Independent latent factor variables (also refered
to as exogenous factors in SEM analyses while dependent variables are referred to
as endogenous variables) may still (but not neccesarily) covary in a non-causal
manner as specified by the theory to be tested and some connections between
factors may be dropped altogether (indicating no hypothesised relationship
between these variables).
Within the Model Generating (MG) approach to structural equation modelling it is
possible to modify – or respecify - the measurement and structural models in
such a way that model fit is improved. During Step 1 this is often achieved by
removing poorly performing indicators (observed variables) based on the
statistical feasibility of parameter estimates (the strength and statistical
significance of indicators’ respective factor loadings) in combination with an
assessment of the appropriateness of indicators’ standard errors (Byrne 2010:
177
67) and their associated standardised residual covariances (Byrne 2010: 86; and,
see also Shumaker and Lomax 2004: 177). This respecification is often carried in
an iterative fashion while the researcher monitors the overall effect of individual
changes on the broader model. Further, any model modifications should be
carried out in the light of appropriate consideration of the substantive changes
(i.e. the theoretical implications for the model) that they will bring about.
So, having developed a measurement model which exhibits good fit and provides
evidence for acceptable convergent and discriminant validity, Step 2 of the
procedure develops the structural model to provide an assessment of predictive
validity. Part of the rationale for the two step procedure is described by Jöreskog
and Sörbom (1993) who write that:
The testing of the structural model, i.e., the testing of the initially
specified theory, may be meaningless unless it is first established that
the measurement model holds. If the chosen indicators for a construct
do not measure that construct, the specified theory must be modified
before it can be tested. Therefore, the measurement model should be
tested before the structural relationships are tested.
(Jöreskog and Sörbom 1993: 113)
During Step 2, the structural model is developed following similar principles of
iterative improvement as with the measurement model. In the case of the
structural model however, the modifications typically take the form of
respecifications to the pattern of between factor (rather than within factor)
parameters5. Once again, this process should be strongly related to and guided
by consideration for the substantive implications of any changes made
(Schumaker and Lomax 2004: 71; Kline 2005: 65; Hair et al. 2006: 797-798).
The five stage procedure described by Schumaker and Lomax (2004) throughout
their guide to SEM analysis is based on the Anderson and Gerbing Two-Step
procedure and breaks each of the two step into the following five stages:
1. model specification;
2. model identification;
5 It is possible to make changes to the factor structures (i.e. removal of indicator
variables) during the development of the structural model, however, following any
such change it is then necessary to re-estimate the measurement model to ensure
that the requirements of construct validity continue to be met.
178
3. model estimation;
4. model testing; and
5. model modification.
Reporting of estimates
Throughout the analysis and discussion sections, standardised parameter
estimates will be used. Unstandarised estimates are reported in Appendix III to
allow for future comparative research and following the advice of Kline (2005:
318-319). Appendix III also reproduces the correlation matrices for the finalised
models according to Boomsma’s (2000: 470) recommendations.
6.4.1 Building the models
Following the model generating approach, the models were developed in an
iterative manner wherein the core hypotheses are firstly examined and,
thereafter, successive constructs are added to the model and the model re-
assessed to evaluate the role of each additional construct. This iterative approach
to the model development process was adopted for a variety of reasons.
Firstly, the core hypotheses (in this case H1 to H4 which test the relationships
between motivational leadership, work meaning and job performance/work
motivation) could be tested in the absence of additional and potentially
confounding constructs.
Secondly, as will be reported in Chapter 7, some of the constructs were not able
to be included in the models owing to either a lack of discriminant validity or an
absence of statistically significant covariance with other constructs. By building
the models in an iterative manner, it was possible to efficaciously identify such
constructs that do not covary with the other constructs in the model.
Thirdly, the iterative approach allows for a clearer appreciation of the role that
each construct plays in the model. For example, the transition from Model 4 to
Model 5b revealed that the effect of employees’ work values on attitudes to work
is reduced to a non-significant level when the employee empowerment construct
was added to model. In this example, had these constructs been included
179
together in the initial model, the small effect that Work Values can have may have
been overlooked. As it is, some interesting questions for future research are
raised by the finding that Work Values do appear to have some (albeit a small)
effect on employees attitudes to work and job performance/work motivation.
In a similar vein, the hypotheses relating to Work Meaning (H3 and H4) could not
(with hindsight) have been tested if the full model was initially specified. Because
the three employee attitude constructs (Work Meaning, Affective Organisational
Commitment and Job Satisfaction) did not demonstrate sufficient discriminant
validity, they could not be included as discrete entities within one model. Section
7.6 describes how these constructs were amalgamated into a broader employee
attitudes construct – however, had this amalgamation been undertaken prior to
testing Work Meaning as a discrete construct (and in the absence of the other two
employee attitude constructs), it would not have been possible to test H3
(ML→ME) and H4 (ME→JP).
While building the models in this way, the measurement model for each
successive model was initially specified with all of the indicator variables, even
though some of these indicator variables were found not to perform well in the
previous model. By building each successive model iteration ‘from scratch’, two
issues are addressed. Firstly, that the model-based imputation of missing values
(see Section 6.6.1 below) is based on the specific model that is being estimated
and tested. Secondly, this approach was able to confirm (or refute) the
robustness of the measurement of the individual constructs. That is, by
estimating, testing and modifying each model ‘from scratch’ it was possible to
make an assessment of the consistency of factor structures across models.
6.5 Instrumentation
The overall research aim is to explore and evaluate the contribution of
motivational leadership to employee work motivation in hospitality services. The
specific objectives as described in Chapter 1 are to:
1. critically evaluate the field of hospitality leadership studies to identify relevant
issues and inform the research design;
2. develop a theoretical framework to:
a. locate the variables of interest in relation to existing organisational
psychology theories;
180
b. articulate the likely linkages between variables; and
c. guide the formulation of specific hypotheses;
3. identify/generate measurement scales for the latent variables;
4. refine the measurement scales; and
5. test and evaluate the relationships between variables using survey data
collected from hotel restaurant waiting staff.
Objective 1 has been satisfied though reviews of the generic and applied
(hospitality) leadership and work motivation research literatures. The theoretical
framework for the research (Objective 2) was developed through the integration
of the findings from the literature reviews with the broader theoretical structures
of work motivation studies and industrial and organisational psychology. The
development of the theoretical framework assisted in the generation of specific
research hypotheses by providing an underpinning rationale for specifying causal
relations based on fundamental principles of industrial and organisational
psychology. The variables (constructs) of interest were operationalised (Objective
3) based on the findings from further interrogations of the applied and generic
leadership, work motivation and organisational psychology literatures.
Objectives 4 and 5 were pursued through the design a survey instrument and the
collection of data from a sample of non-supervisory foodservice employees
(waiting staff) working in table service restaurants in hotels.
The remainder of this chapter describes the design of the survey instrument (a
respondent-completed questionnaire), the refinement of the survey instrument
and the measurement scales and the administration of the questionnaire.
6.5.1 Questionnaire design and refinements
As described above in Chapter 5, the item statements have been generated
according to the advice of Hinkin (1998: 107-108) to (a) keep statements as
short as possible and to (b) ensure that the statement wordings are
understandable to the target population.
To provide independent and external validation of the brevity and clarity of the
item statements, and also an assessment of the face validity (the extent to which
the item statements actually represent the defined construct) a draft
181
questionnaire was subjected to a process of expert judging (Hair et al. 2006: 781;
Hardesty and Bearden 2004). The draft questionnaire was circulated amongst the
PhD supervisory team (Dr Peter Lugosi with expertise in hospitality studies and
Prof Adam Blake with expertise in survey design for multivariate statistical
analysis), Dr Caroline Hattam (a personal friend with expertise in survey-based
econometric analysis of organisational decision-making) and Mr Alan Cutler, the
Chief Executive of Hospitality Leadership Ltd training and consultancy
organisation and author of various articles and books examining leadership issues
in hospitality businesses (e.g. Cutler 2006; Cutler et al. 2006; Cutler 2010).
A number of modifications to item statement wordings were made based on the
feedback from these individuals regarding the brevity, clarity and face validity of
the item statements. An additional item statement was added at this stage.
Following the hospitality leadership work of Tracey and Hinkin (1994, 1996) and
the more general transformational leadership theory work of Bass and Avolio (see
e.g. Bass and Avolio 2004), MC1 ‘I clearly understand what my company’s goals /
targets are’ was added as a measure of Mission Clarity. Employees’ Mission
Clarity (clear understanding of organisational goals) is hypothesised to be an
outcome of transformational leadership and Tracey and Hinkin (1996) found that
transformational leadership had a significant and moderate ( = 0.31) effect on
hospitality employees’ mission clarity.
Following these modifications, the survey was pre-tested during March 2010 (the
pre-test survey form is illustrated in Appendix VI) using a cohort of Bournemouth
University hospitality management undergraduate students (n = 39) who
provided additional feedback regarding the clarity of the item statements. Three
minor changes to the wordings of item statements were made based on the
students’ feedback. In addition, some concerns about the clarity of the Service
Quality (SQ) item statements were raised. No modifications were made to the SQ
statements, however, as it was realised that this construct was attempting to
capture quite a complex phenomenon (employees’ ability to maintain customer
satisfaction in the face of adverse service conditions).
Following the expert judging and student-based pre-test, the questionnaire was
piloted using an actual sample of waiting staff in commercial hotel business (the
pilot survey form is illustrated in Appendix VII). The objective of this pilot survey
was to trial the survey administration method and to trial the questionnaire with
‘real’ respondents. Before describing the administration of the pilot survey,
182
however, a discussion regarding access to hospitality organisations for data
collection purposes follows.
Access to hospitality organisations
To gain access to hotels for data collection, in the first instance, Alan Cutler of the
independent consultants Hospitality Leadership Ltd was contacted. Alan had
previously worked with Bournemouth University School of Tourism on a small-
scale research project looking at leadership issues in hospitality organisations.
Alan provided contact details for relevant managers in six hotel groups. The first
managers with whom cooperation was able to be arranged represented two hotel
groups: (i) a group of ten 4 star hotels in the south east of England; and (ii) a
larger group of 4 star hotels across the UK with 27 individual facilities.
Alan was also instrumental in providing a contact within the National Skills
Academy for Hospitality. This group is part of the People1st6 organisation and its
remit is to identify, endorse and promote qualifications and learning opportunities
in the hospitality sector. The National Skills Academy for Hospitality was happy to
endorse the survey work and have their logo included on the questionnaire and on
the stationery used to contact hotels. It was hoped that this endorsement would
have a positive effect on the recruitment of hotels to participate in the data
collection.
Details of the administration method
The pilot survey was administered with the participation of the first two hotel
groups (described above) with which cooperation was successfully arranged.
Initial contact was made with a senior human resources staff member in each of
the two hotel groups. In one group, contact was then delegated to the head of
food and beverage and in the other group, to a less senior human
resources/personnel employee. With the first group (the group of ten hotels in
the south east of England), the head of food and beverage supplied the number of
non-supervisory waiting staff in each hotel facility and a ‘survey pack’ containing
the relevant number of questionnaires was then sent to each hotel’s general
6 The sector skills council for hospitality, passenger transport, travel and tourism in
the UK.
183
manager (GM). The questionnaires were distributed to individual employees in an
(unsealed) FREEPOST return envelope containing the questionnaire (with an
introduction and instructions on page one) and a separate prize draw entry form.
Completion of the prize draw entry form was optional (see below). Respondents
were asked to mail the completed questionnaire directly back to Bournemouth
University or to return the sealed FREEPOST envelope to a nominated staff
member who would then return all of the completed forms to Bournemouth
University. For the second hotel group, an identical distribution method was
implemented by the human resources/personnel employee.
Regarding the prize draw incentive, respondents were offered the opportunity to
enter a prize draw for shopping vouchers (prizes ranging from £50 to £10). A
number of studies (Church 1993; Etter and Perneger 1997; Laurie et al. 1999;
Singer et al. 1999; Groves et al. 2000) have evaluated the impact of monetary
and lottery-type incentives on survey responses and the findings from these
studies indicate that such methods can generate increases in response rates of
between 7.9 and 19.1 per cent (Church 1993). In terms of the influence on the
demographic nature of the respondent profile, Etter and Perneger (1997) and
Laurie et al. (1999) note that survey incentives can increase responses from low-
income and elderly groups. Groves et al. (2000) investigated the effect of
offering incentives to potential respondents in groups with high and low theorised
disposition towards participation in their survey. They found that incentives
increased the proportion of respondents in both groups, although the proportion
of low-disposition/low-likelihood respondents was raised to a greater degree than
for the high-disposition/high-likelihood respondents.
Given the lack of evidence suggesting any negative consequences likely to arise
from the use of survey incentives, the prize draw method of incentivisation was
pursued.
Results from the survey pilot
As noted above, cooperation was first established with two from the six hotel
groups that were initially contacted. Accordingly, for the pilot survey, two
hundred questionnaires were distributed to (a) three of the ten south east
England hotels (with 50, 40 and 20 recipients respectively; total = 110) and (b)
three hotels within the 27 facility UK-wide hotel group (each with 30 recipients;
184
total = 90). Thirty two valid responses (16 per cent) in total were received: 18
survey forms (16.4 per cent) from the south east hotel group and 14 survey
forms (15.5 per cent) from the UK-wide hotel group. Four incomplete
questionnaires, 2 from each group, were also received.
Dillman (2006: 323) notes the challenges that can be faced by researchers
attempting to administer respondent-completed surveys within organisations (as
opposed to surveys of individuals or households). A number of organisational
studies researchers have discussed how surveys targeting respondents within
organisations often demonstrate low response rates (see e.g. Hager et al. 2003,
White and Luo 2005) and Dillman (2006: 323) helps to quantify typical response
rates by describing an analysis of 183 business surveys carried out in 1991 where
the mean response rate was found to be 21 per cent.
The 16 per cent return rate from the pilot fell a little short of the 21 per cent
mean return rate described by Dillman. However, a second wave of pilot surveys
was not sent owing to concerns about exhausting the goodwill of the participating
hotels by asking them to participate in three and not two survey waves (the
planned two waves were pilot plus full survey, a second pilot wave would have
taken the total to three). Further, the time between distribution and receipt of
the pilot survey forms was 6 weeks – once again, wishing not to exhaust the
goodwill of the participating hotels (in particular the UK-wide group with a further
24 hotels to be included in the full survey) by engaging them for an extended
period, priority was given to moving onto the full survey implementation.
Following the guidelines for preliminary (i.e. pre-test) assessment of data for SEM
analysis provided by Hair et al. al (2006: 780-781), the data from these 32
questionnaires were used to evaluate the suitability of the indicator variables by
assessing distributional normality, mean values and (using both exploratory and
confirmatory factor analysis) the factor structures and item loadings. The
characteristics of the data are as follows.
Regarding distributional normality, each indicator variable was checked for
univariate normality and only one variable (EM6) violated the bounds of either 2
for univariate skewness or 7 for univariate kurtosis described by Curran et al.
(1996). Specifically, the skewness value for EM6 was 2.1, however, as this did
not transgress the boundary by a great deal and because the sample size was
quite small, it was considered that removing EM6 at this stage may be a hasty
185
decision. None of the variables exceeded Curran et al.’s threshold of 7 for
univariate kurtosis (see Section 6.3 on data assumptions for details of
distributional normality).
Hair et al. (2006: 780) suggest that mean values for individual indicator variables
should not approach the upper or lower limits of the scale range. For these data,
the highest mean score was 4.45 (DSB2) and the lowest was 2.55 (SQ7). Hair et
al. did not offer any specific guidance regarding a threshold that indicates when a
mean value is too close to an upper or lower limit; in this case, because 4.45 is
not more than ‘halfway’ between the upper scale points 4 and 5 the score was
deemed to be satisfactorily distant from the upper polar extreme of 5. Using this
same logic, the lower bound mean score of 2.55 is sufficiently distant from the
lower polar extreme of 1 not to cause any concern.
Confirmatory factor analysis (CFA) of the individual constructs was used to check
the statistical significance and magnitude of the item loadings – that is, the
strength of association between each indicator variable and the construct that is
hypothesised to influence that variable. Once again, no specific cut-off value is
proposed by Hair et al. (2006: 780-781) regarding the level at which an indicator
is failing to perform adequately well at the pre-test stage. In a more general
context, Hair et al. (2006: 777, 795) note that factor loadings should preferably
be above 0.7 and at least 0.5 (see Section 7.2.5 below on assessment of
construct validity for more details on this). Accordingly, for the pre-test
assessment, indicator variables loading below 0.5 were considered as candidates
for removal from the survey.
Six indicator variables loaded below the 0.5 level (EM2 at 0.47; ME2 at -0.06; and
ME4 at 0.18; AOC3 at 0.36; DSB3 at 0.47; and DSB4 at 0.42). In total, two
variables (ME2 and ME4) had non-statistically significant factor loadings.
The indicator variable EM2 (I can make my own decisions at work) was removed
as it had a clear item content overlap with indicators EM1 (I can choose the best
way of doing my job) and EM4 (I have a great deal of control over my job) and
was removed from the survey. Indicator variables ME2 and ME4 loaded very
weakly and also failed to meet the criterion of statistical significance leading to
their removal from the survey. The indicator AOC37 loaded at only 0.36 and was
7 AOC3 was also the weakest-loading item (0.45) in Allen and Meyer’s (1991) study
from which the Affective Organisational Commitment scale is drawn.
186
therefore removed from the survey. Because DSB3 and DSB4 were not part of an
exploratory construct (DSB has been previously – and successfully - measured
using the same 4 indicator variables by Simons and Roberson 2003) it was
decided to retain these two indicators in the survey and to monitor their future
performance.
As discussed above in Section 5.3, there is no consensus on the use or non-use of
reverse-polarity items in psychometric scale design. Ray (1983) found evidence
supporting their use while both Herche and Engelland (1996) and Wong (2003)
found that reverse wording caused problems with scale unidimensionality and
construct validity.
Because the use of reverse worded items is not without problems (in particular,
Wong’s issues with reverse worded items in cross-cultural research), only three
indicators in this pilot survey were (somewhat cautiously) included with reverse
wordings. These indicators were ME2, ME4 and AOC3 and, indeed, each of these
performed poorly in the pilot survey. These particular indicators were chosen for
reverse wording because, firstly, AOC3 followed the original wording from Allen
and Meyer’s (1990) Affective Commitment scale. The ME2 and ME4 indicators
were chosen for reverse wording because the Work Meaning (ME) scale was the
only other scales that was both amenable to reverse wording and not based on an
existing set of indicator wordings.
The three indicators (AOC3, ME2 and ME4) were all removed from the survey and
the cautious conclusion drawn is that reverse worded statements do not work well
in hospitality service contexts where respondents are from a variety of cultural
backgrounds. (NB – ME2 and ME4 also negatively affected the unidimensionality
[see below] of the Work Meaning construct, reflecting Wong’s (2003) findings for
cross-cultural context psychometric research).
Regarding factor structures / unidimensionality, exploratory factor analysis (EFA)
was used to check that the indicator variables for each construct did indeed share
a single common cause (i.e. were unidimensional). The Employee Empowerment
(EM) indicators were an exception to this as these are hypothesised to measure
two discrete factors (EM-I, Empowerment – Influence; and EM-C, Empowerment –
Competencies). The EFA analyses were performed using maximum likelihood
estimation (the same estimation method used in the CFA analyses). Varimax
rotation of the factor matrix was applied to maximise the clarity of the factor
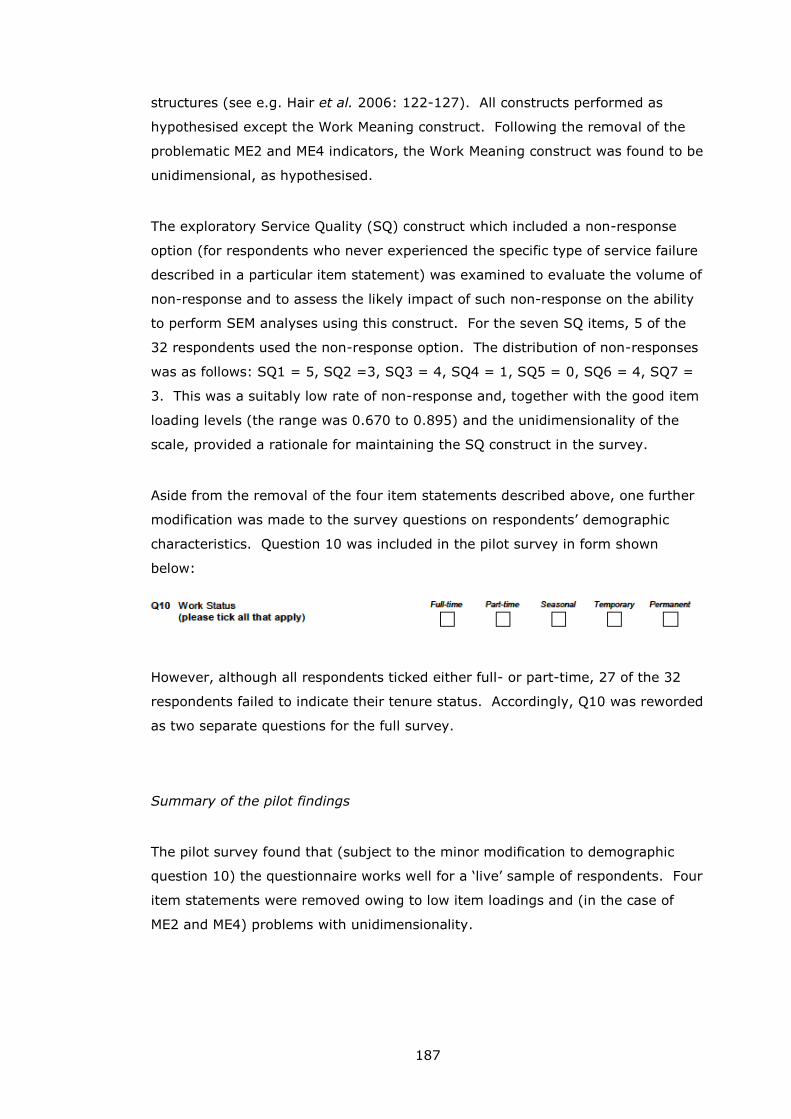
187
structures (see e.g. Hair et al. 2006: 122-127). All constructs performed as
hypothesised except the Work Meaning construct. Following the removal of the
problematic ME2 and ME4 indicators, the Work Meaning construct was found to be
unidimensional, as hypothesised.
The exploratory Service Quality (SQ) construct which included a non-response
option (for respondents who never experienced the specific type of service failure
described in a particular item statement) was examined to evaluate the volume of
non-response and to assess the likely impact of such non-response on the ability
to perform SEM analyses using this construct. For the seven SQ items, 5 of the
32 respondents used the non-response option. The distribution of non-responses
was as follows: SQ1 = 5, SQ2 =3, SQ3 = 4, SQ4 = 1, SQ5 = 0, SQ6 = 4, SQ7 =
3. This was a suitably low rate of non-response and, together with the good item
loading levels (the range was 0.670 to 0.895) and the unidimensionality of the
scale, provided a rationale for maintaining the SQ construct in the survey.
Aside from the removal of the four item statements described above, one further
modification was made to the survey questions on respondents’ demographic
characteristics. Question 10 was included in the pilot survey in form shown
below:
However, although all respondents ticked either full- or part-time, 27 of the 32
respondents failed to indicate their tenure status. Accordingly, Q10 was reworded
as two separate questions for the full survey.
Summary of the pilot findings
The pilot survey found that (subject to the minor modification to demographic
question 10) the questionnaire works well for a ‘live’ sample of respondents. Four
item statements were removed owing to low item loadings and (in the case of
ME2 and ME4) problems with unidimensionality.

188
6.5.2 Administration of the full survey
Administration of the full survey was carried out using the same procedures as
with the pilot study with regard to the methods of distributing and returning the
questionnaires. To engender a higher response rate, the researcher became
significantly more vigorous in explaining to hotel contacts the importance for the
success of the study of proactively and insistently encouraging recipients to
complete and return the survey forms. There is some evidence that this strategy
did make a positive difference to the response rate. Specifically, the response
rate from the south east of England hotel group increased from 16.4 per cent
during the pilot survey to 54.9 per cent (from the remaining seven hotels in this
group) and the overall response rate to the full survey was 37.9 per cent (see
below). No pilot/full survey response rate comparison can be made for the UK-
wide group with a remaining 24 hotels to survey as, unfortunately for the
research, the group appointed a new manager to the job position that the
researcher was in contact with and this manager declined to continue to
participate in the survey.
Of the six hotels/hotel groups that Alan Cutler provided contact details for,
ultimately only two participated in the survey work. The south east of England
group in the pilot and full surveys and the UK-wide group in the pilot. The other
four hotels either refused to participate (n = 1) or procrastinated sufficiently (over
a course of four to six weeks) to avoid participation (n = 3).
The hotel contacts described above represented the initial set of hotels to be
contacted; to progress the survey the researcher subsequently contacted (based
on suggestions from individuals in his professional network) four UK hospitality
industry members’ organisations (hotel associations) and several individual
hotels. The remainder of the participating hotels were recruited through these
efforts.
In total, just over 100 hotels were contacted, 59 hotels agreed to co-operate with
the research and 27 of these actually returned survey forms (a co-operation rate
of 46 per cent).
In terms of individual survey forms distributed and returned:
1,459 survey forms were distributed;
234 survey forms were returned;
o representing a response rate of 16 per cent8
8 This proportion of returns is identical to the pilot survey response.
189
Setting aside those hotels that did not return any survey forms, and therefore,
although indicating that they would, effectively did not participate in the research:
618 survey forms were distributed;
234 survey forms were returned;
o representing a response rate of 37.9 per cent9
The hospitality leadership articles that had been identified for this research were
examined to identify typical response rates for postal surveys within organisations
in this area of social science. Eight studies published during the previous 10
years that had employed a postally-administered survey were identified (Chiang
and Jang 2008; Kozak and Uca 2008; Clark et al. 2009; Patiar and Mia 2009;
Asree et al. 2010; Gill et al. 2010; Kim, B. et al. 2010; Zopiatis and Constanti
2010). The response rates for these studies ranged from 19 to 66 per cent with a
mean response rate of 40 per cent. The response rate achieved for this survey
(37.9 per cent) is close to this average.
Assessment of the sample
The 59 hotels that agreed to participate had the following star ratings: (i) three
star n = 12; (ii) four star n = 36; (iii) five star n = 5; and (iv) no star rating
identified n = 6. Of the 27 that returned survey forms, six (22.2 per cent) had a
three star rating, nineteen (70.4 per cent) had a four star rating and two (7.4 per
cent) did not mention a star rating on their web sites. None of the five star rated
hotels (n = 5) that were contacted ultimately participated in the survey.
To assess whether or not star rating had any effect on the propensity of hotels to
participate, contingency tables were constructed - by cross-classifying hotels’ star
ratings and participation status (did / did not participate) - to test for the
independence of the two variables using the chi-squared statistic. Using the three
star rating categories (3, 4 and 5 star) prevented a meaningful analysis since the
low number of 5 star hotels created too many cells in the contingency table (>20
per cent) with expected values less than 5 (thus violating one of the assumptions
of the contingency table chi square test). To counter this issue, two alternative
contingency tables were constructed. In the first, the 5 star hotels (none of which
participated in the research) were removed from the analysis resulting in a finding
9 Owing to the way in which the pilot survey was administered it was not possible to
calculate a similar figure for the pilot.
190
that there is no association between 3 star / 4 star rating and participation in the
survey (χ2 p = 0.868; Fisher’s exact p = 0.565). The second alternative test
combined the four and five star hotels into one category and also resulted in a
finding that there is no association between hotels with a 3 star rating and hotels
with 4/5 star ratings and participation in the survey (χ2 p = 0.823; Fisher’s exact p
= 0.540).
Hotel size was measured based on the number of survey forms sent to each – this
equates with the number of non-supervisory waiting staff employed by each. The
mean number of survey forms distributed to participating hotels was 22.9; for
those hotels that did not return any forms (and therefore effectively did not
participate in the survey) the mean number of survey forms distributed was 19.6.
An ANOVA10 test was performed to assess whether or not number of non-
supervisory waiting staff had any effect on the propensity of hotels to participate.
This test indicated that there is no association between staff numbers and
propensity to participate in the survey (F = 0.536; d.f. = 1; p = 0.467).
A common reason cited for non-participation was “we are too busy”, although it
was clear from the discussions with the general managers that those who did
participate were more open to this type of co-operation and more positive with
regard to the role of research in hospitality management and organisational
management. There is no reason to believe that the participating hotels had
different approaches to leadership than non-participating hotels.
Regarding the individual respondents, of the 234 responses, a total of 213
useable cases were retained following the data screening process described in
Section 6.6 below. The suitability of this sample size is assessed in two ways:
firstly, it is considered alongside various published guidelines relating to sample
size for SEM analysis; and, secondly, it can be compared with reported sample
sizes for other leadership-focused hospitality studies that have utilised structural
equation modelling.
Recommendations regarding minimum sample sizes for SEM analysis include:
Loehlin (1992) who recommends at least 100 cases, preferably 200
10 NB - the ANOVA test can be used in the same way as the t-test to compare means
between two groups. Hair et al. (2006: 387) describe the t-test as ‘...a special case of
ANOVA for two groups or levels of a treatment variable’.
191
Hoyle (1995) who recommends a sample size of at least 100 to 200
Kline (2005: 15) who considers less than 100 to be ‘untenable’ other than for
very simple models
Schumaker and Lomax (2004:49) who surveyed the literature and found
sample sizes of 250 to 500 to be used in "many articles" and "numerous
studies ..that were in agreement" that fewer than 100 or 150 subjects was
below the minimum
Hair et al. (2006: 741) who write that minimum sample sizes for maximum
likelihood estimation are 100 to 150 and that 200 provides a sound basis for
estimation
Hair et al. (2006: 742) add that where factor loadings are in the range of 0.67
to 0.74 then the sample size should be ‘more in the order of 200’
Other authors base their guidelines not on absolute sample size, but on sample
size relative to the number of observed variables. Examples of such guidelines
include:
Kline (2005: 178) who suggests at least 10 cases per observed variable
Stevens (Stevens 1996) who suggests at least 15 cases per observed variable
Garson (2011b) who suggests that sample size should be at least 50 more than
8 times the number of observed variables in the model
Based on the guidelines for absolute sample size described above, this sample, at
greater than 200 cases, is adequate for SEM analysis; in relation to the guidelines
for the ratio of cases to observed variables, based on the minimum guideline of
10 cases per observed variable, 213 cases allows for the estimation of a model
containing 21 observed variables.
A further model-based assessment of sample adequacy is available when using
the AMOS software for SEM analysis. Hoelter’s Critical N (CN) (Hoelter 1983)
specifically concerns the adequacy of sample size for calculating the χ2 value for
that model. Hoelter’s recommendation was that where CN is ≥200 then the
sample size is large enough to for χ2 to be calculated satisfactorily. Garson
(2011b) notes that a CN of less than 75 is considered insufficient to accept a
model by chi-square. Hoelter’s CN is reported for each SEM model in Chapter 7
detailing the analysis of the data.
A further check on the adequacy of the sample was undertaken by comparing the
current sample size with reported sample sizes for other leadership-focused
192
hospitality studies that have utilised structural equation modelling. Seven
hospitality-leadership studies were identified that had used SEM analysis
(Sparrowe 1994; Tracey and Hinkin 1996; Borchgrevink et al. 2001; Chiang and
Jang 2008; Hinkin and Schriesheim 2008; Clark et al. 2009; Asree et al. 2010)
and the mean sample size for these studies was found to be 285.6. Clarke et al.
(2009) represented something of an outlier with a very large sample size of 797
(excluding Clarke et al., the range of sample sizes was from 88 to 291). A
median value was calculated to reduce the impact of the large outlier. The
median was found to be 237 - with the outlier removed entirely, the mean value
was found to be 200.
In summary then, the sample size of 213 compares well with both the general
guidelines for SEM analysis and with previous published leadership studies in
hospitality settings.
Representativeness of the sample
In strict terms, the sample cannot be properly considered as a probability sample
where each member of the population of interest has an equal probability of
receiving a survey form. Practically, for the population of interest for this
research, it is not possible to access or develop a sampling framework within
which to randomly select recipients of survey forms. Such a sampling framework
would include every hotel with a table service restaurant in the UK and such a
listing does not exist.
The Inter-Departmental Business Register (IDBR) is the most comprehensive
database of UK businesses and is maintained by the ONS (Office for National
Statistics). The IDBR uses the 2007 revision to the Standard Industrial
Classification (UK SIC 2007) meaning that it would be possible to identify hotel
businesses in the database. The coverage of the IDBR is not comprehensive,
however. The IDBR contains data on 2.1 million businesses (Office for National
Statistics 2011b) and there are a total of 4.5 million businesses in the UK (Office
for National Statistics 2011a).
Regardless of any such methodological shortcomings, however, cold calling hotel
businesses following their selection from a list of organisations as the IDBR was
not considered likely to yield good results. Indeed, the lack of enthusiasm for co-
193
operation shown by many of the hotel general managers - even when contact was
supported and endorsed by either the hotel association to which that hotel
belongs – supports this position.
In practical terms, the sample consists of non-supervisory waiting staff working in
table service restaurants in 3 and 4 star hotels in the UK and can therefore be
considered reflective of this constituency.
Evaluating survey non-response
Survey research findings can be influenced by non-response bias that can be
introduced where the responses of persons who did complete the survey differ
substantially from those who do not complete the survey (see e.g. Keegan and
Lucas 2005). For example, if married couples were under-represented in a
particular survey, and married couples have significantly different opinions and/or
experiences from the remainder of the population, then a form of systematic bias
has been introduced to the survey data.
In this survey, bias could potentially have been introduced through the
discriminatory selection of recipients on the part of the person distributing the
survey forms, thus preventing some potential respondents actually receiving the
survey form. The specific concern for this survey had been that hotels might
select employees who enjoy good leader relations in order to produce a
favourable result for that hotel or hotel group. To counter this possibility, the
researcher made it clear to all of the participating hotels that, because the
statistical analysis required a sample size of 200 or more, it would be impossible
to make any inferences about individual hotels or even hotel groups and that they
should not, therefore, be concerned in any way about any findings emerging that
might be unfavourable for their organisation.
While steps have been taken to counter this particular source of non-response
bias, it is nevertheless good practice to evaluate, as far as possible, the nature of
any survey non-response so that any potential bias on the findings can be
anticipated, investigated and ultimately accounted for. The remainder of this
section follows a structured approach to evaluating the nature of any survey non-
response. The effects of any such non-response on the research findings (i.e. the
resulting non-response bias) will be evaluated following the development of the
statistical models using multi-group SEM analyses (see Section 7.15).
194
Armstrong and Overton (1977) suggest several methods for evaluating the
potential impact of non-response on survey findings: (i) researchers’ subjective
estimates of the likely nature of the non-response bias based on the
characteristics of the non-respondents (see e.g. Kirchner and Mousley 1963; and
Vincent 1964 for using this technique based on socio-demographic variables); (ii)
extrapolation, which is based on the assumption that ‘late responders’ are more
like non-responders than ‘early responders’ and then examining differences in
data between early and later responders; and (iii) comparing respondents’
characteristics with known characteristics for the population of interest.
Regarding the use of subjective estimates of the effect of non-response
bias, there is not a great deal of literature in the hospitality leadership area to
guide such a process. In the case of nationality, Testa (2002, 2004, 2009) has
found evidence for greater levels of high-quality leader-member relations between
supervisors and staff with the same nationality. Elsewhere, however, Wong and
Chan (2010) found no evidence for nationality influencing employees’ leadership
perceptions. With respect to respondent age, none of the identified hospitality
leadership articles have included age (neither employee or supervisor) as an
independent variable in their respective analyses.
Owing to the way that this survey was administered it is not possible to
distinguish between early and late responders and therefore the extrapolation
approach for assessing non-response bias is not a feasible option. The method of
administration involved the survey forms being sent to a hotel contact person who
then distributed the forms to the potential respondents. The forms were then
either returned directly to Bournemouth University by respondents, or were
returned firstly to the hotel contact who then returned them to the University.
Because it is not known to the researcher when each respondent received the
survey form, nor when that respondent completed and returned it (was it
returned directly or via the hotel contact?) it is not possible to determine early
from late respondents.
The most efficacious method for determining the characteristics of survey non-
response was to examine the characteristics of the sample and compare these
with known population values. Known (approximate) population values were
identified using the current People 1st’s Industry Profiles for the hotels and
restaurants sector (People 1st 2011a, 2011b) (figures for the waiter category
were obtained directly from People 1st (2011c)). All of these data are derived
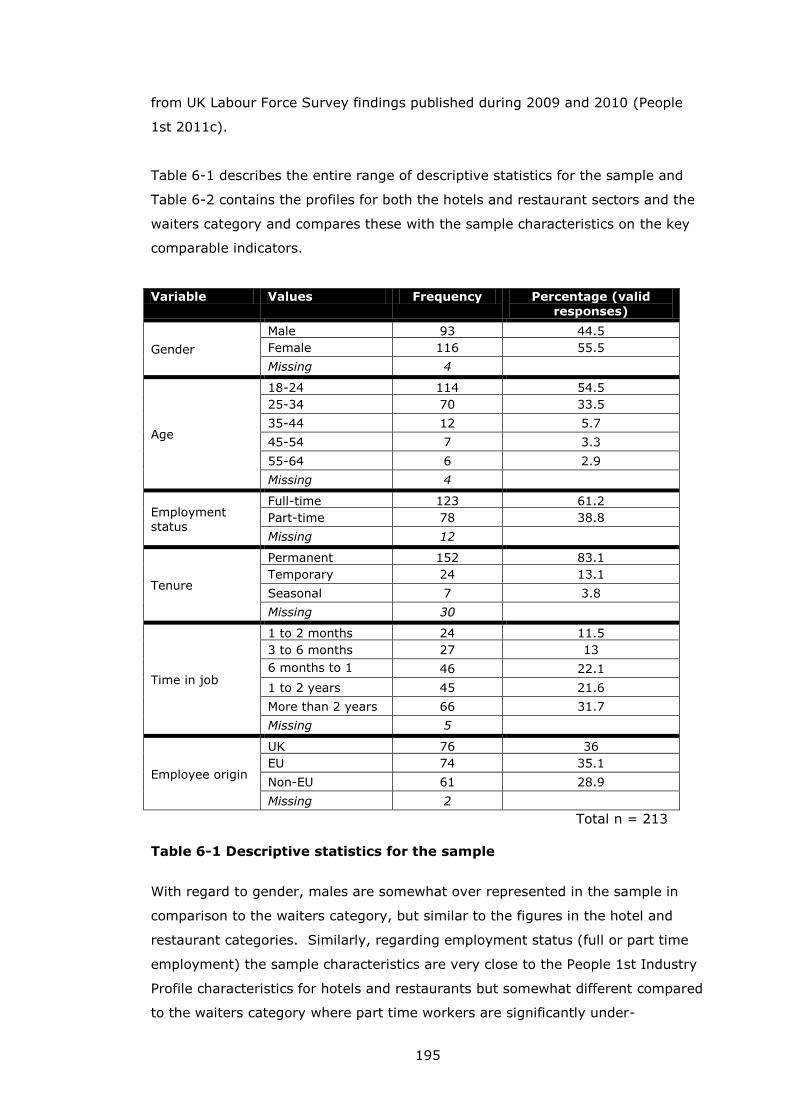
195
from UK Labour Force Survey findings published during 2009 and 2010 (People
1st 2011c).
Table 6-1 describes the entire range of descriptive statistics for the sample and
Table 6-2 contains the profiles for both the hotels and restaurant sectors and the
waiters category and compares these with the sample characteristics on the key
comparable indicators.
Variable Values Frequency Percentage (valid
responses)
Gender
Male 93 44.5
Female 116 55.5
Missing 4
Age
18-24 114 54.5
25-34 70 33.5
35-44 12 5.7
45-54 7 3.3
55-64 6 2.9
Missing 4
Employment status
Full-time 123 61.2
Part-time 78 38.8
Missing 12
Tenure
Permanent 152 83.1
Temporary 24 13.1
Seasonal 7 3.8
Missing 30
Time in job
1 to 2 months 24 11.5
3 to 6 months 27 13
6 months to 1 year
46 22.1
1 to 2 years 45 21.6
More than 2 years 66 31.7
Missing 5
Employee origin
UK 76 36
EU 74 35.1
Non-EU 61 28.9
Missing 2
Total n = 213
Table 6-1 Descriptive statistics for the sample
With regard to gender, males are somewhat over represented in the sample in
comparison to the waiters category, but similar to the figures in the hotel and
restaurant categories. Similarly, regarding employment status (full or part time
employment) the sample characteristics are very close to the People 1st Industry
Profile characteristics for hotels and restaurants but somewhat different compared
to the waiters category where part time workers are significantly under-
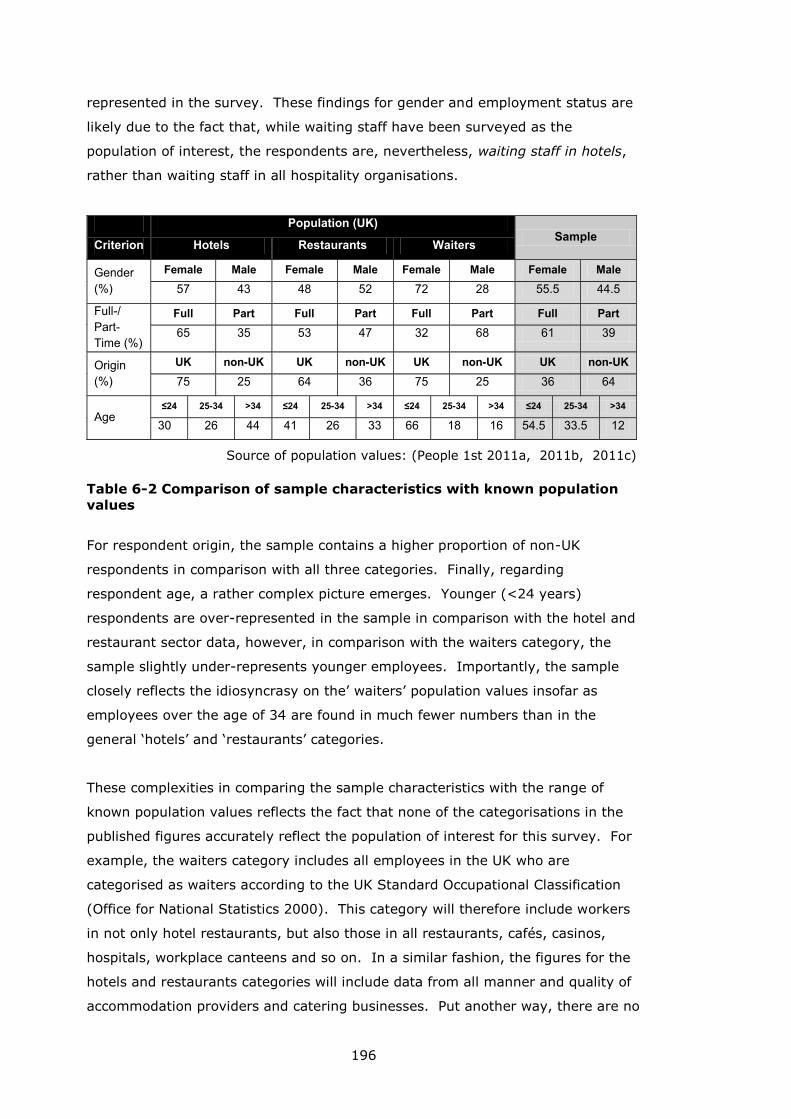
196
represented in the survey. These findings for gender and employment status are
likely due to the fact that, while waiting staff have been surveyed as the
population of interest, the respondents are, nevertheless, waiting staff in hotels,
rather than waiting staff in all hospitality organisations.
Population (UK) Sample
Criterion Hotels Restaurants Waiters
Gender
(%)
Female Male Female Male Female Male Female Male
57 43 48 52 72 28 55.5 44.5
Full-/
Part-
Time (%)
Full Part Full Part Full Part Full Part
65 35 53 47 32 68 61 39
Origin
(%)
UK non-UK UK non-UK UK non-UK UK non-UK
75 25 64 36 75 25 36 64
Age ≤24 25-34 >34 ≤24 25-34 >34 ≤24 25-34 >34 ≤24 25-34 >34
30 26 44 41 26 33 66 18 16 54.5 33.5 12
Source of population values: (People 1st 2011a, 2011b, 2011c)
Table 6-2 Comparison of sample characteristics with known population
values
For respondent origin, the sample contains a higher proportion of non-UK
respondents in comparison with all three categories. Finally, regarding
respondent age, a rather complex picture emerges. Younger (<24 years)
respondents are over-represented in the sample in comparison with the hotel and
restaurant sector data, however, in comparison with the waiters category, the
sample slightly under-represents younger employees. Importantly, the sample
closely reflects the idiosyncrasy on the’ waiters’ population values insofar as
employees over the age of 34 are found in much fewer numbers than in the
general ‘hotels’ and ‘restaurants’ categories.
These complexities in comparing the sample characteristics with the range of
known population values reflects the fact that none of the categorisations in the
published figures accurately reflect the population of interest for this survey. For
example, the waiters category includes all employees in the UK who are
categorised as waiters according to the UK Standard Occupational Classification
(Office for National Statistics 2000). This category will therefore include workers
in not only hotel restaurants, but also those in all restaurants, cafés, casinos,
hospitals, workplace canteens and so on. In a similar fashion, the figures for the
hotels and restaurants categories will include data from all manner and quality of
accommodation providers and catering businesses. Put another way, there are no
197
published population values for the specific population of interest that this
research focuses on (waiting staff in hotels with table service restaurants) or that
focus on the more specific constituencies (types of organisations) that form the
sample for this research (3 and 4 star hotels).
Assessing the likely impacts of non-response bias is clearly problematic in the
light of the difficulties arising from attempting to evaluate survey non-response
through comparisons of the sample characteristics with known values from
similar, but not identical, populations.
It is possible, however, to use SEM analysis to move beyond the subjective
estimation of non-response effects. Specifically, in order to explore whether or
not respondents’ demographic characteristics have any influence on the study
findings, multi-group SEM analyses will be performed to explore the differences
between groups. These multigroup analyses are reported in Section 7.15.
The benefit of SEM multi-group analysis in the context of survey non-response is
that, where a multi-group SEM model indicates that group membership does not
influence the measured relationships within a SE model, then we can be assured
that, even in the absence of a perfect understanding of the representativeness of
the sample, the estimated relationships are likely to be generalisable to the
population of interest.
6.6 Data screening
Prior to initiating the modelling work, the data were screened for missing values,
distributional normality, presence of outliers and an analysis of non-response
assessed how consistently the sample compares with the population of interest.
6.6.1 Treatment of missing data
Missing data are not uncommon in survey research (e.g. Byrne 2010: 353) and a
common source of missing data when using respondent-completed questionnaires
is non-response to one or more survey questions. Not surprisingly, an initial
examination of the completed data set for this research shows that there are
some missing values. Such non-response can occur where some respondents are
198
unwilling to answer sensitive questions relating to, for example, age or income.
More significantly in the context of this research, is the issue of individual item
statements (or even whole sections of the questionnaire containing item
statements) not being completed.
Specific concern over non-response to individual item statements relates to the
limitations that this can place on the range of methods available for developing
the structural equation models. These concerns are described in greater detail
below.
Methods to deal with missing item statement data include (i) removing all cases
containing missing data (listwise deletion), (ii) excluding cases from a specific
analysis where a variable in that analysis is affected by missing data (pairwise
deletion) and (iii) replacing the missing data using estimates of what the values
might have been had they been entered by respondents.
Pairwise and (especially) listwise deletions both result in sample size attrition
(Schumaker and Lomax 2004: 25-26) and pairwise deletions can cause other
problems with SEM covariance matrices (see e.g. Kline 2005: 53-54). Because of
the sample size issue, Schumaker and Lomax (2004: 26) note that it is generally
preferable to replace missing values rather than simply remove cases with
missing values.
Missing value replacement (imputation) techniques include mean imputation
where missing values are replaced by the mean value (representing the most
likely value for that observation) for that variable, calculated from the values of
the completed responses. This method has negative consequences for SEM since
increasing the number of observations with mean values reduces the amount of
variance. Alternatively, regression imputation uses the actual observed values in
that variable as predictors (in regression equations) of the replacement values.
Once again, however, for SEM analyses, issues can arise with the undesirable
effects that this technique can have on variances (and covariances) (Byrne
2010:357). Finally, in recent years, model-based imputation methods have
emerged that improve upon both mean and regression methods. The model-
based methods replace missing data with values that are calculated from model-
specific statistics (see e.g. Kline 2005: 55) and are generally regarded as superior
to means substitution and regression imputation, particularly when sample sizes
are below 250 (Hair et al. 2006: 739-740).
199
The AMOS software for SEM analysis offers researchers an alternative method for
estimating models in the presence of missing data that relies neither on removing
cases nor imputing data. Rather it uses a special - and effective (Byrne 2010:
359) - form of maximum likelihood (full information maximum likelihood, FIML)
estimation to compute model parameters where variables contain missing data
(Kline 2005: 56; Arbuckle 2009: 270). Shumaker and Lomax (2004: 43) note
that FIML has become the favoured approach for dealing with missing data in SEM
analyses.
The FIML method, however, is not particularly suitable for the model generating
approach to SEM utilised in this research. This is because the FIML method (in
AMOS at least) does not allow for the computation of a standardised residual
covariance matrix (SRCM) or modification indices, both of which provide
information related to unmeasured variance in the model and are of key
importance for model modification and development. A further drawback with the
FIML method (which affects some of the analyses in this research) is its inability
to calculate bootstrapped estimates that are used to provide confidence intervals
for parameter estimates where data are multivariate non-normal. Finally, the
standardised root mean square residual (SRMR) estimate - which is a useful
measure of global model fit (see Section 7.2.6) - cannot be calculated with the
FIML method.
Based on the information described above, the favoured approach for dealing with
missing data in this research, is to firstly replace the missing data using the
model-based imputation method (using the AMOS software). This is the next-
best method for dealing with missing data short of using the FIML method and it
allows for (i) the use of modification indices for model development and (ii)
bootstrapped estimates to check the robustness of parameter estimates in models
where data are multivariate non-normal. Following Schumaker and Lomax’s
‘advice for prudent researchers’, (2004: 43) the parameter estimates and
goodness of fit statistics from the models that have been developed using data
sets containing imputed data will then be compared with estimates for the same
(fully-developed) models calculated using the FIML method.
In summary, the final models developed from model-based missing value
replacement will be re-estimated using the FIML to check that the imputation
process has not adversely affected the ultimate findings from the research.
200
In addition to the considerations described above, the selection of imputation
method is dependent on the characteristics of the missing data in terms of their
type, extent and degree of randomness (Hair et al. 2006: 54). The model-based
imputation method for replacing missing values is robust against all degrees of
randomness (Hair et al. 2006: 58), nevertheless, this research goes on to follow
Hair et al.’s (2006: 53) four-step process to evaluate the type and extent of the
missing data and to characterise its degree of randomness.
Prior to beginning the four-step process, an initial examination of the 234
returned survey forms found that of these, 8 had not been completed at all and a
further 2 were missing around half of the 53 item scale questions. These 10
survey forms were removed from the database leaving 224 survey forms to
examine.
Step 1 – Type of missing data
Step 1 of Hair et al.’s (2006) process is to determine whether or not the missing
data are ignorable.
The missing data associated with the Service Quality (SQ) latent construct are
ignorable, since these are missing by design. Specifically, the approach to
measuring SQ for this research is to record the frequency that each respondent is
able to deal with each type of service failure / negative situation, while
maintaining customer satisfaction. Because it is possible that an individual
respondent ‘never’ experiences the particular service failure situation being
described, respondents were instructed simply not to respond in these
circumstances.
Because they are ignorable, the Service Quality (SQ) data (measured using 7
item statements) are not included in the following discussion. Furthermore,
because of the inherent missing data in the measurement of the SQ latent
construct, the SQ data are analysed in a separate modelling exercise using a
truncated sample based on listwise deletion of cases.
Step 2 – Extent of missing data
The remaining missing data are non-ignorable and Step 2 is to determine the
extent of these.
201
Hair et al. (2006: 54-55) note that there are no hard-and-fast rules for
determining exactly how few missing data are acceptable before moving on to
complete the data set with replacement values. General rules of thumb provided
by Hair et al. (2006: 55-56) are that: (A) it should be possible to undertake the
planned analysis effectively using only the cases with no missing values at all; (B)
variables with 15 per cent of values missing are candidates for deletion; (C)
generally, missing data under 10 per cent for an individual case can be ignored,
provided it occurs in a non-random fashion; and (D) removal of a variables or
case is justified if this removal significantly decreases the volume of missing data.
For the remaining 46 item statement variables (53 item statements in total minus
the 7 measuring SQ = 46) across the 224 cases, analyses were performed to
establish: (i) the percentage of variables containing missing vales; (ii) how the
missing values are distributed amongst cases; and (iii) the overall level of missing
data in the data set. Having measured these aspects of the data set, Hair et al.
(2006: 55) recommend further examination to identify non-random patterns of
missing data such as concentration of missing data on specific sets of
questions/statements and attrition in questionnaire completion.
SPSS’s Missing Value Analysis (MVA) module produces summary descriptive
statistics for the proportion of cases and variables with missing values, the
proportion of missing values in each variable and the proportion of all data points
that do not contain a value. The MVA module does not, however, provide a value
for the number of missing values for each case. Accordingly, a new variable
(named Miss_Per_Case) was manually computed in SPSS to provide a sum of
missing values per case.
The MVA analysis reveals that 6 of the 46 variables (13 per cent) in the data set
have no missing values and that 99 per cent of data points are complete.
With regard to rule of thumb (A), the 177 cases with no missing data do provide
an adequate sample size to perform the planned analysis (see the discussion on
sample sizes for SEM in section 6.5.2).
Considering rule of thumb (B), all variables are significantly below the level of 15
per cent missing values that indicates they are candidates for deletion. The
largest proportion of missing values per variable is 3.1 per cent (applying to 4
variables).
202
Considering rule of thumb (C) 6 cases with greater than 10 per cent missing
values are flagged for attention.
The next step is to examine the missing data for non-random patterns.
Six cases had a clear non-random pattern of missing data – specifically, these
respondents had not completed any of the 4 DSB (Discretionary Service
Behaviour) item statements. This may be an example of ‘end of questionnaire
attrition’ (see e.g. Hair et al. 2006: 55) as the four DSB items appear on the back
page of the survey form, separate from the other item scale statements.
Although, notably, 3 of these 6 respondents actually went on to complete the
demographic questions following the DSB item statements.
Hair et al. (2006: 55) note that, to a large extent, researcher judgment is
required in assessing the impact of missing data on any particular data set. For
this research, considering the requirement to avoid a concentration of missing
data on specific sets of questions/statements, an ad hoc guideline was introduced
to prevent concentrated missing data on individual latent constructs. Specifically,
it was decided to remove cases where missing values constitute more than one
third of the total values per latent construct. In practical terms, this means that
for latent constructs measured with 3 to 5 items, no more than 1 item per case
could be missing. For latent constructs with 6 to 8 items no more than 2 items
could be missing.
Five cases with instances of more than one third of values missing within a latent
construct were identified:
1 case was missing 2 DSB items (DSB has 4 items in total);
1 case was missing 4 ML (Motivational Leadership) items (ML has 5 items in
total);
1 case was missing 3 ML items and 3 JP (Job Performance) items (JP has 4
items in total);
1 case was missing 3 ME (Work Meaning) items (ME has 5 items in total); and
1 case was missing 2 ME items (ME has 5 items in total).
These 11 cases with non-random, or concentrated patterns of missing values
were removed from the data set leaving 213 cases. This results in the data set
containing only two cases where more than one value was missing per latent
construct. The first case was missing 2 values (33.3 per cent) from the Job
Satisfaction (JS) construct and the second case was missing 2 values (29 per
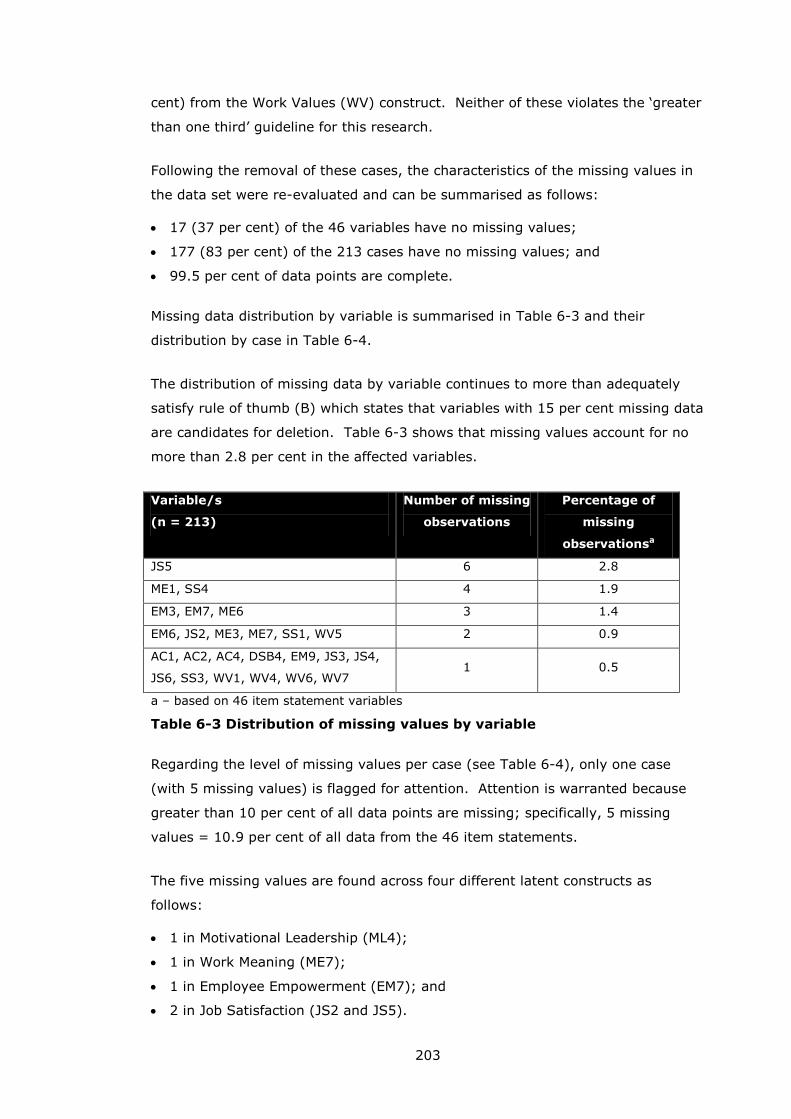
203
cent) from the Work Values (WV) construct. Neither of these violates the ‘greater
than one third’ guideline for this research.
Following the removal of these cases, the characteristics of the missing values in
the data set were re-evaluated and can be summarised as follows:
17 (37 per cent) of the 46 variables have no missing values;
177 (83 per cent) of the 213 cases have no missing values; and
99.5 per cent of data points are complete.
Missing data distribution by variable is summarised in Table 6-3 and their
distribution by case in Table 6-4.
The distribution of missing data by variable continues to more than adequately
satisfy rule of thumb (B) which states that variables with 15 per cent missing data
are candidates for deletion. Table 6-3 shows that missing values account for no
more than 2.8 per cent in the affected variables.
Variable/s
(n = 213)
Number of missing
observations
Percentage of
missing
observationsa
JS5 6 2.8
ME1, SS4 4 1.9
EM3, EM7, ME6 3 1.4
EM6, JS2, ME3, ME7, SS1, WV5 2 0.9
AC1, AC2, AC4, DSB4, EM9, JS3, JS4,
JS6, SS3, WV1, WV4, WV6, WV7 1 0.5
a – based on 46 item statement variables
Table 6-3 Distribution of missing values by variable
Regarding the level of missing values per case (see Table 6-4), only one case
(with 5 missing values) is flagged for attention. Attention is warranted because
greater than 10 per cent of all data points are missing; specifically, 5 missing
values = 10.9 per cent of all data from the 46 item statements.
The five missing values are found across four different latent constructs as
follows:
1 in Motivational Leadership (ML4);
1 in Work Meaning (ME7);
1 in Employee Empowerment (EM7); and
2 in Job Satisfaction (JS2 and JS5).
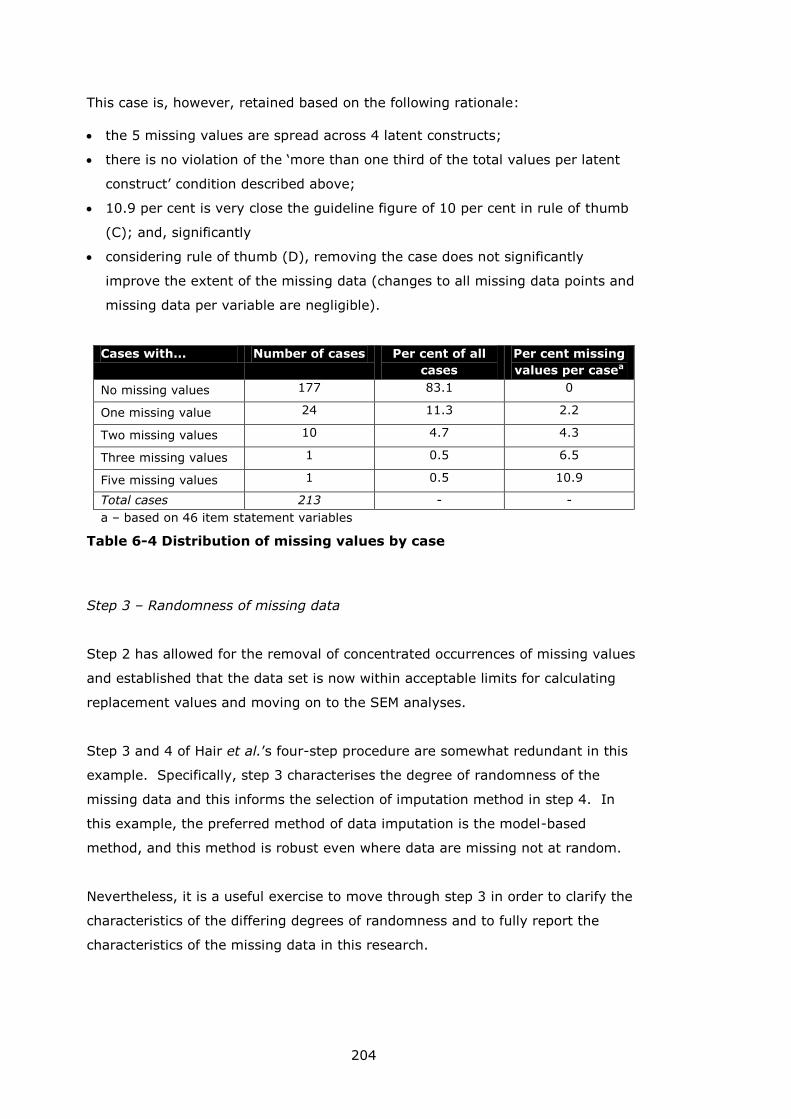
204
This case is, however, retained based on the following rationale:
the 5 missing values are spread across 4 latent constructs;
there is no violation of the ‘more than one third of the total values per latent
construct’ condition described above;
10.9 per cent is very close the guideline figure of 10 per cent in rule of thumb
(C); and, significantly
considering rule of thumb (D), removing the case does not significantly
improve the extent of the missing data (changes to all missing data points and
missing data per variable are negligible).
Cases with... Number of cases Per cent of all
cases
Per cent missing
values per casea
No missing values 177 83.1 0
One missing value 24 11.3 2.2
Two missing values 10 4.7 4.3
Three missing values 1 0.5 6.5
Five missing values 1 0.5 10.9
Total cases 213 - -
a – based on 46 item statement variables
Table 6-4 Distribution of missing values by case
Step 3 – Randomness of missing data
Step 2 has allowed for the removal of concentrated occurrences of missing values
and established that the data set is now within acceptable limits for calculating
replacement values and moving on to the SEM analyses.
Step 3 and 4 of Hair et al.’s four-step procedure are somewhat redundant in this
example. Specifically, step 3 characterises the degree of randomness of the
missing data and this informs the selection of imputation method in step 4. In
this example, the preferred method of data imputation is the model-based
method, and this method is robust even where data are missing not at random.
Nevertheless, it is a useful exercise to move through step 3 in order to clarify the
characteristics of the differing degrees of randomness and to fully report the
characteristics of the missing data in this research.
205
Missing data are categorised by Hair et al. (2006: 56) according to three different
types:
(i) non-random missing values – also referred to as Not Missing at Random
(NMAR, Byrne 2010: 354) and non-ignorable missing data (Schumaker and
Lomax 2004: 43; Garson 2011a);
(ii) Missing at Random (MAR); and
(iii) Missing Completely at Random (MCAR).
Non-random missingness in variable X can be determined where there are
statistically significant differences in the values of an independent variable Y when
the observations on Y are disaggregated using X = missing and X = not missing.
For example, where a categorical variable (Y) is measuring gender and X is a
attitudinal scale variable, a new, dichotomous missing/not missing variable (X1)
can be recoded from X. A chi square (χ2) test can then reveal if there is a
statistically significant measure of association between X1 and Y. A positive result
indicates that gender may be having an effect on whether or not variable X is
missing. Simply removing cases where X is missing might then bias the survey
findings with regard to gender dimensions. This is one reason (aside from
attrition of sample size) why it is often preferable to replace missing values rather
than simply remove them.
Using the same example, variables X (an attitudinal scale variable) and Y (a
categorical gender variable) as above, where data are Missing at Random
(MAR), we see that while there is not a random distribution of missing data
between females and males, within each sub-group (female and male) the
missing data are distributed at random.
Where data are Missing Completely at Random (MCAR), there is no correlation
between missingness of data and any other variable.
Following the guidelines in Hair et al. (2006: 57) each of the 29 item statements
with missing data was cross-tabulated with the demographic variables in the
survey to assess whether or not these demographic variables influence the
presence of the missing data. The demographic variables are:
gender;
age;
full-time / part-time;
206
permanent / seasonal / temporary;
length of service; and
respondent origin (UK / non-UK).
The analysis was carried out using the SPSS Missing Value Analysis (MVA) module
and revealed some minor fluctuations in the proportions of missing data
attributable to age (and its effect on non-response to JS5) and length of service
(and its effect on non-response to EM3). However, the absolute volumes of
missing data in these variables involved are so small (the JS5 variable is missing
5 out of 213 total observations and EM3 is missing is missing 3 out of 213) that
these fluctuations cannot be regarded as meaningful in a statistical sense. To
investigate this further χ2 (chi square) tests were carried out on age/JS5 and
length of service/EM3. These tests confirmed that it is not possible to infer
statistical meaningfulness on these findings as the assumptions of the χ2 test are
not met (i.e. the proportions of expected counts less than 5 are >20 per cent).
Using the SPSS MVA module once again, the item statement data were tested for
their MCAR (Missing Completely at Random) status using Little’s (1988) MCAR
test. This procedure tests the hypothesis that the missing data are missing
completely at random (MCAR) and a p value of <0.05 means that this hypothesis
should be rejected – meaning that the missing data cannot be classified as MCAR.
The analysis produced a p value of 0.002 and so the hypothesis that the missing
data are MCAR is rejected.
In conclusion, the data meet the assumptions for MAR but fail the test for MCAR.
Additionally, the characteristics of the missing data satisfy the four rules of thumb
described by Hair et al. (2006: 55-56).
6.6.2 Distributional normality
As noted in Section 6.3 above, none of the measured variables violate Curran et
al.’s (1996: 26) bounds of 2 for univariate skewness or 7 for univariate kurtosis
(see Appendix II for details).
Multivariate normality is measured using AMOS’s critical ratio (C.R) for
multivariate kurtosis which is equivalent to Mardia’s (1970) normalised estimate
of multivariate kurtosis (Byrne 2010: 104). C.R. values greater than 5 can be
207
regarded as indicative of the existence of multivariate non-normality (Bentler
2005 cited in Byrne 2010: 104). Where an optimal model specification
demonstrates a multivariate kurtosis C.R. value greater than 5, the model is re-
estimated, following the procedure described by Byrne (2010: 329-352), using
AMOS’s bootstrap procedure which generates confidence intervals for each
parameter. In this way parameters are checked for their robustness in the light
of multivariate non-normality as required. Critical ratio estimates for multivariate
normality, and bootstrapped estimates where appropriate, are reported in
Appendix IV.
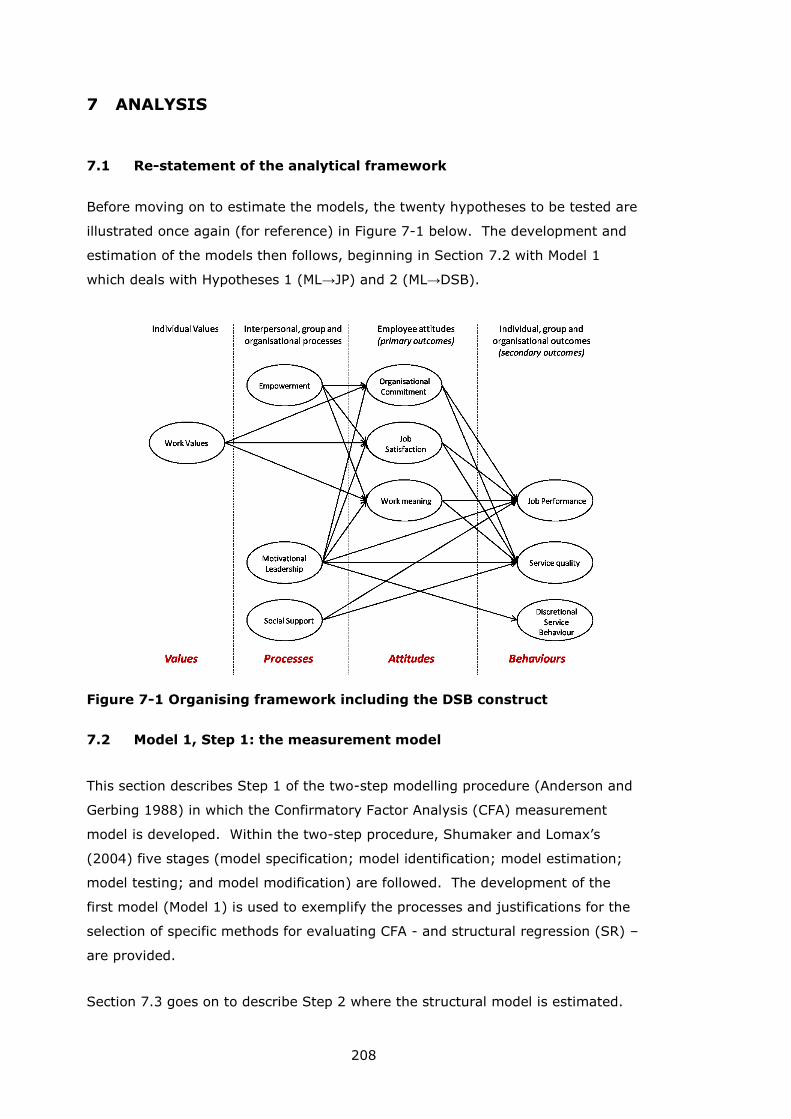
208
7 ANALYSIS
7.1 Re-statement of the analytical framework
Before moving on to estimate the models, the twenty hypotheses to be tested are
illustrated once again (for reference) in Figure 7-1 below. The development and
estimation of the models then follows, beginning in Section 7.2 with Model 1
which deals with Hypotheses 1 (ML→JP) and 2 (ML→DSB).
Figure 7-1 Organising framework including the DSB construct
7.2 Model 1, Step 1: the measurement model
This section describes Step 1 of the two-step modelling procedure (Anderson and
Gerbing 1988) in which the Confirmatory Factor Analysis (CFA) measurement
model is developed. Within the two-step procedure, Shumaker and Lomax’s
(2004) five stages (model specification; model identification; model estimation;
model testing; and model modification) are followed. The development of the
first model (Model 1) is used to exemplify the processes and justifications for the
selection of specific methods for evaluating CFA - and structural regression (SR) –
are provided.
Section 7.3 goes on to describe Step 2 where the structural model is estimated.
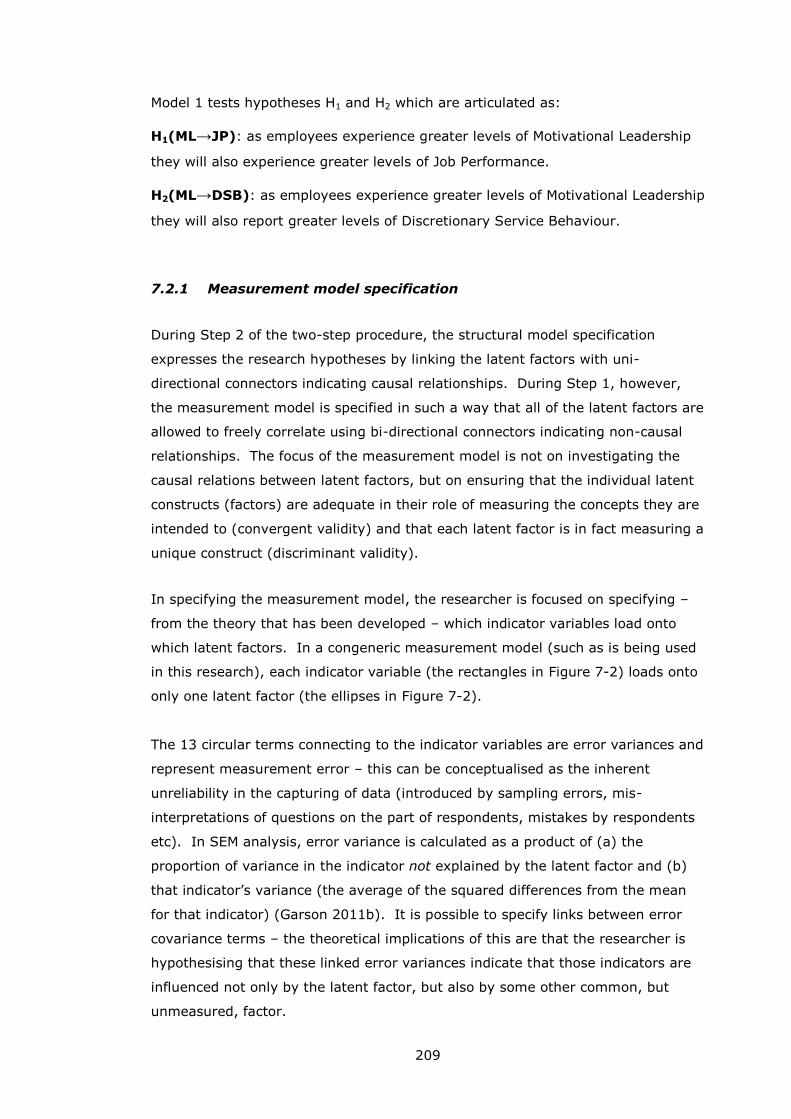
209
Model 1 tests hypotheses H1 and H2 which are articulated as:
H1(ML→JP): as employees experience greater levels of Motivational Leadership
they will also experience greater levels of Job Performance.
H2(ML→DSB): as employees experience greater levels of Motivational Leadership
they will also report greater levels of Discretionary Service Behaviour.
7.2.1 Measurement model specification
During Step 2 of the two-step procedure, the structural model specification
expresses the research hypotheses by linking the latent factors with uni-
directional connectors indicating causal relationships. During Step 1, however,
the measurement model is specified in such a way that all of the latent factors are
allowed to freely correlate using bi-directional connectors indicating non-causal
relationships. The focus of the measurement model is not on investigating the
causal relations between latent factors, but on ensuring that the individual latent
constructs (factors) are adequate in their role of measuring the concepts they are
intended to (convergent validity) and that each latent factor is in fact measuring a
unique construct (discriminant validity).
In specifying the measurement model, the researcher is focused on specifying –
from the theory that has been developed – which indicator variables load onto
which latent factors. In a congeneric measurement model (such as is being used
in this research), each indicator variable (the rectangles in Figure 7-2) loads onto
only one latent factor (the ellipses in Figure 7-2).
The 13 circular terms connecting to the indicator variables are error variances and
represent measurement error – this can be conceptualised as the inherent
unreliability in the capturing of data (introduced by sampling errors, mis-
interpretations of questions on the part of respondents, mistakes by respondents
etc). In SEM analysis, error variance is calculated as a product of (a) the
proportion of variance in the indicator not explained by the latent factor and (b)
that indicator’s variance (the average of the squared differences from the mean
for that indicator) (Garson 2011b). It is possible to specify links between error
covariance terms – the theoretical implications of this are that the researcher is
hypothesising that these linked error variances indicate that those indicators are
influenced not only by the latent factor, but also by some other common, but
unmeasured, factor.
210
It is not unusual for error variances to be linked (creating error covariances) in
model generating SEM, and this is often done during the model modification stage
(Kline 2005: 64-65) in order to improve model fit. Indeed, Bentler and Chou
(1987: 108), 1987, p. 108) have argued that forcing errors to be uncorrelated is
highly restrictive and “rarely appropriate for real data”. When introducing error
covariances in this way, however, researchers should always give consideration to
the theoretical implications it has for the model - not least because including
previously unspecified error covariances introduces an unknown and unmeasured
common factor into the model which can only serve to weaken the a priori theory
(see e.g. Kline 2005: 318).
The specification for measurement model CFA 1:1 is illustrated in Figure 7-2.
Figure 7-2 Specification for the measurement model CFA 1:1
Two constructs, Job Performance (JP) and Discretionary Service Behaviour(DSB),
are specified with 4 indicators while the Motivational Leadership construct (ML)
has 5 indicator variables. This means that the model exceeds the requirements
for model identification (see Section 7.2.2 below). Each indicator corresponds
with an individual item statement in the questionnaire (see Appendix VIII) and
the inclusion of each set of item statements (i.e. the measurement scale for each
construct) is based on the discussions in Chapter 5.
7.2.2 Measurement model identification
Model identification is essentially concerned with satisfying the requirements that:
(a) it should be possible to solve the equations (identify a unique solution) for the
relationships that are described by the theoretical model; and (b) every latent
211
(unobserved) factor must be assigned a scale (or metric) in order that estimates
of effects can be calculated.
The latter issue is dealt with by constraining the unstandardised coefficient
(loading) of one indicator per latent factor to 1, as illustrated in Figure 7-2. This
type of constraint is referred to as a unit loading identification (ULI) constraint; an
alternative method (not used here) exists, wherein the variance of the latent
factor is constrained to 1, this being referred to as a unit variance identification
(UVI) constraint. Also for scaling purposes, a unit loading identification (ULI)
constraint (value = 1) is applied to each indicator’s unstandardised residual path
coefficient (the connecting line between each indicator and its error term) - again,
these constraints can be seen in Figure 7-2. A more detailed discussion of model
identification can be found in Kline (2005: 170-171).
The former issue, that of identifying a unique solution for each parameter to be
estimated can be addressed by using the following guidelines from Hair et al.
(2006: 785; 792):
the four indicator rule stating that for a single factor CFA model, 4 indicators
are required for the model to be identified;
the three indicator rule which “is satisfied when all factors in a congeneric
(indicators load onto only one factor) model have at least three significant
indicators” and;
the two indicator rule which “states that a congeneric factor model with two
significant items per factor will be identified as long as each factor also has a
significant relationship with some other factor”.
Regarding the ‘two indicator rule’ it should be noted that while factors with only
two items can be successfully integrated into SEM models following the criteria
above, (i) two indicator factors can be subject to estimation problems at later
stages of the SEM process (Hair et al. 2006: 786) and (ii) researchers should be
aware of the issue of interpretational confounding where some of the substantive
meaning of the factor is accounted for by the nature of the other latent factors in
the model and not just by that factor’s own indicators (see e.g. Burt 1976).
The specification of four and five indicators (respectively) for the latent factors in
Model 1 exceeds these recommendations and concurs with Rigdon’s (1995: 376)
advice to initially specify models with sufficient parameters to allow for the
deletion of parameters during model modification.
212
7.2.3 Measurement model estimation
Following the discussion in Section 6.3, the measurement model (and the
subsequent structural model) is estimated using the Maximum Likelihood (ML)
estimation method.
As described in Sections 6.3 and 6.6.2, and reported in Appendix II, none of the
measured variables for this research violated the bounds of 2 for univariate
skewness, or 7 for univariate kurtosis noted by Curran et al. (1996: 26). As with
all of the structural equation models in this research, multivariate normality is
assessed for the optimal measurement and structural regression model
specifications. Details of multivariate normality for the data used to estimate
Model 1 are described in Sections 7.2.10 (measurement model) and 7.3
(structural regression model) and are fully reported along with the corresponding
bootstrapped estimates in Appendix IV.
7.2.4 Measurement model testing
Procedures for assessment of model fit fall into two broad categories: (a)
assessments of construct validity (how well the indicators variables measure the
constructs they are intended to); and (b) overall assessments of model fit. Model
fit reflects the extent to which the relationships proposed in the theoretical model
can actually be observed in the collected data and is measured using a
combination of individual fit indices.
It is not uncommon for the initially specified model to fit the data rather poorly
(see e.g. Kline 2005: 185) – the assessment of model fit being made according to
a number of fit indices (see Section 7.2.6 below). Typically, then, following an
assessment of unsatisfactory model fit, the measurement model is respecified by
examining various measures of construct validity (Section 7.2.5 below).
Identifying poorly performing indicator variables allows these variables to be
removed from the model. As these poorly performing indicators are removed, it
is usual to see improvements in both construct validity and overall model fit. It
is, of course, important that researchers carefully report model modifications and
that any changes made are done so with consideration for, and reference to, the
theoretical implications of these changes (Boomsma 2000: 475).
213
The remainder of this section (7.2) describes the issues associated with construct
validity and model fit and goes on to report the diagnostic information for the
initial specification of Model 1. The following sections (7.2.8 to 7.2.10) then
describe the process of measurement model modification. Having established a
measurement model which exhibits good construct reliability and model fit, the
next stage is to undertake work on the structural equation model. This process is
reported in Section 7.3.
7.2.5 Assessment of construct validity
The rationale for conducting CFA (confirmatory factor analysis) in SEM is to
represent (using a range of observable indicator variables) latent constructs which
are not directly observable. Therefore, it is important to assess construct validity
- the extent to which the latent constructs actually represent the concepts they
are designed to measure. Hair et al. (2006: 776) describe this as assessing “the
extent to which a set of measured items actually reflects the theoretical latent
construct those items are designed to measure”. There is not a single and
definitive test for construct validity (Kline 2005: 60) and Hair et al. (2006: 776-
779) provide a detailed discussion of four measures of construct validity:
(i) convergent validity – the extent to which items (indicators) of the latent
construct converge, that is, “share a high proportion of variance in common” (Hair
et al. 2006: 771). Three ways to estimate convergent validity are detailed:
factor loadings – the amount of variance in each indicator explained by the
latent factor
average variance extracted – the average variance extracted (AVE) is the
variance accounted for by the latent factor averaged across the indicators
construct reliability (CR) – high measures (>0.7) for CR are indicative that
all of the indicators consistently represent the same latent factor.
(ii) discriminant validity – the extent to which the latent variable is distinct from
other latent variables in the model.
(iii) nomological validity – is concerned with whether or not the correlations
among latent factors in the CFA make sense (with respect to the hypothesised
relationships or prior research).
214
(iv) face validity – also known as content validity (Hair et al. 2006: 136), this is
the correspondence between the observed variables and the construct that is
intended to be measured by the latent factor.
The four sub-sections below describe the procedures that have been used to
assess these four aspects of construct validity: following this, Section 7.2.6
provides details of the procedures used to assess model fit. The measurement
model for Model 1 is then tested against these criteria (Section 7.2.7) following
which Section 7.2.8 to 7.2.10 describe the subsequent modifications to the
measurement model for Model 1.
Convergent validity
Factor loadings To proceed with the analysis, all of the indicators’ factor
loadings should be statistically significant (Hair et al., 2006: 777; Byrne, 2010:
68). Hair et al. (p. 796) note, however, that statistical significance alone does not
indicate that a particular item is contributing to the model adequately. They
suggest (2006: 777, 795) that factor loadings should preferably be above 0.7 and
at least 0.5. The rationale for these figures is that:
(i) the square of the standardised loading - known as the squared multiple
correlation (SMC) (Kline 2005-177), or commonality estimate (Schumaker and
Lomax 2004: 170) - represents how much of the item’s variance is accounted for
by the latent construct; and
(ii) therefore, a factor loading of 0.71, when squared, describes a situation where
0.5 (0.71*0.71) of the item variance is accounted for by the factor.
Hair et al. (2006: 796) write that low loading items are “candidates for deletion”
and suggest that the associated standardised residual covariances and
modification indices11 are consulted to further evaluate the performance of these
11 The standardised residual covariance matrix provides information about the levels
of unmeasured (residual, or error) covariance between specific indicator variables.
That is, covariance not accounted for by the model. The modification indices estimate
the extent to which model fit would improve if the path between two indicator
variables’ error variances is freed (i.e. a connecting path between them is created).
There should be a good theoretical rationale for linking error variances in this way
(Kline 2005: 318).
215
indicators. Researchers must keep in mind, however, that statistics alone should
not drive model modification (see e.g. Boomsma 2000: 474-476 for a discussion
on how modifications should be defensible primarily from a theoretical
perspective) and Hair et al. do remind us (2006: 777) that even as factor loadings
fall below 0.7 they can still be considered as being important components in the
model. Kline (2005: 186) notes that an indicator may have a standardised
loading as low as 0.2 before it can be considered to ‘substantially fail’ to load on
its factor.
Average variance extracted This is a summary indicator of convergence
insofar as it describes the proportion of variation in the indicator variables -
averaged across all of the indicators - accounted for by the latent factor. Fornell
and Larker (1981: 47) recommend that latent factors should have an AVE of ≥0.5
on the basis that if the AVE is less than 0.5, then the variance owing to
measurement error is greater than the variance explained by the construct, and
the validity of the individual indicators, as well as the latent factor, is
questionable.
Construct reliability relates to the amount of variance in the factor indicators
that is actually accounted for by the factor (and not measurement or random
error). Coefficient alpha, developed by Cronbach (1951), is a commonly used
estimate for item reliability (also referred to as internal consistency); however, its
suitability for use in SEM applications has been criticised on the basis of its over-
and, more commonly, under-estimating of reliability (Raykov 1998; Hair et al.
2006: 777). Accordingly, some effort has been made by SEM researchers to
develop alternative measures (see, e.g. Fornell and Larcker 1981; Bacon et al.
1995; Raykov 1997, 1998). This work utilises the method of construct reliability
developed by Fornell and Larker (1981, see below) and recommended by Hair et
al. (2006: 777) and Garson (2011b). Kline (2005: 59) notes that there is no
‘gold standard’ for reliability scores and provides the following guidelines:
reliability coefficients of around 0.90 are considered excellent, around 0.80 are
very good and around 0.70 are adequate.
Measures employed for AVE and construct reliability Neither AVE or CR are
available as outputs in AMOS, accordingly, these were calculated separately in
Microsoft Excel using the methods developed by Fornell and Larker (1981).
Fornell and Larker’s method for calculating AVE goes beyond that recommended
by Hair et al. (2006: 777) in that it measures “the amount of variance that is
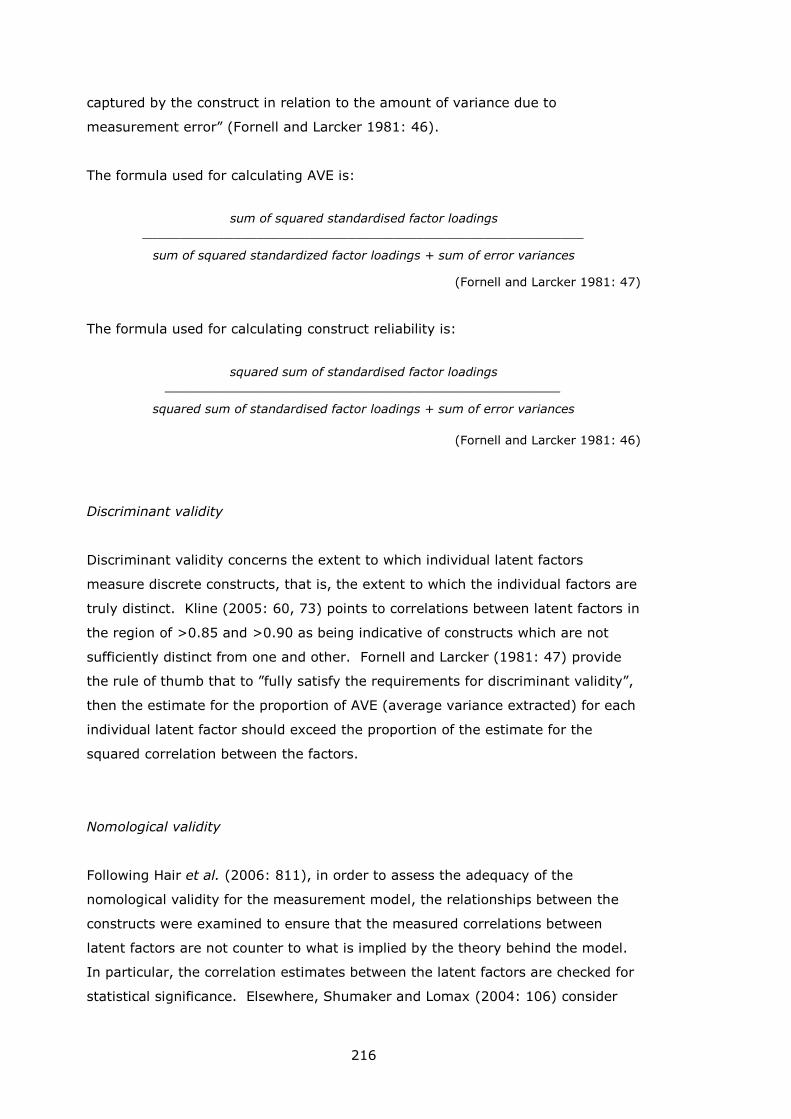
216
captured by the construct in relation to the amount of variance due to
measurement error” (Fornell and Larcker 1981: 46).
The formula used for calculating AVE is:
sum of squared standardised factor loadings __________________________________________________________
sum of squared standardized factor loadings + sum of error variances
(Fornell and Larcker 1981: 47)
The formula used for calculating construct reliability is:
squared sum of standardised factor loadings ____________________________________________________
squared sum of standardised factor loadings + sum of error variances
(Fornell and Larcker 1981: 46)
Discriminant validity
Discriminant validity concerns the extent to which individual latent factors
measure discrete constructs, that is, the extent to which the individual factors are
truly distinct. Kline (2005: 60, 73) points to correlations between latent factors in
the region of >0.85 and >0.90 as being indicative of constructs which are not
sufficiently distinct from one and other. Fornell and Larcker (1981: 47) provide
the rule of thumb that to ”fully satisfy the requirements for discriminant validity”,
then the estimate for the proportion of AVE (average variance extracted) for each
individual latent factor should exceed the proportion of the estimate for the
squared correlation between the factors.
Nomological validity
Following Hair et al. (2006: 811), in order to assess the adequacy of the
nomological validity for the measurement model, the relationships between the
constructs were examined to ensure that the measured correlations between
latent factors are not counter to what is implied by the theory behind the model.
In particular, the correlation estimates between the latent factors are checked for
statistical significance. Elsewhere, Shumaker and Lomax (2004: 106) consider
217
nomological validity as an issue to be addressed during the testing of the
structural (rather than measurement) model.
Because the structural model specifies theory-driven direction and causality of
relationships, Shumaker and Lomax’s approach makes greater sense with regard
to ensuring that the relationships between factors does not run counter to theory.
Nevertheless, one can see how the measurement model provides a preliminary
indication of nomological validity insofar as the measurement mode provides an
assessment of whether or not the factors do in fact covary (at a statistically
significant level) with each other; this being a prerequisite for a successful
structural model.
Face validity
Face validity is the extent to which the content of the items (the
questions/statements) is consistent with the with the construct definition (i.e. do
the items measure the concept they are intended to?) and is established prior to
the data collection stage of the modelling process (see Chapter 5 above on
developing the measures for the constructs). Face validity can also be referred to
as construct validity (see e.g. Kline 2005: 60).
7.2.6 Assessment of model fit
One of the advantages of SEM analysis is that it provides researchers with the
ability to make assessments with respect to the adequacy with which the overall
theoretical model accurately reflects the collected data (Kline 2005: 15). Step 1
of Anderson and Gerbing’s (1988) two-step procedure concentrates on
establishing a statistically and substantively robust measurement model – that is,
the focus during Step 1 is on the pattern (intra-factor) relationships. Ultimately,
however, during Step 2, SEM analysis allows researchers to test hypotheses
related to both the pattern (intra-factor) and structural (inter-factor) relations
simultaneously (Kline 2005: 209).
There is no single test of statistical significance that can be used to indicate a
correct model in structural equation modelling (Schumaker and Lomax 2004: 81).
A considerable number of fit indices have been developed for use in SEM, and
218
selecting which ones to employ presents something of challenge for researchers
(Kline 2005: 133-134). Kline goes on to describe how:
Because a single index reflects only a particular aspect of model fit, a
favorable value of that index does not by itself indicate good fit. This
is also why model fit is usually assessed based in part on the values of
more than one index. That is, there is no single “magic index” that
provides a gold standard for all models.
(Kline 2005: 134)
Hooper et al. (2008: 56) reviewed the findings of Boomsma (2000) Hayduk et al.
(2007) and Hu and Bentler (1999) and came to the same conclusions as Kline
(2005: 134) in recommending that researchers use a combination of:
(i) the model chi-square (including its degrees of freedom and associated p
value);
(ii) the root mean square error of approximation (RMSEA; Steiger 1990)
(including its related 90 per cent confidence interval);
(iii) the Bentler comparative fit index (CFI; Bentler 1990); and
(iv) the standardised root mean square residual (SRMR).
In addition to these four fit indices recommended by Kline (2005), Hooper et al.
(2008: 56) suggest that researchers also utilise one of the parsimony fit indices
such as the PNFI for model comparisons.
Before describing each of the selected fit indices in greater detail, the three broad
categories of fit indices are introduced.
Absolute fit indices provide a direct measure of the accuracy with which the
researcher’s hypothesised model reproduces the observed data. These fit indices
are based on comparisons between the sample covariance matrix and the model-
implied covariance matrix.
Incremental (comparative) fit indices are model comparison fit indices. That is,
they assess the extent to which a hypothesised model fits in comparison with a
baseline model (also referred to as an independence or null model). The null
model assumes that none of the observed variables are correlated. Because there
are no correlations between any of the observed variables, no data reduction
(identification of common factors) can occur. The adequacy of fit of the
219
hypothesised model is then established by measuring the improvement in model
fit (over the null model) brought about by the specification of multi-item
constructs which explain the inter-item correlations that do exist in the sample
data when these are analysed according to the hypothesised model.
Parsimony fit indices are used to determine the optimal model from a number of
competing models. The fit of each model is calculated relative to its complexity.
Parsimony fit measures improve as (i) model fit improves and (ii) model
complexity (number of estimated parameter paths) is reduced. The rationale for
parsimony fit indices is that, since more complex models are expected to fit the
data better, there should be some model fit measures that account for model
complexity. These indices are not appropriate for assessing the fit of a single
model, but are used to compare the fit of two or more models with varying levels
of complexity.
Model chi-square tests the hypothesis that the sample covariance matrix (i.e.
the covariance matrix derived from the collected data) is not significantly different
from the covariance matrix implied by the theoretical model. Because the
objective of SEM is to establish a model which concurs (closely) with empirical
observations, the researcher is seeking a non-significant (i.e. ≥0.05) p value from
the chi-square test. Model chi-square has come under criticism (see e.g:
Jöreskog 1969; Bentler and Bonett 1980), however, on the basis that the chi-
square is so sensitive to sample size that even good-fitting models can be
rejected when sample sizes exceed around 200 (Schumaker and Lomax 2004:
100). Nevertheless, chi-square offers a useful comparison measure for
hierarchical models evaluated with the same data and it is included in the formula
for many of the alternative fit measures. For these reasons it is usually included
in SEM model assessments (Kline 2005: 137).
RMSEA (root mean square error of approximation) was developed by (Steiger
and Lind 1980) and belongs within the family of absolute fit indexes. The
calculation of the RMSEA is based on a non-central chi-square distribution (as
opposed to the central chi-square distribution used in the model chi-square test).
In practical terms, this means that the RMSEA does not assume that the
researcher’s model fits the observed data perfectly. The RMSEA value provides
an indication of the degree of misspecification of the researcher’s model, with
lower values indicating better fit. Hair et al. (2006: 748) note that RMSEA values
of <0.10 are typically achieved for most acceptable models; elsewhere, Browne
220
and Cudeck (1989, 1993) provide a graduated range of RMSEA interpretations:
≤0.05 indicates close fit; >0.05 and <0.08 indicates reasonable fit; and ≥ 0.10
indicates poor fit. The PCLOSE test provides a p value for a significance test to
support or reject a finding of RMSEA ≤ 0.05. PCLOSE tests the null hypothesis
that the population RMSEA is no greater than 0.05 – accordingly, a PCLOSE value
of ≥0.05 is sought indicating that we cannot reject the null hypothesis and can
conclude that an RMSEA value of less than 0.05 is supported. A further
advantage of the RMSEA is that it is possible to calculate a confidence interval and
associated upper and lower boundaries for the likely RMSEA value (Maccallum et
al. 1996). Lastly, the RMSEA also takes model complexity into account and,
because of this, it can also be regarded as a parsimony-adjusted fit index (Kline
2005: 137). Therefore, if two competing models have the same explanatory
power, the RMSEA will favour the simpler (or most parsimonious) one. For these
reasons, the RMSEA has attracted significant support as ‘one of the most
informative fit indices’ (Diamantopoulos and Siguaw 2000: 85).
CFI (Comparative Fit Index) was developed by (Bentler 1990) and belongs to the
family of comparative (or incremental) fit indices. It is favoured because it takes
account of sample size (i.e. it is among the least affected by variations in sample
size: see e.g. Fan et al. 1999) and performs well with smaller sample sizes
(Tabachnick and Fidell 2007). Values >0.95 are usually sought for CFI (Hooper et
al. 2008) although Hair et al. (2006: 753) provide some useful and nuanced
guidelines where CFI should achieve values of between 0.90 and >0.95 depending
on sample size and the number of observed variables in the model.
The SRMR (standardised root mean residual) belongs within the absolute fit index
category and is based on the difference between the residual covariance matrix
derived from the sample data and the residual covariance matrix predicted by the
theoretical model. A perfectly fitting model will have an SRMR value of 0 and as
the SRMR value rises the model deteriorates – as such, the SRMR is a ‘badness-
of-fit’ measure Hair et al. (2006: 748). Acceptable values for SRMR range from
<0.10 (Kline 2005: 141) to <0.08 (Hu and Bentler 1999). Once again, Hair et al.
(2006: 753) provide guidelines accounting for sample size, model complexity and
the relative performance of the CFI index in combination with SRMR.
Finally, Hoelter’s Critical N (CN) (Hoelter 1983) is focussed not on model fit but
on adequacy of sample size (Byrne 2010: 83). AMOS includes Hoelter’s CN in its
model fit output and the value of this indicates the adequacy of the sample size
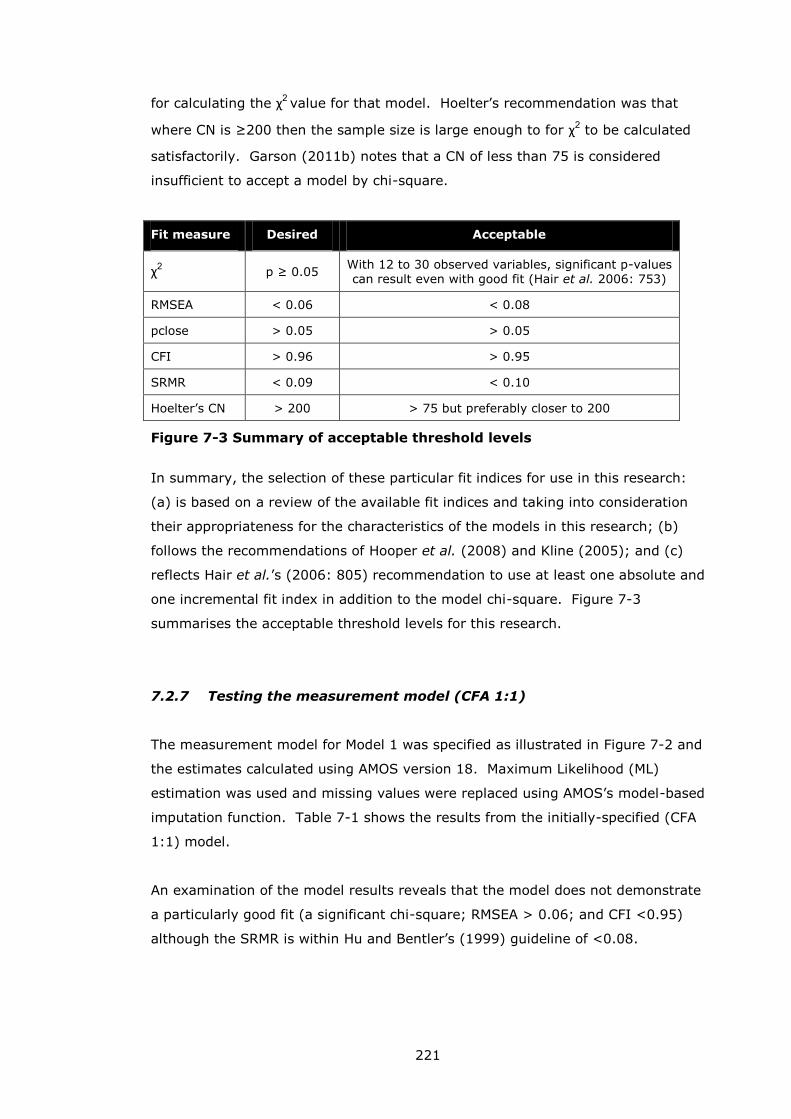
221
for calculating the χ2 value for that model. Hoelter’s recommendation was that
where CN is ≥200 then the sample size is large enough to for χ2 to be calculated
satisfactorily. Garson (2011b) notes that a CN of less than 75 is considered
insufficient to accept a model by chi-square.
Fit measure Desired Acceptable
χ2 p ≥ 0.05
With 12 to 30 observed variables, significant p-values can result even with good fit (Hair et al. 2006: 753)
RMSEA < 0.06 < 0.08
pclose > 0.05 > 0.05
CFI > 0.96 > 0.95
SRMR < 0.09 < 0.10
Hoelter’s CN > 200 > 75 but preferably closer to 200
Figure 7-3 Summary of acceptable threshold levels
In summary, the selection of these particular fit indices for use in this research:
(a) is based on a review of the available fit indices and taking into consideration
their appropriateness for the characteristics of the models in this research; (b)
follows the recommendations of Hooper et al. (2008) and Kline (2005); and (c)
reflects Hair et al.’s (2006: 805) recommendation to use at least one absolute and
one incremental fit index in addition to the model chi-square. Figure 7-3
summarises the acceptable threshold levels for this research.
7.2.7 Testing the measurement model (CFA 1:1)
The measurement model for Model 1 was specified as illustrated in Figure 7-2 and
the estimates calculated using AMOS version 18. Maximum Likelihood (ML)
estimation was used and missing values were replaced using AMOS’s model-based
imputation function. Table 7-1 shows the results from the initially-specified (CFA
1:1) model.
An examination of the model results reveals that the model does not demonstrate
a particularly good fit (a significant chi-square; RMSEA > 0.06; and CFI <0.95)
although the SRMR is within Hu and Bentler’s (1999) guideline of <0.08.
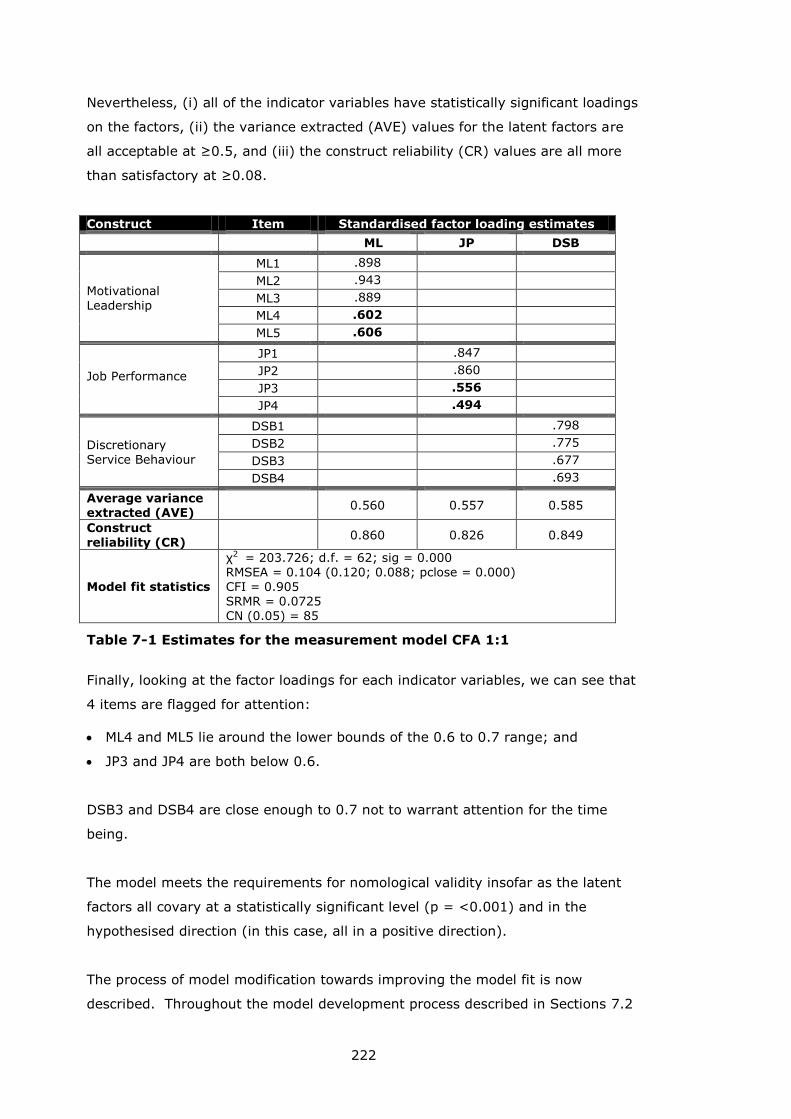
222
Nevertheless, (i) all of the indicator variables have statistically significant loadings
on the factors, (ii) the variance extracted (AVE) values for the latent factors are
all acceptable at ≥0.5, and (iii) the construct reliability (CR) values are all more
than satisfactory at ≥0.08.
Construct Item Standardised factor loading estimates
ML JP DSB
Motivational Leadership
ML1 .898
ML2 .943
ML3 .889
ML4 .602
ML5 .606
Job Performance
JP1 .847
JP2 .860
JP3 .556
JP4 .494
Discretionary Service Behaviour
DSB1 .798
DSB2 .775
DSB3 .677
DSB4 .693
Average variance extracted (AVE)
0.560 0.557 0.585
Construct
reliability (CR) 0.860 0.826 0.849
Model fit statistics
χ2 = 203.726; d.f. = 62; sig = 0.000 RMSEA = 0.104 (0.120; 0.088; pclose = 0.000) CFI = 0.905 SRMR = 0.0725 CN (0.05) = 85
Table 7-1 Estimates for the measurement model CFA 1:1
Finally, looking at the factor loadings for each indicator variables, we can see that
4 items are flagged for attention:
ML4 and ML5 lie around the lower bounds of the 0.6 to 0.7 range; and
JP3 and JP4 are both below 0.6.
DSB3 and DSB4 are close enough to 0.7 not to warrant attention for the time
being.
The model meets the requirements for nomological validity insofar as the latent
factors all covary at a statistically significant level (p = <0.001) and in the
hypothesised direction (in this case, all in a positive direction).
The process of model modification towards improving the model fit is now
described. Throughout the model development process described in Sections 7.2
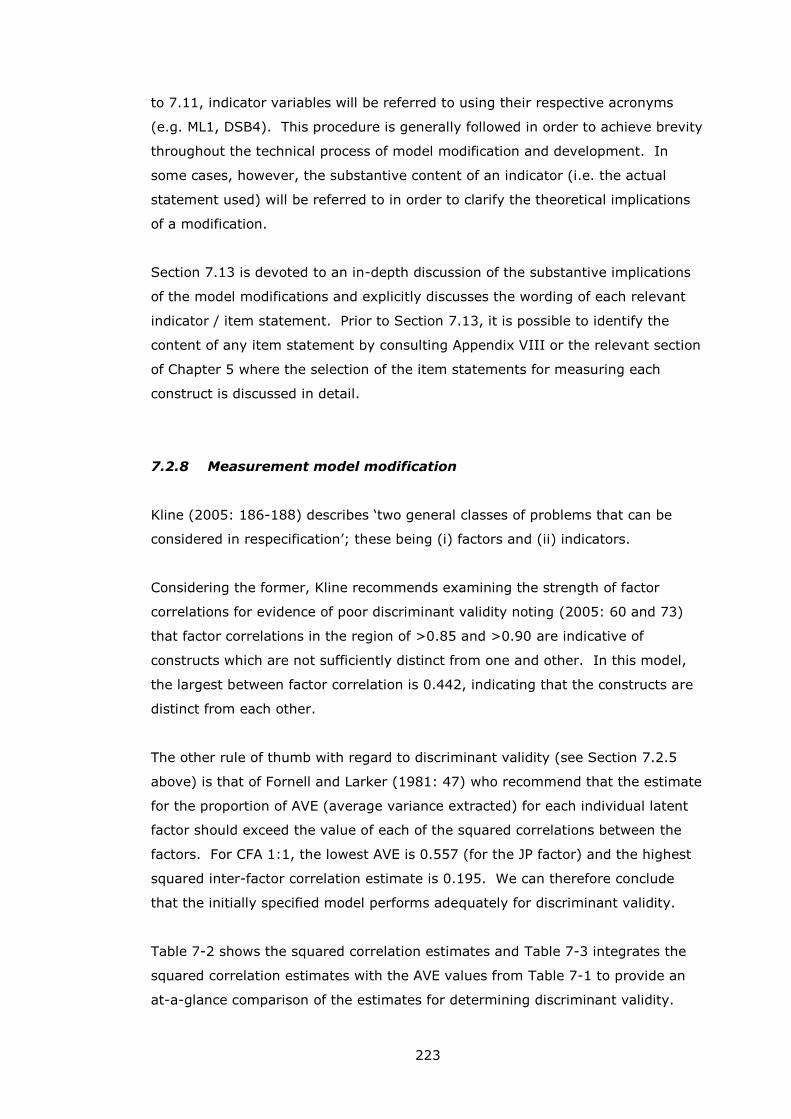
223
to 7.11, indicator variables will be referred to using their respective acronyms
(e.g. ML1, DSB4). This procedure is generally followed in order to achieve brevity
throughout the technical process of model modification and development. In
some cases, however, the substantive content of an indicator (i.e. the actual
statement used) will be referred to in order to clarify the theoretical implications
of a modification.
Section 7.13 is devoted to an in-depth discussion of the substantive implications
of the model modifications and explicitly discusses the wording of each relevant
indicator / item statement. Prior to Section 7.13, it is possible to identify the
content of any item statement by consulting Appendix VIII or the relevant section
of Chapter 5 where the selection of the item statements for measuring each
construct is discussed in detail.
7.2.8 Measurement model modification
Kline (2005: 186-188) describes ‘two general classes of problems that can be
considered in respecification’; these being (i) factors and (ii) indicators.
Considering the former, Kline recommends examining the strength of factor
correlations for evidence of poor discriminant validity noting (2005: 60 and 73)
that factor correlations in the region of >0.85 and >0.90 are indicative of
constructs which are not sufficiently distinct from one and other. In this model,
the largest between factor correlation is 0.442, indicating that the constructs are
distinct from each other.
The other rule of thumb with regard to discriminant validity (see Section 7.2.5
above) is that of Fornell and Larker (1981: 47) who recommend that the estimate
for the proportion of AVE (average variance extracted) for each individual latent
factor should exceed the value of each of the squared correlations between the
factors. For CFA 1:1, the lowest AVE is 0.557 (for the JP factor) and the highest
squared inter-factor correlation estimate is 0.195. We can therefore conclude
that the initially specified model performs adequately for discriminant validity.
Table 7-2 shows the squared correlation estimates and Table 7-3 integrates the
squared correlation estimates with the AVE values from Table 7-1 to provide an
at-a-glance comparison of the estimates for determining discriminant validity.
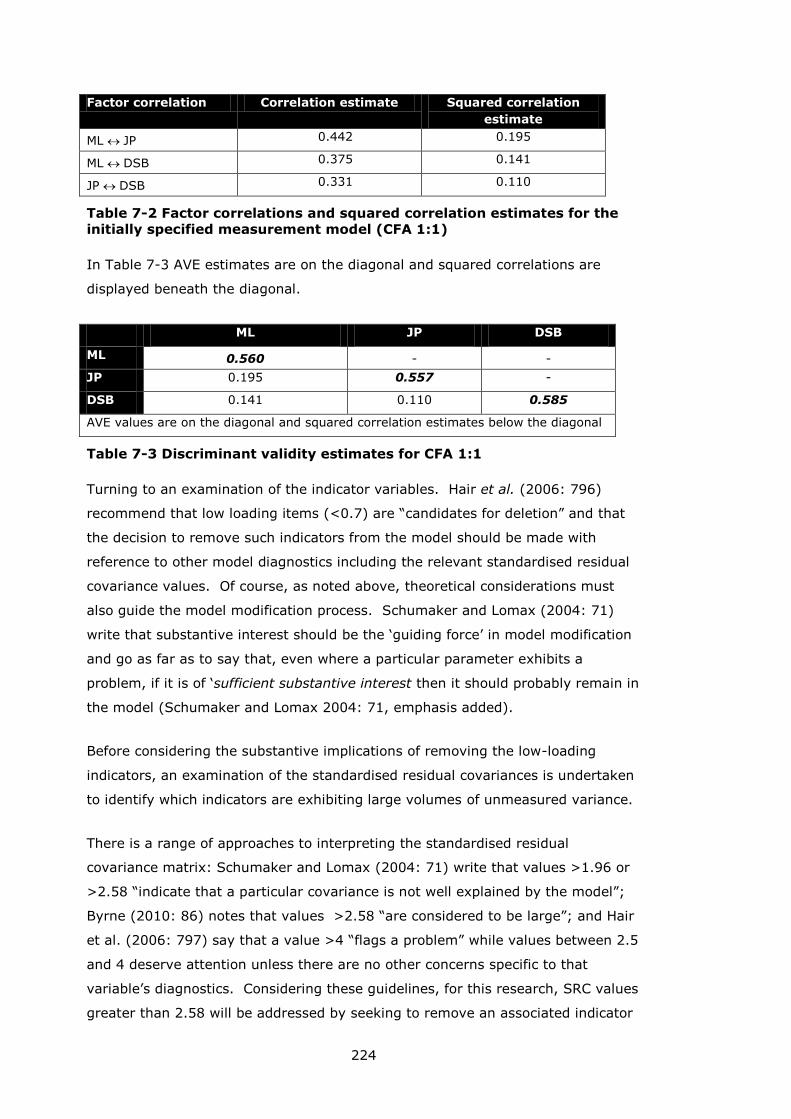
224
Factor correlation Correlation estimate Squared correlation
estimate
ML JP 0.442 0.195
ML DSB 0.375 0.141
JP DSB 0.331 0.110
Table 7-2 Factor correlations and squared correlation estimates for the
initially specified measurement model (CFA 1:1)
In Table 7-3 AVE estimates are on the diagonal and squared correlations are
displayed beneath the diagonal.
ML JP DSB
ML 0.560 - -
JP 0.195 0.557 -
DSB 0.141 0.110 0.585
AVE values are on the diagonal and squared correlation estimates below the diagonal
Table 7-3 Discriminant validity estimates for CFA 1:1
Turning to an examination of the indicator variables. Hair et al. (2006: 796)
recommend that low loading items (<0.7) are “candidates for deletion” and that
the decision to remove such indicators from the model should be made with
reference to other model diagnostics including the relevant standardised residual
covariance values. Of course, as noted above, theoretical considerations must
also guide the model modification process. Schumaker and Lomax (2004: 71)
write that substantive interest should be the ‘guiding force’ in model modification
and go as far as to say that, even where a particular parameter exhibits a
problem, if it is of ‘sufficient substantive interest then it should probably remain in
the model (Schumaker and Lomax 2004: 71, emphasis added).
Before considering the substantive implications of removing the low-loading
indicators, an examination of the standardised residual covariances is undertaken
to identify which indicators are exhibiting large volumes of unmeasured variance.
There is a range of approaches to interpreting the standardised residual
covariance matrix: Schumaker and Lomax (2004: 71) write that values >1.96 or
>2.58 “indicate that a particular covariance is not well explained by the model”;
Byrne (2010: 86) notes that values >2.58 “are considered to be large”; and Hair
et al. (2006: 797) say that a value >4 “flags a problem” while values between 2.5
and 4 deserve attention unless there are no other concerns specific to that
variable’s diagnostics. Considering these guidelines, for this research, SRC values
greater than 2.58 will be addressed by seeking to remove an associated indicator
225
variable but with due consideration for the substantive implications this may have
for the model.
Considering the four indicator variables in the initially specified model that have
been flagged for attention:
ML4 has a moderately low loading of 0.602 and two standardised residuals
>2.58 (at 3.295 and 3.264)
ML5 has moderately low loading of 0.606 and one standardised residual >2.58
(at 3.264)
JP3 has a moderately low loading of 0.556 and one standardised residual
>2.58 (at 2.605)
JP4 has a lower loading (0.494), one standardised residual >1.96 (at 2.359)
and two standardised residuals >2.58 (at 2.605 and 3.308)
o JP4’s very large standardised residual covariance (3.308) is shared with
DSB4 flagging DSB4 as a candidate for removal
Considering the substantive implications of removing these variables (this is, how
their removal affects the construct’s content validity, in other words, the meaning
of the construct). Both ML4 and ML5 were included somewhat speculatively (see
Section 5.2) and their removal from the construct will not affect the core
substantive content of the ML construct. ML4 relates to the recognition/feedback
dimension of Motivational Leadership and ML5 describes the leader putting the
group interests before their own. Removing these would leave three ‘core’ items
(ML1, 2 and 3) related to transformational leaders’ ‘vision→goal→effort’
behaviour. Removing ML4 and ML5, then, results in a very clear vision- / goal-
related ML construct that very closely reflects the central goal-setting, goal-
clarification and goal-encouragement dimensions of Motivational Leadership as
described by Avolio and Bass (2004a: 96) (see Section 2.4.3).
Secondly, considering JP3 and JP4. JP3 is related, substantively, to JP1 – both
relate to intensity of work (JP1 = Try to work harder; JP3 = Find that you have
done more than you expected to do). Therefore, if JP3 was removed from the
model, the substantive content of work intensity remains in the construct.
JP4, on the other hand, has an important substantive role to play in the wider
model. Considering the relationship between the Job Performance (JP) construct
and the Discretionary Service Behaviour (DSB) construct: DSB was designed (by
Blancero and Johnson 1997 and 2001) specifically for application in a services
context and all of its items explicitly relate extra effort to the customer service
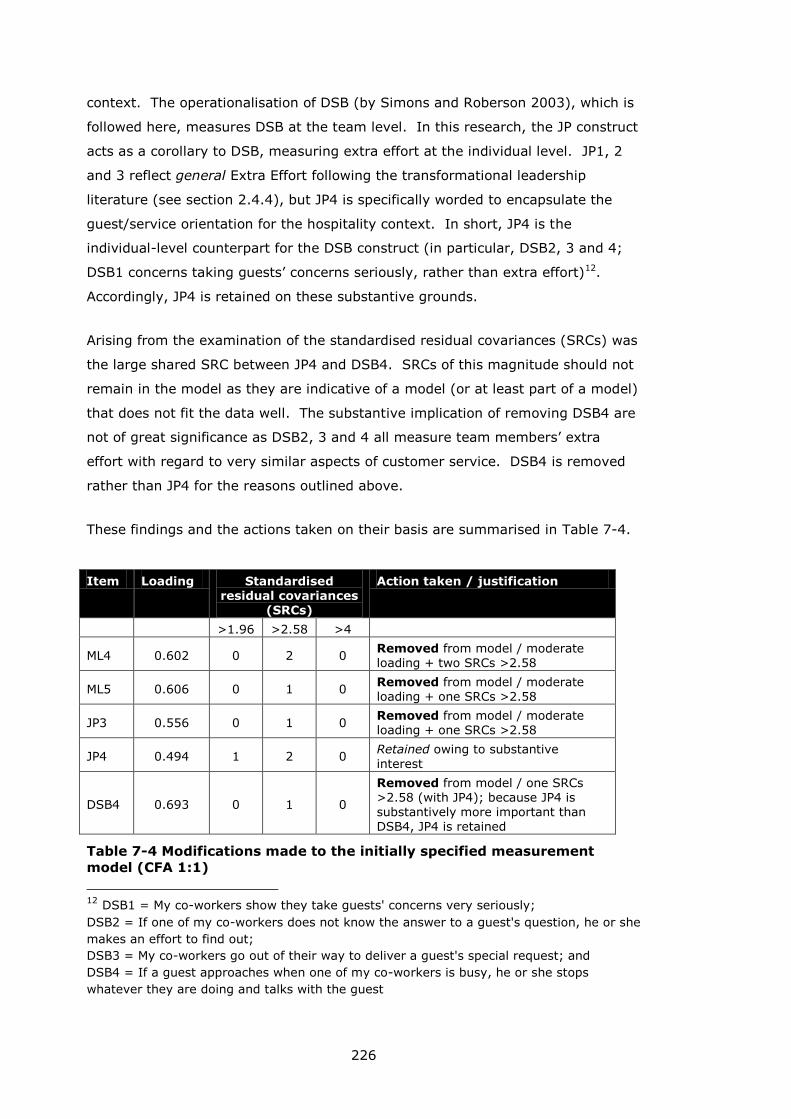
226
context. The operationalisation of DSB (by Simons and Roberson 2003), which is
followed here, measures DSB at the team level. In this research, the JP construct
acts as a corollary to DSB, measuring extra effort at the individual level. JP1, 2
and 3 reflect general Extra Effort following the transformational leadership
literature (see section 2.4.4), but JP4 is specifically worded to encapsulate the
guest/service orientation for the hospitality context. In short, JP4 is the
individual-level counterpart for the DSB construct (in particular, DSB2, 3 and 4;
DSB1 concerns taking guests’ concerns seriously, rather than extra effort)12.
Accordingly, JP4 is retained on these substantive grounds.
Arising from the examination of the standardised residual covariances (SRCs) was
the large shared SRC between JP4 and DSB4. SRCs of this magnitude should not
remain in the model as they are indicative of a model (or at least part of a model)
that does not fit the data well. The substantive implication of removing DSB4 are
not of great significance as DSB2, 3 and 4 all measure team members’ extra
effort with regard to very similar aspects of customer service. DSB4 is removed
rather than JP4 for the reasons outlined above.
These findings and the actions taken on their basis are summarised in Table 7-4.
Item Loading Standardised residual covariances
(SRCs)
Action taken / justification
>1.96 >2.58 >4
ML4 0.602 0 2 0 Removed from model / moderate loading + two SRCs >2.58
ML5 0.606 0 1 0 Removed from model / moderate loading + one SRCs >2.58
JP3 0.556 0 1 0 Removed from model / moderate loading + one SRCs >2.58
JP4 0.494 1 2 0 Retained owing to substantive
interest
DSB4 0.693 0 1 0
Removed from model / one SRCs >2.58 (with JP4); because JP4 is substantively more important than DSB4, JP4 is retained
Table 7-4 Modifications made to the initially specified measurement
model (CFA 1:1)
12 DSB1 = My co-workers show they take guests' concerns very seriously;
DSB2 = If one of my co-workers does not know the answer to a guest's question, he or she
makes an effort to find out;
DSB3 = My co-workers go out of their way to deliver a guest's special request; and
DSB4 = If a guest approaches when one of my co-workers is busy, he or she stops
whatever they are doing and talks with the guest
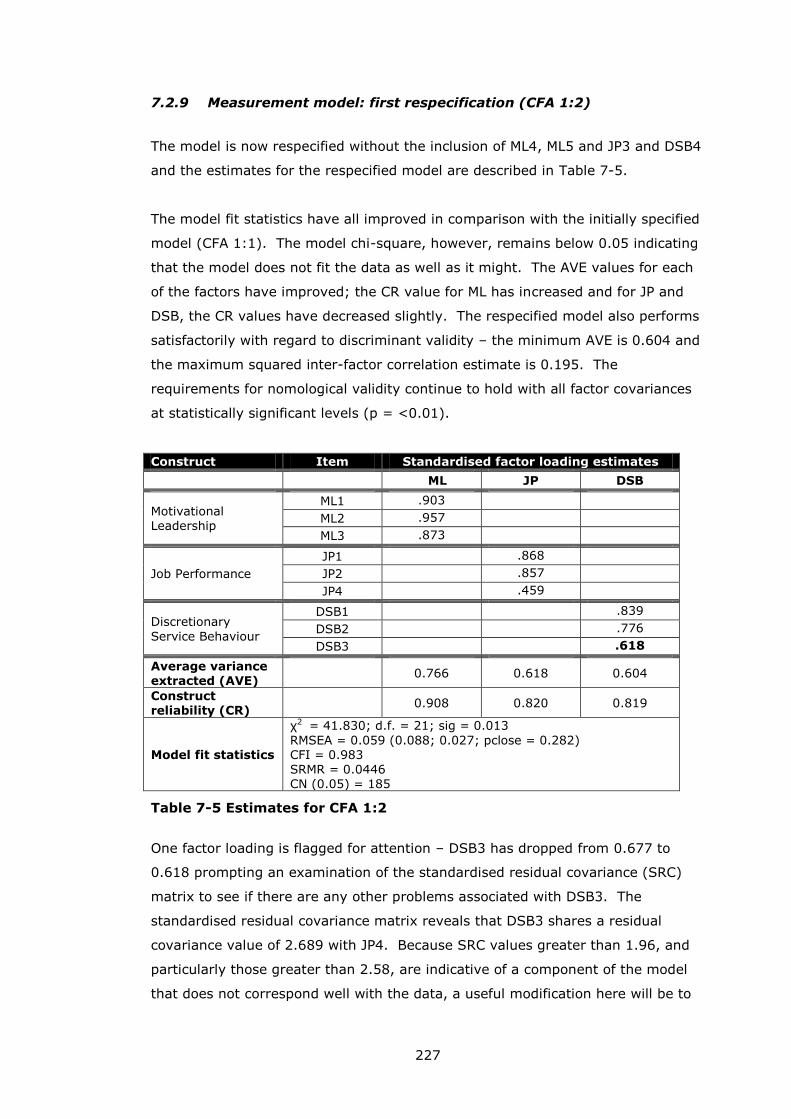
227
7.2.9 Measurement model: first respecification (CFA 1:2)
The model is now respecified without the inclusion of ML4, ML5 and JP3 and DSB4
and the estimates for the respecified model are described in Table 7-5.
The model fit statistics have all improved in comparison with the initially specified
model (CFA 1:1). The model chi-square, however, remains below 0.05 indicating
that the model does not fit the data as well as it might. The AVE values for each
of the factors have improved; the CR value for ML has increased and for JP and
DSB, the CR values have decreased slightly. The respecified model also performs
satisfactorily with regard to discriminant validity – the minimum AVE is 0.604 and
the maximum squared inter-factor correlation estimate is 0.195. The
requirements for nomological validity continue to hold with all factor covariances
at statistically significant levels (p = <0.01).
Construct Item Standardised factor loading estimates
ML JP DSB
Motivational Leadership
ML1 .903
ML2 .957
ML3 .873
Job Performance
JP1 .868
JP2 .857
JP4 .459
Discretionary
Service Behaviour
DSB1 .839
DSB2 .776
DSB3 .618
Average variance extracted (AVE)
0.766 0.618 0.604
Construct reliability (CR)
0.908 0.820 0.819
Model fit statistics
χ2 = 41.830; d.f. = 21; sig = 0.013
RMSEA = 0.059 (0.088; 0.027; pclose = 0.282) CFI = 0.983
SRMR = 0.0446 CN (0.05) = 185
Table 7-5 Estimates for CFA 1:2
One factor loading is flagged for attention – DSB3 has dropped from 0.677 to
0.618 prompting an examination of the standardised residual covariance (SRC)
matrix to see if there are any other problems associated with DSB3. The
standardised residual covariance matrix reveals that DSB3 shares a residual
covariance value of 2.689 with JP4. Because SRC values greater than 1.96, and
particularly those greater than 2.58, are indicative of a component of the model
that does not correspond well with the data, a useful modification here will be to
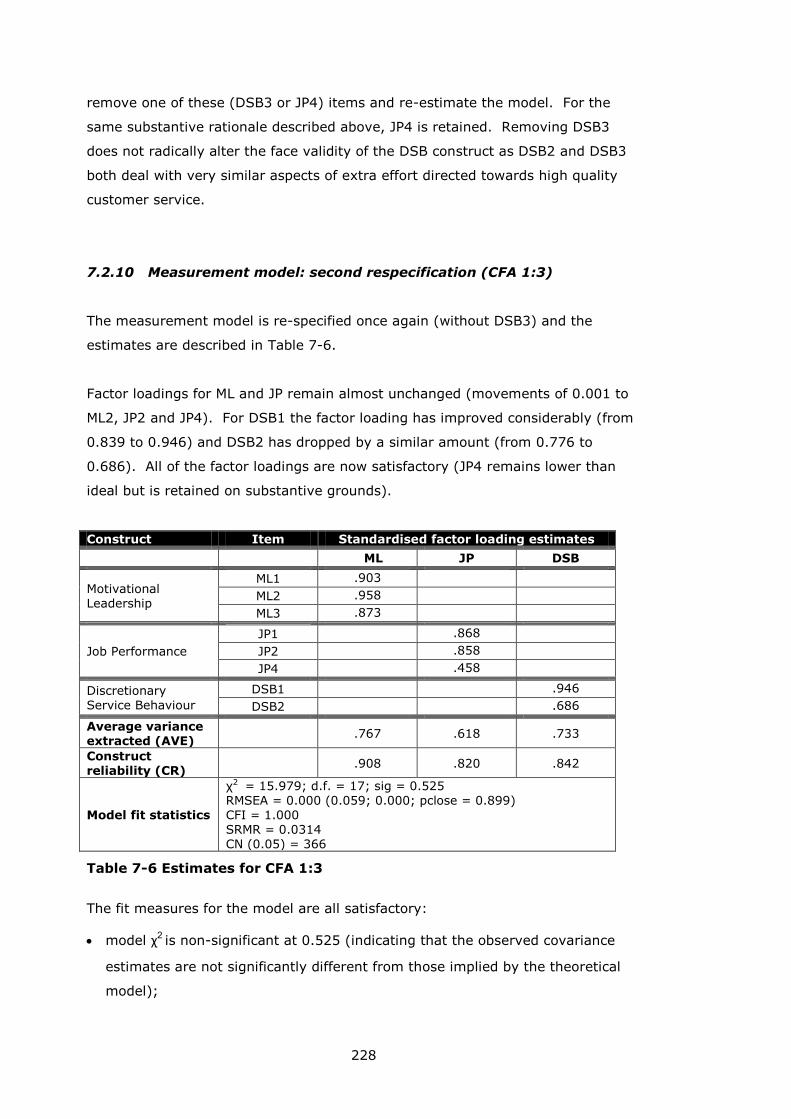
228
remove one of these (DSB3 or JP4) items and re-estimate the model. For the
same substantive rationale described above, JP4 is retained. Removing DSB3
does not radically alter the face validity of the DSB construct as DSB2 and DSB3
both deal with very similar aspects of extra effort directed towards high quality
customer service.
7.2.10 Measurement model: second respecification (CFA 1:3)
The measurement model is re-specified once again (without DSB3) and the
estimates are described in Table 7-6.
Factor loadings for ML and JP remain almost unchanged (movements of 0.001 to
ML2, JP2 and JP4). For DSB1 the factor loading has improved considerably (from
0.839 to 0.946) and DSB2 has dropped by a similar amount (from 0.776 to
0.686). All of the factor loadings are now satisfactory (JP4 remains lower than
ideal but is retained on substantive grounds).
Construct Item Standardised factor loading estimates
ML JP DSB
Motivational Leadership
ML1 .903
ML2 .958
ML3 .873
Job Performance
JP1 .868
JP2 .858
JP4 .458
Discretionary Service Behaviour
DSB1 .946
DSB2 .686
Average variance extracted (AVE)
.767 .618 .733
Construct reliability (CR)
.908 .820 .842
Model fit statistics
χ2 = 15.979; d.f. = 17; sig = 0.525 RMSEA = 0.000 (0.059; 0.000; pclose = 0.899) CFI = 1.000 SRMR = 0.0314 CN (0.05) = 366
Table 7-6 Estimates for CFA 1:3
The fit measures for the model are all satisfactory:
model χ2 is non-significant at 0.525 (indicating that the observed covariance
estimates are not significantly different from those implied by the theoretical
model);
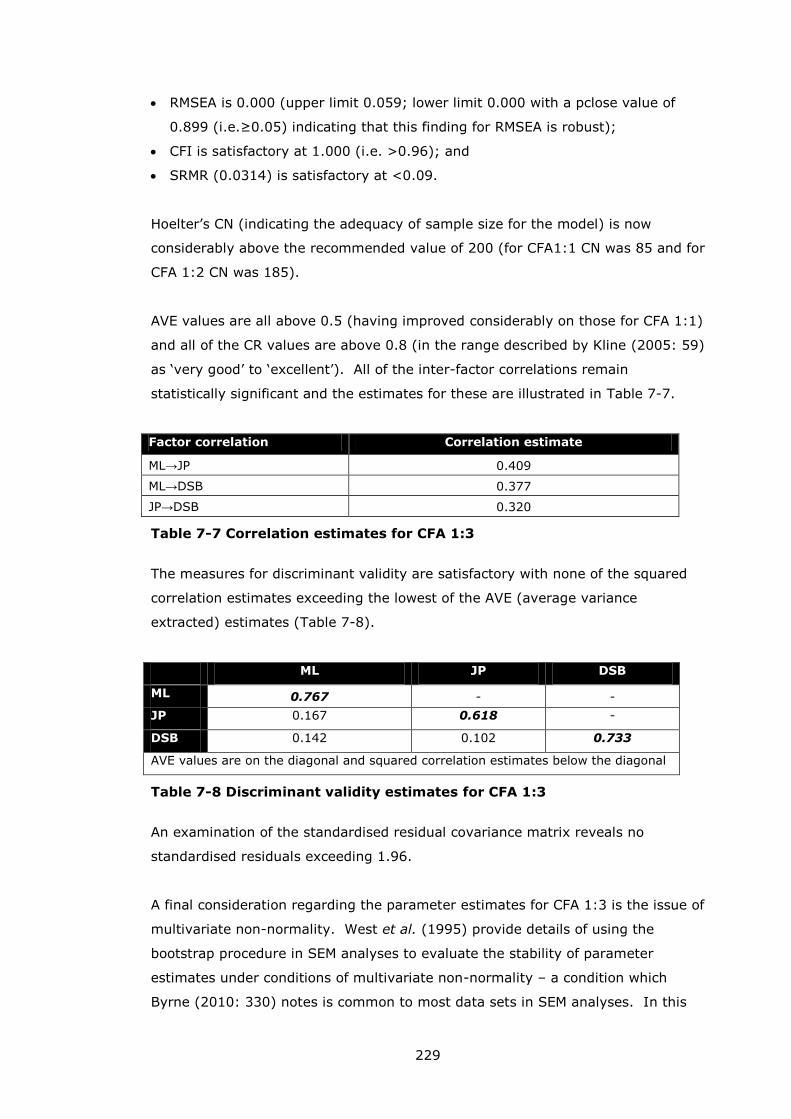
229
RMSEA is 0.000 (upper limit 0.059; lower limit 0.000 with a pclose value of
0.899 (i.e.≥0.05) indicating that this finding for RMSEA is robust);
CFI is satisfactory at 1.000 (i.e. >0.96); and
SRMR (0.0314) is satisfactory at <0.09.
Hoelter’s CN (indicating the adequacy of sample size for the model) is now
considerably above the recommended value of 200 (for CFA1:1 CN was 85 and for
CFA 1:2 CN was 185).
AVE values are all above 0.5 (having improved considerably on those for CFA 1:1)
and all of the CR values are above 0.8 (in the range described by Kline (2005: 59)
as ‘very good’ to ‘excellent’). All of the inter-factor correlations remain
statistically significant and the estimates for these are illustrated in Table 7-7.
Factor correlation Correlation estimate
ML→JP 0.409
ML→DSB 0.377
JP→DSB 0.320
Table 7-7 Correlation estimates for CFA 1:3
The measures for discriminant validity are satisfactory with none of the squared
correlation estimates exceeding the lowest of the AVE (average variance
extracted) estimates (Table 7-8).
ML JP DSB
ML 0.767 - -
JP 0.167 0.618 -
DSB 0.142 0.102 0.733
AVE values are on the diagonal and squared correlation estimates below the diagonal
Table 7-8 Discriminant validity estimates for CFA 1:3
An examination of the standardised residual covariance matrix reveals no
standardised residuals exceeding 1.96.
A final consideration regarding the parameter estimates for CFA 1:3 is the issue of
multivariate non-normality. West et al. (1995) provide details of using the
bootstrap procedure in SEM analyses to evaluate the stability of parameter
estimates under conditions of multivariate non-normality – a condition which
Byrne (2010: 330) notes is common to most data sets in SEM analyses. In this
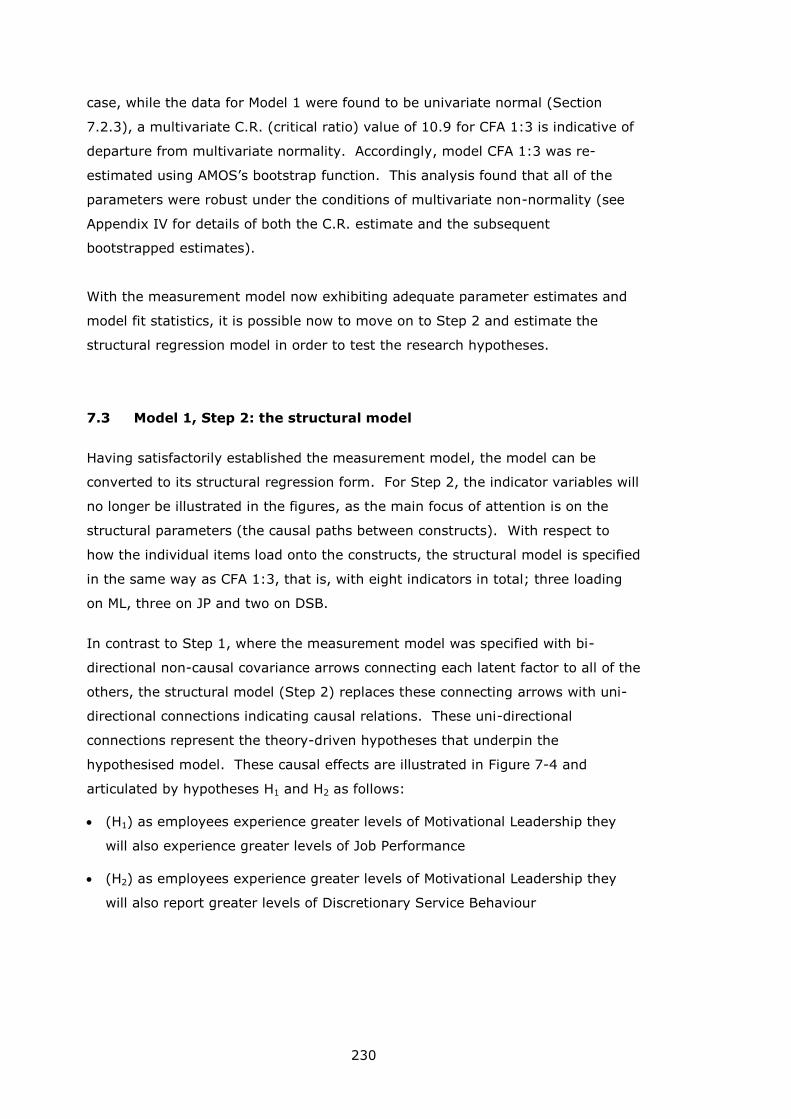
230
case, while the data for Model 1 were found to be univariate normal (Section
7.2.3), a multivariate C.R. (critical ratio) value of 10.9 for CFA 1:3 is indicative of
departure from multivariate normality. Accordingly, model CFA 1:3 was re-
estimated using AMOS’s bootstrap function. This analysis found that all of the
parameters were robust under the conditions of multivariate non-normality (see
Appendix IV for details of both the C.R. estimate and the subsequent
bootstrapped estimates).
With the measurement model now exhibiting adequate parameter estimates and
model fit statistics, it is possible now to move on to Step 2 and estimate the
structural regression model in order to test the research hypotheses.
7.3 Model 1, Step 2: the structural model
Having satisfactorily established the measurement model, the model can be
converted to its structural regression form. For Step 2, the indicator variables will
no longer be illustrated in the figures, as the main focus of attention is on the
structural parameters (the causal paths between constructs). With respect to
how the individual items load onto the constructs, the structural model is specified
in the same way as CFA 1:3, that is, with eight indicators in total; three loading
on ML, three on JP and two on DSB.
In contrast to Step 1, where the measurement model was specified with bi-
directional non-causal covariance arrows connecting each latent factor to all of the
others, the structural model (Step 2) replaces these connecting arrows with uni-
directional connections indicating causal relations. These uni-directional
connections represent the theory-driven hypotheses that underpin the
hypothesised model. These causal effects are illustrated in Figure 7-4 and
articulated by hypotheses H1 and H2 as follows:
(H1) as employees experience greater levels of Motivational Leadership they
will also experience greater levels of Job Performance
(H2) as employees experience greater levels of Motivational Leadership they
will also report greater levels of Discretionary Service Behaviour
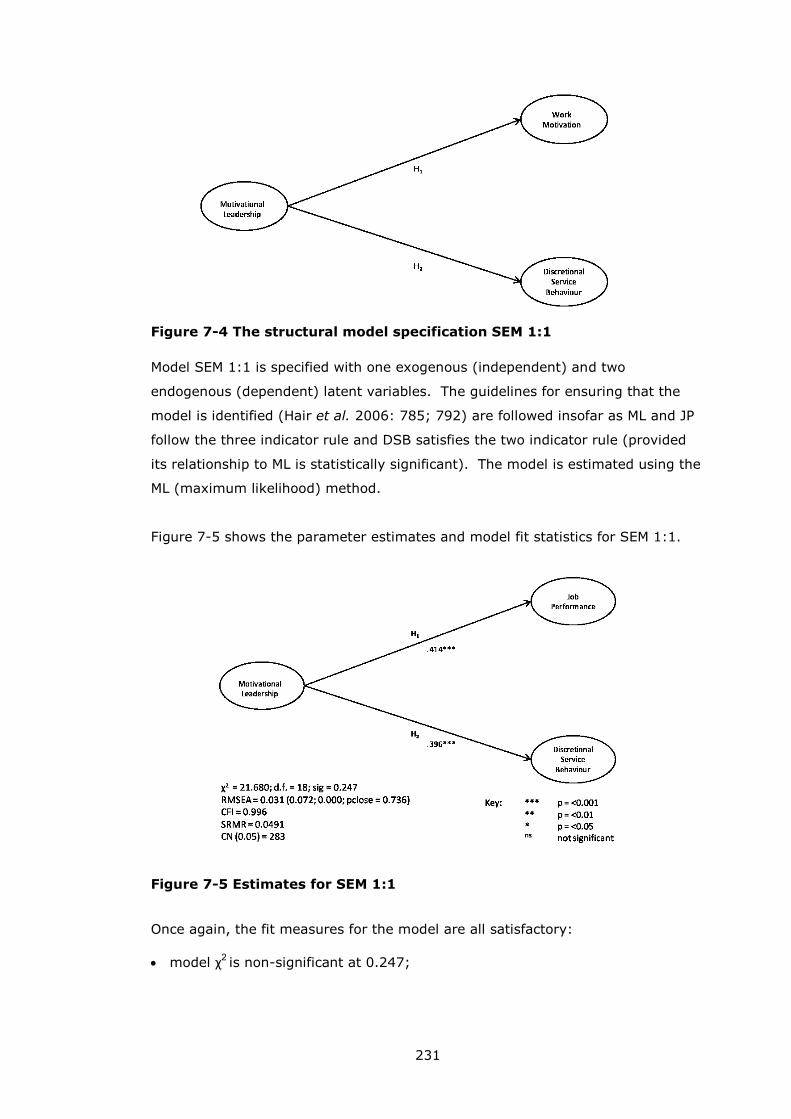
231
Figure 7-4 The structural model specification SEM 1:1
Model SEM 1:1 is specified with one exogenous (independent) and two
endogenous (dependent) latent variables. The guidelines for ensuring that the
model is identified (Hair et al. 2006: 785; 792) are followed insofar as ML and JP
follow the three indicator rule and DSB satisfies the two indicator rule (provided
its relationship to ML is statistically significant). The model is estimated using the
ML (maximum likelihood) method.
Figure 7-5 shows the parameter estimates and model fit statistics for SEM 1:1.
Figure 7-5 Estimates for SEM 1:1
Once again, the fit measures for the model are all satisfactory:
model χ2 is non-significant at 0.247;
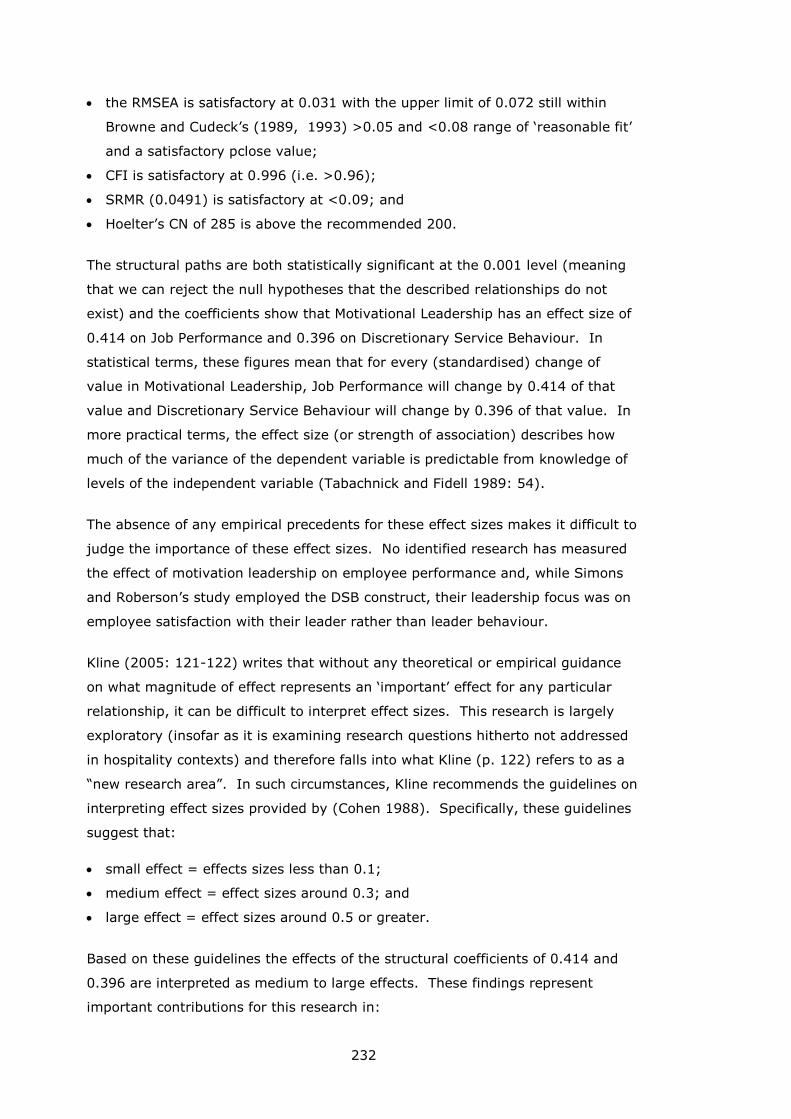
232
the RMSEA is satisfactory at 0.031 with the upper limit of 0.072 still within
Browne and Cudeck’s (1989, 1993) >0.05 and <0.08 range of ‘reasonable fit’
and a satisfactory pclose value;
CFI is satisfactory at 0.996 (i.e. >0.96);
SRMR (0.0491) is satisfactory at <0.09; and
Hoelter’s CN of 285 is above the recommended 200.
The structural paths are both statistically significant at the 0.001 level (meaning
that we can reject the null hypotheses that the described relationships do not
exist) and the coefficients show that Motivational Leadership has an effect size of
0.414 on Job Performance and 0.396 on Discretionary Service Behaviour. In
statistical terms, these figures mean that for every (standardised) change of
value in Motivational Leadership, Job Performance will change by 0.414 of that
value and Discretionary Service Behaviour will change by 0.396 of that value. In
more practical terms, the effect size (or strength of association) describes how
much of the variance of the dependent variable is predictable from knowledge of
levels of the independent variable (Tabachnick and Fidell 1989: 54).
The absence of any empirical precedents for these effect sizes makes it difficult to
judge the importance of these effect sizes. No identified research has measured
the effect of motivation leadership on employee performance and, while Simons
and Roberson’s study employed the DSB construct, their leadership focus was on
employee satisfaction with their leader rather than leader behaviour.
Kline (2005: 121-122) writes that without any theoretical or empirical guidance
on what magnitude of effect represents an ‘important’ effect for any particular
relationship, it can be difficult to interpret effect sizes. This research is largely
exploratory (insofar as it is examining research questions hitherto not addressed
in hospitality contexts) and therefore falls into what Kline (p. 122) refers to as a
“new research area”. In such circumstances, Kline recommends the guidelines on
interpreting effect sizes provided by (Cohen 1988). Specifically, these guidelines
suggest that:
small effect = effects sizes less than 0.1;
medium effect = effect sizes around 0.3; and
large effect = effect sizes around 0.5 or greater.
Based on these guidelines the effects of the structural coefficients of 0.414 and
0.396 are interpreted as medium to large effects. These findings represent
important contributions for this research in:
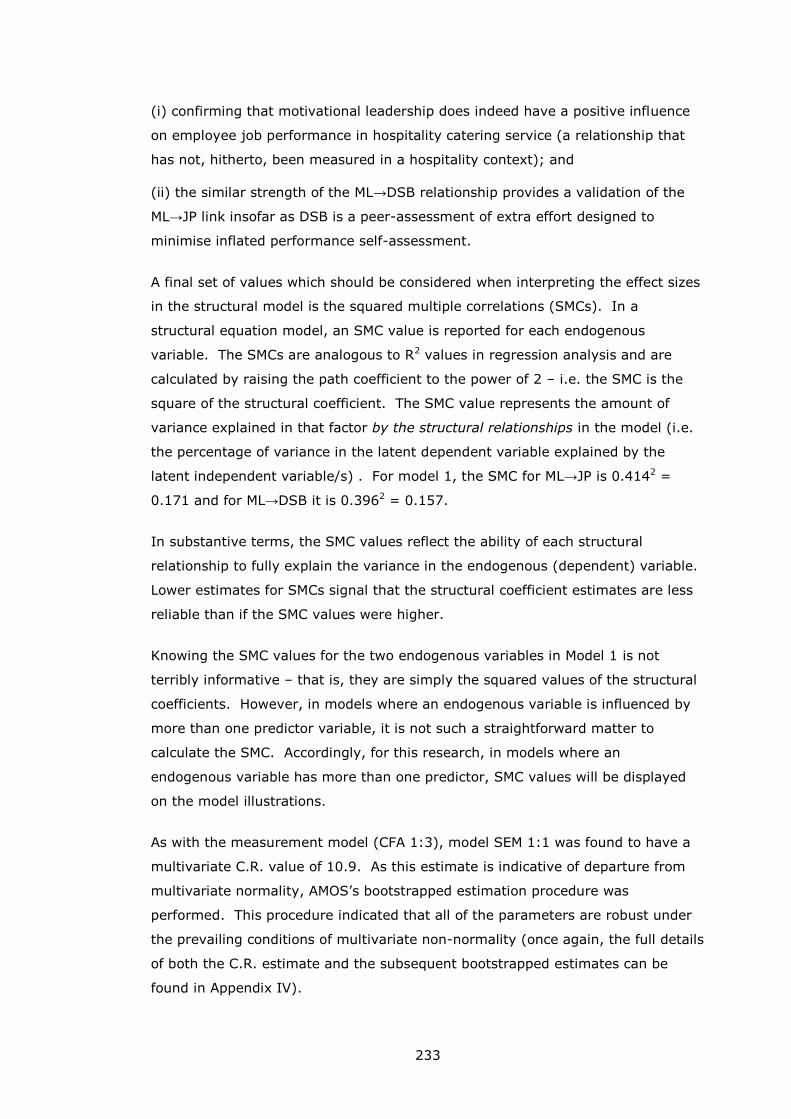
233
(i) confirming that motivational leadership does indeed have a positive influence
on employee job performance in hospitality catering service (a relationship that
has not, hitherto, been measured in a hospitality context); and
(ii) the similar strength of the ML→DSB relationship provides a validation of the
ML→JP link insofar as DSB is a peer-assessment of extra effort designed to
minimise inflated performance self-assessment.
A final set of values which should be considered when interpreting the effect sizes
in the structural model is the squared multiple correlations (SMCs). In a
structural equation model, an SMC value is reported for each endogenous
variable. The SMCs are analogous to R2 values in regression analysis and are
calculated by raising the path coefficient to the power of 2 – i.e. the SMC is the
square of the structural coefficient. The SMC value represents the amount of
variance explained in that factor by the structural relationships in the model (i.e.
the percentage of variance in the latent dependent variable explained by the
latent independent variable/s) . For model 1, the SMC for ML→JP is 0.4142 =
0.171 and for ML→DSB it is 0.3962 = 0.157.
In substantive terms, the SMC values reflect the ability of each structural
relationship to fully explain the variance in the endogenous (dependent) variable.
Lower estimates for SMCs signal that the structural coefficient estimates are less
reliable than if the SMC values were higher.
Knowing the SMC values for the two endogenous variables in Model 1 is not
terribly informative – that is, they are simply the squared values of the structural
coefficients. However, in models where an endogenous variable is influenced by
more than one predictor variable, it is not such a straightforward matter to
calculate the SMC. Accordingly, for this research, in models where an
endogenous variable has more than one predictor, SMC values will be displayed
on the model illustrations.
As with the measurement model (CFA 1:3), model SEM 1:1 was found to have a
multivariate C.R. value of 10.9. As this estimate is indicative of departure from
multivariate normality, AMOS’s bootstrapped estimation procedure was
performed. This procedure indicated that all of the parameters are robust under
the prevailing conditions of multivariate non-normality (once again, the full details
of both the C.R. estimate and the subsequent bootstrapped estimates can be
found in Appendix IV).
234
7.4 Model 2
Model 2 (Figure 7-6) builds upon Model 1 by introducing Work Meaning (ME) as
mediator variable between Motivational Leadership (ML) and Job Performance
(JP). Work Meaning is an endogenous variable (being a dependent of ML) that
has a dual role insofar as it is also a predictor of JP. In structural models, dual-
role mediator variables such as ME are hypothesised to “transmit some of the
causal effects of prior variables onto subsequent variables” (Kline 2005: 68).
Following the estimation and testing of the structural model, any such mediation
effect will be tested rigorously to establish (a) whether or not it is observed in the
model and, if it is observed, whether the mediation effect is full or partial.
In addition to H1 and H2, Model 2 tests hypotheses H3 and H4 which are articulated
as follows:
H3 (ML→ME): as employees experience greater levels of Motivational Leadership
they will also experience greater levels of Work Meaning
H4 (ME→JP): as employees experience greater levels of Work Meaning they will
also experience greater levels of Job Performance
Figure 7-6 Structural specification for Model 2
Work Meaning is introduced into the model building process independently of the
other two Employee Attitude factors (Job Satisfaction and Affective Organisational
Commitment) because of its core theoretical role in the research. Specifically,
Work Meaning is posited in the transformational leadership literature as a key
outcome of motivational leadership; accordingly, it was deemed important that its
relationships with Motivational Leadership and Job Performance are evaluated in
the absence of the potentially confounding related attitudinal variables, Job
Satisfaction and Affective Organisational Commitment.
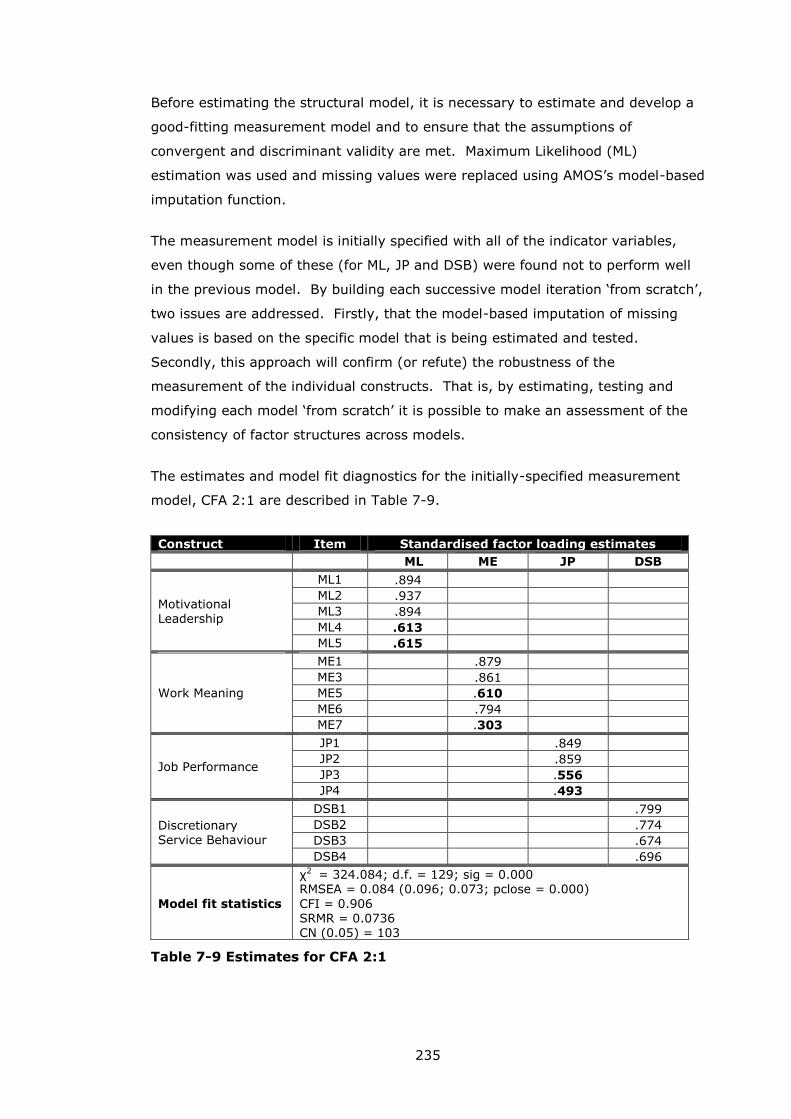
235
Before estimating the structural model, it is necessary to estimate and develop a
good-fitting measurement model and to ensure that the assumptions of
convergent and discriminant validity are met. Maximum Likelihood (ML)
estimation was used and missing values were replaced using AMOS’s model-based
imputation function.
The measurement model is initially specified with all of the indicator variables,
even though some of these (for ML, JP and DSB) were found not to perform well
in the previous model. By building each successive model iteration ‘from scratch’,
two issues are addressed. Firstly, that the model-based imputation of missing
values is based on the specific model that is being estimated and tested.
Secondly, this approach will confirm (or refute) the robustness of the
measurement of the individual constructs. That is, by estimating, testing and
modifying each model ‘from scratch’ it is possible to make an assessment of the
consistency of factor structures across models.
The estimates and model fit diagnostics for the initially-specified measurement
model, CFA 2:1 are described in Table 7-9.
Construct Item Standardised factor loading estimates
ML ME JP DSB
Motivational Leadership
ML1 .894
ML2 .937
ML3 .894
ML4 .613
ML5 .615
Work Meaning
ME1
.879
ME3
.861
ME5
.610
ME6
.794
ME7
.303
Job Performance
JP1
.849
JP2
.859
JP3
.556
JP4
.493
Discretionary Service Behaviour
DSB1
.799
DSB2
.774
DSB3
.674
DSB4
.696
Model fit statistics
χ2 = 324.084; d.f. = 129; sig = 0.000 RMSEA = 0.084 (0.096; 0.073; pclose = 0.000)
CFI = 0.906 SRMR = 0.0736 CN (0.05) = 103
Table 7-9 Estimates for CFA 2:1
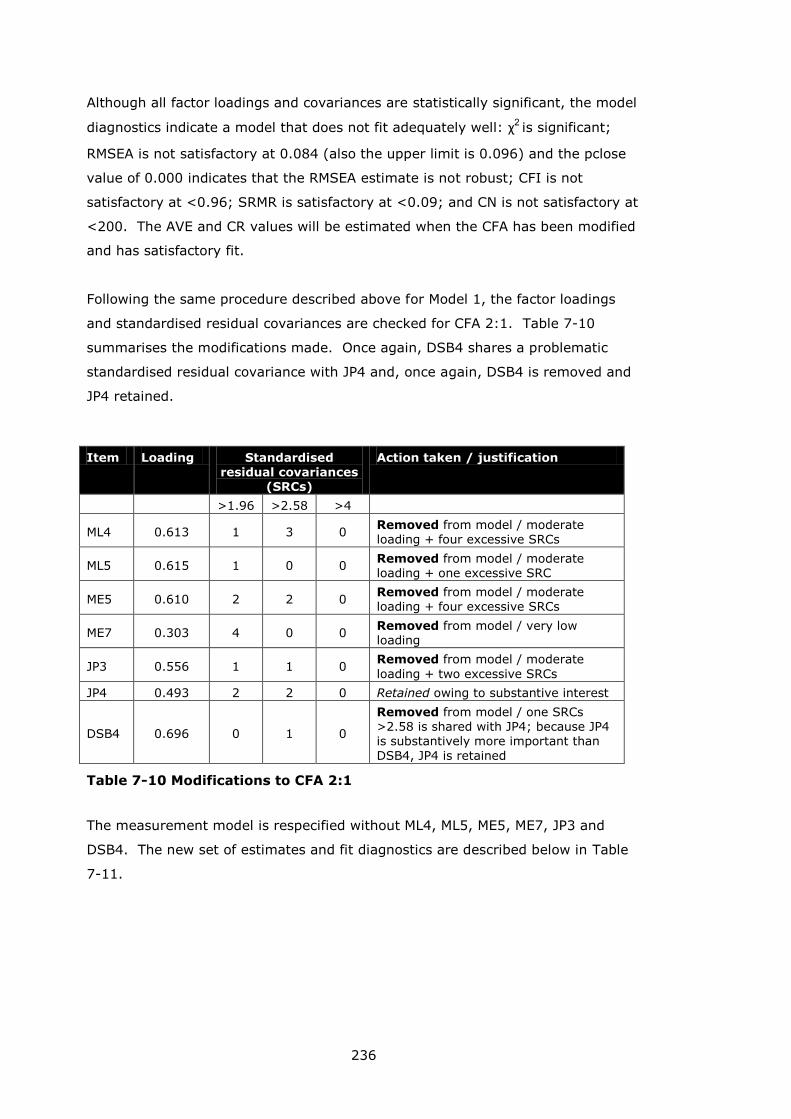
236
Although all factor loadings and covariances are statistically significant, the model
diagnostics indicate a model that does not fit adequately well: χ2 is significant;
RMSEA is not satisfactory at 0.084 (also the upper limit is 0.096) and the pclose
value of 0.000 indicates that the RMSEA estimate is not robust; CFI is not
satisfactory at <0.96; SRMR is satisfactory at <0.09; and CN is not satisfactory at
<200. The AVE and CR values will be estimated when the CFA has been modified
and has satisfactory fit.
Following the same procedure described above for Model 1, the factor loadings
and standardised residual covariances are checked for CFA 2:1. Table 7-10
summarises the modifications made. Once again, DSB4 shares a problematic
standardised residual covariance with JP4 and, once again, DSB4 is removed and
JP4 retained.
Item Loading Standardised residual covariances
(SRCs)
Action taken / justification
>1.96 >2.58 >4
ML4 0.613 1 3 0 Removed from model / moderate
loading + four excessive SRCs
ML5 0.615 1 0 0 Removed from model / moderate loading + one excessive SRC
ME5 0.610 2 2 0 Removed from model / moderate loading + four excessive SRCs
ME7 0.303 4 0 0 Removed from model / very low loading
JP3 0.556 1 1 0 Removed from model / moderate
loading + two excessive SRCs
JP4 0.493 2 2 0 Retained owing to substantive interest
DSB4 0.696 0 1 0
Removed from model / one SRCs >2.58 is shared with JP4; because JP4 is substantively more important than
DSB4, JP4 is retained
Table 7-10 Modifications to CFA 2:1
The measurement model is respecified without ML4, ML5, ME5, ME7, JP3 and
DSB4. The new set of estimates and fit diagnostics are described below in Table
7-11.
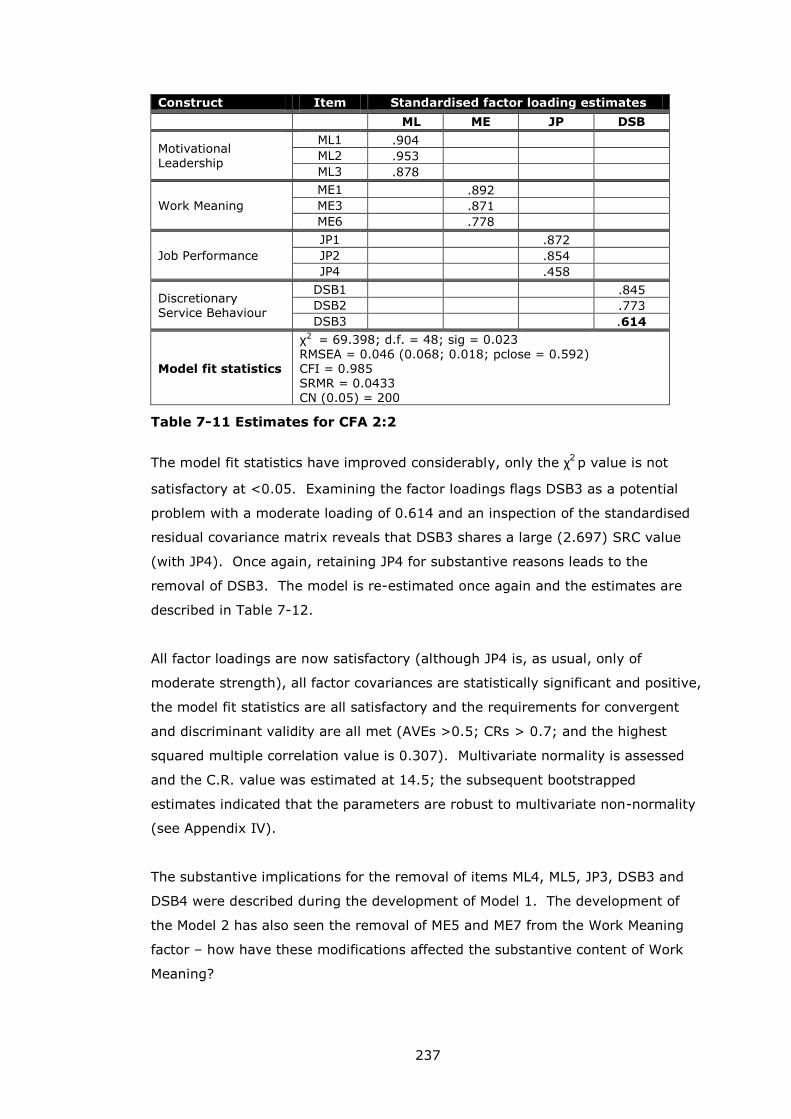
237
Construct Item Standardised factor loading estimates
ML ME JP DSB
Motivational Leadership
ML1 .904
ML2 .953
ML3 .878
Work Meaning
ME1
.892
ME3
.871
ME6
.778
Job Performance
JP1
.872
JP2
.854
JP4
.458
Discretionary Service Behaviour
DSB1
.845
DSB2
.773
DSB3
.614
Model fit statistics
χ2 = 69.398; d.f. = 48; sig = 0.023 RMSEA = 0.046 (0.068; 0.018; pclose = 0.592) CFI = 0.985 SRMR = 0.0433 CN (0.05) = 200
Table 7-11 Estimates for CFA 2:2
The model fit statistics have improved considerably, only the χ2 p value is not
satisfactory at <0.05. Examining the factor loadings flags DSB3 as a potential
problem with a moderate loading of 0.614 and an inspection of the standardised
residual covariance matrix reveals that DSB3 shares a large (2.697) SRC value
(with JP4). Once again, retaining JP4 for substantive reasons leads to the
removal of DSB3. The model is re-estimated once again and the estimates are
described in Table 7-12.
All factor loadings are now satisfactory (although JP4 is, as usual, only of
moderate strength), all factor covariances are statistically significant and positive,
the model fit statistics are all satisfactory and the requirements for convergent
and discriminant validity are all met (AVEs >0.5; CRs > 0.7; and the highest
squared multiple correlation value is 0.307). Multivariate normality is assessed
and the C.R. value was estimated at 14.5; the subsequent bootstrapped
estimates indicated that the parameters are robust to multivariate non-normality
(see Appendix IV).
The substantive implications for the removal of items ML4, ML5, JP3, DSB3 and
DSB4 were described during the development of Model 1. The development of
the Model 2 has also seen the removal of ME5 and ME7 from the Work Meaning
factor – how have these modifications affected the substantive content of Work
Meaning?
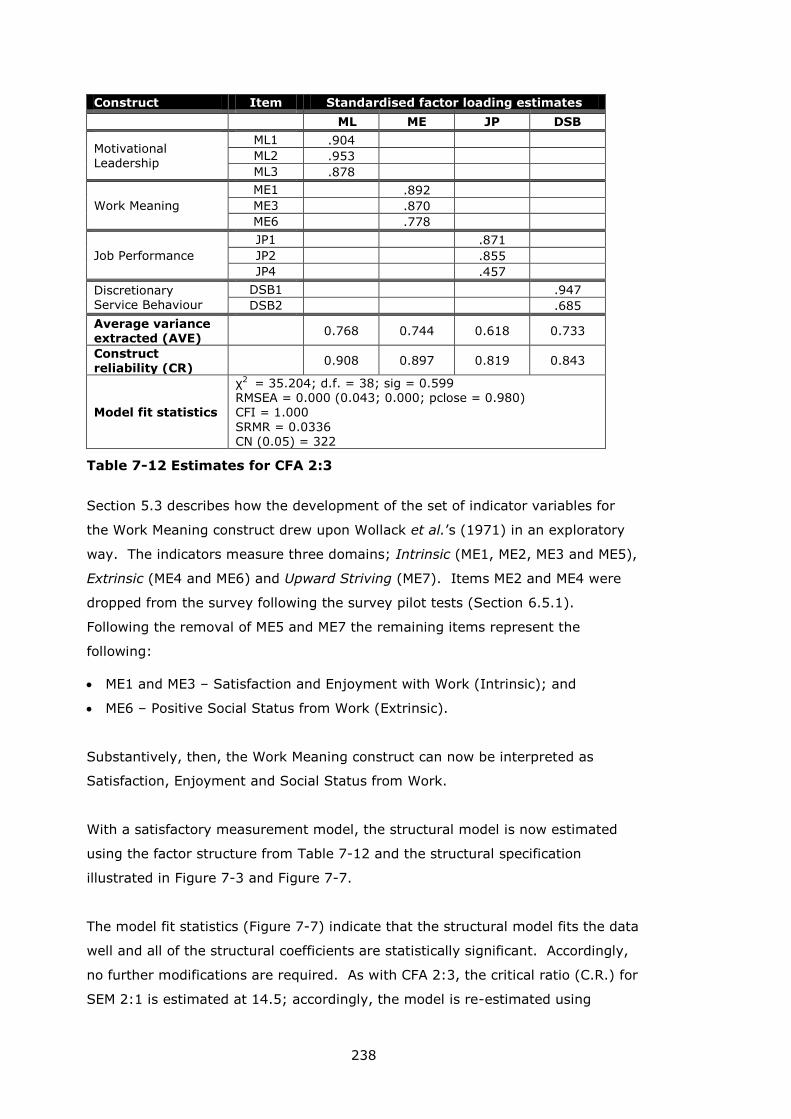
238
Construct Item Standardised factor loading estimates
ML ME JP DSB
Motivational Leadership
ML1 .904
ML2 .953
ML3 .878
Work Meaning
ME1
.892
ME3
.870
ME6
.778
Job Performance
JP1
.871
JP2
.855
JP4
.457
Discretionary Service Behaviour
DSB1
.947
DSB2
.685
Average variance extracted (AVE)
0.768 0.744 0.618 0.733
Construct reliability (CR)
0.908 0.897 0.819 0.843
Model fit statistics
χ2 = 35.204; d.f. = 38; sig = 0.599 RMSEA = 0.000 (0.043; 0.000; pclose = 0.980) CFI = 1.000
SRMR = 0.0336 CN (0.05) = 322
Table 7-12 Estimates for CFA 2:3
Section 5.3 describes how the development of the set of indicator variables for
the Work Meaning construct drew upon Wollack et al.’s (1971) in an exploratory
way. The indicators measure three domains; Intrinsic (ME1, ME2, ME3 and ME5),
Extrinsic (ME4 and ME6) and Upward Striving (ME7). Items ME2 and ME4 were
dropped from the survey following the survey pilot tests (Section 6.5.1).
Following the removal of ME5 and ME7 the remaining items represent the
following:
ME1 and ME3 – Satisfaction and Enjoyment with Work (Intrinsic); and
ME6 – Positive Social Status from Work (Extrinsic).
Substantively, then, the Work Meaning construct can now be interpreted as
Satisfaction, Enjoyment and Social Status from Work.
With a satisfactory measurement model, the structural model is now estimated
using the factor structure from Table 7-12 and the structural specification
illustrated in Figure 7-3 and Figure 7-7.
The model fit statistics (Figure 7-7) indicate that the structural model fits the data
well and all of the structural coefficients are statistically significant. Accordingly,
no further modifications are required. As with CFA 2:3, the critical ratio (C.R.) for
SEM 2:1 is estimated at 14.5; accordingly, the model is re-estimated using
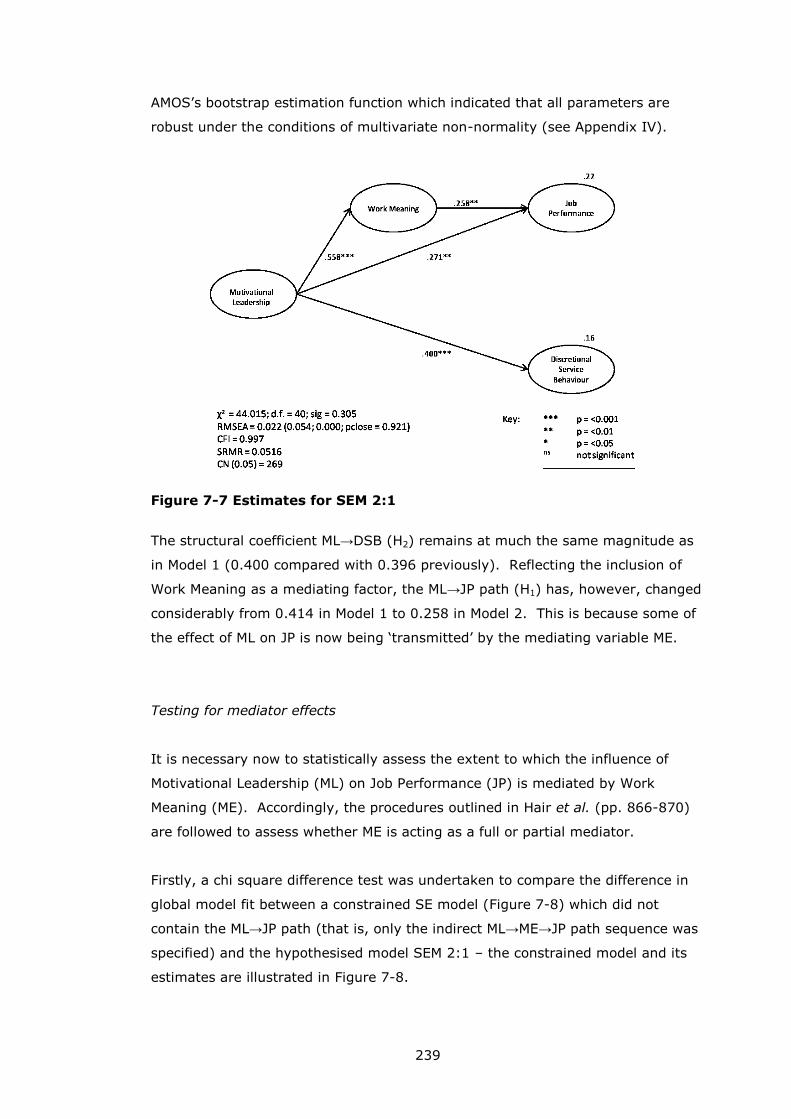
239
AMOS’s bootstrap estimation function which indicated that all parameters are
robust under the conditions of multivariate non-normality (see Appendix IV).
Figure 7-7 Estimates for SEM 2:1
The structural coefficient ML→DSB (H2) remains at much the same magnitude as
in Model 1 (0.400 compared with 0.396 previously). Reflecting the inclusion of
Work Meaning as a mediating factor, the ML→JP path (H1) has, however, changed
considerably from 0.414 in Model 1 to 0.258 in Model 2. This is because some of
the effect of ML on JP is now being ‘transmitted’ by the mediating variable ME.
Testing for mediator effects
It is necessary now to statistically assess the extent to which the influence of
Motivational Leadership (ML) on Job Performance (JP) is mediated by Work
Meaning (ME). Accordingly, the procedures outlined in Hair et al. (pp. 866-870)
are followed to assess whether ME is acting as a full or partial mediator.
Firstly, a chi square difference test was undertaken to compare the difference in
global model fit between a constrained SE model (Figure 7-8) which did not
contain the ML→JP path (that is, only the indirect ML→ME→JP path sequence was
specified) and the hypothesised model SEM 2:1 – the constrained model and its
estimates are illustrated in Figure 7-8.
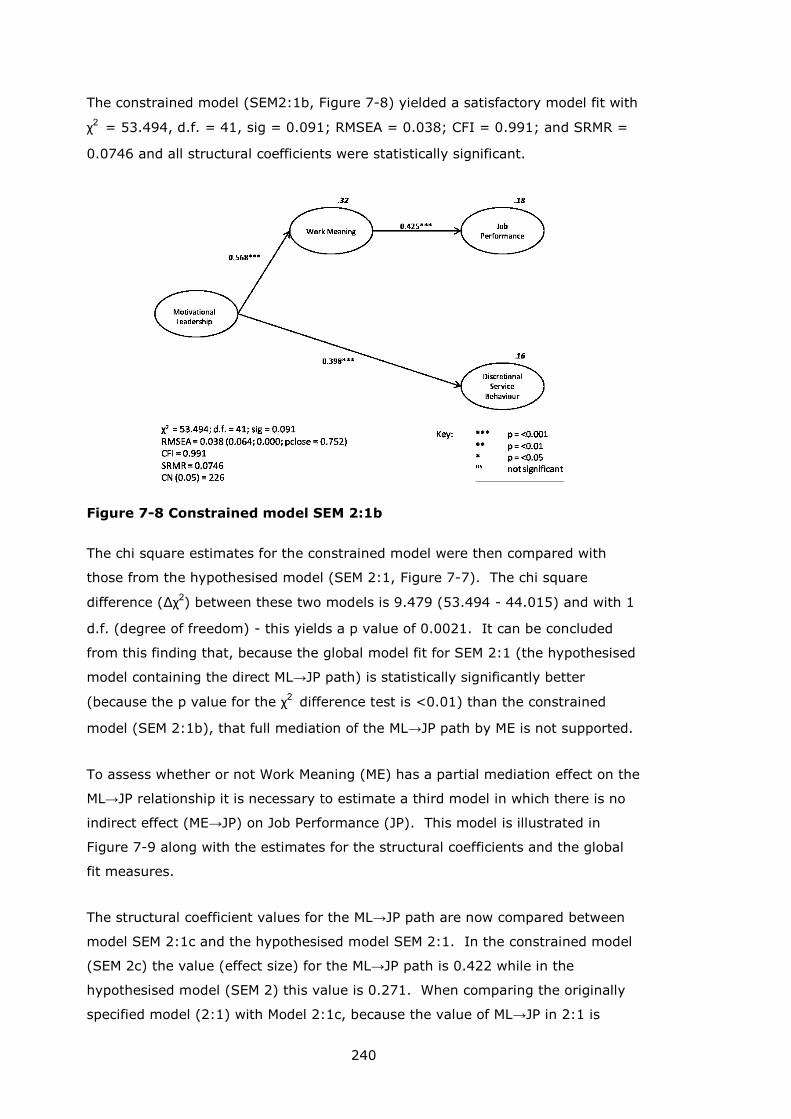
240
The constrained model (SEM2:1b, Figure 7-8) yielded a satisfactory model fit with
χ2 = 53.494, d.f. = 41, sig = 0.091; RMSEA = 0.038; CFI = 0.991; and SRMR =
0.0746 and all structural coefficients were statistically significant.
Figure 7-8 Constrained model SEM 2:1b
The chi square estimates for the constrained model were then compared with
those from the hypothesised model (SEM 2:1, Figure 7-7). The chi square
difference (Δχ2) between these two models is 9.479 (53.494 - 44.015) and with 1
d.f. (degree of freedom) - this yields a p value of 0.0021. It can be concluded
from this finding that, because the global model fit for SEM 2:1 (the hypothesised
model containing the direct ML→JP path) is statistically significantly better
(because the p value for the χ2 difference test is <0.01) than the constrained
model (SEM 2:1b), that full mediation of the ML→JP path by ME is not supported.
To assess whether or not Work Meaning (ME) has a partial mediation effect on the
ML→JP relationship it is necessary to estimate a third model in which there is no
indirect effect (ME→JP) on Job Performance (JP). This model is illustrated in
Figure 7-9 along with the estimates for the structural coefficients and the global
fit measures.
The structural coefficient values for the ML→JP path are now compared between
model SEM 2:1c and the hypothesised model SEM 2:1. In the constrained model
(SEM 2c) the value (effect size) for the ML→JP path is 0.422 while in the
hypothesised model (SEM 2) this value is 0.271. When comparing the originally
specified model (2:1) with Model 2:1c, because the value of ML→JP in 2:1 is
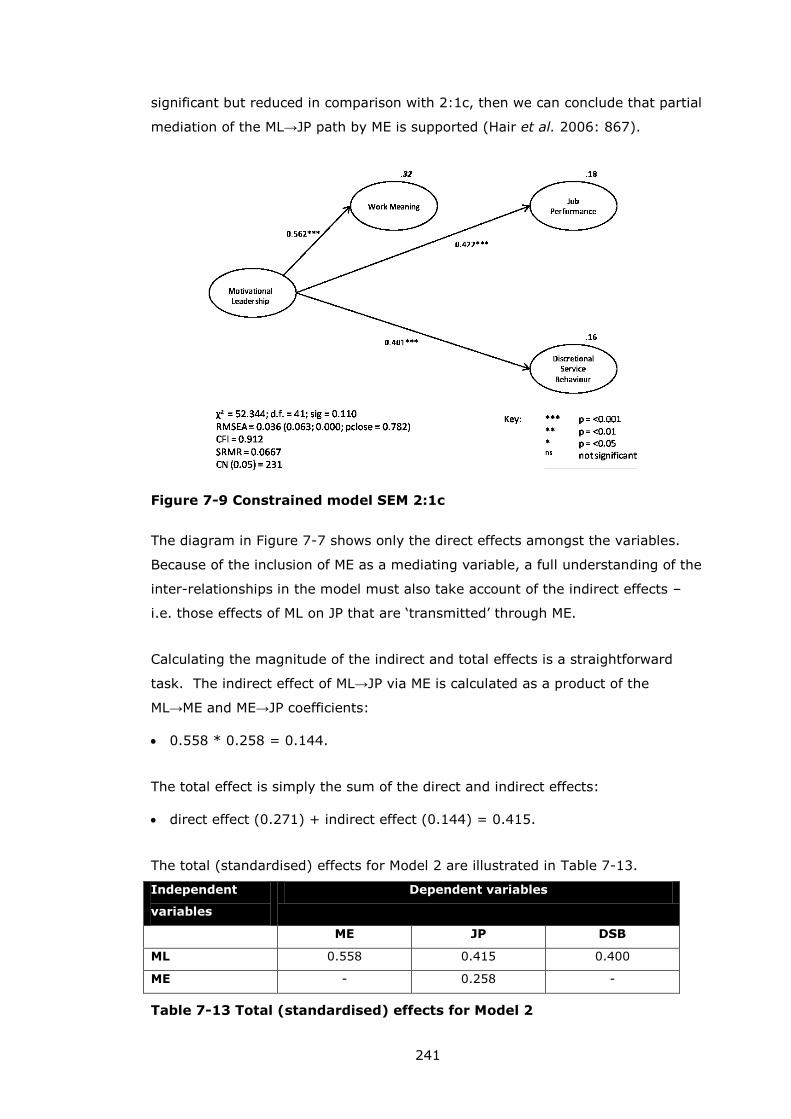
241
significant but reduced in comparison with 2:1c, then we can conclude that partial
mediation of the ML→JP path by ME is supported (Hair et al. 2006: 867).
Figure 7-9 Constrained model SEM 2:1c
The diagram in Figure 7-7 shows only the direct effects amongst the variables.
Because of the inclusion of ME as a mediating variable, a full understanding of the
inter-relationships in the model must also take account of the indirect effects –
i.e. those effects of ML on JP that are ‘transmitted’ through ME.
Calculating the magnitude of the indirect and total effects is a straightforward
task. The indirect effect of ML→JP via ME is calculated as a product of the
ML→ME and ME→JP coefficients:
0.558 * 0.258 = 0.144.
The total effect is simply the sum of the direct and indirect effects:
direct effect (0.271) + indirect effect (0.144) = 0.415.
The total (standardised) effects for Model 2 are illustrated in Table 7-13.
Independent
variables
Dependent variables
ME JP DSB
ML 0.558 0.415 0.400
ME - 0.258 -
Table 7-13 Total (standardised) effects for Model 2
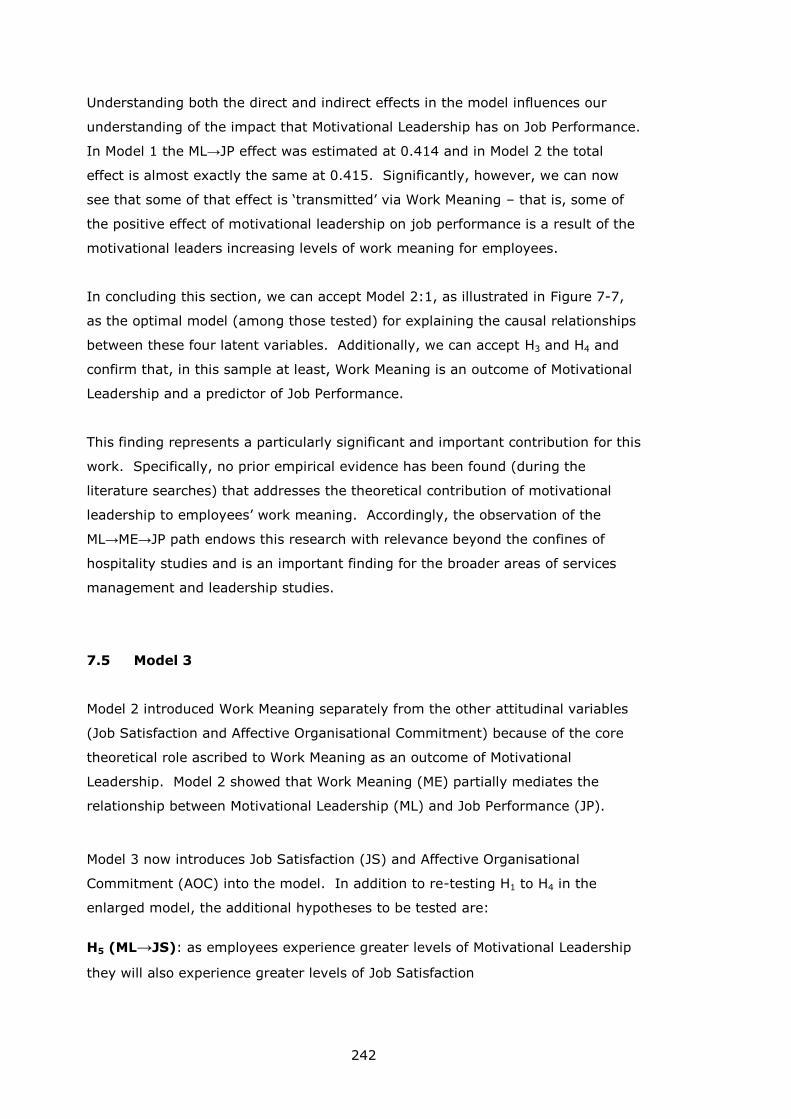
242
Understanding both the direct and indirect effects in the model influences our
understanding of the impact that Motivational Leadership has on Job Performance.
In Model 1 the ML→JP effect was estimated at 0.414 and in Model 2 the total
effect is almost exactly the same at 0.415. Significantly, however, we can now
see that some of that effect is ‘transmitted’ via Work Meaning – that is, some of
the positive effect of motivational leadership on job performance is a result of the
motivational leaders increasing levels of work meaning for employees.
In concluding this section, we can accept Model 2:1, as illustrated in Figure 7-7,
as the optimal model (among those tested) for explaining the causal relationships
between these four latent variables. Additionally, we can accept H3 and H4 and
confirm that, in this sample at least, Work Meaning is an outcome of Motivational
Leadership and a predictor of Job Performance.
This finding represents a particularly significant and important contribution for this
work. Specifically, no prior empirical evidence has been found (during the
literature searches) that addresses the theoretical contribution of motivational
leadership to employees’ work meaning. Accordingly, the observation of the
ML→ME→JP path endows this research with relevance beyond the confines of
hospitality studies and is an important finding for the broader areas of services
management and leadership studies.
7.5 Model 3
Model 2 introduced Work Meaning separately from the other attitudinal variables
(Job Satisfaction and Affective Organisational Commitment) because of the core
theoretical role ascribed to Work Meaning as an outcome of Motivational
Leadership. Model 2 showed that Work Meaning (ME) partially mediates the
relationship between Motivational Leadership (ML) and Job Performance (JP).
Model 3 now introduces Job Satisfaction (JS) and Affective Organisational
Commitment (AOC) into the model. In addition to re-testing H1 to H4 in the
enlarged model, the additional hypotheses to be tested are:
H5 (ML→JS): as employees experience greater levels of Motivational Leadership
they will also experience greater levels of Job Satisfaction
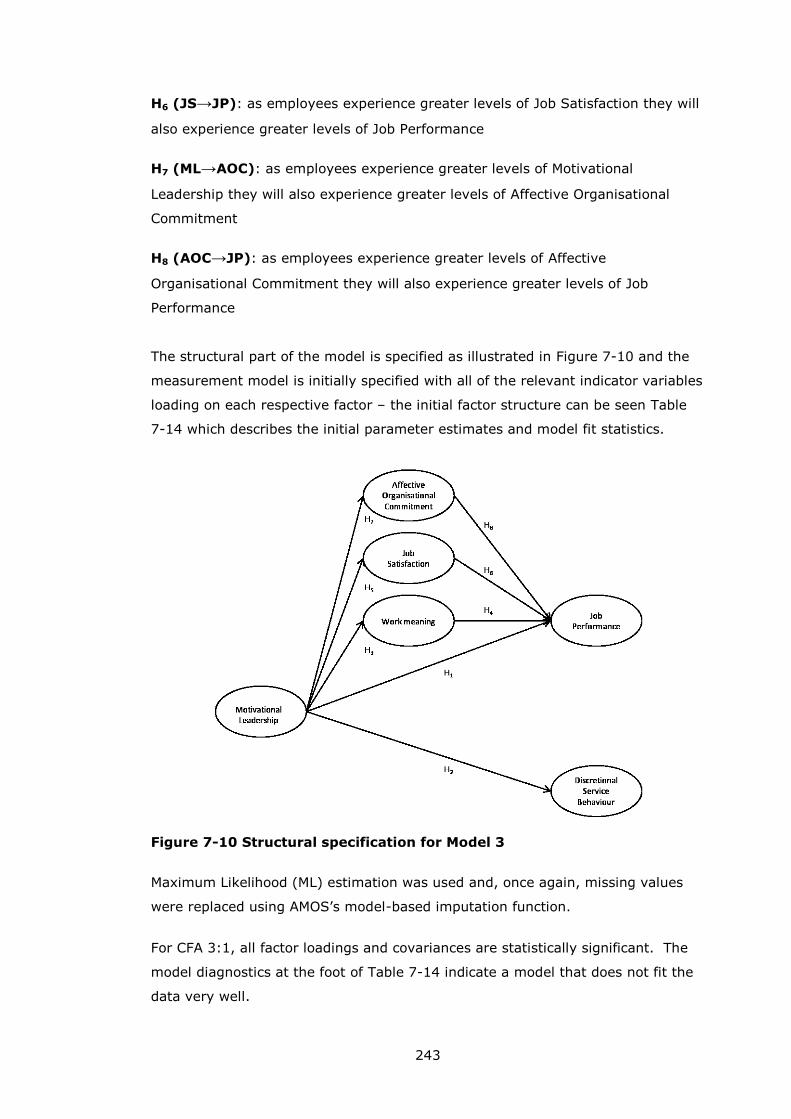
243
H6 (JS→JP): as employees experience greater levels of Job Satisfaction they will
also experience greater levels of Job Performance
H7 (ML→AOC): as employees experience greater levels of Motivational
Leadership they will also experience greater levels of Affective Organisational
Commitment
H8 (AOC→JP): as employees experience greater levels of Affective
Organisational Commitment they will also experience greater levels of Job
Performance
The structural part of the model is specified as illustrated in Figure 7-10 and the
measurement model is initially specified with all of the relevant indicator variables
loading on each respective factor – the initial factor structure can be seen Table
7-14 which describes the initial parameter estimates and model fit statistics.
Figure 7-10 Structural specification for Model 3
Maximum Likelihood (ML) estimation was used and, once again, missing values
were replaced using AMOS’s model-based imputation function.
For CFA 3:1, all factor loadings and covariances are statistically significant. The
model diagnostics at the foot of Table 7-14 indicate a model that does not fit the
data very well.
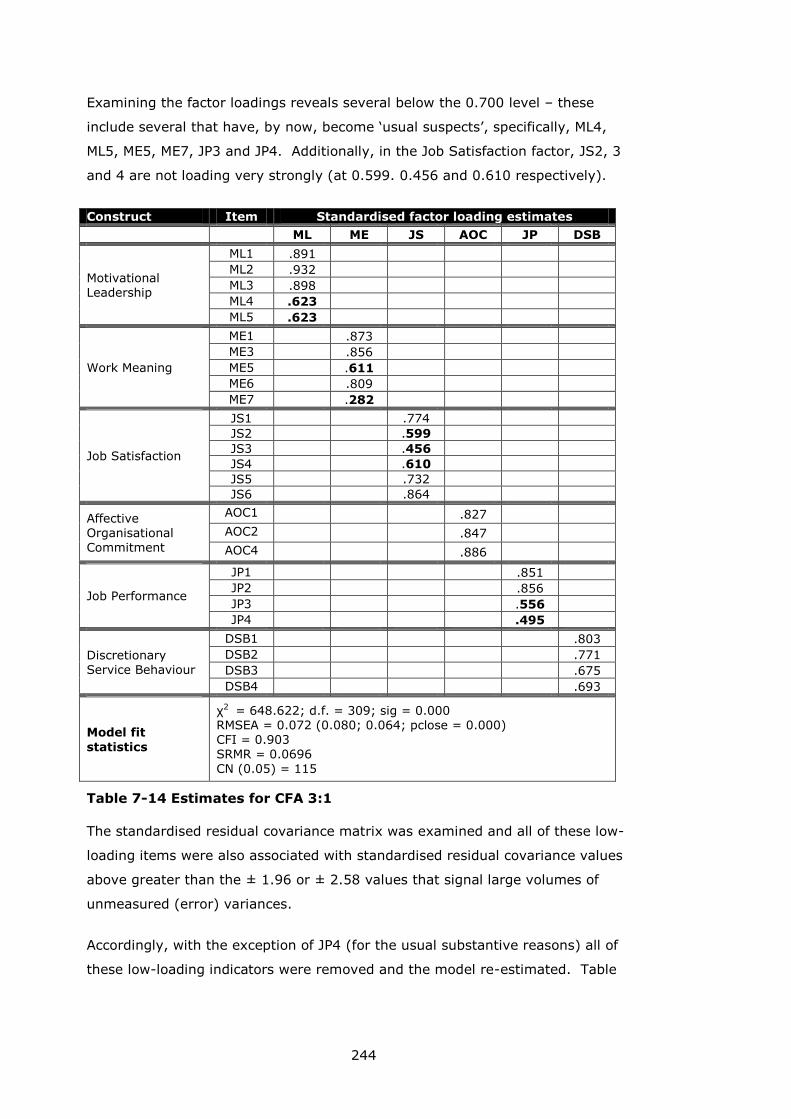
244
Examining the factor loadings reveals several below the 0.700 level – these
include several that have, by now, become ‘usual suspects’, specifically, ML4,
ML5, ME5, ME7, JP3 and JP4. Additionally, in the Job Satisfaction factor, JS2, 3
and 4 are not loading very strongly (at 0.599. 0.456 and 0.610 respectively).
Construct Item Standardised factor loading estimates
ML ME JS AOC JP DSB
Motivational Leadership
ML1 .891
ML2 .932
ML3 .898
ML4 .623
ML5 .623
Work Meaning
ME1 .873
ME3 .856
ME5 .611
ME6 .809
ME7 .282
Job Satisfaction
JS1 .774
JS2 .599
JS3 .456
JS4 .610
JS5 .732
JS6 .864
Affective Organisational
Commitment
AOC1 .827
AOC2 .847
AOC4 .886
Job Performance
JP1 .851
JP2 .856
JP3 .556
JP4 .495
Discretionary Service Behaviour
DSB1 .803
DSB2 .771
DSB3 .675
DSB4 .693
Model fit
statistics
χ2 = 648.622; d.f. = 309; sig = 0.000 RMSEA = 0.072 (0.080; 0.064; pclose = 0.000) CFI = 0.903 SRMR = 0.0696
CN (0.05) = 115
Table 7-14 Estimates for CFA 3:1
The standardised residual covariance matrix was examined and all of these low-
loading items were also associated with standardised residual covariance values
above greater than the ± 1.96 or ± 2.58 values that signal large volumes of
unmeasured (error) variances.
Accordingly, with the exception of JP4 (for the usual substantive reasons) all of
these low-loading indicators were removed and the model re-estimated. Table
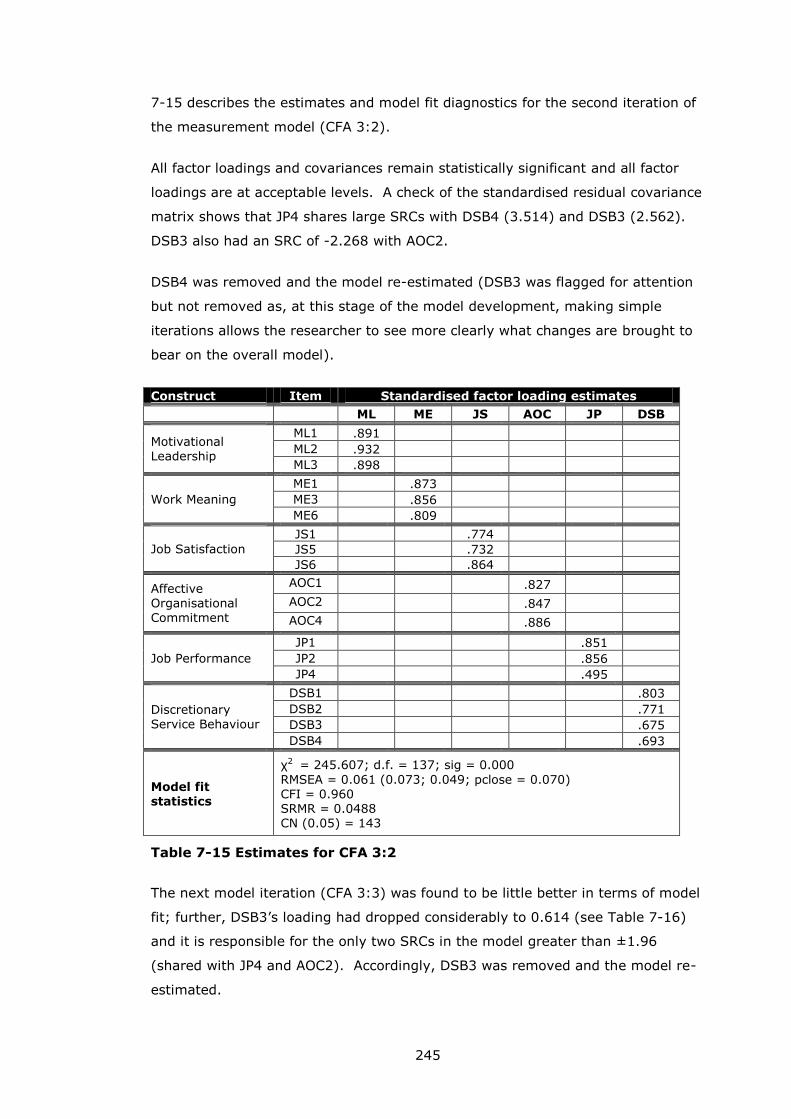
245
7-15 describes the estimates and model fit diagnostics for the second iteration of
the measurement model (CFA 3:2).
All factor loadings and covariances remain statistically significant and all factor
loadings are at acceptable levels. A check of the standardised residual covariance
matrix shows that JP4 shares large SRCs with DSB4 (3.514) and DSB3 (2.562).
DSB3 also had an SRC of -2.268 with AOC2.
DSB4 was removed and the model re-estimated (DSB3 was flagged for attention
but not removed as, at this stage of the model development, making simple
iterations allows the researcher to see more clearly what changes are brought to
bear on the overall model).
Construct Item Standardised factor loading estimates
ML ME JS AOC JP DSB
Motivational Leadership
ML1 .891
ML2 .932
ML3 .898
Work Meaning
ME1 .873
ME3 .856
ME6 .809
Job Satisfaction
JS1 .774
JS5 .732
JS6 .864
Affective Organisational Commitment
AOC1 .827
AOC2 .847
AOC4 .886
Job Performance
JP1 .851
JP2 .856
JP4 .495
Discretionary Service Behaviour
DSB1 .803
DSB2 .771
DSB3 .675
DSB4 .693
Model fit statistics
χ2 = 245.607; d.f. = 137; sig = 0.000
RMSEA = 0.061 (0.073; 0.049; pclose = 0.070) CFI = 0.960 SRMR = 0.0488 CN (0.05) = 143
Table 7-15 Estimates for CFA 3:2
The next model iteration (CFA 3:3) was found to be little better in terms of model
fit; further, DSB3’s loading had dropped considerably to 0.614 (see Table 7-16)
and it is responsible for the only two SRCs in the model greater than ±1.96
(shared with JP4 and AOC2). Accordingly, DSB3 was removed and the model re-
estimated.
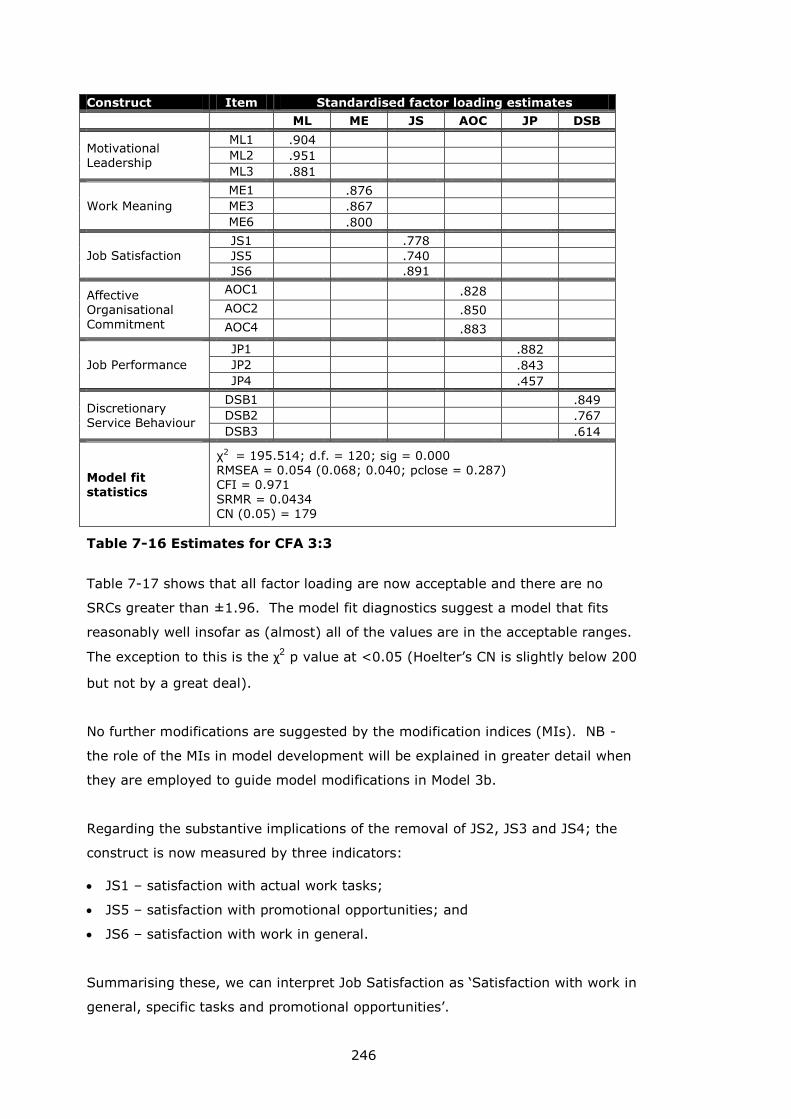
246
Construct Item Standardised factor loading estimates
ML ME JS AOC JP DSB
Motivational Leadership
ML1 .904
ML2 .951
ML3 .881
Work Meaning
ME1 .876
ME3 .867
ME6 .800
Job Satisfaction
JS1 .778
JS5 .740
JS6 .891
Affective Organisational
Commitment
AOC1 .828
AOC2 .850
AOC4 .883
Job Performance
JP1 .882
JP2 .843
JP4 .457
Discretionary Service Behaviour
DSB1 .849
DSB2 .767
DSB3 .614
Model fit statistics
χ2 = 195.514; d.f. = 120; sig = 0.000 RMSEA = 0.054 (0.068; 0.040; pclose = 0.287) CFI = 0.971 SRMR = 0.0434 CN (0.05) = 179
Table 7-16 Estimates for CFA 3:3
Table 7-17 shows that all factor loading are now acceptable and there are no
SRCs greater than ±1.96. The model fit diagnostics suggest a model that fits
reasonably well insofar as (almost) all of the values are in the acceptable ranges.
The exception to this is the χ2 p value at <0.05 (Hoelter’s CN is slightly below 200
but not by a great deal).
No further modifications are suggested by the modification indices (MIs). NB -
the role of the MIs in model development will be explained in greater detail when
they are employed to guide model modifications in Model 3b.
Regarding the substantive implications of the removal of JS2, JS3 and JS4; the
construct is now measured by three indicators:
JS1 – satisfaction with actual work tasks;
JS5 – satisfaction with promotional opportunities; and
JS6 – satisfaction with work in general.
Summarising these, we can interpret Job Satisfaction as ‘Satisfaction with work in
general, specific tasks and promotional opportunities’.
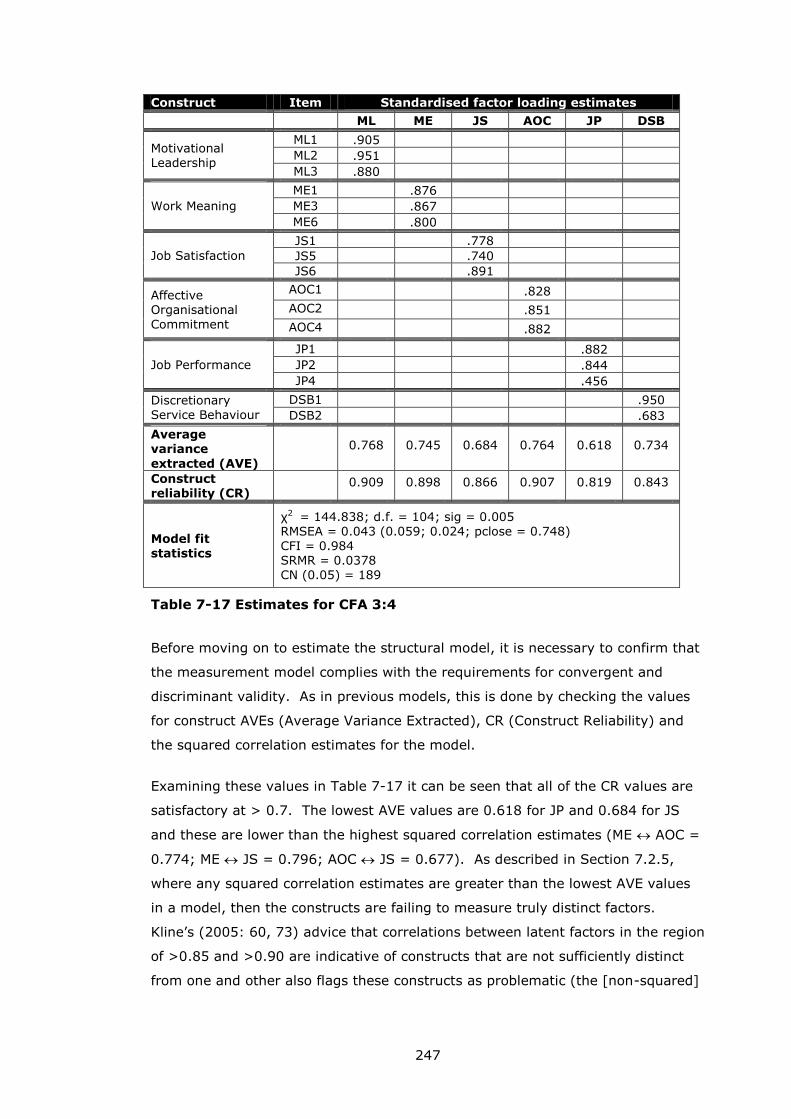
247
Construct Item Standardised factor loading estimates
ML ME JS AOC JP DSB
Motivational Leadership
ML1 .905
ML2 .951
ML3 .880
Work Meaning
ME1 .876
ME3 .867
ME6 .800
Job Satisfaction
JS1 .778
JS5 .740
JS6 .891
Affective Organisational
Commitment
AOC1 .828
AOC2 .851
AOC4 .882
Job Performance
JP1 .882
JP2 .844
JP4 .456
Discretionary Service Behaviour
DSB1 .950
DSB2 .683
Average variance
extracted (AVE)
0.768 0.745 0.684 0.764 0.618 0.734
Construct reliability (CR)
0.909 0.898 0.866 0.907 0.819 0.843
Model fit statistics
χ2 = 144.838; d.f. = 104; sig = 0.005 RMSEA = 0.043 (0.059; 0.024; pclose = 0.748)
CFI = 0.984 SRMR = 0.0378 CN (0.05) = 189
Table 7-17 Estimates for CFA 3:4
Before moving on to estimate the structural model, it is necessary to confirm that
the measurement model complies with the requirements for convergent and
discriminant validity. As in previous models, this is done by checking the values
for construct AVEs (Average Variance Extracted), CR (Construct Reliability) and
the squared correlation estimates for the model.
Examining these values in Table 7-17 it can be seen that all of the CR values are
satisfactory at > 0.7. The lowest AVE values are 0.618 for JP and 0.684 for JS
and these are lower than the highest squared correlation estimates (ME AOC =
0.774; ME JS = 0.796; AOC JS = 0.677). As described in Section 7.2.5,
where any squared correlation estimates are greater than the lowest AVE values
in a model, then the constructs are failing to measure truly distinct factors.
Kline’s (2005: 60, 73) advice that correlations between latent factors in the region
of >0.85 and >0.90 are indicative of constructs that are not sufficiently distinct
from one and other also flags these constructs as problematic (the [non-squared]
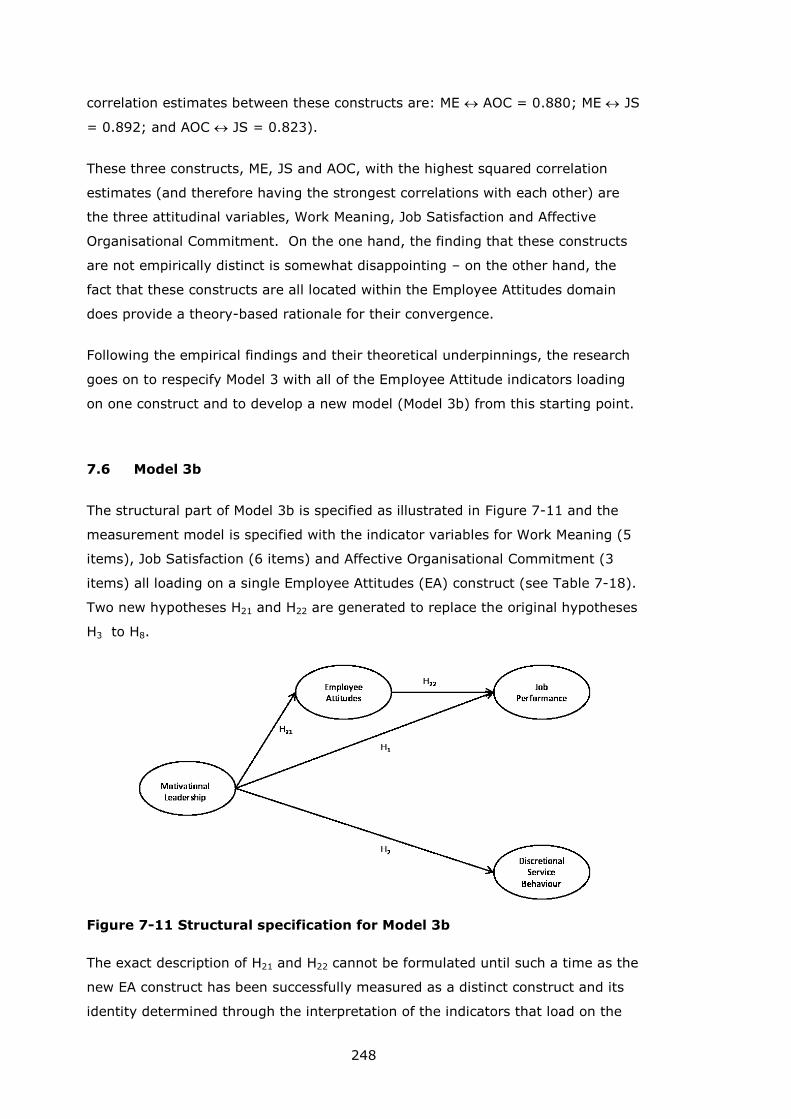
248
correlation estimates between these constructs are: ME AOC = 0.880; ME JS
= 0.892; and AOC JS = 0.823).
These three constructs, ME, JS and AOC, with the highest squared correlation
estimates (and therefore having the strongest correlations with each other) are
the three attitudinal variables, Work Meaning, Job Satisfaction and Affective
Organisational Commitment. On the one hand, the finding that these constructs
are not empirically distinct is somewhat disappointing – on the other hand, the
fact that these constructs are all located within the Employee Attitudes domain
does provide a theory-based rationale for their convergence.
Following the empirical findings and their theoretical underpinnings, the research
goes on to respecify Model 3 with all of the Employee Attitude indicators loading
on one construct and to develop a new model (Model 3b) from this starting point.
7.6 Model 3b
The structural part of Model 3b is specified as illustrated in Figure 7-11 and the
measurement model is specified with the indicator variables for Work Meaning (5
items), Job Satisfaction (6 items) and Affective Organisational Commitment (3
items) all loading on a single Employee Attitudes (EA) construct (see Table 7-18).
Two new hypotheses H21 and H22 are generated to replace the original hypotheses
H3 to H8.
Figure 7-11 Structural specification for Model 3b
The exact description of H21 and H22 cannot be formulated until such a time as the
new EA construct has been successfully measured as a distinct construct and its
identity determined through the interpretation of the indicators that load on the
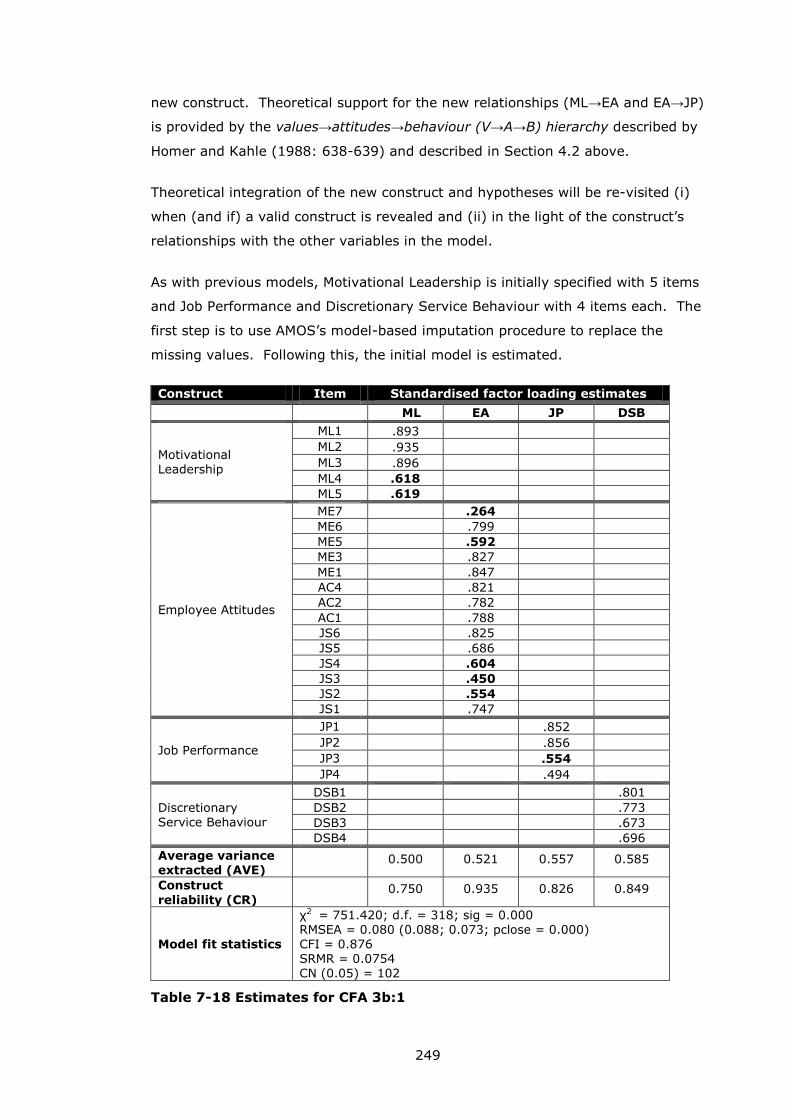
249
new construct. Theoretical support for the new relationships (ML→EA and EA→JP)
is provided by the values→attitudes→behaviour (V→A→B) hierarchy described by
Homer and Kahle (1988: 638-639) and described in Section 4.2 above.
Theoretical integration of the new construct and hypotheses will be re-visited (i)
when (and if) a valid construct is revealed and (ii) in the light of the construct’s
relationships with the other variables in the model.
As with previous models, Motivational Leadership is initially specified with 5 items
and Job Performance and Discretionary Service Behaviour with 4 items each. The
first step is to use AMOS’s model-based imputation procedure to replace the
missing values. Following this, the initial model is estimated.
Construct Item Standardised factor loading estimates
ML EA JP DSB
Motivational Leadership
ML1 .893
ML2 .935
ML3 .896
ML4 .618
ML5 .619
Employee Attitudes
ME7
.264
ME6
.799
ME5
.592
ME3
.827
ME1
.847
AC4
.821
AC2
.782
AC1
.788
JS6
.825
JS5
.686
JS4
.604
JS3
.450
JS2
.554
JS1
.747
Job Performance
JP1
.852
JP2
.856
JP3
.554
JP4
.494
Discretionary Service Behaviour
DSB1
.801
DSB2
.773
DSB3
.673
DSB4
.696
Average variance extracted (AVE)
0.500 0.521 0.557 0.585
Construct
reliability (CR) 0.750 0.935 0.826 0.849
Model fit statistics
χ2 = 751.420; d.f. = 318; sig = 0.000 RMSEA = 0.080 (0.088; 0.073; pclose = 0.000) CFI = 0.876 SRMR = 0.0754
CN (0.05) = 102
Table 7-18 Estimates for CFA 3b:1
250
Referring to Table 7-18, all factor loadings and factor covariances are statistically
significant although the model fit diagnostics for the initially-specified
measurement model indicate that the model is not a close fitting one. There are,
however, several low factor loadings that explain this poor fit. More importantly,
the initial model demonstrates discriminant validity with the highest squared
correlation estimate at 0.416 (ML EA) and the lowest AVE is 0.500.
The low loading items are recognisable from previous model iterations (ML4, ML5,
ME5, ME7, JS2, JS3, JS4 and JP3). These were all associated with high SRCs
(standardised residual covariances) and were removed and the measurement
model re-estimated. The results of this, a several subsequent model
modifications are summarised as follows.
Model CFA 3b:2
DSB4 shares a high (3.505) SRC with JP4; DSB4 removed (JP4 retained on
substantive grounds, as previously)
JS5 is flagged for observation owing to a high SRC (2.560) with ML3
Model CFA 3b:3
DSB3 removed owing to a moderate loading (0.611) and also a high SRC
(2.701) with JP4
JS5 remains on observation owing to 2.565 SRC with ML3
Prior to moving on to the modifications made to iteration CFA 3b:4, it is useful to
say a few words about the use of modification indices (MIs) for SEM model
development. For each parameter that is fixed to zero in a CFA or SEM model
(i.e. a potential path between two variables that is not included) a modification
index value is calculated by AMOS (and most other SEM software programmes).
For each pair of variables that could be connected by a path, the modification
index value provides an estimate of the improvement in model chi square (χ2 M)
that will be observed if this path is freed. In practical terms, a high MI value
indicates that these two variables are linked by a common, but unmeasured,
influence (i.e. a common factor that is not included in the model) (Byrne 2010:
110).
251
There should always be a good theoretical rationale for linking error variances in
this way13 (Kline 2005: 318) and models that include error covariances are often
criticised for ‘capitalising on chance’ (see e.g. Kline 2005: 147). In this context,
capitalising on chance refers to introducing error covariances – i.e. introducing
unmeasured and un-theorised linkages between variables - to satisfy the
observed data, rather than modifying the model substantively i.e. changing the
content (and therefore the meaning) of the model based on theory.
In adopting a model generating approach, this research is somewhat exploratory,
and, by its exploratory nature, is to some extent inherently capitalising on
chance! Put another way, while the meanings and structures of the models are
based in theory, the development of the models is guided to some degree by the
nature of the collected data. Nevertheless, the use of covaried error terms is
avoided because, not only does this technique capitalise on chance, it also
introduces unmeasured (and un-theorised) variance into the model.
Accordingly, for this research, the modification indices are used in a more
circumspect (cautionary) way. That is, when models have been modified as far as
is possible using evidence from the magnitudes of factor loadings and the
standardised residual covariance matrices, high MI values are then used to flag
pairs of variables for inspection. In particular, flagged pairs of variables are
examined to see if there is a large degree of overlap in item content – an
application of modification indices described by Byrne (2010: 110). Where
content overlap is identified, the weaker performing variable is removed and the
model re-estimated to see if model fit has improved. Indicator variable
performance is judged by comparing factor loadings, or, where factor loadings are
very similar, by comparing the total magnitude standardised residual covariances
(SRCs) associated with each indicator variable14. The variable with the greatest
associated SRC (in other words, the part of the model that is less well-explained
by the data) is then removed.
13 For example, it is uncommon to link the paths between error terms in two separate
constructs. During the descriptions of model modifications to follow, the phrase
‘theoretically plausible’ will be used to distinguish between MI values that indicate
potentially acceptable modifications and those that would make no substantive sense.
14 SCR values can be both positive and negative, with deviations from zero in either
direction signalling unmeasured variance. Accordingly, to compare magnitude of SRCs
between variables, all SRC values were rendered positive by being raised to power of
2 (i.e. they were squared).
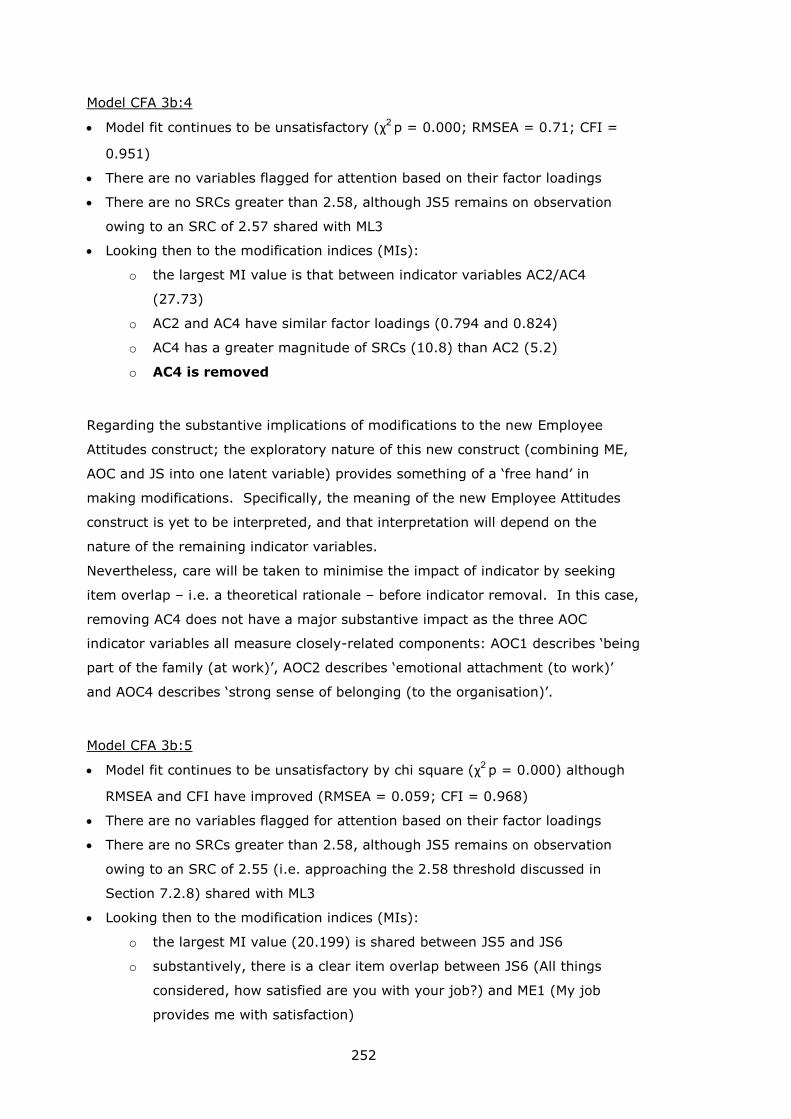
252
Model CFA 3b:4
Model fit continues to be unsatisfactory (χ2 p = 0.000; RMSEA = 0.71; CFI =
0.951)
There are no variables flagged for attention based on their factor loadings
There are no SRCs greater than 2.58, although JS5 remains on observation
owing to an SRC of 2.57 shared with ML3
Looking then to the modification indices (MIs):
o the largest MI value is that between indicator variables AC2/AC4
(27.73)
o AC2 and AC4 have similar factor loadings (0.794 and 0.824)
o AC4 has a greater magnitude of SRCs (10.8) than AC2 (5.2)
o AC4 is removed
Regarding the substantive implications of modifications to the new Employee
Attitudes construct; the exploratory nature of this new construct (combining ME,
AOC and JS into one latent variable) provides something of a ‘free hand’ in
making modifications. Specifically, the meaning of the new Employee Attitudes
construct is yet to be interpreted, and that interpretation will depend on the
nature of the remaining indicator variables.
Nevertheless, care will be taken to minimise the impact of indicator by seeking
item overlap – i.e. a theoretical rationale – before indicator removal. In this case,
removing AC4 does not have a major substantive impact as the three AOC
indicator variables all measure closely-related components: AOC1 describes ‘being
part of the family (at work)’, AOC2 describes ‘emotional attachment (to work)’
and AOC4 describes ‘strong sense of belonging (to the organisation)’.
Model CFA 3b:5
Model fit continues to be unsatisfactory by chi square (χ2 p = 0.000) although
RMSEA and CFI have improved (RMSEA = 0.059; CFI = 0.968)
There are no variables flagged for attention based on their factor loadings
There are no SRCs greater than 2.58, although JS5 remains on observation
owing to an SRC of 2.55 (i.e. approaching the 2.58 threshold discussed in
Section 7.2.8) shared with ML3
Looking then to the modification indices (MIs):
o the largest MI value (20.199) is shared between JS5 and JS6
o substantively, there is a clear item overlap between JS6 (All things
considered, how satisfied are you with your job?) and ME1 (My job
provides me with satisfaction)
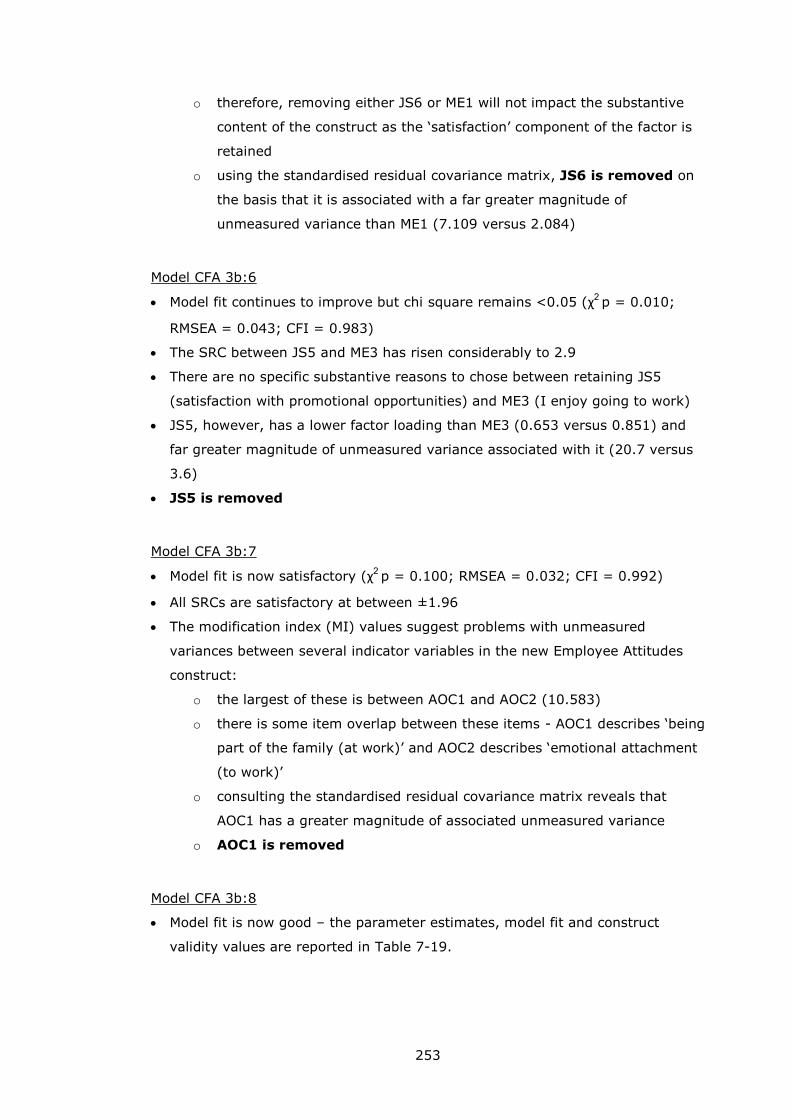
253
o therefore, removing either JS6 or ME1 will not impact the substantive
content of the construct as the ‘satisfaction’ component of the factor is
retained
o using the standardised residual covariance matrix, JS6 is removed on
the basis that it is associated with a far greater magnitude of
unmeasured variance than ME1 (7.109 versus 2.084)
Model CFA 3b:6
Model fit continues to improve but chi square remains <0.05 (χ2 p = 0.010;
RMSEA = 0.043; CFI = 0.983)
The SRC between JS5 and ME3 has risen considerably to 2.9
There are no specific substantive reasons to chose between retaining JS5
(satisfaction with promotional opportunities) and ME3 (I enjoy going to work)
JS5, however, has a lower factor loading than ME3 (0.653 versus 0.851) and
far greater magnitude of unmeasured variance associated with it (20.7 versus
3.6)
JS5 is removed
Model CFA 3b:7
Model fit is now satisfactory (χ2 p = 0.100; RMSEA = 0.032; CFI = 0.992)
All SRCs are satisfactory at between ±1.96
The modification index (MI) values suggest problems with unmeasured
variances between several indicator variables in the new Employee Attitudes
construct:
o the largest of these is between AOC1 and AOC2 (10.583)
o there is some item overlap between these items - AOC1 describes ‘being
part of the family (at work)’ and AOC2 describes ‘emotional attachment
(to work)’
o consulting the standardised residual covariance matrix reveals that
AOC1 has a greater magnitude of associated unmeasured variance
o AOC1 is removed
Model CFA 3b:8
Model fit is now good – the parameter estimates, model fit and construct
validity values are reported in Table 7-19.
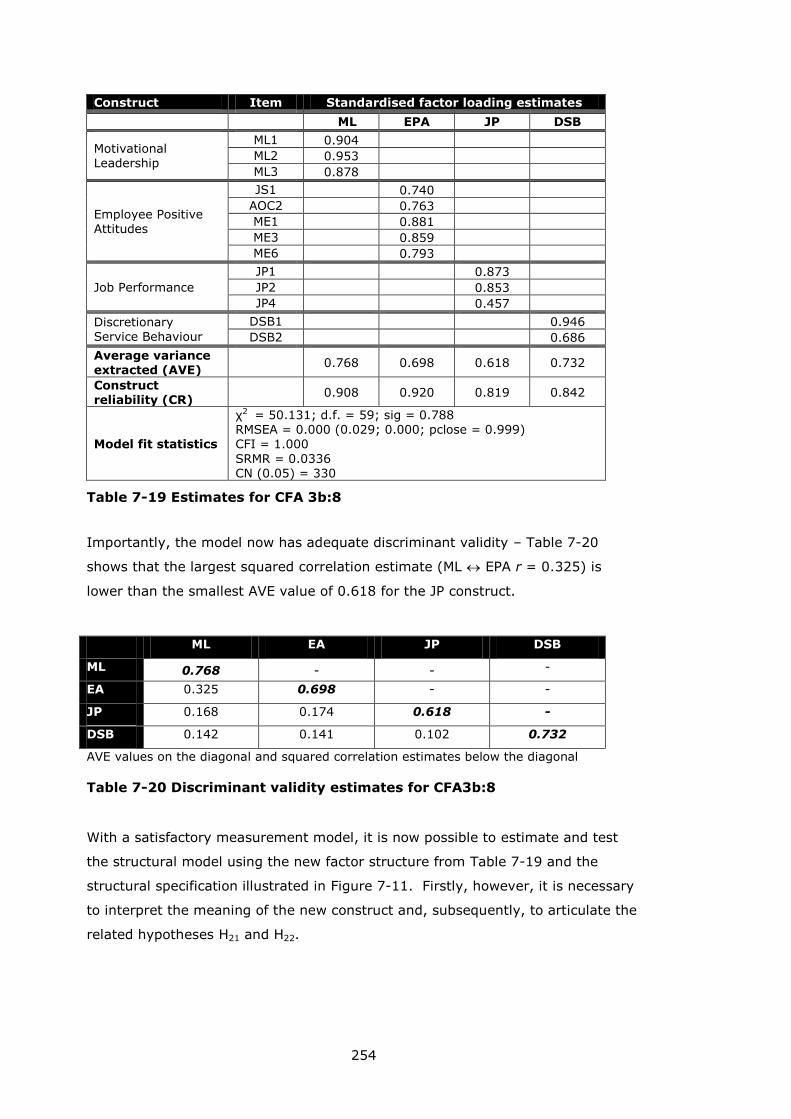
254
Construct Item Standardised factor loading estimates
ML EPA JP DSB
Motivational Leadership
ML1 0.904
ML2 0.953
ML3 0.878
Employee Positive Attitudes
JS1
0.740
AOC2
0.763
ME1
0.881
ME3
0.859
ME6
0.793
Job Performance
JP1
0.873
JP2
0.853
JP4
0.457
Discretionary Service Behaviour
DSB1
0.946
DSB2
0.686
Average variance extracted (AVE)
0.768 0.698 0.618 0.732
Construct reliability (CR)
0.908 0.920 0.819 0.842
Model fit statistics
χ2 = 50.131; d.f. = 59; sig = 0.788 RMSEA = 0.000 (0.029; 0.000; pclose = 0.999) CFI = 1.000
SRMR = 0.0336 CN (0.05) = 330
Table 7-19 Estimates for CFA 3b:8
Importantly, the model now has adequate discriminant validity – Table 7-20
shows that the largest squared correlation estimate (ML EPA r = 0.325) is
lower than the smallest AVE value of 0.618 for the JP construct.
ML EA JP DSB
ML 0.768 - - -
EA 0.325 0.698 - -
JP 0.168 0.174 0.618 -
DSB 0.142 0.141 0.102 0.732
AVE values on the diagonal and squared correlation estimates below the diagonal
Table 7-20 Discriminant validity estimates for CFA3b:8
With a satisfactory measurement model, it is now possible to estimate and test
the structural model using the new factor structure from Table 7-19 and the
structural specification illustrated in Figure 7-11. Firstly, however, it is necessary
to interpret the meaning of the new construct and, subsequently, to articulate the
related hypotheses H21 and H22.
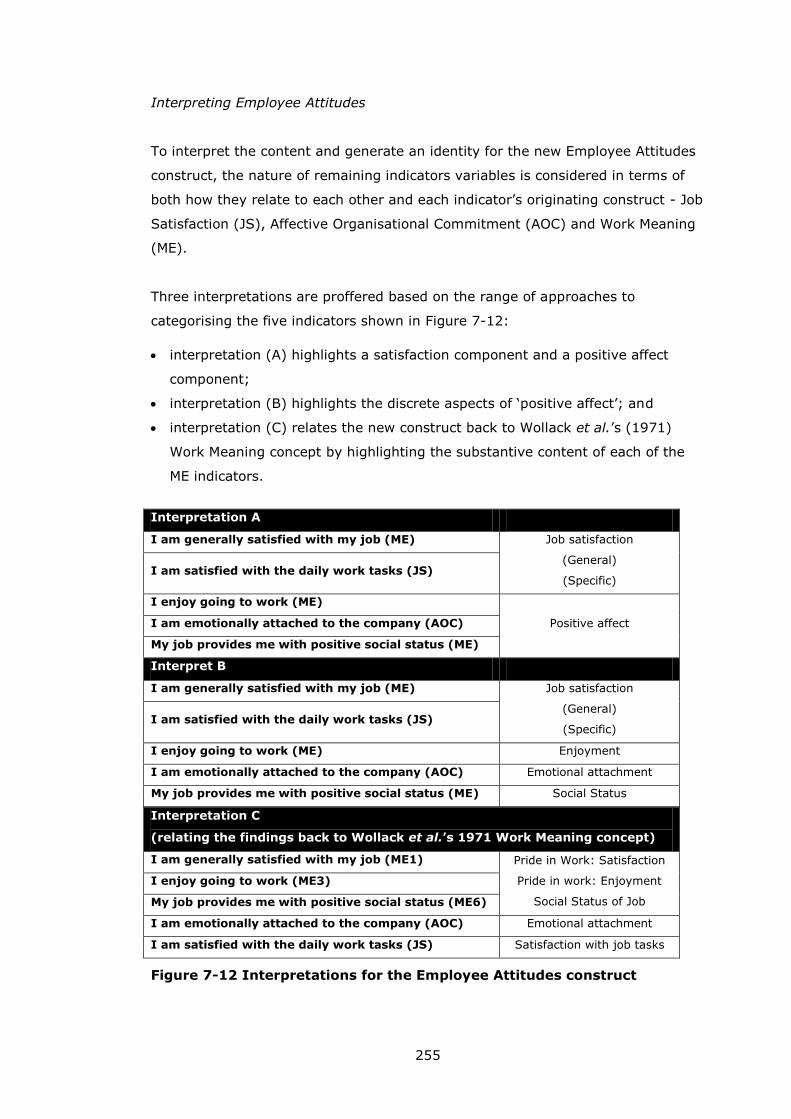
255
Interpreting Employee Attitudes
To interpret the content and generate an identity for the new Employee Attitudes
construct, the nature of remaining indicators variables is considered in terms of
both how they relate to each other and each indicator’s originating construct - Job
Satisfaction (JS), Affective Organisational Commitment (AOC) and Work Meaning
(ME).
Three interpretations are proffered based on the range of approaches to
categorising the five indicators shown in Figure 7-12:
interpretation (A) highlights a satisfaction component and a positive affect
component;
interpretation (B) highlights the discrete aspects of ‘positive affect’; and
interpretation (C) relates the new construct back to Wollack et al.’s (1971)
Work Meaning concept by highlighting the substantive content of each of the
ME indicators.
Interpretation A
I am generally satisfied with my job (ME) Job satisfaction
(General)
(Specific) I am satisfied with the daily work tasks (JS)
I enjoy going to work (ME)
Positive affect I am emotionally attached to the company (AOC)
My job provides me with positive social status (ME)
Interpret B
I am generally satisfied with my job (ME) Job satisfaction
(General)
(Specific) I am satisfied with the daily work tasks (JS)
I enjoy going to work (ME) Enjoyment
I am emotionally attached to the company (AOC) Emotional attachment
My job provides me with positive social status (ME) Social Status
Interpretation C
(relating the findings back to Wollack et al.’s 1971 Work Meaning concept)
I am generally satisfied with my job (ME1) Pride in Work: Satisfaction
Pride in work: Enjoyment
Social Status of Job
I enjoy going to work (ME3)
My job provides me with positive social status (ME6)
I am emotionally attached to the company (AOC) Emotional attachment
I am satisfied with the daily work tasks (JS) Satisfaction with job tasks
Figure 7-12 Interpretations for the Employee Attitudes construct
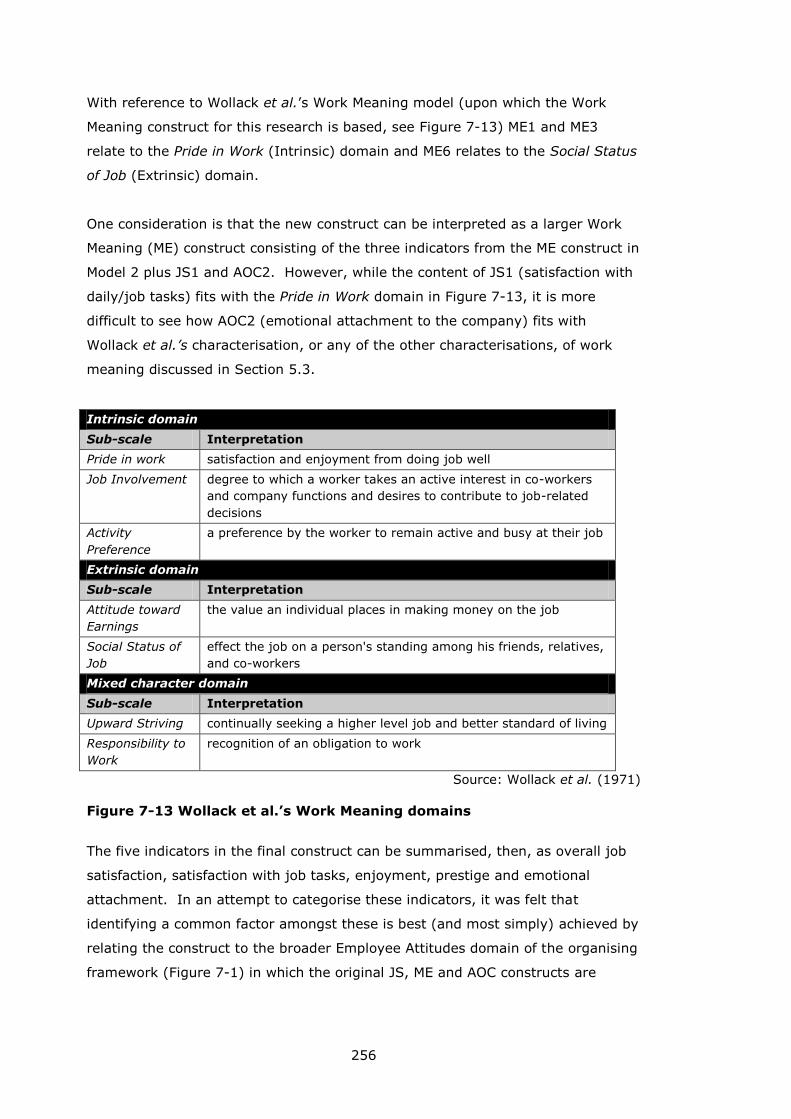
256
With reference to Wollack et al.’s Work Meaning model (upon which the Work
Meaning construct for this research is based, see Figure 7-13) ME1 and ME3
relate to the Pride in Work (Intrinsic) domain and ME6 relates to the Social Status
of Job (Extrinsic) domain.
One consideration is that the new construct can be interpreted as a larger Work
Meaning (ME) construct consisting of the three indicators from the ME construct in
Model 2 plus JS1 and AOC2. However, while the content of JS1 (satisfaction with
daily/job tasks) fits with the Pride in Work domain in Figure 7-13, it is more
difficult to see how AOC2 (emotional attachment to the company) fits with
Wollack et al.’s characterisation, or any of the other characterisations, of work
meaning discussed in Section 5.3.
Intrinsic domain
Sub-scale Interpretation
Pride in work satisfaction and enjoyment from doing job well
Job Involvement degree to which a worker takes an active interest in co-workers
and company functions and desires to contribute to job-related
decisions
Activity
Preference
a preference by the worker to remain active and busy at their job
Extrinsic domain
Sub-scale Interpretation
Attitude toward
Earnings
the value an individual places in making money on the job
Social Status of
Job
effect the job on a person's standing among his friends, relatives,
and co-workers
Mixed character domain
Sub-scale Interpretation
Upward Striving continually seeking a higher level job and better standard of living
Responsibility to
Work
recognition of an obligation to work
Source: Wollack et al. (1971)
Figure 7-13 Wollack et al.’s Work Meaning domains
The five indicators in the final construct can be summarised, then, as overall job
satisfaction, satisfaction with job tasks, enjoyment, prestige and emotional
attachment. In an attempt to categorise these indicators, it was felt that
identifying a common factor amongst these is best (and most simply) achieved by
relating the construct to the broader Employee Attitudes domain of the organising
framework (Figure 7-1) in which the original JS, ME and AOC constructs are
257
located. Accordingly, the new construct is interpreted as Employee Positive
Attitudes (EPA)15.
The new hypotheses can now be expressed as follows:
H21 (ML→EPA): as employees experience greater levels of Motivational
Leadership they will also experience greater levels of Positive Attitudes.
H22 (EPA→JP): as employees experience greater levels of Positive Attitudes they
will also report greater levels of Job Performance.
Regarding theoretical support for hypothesis H21 (ML→EPA), the rationale and
justifications for the original ML→ME, ML→JS and ML→AOC are articulated in
Section 4.4. The new construct, EPA, contains components of Work Meaning, Job
Satisfaction and Affective Organisational Commitment, albeit now combined to
form a broader ‘positive attitude’ construct. Because EPA is a new construct,
there is no specific empirical precedent for how a combined ‘Employee Positive
Attitude’ will relate to motivational leadership and job performance. However, in
the transformational leadership theory literature, there are various discussions of
where transformational and inspirational leadership can positively influence
employees’ attitudes (examples include Avolio et al. 1991: 15; Bass and Riggio
2006: 32; Avolio and Bass 2004: 19).
Regarding theoretical support for hypothesis H22 (EPA→JP), this is supported
broadly by the values→attitudes→behaviour (V→A→B) hierarchy described by
Homer and Kahle (1988: 638-639). In more specific terms, each component of
the new construct (ME, JS and AOC) has theoretical and/or empirical support as
outlined in Section 4.4
Estimating SEM 3b
Figure 7-14 illustrates the parameter estimates and model fit diagnostics for SEM
3b. The model fits well according to all of the indicators and all of the structural
coefficients are statistically significant.
15 Positive Employee Attitudes (PEA) was considered, but dropped, as there is no
theoretical basis for a leguminous covariate of motivational leadership.
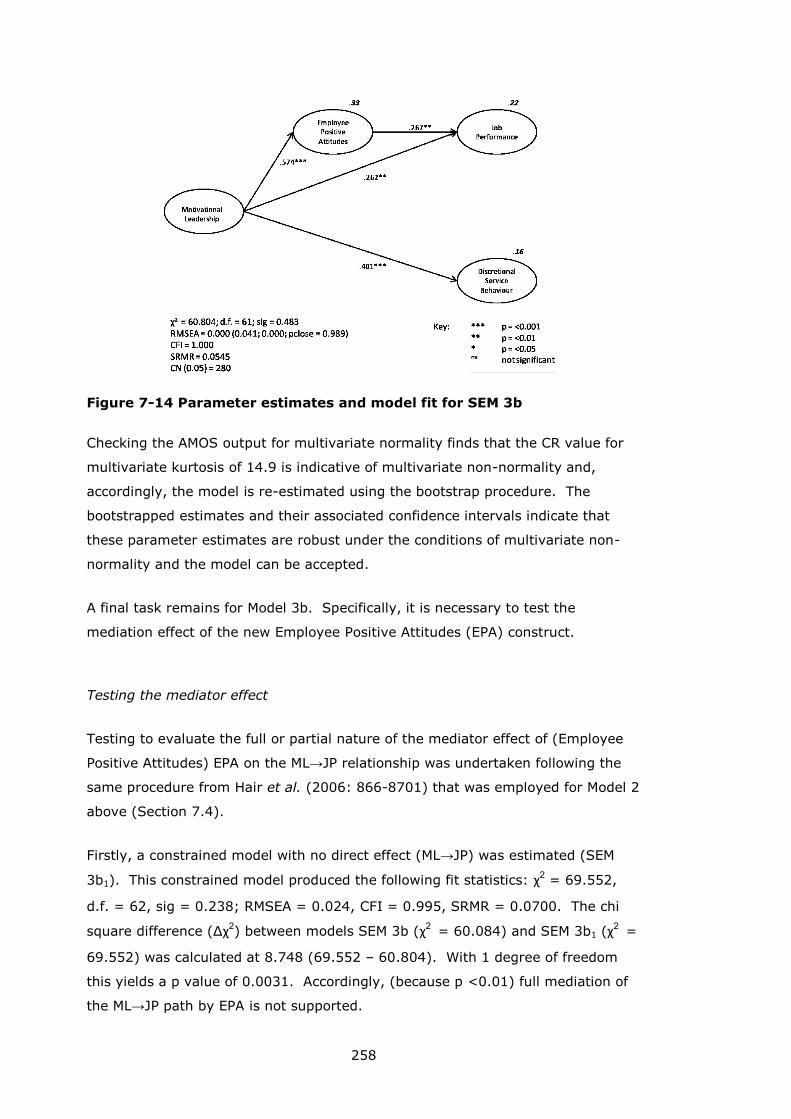
258
Figure 7-14 Parameter estimates and model fit for SEM 3b
Checking the AMOS output for multivariate normality finds that the CR value for
multivariate kurtosis of 14.9 is indicative of multivariate non-normality and,
accordingly, the model is re-estimated using the bootstrap procedure. The
bootstrapped estimates and their associated confidence intervals indicate that
these parameter estimates are robust under the conditions of multivariate non-
normality and the model can be accepted.
A final task remains for Model 3b. Specifically, it is necessary to test the
mediation effect of the new Employee Positive Attitudes (EPA) construct.
Testing the mediator effect
Testing to evaluate the full or partial nature of the mediator effect of (Employee
Positive Attitudes) EPA on the ML→JP relationship was undertaken following the
same procedure from Hair et al. (2006: 866-8701) that was employed for Model 2
above (Section 7.4).
Firstly, a constrained model with no direct effect (ML→JP) was estimated (SEM
3b1). This constrained model produced the following fit statistics: χ2 = 69.552,
d.f. = 62, sig = 0.238; RMSEA = 0.024, CFI = 0.995, SRMR = 0.0700. The chi
square difference (Δχ2) between models SEM 3b (χ2
= 60.084) and SEM 3b1 (χ2 =
69.552) was calculated at 8.748 (69.552 – 60.804). With 1 degree of freedom
this yields a p value of 0.0031. Accordingly, (because p <0.01) full mediation of
the ML→JP path by EPA is not supported.
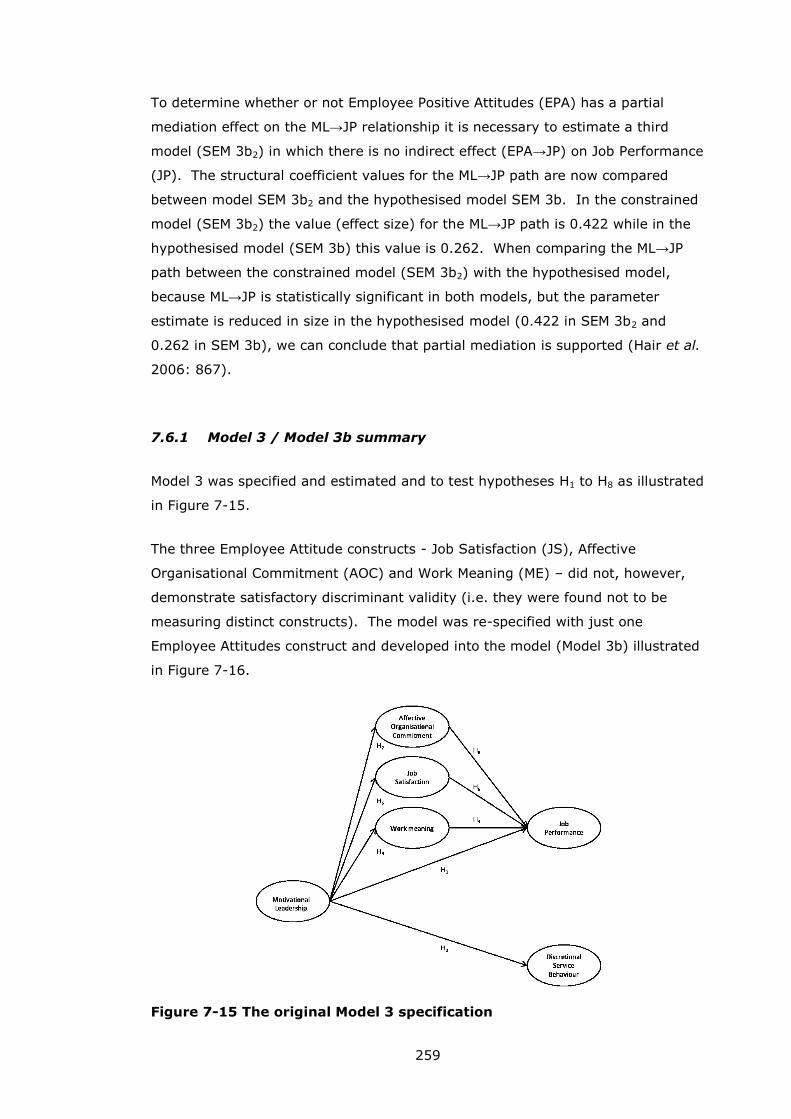
259
To determine whether or not Employee Positive Attitudes (EPA) has a partial
mediation effect on the ML→JP relationship it is necessary to estimate a third
model (SEM 3b2) in which there is no indirect effect (EPA→JP) on Job Performance
(JP). The structural coefficient values for the ML→JP path are now compared
between model SEM 3b2 and the hypothesised model SEM 3b. In the constrained
model (SEM 3b2) the value (effect size) for the ML→JP path is 0.422 while in the
hypothesised model (SEM 3b) this value is 0.262. When comparing the ML→JP
path between the constrained model (SEM 3b2) with the hypothesised model,
because ML→JP is statistically significant in both models, but the parameter
estimate is reduced in size in the hypothesised model (0.422 in SEM 3b2 and
0.262 in SEM 3b), we can conclude that partial mediation is supported (Hair et al.
2006: 867).
7.6.1 Model 3 / Model 3b summary
Model 3 was specified and estimated and to test hypotheses H1 to H8 as illustrated
in Figure 7-15.
The three Employee Attitude constructs - Job Satisfaction (JS), Affective
Organisational Commitment (AOC) and Work Meaning (ME) – did not, however,
demonstrate satisfactory discriminant validity (i.e. they were found not to be
measuring distinct constructs). The model was re-specified with just one
Employee Attitudes construct and developed into the model (Model 3b) illustrated
in Figure 7-16.
Figure 7-15 The original Model 3 specification
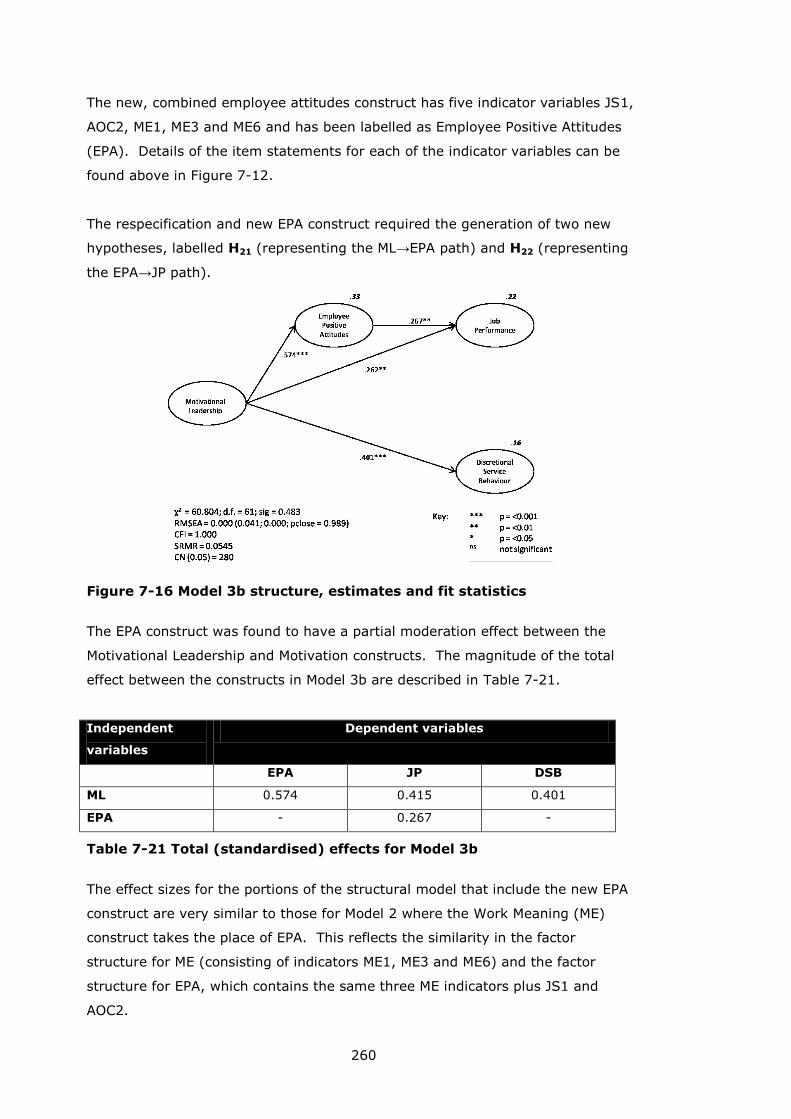
260
The new, combined employee attitudes construct has five indicator variables JS1,
AOC2, ME1, ME3 and ME6 and has been labelled as Employee Positive Attitudes
(EPA). Details of the item statements for each of the indicator variables can be
found above in Figure 7-12.
The respecification and new EPA construct required the generation of two new
hypotheses, labelled H21 (representing the ML→EPA path) and H22 (representing
the EPA→JP path).
Figure 7-16 Model 3b structure, estimates and fit statistics
The EPA construct was found to have a partial moderation effect between the
Motivational Leadership and Motivation constructs. The magnitude of the total
effect between the constructs in Model 3b are described in Table 7-21.
Independent
variables
Dependent variables
EPA JP DSB
ML 0.574 0.415 0.401
EPA - 0.267 -
Table 7-21 Total (standardised) effects for Model 3b
The effect sizes for the portions of the structural model that include the new EPA
construct are very similar to those for Model 2 where the Work Meaning (ME)
construct takes the place of EPA. This reflects the similarity in the factor
structure for ME (consisting of indicators ME1, ME3 and ME6) and the factor
structure for EPA, which contains the same three ME indicators plus JS1 and
AOC2.
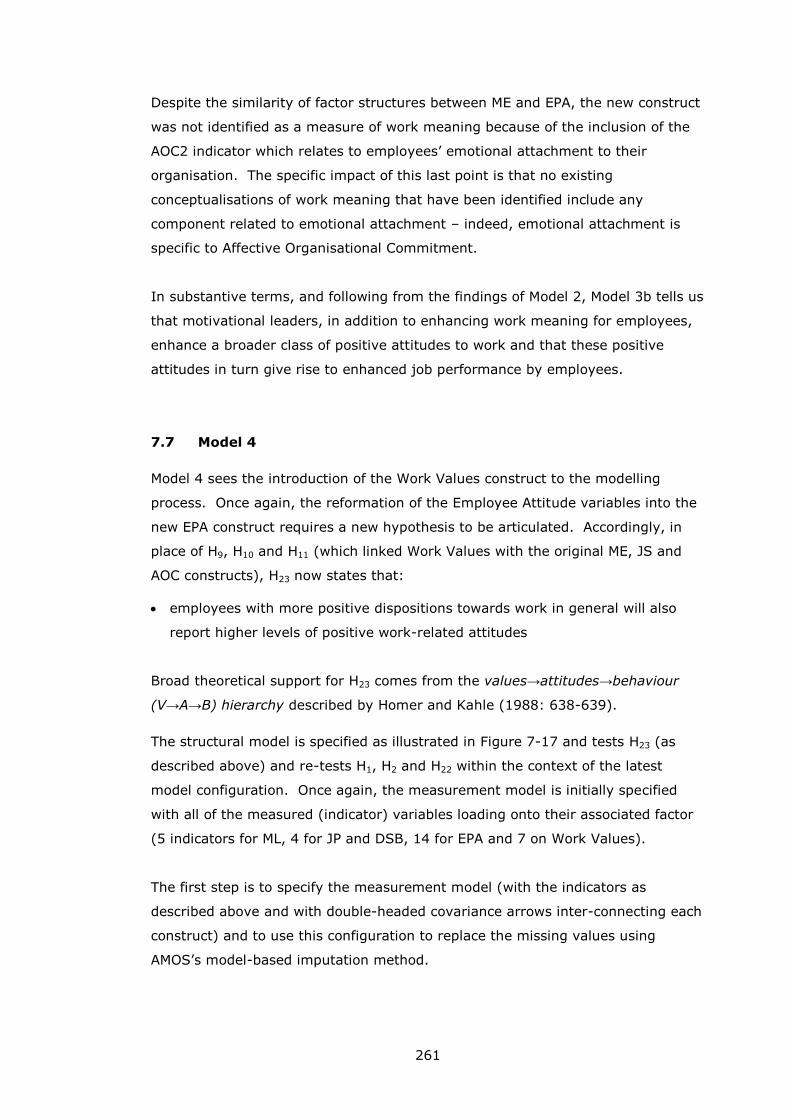
261
Despite the similarity of factor structures between ME and EPA, the new construct
was not identified as a measure of work meaning because of the inclusion of the
AOC2 indicator which relates to employees’ emotional attachment to their
organisation. The specific impact of this last point is that no existing
conceptualisations of work meaning that have been identified include any
component related to emotional attachment – indeed, emotional attachment is
specific to Affective Organisational Commitment.
In substantive terms, and following from the findings of Model 2, Model 3b tells us
that motivational leaders, in addition to enhancing work meaning for employees,
enhance a broader class of positive attitudes to work and that these positive
attitudes in turn give rise to enhanced job performance by employees.
7.7 Model 4
Model 4 sees the introduction of the Work Values construct to the modelling
process. Once again, the reformation of the Employee Attitude variables into the
new EPA construct requires a new hypothesis to be articulated. Accordingly, in
place of H9, H10 and H11 (which linked Work Values with the original ME, JS and
AOC constructs), H23 now states that:
employees with more positive dispositions towards work in general will also
report higher levels of positive work-related attitudes
Broad theoretical support for H23 comes from the values→attitudes→behaviour
(V→A→B) hierarchy described by Homer and Kahle (1988: 638-639).
The structural model is specified as illustrated in Figure 7-17 and tests H23 (as
described above) and re-tests H1, H2 and H22 within the context of the latest
model configuration. Once again, the measurement model is initially specified
with all of the measured (indicator) variables loading onto their associated factor
(5 indicators for ML, 4 for JP and DSB, 14 for EPA and 7 on Work Values).
The first step is to specify the measurement model (with the indicators as
described above and with double-headed covariance arrows inter-connecting each
construct) and to use this configuration to replace the missing values using
AMOS’s model-based imputation method.
262
Figure 7-17 Structural specification for Model 4
Before estimating the measurement model using the now complete data set, it is
worthwhile briefly describing the double-headed arrow connecting Motivational
Leadership (ML) and Work Values (WV) in Figure 7-17. Model 4 is the first model
in this research to include more than one exogenous construct – that is, both ML
and WV are independent latent variables that have no causes contained within the
model (unlike the dependent, endogenous latent variables, that are each
hypothesised to be influenced by another one or more latent variables in the
model).
In SEM it is usual to assume that exogenous variables are correlated, unless there
is a specific theory-based rationale arguing against this (Garson 2011b). Kline
(2005: 67-68) describes this correlation as representing the unanalysed
association between the two constructs, going on to say that the correlation is
unanalysed in the sense that no predictions are offered to explain why these
constructs covary.
The procedure for measurement model development used in for Models 1 to 3 is
followed once more. For brevity, the modifications leading to the final
measurement model specification are summarised in Table 7-22.
Following these 6 modification steps, the measurement model now demonstrates
satisfactory fit and all factor loadings and factor covariances are statistically
significant (see Table 7-23). The constructs all demonstrate convergent (all AVEs
>0.5 and all CRs > 0.07) and discriminant validity (the highest squared
correlation estimate is ML EPA at 0.325 and the lowest AVE is 0.617).
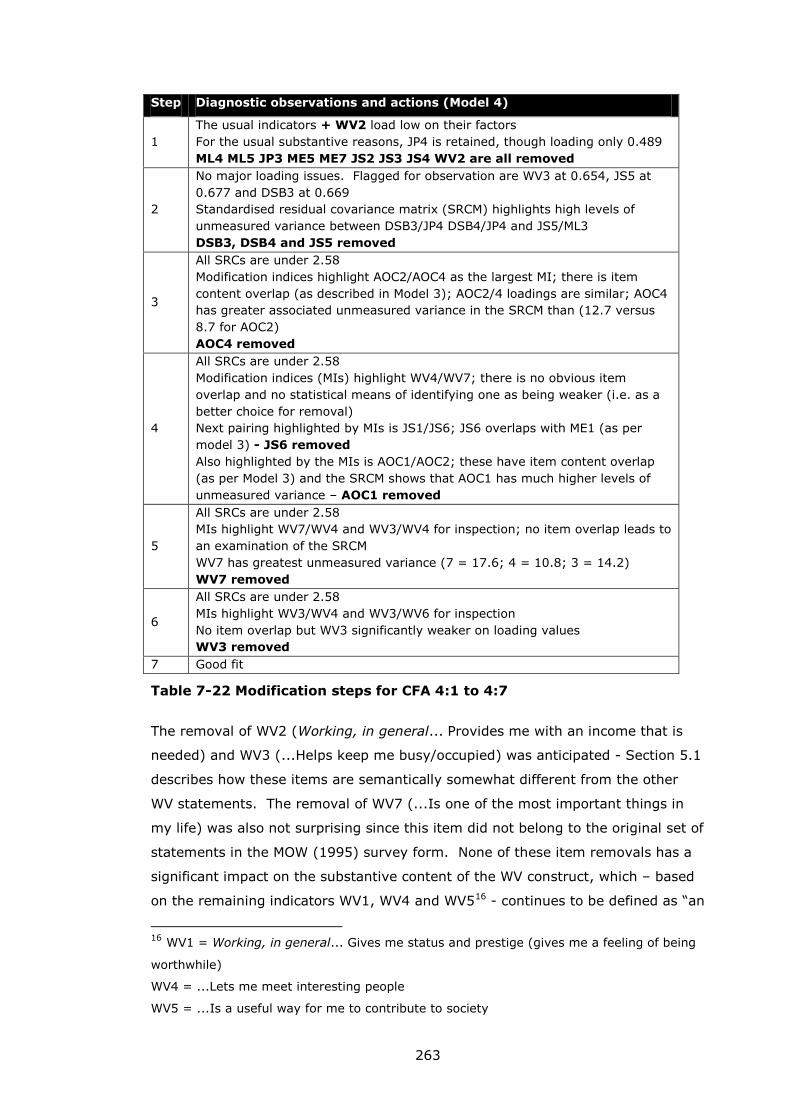
263
Step Diagnostic observations and actions (Model 4)
1
The usual indicators + WV2 load low on their factors
For the usual substantive reasons, JP4 is retained, though loading only 0.489
ML4 ML5 JP3 ME5 ME7 JS2 JS3 JS4 WV2 are all removed
2
No major loading issues. Flagged for observation are WV3 at 0.654, JS5 at
0.677 and DSB3 at 0.669
Standardised residual covariance matrix (SRCM) highlights high levels of
unmeasured variance between DSB3/JP4 DSB4/JP4 and JS5/ML3
DSB3, DSB4 and JS5 removed
3
All SRCs are under 2.58
Modification indices highlight AOC2/AOC4 as the largest MI; there is item
content overlap (as described in Model 3); AOC2/4 loadings are similar; AOC4
has greater associated unmeasured variance in the SRCM than (12.7 versus
8.7 for AOC2)
AOC4 removed
4
All SRCs are under 2.58
Modification indices (MIs) highlight WV4/WV7; there is no obvious item
overlap and no statistical means of identifying one as being weaker (i.e. as a
better choice for removal)
Next pairing highlighted by MIs is JS1/JS6; JS6 overlaps with ME1 (as per
model 3) - JS6 removed
Also highlighted by the MIs is AOC1/AOC2; these have item content overlap
(as per Model 3) and the SRCM shows that AOC1 has much higher levels of
unmeasured variance – AOC1 removed
5
All SRCs are under 2.58
MIs highlight WV7/WV4 and WV3/WV4 for inspection; no item overlap leads to
an examination of the SRCM
WV7 has greatest unmeasured variance (7 = 17.6; 4 = 10.8; 3 = 14.2)
WV7 removed
6
All SRCs are under 2.58
MIs highlight WV3/WV4 and WV3/WV6 for inspection
No item overlap but WV3 significantly weaker on loading values
WV3 removed
7 Good fit
Table 7-22 Modification steps for CFA 4:1 to 4:7
The removal of WV2 (Working, in general... Provides me with an income that is
needed) and WV3 (...Helps keep me busy/occupied) was anticipated - Section 5.1
describes how these items are semantically somewhat different from the other
WV statements. The removal of WV7 (...Is one of the most important things in
my life) was also not surprising since this item did not belong to the original set of
statements in the MOW (1995) survey form. None of these item removals has a
significant impact on the substantive content of the WV construct, which – based
on the remaining indicators WV1, WV4 and WV516 - continues to be defined as “an
16 WV1 = Working, in general... Gives me status and prestige (gives me a feeling of being
worthwhile)
WV4 = ...Lets me meet interesting people
WV5 = ...Is a useful way for me to contribute to society
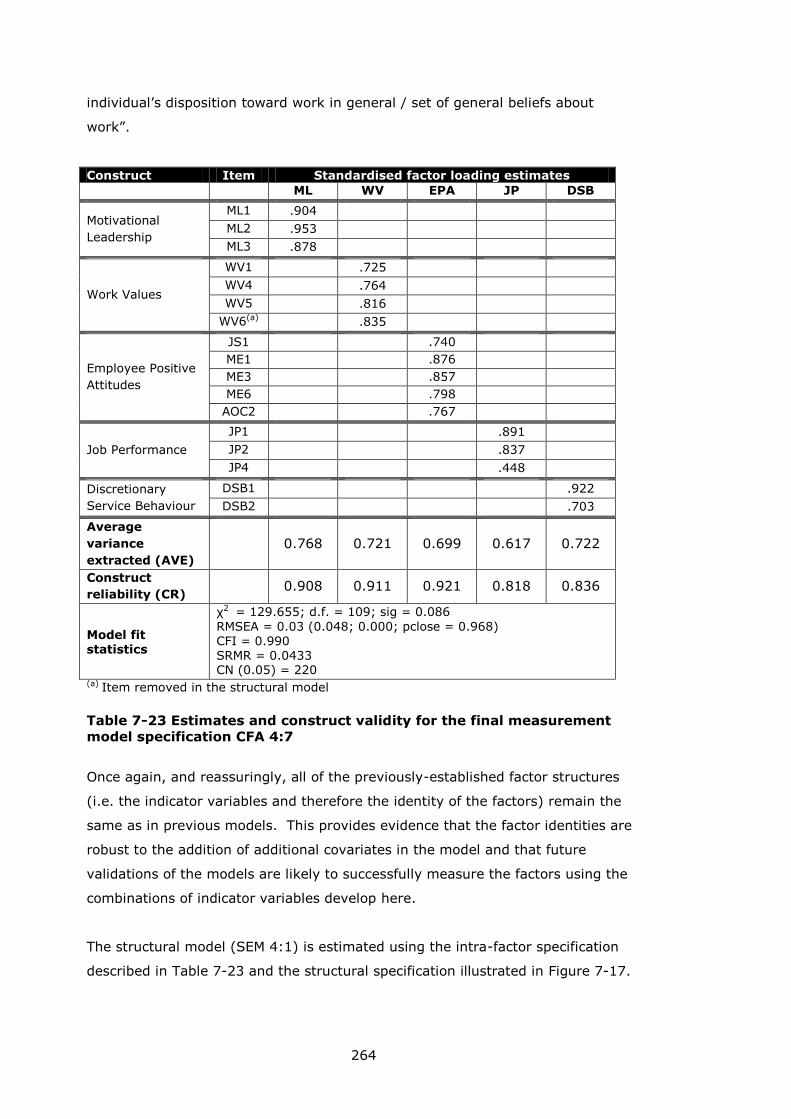
264
individual’s disposition toward work in general / set of general beliefs about
work”.
Construct Item Standardised factor loading estimates
ML WV EPA JP DSB
Motivational
Leadership
ML1 .904
ML2 .953
ML3 .878
Work Values
WV1 .725
WV4 .764
WV5 .816
WV6(a) .835
Employee Positive
Attitudes
JS1 .740
ME1 .876
ME3 .857
ME6 .798
AOC2 .767
Job Performance
JP1 .891
JP2 .837
JP4 .448
Discretionary
Service Behaviour
DSB1 .922
DSB2 .703
Average
variance
extracted (AVE)
0.768 0.721 0.699 0.617 0.722
Construct
reliability (CR) 0.908 0.911 0.921 0.818 0.836
Model fit statistics
χ2 = 129.655; d.f. = 109; sig = 0.086
RMSEA = 0.03 (0.048; 0.000; pclose = 0.968) CFI = 0.990 SRMR = 0.0433 CN (0.05) = 220
(a) Item removed in the structural model
Table 7-23 Estimates and construct validity for the final measurement
model specification CFA 4:7
Once again, and reassuringly, all of the previously-established factor structures
(i.e. the indicator variables and therefore the identity of the factors) remain the
same as in previous models. This provides evidence that the factor identities are
robust to the addition of additional covariates in the model and that future
validations of the models are likely to successfully measure the factors using the
combinations of indicator variables develop here.
The structural model (SEM 4:1) is estimated using the intra-factor specification
described in Table 7-23 and the structural specification illustrated in Figure 7-17.
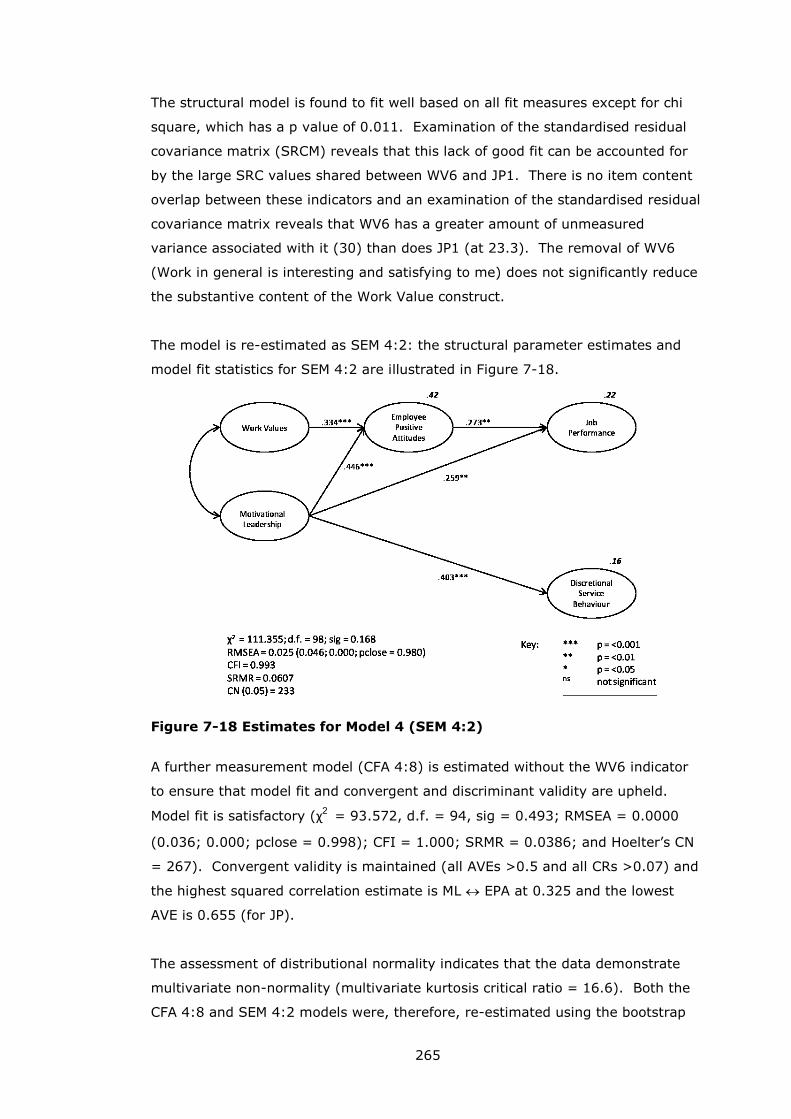
265
The structural model is found to fit well based on all fit measures except for chi
square, which has a p value of 0.011. Examination of the standardised residual
covariance matrix (SRCM) reveals that this lack of good fit can be accounted for
by the large SRC values shared between WV6 and JP1. There is no item content
overlap between these indicators and an examination of the standardised residual
covariance matrix reveals that WV6 has a greater amount of unmeasured
variance associated with it (30) than does JP1 (at 23.3). The removal of WV6
(Work in general is interesting and satisfying to me) does not significantly reduce
the substantive content of the Work Value construct.
The model is re-estimated as SEM 4:2: the structural parameter estimates and
model fit statistics for SEM 4:2 are illustrated in Figure 7-18.
Figure 7-18 Estimates for Model 4 (SEM 4:2)
A further measurement model (CFA 4:8) is estimated without the WV6 indicator
to ensure that model fit and convergent and discriminant validity are upheld.
Model fit is satisfactory (χ2 = 93.572, d.f. = 94, sig = 0.493; RMSEA = 0.0000
(0.036; 0.000; pclose = 0.998); CFI = 1.000; SRMR = 0.0386; and Hoelter’s CN
= 267). Convergent validity is maintained (all AVEs >0.5 and all CRs >0.07) and
the highest squared correlation estimate is ML EPA at 0.325 and the lowest
AVE is 0.655 (for JP).
The assessment of distributional normality indicates that the data demonstrate
multivariate non-normality (multivariate kurtosis critical ratio = 16.6). Both the
CFA 4:8 and SEM 4:2 models were, therefore, re-estimated using the bootstrap
266
method. All of the model parameters were found to be robust to the non-normal
multivariate distribution as described in Appendix IV.
Model 4 mediation and total effects
A constrained model with no direct effect (ML→JP) was estimated (SEM 4:21).
The chi square difference (Δχ2) between models SEM 4:2 (χ2
= 120.67) and SEM
4:21 (χ2 = 111.355) was calculated at 9.315. With 1 degree of freedom this
yields a p value of 0.0023. Accordingly, (because p <0.01) full mediation of the
ML→JP path by EPA is not supported.
To determine whether or not Employee Positive Attitudes (EPA) has a partial
mediation effect on the ML→JP relationship it is necessary to estimate a third
model (SEM 4:22) in which there is no indirect effect (EPA→JP) on Job
Performance (JP).
The structural coefficient values for the ML→JP path are now compared between
model SEM 4:22 and the hypothesised model SEM 4:2. In the constrained model
(SEM 4:22) the value (effect size) for the ML→JP path is 0.424 while in the
hypothesised model (SEM 4:2) this value is 0.259. When comparing the ML→JP
path between the constrained model (SEM 4:22) with the hypothesised model,
because ML→JP is statistically significant in both models but the parameter
estimate is reduced in size in the hypothesised model (0.424 in SEM 4:22 and
0.259 in SEM 4:2) we can conclude that partial mediation is supported (see Hair
et al. 2006: 867).
Table 7-24 describes the total (combined direct and indirect) effects for Model 4
(SEM 4:2). In comparison to Model 3b, the total effect of ML on EPA has dropped
considerably (from 0.574 to 0.446), the total effect of ML on JP is slightly down
(from 0.415 to 0.380) and ML→DSB is much the same (0.403 versus 0.401 in
Model 3). Also remaining at a similar level is the EPA→JP path (0.273 versus
0.267 in Model 3).
In Model 4, there is a second mediation effect to be tested – that is, the
hypothesised full mediation of the WV→JP path by EPA. To confirm the full
mediation effect of EPA - following Hair et al.’s guidelines (2006: top of p. 868) –
a direct path between WV and JP is estimated. Because this path is not
significant (p = 0.139) the full mediation of the WV→JP path by EPA is supported.
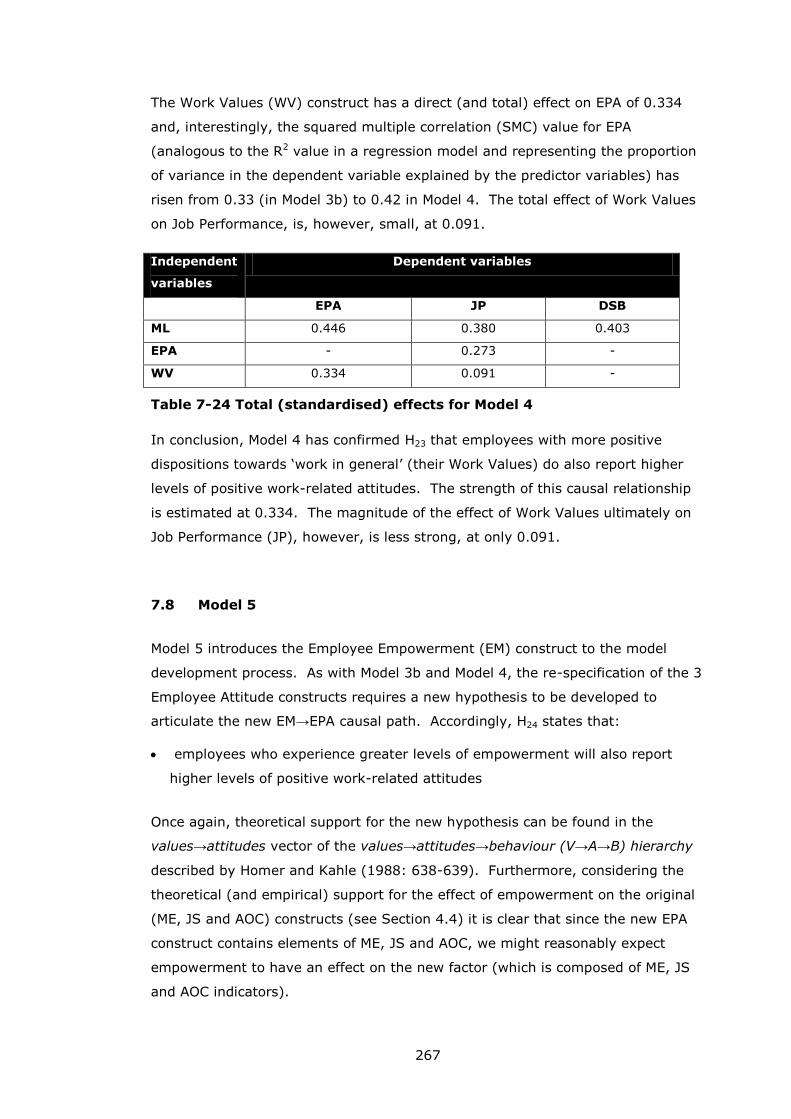
267
The Work Values (WV) construct has a direct (and total) effect on EPA of 0.334
and, interestingly, the squared multiple correlation (SMC) value for EPA
(analogous to the R2 value in a regression model and representing the proportion
of variance in the dependent variable explained by the predictor variables) has
risen from 0.33 (in Model 3b) to 0.42 in Model 4. The total effect of Work Values
on Job Performance, is, however, small, at 0.091.
Independent
variables
Dependent variables
EPA JP DSB
ML 0.446 0.380 0.403
EPA - 0.273 -
WV 0.334 0.091 -
Table 7-24 Total (standardised) effects for Model 4
In conclusion, Model 4 has confirmed H23 that employees with more positive
dispositions towards ‘work in general’ (their Work Values) do also report higher
levels of positive work-related attitudes. The strength of this causal relationship
is estimated at 0.334. The magnitude of the effect of Work Values ultimately on
Job Performance (JP), however, is less strong, at only 0.091.
7.8 Model 5
Model 5 introduces the Employee Empowerment (EM) construct to the model
development process. As with Model 3b and Model 4, the re-specification of the 3
Employee Attitude constructs requires a new hypothesis to be developed to
articulate the new EM→EPA causal path. Accordingly, H24 states that:
employees who experience greater levels of empowerment will also report
higher levels of positive work-related attitudes
Once again, theoretical support for the new hypothesis can be found in the
values→attitudes vector of the values→attitudes→behaviour (V→A→B) hierarchy
described by Homer and Kahle (1988: 638-639). Furthermore, considering the
theoretical (and empirical) support for the effect of empowerment on the original
(ME, JS and AOC) constructs (see Section 4.4) it is clear that since the new EPA
construct contains elements of ME, JS and AOC, we might reasonably expect
empowerment to have an effect on the new factor (which is composed of ME, JS
and AOC indicators).
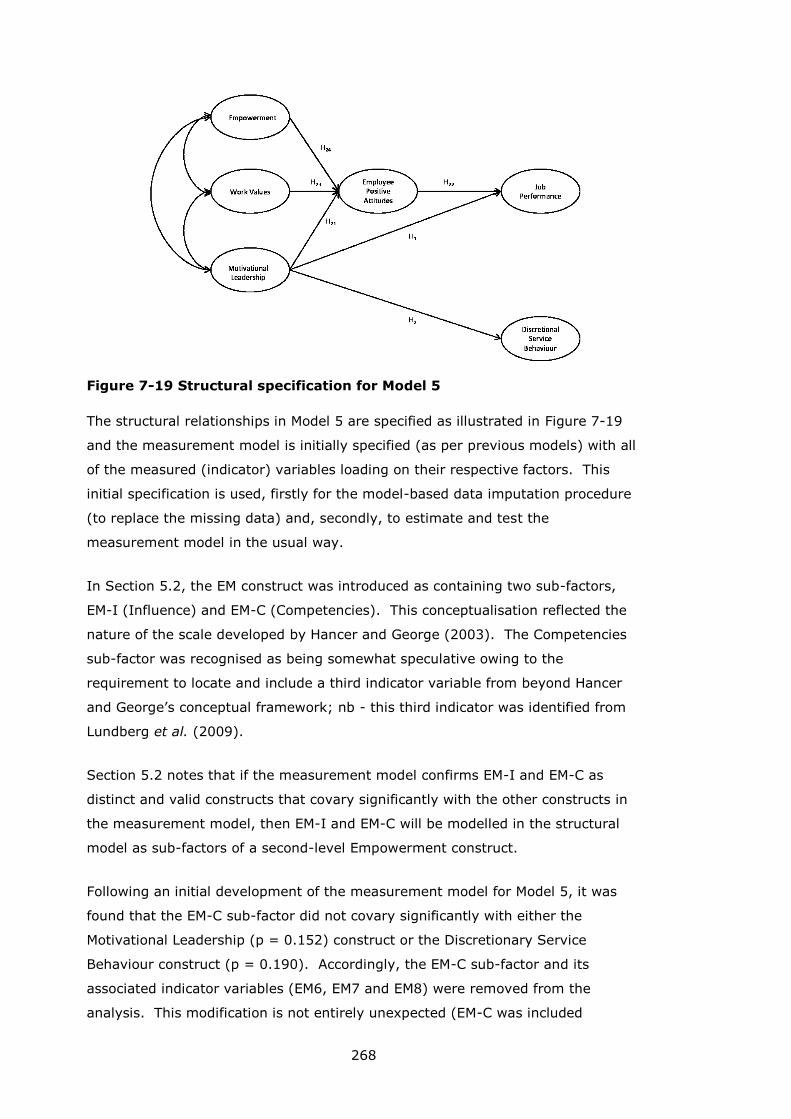
268
Figure 7-19 Structural specification for Model 5
The structural relationships in Model 5 are specified as illustrated in Figure 7-19
and the measurement model is initially specified (as per previous models) with all
of the measured (indicator) variables loading on their respective factors. This
initial specification is used, firstly for the model-based data imputation procedure
(to replace the missing data) and, secondly, to estimate and test the
measurement model in the usual way.
In Section 5.2, the EM construct was introduced as containing two sub-factors,
EM-I (Influence) and EM-C (Competencies). This conceptualisation reflected the
nature of the scale developed by Hancer and George (2003). The Competencies
sub-factor was recognised as being somewhat speculative owing to the
requirement to locate and include a third indicator variable from beyond Hancer
and George’s conceptual framework; nb - this third indicator was identified from
Lundberg et al. (2009).
Section 5.2 notes that if the measurement model confirms EM-I and EM-C as
distinct and valid constructs that covary significantly with the other constructs in
the measurement model, then EM-I and EM-C will be modelled in the structural
model as sub-factors of a second-level Empowerment construct.
Following an initial development of the measurement model for Model 5, it was
found that the EM-C sub-factor did not covary significantly with either the
Motivational Leadership (p = 0.152) construct or the Discretionary Service
Behaviour construct (p = 0.190). Accordingly, the EM-C sub-factor and its
associated indicator variables (EM6, EM7 and EM8) were removed from the
analysis. This modification is not entirely unexpected (EM-C was included
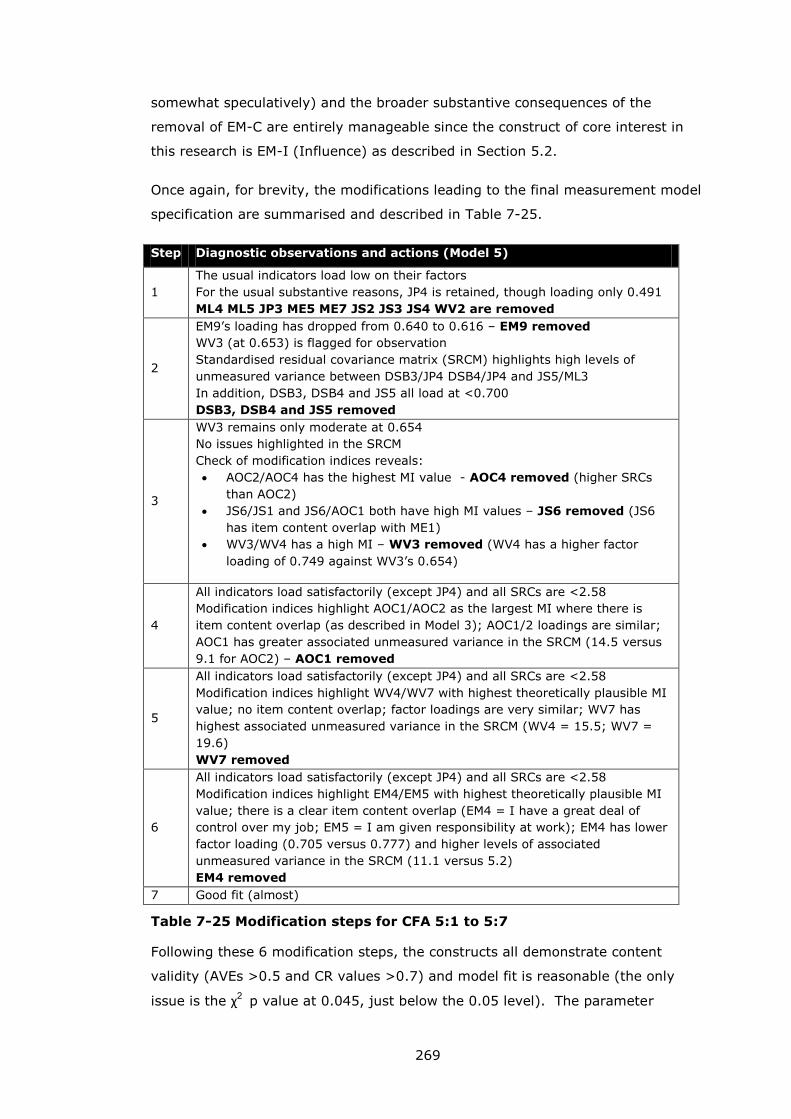
269
somewhat speculatively) and the broader substantive consequences of the
removal of EM-C are entirely manageable since the construct of core interest in
this research is EM-I (Influence) as described in Section 5.2.
Once again, for brevity, the modifications leading to the final measurement model
specification are summarised and described in Table 7-25.
Step Diagnostic observations and actions (Model 5)
1
The usual indicators load low on their factors
For the usual substantive reasons, JP4 is retained, though loading only 0.491
ML4 ML5 JP3 ME5 ME7 JS2 JS3 JS4 WV2 are removed
2
EM9’s loading has dropped from 0.640 to 0.616 – EM9 removed
WV3 (at 0.653) is flagged for observation
Standardised residual covariance matrix (SRCM) highlights high levels of
unmeasured variance between DSB3/JP4 DSB4/JP4 and JS5/ML3
In addition, DSB3, DSB4 and JS5 all load at <0.700
DSB3, DSB4 and JS5 removed
3
WV3 remains only moderate at 0.654
No issues highlighted in the SRCM
Check of modification indices reveals:
AOC2/AOC4 has the highest MI value - AOC4 removed (higher SRCs
than AOC2)
JS6/JS1 and JS6/AOC1 both have high MI values – JS6 removed (JS6
has item content overlap with ME1)
WV3/WV4 has a high MI – WV3 removed (WV4 has a higher factor
loading of 0.749 against WV3’s 0.654)
4
All indicators load satisfactorily (except JP4) and all SRCs are <2.58
Modification indices highlight AOC1/AOC2 as the largest MI where there is
item content overlap (as described in Model 3); AOC1/2 loadings are similar;
AOC1 has greater associated unmeasured variance in the SRCM (14.5 versus
9.1 for AOC2) – AOC1 removed
5
All indicators load satisfactorily (except JP4) and all SRCs are <2.58
Modification indices highlight WV4/WV7 with highest theoretically plausible MI
value; no item content overlap; factor loadings are very similar; WV7 has
highest associated unmeasured variance in the SRCM (WV4 = 15.5; WV7 =
19.6)
WV7 removed
6
All indicators load satisfactorily (except JP4) and all SRCs are <2.58
Modification indices highlight EM4/EM5 with highest theoretically plausible MI
value; there is a clear item content overlap (EM4 = I have a great deal of
control over my job; EM5 = I am given responsibility at work); EM4 has lower
factor loading (0.705 versus 0.777) and higher levels of associated
unmeasured variance in the SRCM (11.1 versus 5.2)
EM4 removed
7 Good fit (almost)
Table 7-25 Modification steps for CFA 5:1 to 5:7
Following these 6 modification steps, the constructs all demonstrate content
validity (AVEs >0.5 and CR values >0.7) and model fit is reasonable (the only
issue is the χ2 p value at 0.045, just below the 0.05 level). The parameter
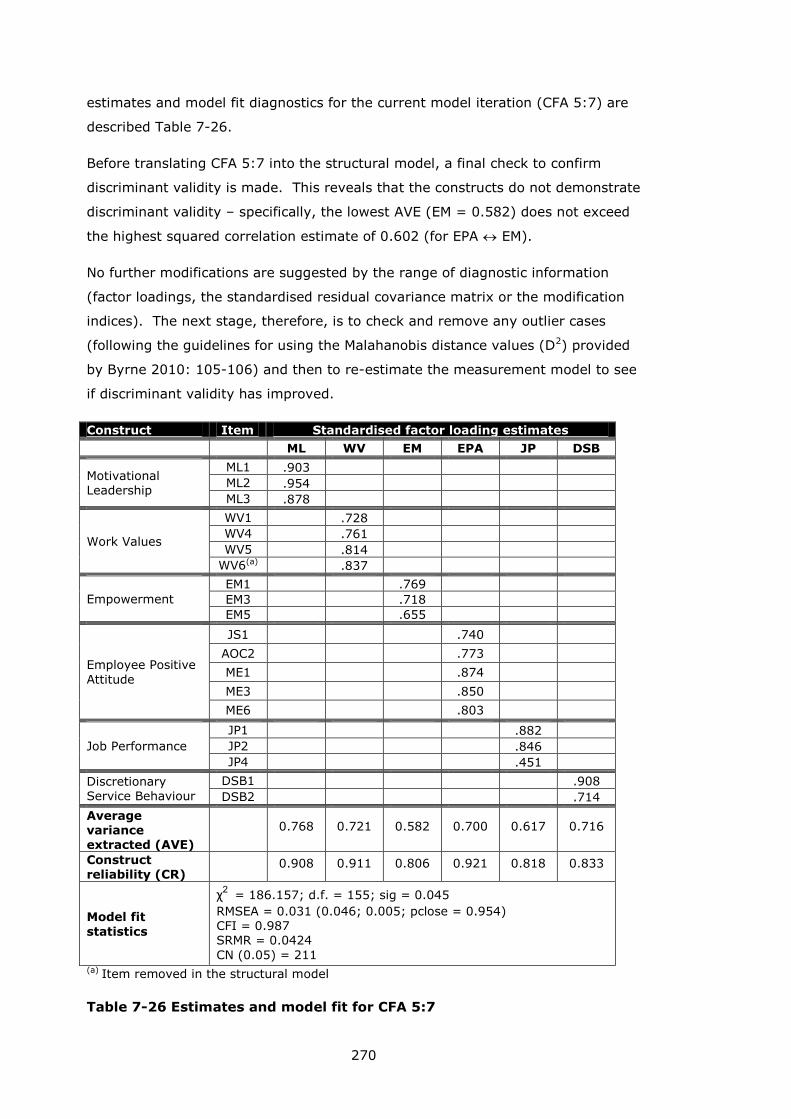
270
estimates and model fit diagnostics for the current model iteration (CFA 5:7) are
described Table 7-26.
Before translating CFA 5:7 into the structural model, a final check to confirm
discriminant validity is made. This reveals that the constructs do not demonstrate
discriminant validity – specifically, the lowest AVE (EM = 0.582) does not exceed
the highest squared correlation estimate of 0.602 (for EPA EM).
No further modifications are suggested by the range of diagnostic information
(factor loadings, the standardised residual covariance matrix or the modification
indices). The next stage, therefore, is to check and remove any outlier cases
(following the guidelines for using the Malahanobis distance values (D2) provided
by Byrne 2010: 105-106) and then to re-estimate the measurement model to see
if discriminant validity has improved.
Construct Item Standardised factor loading estimates
ML WV EM EPA JP DSB
Motivational Leadership
ML1 .903
ML2 .954
ML3 .878
Work Values
WV1 .728
WV4 .761
WV5 .814
WV6(a) .837
Empowerment
EM1 .769
EM3 .718
EM5 .655
Employee Positive
Attitude
JS1 .740
AOC2 .773
ME1 .874
ME3 .850
ME6 .803
Job Performance
JP1 .882
JP2 .846
JP4 .451
Discretionary Service Behaviour
DSB1 .908
DSB2 .714
Average variance extracted (AVE)
0.768 0.721 0.582 0.700 0.617 0.716
Construct reliability (CR)
0.908 0.911 0.806 0.921 0.818 0.833
Model fit
statistics
χ2 = 186.157; d.f. = 155; sig = 0.045
RMSEA = 0.031 (0.046; 0.005; pclose = 0.954) CFI = 0.987 SRMR = 0.0424
CN (0.05) = 211 (a) Item removed in the structural model
Table 7-26 Estimates and model fit for CFA 5:7
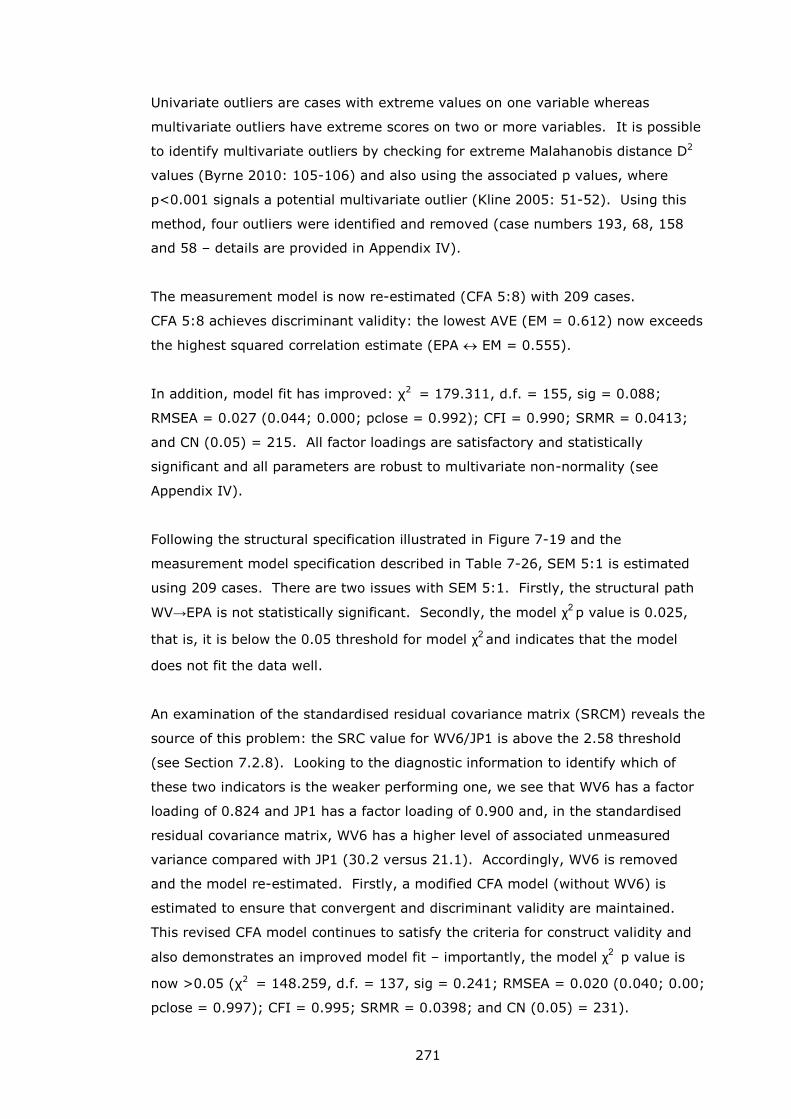
271
Univariate outliers are cases with extreme values on one variable whereas
multivariate outliers have extreme scores on two or more variables. It is possible
to identify multivariate outliers by checking for extreme Malahanobis distance D2
values (Byrne 2010: 105-106) and also using the associated p values, where
p<0.001 signals a potential multivariate outlier (Kline 2005: 51-52). Using this
method, four outliers were identified and removed (case numbers 193, 68, 158
and 58 – details are provided in Appendix IV).
The measurement model is now re-estimated (CFA 5:8) with 209 cases.
CFA 5:8 achieves discriminant validity: the lowest AVE (EM = 0.612) now exceeds
the highest squared correlation estimate (EPA EM = 0.555).
In addition, model fit has improved: χ2 = 179.311, d.f. = 155, sig = 0.088;
RMSEA = 0.027 (0.044; 0.000; pclose = 0.992); CFI = 0.990; SRMR = 0.0413;
and CN (0.05) = 215. All factor loadings are satisfactory and statistically
significant and all parameters are robust to multivariate non-normality (see
Appendix IV).
Following the structural specification illustrated in Figure 7-19 and the
measurement model specification described in Table 7-26, SEM 5:1 is estimated
using 209 cases. There are two issues with SEM 5:1. Firstly, the structural path
WV→EPA is not statistically significant. Secondly, the model χ2 p value is 0.025,
that is, it is below the 0.05 threshold for model χ2 and indicates that the model
does not fit the data well.
An examination of the standardised residual covariance matrix (SRCM) reveals the
source of this problem: the SRC value for WV6/JP1 is above the 2.58 threshold
(see Section 7.2.8). Looking to the diagnostic information to identify which of
these two indicators is the weaker performing one, we see that WV6 has a factor
loading of 0.824 and JP1 has a factor loading of 0.900 and, in the standardised
residual covariance matrix, WV6 has a higher level of associated unmeasured
variance compared with JP1 (30.2 versus 21.1). Accordingly, WV6 is removed
and the model re-estimated. Firstly, a modified CFA model (without WV6) is
estimated to ensure that convergent and discriminant validity are maintained.
This revised CFA model continues to satisfy the criteria for construct validity and
also demonstrates an improved model fit – importantly, the model χ2 p value is
now >0.05 (χ2 = 148.259, d.f. = 137, sig = 0.241; RMSEA = 0.020 (0.040; 0.00;
pclose = 0.997); CFI = 0.995; SRMR = 0.0398; and CN (0.05) = 231).
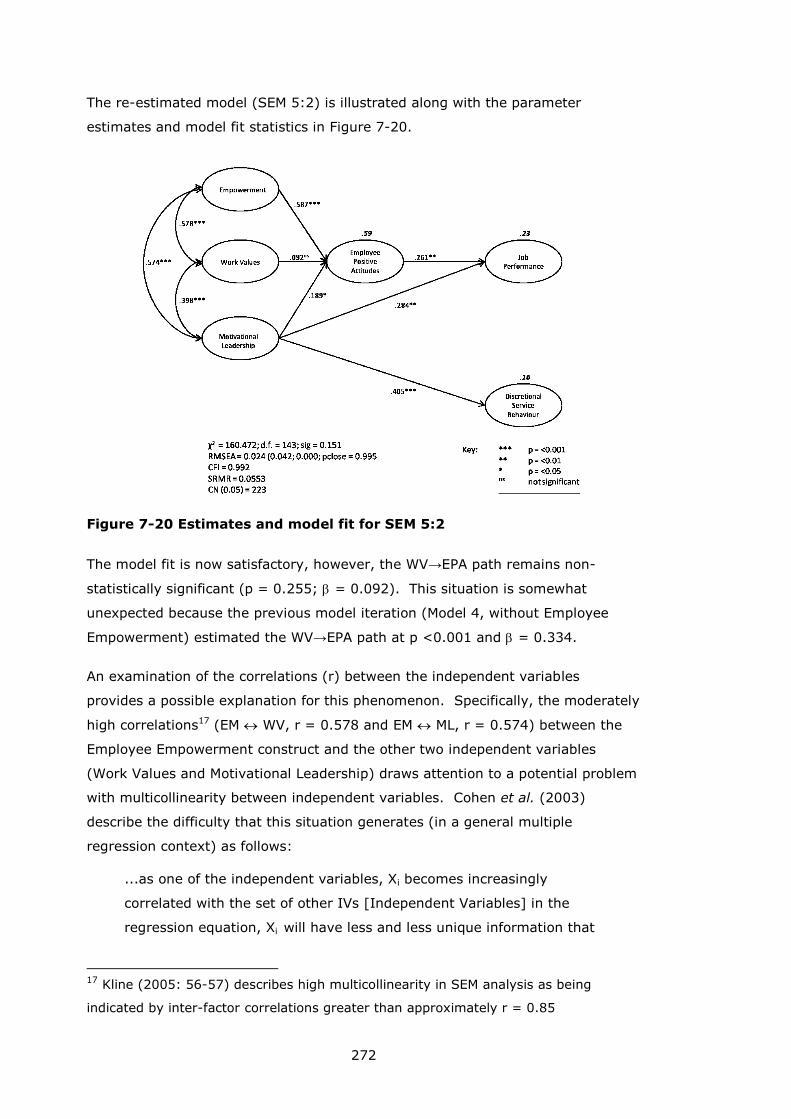
272
The re-estimated model (SEM 5:2) is illustrated along with the parameter
estimates and model fit statistics in Figure 7-20.
Figure 7-20 Estimates and model fit for SEM 5:2
The model fit is now satisfactory, however, the WV→EPA path remains non-
statistically significant (p = 0.255; = 0.092). This situation is somewhat
unexpected because the previous model iteration (Model 4, without Employee
Empowerment) estimated the WV→EPA path at p <0.001 and = 0.334.
An examination of the correlations (r) between the independent variables
provides a possible explanation for this phenomenon. Specifically, the moderately
high correlations17 (EM WV, r = 0.578 and EM ML, r = 0.574) between the
Employee Empowerment construct and the other two independent variables
(Work Values and Motivational Leadership) draws attention to a potential problem
with multicollinearity between independent variables. Cohen et al. (2003)
describe the difficulty that this situation generates (in a general multiple
regression context) as follows:
...as one of the independent variables, Xi becomes increasingly
correlated with the set of other IVs [Independent Variables] in the
regression equation, Xi will have less and less unique information that
17 Kline (2005: 56-57) describes high multicollinearity in SEM analysis as being
indicated by inter-factor correlations greater than approximately r = 0.85
273
it can potentially contribute to the prediction of Y [the dependent
variable]
(Cohen et al. 2003: 419)
Cohen et al. go on to describe how, under these conditions, individual regression
coefficients can change in magnitude, making them difficult to interpret.
Elsewhere, Hair et al. (2006) describe how the presence of multicollinearity:
...creates “shared” variance between variables, thus decreasing the
ability to predict the dependent measure as well as ascertain the
relative roles of each independent variable
(Hair et al. 2006: 228)
Hair et al. (2006:228) describe two implications of multicollinearity that concur
with the current situation:
as multicollinearity increases, the ability to demonstrate that the estimated
regression coefficients are significantly different from zero can become
markedly impacted due to increases in the standard error; and
high degrees of multicollinearity can also result in regression coefficients being
incorrectly estimated.
Examining the correlations between independent variables (as undertaken above)
is a useful initial step in diagnosing multicollinearity, however, an absence of high
correlations does not confer that multicollinearity is not present (Hair et al. 2006:
227). A number of diagnostic procedures are available to identify and assess
multicollinearity, however, these are not available in the AMOS structural equation
modelling software, nor any other SEM software (McIntosh 2009). Accordingly, to
evaluate the degree of multicollinearity present, the observed variables for each
of three independent variables - Motivational Leadership (ML), Work Values (WV)
and Employee Empowerment (EM) and the relevant dependent variable,
Employee Positive Attitudes (EPA) - were summed to create four summated scale
variables suitable for use in a multiple regression model (SPSS’s regression
procedures can generate multicollinearity diagnostics).
The regression model was specified and estimated using SPSS and the overall
model fit was satisfactory (F = 68.436, d.f. = 3, p < 0.001) with the three
independent variables (ML, WV and EM) accounting for approximately half of the
variance in Employee Positive Attitudes (R2 = 0.496). As with the SE model (SEM
5:2), Employee Empowerment was the most influential predictor with a
274
standardised beta weight of 0.449 (p <0.001), this was followed in magnitude by
Motivational Leadership ( = 0.261, p <0.001) and Work Values ( = 0.139, p
<0.05).
The multicollinearity diagnostics produced by SPSS are the tolerance, the variance
inflation factor (VIF, which is the inverse of the tolerance value) and the condition
index. There are no specific statistical criteria for thresholds for any of these
multicollinearity diagnostics (Cohen et al. 2003: 424-425) and opinions differ
regarding rules of thumb for what is acceptable for each method of ascertaining
the likelihood of multicollinearity.
For VIF, Hair et al. (2006: 230) suggest that values >10 are problematic although
this threshold should be lowered when sample sizes are smaller; Garson (2012)
writes that VIF values >4.0 indicate problems with multicollinearity; and Cohen et
al. (2003: 423), with reference to the >10 rule of thumb, write that “We believe
that this common rule of thumb guideline is too high (lenient) for most behavioral
science applications”.
Regarding the condition index approach to assessing multicollinearity, Cohen et
al. (2003: 424) reiterate the “traditional rule of thumb” that condition index
values >30 “indicate highly severe problems of multicollinearity” - while also
noting that “no strong statistical rationale exists for this choice”. Garson (2012)
writes that condition indices >30 suggest serious collinearity problems and indices
>15 are indicative of possible collinearity problems. The guideline that condition
indices >15 indicate multicollinearity problems is also noted by Belsley (1991,
cited in van Vuuren et al. 2007: 121).
For the regression model estimated with the summated scales, none of the VIF
values exceeds 4 (EM = 1.569, WV = 1.325 and ML = 1.385). However, two
condition indices (one condition index, or dimension, is generated for each
independent and the constant – therefore four in total for this model) exceed 15
(at 15.998 and 17.063 respectively). An examination of the related variance
proportions, following Garson’s (2012) guidelines, reveals that because two
variables (EM and WV) have variance proportions >0.5 (EM = 0.98; WV = 0.72)
on the two dimensions with condition indices >15, then these variables (EM and
275
WV) have a high linear dependence and multicollinearity can be considered a
problem18.
Having employed regression techniques with summated scale variables to identify
collinearity (albeit at an apparently moderate level) between the Employee
Empowerment and Work Values constructs, the next step is to seek a suitable
remedy for this situation.
A number of remedies for multicollinearity are discussed by Cohen et al. (2003:
425-430) including: (i) the combination of independent variables if they are
measuring the same or very similar concepts (p. 426); (ii) the collection of
additional data to increase sample size and improve the precision of the structural
coefficient estimates (p. 427); and (iii) removal of one or more independent
variables (p. 430).
Remedy (i) is not appropriate in this instance because the discriminant validity
estimates from the measurement model (CFA 5:8) confirm that the EM, WV and
ML constructs do indeed measure discrete concepts. Remedy (ii) is recommended
for future research to pursue this analysis using a larger sample. For the current
research, remedy (iii) is followed and the Work Values construct is removed
(because this construct has the non-significant structural coefficient). Remedy
(iii) (removal of one or more independent variable) is also supported, specifically
in an SEM context, by Kline (2005: 57).
The decision to remove the Work Values construct is further supported following
the outcome of a second approach to investigating the issue of the non-significant
WV→EPA path. This second course of action is described as follows.
Following the parsimonious principle (see e.g. Kline 2005: 145-147 and Raykov
and Marcolides 2006: 41-43), which guides researchers to find a parsimonious
model that maintains a satisfactory fit to the data, it is common in SEM analyses
to remove non-significant parameters (see also Byrne 2010: 185).
Removing parameters in this way requires researchers to compare the alternative
‘nested’ models using the chi square difference test (Δχ2) with the objective of
finding “a parsimonious model which fits the data reasonably well” (Kline 2005:
18 NB – Garson (citing Belsley et al. 1980) notes that it is possible to find one
multicollinearity diagnostic (in this case the condition index) indicating a problem while
another (the VIF) does not.
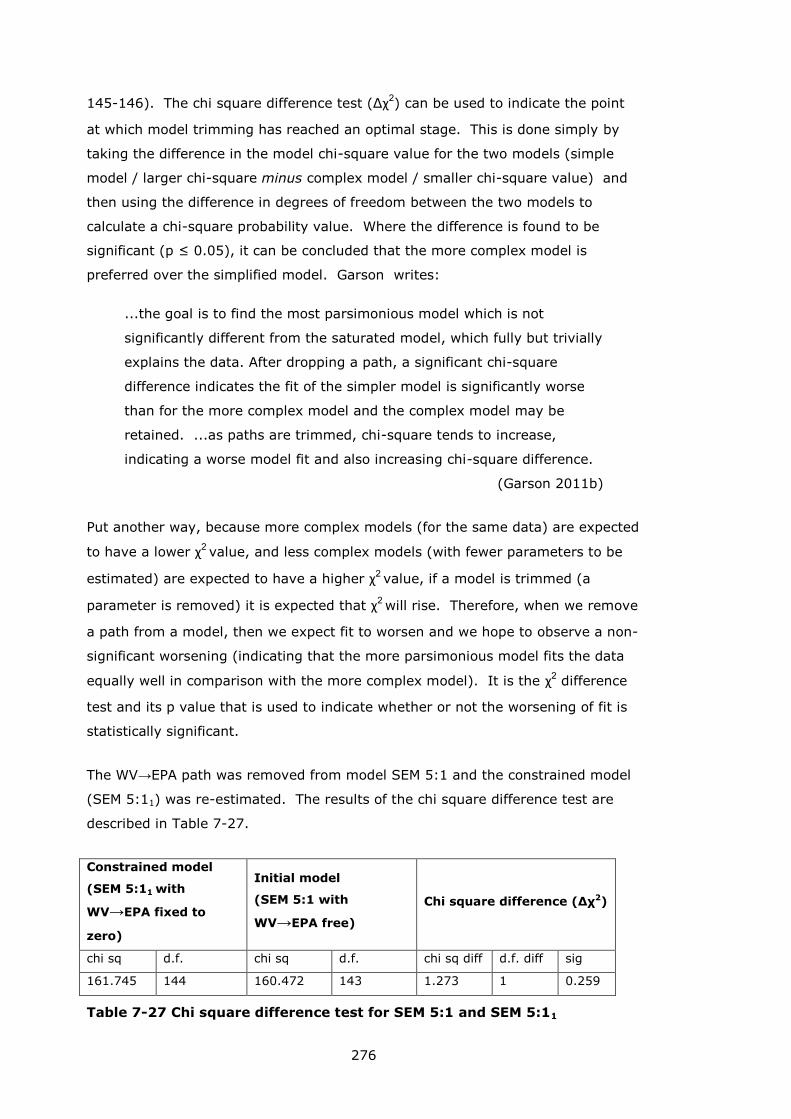
276
145-146). The chi square difference test (Δχ2) can be used to indicate the point
at which model trimming has reached an optimal stage. This is done simply by
taking the difference in the model chi-square value for the two models (simple
model / larger chi-square minus complex model / smaller chi-square value) and
then using the difference in degrees of freedom between the two models to
calculate a chi-square probability value. Where the difference is found to be
significant (p ≤ 0.05), it can be concluded that the more complex model is
preferred over the simplified model. Garson writes:
...the goal is to find the most parsimonious model which is not
significantly different from the saturated model, which fully but trivially
explains the data. After dropping a path, a significant chi-square
difference indicates the fit of the simpler model is significantly worse
than for the more complex model and the complex model may be
retained. ...as paths are trimmed, chi-square tends to increase,
indicating a worse model fit and also increasing chi-square difference.
(Garson 2011b)
Put another way, because more complex models (for the same data) are expected
to have a lower χ2 value, and less complex models (with fewer parameters to be
estimated) are expected to have a higher χ2 value, if a model is trimmed (a
parameter is removed) it is expected that χ2 will rise. Therefore, when we remove
a path from a model, then we expect fit to worsen and we hope to observe a non-
significant worsening (indicating that the more parsimonious model fits the data
equally well in comparison with the more complex model). It is the χ2 difference
test and its p value that is used to indicate whether or not the worsening of fit is
statistically significant.
The WV→EPA path was removed from model SEM 5:1 and the constrained model
(SEM 5:11) was re-estimated. The results of the chi square difference test are
described in Table 7-27.
Constrained model
(SEM 5:11 with
WV→EPA fixed to
zero)
Initial model
(SEM 5:1 with
WV→EPA free)
Chi square difference (Δχ2)
chi sq d.f. chi sq d.f. chi sq diff d.f. diff sig
161.745 144 160.472 143 1.273 1 0.259
Table 7-27 Chi square difference test for SEM 5:1 and SEM 5:11
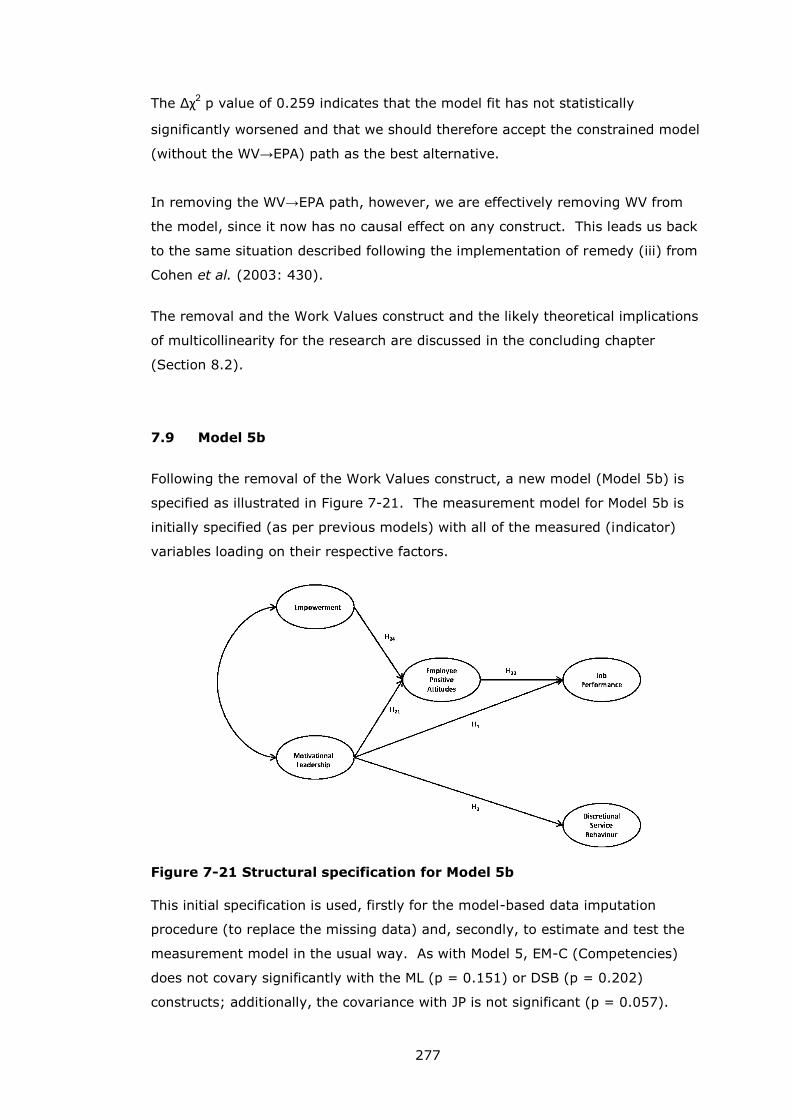
277
The Δχ2 p value of 0.259 indicates that the model fit has not statistically
significantly worsened and that we should therefore accept the constrained model
(without the WV→EPA) path as the best alternative.
In removing the WV→EPA path, however, we are effectively removing WV from
the model, since it now has no causal effect on any construct. This leads us back
to the same situation described following the implementation of remedy (iii) from
Cohen et al. (2003: 430).
The removal and the Work Values construct and the likely theoretical implications
of multicollinearity for the research are discussed in the concluding chapter
(Section 8.2).
7.9 Model 5b
Following the removal of the Work Values construct, a new model (Model 5b) is
specified as illustrated in Figure 7-21. The measurement model for Model 5b is
initially specified (as per previous models) with all of the measured (indicator)
variables loading on their respective factors.
Figure 7-21 Structural specification for Model 5b
This initial specification is used, firstly for the model-based data imputation
procedure (to replace the missing data) and, secondly, to estimate and test the
measurement model in the usual way. As with Model 5, EM-C (Competencies)
does not covary significantly with the ML (p = 0.151) or DSB (p = 0.202)
constructs; additionally, the covariance with JP is not significant (p = 0.057).
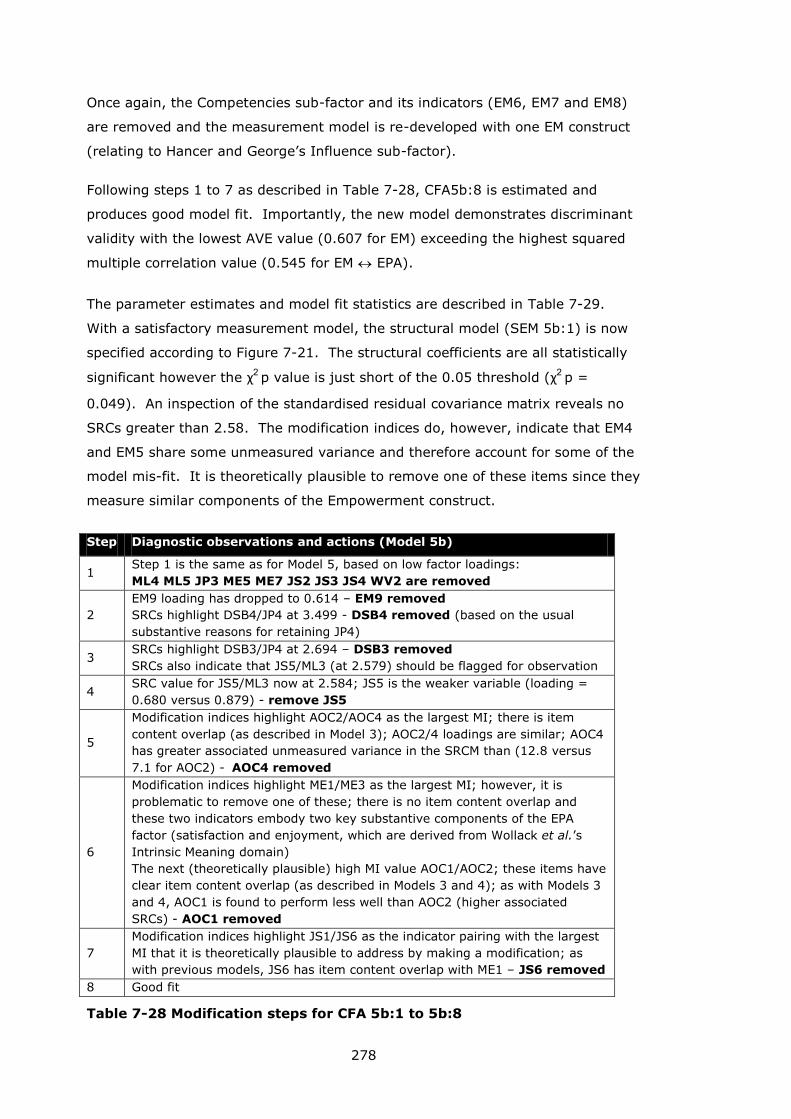
278
Once again, the Competencies sub-factor and its indicators (EM6, EM7 and EM8)
are removed and the measurement model is re-developed with one EM construct
(relating to Hancer and George’s Influence sub-factor).
Following steps 1 to 7 as described in Table 7-28, CFA5b:8 is estimated and
produces good model fit. Importantly, the new model demonstrates discriminant
validity with the lowest AVE value (0.607 for EM) exceeding the highest squared
multiple correlation value (0.545 for EM EPA).
The parameter estimates and model fit statistics are described in Table 7-29.
With a satisfactory measurement model, the structural model (SEM 5b:1) is now
specified according to Figure 7-21. The structural coefficients are all statistically
significant however the χ2 p value is just short of the 0.05 threshold (χ2
p =
0.049). An inspection of the standardised residual covariance matrix reveals no
SRCs greater than 2.58. The modification indices do, however, indicate that EM4
and EM5 share some unmeasured variance and therefore account for some of the
model mis-fit. It is theoretically plausible to remove one of these items since they
measure similar components of the Empowerment construct.
Step Diagnostic observations and actions (Model 5b)
1 Step 1 is the same as for Model 5, based on low factor loadings:
ML4 ML5 JP3 ME5 ME7 JS2 JS3 JS4 WV2 are removed
2
EM9 loading has dropped to 0.614 – EM9 removed
SRCs highlight DSB4/JP4 at 3.499 - DSB4 removed (based on the usual
substantive reasons for retaining JP4)
3 SRCs highlight DSB3/JP4 at 2.694 – DSB3 removed
SRCs also indicate that JS5/ML3 (at 2.579) should be flagged for observation
4 SRC value for JS5/ML3 now at 2.584; JS5 is the weaker variable (loading =
0.680 versus 0.879) - remove JS5
5
Modification indices highlight AOC2/AOC4 as the largest MI; there is item
content overlap (as described in Model 3); AOC2/4 loadings are similar; AOC4
has greater associated unmeasured variance in the SRCM than (12.8 versus
7.1 for AOC2) - AOC4 removed
6
Modification indices highlight ME1/ME3 as the largest MI; however, it is
problematic to remove one of these; there is no item content overlap and
these two indicators embody two key substantive components of the EPA
factor (satisfaction and enjoyment, which are derived from Wollack et al.’s
Intrinsic Meaning domain)
The next (theoretically plausible) high MI value AOC1/AOC2; these items have
clear item content overlap (as described in Models 3 and 4); as with Models 3
and 4, AOC1 is found to perform less well than AOC2 (higher associated
SRCs) - AOC1 removed
7
Modification indices highlight JS1/JS6 as the indicator pairing with the largest
MI that it is theoretically plausible to address by making a modification; as
with previous models, JS6 has item content overlap with ME1 – JS6 removed
8 Good fit
Table 7-28 Modification steps for CFA 5b:1 to 5b:8
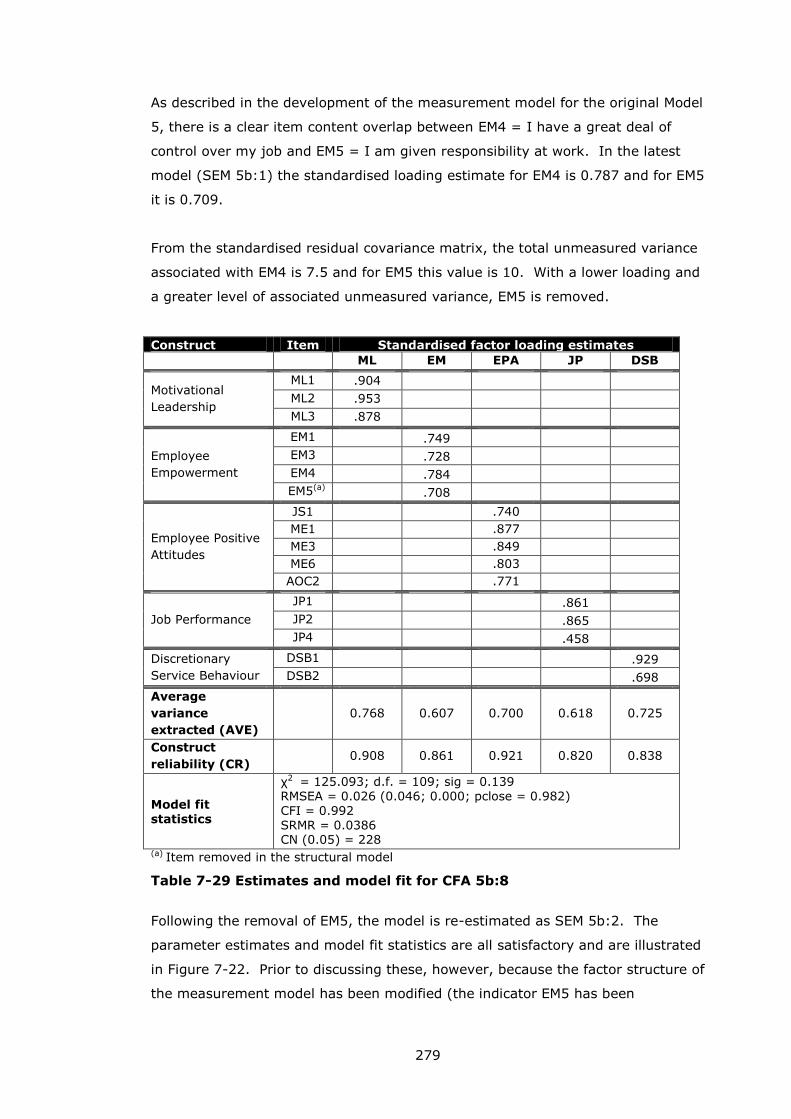
279
As described in the development of the measurement model for the original Model
5, there is a clear item content overlap between EM4 = I have a great deal of
control over my job and EM5 = I am given responsibility at work. In the latest
model (SEM 5b:1) the standardised loading estimate for EM4 is 0.787 and for EM5
it is 0.709.
From the standardised residual covariance matrix, the total unmeasured variance
associated with EM4 is 7.5 and for EM5 this value is 10. With a lower loading and
a greater level of associated unmeasured variance, EM5 is removed.
Construct Item Standardised factor loading estimates
ML EM EPA JP DSB
Motivational
Leadership
ML1 .904
ML2 .953
ML3 .878
Employee
Empowerment
EM1 .749
EM3 .728
EM4 .784
EM5(a) .708
Employee Positive
Attitudes
JS1 .740
ME1 .877
ME3 .849
ME6 .803
AOC2 .771
Job Performance
JP1 .861
JP2 .865
JP4 .458
Discretionary
Service Behaviour
DSB1 .929
DSB2 .698
Average
variance
extracted (AVE)
0.768 0.607 0.700 0.618 0.725
Construct
reliability (CR) 0.908 0.861 0.921 0.820 0.838
Model fit statistics
χ2 = 125.093; d.f. = 109; sig = 0.139 RMSEA = 0.026 (0.046; 0.000; pclose = 0.982) CFI = 0.992 SRMR = 0.0386 CN (0.05) = 228
(a) Item removed in the structural model
Table 7-29 Estimates and model fit for CFA 5b:8
Following the removal of EM5, the model is re-estimated as SEM 5b:2. The
parameter estimates and model fit statistics are all satisfactory and are illustrated
in Figure 7-22. Prior to discussing these, however, because the factor structure of
the measurement model has been modified (the indicator EM5 has been
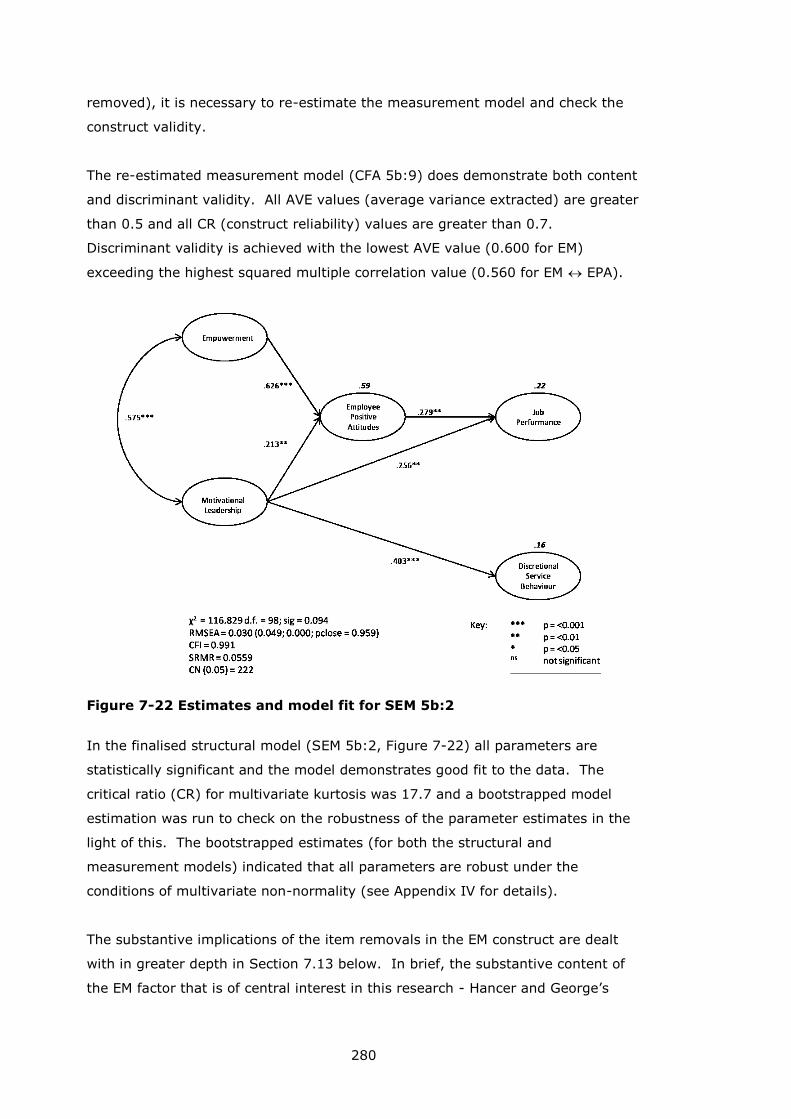
280
removed), it is necessary to re-estimate the measurement model and check the
construct validity.
The re-estimated measurement model (CFA 5b:9) does demonstrate both content
and discriminant validity. All AVE values (average variance extracted) are greater
than 0.5 and all CR (construct reliability) values are greater than 0.7.
Discriminant validity is achieved with the lowest AVE value (0.600 for EM)
exceeding the highest squared multiple correlation value (0.560 for EM EPA).
Figure 7-22 Estimates and model fit for SEM 5b:2
In the finalised structural model (SEM 5b:2, Figure 7-22) all parameters are
statistically significant and the model demonstrates good fit to the data. The
critical ratio (CR) for multivariate kurtosis was 17.7 and a bootstrapped model
estimation was run to check on the robustness of the parameter estimates in the
light of this. The bootstrapped estimates (for both the structural and
measurement models) indicated that all parameters are robust under the
conditions of multivariate non-normality (see Appendix IV for details).
The substantive implications of the item removals in the EM construct are dealt
with in greater depth in Section 7.13 below. In brief, the substantive content of
the EM factor that is of central interest in this research - Hancer and George’s
281
(2003) Influence dimension – remains adequately measured by items EM1, EM3
and EM4.
The correlation between EM and ML is moderately high (r = 0.578, p < 0.001)
and the ML→EPA path has dropped in magnitude from = 0.446 in Model 4 to =
0.213. The moderately high correlation and the change in the ML→EPA structural
coefficient suggests that collinearity between the EM and ML constructs may be
continuing to influence the estimates of EM and ML on EPA. The implications of
this will be discussed further in the final chapter (Section 8.2).
Mediator and total effects for Model 5b
Testing the mediator effect of EPA was carried out in the same way as with
previous models and confirmed that EPA acts as a partial mediator between ML
and JP.
A constrained model with no direct effect (ML→JP) was estimated (SEM 5:21).
The chi square difference (Δχ2) between models SEM 5:2 (χ2
= 125.182) and SEM
5:21 (χ2 = 116.829) was calculated at 8.353. With 1 degree of freedom this
yields a p value of 0.0039. Accordingly, (because p <0.01) full mediation of the
ML→JP path by EPA is not supported.
To determine whether or not Employee Positive Attitudes (EPA) has a partial
mediation effect on the ML→JP relationship it is necessary to estimate a third
model (SEM 5:22) in which there is no indirect effect (EPA→JP) on Job
Performance (JP).
The structural coefficient values for the ML→JP path are now compared between
model SEM 5:22 and the hypothesised model SEM 5:2. In the constrained model
(SEM 5:22) the value (effect size) for the ML→JP path is 0.424 while in the
hypothesised model (SEM 5:2) this value is 0.256. When comparing the ML→JP
path between the constrained model (SEM 5:22) with the hypothesised model,
because ML→JP is statistically significant in both but reduced in size in the
hypothesised model (0.424 in SEM 5:22 and 0.256 in SEM 5:2) we can conclude
that partial mediation is supported (see Hair et al. 2006: 867).
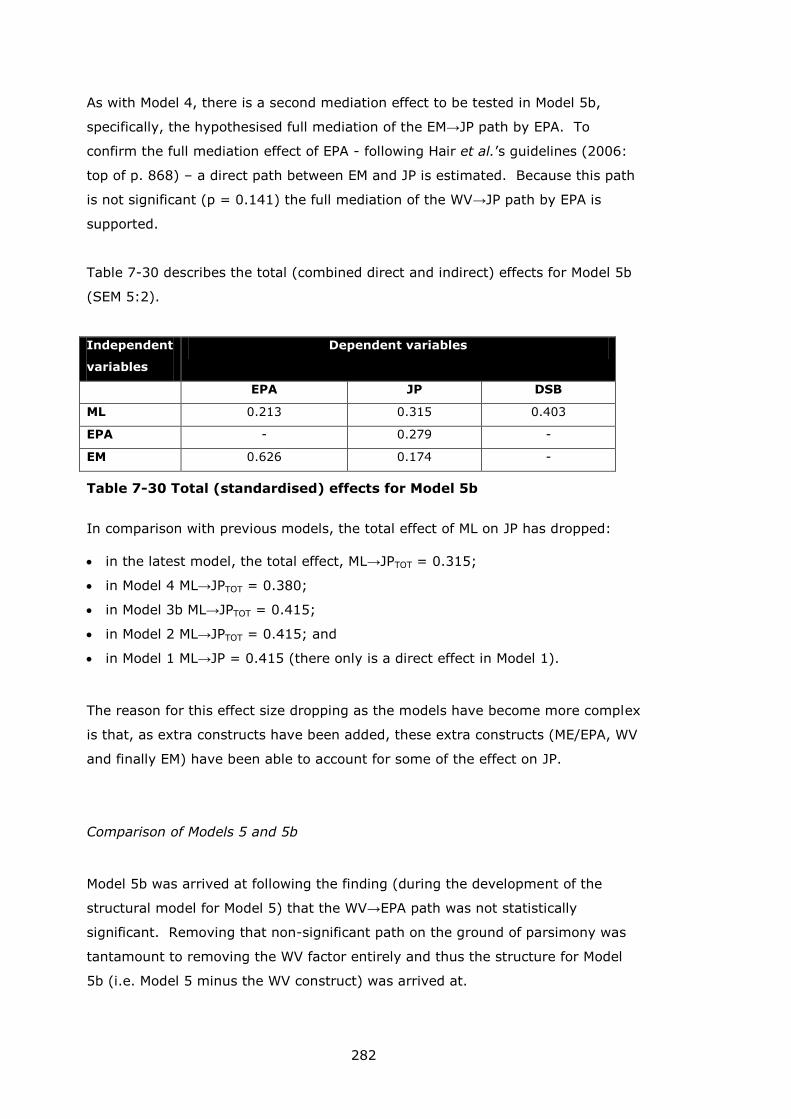
282
As with Model 4, there is a second mediation effect to be tested in Model 5b,
specifically, the hypothesised full mediation of the EM→JP path by EPA. To
confirm the full mediation effect of EPA - following Hair et al.’s guidelines (2006:
top of p. 868) – a direct path between EM and JP is estimated. Because this path
is not significant (p = 0.141) the full mediation of the WV→JP path by EPA is
supported.
Table 7-30 describes the total (combined direct and indirect) effects for Model 5b
(SEM 5:2).
Independent
variables
Dependent variables
EPA JP DSB
ML 0.213 0.315 0.403
EPA - 0.279 -
EM 0.626 0.174 -
Table 7-30 Total (standardised) effects for Model 5b
In comparison with previous models, the total effect of ML on JP has dropped:
in the latest model, the total effect, ML→JPTOT = 0.315;
in Model 4 ML→JPTOT = 0.380;
in Model 3b ML→JPTOT = 0.415;
in Model 2 ML→JPTOT = 0.415; and
in Model 1 ML→JP = 0.415 (there only is a direct effect in Model 1).
The reason for this effect size dropping as the models have become more complex
is that, as extra constructs have been added, these extra constructs (ME/EPA, WV
and finally EM) have been able to account for some of the effect on JP.
Comparison of Models 5 and 5b
Model 5b was arrived at following the finding (during the development of the
structural model for Model 5) that the WV→EPA path was not statistically
significant. Removing that non-significant path on the ground of parsimony was
tantamount to removing the WV factor entirely and thus the structure for Model
5b (i.e. Model 5 minus the WV construct) was arrived at.
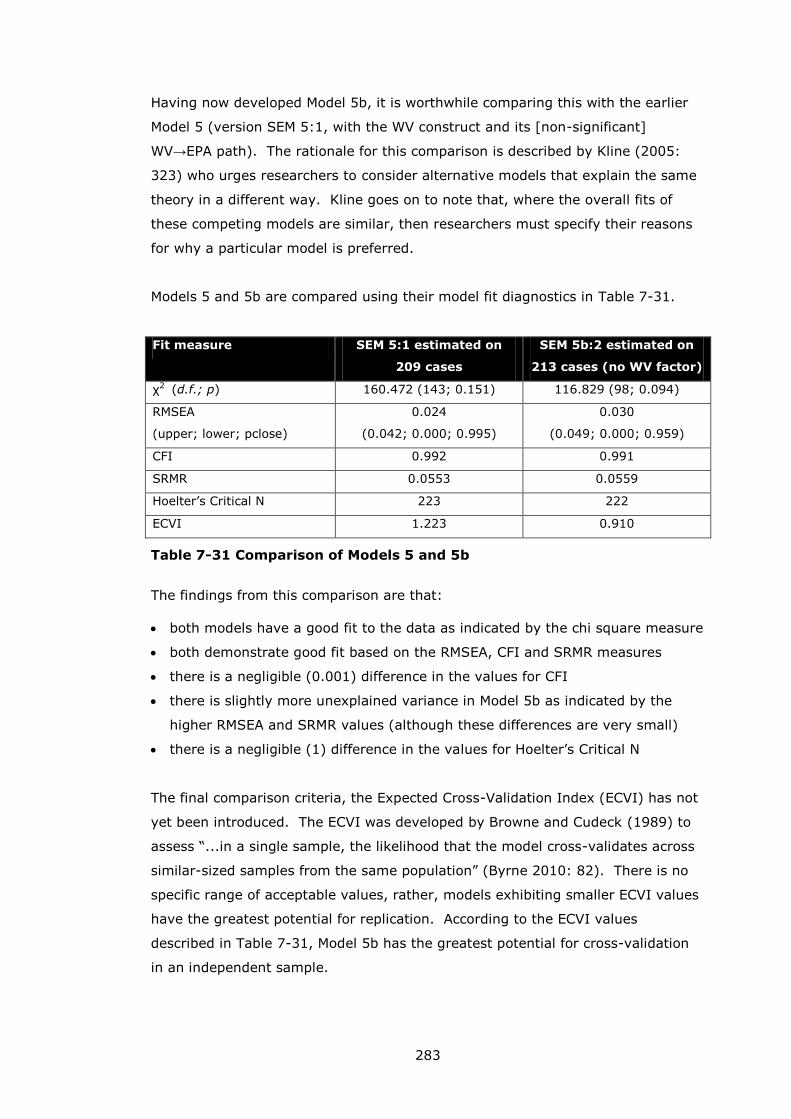
283
Having now developed Model 5b, it is worthwhile comparing this with the earlier
Model 5 (version SEM 5:1, with the WV construct and its [non-significant]
WV→EPA path). The rationale for this comparison is described by Kline (2005:
323) who urges researchers to consider alternative models that explain the same
theory in a different way. Kline goes on to note that, where the overall fits of
these competing models are similar, then researchers must specify their reasons
for why a particular model is preferred.
Models 5 and 5b are compared using their model fit diagnostics in Table 7-31.
Fit measure SEM 5:1 estimated on
209 cases
SEM 5b:2 estimated on
213 cases (no WV factor)
χ2 (d.f.; p) 160.472 (143; 0.151) 116.829 (98; 0.094)
RMSEA
(upper; lower; pclose)
0.024
(0.042; 0.000; 0.995)
0.030
(0.049; 0.000; 0.959)
CFI 0.992 0.991
SRMR 0.0553 0.0559
Hoelter’s Critical N 223 222
ECVI 1.223 0.910
Table 7-31 Comparison of Models 5 and 5b
The findings from this comparison are that:
both models have a good fit to the data as indicated by the chi square measure
both demonstrate good fit based on the RMSEA, CFI and SRMR measures
there is a negligible (0.001) difference in the values for CFI
there is slightly more unexplained variance in Model 5b as indicated by the
higher RMSEA and SRMR values (although these differences are very small)
there is a negligible (1) difference in the values for Hoelter’s Critical N
The final comparison criteria, the Expected Cross-Validation Index (ECVI) has not
yet been introduced. The ECVI was developed by Browne and Cudeck (1989) to
assess “...in a single sample, the likelihood that the model cross-validates across
similar-sized samples from the same population” (Byrne 2010: 82). There is no
specific range of acceptable values, rather, models exhibiting smaller ECVI values
have the greatest potential for replication. According to the ECVI values
described in Table 7-31, Model 5b has the greatest potential for cross-validation
in an independent sample.
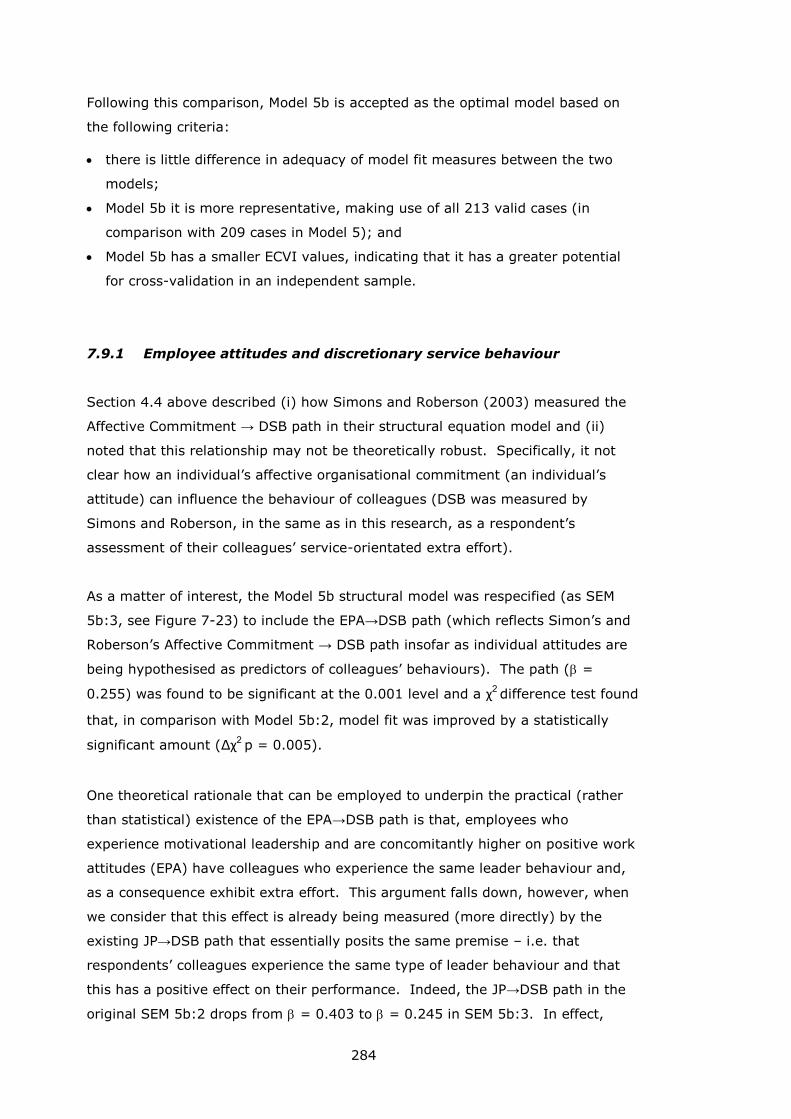
284
Following this comparison, Model 5b is accepted as the optimal model based on
the following criteria:
there is little difference in adequacy of model fit measures between the two
models;
Model 5b it is more representative, making use of all 213 valid cases (in
comparison with 209 cases in Model 5); and
Model 5b has a smaller ECVI values, indicating that it has a greater potential
for cross-validation in an independent sample.
7.9.1 Employee attitudes and discretionary service behaviour
Section 4.4 above described (i) how Simons and Roberson (2003) measured the
Affective Commitment → DSB path in their structural equation model and (ii)
noted that this relationship may not be theoretically robust. Specifically, it not
clear how an individual’s affective organisational commitment (an individual’s
attitude) can influence the behaviour of colleagues (DSB was measured by
Simons and Roberson, in the same as in this research, as a respondent’s
assessment of their colleagues’ service-orientated extra effort).
As a matter of interest, the Model 5b structural model was respecified (as SEM
5b:3, see Figure 7-23) to include the EPA→DSB path (which reflects Simon’s and
Roberson’s Affective Commitment → DSB path insofar as individual attitudes are
being hypothesised as predictors of colleagues’ behaviours). The path ( =
0.255) was found to be significant at the 0.001 level and a χ2 difference test found
that, in comparison with Model 5b:2, model fit was improved by a statistically
significant amount (Δχ2 p = 0.005).
One theoretical rationale that can be employed to underpin the practical (rather
than statistical) existence of the EPA→DSB path is that, employees who
experience motivational leadership and are concomitantly higher on positive work
attitudes (EPA) have colleagues who experience the same leader behaviour and,
as a consequence exhibit extra effort. This argument falls down, however, when
we consider that this effect is already being measured (more directly) by the
existing JP→DSB path that essentially posits the same premise – i.e. that
respondents’ colleagues experience the same type of leader behaviour and that
this has a positive effect on their performance. Indeed, the JP→DSB path in the
original SEM 5b:2 drops from = 0.403 to = 0.245 in SEM 5b:3. In effect,
285
what is being witnessed by this respecification is the transference of some of the
direct ML→DSB effect via the EPA construct.
Figure 7-23 SEM 5b:3 with the EPA→DSB path
The inclusion of the EPA→DSB path does bring another effect into play, however:
there is now an indirect (fully mediated) effect of EM on DSB via EPA
(EM→EPA→DSB; = 0.161). Once more, this path can be rationalised on the
basis that employees working in close proximity experience the same levels of
empowerment.
In summary, the difference made by introducing the previously unhypothesised
EPA→DSB path are that:
the total effect of ML→DSB is down from 0.403 to 0.298;
o 0.298 is made up of: direct = 0.245 and indirect = 0.053
some of the variance in DSB now explained by:
o EM→EPA→DSB ( = 0.161) and
o by EPA→DSB ( = 0.255)
the total variance explained in DSB has risen from 0.16 to 0.20.
Statistically, SEM 5b:3 is a better model owing to its improved global fit
measures, however, in conclusion, the fact that the new EPA→DSB path appears
simply to re-direct some (0.059) the ML→DSB effect through EPA combined with
the conceptual difficulties in theoretically sustaining the notion that one person’s
attitudes can influence another’s behaviour, leads to the rejection of the
286
EPA→DSB path from the model and a return to SEM 5b:2 as the optimal model
(see Figure 7-22).
7.9.2 Model 5 / Model 5b summary
Model 5b has established that the strongest effects on job performance come
from motivational leadership (0.315), followed by employees’ positive attitudes
(0.279) and then from empowerment (0.174).
The development of the final model (5b) has seen the removal of the WV factor
from the model. This decision was made on the grounds that the WV→EPA path
was found to be non-significant and, in seeking a parsimonious solution (see e.g.
Byrne 2010: 185), this path was removed from the model. As noted above,
removing this path was tantamount to removing the WV factor entirely, thus the
structure for Model 5b (with no WV construct) was arrived at.
Models 5 and 5b represent alternative explanations of the same set of inter-
linkages and a comparison of these competing models was undertaken using the
range of model fit statistics described in Table 7-31. Following this comparison,
Model 5b was selected as the optimal explanation of the relationships between the
constructs.
7.10 Model 6
Model 6 sees the introduction of the Social Support (SS) construct to the model.
Social support has been included in three previous hospitality leadership studies
(Borchgrevink and Boster 1994; Ross and Boles 1994; Susskind et al. 2000a)
with mixed evidence for its positive influence in hospitality work environments
(see Section 5.2 for details). Within the organising framework for this research,
Social Support is hypothesised to be a predictor of Job Performance and Service
Quality.
Indicator variable SS1 was removed owing to a poor factor loading of 0.517 and
the remainder of the CFA model was developed along similar lines to previous
ones (i.e. the same factor structure as was reported for CFA 5:8b was resolved).
At this stage the model fit was adequate (χ2 = 167.306, d.f. = 137, sig = 0.040;
287
RMSEA = 0.032; CFI = 0.987; and SRMR = 0.0370) excepting for the chi square
p value at 0.040. However, because the Social Support construct did not covary
at a statistically significant level with the Job Performance construct (p = 0.227)
the model was not suitable for further development as a structural model.
Because of this lack of statistically significant covariance between Social Support
and Job Performance, the hypothesis (H15) that employees experiencing higher
levels of Social Support will also experience higher levels of Job Performance
cannot be tested and is effectively not confirmed.
The second hypothesis involving Social Support, H16 (Social Support→Service
Quality) stating that employees experiencing higher levels of Social Support will
also report greater success in maintaining customer satisfaction in the presence of
service failures, is also effectively not confirmed because the Service Quality
construct does not covary at a statistically significant level with any other
construct in the model. This finding is reported below in Section 7.11 where the
introduction of the Service Quality (SQ) construct is described.
7.11 Model 7
The Service Quality (SQ) construct is defined as ‘Employee ability to maintain
satisfied customers in the face of adverse service conditions’ and is measured
using an exploratory seven item scale developed from earlier research findings by
Bitner et al. (1994) that compared customer and staff perceptions of satisfaction
or dissatisfaction in critical service encounters. The SQ construct is hypothesised
as an outcome of Social Support (H16), Affective Organisational Commitment
(H17), Job Satisfaction (H18), Work Meaning (H19) and Motivational Leadership
(H2o).
To incorporate SQ into the existing model (Model 5b), a CFA model was specified
containing all indicator variables for the constructs ML (Motivational Leadership),
EM (Empowerment), EPA (Employee Positive Attitudes), JP (Job Performance) and
DSB (Discretionary Service Behaviour). The data set used to estimate this model
contained 122 responses which was the number of cases where all of the seven
SQ items were completed - recalling that for the measurement of the SQ
construct, a non-response option was made available for individuals who never
experienced service failure in a particular critical service encounter (Section 5.4).
The CFA model was estimated with the following results:
288
all SQ indicators loaded well (at >0.7) and all SQ factor loadings were
statistically significant;
the SQ construct, however, did not covary at a statistically significant level with
any other construct.
The model specification was modified in the usual way, with analyses of the
standardised residual covariances and modification indices being used to indicate
where modifications to improve this situation might be made. Ultimately, three
indicator variables were removed (SQ3, SQ5 and SQ7) from the SQ construct.
Following these modifications, the truncated SQ construct (consisting of indicators
SQ1, SQ2, SQ4 and SQ6) was estimated alongside the ML, EM, EPA, JP and DSB
constructs as per the final CFA specification used in Model 5b. However, no
statistically significant covariances between the SQ construct and any others were
found.
Because the modelling above was undertaken using the constructs present in
Model 5b, as a further check on the adequacy of the SQ construct, it was
modelled alongside the constructs used in the previous model iteration, Model 5,
which included the Work Values (WV) construct. Although it was not possible to
develop this model to a state of adequate fit, and SQ continued to covary at non-
statistically significant levels with the constructs as described above, SQ did
covary at a statistically significant level (p = 0.034) with the Work Values
construct. Accordingly, a CFA model containing only the SQ and WV constructs
was estimated. It was not possible, however, to develop a model that exhibited
satisfactory fit and in which the covariance between the SQ and WV constructs
remained statistically significant.
7.12 Post-development validation of the model
Two aspects of validation are dealt with in this section: (i) cross-checking the
model-based data imputation process; and (ii) cross-validating the model using a
split-sample multi-group analysis of invariance.
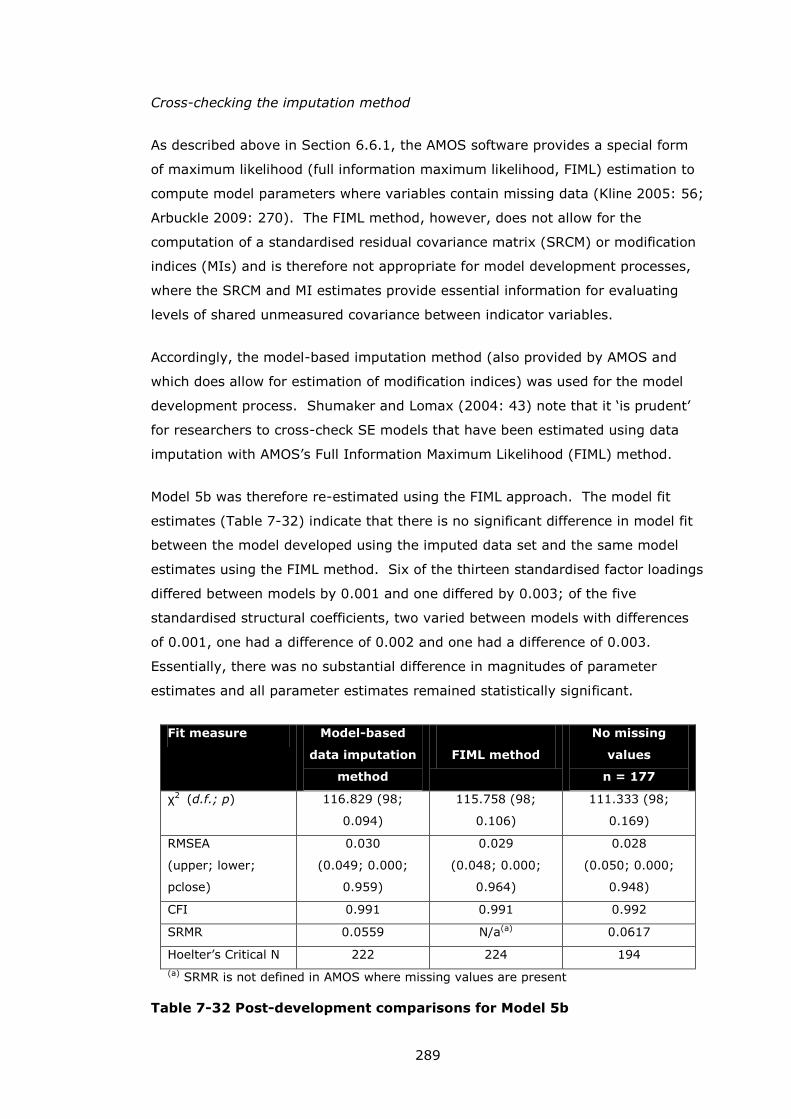
289
Cross-checking the imputation method
As described above in Section 6.6.1, the AMOS software provides a special form
of maximum likelihood (full information maximum likelihood, FIML) estimation to
compute model parameters where variables contain missing data (Kline 2005: 56;
Arbuckle 2009: 270). The FIML method, however, does not allow for the
computation of a standardised residual covariance matrix (SRCM) or modification
indices (MIs) and is therefore not appropriate for model development processes,
where the SRCM and MI estimates provide essential information for evaluating
levels of shared unmeasured covariance between indicator variables.
Accordingly, the model-based imputation method (also provided by AMOS and
which does allow for estimation of modification indices) was used for the model
development process. Shumaker and Lomax (2004: 43) note that it ‘is prudent’
for researchers to cross-check SE models that have been estimated using data
imputation with AMOS’s Full Information Maximum Likelihood (FIML) method.
Model 5b was therefore re-estimated using the FIML approach. The model fit
estimates (Table 7-32) indicate that there is no significant difference in model fit
between the model developed using the imputed data set and the same model
estimates using the FIML method. Six of the thirteen standardised factor loadings
differed between models by 0.001 and one differed by 0.003; of the five
standardised structural coefficients, two varied between models with differences
of 0.001, one had a difference of 0.002 and one had a difference of 0.003.
Essentially, there was no substantial difference in magnitudes of parameter
estimates and all parameter estimates remained statistically significant.
Fit measure Model-based
data imputation
method
FIML method
No missing
values
n = 177
χ2 (d.f.; p) 116.829 (98;
0.094)
115.758 (98;
0.106)
111.333 (98;
0.169)
RMSEA
(upper; lower;
pclose)
0.030
(0.049; 0.000;
0.959)
0.029
(0.048; 0.000;
0.964)
0.028
(0.050; 0.000;
0.948)
CFI 0.991 0.991 0.992
SRMR 0.0559 N/a(a) 0.0617
Hoelter’s Critical N 222 224 194
(a) SRMR is not defined in AMOS where missing values are present
Table 7-32 Post-development comparisons for Model 5b
290
These findings show that there have been no substantial or adverse consequences
on the model parameter estimates as a result of employing the model-based data
imputation method in preference to the generally favoured FIML estimation
method.
A general rule of thumb for missing data approaches provided by Hair et al.
(2006: 55-56) is that, before undertaking any data imputation, it should be
possible to undertake the planned analysis effectively using only the cases with no
missing values at all. There are 177 cases with no missing data in the current
data set - according to the guidelines for SEM sample sizes described in Section
6.5.2, such a sample should be adequate for analysis to proceed. To provide an
empirical check on the adequacy of the 177 cases for SEM analysis, Model 5b was
re-estimated using only the data from these 177 cases.
The model fit statistics for this model are described in Table 7-32 (alongside the
results of the FIML estimates) and show that, once again, there is no appreciable
difference in the overall fit. All factor loadings and structural coefficients remain
statistically significant. All of the factor loadings and structural coefficients vary
to some extent from the values in the original Model 5b, and this reflects the fact
that the data set has changed significantly. The variations are greater than in the
previous model comparison, in this case ranging between 0.001 and 0.6.
However, the only substantive difference between the model estimated with 177
cases and the original Model 5b is that the squared multiple correlation value for
the Job Performance (JP) construct has dropped to 0.18 (from 0.22 in Model 5b
with 213 cases).
The one model fit measure that has changed somewhat is Hoelter’s Critical N
which assesses adequacy of sampling size. Reflecting the smaller sample size
(177 cases versus 213 cases in the full data set), this estimate has dropped
slightly below the preferred level of 200 to 194. Nevertheless, this estimate is
very close to 200 and is considerably above the minimum of 75 suggested by
Garson (2011b). Based on these findings, it is concluded that the sample size of
177 cases with no missing values was adequate for undertaking SEM analysis. As
a consequence, the general rule of thumb for missing data approaches provided
by Hair et al. (2006: 55-56) is satisfied.
291
Split-sample cross-validation of the model
The most effective method of validating an SEM model is to test the model in a
strictly confirmatory mode using data from an independent sample drawn from
the same population (Blunch 2008: 98). Given the amount of time taken to
successfully collect data suitable for the exploratory model that has been
developed above, a second round of data collection for undertaking an
independent sample for a cross-validation exercise was not possible.
In the absence of an independent sample, one approach to cross-validation is to
randomly split the existing sample and to use the two resulting sets of cases to
perform multi-group SEM analyses to confirm (or refute) group invariance (Hair et
al. 2006: 819). If the models estimated using the data split into two groups
demonstrate adequate fit and there is no statistically significant difference in
parameter estimates, then it can be concluded that the model is likely to cross-
validate in an independent sample.
This procedure was carried out and the steps are summarised below:
the RANDBETWEEN function in Microsoft Excel was used to generate 213
random numbers between 2,000 and 200,000 (these limits were set
arbitrarily);
these random numbers were pasted into the SPSS database and the cases
were then sorted by ascending random number;
the sample was split into two groups (Group 1 [G1] = 106 cases and Group 2
[G2] = 107 cases) at the midway point in the ascending order of random
numbers. These groups are each just above the 100 cases lower limit for
sample size in SEM analysis described in Section 6.5.2 above;
following the steps described by Hair et al. (2006: 820-824) and Byrne (2010:
266-271) these two groups were used to:
o confirm that global model fit for both groups is satisfactory; and
o evaluate the equivalence of the factor loadings, structural coefficients
and factor covariances.
The loose cross-validation (where separate models are estimated using the split
samples) found that models both demonstrated satisfactory global fit:
G1: χ2 = 98.923, d.f. = 98, sig = 0.455; RMSEA = 0.009; CFI = 0.999; and
SRMR = 0.0655; and
G2: χ2 = 111.601, d.f. = 98, sig = 0.164; RMSEA = 0.036; CFI = 0.987; and
SRMR = 0.0700.
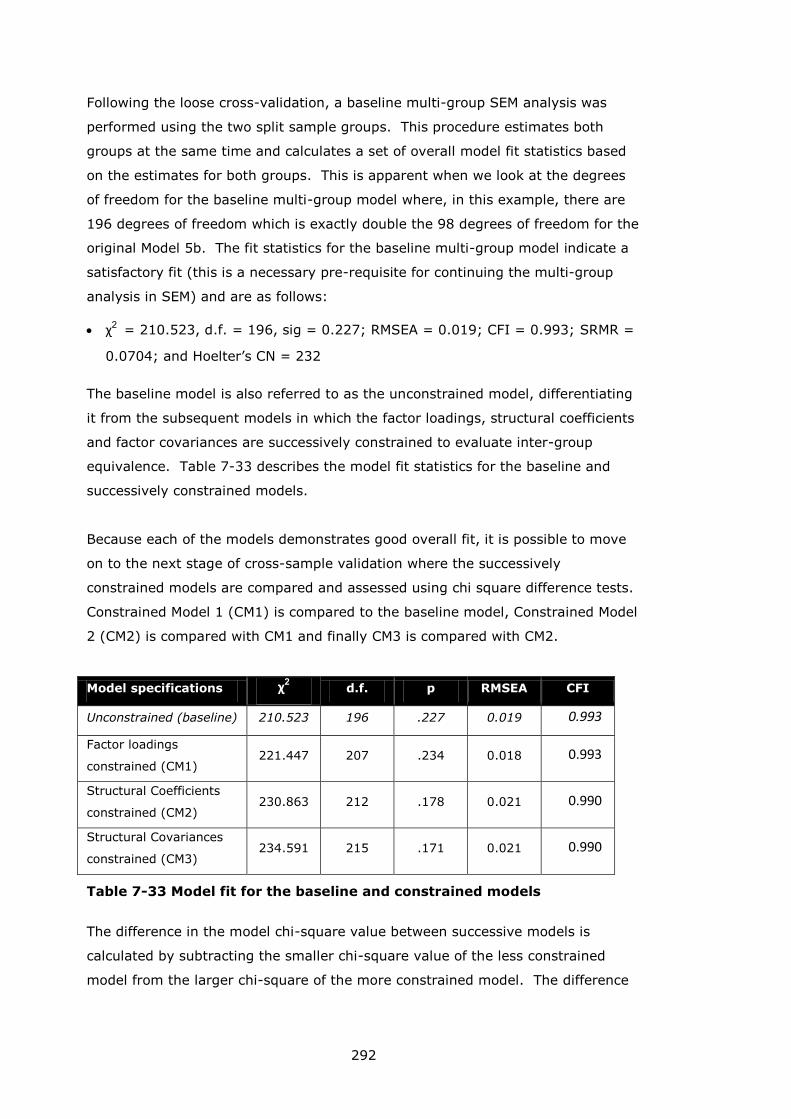
292
Following the loose cross-validation, a baseline multi-group SEM analysis was
performed using the two split sample groups. This procedure estimates both
groups at the same time and calculates a set of overall model fit statistics based
on the estimates for both groups. This is apparent when we look at the degrees
of freedom for the baseline multi-group model where, in this example, there are
196 degrees of freedom which is exactly double the 98 degrees of freedom for the
original Model 5b. The fit statistics for the baseline multi-group model indicate a
satisfactory fit (this is a necessary pre-requisite for continuing the multi-group
analysis in SEM) and are as follows:
χ2 = 210.523, d.f. = 196, sig = 0.227; RMSEA = 0.019; CFI = 0.993; SRMR =
0.0704; and Hoelter’s CN = 232
The baseline model is also referred to as the unconstrained model, differentiating
it from the subsequent models in which the factor loadings, structural coefficients
and factor covariances are successively constrained to evaluate inter-group
equivalence. Table 7-33 describes the model fit statistics for the baseline and
successively constrained models.
Because each of the models demonstrates good overall fit, it is possible to move
on to the next stage of cross-sample validation where the successively
constrained models are compared and assessed using chi square difference tests.
Constrained Model 1 (CM1) is compared to the baseline model, Constrained Model
2 (CM2) is compared with CM1 and finally CM3 is compared with CM2.
Model specifications χ2 d.f. p RMSEA CFI
Unconstrained (baseline) 210.523 196 .227 0.019 0.993
Factor loadings
constrained (CM1) 221.447 207 .234 0.018 0.993
Structural Coefficients
constrained (CM2) 230.863 212 .178 0.021 0.990
Structural Covariances
constrained (CM3) 234.591 215 .171 0.021 0.990
Table 7-33 Model fit for the baseline and constrained models
The difference in the model chi-square value between successive models is
calculated by subtracting the smaller chi-square value of the less constrained
model from the larger chi-square of the more constrained model. The difference
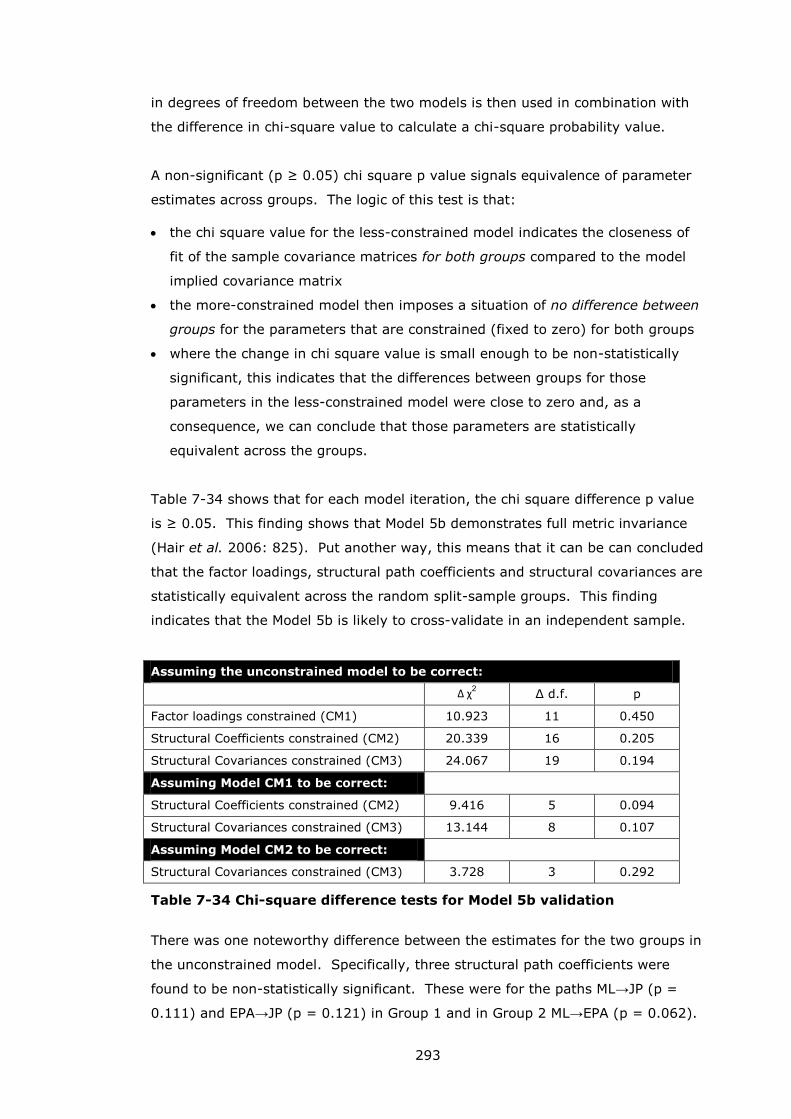
293
in degrees of freedom between the two models is then used in combination with
the difference in chi-square value to calculate a chi-square probability value.
A non-significant (p ≥ 0.05) chi square p value signals equivalence of parameter
estimates across groups. The logic of this test is that:
the chi square value for the less-constrained model indicates the closeness of
fit of the sample covariance matrices for both groups compared to the model
implied covariance matrix
the more-constrained model then imposes a situation of no difference between
groups for the parameters that are constrained (fixed to zero) for both groups
where the change in chi square value is small enough to be non-statistically
significant, this indicates that the differences between groups for those
parameters in the less-constrained model were close to zero and, as a
consequence, we can conclude that those parameters are statistically
equivalent across the groups.
Table 7-34 shows that for each model iteration, the chi square difference p value
is ≥ 0.05. This finding shows that Model 5b demonstrates full metric invariance
(Hair et al. 2006: 825). Put another way, this means that it can be can concluded
that the factor loadings, structural path coefficients and structural covariances are
statistically equivalent across the random split-sample groups. This finding
indicates that the Model 5b is likely to cross-validate in an independent sample.
Assuming the unconstrained model to be correct:
Δ χ2 Δ d.f. p
Factor loadings constrained (CM1) 10.923 11 0.450
Structural Coefficients constrained (CM2) 20.339 16 0.205
Structural Covariances constrained (CM3) 24.067 19 0.194
Assuming Model CM1 to be correct:
Structural Coefficients constrained (CM2) 9.416 5 0.094
Structural Covariances constrained (CM3) 13.144 8 0.107
Assuming Model CM2 to be correct:
Structural Covariances constrained (CM3) 3.728 3 0.292
Table 7-34 Chi-square difference tests for Model 5b validation
There was one noteworthy difference between the estimates for the two groups in
the unconstrained model. Specifically, three structural path coefficients were
found to be non-statistically significant. These were for the paths ML→JP (p =
0.111) and EPA→JP (p = 0.121) in Group 1 and in Group 2 ML→EPA (p = 0.062).
294
Given the finding described above - that these paths are statistically equivalent
across groups - the non-statistical significance of these three parameter estimates
is likely to have arisen as a consequence of the smaller sample sizes (Group 1 =
106 and Group 2 = 107 cases) as described by Kline (2005: 41).
In summary, the post-development model validations have shown that:
the model-based imputation method is robust; and
that the final model (Model 5b) is likely to cross-validate in an independent
sample drawn from the same population.
7.13 Post-modification construct identities
The model development process has resulted in the selection of Model 5b (see
Section 7.9 above) as the optimal model that explains the observed data in
accordance with the proposed theoretical linkages between the latent constructs.
For reasons of parsimony, one of the measured constructs (Work Values) was not
retained in the model as its effect on Employee Positive Attitudes was not
statistically significant. A further two of the measured constructs, Social Support
and Service Quality, were not able to be included in the model as they were found
not to covary at a statistically significant level with the other constructs.
Aside from the three constructs that were not included in the final model, other
changes to the theorised model included modifications with minor substantive
implications that were made to the Motivational Leadership, Empowerment, Job
Performance and Discretionary Service Behaviour constructs. Modifications with
major substantive changes were made when the three Employee Attitude
variables (Job Satisfaction, Work Meaning and Affective Organisational
Commitment) were merged to form the new Employee Positive Attitudes
construct. The substantive implications of the modifications to construct
composition are discussed below.
Section 7.2.5 above describes content validity (also known as face validity) as the
correspondence between the observed (indicator) variables and the construct that
is intended to be measured by the latent construct.
Following the model generating approach, as Models 1 to 5b were being
developed, various indicator variables were removed from the analysis in order to
295
satisfy the requirements for construct validity and/or to improve model fit. The
justifications for and the substantive implications of removing these variables
have been discussed during each of the models. It is worthwhile, however,
revisiting the modifications and the associated re-interpreted constructs to
contextualise these within the framework of the hypothesised model and the
research in general. The modifications to each construct are described briefly
below and the final interpretations of the constructs are summarised in Figure
7-24.
The Work Values construct was ultimately measured with indicators WV1 (Gives
me status and prestige), WV4 (Lets me meet interesting people) and WV5 (Is a
useful way for me to contribute to society). These themes can be summarised as
follows:
WV1 = social status;
WV4 = social interaction; and
WV5 = societal contribution.
Accordingly, the final Work Values construct is interpreted as ‘an individual’s
general beliefs/values regarding the social and societal benefits of work and
working’. Regarding the modifications to the WV construct: removal of WV2 and
WV3 was not a cause for concern since these had been noted during the construct
development stage as being somewhat semantically different from the other item
statements (see Section 5.1). Neither was the removal of WV7 a great surprise
as this item did not belong to the original set of statements in MOW (1995)
survey form, coming instead from London (1983). WV6 was removed owing to a
high standardised residual covariance value; with hindsight, its departure is fitting
as it does not share any obvious social theme as do WV1, 4 and 5.
Motivational Leadership saw the removal of ML4 and ML5. These two
speculatively-included items related to the positive feedback from leaders (ML4)
and the leader putting the group interests before their own (ML5). The remaining
indicators ML1, ML2 and ML3 all focus on leader vision→goal→effort behaviour:
establishing a vision (ML1), articulating the vision (ML2) and encouraging effort
towards the achieving the vision (ML3). The core vision→goal→effort components
of the ML construct, therefore, remain.
296
Employee Empowerment (EM) was measured in the survey instrument using an
8-item scale, which was reduced from Hancer and George’s 2003 11-item
empowerment scale. Following the model development process in Models 4 and
5, the EM scale was reduced to three items (EM1, EM3 and EM4). The removal of
indicators EM6, EM7 and EM8 makes substantive sense as these all measure
Hancer and George’s (2003) Competencies sub-factor (which measured employee
perceptions of self-efficacy). The primary focus of this research was on Hancer
and George’s Influence factor (which is represented adequately by the remaining
indicators (1, 3 and 4). Indicators that did measure the Influence factor but
which were removed are:
EM2 - dropped during the scale/survey development stage of the research
EM9 - drawn from Lundberg et al. (2009) and speculatively included as part of
the Influence sub-factor;
EM5 - removal has no substantive implications as it has considerable item
overlap with EM4.
In summary, the remaining items (EM1, 3 and 4) adequately measure the core
concept of interest, that is, the Influence dimension of Hancer and George’s
(2003) empowerment measure.
The indicators for the exploratory Work Meaning construct were subsumed into
the EPA (Employee Positive Attitudes) construct during the development of Models
3 and 3b. The previous model, Model 2, is included in the final findings of this
research as a valid model that measures the mediating role of work meaning
between motivational leadership and job performance. Two items (ME2 and ME4)
were removed from the Work Meaning construct during the survey and scale
development stage of the research. During the development of Model 2, ME5 and
ME7 were removed from the model owing to low factor loadings. The remaining
items (ME1, ME3 and ME6) describe employees’ Satisfaction, Enjoyment and
Social Status from Work and the inclusion of these means that both the Intrinsic
and Extrinsic dimensions of work meaning from Wollack et al.’s (1971) work are
represented in the Work Meaning construct for this research.
Following the failure of the three initial employee attitude constructs - Work
Meaning (ME), Job Satisfaction (JS) and Affective Organisational Commitment
(AOC) - to achieve satisfactory discriminant validity, the Employee Positive
Attitudes (EPA) construct was developed as an amalgamation of these. As an
exploratory and ad hoc construct, this new construct was able to be interpreted
297
somewhat flexibly, although efforts were made to relate the identity of the new
construct to the original constructs and to the broader Employee Attitudes
category of the organising framework in which all three of the initial constructs
are located. The steps for interpreting the new EPA construct are discussed in
some detail in Section 7.6 above. In many ways, the EPA construct is similar to
Work Meaning, however it also contains the emotional attachment component
that was originally part of the Affective Organisational Commitment construct.
Both Job Performance (JP) and Discretionary Service Behaviour (DSB) measure
employees’ work motivation. Job Performance (JP) is developed from (i) research
narratives that posit extra effort as a measure of motivated employees (e.g.
Georgopoulos et al. 1957: 345) and (ii) leadership theory where extra effort is
one outcome of transformational leadership (e.g. Bass and Avolio 2008; Limsila
and Ogunlana 2008: 167).
Job Performance saw the removal of JP3 (How often do you find that you have
done more than you expected to do?). Perhaps the JP3 item did not work well
with this sample because waiting staff cannot practically ‘do more than they
expected to do’. That is, a member of the waiting staff expects to serve all of the
customers that arrive during a serving, and by the end of the service, all of the
customers have been attended to.
Put another way, ‘expected effort’ is somewhat delimited by the requirement to
serve all the customers and effort beyond this is neither a requirement nor is it
feasible (since there are no more customers to serve). JP4 was retained
throughout the model development owing to its core substantive role of relating
the JP construct to the service context and its reflection of the DSB2 indicator in
the Discretionary Service Behaviour construct. The Job Performance construct
remains largely unchanged.
Discretionary Service Behaviour was included in the survey with all four items as
described by Simons (2010). There is a considerable degree of item content
overlap amongst the four indicators, in particular, between items DSB2
(answering a guest’s question), DSB3 (delivering a guest’s special request) and
DSB4 (taking time to talk with a guest). Accordingly, the removal of DSB3 and
DSB4 has not drastically altered the meaning of the factor.
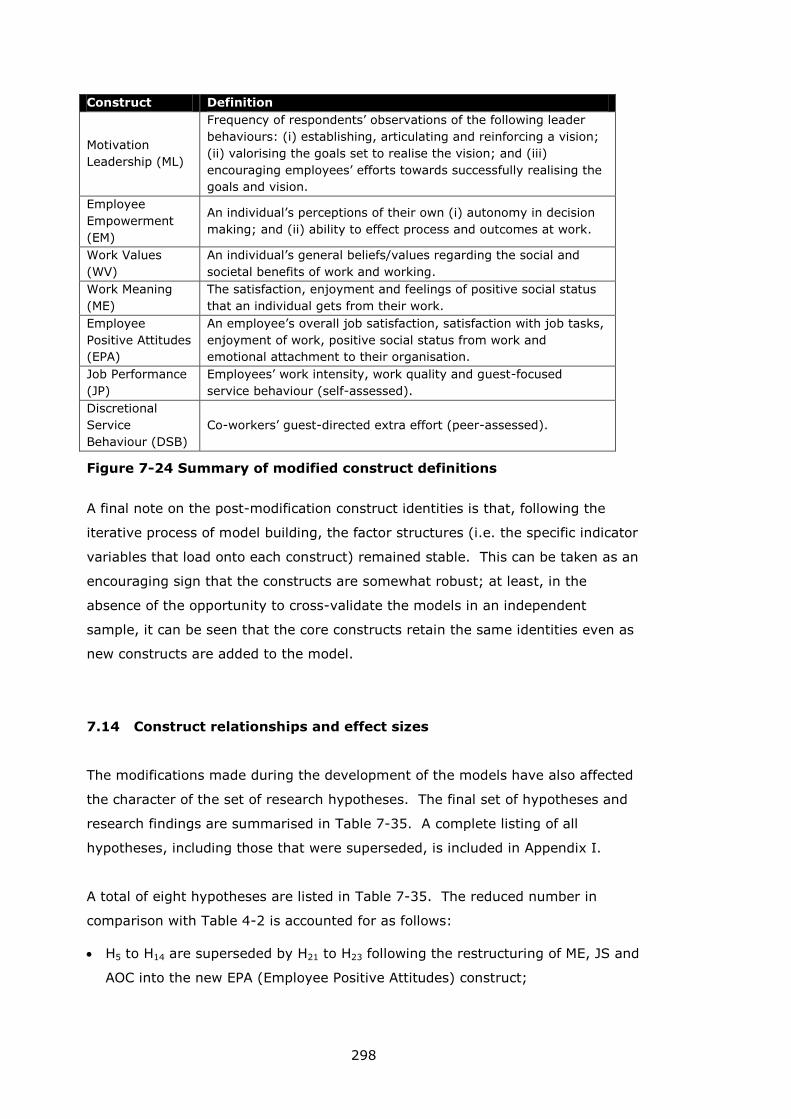
298
Construct Definition
Motivation
Leadership (ML)
Frequency of respondents’ observations of the following leader
behaviours: (i) establishing, articulating and reinforcing a vision;
(ii) valorising the goals set to realise the vision; and (iii)
encouraging employees’ efforts towards successfully realising the
goals and vision.
Employee
Empowerment
(EM)
An individual’s perceptions of their own (i) autonomy in decision
making; and (ii) ability to effect process and outcomes at work.
Work Values
(WV)
An individual’s general beliefs/values regarding the social and
societal benefits of work and working.
Work Meaning
(ME)
The satisfaction, enjoyment and feelings of positive social status
that an individual gets from their work.
Employee
Positive Attitudes
(EPA)
An employee’s overall job satisfaction, satisfaction with job tasks,
enjoyment of work, positive social status from work and
emotional attachment to their organisation.
Job Performance
(JP)
Employees’ work intensity, work quality and guest-focused
service behaviour (self-assessed).
Discretional
Service
Behaviour (DSB)
Co-workers’ guest-directed extra effort (peer-assessed).
Figure 7-24 Summary of modified construct definitions
A final note on the post-modification construct identities is that, following the
iterative process of model building, the factor structures (i.e. the specific indicator
variables that load onto each construct) remained stable. This can be taken as an
encouraging sign that the constructs are somewhat robust; at least, in the
absence of the opportunity to cross-validate the models in an independent
sample, it can be seen that the core constructs retain the same identities even as
new constructs are added to the model.
7.14 Construct relationships and effect sizes
The modifications made during the development of the models have also affected
the character of the set of research hypotheses. The final set of hypotheses and
research findings are summarised in Table 7-35. A complete listing of all
hypotheses, including those that were superseded, is included in Appendix I.
A total of eight hypotheses are listed in Table 7-35. The reduced number in
comparison with Table 4-2 is accounted for as follows:
H5 to H14 are superseded by H21 to H23 following the restructuring of ME, JS and
AOC into the new EPA (Employee Positive Attitudes) construct;
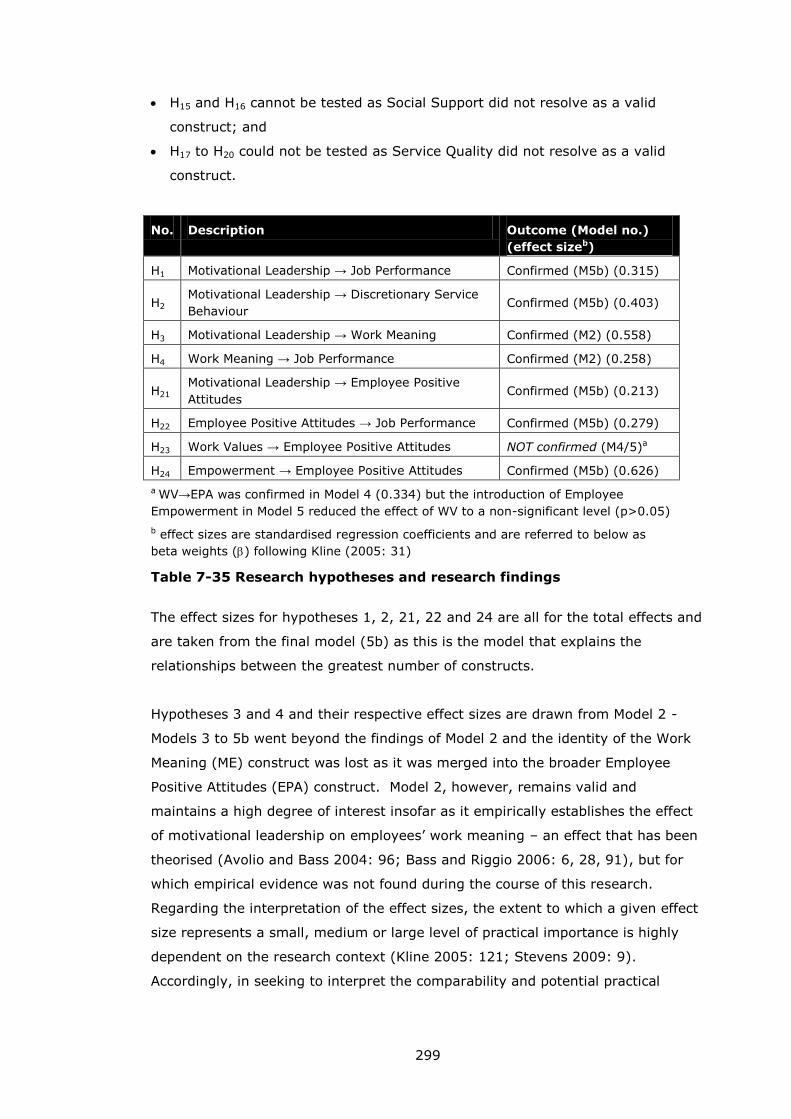
299
H15 and H16 cannot be tested as Social Support did not resolve as a valid
construct; and
H17 to H20 could not be tested as Service Quality did not resolve as a valid
construct.
No. Description Outcome (Model no.)
(effect sizeb)
H1 Motivational Leadership → Job Performance Confirmed (M5b) (0.315)
H2 Motivational Leadership → Discretionary Service
Behaviour Confirmed (M5b) (0.403)
H3 Motivational Leadership → Work Meaning Confirmed (M2) (0.558)
H4 Work Meaning → Job Performance Confirmed (M2) (0.258)
H21 Motivational Leadership → Employee Positive
Attitudes Confirmed (M5b) (0.213)
H22 Employee Positive Attitudes → Job Performance Confirmed (M5b) (0.279)
H23 Work Values → Employee Positive Attitudes NOT confirmed (M4/5)a
H24 Empowerment → Employee Positive Attitudes Confirmed (M5b) (0.626)
a WV→EPA was confirmed in Model 4 (0.334) but the introduction of Employee
Empowerment in Model 5 reduced the effect of WV to a non-significant level (p>0.05)
b effect sizes are standardised regression coefficients and are referred to below as
beta weights () following Kline (2005: 31)
Table 7-35 Research hypotheses and research findings
The effect sizes for hypotheses 1, 2, 21, 22 and 24 are all for the total effects and
are taken from the final model (5b) as this is the model that explains the
relationships between the greatest number of constructs.
Hypotheses 3 and 4 and their respective effect sizes are drawn from Model 2 -
Models 3 to 5b went beyond the findings of Model 2 and the identity of the Work
Meaning (ME) construct was lost as it was merged into the broader Employee
Positive Attitudes (EPA) construct. Model 2, however, remains valid and
maintains a high degree of interest insofar as it empirically establishes the effect
of motivational leadership on employees’ work meaning – an effect that has been
theorised (Avolio and Bass 2004: 96; Bass and Riggio 2006: 6, 28, 91), but for
which empirical evidence was not found during the course of this research.
Regarding the interpretation of the effect sizes, the extent to which a given effect
size represents a small, medium or large level of practical importance is highly
dependent on the research context (Kline 2005: 121; Stevens 2009: 9).
Accordingly, in seeking to interpret the comparability and potential practical
300
importance of the effect sizes observed in this research, the primary recourse is
to compare the effect sizes with those previously reported in the literature.
Regarding the strength of association between motivational leadership and work
meaning, as noted above, no empirical precedents have been identified with
which to compare the current finding. While there may be some unidentified non-
hospitality leadership studies that have measured this relationship, the
comprehensive review of published hospitality leadership studies undertaken for
this research has conclusively found that this relationship has not previously been
measured.
Hypotheses 21, 22 and 24 all relate to the new construct, Employee Positive
Attitudes (EPA). Because EPA represents a new conceptualisation, it follows that
there are no empirical findings to compare the current effect sizes with. The most
relevant findings are those of Erkutlu (2008) who found in his survey of
hospitality employees in Turkish hotels that Inspirational Motivation had a positive
effect on job satisfaction ( = 0.02) and on organisational commitment ( =
0.25).
Regarding the influence of motivational leadership on job performance. Once
more, because this is the first study to evaluate this relationship in a hospitality
context, there are no prior empirical (hospitality) findings with which to compare
the current results. One useful comparison for the effect of motivational
leadership on job performance (albeit not in a hospitality context) comes from
Avolio and Bass (2004a, 2004b) who report correlation matrices based on their
meta-analyses of the Multi-Factor Leadership Questionnaire (MLQ) for assessing
their Full-Range Leadership Model (FRLM).
Based on their analysis of 1,143 European self-rater respondents (all economic
sectors), Avolio and Bass (2004b) report an inter-factor correlation of 0.550
between the Inspirational Motivation (IM) and Extra Effort (EE) constructs of the
MLQ (Multi-Factor Leadership Questionnaire). This correlation estimate is 0.560
for the corresponding US sample with n = 3,755 also from all economic sectors
(Avolio and Bass 2004a: 71).
This inter-factor correlation is, of course, based on the factor covariances found in
a CFA (confirmatory factor analysis) model rather than the path coefficients in a
structural model. The CFA model for Model 5b finds a correlation estimate of
301
0.408. While the construct definitions and corresponding measurements in this
study are not identical to those found in the MLQ, the concepts are similar, and an
inter-factor correlation of 0.408 is not radically different from Avolio and Bass’s
0.550 estimate for European employees.
Finally, regarding Hypothesis 2 (ML→DSB), there is no prior research with which
to compare the effect size for this relationship. The DSB (Discretionary Service
Behaviour) construct is a relatively new conceptualisation, developed by Blancero
and Johnson (1997, 2001) and operationalised by Simons and Roberson (2003).
Simons and Roberson’s (2003) study is the only known empirical application of
the DSB construct and those researchers measured the influence of Affective
Commitment on DSB, finding this path significant with an en effect size of 0.260
(p. 440).
Summary of effect sizes
Summarising the above, we find that there are few prior empirical findings with
which to compare the effect sizes in the current research. This is not surprising
considering that the research is largely exploratory (insofar as it is examining
research questions hitherto not addressed in hospitality contexts19) and therefore
falls into what Kline (p. 122) refers to as a “new research area”. In such
circumstances, Kline recommends the guidelines on interpreting effect sizes
provided by (Cohen 1988). Specifically, these guidelines suggest that:
effects sizes less than 0.1 = small effects;
effect sizes around 0.3 = medium effects; and
effect sizes around 0.5 or greater = large effects.
(Kline 2005: 122)
Based on these guidelines the relevant effect sizes from Models 2 and 5b (and
summarised in Table 7-35 above) are interpreted as follows (ranked in
descending order of magnitude):
H24 (EM→EPA) = 0.626 = large.
H3 (ML→ME) = 0.558 = large;
H2 (ML→DSB) = 0.403 = medium to large;
H1 (ML→JP) = 0.315 = medium;
19 And in the case of the newly formed EPA construct, is entirely novel
302
H22 (EPA→JP) = 0.279 = medium;
H4 (ME→JP) = 0.258 = medium;
H21 (ML→EPA) = 0.213 = small to medium; and
EM→EPA→JP = 0.174 = small to medium.
The final path in the list above was not expressed as a hypothesis owing to it
being a fully-mediated path (i.e. there is no direct line connecting EM with JP).
The indirect effect of EM on JP (= 0.174) is, however, described in Table 7-30
along with the other standardised total effects for Model 5b. This mediated path
represents the indirect effect of EM on JP that has been ‘transmitted’ through EPA
and is calculated as the product of the two direct effects 0.626 * 0.279 = 0.174
and classed as a small to medium effect.
7.15 Multi-group analyses
SEM analyses can also be used to investigate and assess the ways in which effect
sizes (relationships between variables) are moderated by categorical independent
variables such as demographic or employment characteristic variables. Where
effect sizes are significantly moderated and the difference in effect sizes between
groups is deemed to be considerable, there may be implications with regard to
the ways in which organisations manage different groups of employees.
Moderator effects such as these can be assessed using multi-group SEM analyses
and this section describes how multi-group analyses are employed to:
(i) highlight differences in effects sizes across demographic grouping (gender, age
etc). Any such variations in effect sizes can then be considered in the light of
survey non-response to assess how non-response may be influencing the
research findings;
(ii) assess the moderator effects of respondents’ degree of supervisor contact and
perceptions of training and information provision; and
(iii) examine to effect of employee work orientations in moderating inter-factor
relationships by using Work Values as a grouping variable.
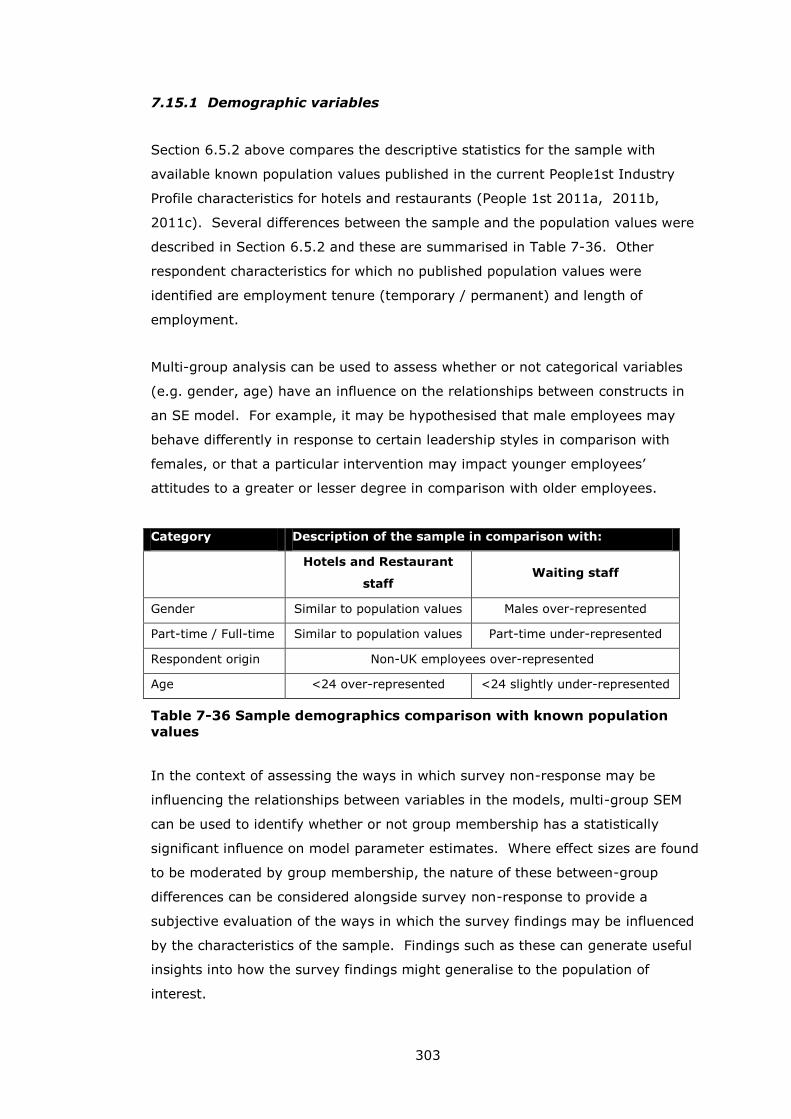
303
7.15.1 Demographic variables
Section 6.5.2 above compares the descriptive statistics for the sample with
available known population values published in the current People1st Industry
Profile characteristics for hotels and restaurants (People 1st 2011a, 2011b,
2011c). Several differences between the sample and the population values were
described in Section 6.5.2 and these are summarised in Table 7-36. Other
respondent characteristics for which no published population values were
identified are employment tenure (temporary / permanent) and length of
employment.
Multi-group analysis can be used to assess whether or not categorical variables
(e.g. gender, age) have an influence on the relationships between constructs in
an SE model. For example, it may be hypothesised that male employees may
behave differently in response to certain leadership styles in comparison with
females, or that a particular intervention may impact younger employees’
attitudes to a greater or lesser degree in comparison with older employees.
Category Description of the sample in comparison with:
Hotels and Restaurant
staff Waiting staff
Gender Similar to population values Males over-represented
Part-time / Full-time Similar to population values Part-time under-represented
Respondent origin Non-UK employees over-represented
Age <24 over-represented <24 slightly under-represented
Table 7-36 Sample demographics comparison with known population
values
In the context of assessing the ways in which survey non-response may be
influencing the relationships between variables in the models, multi-group SEM
can be used to identify whether or not group membership has a statistically
significant influence on model parameter estimates. Where effect sizes are found
to be moderated by group membership, the nature of these between-group
differences can be considered alongside survey non-response to provide a
subjective evaluation of the ways in which the survey findings may be influenced
by the characteristics of the sample. Findings such as these can generate useful
insights into how the survey findings might generalise to the population of
interest.
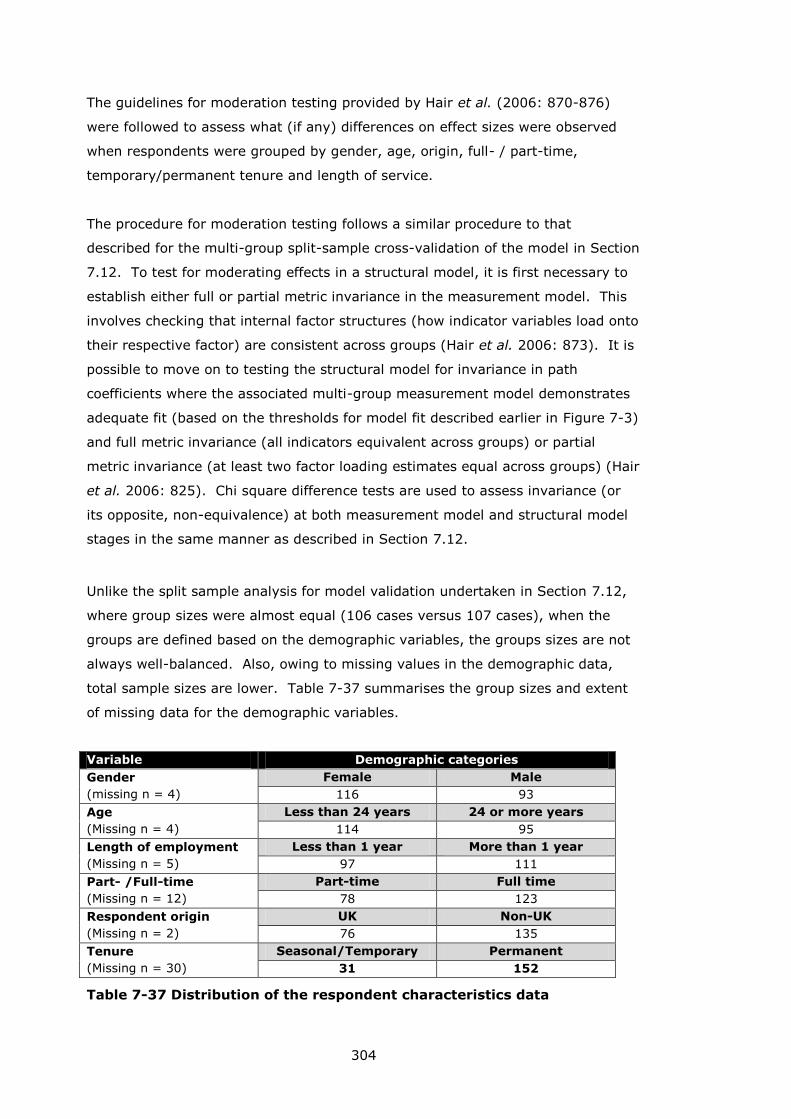
304
The guidelines for moderation testing provided by Hair et al. (2006: 870-876)
were followed to assess what (if any) differences on effect sizes were observed
when respondents were grouped by gender, age, origin, full- / part-time,
temporary/permanent tenure and length of service.
The procedure for moderation testing follows a similar procedure to that
described for the multi-group split-sample cross-validation of the model in Section
7.12. To test for moderating effects in a structural model, it is first necessary to
establish either full or partial metric invariance in the measurement model. This
involves checking that internal factor structures (how indicator variables load onto
their respective factor) are consistent across groups (Hair et al. 2006: 873). It is
possible to move on to testing the structural model for invariance in path
coefficients where the associated multi-group measurement model demonstrates
adequate fit (based on the thresholds for model fit described earlier in Figure 7-3)
and full metric invariance (all indicators equivalent across groups) or partial
metric invariance (at least two factor loading estimates equal across groups) (Hair
et al. 2006: 825). Chi square difference tests are used to assess invariance (or
its opposite, non-equivalence) at both measurement model and structural model
stages in the same manner as described in Section 7.12.
Unlike the split sample analysis for model validation undertaken in Section 7.12,
where group sizes were almost equal (106 cases versus 107 cases), when the
groups are defined based on the demographic variables, the groups sizes are not
always well-balanced. Also, owing to missing values in the demographic data,
total sample sizes are lower. Table 7-37 summarises the group sizes and extent
of missing data for the demographic variables.
Variable Demographic categories
Gender
(missing n = 4)
Female Male
116 93
Age
(Missing n = 4)
Less than 24 years 24 or more years
114 95
Length of employment
(Missing n = 5)
Less than 1 year More than 1 year
97 111
Part- /Full-time
(Missing n = 12)
Part-time Full time
78 123
Respondent origin
(Missing n = 2)
UK Non-UK
76 135
Tenure
(Missing n = 30)
Seasonal/Temporary Permanent
31 152
Table 7-37 Distribution of the respondent characteristics data
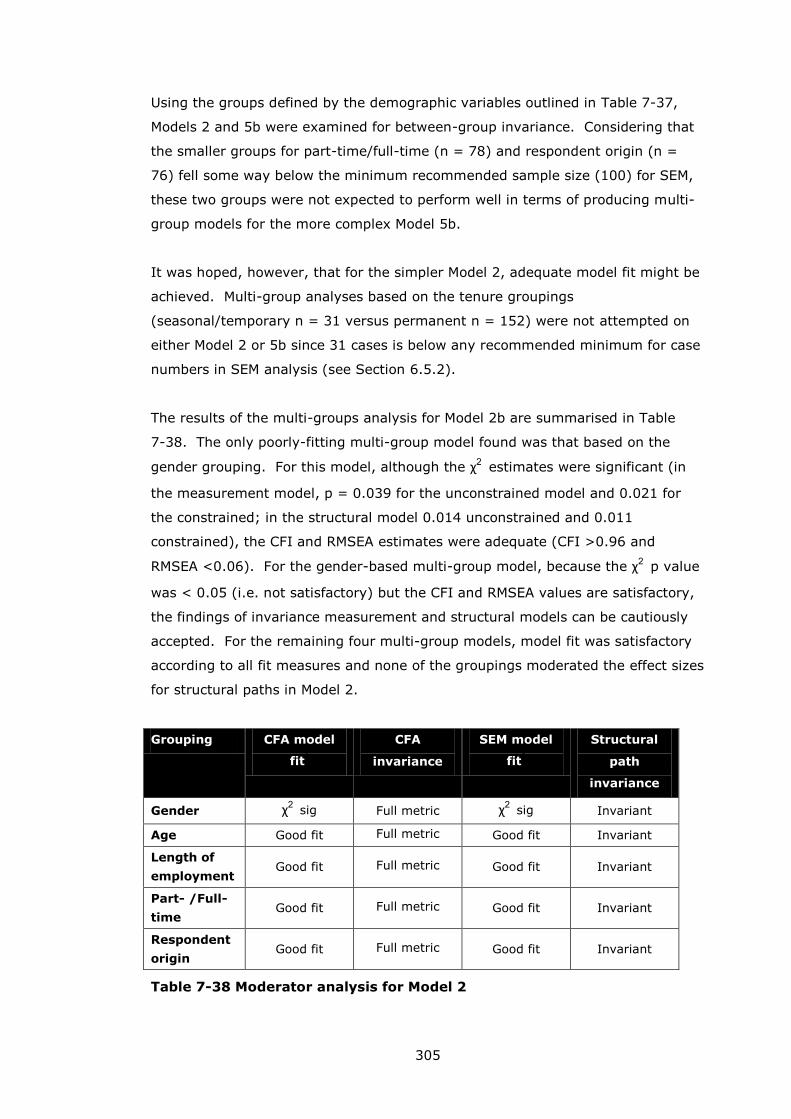
305
Using the groups defined by the demographic variables outlined in Table 7-37,
Models 2 and 5b were examined for between-group invariance. Considering that
the smaller groups for part-time/full-time (n = 78) and respondent origin (n =
76) fell some way below the minimum recommended sample size (100) for SEM,
these two groups were not expected to perform well in terms of producing multi-
group models for the more complex Model 5b.
It was hoped, however, that for the simpler Model 2, adequate model fit might be
achieved. Multi-group analyses based on the tenure groupings
(seasonal/temporary n = 31 versus permanent n = 152) were not attempted on
either Model 2 or 5b since 31 cases is below any recommended minimum for case
numbers in SEM analysis (see Section 6.5.2).
The results of the multi-groups analysis for Model 2b are summarised in Table
7-38. The only poorly-fitting multi-group model found was that based on the
gender grouping. For this model, although the χ2 estimates were significant (in
the measurement model, p = 0.039 for the unconstrained model and 0.021 for
the constrained; in the structural model 0.014 unconstrained and 0.011
constrained), the CFI and RMSEA estimates were adequate (CFI >0.96 and
RMSEA <0.06). For the gender-based multi-group model, because the χ2 p value
was < 0.05 (i.e. not satisfactory) but the CFI and RMSEA values are satisfactory,
the findings of invariance measurement and structural models can be cautiously
accepted. For the remaining four multi-group models, model fit was satisfactory
according to all fit measures and none of the groupings moderated the effect sizes
for structural paths in Model 2.
Grouping CFA model
fit2
CFA
invariance
SEM model
fit2
Structural
path
invariance
Gender χ2 sig Full metric χ2
sig Invariant
Age Good fit Full metric Good fit Invariant
Length of
employment Good fit Full metric Good fit Invariant
Part- /Full-
time Good fit Full metric Good fit Invariant
Respondent
origin Good fit Full metric Good fit Invariant
Table 7-38 Moderator analysis for Model 2
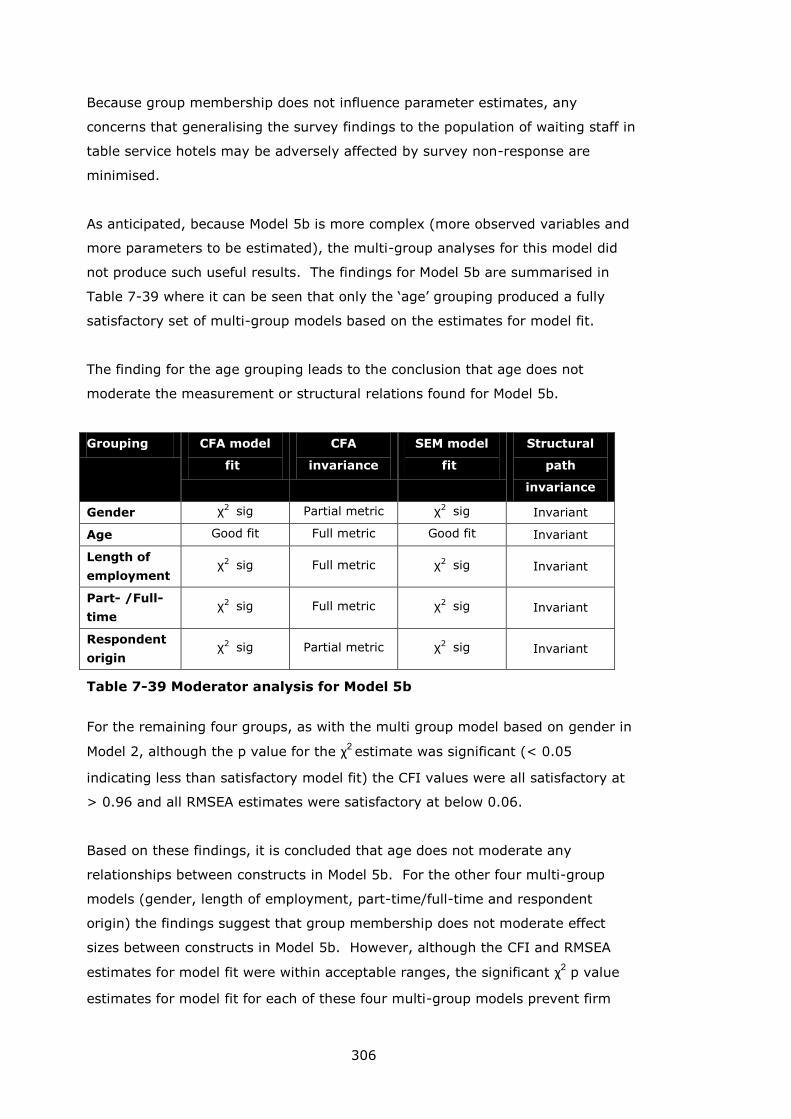
306
Because group membership does not influence parameter estimates, any
concerns that generalising the survey findings to the population of waiting staff in
table service hotels may be adversely affected by survey non-response are
minimised.
As anticipated, because Model 5b is more complex (more observed variables and
more parameters to be estimated), the multi-group analyses for this model did
not produce such useful results. The findings for Model 5b are summarised in
Table 7-39 where it can be seen that only the ‘age’ grouping produced a fully
satisfactory set of multi-group models based on the estimates for model fit.
The finding for the age grouping leads to the conclusion that age does not
moderate the measurement or structural relations found for Model 5b.
Grouping CFA model
fit2
CFA
invariance
SEM model
fit2
Structural
path
invariance
Gender χ2 sig Partial metric χ2 sig Invariant
Age Good fit Full metric Good fit Invariant
Length of
employment χ2 sig Full metric χ2 sig Invariant
Part- /Full-
time χ2 sig Full metric χ2 sig Invariant
Respondent
origin χ2 sig Partial metric χ2 sig Invariant
Table 7-39 Moderator analysis for Model 5b
For the remaining four groups, as with the multi group model based on gender in
Model 2, although the p value for the χ2 estimate was significant (< 0.05
indicating less than satisfactory model fit) the CFI values were all satisfactory at
> 0.96 and all RMSEA estimates were satisfactory at below 0.06.
Based on these findings, it is concluded that age does not moderate any
relationships between constructs in Model 5b. For the other four multi-group
models (gender, length of employment, part-time/full-time and respondent
origin) the findings suggest that group membership does not moderate effect
sizes between constructs in Model 5b. However, although the CFI and RMSEA
estimates for model fit were within acceptable ranges, the significant χ2 p value
estimates for model fit for each of these four multi-group models prevent firm
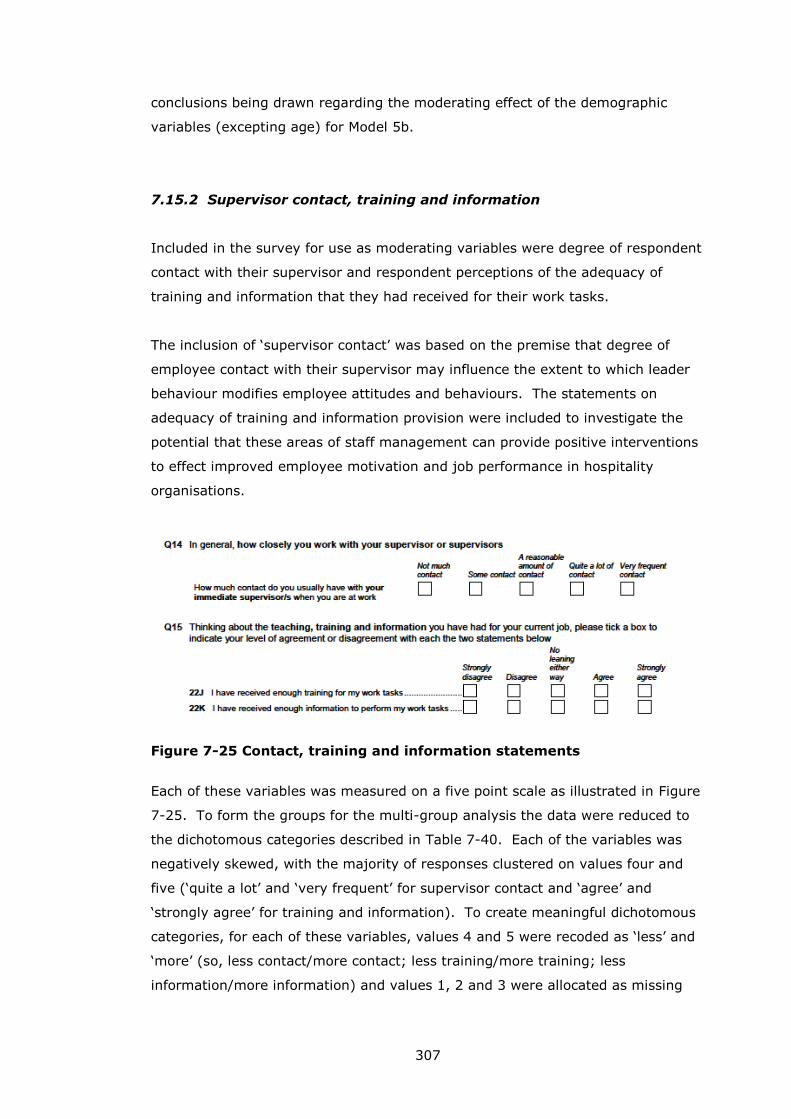
307
conclusions being drawn regarding the moderating effect of the demographic
variables (excepting age) for Model 5b.
7.15.2 Supervisor contact, training and information
Included in the survey for use as moderating variables were degree of respondent
contact with their supervisor and respondent perceptions of the adequacy of
training and information that they had received for their work tasks.
The inclusion of ‘supervisor contact’ was based on the premise that degree of
employee contact with their supervisor may influence the extent to which leader
behaviour modifies employee attitudes and behaviours. The statements on
adequacy of training and information provision were included to investigate the
potential that these areas of staff management can provide positive interventions
to effect improved employee motivation and job performance in hospitality
organisations.
Figure 7-25 Contact, training and information statements
Each of these variables was measured on a five point scale as illustrated in Figure
7-25. To form the groups for the multi-group analysis the data were reduced to
the dichotomous categories described in Table 7-40. Each of the variables was
negatively skewed, with the majority of responses clustered on values four and
five (‘quite a lot’ and ‘very frequent’ for supervisor contact and ‘agree’ and
‘strongly agree’ for training and information). To create meaningful dichotomous
categories, for each of these variables, values 4 and 5 were recoded as ‘less’ and
‘more’ (so, less contact/more contact; less training/more training; less
information/more information) and values 1, 2 and 3 were allocated as missing
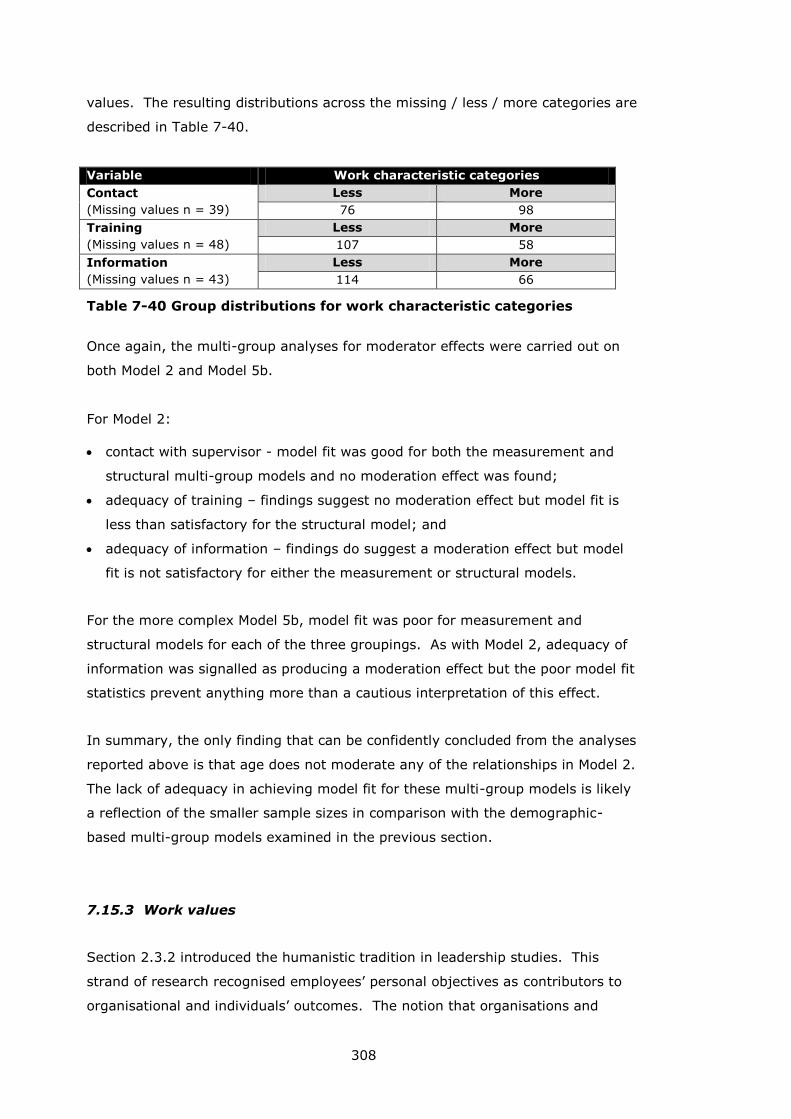
308
values. The resulting distributions across the missing / less / more categories are
described in Table 7-40.
Variable Work characteristic categories
Contact
(Missing values n = 39)
Less More
76 98
Training
(Missing values n = 48)
Less More
107 58
Information
(Missing values n = 43)
Less More
114 66
Table 7-40 Group distributions for work characteristic categories
Once again, the multi-group analyses for moderator effects were carried out on
both Model 2 and Model 5b.
For Model 2:
contact with supervisor - model fit was good for both the measurement and
structural multi-group models and no moderation effect was found;
adequacy of training – findings suggest no moderation effect but model fit is
less than satisfactory for the structural model; and
adequacy of information – findings do suggest a moderation effect but model
fit is not satisfactory for either the measurement or structural models.
For the more complex Model 5b, model fit was poor for measurement and
structural models for each of the three groupings. As with Model 2, adequacy of
information was signalled as producing a moderation effect but the poor model fit
statistics prevent anything more than a cautious interpretation of this effect.
In summary, the only finding that can be confidently concluded from the analyses
reported above is that age does not moderate any of the relationships in Model 2.
The lack of adequacy in achieving model fit for these multi-group models is likely
a reflection of the smaller sample sizes in comparison with the demographic-
based multi-group models examined in the previous section.
7.15.3 Work values
Section 2.3.2 introduced the humanistic tradition in leadership studies. This
strand of research recognised employees’ personal objectives as contributors to
organisational and individuals’ outcomes. The notion that organisations and
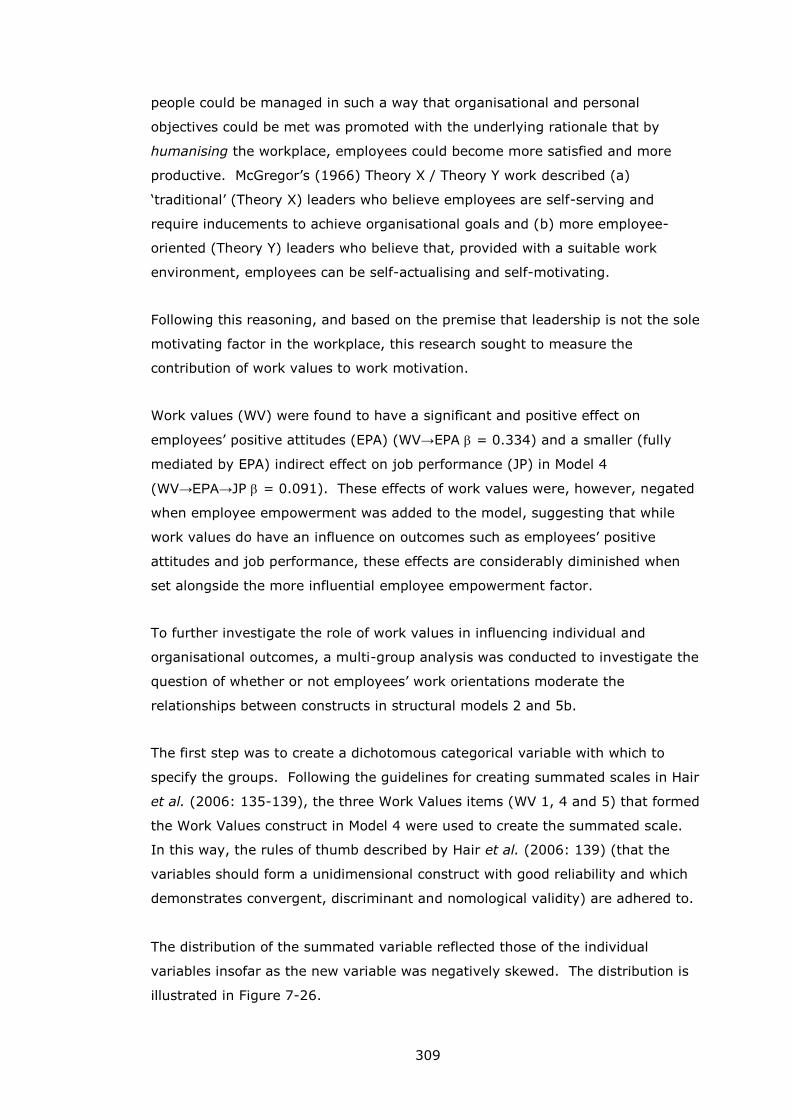
309
people could be managed in such a way that organisational and personal
objectives could be met was promoted with the underlying rationale that by
humanising the workplace, employees could become more satisfied and more
productive. McGregor’s (1966) Theory X / Theory Y work described (a)
‘traditional’ (Theory X) leaders who believe employees are self-serving and
require inducements to achieve organisational goals and (b) more employee-
oriented (Theory Y) leaders who believe that, provided with a suitable work
environment, employees can be self-actualising and self-motivating.
Following this reasoning, and based on the premise that leadership is not the sole
motivating factor in the workplace, this research sought to measure the
contribution of work values to work motivation.
Work values (WV) were found to have a significant and positive effect on
employees’ positive attitudes (EPA) (WV→EPA = 0.334) and a smaller (fully
mediated by EPA) indirect effect on job performance (JP) in Model 4
(WV→EPA→JP = 0.091). These effects of work values were, however, negated
when employee empowerment was added to the model, suggesting that while
work values do have an influence on outcomes such as employees’ positive
attitudes and job performance, these effects are considerably diminished when
set alongside the more influential employee empowerment factor.
To further investigate the role of work values in influencing individual and
organisational outcomes, a multi-group analysis was conducted to investigate the
question of whether or not employees’ work orientations moderate the
relationships between constructs in structural models 2 and 5b.
The first step was to create a dichotomous categorical variable with which to
specify the groups. Following the guidelines for creating summated scales in Hair
et al. (2006: 135-139), the three Work Values items (WV 1, 4 and 5) that formed
the Work Values construct in Model 4 were used to create the summated scale.
In this way, the rules of thumb described by Hair et al. (2006: 139) (that the
variables should form a unidimensional construct with good reliability and which
demonstrates convergent, discriminant and nomological validity) are adhered to.
The distribution of the summated variable reflected those of the individual
variables insofar as the new variable was negatively skewed. The distribution is
illustrated in Figure 7-26.
310
Figure 7-26 Distribution of the Work Values summated scale variable
To create a meaningful categorisation:
the new summated variable was recoded to designate value 3 to 9 as missing;
the remaining six values were recoded as follows:
o values 10, 11 and 12 were combined to create a category labelled
‘moderate work values’; and
o values 13, 14 and 15 were combined to create a category labelled
‘high work values’
This recoding created two approximately equal and meaningful categories,
moderate and high work values, as described in Table 7-41. Values 3 to 9 that
were designated as missing represented only 16 of the 209 valid values in the
original summated scale and four of the 20 missing values were missing from the
survey forms.
Variable Work values
Contact
(Missing values n = 20)
Moderate High
105 88
Table 7-41 Distribution of the Work Values reduced and recoded
summated scale variable
Following a by now familiar theme, the tests for moderator effects using the Work
Values summated scale categories produced good fitting multi-group
measurement and structural models when applied to Model 2 and models with
unsatisfactory fit when applied to Model 5b.
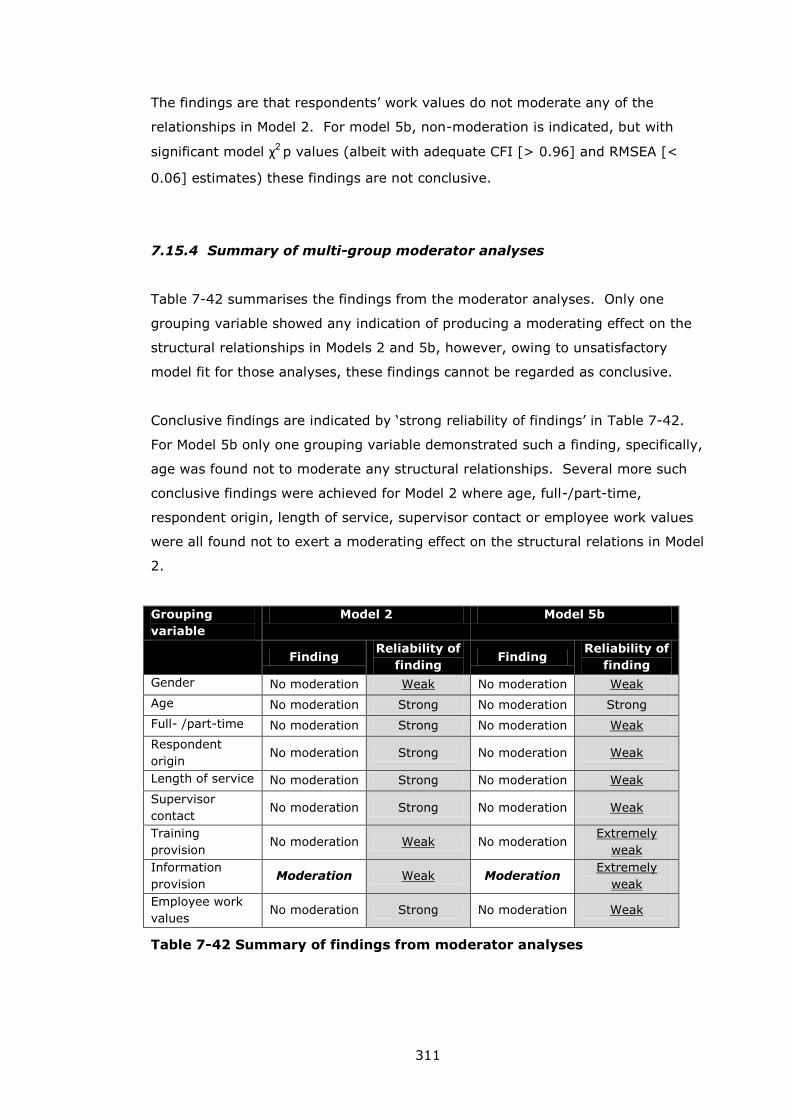
311
The findings are that respondents’ work values do not moderate any of the
relationships in Model 2. For model 5b, non-moderation is indicated, but with
significant model χ2 p values (albeit with adequate CFI [> 0.96] and RMSEA [<
0.06] estimates) these findings are not conclusive.
7.15.4 Summary of multi-group moderator analyses
Table 7-42 summarises the findings from the moderator analyses. Only one
grouping variable showed any indication of producing a moderating effect on the
structural relationships in Models 2 and 5b, however, owing to unsatisfactory
model fit for those analyses, these findings cannot be regarded as conclusive.
Conclusive findings are indicated by ‘strong reliability of findings’ in Table 7-42.
For Model 5b only one grouping variable demonstrated such a finding, specifically,
age was found not to moderate any structural relationships. Several more such
conclusive findings were achieved for Model 2 where age, full-/part-time,
respondent origin, length of service, supervisor contact or employee work values
were all found not to exert a moderating effect on the structural relations in Model
2.
Grouping
variable
Model 2 Model 5b
Finding
Reliability of
finding Finding
Reliability of
finding
Gender No moderation Weak No moderation Weak
Age No moderation Strong No moderation Strong
Full- /part-time No moderation Strong No moderation Weak
Respondent
origin No moderation Strong No moderation Weak
Length of service No moderation Strong No moderation Weak
Supervisor
contact No moderation Strong No moderation Weak
Training
provision No moderation Weak No moderation
Extremely
weak
Information
provision Moderation Weak Moderation
Extremely
weak
Employee work
values No moderation Strong No moderation Weak
Table 7-42 Summary of findings from moderator analyses
312
Where the demographic and work characteristic variables showed strong support
for non-moderation20, an indication that these research findings are not adversely
affected by non-response bias is provided and, accordingly, there can be some
degree of confidence that the findings will generalise to the population of interest.
As a caveat, however, the strongest indication for generalisability of findings
would be provided by model cross-validation in an independent sample, an
exercise that has not been possible within the scope of this research.
7.16 Model 8: Mission Clarity
The final variable to be subjected to analysis concerns employee mission clarity.
Hinkin and Tracey (1994: 55) defined mission clarity as employees’ understanding
of the purpose, mission and goals of their organisation and those authors found
that transformational leadership (TL) behaviour exerted a positive influence on
employees’ levels of goal clarity (GC) (Hinkin and Tracey 1994 TL→GC = 0.37;
Tracey and Hinkin 1996 TL→GC = 0.31).
For this research, mission clarity was measured using a single statement at the
end of Question 5 in the survey form and was worded “I clearly understand what
my company’s goals/targets are” with response options on a five-point scale from
Strongly Disagree to Strongly Agree. This item is labelled as MC1 in the coded
version of the survey form in Appendix VIII although in the pre-test (Appendix VI)
and pilot (Appendix VII) questionnaires it was labelled as GF1 (Goal Focus).
The theoretical link between transformational / motivational leadership and
mission clarity is emphasised in the Inspirational Motivational (IM) dimension of
transformational leadership (see e.g. Avolio and Bass 2004a: 96) and a goal-
setting element to employee empowerment is described by Nixon (1994) and, in a
hospitality context, by Erstad (1997). Elsewhere Lashley (1995, 1996) has
discussed the goal-related dimensions of employee empowerment in terms of
employee empowerment creating a shared sense of purpose between managers
and employees (i.e. employees have greater clarity regarding organisational/team
goals) and also cites greater employee commitment to goals as an outcome of
employee empowerment. Goal, or mission, clarity would appear to be a key
element in underpinning employees’ contribution to goal achievement.
20 In Model; 2: age, full-/part-time, respondent origin and length of service in Model
2; and in Model 5b, age.
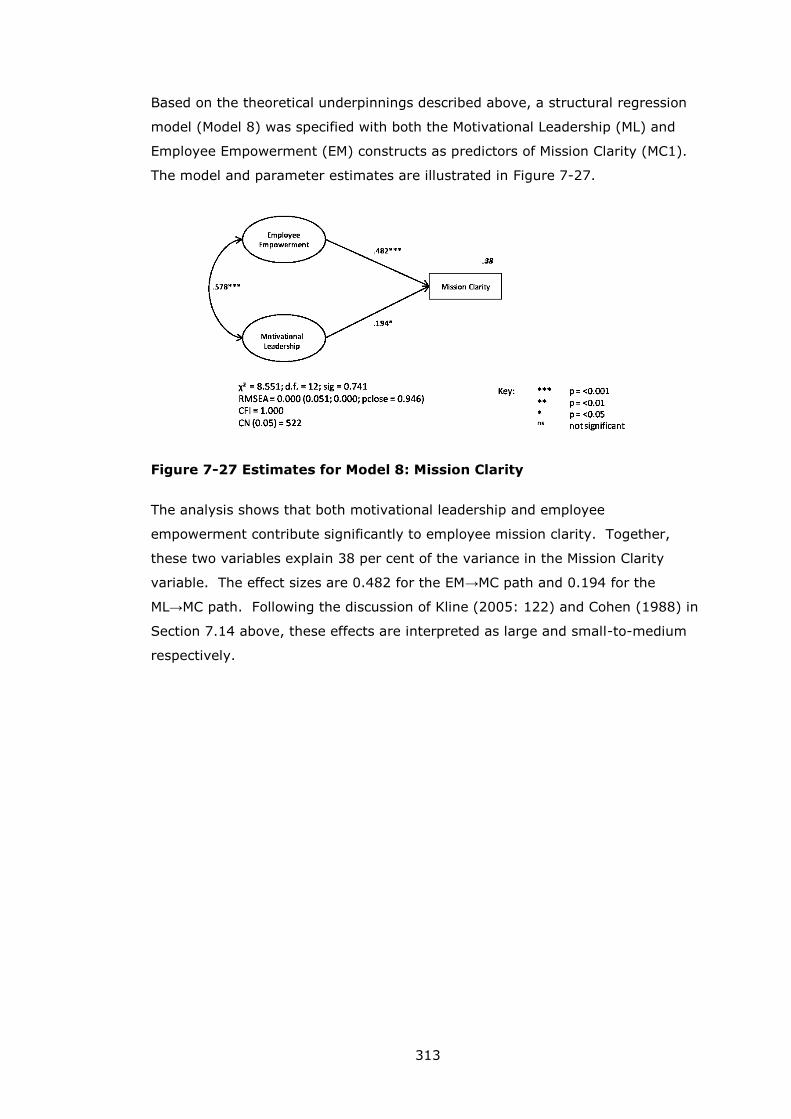
313
Based on the theoretical underpinnings described above, a structural regression
model (Model 8) was specified with both the Motivational Leadership (ML) and
Employee Empowerment (EM) constructs as predictors of Mission Clarity (MC1).
The model and parameter estimates are illustrated in Figure 7-27.
Figure 7-27 Estimates for Model 8: Mission Clarity
The analysis shows that both motivational leadership and employee
empowerment contribute significantly to employee mission clarity. Together,
these two variables explain 38 per cent of the variance in the Mission Clarity
variable. The effect sizes are 0.482 for the EM→MC path and 0.194 for the
ML→MC path. Following the discussion of Kline (2005: 122) and Cohen (1988) in
Section 7.14 above, these effects are interpreted as large and small-to-medium
respectively.
314
8 REVIEW, DISCUSSION AND CONCLUSION
This chapter concludes the thesis by discussing the research findings with regard
to the theoretical and practical implications that flow from them, and how future
research might build upon them.
Before looking to the future, the rationale for the research design is reviewed and
the model development process is summarised, highlighting the significant
modifications to, and important findings from, each iteration of the model. The
contributions of, and new conceptualisations from, the research are then
discussed along with suggestions for future research to address both the issues
that arise from the research findings and from the limitations of the current
research.
8.1 Précis of the research
This research has aimed to:
explore and evaluate the contribution of motivational leadership to employee
work motivation in hospitality services.
Addressing calls in the broader leadership (Lowe and Gardner 2000: 496-498)
and organisational studies (Johns 2001; Rousseau and Fried 2001) literature for
more integrated research approaches that link workplace phenomena (i.e. do not
study individual phenomena in isolation), motivational leadership has been
located within the broader organisational / motivational context by measuring a
number of non-leadership contributors (e.g. empowerment and employees’ work
values) to employee work motivation.
The following specific research objectives have been pursued:
1. critically evaluate the field of hospitality leadership studies to identify relevant
issues and inform the research design;
2. develop a theoretical framework to:
a. locate the variables of interest in relation to existing organisational
psychology theories;
b. articulate the likely linkages between variables; and
c. guide the formulation of specific hypotheses;
315
3. identify/generate measurement scales for the latent variables;
4. refine the measurement scales; and
5. test and evaluate the relationships between the latent variables using survey
data collected from hotel restaurant waiting staff.
To underpin the critical review of the field of hospitality leadership studies
(Objective 1), the research began by describing the major theoretical
developments in the generic leadership studies field, while also drawing out
relevant issues for consideration in this study. The issues identified were:
employees’ work orientations / work values (Section 2.3.2);
adequacy of information provision and training and degree of autonomy /
empowerment (Section 2.3.3);
motivational leadership and job performance (Section 2.4); and
work meaning emerges as a variable of interest from Sections 2.3.2, 2.3.3 and
2.4.
The review of generic leadership studies provided a framework within which to
categorise the theoretical approaches utilised in the published hospitality
leadership research. The research identified 46 published articles examining
leadership issues in hospitality contexts that utilised theory drawn from the field
of leadership studies. The review of these articles found that the hospitality
leadership field is fragmented with regard to the range of approaches taken and
the research questions pursued.
Because of this lack of theoretical or empirical consistency and integration, it is
difficult to specify knowledge gaps in the area. One important gap identified was
the significant lack of hospitality studies that have addressed the causal link
between leadership and job performance.
With regard to the theoretical foci of the hospitality leadership studies, the
analysis revealed that transformational leadership has been the most-utilised
theoretical approach (26 per cent of all papers), in particular, during the 1990s
(40 per cent of all published studies) and during 2000-2010 (26 per cent of all
published studies).
Because transformational leadership has been the most frequently utilised
theoretical approach, it provides the broadest theoretical and empirical knowledge
base upon which to build. Accordingly, future hospitality leadership research
316
might fruitfully focus on this approach to enhance our understanding of the field
through a process of iterative augmentation of knowledge generation.
Transformational leadership theory is also capable of accommodating the full
range of leader behaviours by conceptualising both transformational and
transactional leader behaviours. This breadth of scope lends transformational
leadership a contextual flexibility that means it can be used as a measurement
tool for understanding leader behaviour and leadership outcomes in the wide
range of organisational contexts (e.g. differing: organisational focus such as
catering, events or accommodation; organisational size; leader behaviour /
leadership style; nature of customers e.g. leisure / business) that exist in the
hospitality sector.
Significantly, transformational leadership, through its Inspirational Motivational
(IM) dimension, addresses a key issue in hospitality management, that of
employee work motivation. Inspirational Motivation (IM) describes the capacity of
transformational leaders to inspire, motivate and provide and shape meaning for
employees by emphasising priorities, purpose and a vision for goal achievement
(Avolio et al. 1991; Bass 1999). For service staff experiencing challenging
employment characteristics (e.g. low pay, long and anti-social hours, unstable
and seasonal employment, low job status, lack of career progression opportunities
and poor levels of employment benefits), the presence and influence of an
inspirational leader who can provide or enhance work meaning, motivate them to
perform well and increase their levels of job satisfaction may be welcomed.
These findings from the review of the generic and hospitality-specific leadership
literatures informed the decision to draw upon the Inspirational Motivational (IM)
dimension of transformational leadership theory to measure motivational
leadership.
Regarding work motivation, this can be measured using both attitudinal and
behavioural measures (Ambrose and Kulik 1999: 232). The review of hospitality
leadership research identified three attitudinally-based variables that can each be
regarded as manifestations of employee work motivation. Employee job
satisfaction and affective organisational commitment are frequently used in both
the general and hospitality-specific organisational psychology and organisational
behaviour research while the third attitude measure, work meaning, is drawn
from transformational leadership theory (Avolio and Bass 2004a: 96; Bass and
Riggio 2006: 6).
317
Two principal behavioural measures of work motivation are employed. The first
(Job Performance) is a respondent self-assessment measure of extra effort drawn
from the transformational leadership literature (Avolio and Bass 2004; Bass and
Riggio 2006) and the second (Discretionary Service Behaviour) is a peer-
assessment of extra effort based on earlier work by Blancero and Johnson (1997,
2001) and by Simons and Roberson (2003). An exploratory third measure of job
performance (Service Quality) is included that utilises a scale (developed for this
research) that attempts to measure performance based on service quality.
In summary, the initial reviews of the literature informed the design of the
research wherein the contribution of motivational leadership to employee work
motivation is evaluated by:
(i) drawing upon a core aspect of transformational leadership theory (motivational
leader behaviour); to
(ii) addressing a significant knowledge gap in the hospitality leadership literature -
the link between leadership and job performance.
With regard to the goal of adopting more integrated research approaches that link
workplace phenomena, the literature review process also sought to identify non-
leadership variables that may contribute to service employees’ attitudes and
behaviours. Accordingly, employee work orientations (work values) and
employee perceptions of empowerment were both measured as predictors of
employee attitudes, and social support (peer support) was measured as a
predictor of job performance.
The review of the hospitality leadership research literature also identified Pittway
et al.’s 1998 review of leadership-related hospitality research. In common with
the current research, Pittaway et al. sought to identify how future research in the
field of hospitality leadership might usefully progress. It is argued in this research
(in Section 3.11.2 above), however, that because Pittaway et al.’s analytical
framework was based on ontological perspectives drawn from generic leadership
studies, their analysis does not adequately address the requirements for
progressing applied (hospitality) leadership research studies following the
iterative and deductive model of positivistic social science.
The current research takes a contrasting approach to that of Pittaway et al. by
basing its recommendations for future hospitality leadership research on a
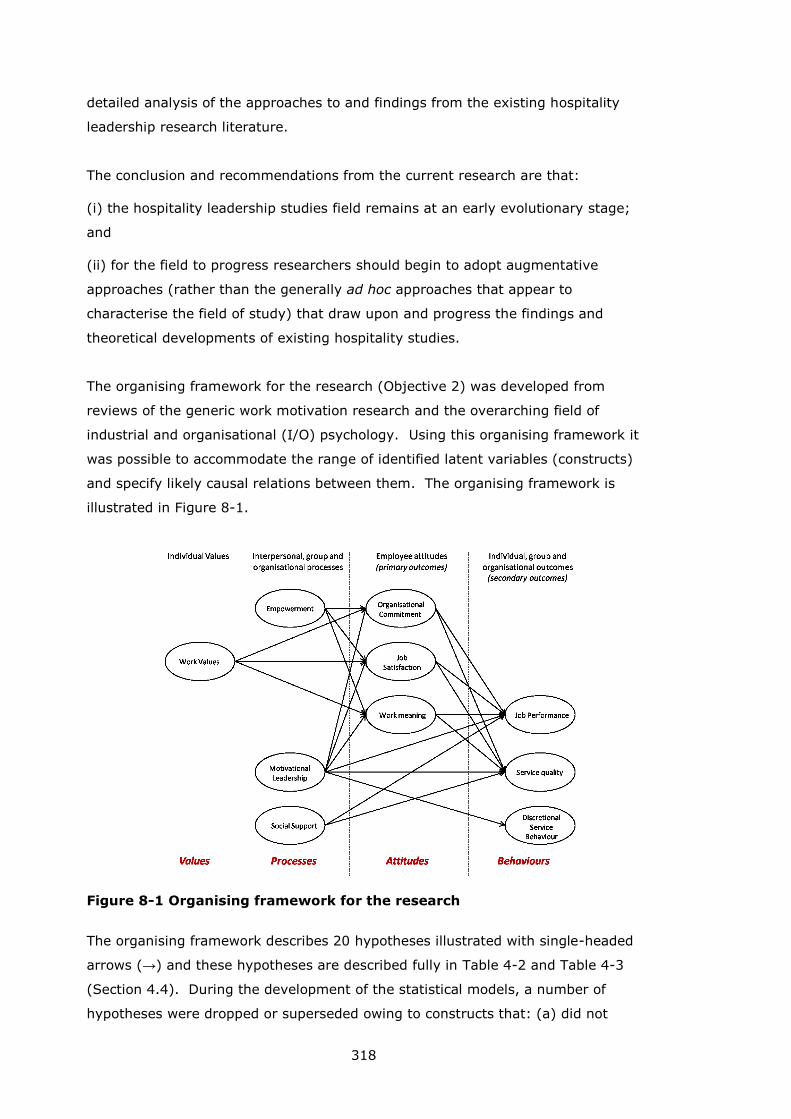
318
detailed analysis of the approaches to and findings from the existing hospitality
leadership research literature.
The conclusion and recommendations from the current research are that:
(i) the hospitality leadership studies field remains at an early evolutionary stage;
and
(ii) for the field to progress researchers should begin to adopt augmentative
approaches (rather than the generally ad hoc approaches that appear to
characterise the field of study) that draw upon and progress the findings and
theoretical developments of existing hospitality studies.
The organising framework for the research (Objective 2) was developed from
reviews of the generic work motivation research and the overarching field of
industrial and organisational (I/O) psychology. Using this organising framework it
was possible to accommodate the range of identified latent variables (constructs)
and specify likely causal relations between them. The organising framework is
illustrated in Figure 8-1.
Figure 8-1 Organising framework for the research
The organising framework describes 20 hypotheses illustrated with single-headed
arrows (→) and these hypotheses are described fully in Table 4-2 and Table 4-3
(Section 4.4). During the development of the statistical models, a number of
hypotheses were dropped or superseded owing to constructs that: (a) did not
319
demonstrate statistically significant correlations with the other constructs in the
model (Social Support and Service Quality); (b) did not demonstrate discriminant
validity within the wider model (Job Satisfaction, Affective Organisational
Commitment and Work Meaning21); or (c) did not exert a statistically significant
effect on any other constructs (Work Values). This process is described in Section
8.2 below.
Following the evolutionary development of the models, a smaller set of eight
hypotheses that had been satisfactorily tested remained. These hypotheses are
described in Table 8-1 below along with a further two hypotheses relating to
mission clarity that are not included in the organising framework.
Objectives 3 and 4 were concerned with the development (based on interrogation
of existing literature and expert judging) and refinement (by means of the pre-
test and pilot surveys) of the measurement scales for the latent variables
illustrated in Figure 8-1.
Research Objective 5, to test and evaluate the relationships between the latent
variables, was accomplished using data collected using a questionnaire survey of
hotel restaurant waiting staff. The data collection process and assessment of the
data are described in Sections 6.5 and 6.6 while Section 8.2 below summarises
the model development process highlighting the significant modifications to, and
important findings from, each iteration of the model. The contributions of the
research, new conceptualisations and implications for research and for practice
are then discussed in Section 8.3.
8.2 The model development process
Data were collected from waiting staff in hotel restaurants in the UK and analysed
using structural equation modelling (SEM). A model generating (MG) approach
was utilised in which models are developed through iterative modification and re-
testing with the same data (Jöreskog 1993: 295; Raykov and Marcolides 2006:
7).
21 The Work Meaning construct performed satisfactorily in the absence of the other
two attitudinal constructs (Model 2) but in later models (Models 3 to 5b), the three
attitudinal constructs were consolidated into one construct owing to a lack of
discriminant validity between them.
320
This development process resulted in two substantive models:
Model 2, describing the relationships between Motivational Leadership (ML),
Work Meaning (ME), Job Performance (JP) and Discretionary Service Behaviour
(DSB); and
Model 5b, describing the relationships between Employee Empowerment (EM),
Motivational Leadership (ML), Employee Positive Attitudes (EPA), Job
Performance (JP) and Discretionary Service Behaviour (DSB).
The model development process is reviewed immediately below and the important
findings from each model iteration are highlighted. Section 8.3 then goes on to
discuss these relationships and their implications for hospitality and leadership
research in greater detail.
The models were developed in an iterative manner with the core hypotheses
being examined first and successive constructs being added to the model
thereafter. In this way, the core hypotheses (H1 to H4) testing the relationships
between motivational leadership, work meaning and job performance (JP and
DSB) are tested in the absence of additional, and potentially confounding,
constructs.
This approach was justified by two findings. Firstly, the hypotheses relating to
Work Meaning (H3 and H4) could not (with hindsight) have been tested if the full
model was initially specified. This is because the three employee attitude
constructs (Work Meaning, Affective Organisational Commitment and Job
Satisfaction) did not demonstrate sufficient discriminant validity, meaning that
they could not be included as discrete entities within one model. Secondly, the
effect of work values on employee work attitudes (Model 4) would have been
overlooked had the Work Values construct not been modelled separately from the
Employee Empowerment construct.
Model 1 tested the effect of motivational leadership (the ML construct) on self-
reported job performance (the Job Performance construct, JP) and peer-assessed
job performance (the Discretionary Service Behaviour construct, DSB). This
model established that these three constructs did resolve as valid statistical
artefacts and are related at a statistically significant level. Modifications in the
form of removal of some indicator variables were made to each construct in order
to produce a model that fitted well to the data.
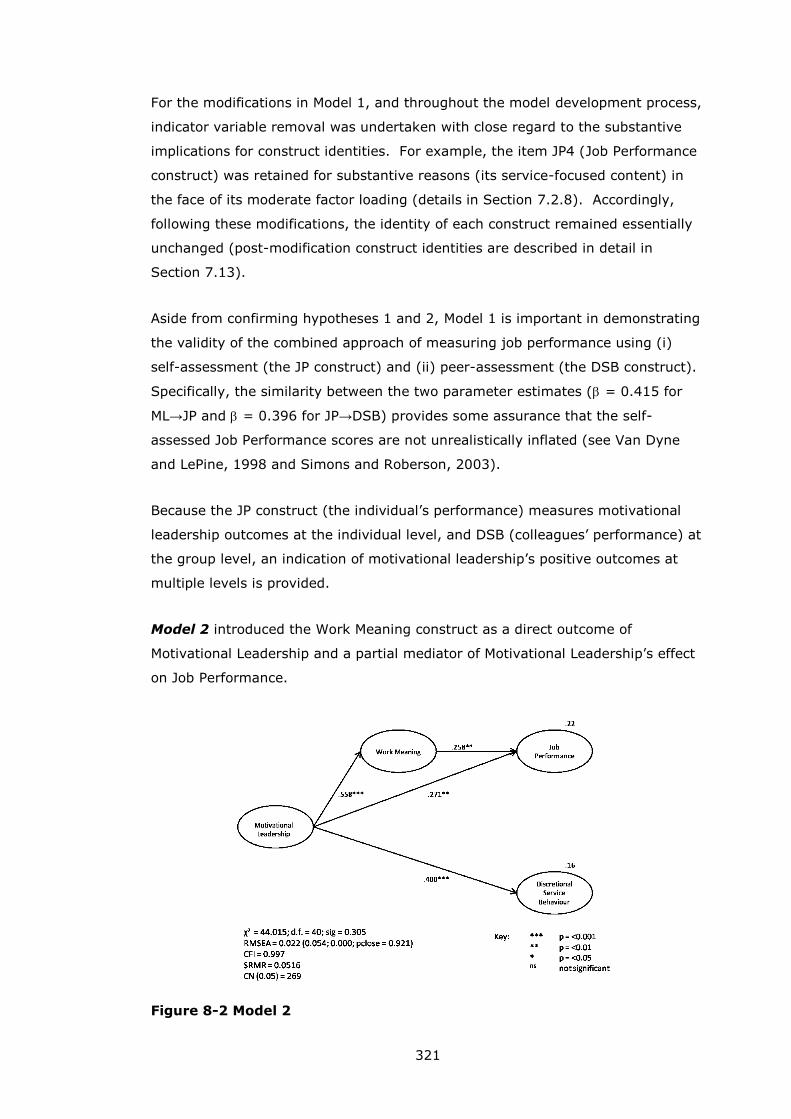
321
For the modifications in Model 1, and throughout the model development process,
indicator variable removal was undertaken with close regard to the substantive
implications for construct identities. For example, the item JP4 (Job Performance
construct) was retained for substantive reasons (its service-focused content) in
the face of its moderate factor loading (details in Section 7.2.8). Accordingly,
following these modifications, the identity of each construct remained essentially
unchanged (post-modification construct identities are described in detail in
Section 7.13).
Aside from confirming hypotheses 1 and 2, Model 1 is important in demonstrating
the validity of the combined approach of measuring job performance using (i)
self-assessment (the JP construct) and (ii) peer-assessment (the DSB construct).
Specifically, the similarity between the two parameter estimates ( = 0.415 for
ML→JP and = 0.396 for JP→DSB) provides some assurance that the self-
assessed Job Performance scores are not unrealistically inflated (see Van Dyne
and LePine, 1998 and Simons and Roberson, 2003).
Because the JP construct (the individual’s performance) measures motivational
leadership outcomes at the individual level, and DSB (colleagues’ performance) at
the group level, an indication of motivational leadership’s positive outcomes at
multiple levels is provided.
Model 2 introduced the Work Meaning construct as a direct outcome of
Motivational Leadership and a partial mediator of Motivational Leadership’s effect
on Job Performance.
Figure 8-2 Model 2
322
Model 2 is illustrated in Figure 8-2. All paths are statistically significant and the
total (direct plus indirect paths) standardised effects are as follows:
ML→ME = 0.558
ML→JP = 0.415
ML→DSB = 0.400
ME→JP = 0.258
Model 2 confirms that motivational leadership positively influences employees’
work meaning. This effect is postulated in Bass’s transformational leadership
theory (Avolio and Bass 2004a: 96; Bass and Riggio 2006: 6) although the exact
nature of ‘work meaning’ is not made explicit. This research developed an
exploratory Work Meaning construct for testing (based on earlier work by Wollack
et al. 1971) and the post-modification construct identity for Work Meaning is
interpreted as “employees’ satisfaction, enjoyment and social status from work”.
Model 2 is important firstly because it confirms work meaning as an attitudinal
outcome of motivational leadership – no other work identified during the course of
this research has measured work meaning in a leadership context. Accordingly,
this finding is relevant not only for leadership in hospitality but also for the wider
field of generic leadership studies. Secondly, Model 2 confirms work meaning as
a partial mediator of motivational leadership’s effect on job performance, as
illustrated in Figure 8-2.
Model 3 introduced the remaining two hypothesised attitudinal outcomes of
transformational leadership (job satisfaction and affective organisational
commitment) into the model. Like work meaning, these attitudinal constructs are
hypothesised as direct outcomes of motivational leadership and partial mediators
between motivational leadership and job performance.
It was found that the three attitudinal constructs were not sufficiently distinct
from one another based on Fornell and Larcker’s criteria for discriminant validity
(1981: 47). That the three constructs all measure employee attitudes make this
finding entirely plausible.
The model was re-specified (as Model 3b) with all of the indicator variables
loading on one Employee Attitude variable. The model was developed following
the process described in Section 7.6. The re-specified model established a new
construct, labelled Employee Positive Attitudes (EPA) illustrated in Figure 8-3.
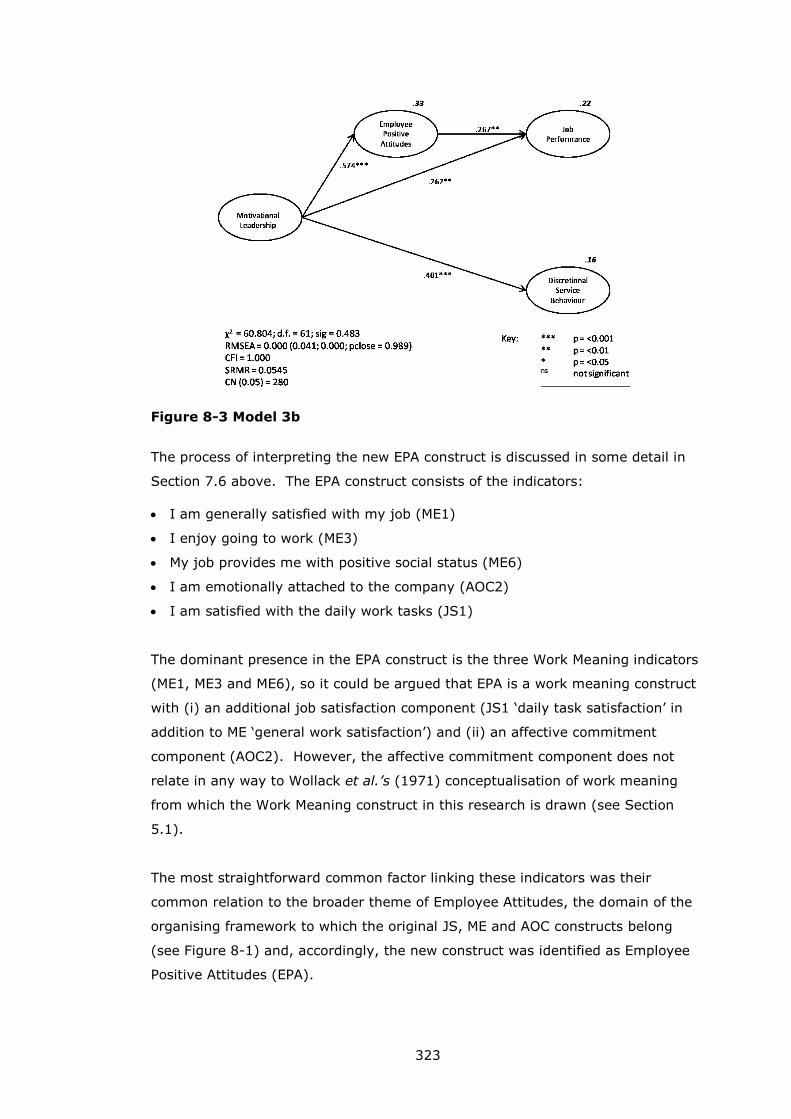
323
Figure 8-3 Model 3b
The process of interpreting the new EPA construct is discussed in some detail in
Section 7.6 above. The EPA construct consists of the indicators:
I am generally satisfied with my job (ME1)
I enjoy going to work (ME3)
My job provides me with positive social status (ME6)
I am emotionally attached to the company (AOC2)
I am satisfied with the daily work tasks (JS1)
The dominant presence in the EPA construct is the three Work Meaning indicators
(ME1, ME3 and ME6), so it could be argued that EPA is a work meaning construct
with (i) an additional job satisfaction component (JS1 ‘daily task satisfaction’ in
addition to ME ‘general work satisfaction’) and (ii) an affective commitment
component (AOC2). However, the affective commitment component does not
relate in any way to Wollack et al.’s (1971) conceptualisation of work meaning
from which the Work Meaning construct in this research is drawn (see Section
5.1).
The most straightforward common factor linking these indicators was their
common relation to the broader theme of Employee Attitudes, the domain of the
organising framework to which the original JS, ME and AOC constructs belong
(see Figure 8-1) and, accordingly, the new construct was identified as Employee
Positive Attitudes (EPA).
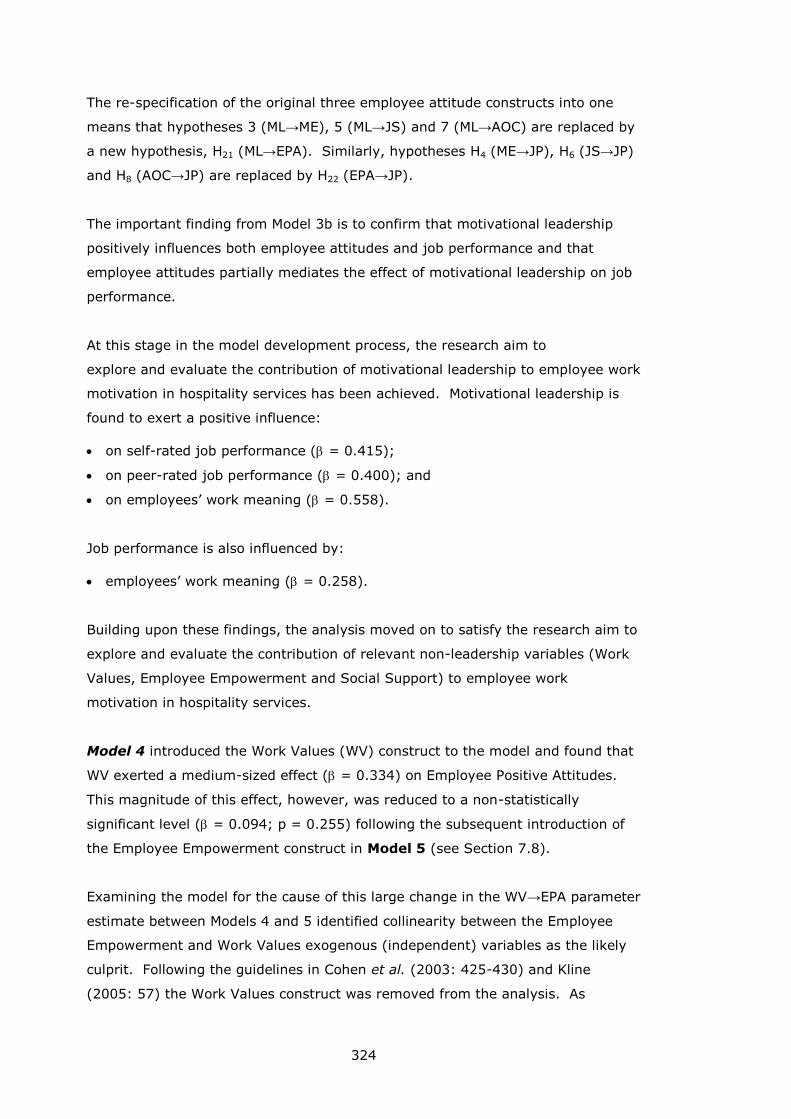
324
The re-specification of the original three employee attitude constructs into one
means that hypotheses 3 (ML→ME), 5 (ML→JS) and 7 (ML→AOC) are replaced by
a new hypothesis, H21 (ML→EPA). Similarly, hypotheses H4 (ME→JP), H6 (JS→JP)
and H8 (AOC→JP) are replaced by H22 (EPA→JP).
The important finding from Model 3b is to confirm that motivational leadership
positively influences both employee attitudes and job performance and that
employee attitudes partially mediates the effect of motivational leadership on job
performance.
At this stage in the model development process, the research aim to
explore and evaluate the contribution of motivational leadership to employee work
motivation in hospitality services has been achieved. Motivational leadership is
found to exert a positive influence:
on self-rated job performance ( = 0.415);
on peer-rated job performance ( = 0.400); and
on employees’ work meaning ( = 0.558).
Job performance is also influenced by:
employees’ work meaning ( = 0.258).
Building upon these findings, the analysis moved on to satisfy the research aim to
explore and evaluate the contribution of relevant non-leadership variables (Work
Values, Employee Empowerment and Social Support) to employee work
motivation in hospitality services.
Model 4 introduced the Work Values (WV) construct to the model and found that
WV exerted a medium-sized effect ( = 0.334) on Employee Positive Attitudes.
This magnitude of this effect, however, was reduced to a non-statistically
significant level ( = 0.094; p = 0.255) following the subsequent introduction of
the Employee Empowerment construct in Model 5 (see Section 7.8).
Examining the model for the cause of this large change in the WV→EPA parameter
estimate between Models 4 and 5 identified collinearity between the Employee
Empowerment and Work Values exogenous (independent) variables as the likely
culprit. Following the guidelines in Cohen et al. (2003: 425-430) and Kline
(2005: 57) the Work Values construct was removed from the analysis. As
325
reported in Section 7.8, this removal is also supported by guidelines in the SEM
literature regarding parsimony in model building (Kline 2005: 145-147; Raykov
and Marcolides 2006: 41-43; Byrne 2010: 185). Model 5b - containing the EM
construct but not WV - was specified and estimated as illustrated in Figure 8-4.
Figure 8-4 Model 5b
The removal of the Work Values construct allowed for the development of Model
5b, which is preferable to Model 5 insofar as it satisfies the principle of parsimony
(containing no non-significant parameters) and has a lower ECVI value indicating
that it is slightly more likely to be replicated in an independent sample than Model
5 (see Table 7-31).
The identification of collinearity between Employee Empowerment and Work
Values constructs and the subsequent removal of WV from the model does not,
however, mean that WV has no effect on EPA. It simply means that its effect is
not clear when set alongside the EM construct (in Model 5) because the conditions
of collinearity make the WV→EPA structural coefficient estimate unreliable.
As described in Section 7.8, when collinearity between independent variables is
present, large standard errors can lead to paths being measured as non-
significant and individual regression coefficients can change in magnitude, making
them difficult to interpret. How, then, should the WV→EPA estimate be
interpreted? The most straightforward interpretation is to accept the finding from
Model 4 where the WV→EPA relationship was estimated in the absence of any
326
confounding collinearity. Accordingly, the parameter estimate is accepted as =
0.334 (p <0.001).
Regarding Model 5b, it is also necessary to examine what, if any, effects
multicollinearity has on the parameter estimates in this model. Of particular
interest is the ML→EPA estimate that is reduced in Model 5b (ML→EPA = 0.213,
p <0.01) compared with Model 4 (ML→EPA = 0.446, p <0.001). This is a
considerable reduction and it is likely to have been caused by the moderately high
correlation (collinearity) between the independent variables EM and ML (r =
0.575, p = <0.001).
To further investigate any likely effect of multicollinearity in Model 5b, following
the same procedure described in Section 7.8 for Model 5, a multiple regression
model was specified using summated scales created from the observed variables
for the independents EM, ML and the dependent EPA. The regression model was
estimated using SPSS and the overall model fit was satisfactory (F = 68.436, d.f.
= 2, p < 0.001) with the two independent variables (ML and EM) accounting for
almost half of the variance in Employee Positive Attitudes (EPA) (R2 = 0.476).
The standardised regression coefficient () for Employee Empowerment → EPA
was 0.496 (p <0.001) and the Motivational Leadership → EPA was 0.291 (p
<0.001). The collinearity diagnostics did not indicate any major issues with the
VIF values not exceeding 1.3 and the largest condition index estimated at 12.2.
As noted in Section 7.8, there are no specific statistical criteria for thresholds for
the VIF and condition index multicollinearity diagnostics (Cohen et al. 2003: 424-
425). Hair et al. (2006: 230) advise individual researchers to determine
acceptable degrees of collinearity for their models on the basis that “most defaults
or recommended thresholds still allow for substantial collinearity”. In this case, it
appears that the ML→EPA structural coefficient is being affected (reduced) by the
collinearity between ML and EM, albeit the magnitude of the collinearity (as
evidenced by the summated scale regression model collinearity diagnostics) being
moderate. The assessment here, therefore, is that the likelihood is that a more
accurate estimate for the ML→EPA coefficient lies somewhere between 0.213 (the
Model 5b finding) and 0.446 (the Model 4 finding), i.e. somewhere closer to the
ML→EPA coefficient that was estimated in the absence of collinearity between the
Motivational Leadership and Employee Empowerment constructs.
Relating this matter to the wider theory that is being scrutinised, the ML→EPA
path measures the effect that motivational leadership has on employee attitudes,
327
i.e. an attitudinal outcome of motivational leadership. The research also
measures the Job Performance (JP) construct as a behavioural outcome of
motivational leadership on employees’ behaviour. The total effect of motivational
leadership on job performance is calculated as:
the direct effect, ML→JP, plus
the indirect, ML→EPA * EPA→JB.
The importance of the variation in the ML→EPA between Models 4 and 5b is
diminished when considering the total effects on motivational leadership on job
performance (ML→JPTOT). In Model 4 ML→JPTOT = 0.380 and in Model 5b
ML→JPTOT = 0.315; this is a far smaller reduction than that seen in the direct
ML→EPA parameter estimate. Accounting for the effect of multicollinearity in
Model 5b on the magnitude of ML→JPTOT, we might expect that a more accurate
estimate for ML→JPTOT will lie somewhere between 0.315 and 0.380. Regardless
of whether the adjusted estimate lies towards the bottom or the top of the range,
it will be interpreted (according to Cohen’s 1988 categorisations) as a medium-
strength effect.
Model 5b represents the culmination of the model building exercise. Following
the development and estimation of Model 5b, the Social Support construct was
introduced in Model 6 and the Service Quality construct in Model 7. However,
neither Model 6 nor 7 could be developed into a structural model. In the case of
Model 6, the Social Support construct did not covary at a statistically significant
level with the Job Performance construct (p = 0.227) and therefore the model
was not suitable for further development as a structural model. In the case of
Model 7, the Service Quality construct did not covary at a statistically significant
level with any other construct.
For Model 6, the substantive implications of this outcome is the finding that Social
Support (peer support) is not likely to be a significant predictor of job
performance.
For Model 7, it appears that the exploratory method (see Section 5.4) for
measuring service quality based on employee perceptions of frequency of
maintaining customer satisfaction during service failure events simply did not
work. Indeed, feedback from one hotel manager in a participating hotel indicated
that some respondents did not fully understand the wording for the Service
Quality set of indicator variables (although, unfortunately, no such feedback was
328
received from participants in the pilot study). The important finding from Model 7
is that researchers wishing to assess service quality from the employee’s
perspective should not approach the task in the manner described in this
research!
Attempting to measure service quality in this way was intended to circumvent the
requirement to collect customer data and design a method that ensured that a
causal relationship could be established in the analysis (i.e., the customers who
respond have experienced service from subordinates of the same leader whose
behaviour is being measured). Successfully executing such a method for
assessing service quality is hereby devolved to future researchers and ‘chalked
up’ as ‘an area for future research’. One potential avenue for future researchers
to follow has been identified subsequent to the completion of the data collection
and analysis in this research. Babakus et al. (2003) drew upon the earlier work
of Ruyter and Wetzels (2000) to create a used a construct measuring service
recovery performance. Babakus et al.’s construct is operationalised with five
indicator variables that measure employees’ perceptions and experiences related
to service failure and their research found that (i) management commitment to
service quality positively influenced employees’ affective organisational
commitment (AOC) and job satisfaction (JS) and (ii) that employees’ AOC and JS
in turn positively influenced service recovery performance.
8.2.1 Additional analyses
Following the development of the multi-construct structural equation models, two
smaller models were specified and estimated to measure the contributions of (i)
motivational leadership and empowerment to mission clarity and (ii) employees’
job satisfaction to job performance.
Mission clarity
Section 7.16 describes Model 8 where it was found that both motivational
leadership ( = 0.194) and employee empowerment ( = 0.482) had significant
positive effects on employees’ mission clarity (MC). The motivational leadership
→ mission clarity finding can be compared with Hinkin and Tracey (1994) who
329
found transformational leadership predicting mission clarity ( = 0.370) and
Tracey and Hinkin (1996) estimating the same relationship at = 0.310.
Although mission clarity is not measured as a specific leadership outcome in the
Full-Range Leadership Model (FRLM) of transformational leadership, the notion
that transformational leaders can enhance employees’ understanding of
organisational goals is discussed within the transformational leadership theory
literature, in particular, in the context of the Inspirational Motivational (IM)
dimension (e.g. Hinkin and Tracey 1994: 51). In this current research, the
Motivational Leadership (ML) construct is based on the IM dimension of
transformational leadership, the positive ML→MC link therefore provides an
indication of the face validity of the ML construct, i.e. that the construct does
indeed measure leaders’ motivational / inspirational behaviour.
In their discussion of transformational leadership’s contribution to mission clarity,
Tracey and Hinkin (1996: 167-168) describe how transformational leaders ensure
that employees understand their work objectives. This approach is contrasted
with that of more transactional leaders who tend to clarify objectives and work
responsibilities for employees’ by focusing on how employees should meet role
requirements in exchange for rewards (the work→pay transaction). For
hospitality organisations, one benefit that may arise from the transformational
approach of ensuring that employees understand, rather than simply accept, their
goals is that for low-paid (perhaps also part-time) service staff, the transactional
emphasis on reward may be less effective than for higher-paid staff elsewhere in
the organisation. Put another way, low-pay may not offer the kind of positive
reward that successful transactional leadership approaches depend on.
In one respect, it is perhaps not surprising that this study confirms the
motivational leadership → mission clarity (ML→MC) link. Specifically, this is
because motivational leadership has been measured (based on the Inspirational
Motivational (IM) dimension of transformational leadership theory) as the degree
to which leaders articulate organisational/departmental/team vision and goals and
encourage employees towards achieving these goals. This observation serves as
a reminder that the IM dimension of transformational leadership theory draws
heavily on House’s (1971) Path-Goal leadership theory that focused on how
leaders could enhance organisational effectiveness by clarifying the paths that
would lead to followers successfully achieving work goals. Future hospitality
leadership researchers may wish to examine ways in which the path-goal model -
and the expectancy theories of motivation that path-goal theory drew upon – can
330
provide insights into leadership and motivation in hospitality contexts. This
avenue may prove fruitful since the review of hospitality leadership studies in
Chapter 3 above did not identify any studies adopting a path-goal theoretical
approach.
In summary, regarding the motivational leadership → mission clarity relationship,
this finding:
(i) builds upon the hospitality leadership work of Hinkin and Tracey (1994) and
Tracey and Hinkin (1996) by confirming the ML→MC relationship in an
independent sample; and
(ii) contributes to transformational leadership theory by successfully measuring
the effect of motivational leadership on employees’ mission clarity.
Model 8 also found that employee empowerment also had a significant positive
effect ( = 0.482) on employees’ mission clarity (MC). Mission clarity has been
conceptually related to empowerment processes in Section 7.16 above, which
reports how, for example, Lashley (1995, 1996) has discussed a shared sense of
purpose between managers and employees as an outcome of empowerment. The
discussion of the empowerment→mission clarity relationship will be addressed in
Section 8.3.5 below where the issue of integrating empowerment within future
hospitality leadership research is considered in greater detail.
The ‘holy grail’ of organisational psychology: Job Satisfaction → Job Performance
The consolidation (during the development of Model 3/3b) of the three employee
attitude constructs (Job Satisfaction, Work Meaning and Affective Organisational
Commitment) means that Hypothesis 6, Job Satisfaction → Job Performance
(JS→JP), cannot be measured as part of the larger model.
The successful (and consistent) measurement of this relationship has been called
the ‘holy grail’ of organisational studies (Landy 1985: 410; Weiss 2002: 184). Of
the seventeen hospitality studies identified for this research that included job
satisfaction in their analyses (see Section 5.3) however, none measured the
JS→JP relationship. To address this knowledge gap, a model was specified with
the Job Satisfaction construct as a predictor of Job Performance.
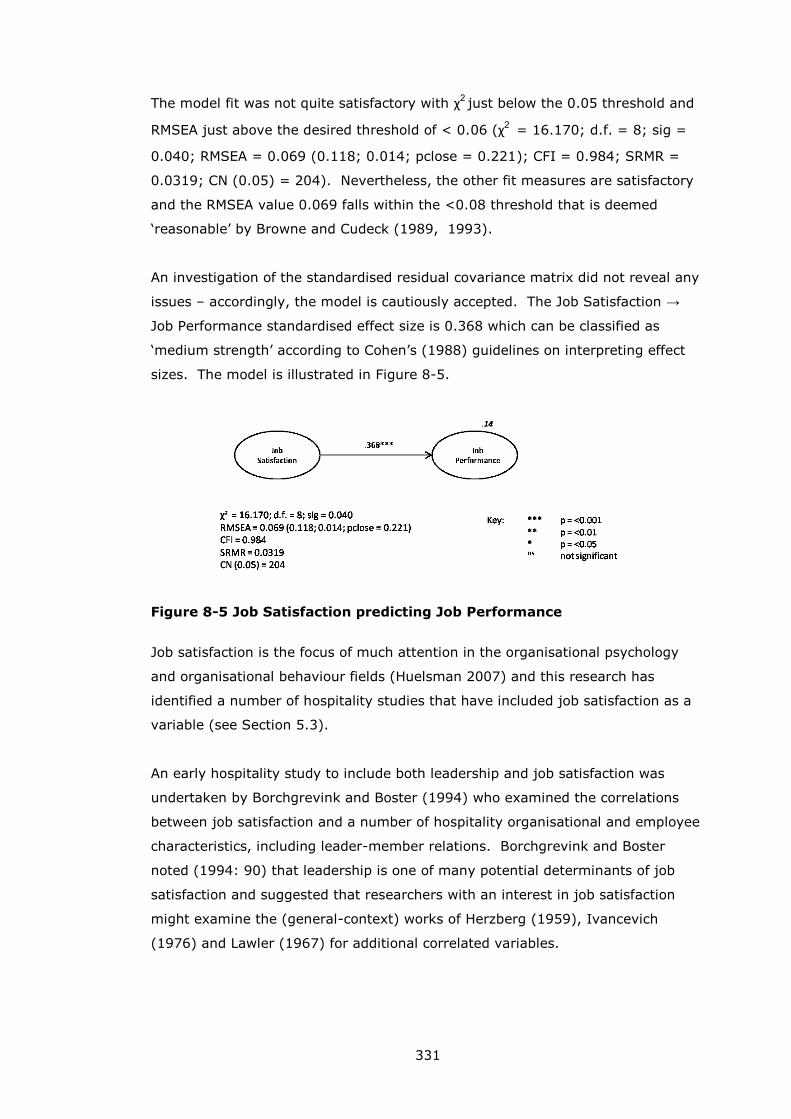
331
The model fit was not quite satisfactory with χ2 just below the 0.05 threshold and
RMSEA just above the desired threshold of < 0.06 (χ2 = 16.170; d.f. = 8; sig =
0.040; RMSEA = 0.069 (0.118; 0.014; pclose = 0.221); CFI = 0.984; SRMR =
0.0319; CN (0.05) = 204). Nevertheless, the other fit measures are satisfactory
and the RMSEA value 0.069 falls within the <0.08 threshold that is deemed
‘reasonable’ by Browne and Cudeck (1989, 1993).
An investigation of the standardised residual covariance matrix did not reveal any
issues – accordingly, the model is cautiously accepted. The Job Satisfaction →
Job Performance standardised effect size is 0.368 which can be classified as
‘medium strength’ according to Cohen’s (1988) guidelines on interpreting effect
sizes. The model is illustrated in Figure 8-5.
Figure 8-5 Job Satisfaction predicting Job Performance
Job satisfaction is the focus of much attention in the organisational psychology
and organisational behaviour fields (Huelsman 2007) and this research has
identified a number of hospitality studies that have included job satisfaction as a
variable (see Section 5.3).
An early hospitality study to include both leadership and job satisfaction was
undertaken by Borchgrevink and Boster (1994) who examined the correlations
between job satisfaction and a number of hospitality organisational and employee
characteristics, including leader-member relations. Borchgrevink and Boster
noted (1994: 90) that leadership is one of many potential determinants of job
satisfaction and suggested that researchers with an interest in job satisfaction
might examine the (general-context) works of Herzberg (1959), Ivancevich
(1976) and Lawler (1967) for additional correlated variables.
332
In a practical hospitality management context, enhancing job satisfaction can
militate against counterproductive organisational outcomes such as employee
turnover (e.g. Carbery et al. 2003; Kim et al. 2005; Tutuncu and Kozak 2007;
Kuruüzüm et al. 2009; Yang 2010) and absenteeism (Kuruüzüm et al. 2009; Yang
2010). Beyond these examples there is a wide range of antecedents,
consequences and correlates of job satisfaction for hospitality researchers to focus
on. Deery’s (2008) recent review, for example, found a number of organisational
attributes and strategies and individuals’ characteristics that can influence job
satisfaction in hospitality contexts.
Recent empirical hospitality studies that have included a focus on job satisfaction
have found that:
role conflict (e.g. having to bend organisational rules to achieve work goals)
and burnout can contribute to reduced job satisfaction (Yang 2010);
good co-worker relationships and employee autonomy can act as positive
determinants of job satisfaction (Yang 2010);
self-determination (autonomy) can positively influence job satisfaction (Chiang
and Jang 2008);
the nature of an organisation’s environment/culture can influence employees’
job satisfaction (Øgaard et al. 2008; Yiing and Ahmad 2009); and
job involvement (an employee’s degree of active participation in their job)
positively influences job satisfaction (Carbery et al. 2003).
This research has tested and (cautiously) found that the ‘holy grail’ of
organisational studies, the job satisfaction → job performance relationship
appears to be manifest in the hospitality service employees sampled for this
research. Given the theoretical significance of this finding, a priority for future
research should be to test this relationship in an independent sample. As
described above, there is a significant range of organisational and individual
variables that are related to job satisfaction for future research to address as
appropriate. Considering, however, the way in which the job satisfaction
construct was not found to be empirically distinct from the other two employee
attitude constructs (work meaning and affective organisational commitment), for
any future research that seeks to improve our understanding of the relationships
between leadership and employee attitudes – and the inter-relationships between
different types of employee attitudes - a further priority should be to build upon
the findings of this research to investigate further the composition of employee
attitudinal constructs and how they inter-relate.
333
Moderator effects
A number of multi-group models were specified to examine how construct
relationships might be affected according to respondent group membership (i.e.
older/younger, full-time/part-time, moderate/high work values). Not all of the
multi-group models demonstrated sufficiently good model fit to produce
conclusive findings. Conclusive findings from the moderator analyses are that:
the construct relationships in Model 2 are not moderated by:
o age
o full- /part-time work status
o respondent origin
o length of service
o degree of supervisor contact or
o employee work values.
For Model 5b, the only conclusive finding is that the construct relationships are
not moderated by respondent age.
The only grouping variable that was indicated as moderating construct
relationships (in both Model 2 and Model 5b) was ‘respondent perception of
adequacy of information provision’. However, less than satisfactory model fit
means that this finding cannot be regarded as conclusive.
In terms of implications for practice, these findings suggest that organisations do
not have to tailor interventions (empowerment strategies or leader training) to
accommodate different workplace groups. Further research is, however, required
to strengthen the current findings with regard to how relationships might be
moderated by adequacy of information provision. Uptake of information and/or
perceptions of adequacy of information provision could be influenced by a number
of organisational (e.g. communication strategy), leadership (e.g. leader
effectiveness as communicator) and individual (e.g. organisational commitment)
factors.
Efforts to relate ‘adequacy of information provision’ (and ‘job knowledge’, the
phrase that was identified in Table 2-6 and gave rise to the inclusion of this
variable in the research) to the wider hospitality management literature revealed
that little research has been carried out into adequacy of information provision
related to how employees should carry out their work duties.
334
Harsha (1998: 133-134) noted that job knowledge is essential for guest service
employees in hotels to perform their roles adequately and went on to link guest
service employees’ job knowledge with effective empowerment processes that
enable hospitality service employees to make their own decisions (and thus
improve customer service through speedy resolution of issues). Elsewhere in the
hospitality research literature dealing with employee empowerment, information
provision has been referred to by Lashley (1995, 1996) and Lashley and
McGoldrick (1994) in the context of empowerment through employee involvement
in organisational processes.
The topic has not, however, received a great deal of attention in these articles. A
targeted review of the hospitality literature may reveal further research that has
addressed the issues of information provision for employees. Indications from
this research are that while adequacy of information provision may be a
significant variable moderating the relationships between the constructs in Models
2 and 5b, there is little existing knowledge of this issue in the published
hospitality research literature.
This apparent paucity of research knowledge in this area suggests that
exploratory research may be required to identify and frame relevant research
questions regarding the nature of information required and how different types of
information and different channels of communication can affect employee job
performance and the inter-relationships between organisations and employees in
hospitality organisations.
8.3 Contributions, new conceptualisations and areas for further
research
The research aim, to explore and evaluate the contribution of motivational
leadership to employee work motivation in hospitality services, has been satisfied.
Work motivation was measured using both employee attitudes and job
performance and the findings demonstrate that:
motivational leadership does contribute (positively) to enhanced employee:
o positive work attitudes; and
o job performance.
positive employee work orientations (Work Values) contribute to enhanced
employee work attitudes;
335
employee empowerment (perceptions of influence) contributes to enhanced
employee work attitudes; and
positive employee work attitudes contribute to enhanced employee job
performance.
The research also:
operationalised the work meaning concept (from the transformational
leadership literature) and evaluated the hitherto unmeasured (positive) effect
of motivational leadership on employees’ work meaning;
evaluated the hitherto (in hospitality studies) unmeasured (positive) effect of
job satisfaction on job performance; and
built upon the work of Hinkin and Tracey (1996) and Tracey and Hinkin (1994)
by measuring a positive effect of motivational leadership on employees’ levels
of mission clarity (understanding of organisational objectives).
Additionally, the research undertook a detailed review of the existing leadership-
related hospitality research literature and found that after almost 40 years of
research effort, the field remains at an early stage of evolutionary development.
This finding was reached based on the assessment that the field is characterised
by a lack of volume and depth and also a general absence of iterative and
augmentative research progress where critiques of concepts, approaches and
findings are addressed by subsequent research studies. Furthermore, the
research recommends that to progress hospitality leadership research in an
iterative and augmentative way, researchers should build upon the approaches
and findings of prior research.
In contrast to Pittaway et al.’s (1998) earlier review of hospitality leadership
research (in which the authors’ recommendations for future research questions
were based on an analysis of ontological approaches to generic leadership
research) the recommendation for the way forward generated by the current
research focus not on outlining specific questions for future research, but on
addressing the previous lack of augmentative, iterative development (i.e. by
critically building upon previous approaches and findings) to help evolve the field.
Table 8-1 below describes the effect size for each of the relationships confirmed
by the research. Following Table 8-1 is a discussion of the implications of the
findings for theory and practice. During this discussion, the contributions of the
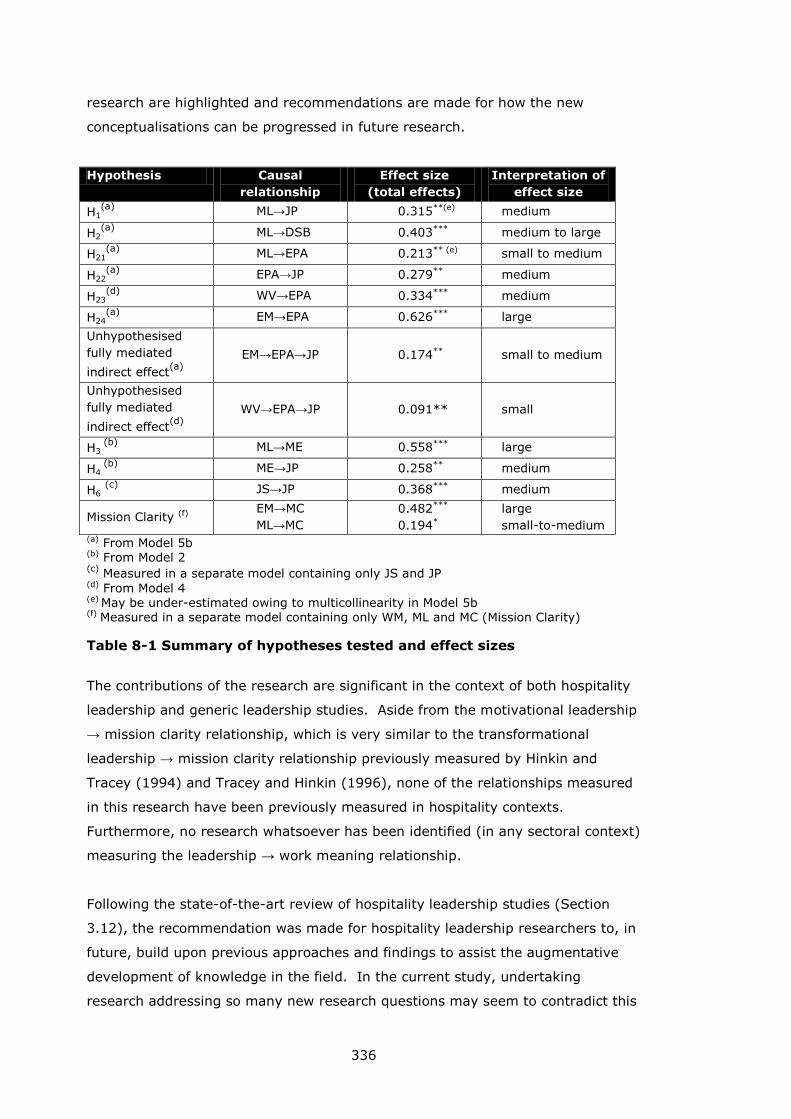
336
research are highlighted and recommendations are made for how the new
conceptualisations can be progressed in future research.
Hypothesis Causal
relationship
Effect size
(total effects)
Interpretation of
effect size
H1(a)
ML→JP 0.315**(e) medium
H2(a)
ML→DSB 0.403*** medium to large
H21(a)
ML→EPA 0.213** (e) small to medium
H22(a)
EPA→JP 0.279** medium
H23(d)
WV→EPA 0.334*** medium
H24(a)
EM→EPA 0.626*** large
Unhypothesised
fully mediated
indirect effect(a)
EM→EPA→JP 0.174** small to medium
Unhypothesised
fully mediated
indirect effect(d)
WV→EPA→JP 0.091** small
H3 (b)
ML→ME 0.558*** large
H4 (b)
ME→JP 0.258** medium
H6 (c)
JS→JP 0.368*** medium
Mission Clarity (f) EM→MC
ML→MC
0.482***
0.194*
large
small-to-medium (a) From Model 5b (b) From Model 2 (c)
Measured in a separate model containing only JS and JP (d) From Model 4 (e)
May be under-estimated owing to multicollinearity in Model 5b (f) Measured in a separate model containing only WM, ML and MC (Mission Clarity)
Table 8-1 Summary of hypotheses tested and effect sizes
The contributions of the research are significant in the context of both hospitality
leadership and generic leadership studies. Aside from the motivational leadership
→ mission clarity relationship, which is very similar to the transformational
leadership → mission clarity relationship previously measured by Hinkin and
Tracey (1994) and Tracey and Hinkin (1996), none of the relationships measured
in this research have been previously measured in hospitality contexts.
Furthermore, no research whatsoever has been identified (in any sectoral context)
measuring the leadership → work meaning relationship.
Following the state-of-the-art review of hospitality leadership studies (Section
3.12), the recommendation was made for hospitality leadership researchers to, in
future, build upon previous approaches and findings to assist the augmentative
development of knowledge in the field. In the current study, undertaking
research addressing so many new research questions may seem to contradict this
337
recommendation. In response to this point, the research has built upon the most-
frequently utilised approach (transformational leadership) focusing in particular on
the Inspirational Motivation (IM) dimension that encapsulates leaders’ goal-
focused motivational behaviour. The research has used this approach to evaluate
the hitherto unexamined but key research question for hospitality organisations,
‘to what extent do motivational leaders effect an increase in employee motivation
/ job performance’?
That so many of the measured relationships are new reflects:
(i) the early evolutionary stage of the field of studies (see Section 3.10), meaning
that there are a great many unanswered and unaddressed research questions;
and
(ii) the inclusion of the newly-developed (and therefore hitherto unmeasured)
Work Meaning (ME) and Employee Positive Attitude (EPA) constructs.
The discussion below considers the implications of the study findings for theory
and practice (which are often closely-linked because of the applied focus of both
the current research and of organisational behaviour theories). Several areas for
further research arise from the findings of the study; some are suggested by new
findings and new conceptualisations while others arise as a result of limitations to
the current research.
8.3.1 Work motivation: behavioural measures
For this research, work motivation has been measured using both attitudinal and
behavioural measures.
Turning firstly to the two behavioural measures, Job Performance (JP) and
Discretionary Service Behaviour (DSB). The Job Performance (JP) measure is a
respondent self-rated measure of extra effort drawn from the Extra Effort
component of Bass’s Full-Range Leadership Model (FRLM) (Avolio and Bass
2004a) (see also Section 5.4). For this research, one of the indicator variables
(JP4 – How often you go out of your way to deal with a guests’ special request?)
specifically focused on service behaviour. This service focus was intended to
make the construct more relevant to hospitality service settings and also to
complement the service–focused nature of the second behavioural measure of
work motivation, Discretionary Service Behaviour (DSB).
338
DSB is a peer-rated measure of work-focused extra effort specifically developed
(by Blancero and Johnson 1997, 2001) for application in service industry settings.
By using both self- and peer-rated measures of service-focused extra effort, the
research sought to provide insights into any self-rater bias that might be manifest
in the survey data and also to examine the outcomes of Motivational Leadership
at both individual and team levels (DSB was measured using respondents’
assessments of colleagues’ guest-focused performance).
The research found that motivational leadership positively influences both of
these job performance measures. Because no prior studies have examined the
link between leadership and employee job performance, these findings represent
unique contributions to hospitality leadership studies.
The implications for practice of this finding are that hospitality organisations
should seek to maximise, either through selection or training, goal-centred
motivation behaviour in supervisors/managers/leaders of hospitality service
employees.
Selecting leaders: Several research articles focusing on leadership competencies
have been identified during the course of this research. Brownell (2005)
discussed the assessment centre method for evaluating key leadership
competencies in individuals by using a series of exercises or activities to assess
these individuals’ knowledge and skills in relation to a range of pre-identified
competencies for a particular work role. Brownell found that the assessment
centre approach worked well for predicting leadership competencies in hospitality
contexts. Other studies examining leadership competencies in hospitality
contexts are Chung-Herrera et al.(2003), Brownell (2008) and Asree et al. (2010)
who each focus on a different aspect of hospitality leadership. Building upon the
current research will require researchers to develop competencies schedules that
focus on goal-centred leadership behaviour. Indeed, any such future research
that seeks to address leadership competencies in the context of hospitality
services and goal-centred behaviour should consider the recently published work
of Testa and Sipe (2012). Testa and Sipe interviewed leaders working in a range
of restaurant, hotel and tourism organisations to identify a suite of leader
competencies that are germane for enhancing service performance. An
examination of the 100 competencies and desired (prototypical) behaviours that
were drawn from their interviews reveals 13 that can be related to goal-focused
leader behaviour (2012: 653).
339
Leadership training: A number of hospitality studies have examined issues related
to leadership training (Hill and Vanhoof 1997; Scheule and Sneed 2001; Marnburg
2007; Arendt and Gregoire 2008; Scott-Halsell et al. 2008; Naipaul and Wang
2009), all of which focus on hospitality students and hospitality curricula at the
further/higher education level. No studies were identified, however, that focus on
workplace training for leadership skills. To efficatiously identify relevant articles,
it is recommeneded that researchers interested in pursuing this avenue of
research should examine the literature using a range of keywords that go beyond
solely leadership and also encompass a broader range of management-related
themes.
Issues for theory and future research relate to (i) questions that are raised about
the factor structure for the DSB construct and (ii) refining the method of
measuring employee job performance.
Factor structure: Both measures (JP and DSB) resolved into usable factors
following the model development process. The JP construct retained three of its
four indicators (JP1, JP2 and JP4) although two of the original four DSB indicators
were dropped (DSB1 and DSB2 were retained).
The original four DSB items were used for the research because these had been
previously – and successfully - used by Simons and Roberson (2003). In the
current study, DSB3 and DSB4 loaded moderately well on the DSB construct, but
both had high standardised residual covariances indicating a large amount of
unexplained variance associated with these indicators. Removing DSB3 and DSB4
was possible owing to the considerable item content overlap between the DSB
indicators (which all focus on slightly different examples of guest-focused extra
effort, see Appendix VIII).
The factor loadings for the DSB construct as measured by Simons and Roberson
(2003) are illustrated in Table 8-2 and are contrasted with the DSB factor
loadings from the current study. Simons and Roberson’s respondents were
employed in a variety of positions in hotels in North America and 14 per cent were
managers. Simons and Roberson report using a method involving ‘aggregated
residuals’ to control for respondents’ differing degrees of customer contact,
although it not clear exactly what this method entails.
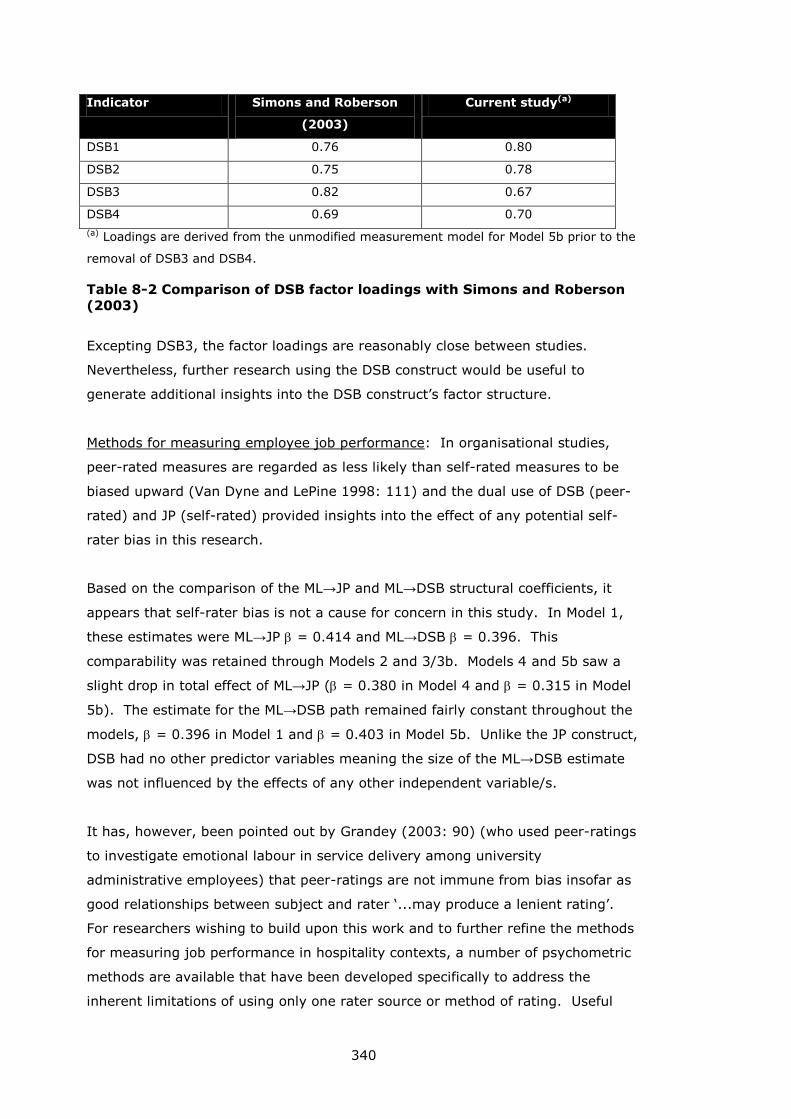
340
Indicator Simons and Roberson
(2003)
Current study(a)
DSB1 0.76 0.80
DSB2 0.75 0.78
DSB3 0.82 0.67
DSB4 0.69 0.70
(a) Loadings are derived from the unmodified measurement model for Model 5b prior to the
removal of DSB3 and DSB4.
Table 8-2 Comparison of DSB factor loadings with Simons and Roberson
(2003)
Excepting DSB3, the factor loadings are reasonably close between studies.
Nevertheless, further research using the DSB construct would be useful to
generate additional insights into the DSB construct’s factor structure.
Methods for measuring employee job performance: In organisational studies,
peer-rated measures are regarded as less likely than self-rated measures to be
biased upward (Van Dyne and LePine 1998: 111) and the dual use of DSB (peer-
rated) and JP (self-rated) provided insights into the effect of any potential self-
rater bias in this research.
Based on the comparison of the ML→JP and ML→DSB structural coefficients, it
appears that self-rater bias is not a cause for concern in this study. In Model 1,
these estimates were ML→JP = 0.414 and ML→DSB = 0.396. This
comparability was retained through Models 2 and 3/3b. Models 4 and 5b saw a
slight drop in total effect of ML→JP ( = 0.380 in Model 4 and = 0.315 in Model
5b). The estimate for the ML→DSB path remained fairly constant throughout the
models, = 0.396 in Model 1 and = 0.403 in Model 5b. Unlike the JP construct,
DSB had no other predictor variables meaning the size of the ML→DSB estimate
was not influenced by the effects of any other independent variable/s.
It has, however, been pointed out by Grandey (2003: 90) (who used peer-ratings
to investigate emotional labour in service delivery among university
administrative employees) that peer-ratings are not immune from bias insofar as
good relationships between subject and rater ‘...may produce a lenient rating’.
For researchers wishing to build upon this work and to further refine the methods
for measuring job performance in hospitality contexts, a number of psychometric
methods are available that have been developed specifically to address the
inherent limitations of using only one rater source or method of rating. Useful
341
and relevant resources for future studies include, in general organisational
studies:
Lawler (1967) who built upon Campbell and Fiske’s (1959) multi-trait multi-
method to develop a multi-trait multi-rater method for assessing managers’ job
performance;
Borman (1974) who refined Lawler’s (1967) method to account for raters’
knowledge of the job area they are rating; and
Podsakoff et al. (2003) who report on methods for multi-trait multi-method
research designs using structural equation modelling.
And in leadership and hospitality- / service-specific contexts, relevant resources
for future studies include:
Fleenor et al. (2010) who review self–other rating agreement in leadership
research;
Yee et al. (in press) who utilised multi-rater techniques to measure
relationships among leadership, goal orientation, and service quality in high-
contact service industries;
Patiar and Mia (2008) who examined the effect of gender on differences
between self and superiors’ ratings of employee performance in hotels.
8.3.2 Work motivation: attitudinal measures
In addition to the JP construct providing a behavioural measurement of work
motivation, three attitudinal measures of work motivation were hypothesised as
outcomes of motivational leadership (and as predictors of individual job
performance). Work Meaning was included as a discrete construct in Model 2 and
in Model 3/3b Work Meaning, Job Satisfaction and Affective Organisational
Commitment were combined (owing to a lack of discriminant validity) to create
the new Employee Positive Attitudes (EPA) construct.
Work meaning
The Work Meaning construct is a new operationalisation to evaluate a
transformational leadership (TL) outcome that is discussed in the TL literature
(e.g. Bass and Riggio 2006: 6, 28) but has not been operationalised or measured
in the TL context.
342
The method for measuring the Work Meaning construct utilised in this research
drew upon a related conceptualisation developed by Wollack et al. (1971).
Following modifications during the development of Model 2, the Work Meaning
construct (measured with ME1, ME3 and ME6) was interpreted as “employees’
satisfaction, enjoyment and social status from work” and was confirmed as an
outcome of motivational leadership (ML) and a predictor of individual job
performance (JP).
This finding:
(i) confirms the much-written about, but hitherto unmeasured, status of work
meaning as an outcome of motivational/transformational leadership; and
(ii) establishes work meaning as a mediating variable in the motivational
leadership → job performance relationship.
Because no research measuring either of these relationships has been identified,
either in the hospitality-specific or the more general organisational studies
literatures, this finding represents a contribution to the fields of both hospitality
and generic leadership studies.
In addition to measuring the motivational leadership → job performance
relationship, this study has also addressed the nebulous nature of the ‘meaning of
meaning’. Section 5.3 provides a critical appraisal of the transformational
leadership literature, wherein the interpretation of ‘meaning’ and ‘meaningful ‘ is
not always made explicit. Accordingly, the research examined the broader
organisational studies literature to develop a more concrete conceptualisation of
work meaning and a set of measures to operationalise the concept for empirical
measurement.
The resultant Work Meaning construct was defined as ‘The meaning that an
individual attaches to their role at work’ and, following the model development
process and the removal of two of the five indicator variables (ME5 and ME7), the
construct was interpreted as “employees’ satisfaction, enjoyment and social
status from work”.
In the light of some of the more negative commentaries regarding the quality of
hospitality service jobs reported in Chapter 1 (e.g. Hesselink et al. 2004: 11;
Wildes 2007: 5-6; Wong and Ko 2009: 195), in particular Wood’s (1997: 198)
343
description of hospitality work as ‘...largely exploitative, degrading, poorly paid,
unpleasant, insecure and taken as a last resort’, it is encouraging that (at least
some) hospitality employees do find some satisfaction, enjoyment and social
status from their work.
What are the practical implications flowing from this finding? As above, that
hospitality organisations should seek to maximise (through selection or training)
goal-centred motivational behaviour in supervisors/managers/leaders of
hospitality service employees.
To briefly explore if there may be a way of selecting service employees to
maximise their levels of work meaning, an ad hoc structural equation model was
specified to examine if the Work Values construct22 exerted a positive influence on
Work Meaning. The resulting model used the Work Meaning (ME) factor structure
established in Model 2 and the Work Values (WV) factor structure established in
Model 4. The WV→ME structural regression coefficient was statistically significant
(p ≤ 0.001) with a standardised beta weight of 0.483 and the global model fit was
satisfactory (χ2 = 13.194, d.f. = 8, sig = 0.105; RMSEA = 0.055; CFI = 0.992;
and SRMR = 0.0342).
This finding suggests that because employees’ work orientations (measured using
the Work Values construct) tend to positively influence (and quite strongly with
= 0.483) work meaning, service employees might be selected on the basis of high
levels of positive work orientation. Future research can build upon the relevant
findings from this work to develop methods for effecting such a selection process.
As usual, it is recommended that future research undertake an independent
sample validation of the relevant work meaning-related relationships.
Additionally, future research might also address the question of how increased
employee work meaning may contribute to reducing counterproductive
organisational outcomes such as turnover and absenteeism (in contrast to the
productive organisational outcomes based on job performance measured in this
research).
22 The more general findings relating to the Work Values are discussed in the following
sub-section
344
Employee positive attitudes
During the development of Models 3 and 3b, the three attitudinal outcome
variables, Work Meaning (ME), Job Satisfaction (JS) and Affective Organisational
Commitment (AOC) were combined to overcome a lack of sufficient discriminant
validity between them (i.e. these three constructs were found not to be
conclusively measuring discrete phenomena).
This exploratory process resulted in the establishment of a construct measured by
respondents’ overall job satisfaction, satisfaction with job tasks, enjoyment,
prestige and emotional attachment. This was interpreted as Employee Positive
Attitudes (EPA).
Considering that three of the five indicators are drawn from the Work Meaning
construct, and in the light of the discussion presented in Section 5.3 of work
meaning as ‘an individual’s attitude to their current job’, it can be argued that this
new construct represents a broader manifestation of ‘work meaning’ rather than
an entirely different construct. This interpretation was discussed during the
summary of model development in Section 8.2, although the lack of a conceptual
connection between the indicator variable AOC2 (I am emotionally attached to the
company) and Wollack et al.’s (1971) work meaning theory led to the acceptance
of the more general Employee Positive Attitude interpretation. However, the
dominant presence in the EPA construct is the three Work Meaning indicators
(ME1, ME3 and ME6). Accordingly, it could be argued that EPA is a work meaning
construct with (i) an additional job satisfaction component (JS1 ‘daily task
satisfaction’ in addition to ME1 ‘general work satisfaction’) and (ii) an affective
commitment component (AOC2).
In many respects, the implications for practice related to the EPA construct are
similar to those described for work meaning above:
organisations should take steps to maximise motivational leadership (because
motivational leadership enhances EPA); and
future research should investigate the possibility of selecting for service
employees who score high on work values and are therefore likely to
demonstrate higher levels of positive work attitudes.
Factor structure: Additional research related to the EPA construct should include
a deeper investigation of its factor structure. In particular focusing on its content
345
validity - or face validity (Hair et al. 2006: 136) - which is the extent to which the
content of the items (the questions/statements) is consistent with the with the
construct definition i.e. do the items measure the concept they are intended to?.
In this case, that question is reversed and we should ask ‘does the
definition/interpretation adequately reflect the substantive content of the
construct?’.
Another closely-related issue is that because the Employee Positive Attitudes
construct shares much in common with the Work Meaning construct (three out
five indicator variables), future research should examine the conceptual content
of both of these constructs:
(i) towards developing an improved operationalisation of both; or
(ii) to investigate the extent to which the Work Values and Employee Positive
Attitudes constructs are measuring similar attitudinal phenomena.
Additional predictors of employee attitudes: Like the Work Meaning construct,
Employee Positive Attitudes was found to be both an outcome of motivational
leadership and a predictor of individual job performance. Considering its central
role as a mediator of the motivational leadership → job performance relationship
(i.e., given that it has been found to be a contributor to employee job
performance), future research might also develop and test hypotheses regarding
additional predictors23 of employee attitudes in the context of hospitality services.
The hospitality leadership and organisational studies literature is replete with
predictors (organisational- and individual-focused) of both positive and negative
employee attitudes and the choice of predictor variables to study in any future
research study will be guided by the nature of the specific context and research
questions. In a similar vein to the recommendation made in this research for
hospitality leadership scholars to build upon previous approaches and findings
where possible, future research into predictors of EPA or related attitudinal
concepts should be designed to build upon existing knowledge and explicitly
related to organisational psychology / organisational behaviour theory.
23 This research also found Employee Empowerment as a predictor of EPA and this is
discussed in greater detail in Section 8.3.5 below.
346
8.3.3 Work Values
While Work Meaning has measured employees’ attitude to their current job, the
Work Values construct was designed to measure employees’ work orientations or
disposition to work in general.
The relevance of work values (work orientations or employees’ attitudes to work
in general) for this research was highlighted during the review of leadership
studies (Section 2.3.2), which identified McGregor’s Theory X / Theory Y (1966)
research that addressed the issue of managers’ expectations regarding
employees’ work-orientations. Employees’ work orientations were investigated in
a hospitality context by Stamper and Van Dyne (2003) who found that hospitality
organisations can employ a large number of employees (in particular part-time
and temporary workers) who may not have strong positive work-orientations.
It has not been possible to draw concrete conclusions about the relative influence
of work values alongside both motivational leadership and employee
empowerment on employee work attitudes. This difficulty is due to
multicollinearity between the Employee Empowerment construct and the
Motivational Leadership and Work Values constructs.
In the absence of the confounding influence of the Employee Empowerment
construct, Work Values was found to have medium-sized ( = 0.334) effect on
Positive Employee Attitudes (the discussion of effect size interpretations can be
found in Section 7.14).
Employee work orientation (Work Values) is measured as a significant predictor of
work attitudes (Employee Positive Attitudes) (WV→EPA = 0.334) and an indirect
predictor of job performance (JP) (WV→EPA→JP = 0.091). In a practical
context, it is not straightforward to modify individuals’ values (see e.g. Paarlberg
and Perry 2007), and therefore a management solution to enhancing work values
amongst employees may lie in the area of recruitment. Previous research related
to recruitment in a leadership context has been covered above in Section 8.3.1
where leadership competencies approaches and the assessment centre method
for assessing job applicants is discussed.
While the assessment centre approach may not be practical for selecting and
hiring (often part-time and/or seasonal) waiting staff for many organisations, it is

347
not beyond reason that organisations who are committed to quality service could
adopt assessment methods based on prescribed competencies that include factors
related to an individual’s work orientations / work values. Indeed, previous
hospitality researchers have recommended screening for applicant suitability.
Although not specifically referring to the same type of work orientation that the
Work Values construct has measured, Mill (1986: 41) recommends that
hospitality organisations hire “...service employees who have a ‘customer-
interaction orientation’.”, noting that such employees will demonstrate
behavioural flexibility, empathy and strong interpersonal skills. Elsewhere, King
(1984: 98) has recommended that applicants for hotel and restaurant work be
screened for their suitability for customer-contact positions.
With regard to part-time and temporary workers, Stamper and Van Dyne (2003)
found that this constituency are more likely to have less positive work
orientations. By contrast, this study found no significant differences in work
values scores using an ANOVA test on the work values summated scale described
in Section 7.15.3 with part-/full-time and temporary/permanent groupings.
Nevertheless, this may be an issue for work orientations in other samples.
Reducing dependence on part-time and temporary workers may be one solution,
however hospitality organisations have traditionally made much use of part-time
(e.g. for busy lunch and/or evening service) and temporary employees (e.g.
owing to seasonality of custom).
Bass’s transformational leadership theory (Bass and Riggio 2006) proposes
Individualised Consideration (IC) as one of the components that transformational
leaders make use of to promote extra effort in employees. Tailored leader
behaviour towards different constituencies of employees (full-time / part-time
and temporary / permanent) could address differences in work orientations
between these groups. Individualised Consideration has not been measured
during this research but may provide a model for hospitality leaders to address
issues related to employee work orientations. Employee work orientations may
be considered as a situational factor and future research might investigate
appropriate management responses by examining situational and contingency
leadership approaches to dealing with issues such as this.
Any future research in this area would be aided by interpretivistic approaches to
gaining a more nuanced understanding of work orientations among different
groups of employees.
348
8.3.4 Motivational leadership
The Motivational Leadership (ML) construct drew upon theory relating to the
Inspirational Motivational (IM) dimension of Bass’s (Bass and Riggio 2006)
transformational leadership theory (see also Bass and Avolio 2004a: 96). The
three indicator variables that loaded well onto the ML construct related to leaders’
articulation of vision, goals and encouragement (to achieve these goals).
Section 5.2 describes how indicator variables ML4 and ML5 were drawn from other
areas of transformational leadership theory (ML4 relates to positive reinforcement
/ positive feedback from leaders and ML5 relates to leaders’ ‘positive role model’
attributes). These two indicators did not load strongly onto the construct and
were removed from the analysis. That these two indicators (drawn from beyond
the IM concept) did not load well confirms the relevance of the existing IM / ML
construct for the hospitality service context.
The role of the Motivational Leadership in future hospitality leadership research
will be returned to in the following section (Section 8.3.5).
8.3.5 Employee Empowerment
Respondent perceptions of Employee Empowerment (EM) were found to be an
important predictor of employee motivation (measured as Employee Positive
Attitudes, EPA). The strength of this relationship was estimated at EM→EPA =
0.626 (p<0.001). Employee perceptions of empowerment also exerted an
indirect effect (through the path EM→EPA→JP) on individual job performance with
an effect size of = 0.174 (p<0.01).
A number of hospitality studies24 have included empowerment as a variable of
interest and these studies utilised a variety of ways of conceptualising and
measuring empowerment (see the discussion of the Employee Empowerment
construct in Section 5.2).
24 (Sparrowe 1994; Lashley 1995; Hartline and Ferrell 1996; Lashley 1996; Hancer
and George 2003; Kim and George 2005; Hau-Siu Chow et al. 2006; Chiang and Jang
2008; Clark et al. 2009; Brownell 2010; Gill et al. 2010)
349
In this research, the final Employee Empowerment construct (following
modifications during model development) consisted of three indicator variables
(EM1, EM3, and EM4) and these measure the Influence dimension of Hancer and
George’s (2003) empowerment conceptualisation. The content of the three
indicators is as follows:
EM1 I can choose the best way of doing my job
EM3 I have influence over what happens in my work group
EM4 I have a great deal of control over my job
This research did not address the question “from where do these feelings of
influence come?” – that is, the research did not extend to hypothesising
antecedents of employee empowerment. Nevertheless, it has been possible to
explore differences in perceptions of empowerment based on respondent
membership of demographic and job characteristic groups.
A series of ANOVA tests were performed on a summated scale created from the
EM1, EM3 and EM4 indicators and using demographic and job characteristic
variables to create respondent groups. The range of the new summated
employee empowerment variable was 3 to 15 and the mean for all respondents is
11.2. The ANOVA analyses found that:
UK respondents feel less empowered than their non-UK counterparts (UKmean=
10.2; non-UKmean = 11.8; p = 0.000)
For the analyses using supervisor contact and adequacy of training and
information provision as grouping variables, the modified dichotomous
(Less/More) variables described in Section 7.15.2 were used. The analyses found
that:
perceptions of empowerment are significantly lower for respondents with less:
o supervisor contact (LESSmean= 10.9; MOREmean = 12; p = 0.001)
o adequacy of training provision (LESSmean= 11.1; MOREmean = 12.3;
p = 0.001); and
o adequacy of information provision (LESSmean= 11.1; MOREmean =
12.4; p < 0.001).
Organisations can implement practical measures to address supervisor contact
and provision of information and training. The finding that non-UK employees
typically experience greater levels of empowerment needs to be addressed by
350
further research. The potential leader-member cross-cultural dimension brings to
mind the work of Testa (2004, 2007, 2009) who found differences in leader-
member relations when comparing culturally-congruent and non-congruent dyads.
If leadership contributes in any way to perceptions of empowerment, then cultural
congruity of leader-member relationship may be a significant factor.
These findings suggests some interesting implications for theory. The Full-Range
Leadership Model (FRLM) of transformational leadership theory does not contain
an empowerment component. This research has drawn upon one specific
dimension of transformational leadership – the Inspirational Motivational
dimension – to measure motivational leadership. Empowerment has been
measured as having an effect that complements that of motivational leadership
on employee work attitudes. Future research might seek to evaluate how the
wider range of transformational leadership dimensions contribute to employee
motivation (both behavioural and attitudinal) and the empowerment construct
could be integrated into such an analysis.
An emerging leadership theory is servant leadership, a central tenet of which is
(leaders) putting subordinates first and emphasising that satisfying subordinates’
work needs is a priority; supervisors who practice this principle will often break
from their own work to assist subordinates. Servant leadership theory also posits
that:
... to bring out the best in their followers, leaders rely on one-on-one
communication to understand the abilities, needs, desires, goals, and
potential of those individuals. With knowledge of each follower's
unique characteristics and interests, leaders then assist followers in
achieving their potential
(Liden et al. 2008: 162)
Liden et al. go on to describe how:
This encouragement is done through building self-confidence (Lord,
Brown, & Freiberg, 1999), serving as a role model, inspiring trust, and
providing information, feedback, and resources
(Liden et al. 2008: 162)
Liden et al.’s description of ‘providing information, feedback, and resources’ are
examples of enabling behaviour that managers wishing to empower employees
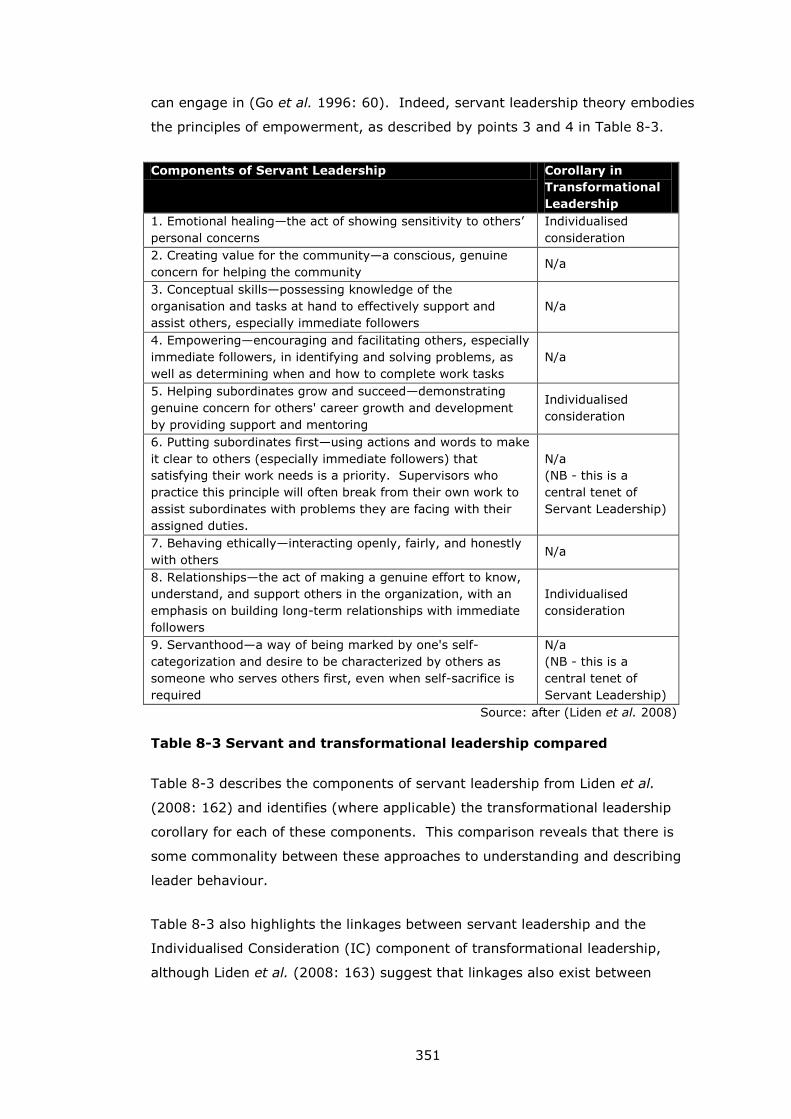
351
can engage in (Go et al. 1996: 60). Indeed, servant leadership theory embodies
the principles of empowerment, as described by points 3 and 4 in Table 8-3.
Components of Servant Leadership Corollary in
Transformational
Leadership
1. Emotional healing—the act of showing sensitivity to others’
personal concerns
Individualised
consideration
2. Creating value for the community—a conscious, genuine
concern for helping the community N/a
3. Conceptual skills—possessing knowledge of the
organisation and tasks at hand to effectively support and
assist others, especially immediate followers
N/a
4. Empowering—encouraging and facilitating others, especially
immediate followers, in identifying and solving problems, as
well as determining when and how to complete work tasks
N/a
5. Helping subordinates grow and succeed—demonstrating
genuine concern for others' career growth and development
by providing support and mentoring
Individualised
consideration
6. Putting subordinates first—using actions and words to make
it clear to others (especially immediate followers) that
satisfying their work needs is a priority. Supervisors who
practice this principle will often break from their own work to
assist subordinates with problems they are facing with their
assigned duties.
N/a
(NB - this is a
central tenet of
Servant Leadership)
7. Behaving ethically—interacting openly, fairly, and honestly
with others N/a
8. Relationships—the act of making a genuine effort to know,
understand, and support others in the organization, with an
emphasis on building long-term relationships with immediate
followers
Individualised
consideration
9. Servanthood—a way of being marked by one's self-
categorization and desire to be characterized by others as
someone who serves others first, even when self-sacrifice is
required
N/a
(NB - this is a
central tenet of
Servant Leadership)
Source: after (Liden et al. 2008)
Table 8-3 Servant and transformational leadership compared
Table 8-3 describes the components of servant leadership from Liden et al.
(2008: 162) and identifies (where applicable) the transformational leadership
corollary for each of these components. This comparison reveals that there is
some commonality between these approaches to understanding and describing
leader behaviour.
Table 8-3 also highlights the linkages between servant leadership and the
Individualised Consideration (IC) component of transformational leadership,
although Liden et al. (2008: 163) suggest that linkages also exist between
352
servant leadership and the transformational leadership’s Idealised Influence and
Intellectual Stimulation components.
Future hospitality leadership research might usefully draw together strands from
both transformational and servant leadership to explain the complementary
actions of motivating and empowering leader behaviour. There are clear linkages
between the two approaches and servant leadership – with its existing recognition
of the importance of leaders’ empowering behaviour - may provide a useful
theoretical perspective to assist in the theoretical integration of empowerment
and motivational leadership as drivers of improved employee work attitudes and
job performance.
Considering the focus of this research on leadership in organisations – that is,
leadership at the departmental, group or team level, rather than executive-level
leadership of organisations, an apposite theme for future hospitality leadership
research to explore is the influence of employee empowerment on team leaders.
Middle-level leaders can also benefit from empowerment initiatives but the scope
of this research has not encompassed empowerment of these leaders. Indeed,
the relevance of the empowerment theme for service-based leadership is
underlined in Testa and Sipe’s (2012: 653) recent research where leaders’ ability
to “drive decision authority to the lowest appropriate level” was identified through
interviews with hospitality and tourism sector leaders as a key competency for
managing in service settings.
8.3.6 Limitations of the current study
Aside from further research arising from the findings of the study, there are
several areas where further research can usefully address the limitations of the
current research.
Validation in an independent sample.
Section 7.12 describes how the most effective method of validating an SEM model
is to test the model in a strictly confirmatory mode using data from an
independent sample drawn from the same population; the population being non-
supervisory waiting staff working table service restaurants in 3 and 4 star hotels.
353
In this research all of the participating hotels were located in the UK and therefore
an independent sample from the same population should be from UK hotels –
future research might, however, attempt to validate the study in similar
populations in other countries. A second round of data collection was not included
in the research design – securing the participation of enough hotels to generate
one sample of sufficient size was anticipated to be (and was indeed) a significant
challenge.
Models 2 and 5b were cross-validated using a random split-sample method to
confirm (or refute) group invariance (Hair et al. 2006: 819) and these analyses
concluded that the models are likely to cross-validate in independent samples.
Related to the desirability of cross-validation in an independent sample is Kline’s
(2005: 324) note on causality where he writes:
...it would be almost beyond belief that all of the conditions required
for the inference of causality from covariances have been met in a
single study. In general, it is better the view structural models as
being “as if” models of causality that may or may not correspond to
causal sequences in the real world
Kline’s ‘as if’ is interpreted here as meaning that the research findings should
presented in such way that researchers position their findings in terms of “...it
looks as if phenomenon A affects phenomenon B”.
Representativeness of the sample
Section 6.5.2 discusses the representativeness of the sample noting that the
sample cannot be considered a true probability sample since there is no sampling
frame that is representative of the population of waiting staff in hotel restaurants
in the UK.
One solution to improve the generalisability of the findings from a piece of similar
research would be to secure the participation of a large hotel group and use their
entire service staff as a population from which to draw a sample. The findings
from such a study would (strictly speaking) be generalisable only to that hotel
group. However, such a study could be repeated in other hotel groups. If enough
354
such studies are undertaken using similar research designs, a meta analysis might
then be performed to broaden the generalisability further.
Size of the sample
The sample size is adequate for SEM analysis according to the guidelines
described in Section 6.5.2. A larger sample size would, however, have improved
the ability to identify and assess any moderating effects from the demographic
and job characteristic variables (see Section 7.15). Satisfactorily confirming or
refuting the existence of such moderating effects can contribute to our
understanding of how the research findings may be affected by survey non-
response bias.
Unequal group sizes (such as in the case of the ‘tenure’ variable where only 31
cases fell in the seasonal/temporary category) made it impossible to undertake
multi-group analyses owing to the number of cases in specific group dropping far
below the recommended numbers for SEM analysis (100 is generally regarded as
a minimum number of cases, see Section 6.5.2).
Even where group sizes were well-balanced, the complexity of Model 5b (more
observed variables and more parameters to be estimated) in comparison with
Model 2 led to an inability to draw conclusive findings from the majority of multi-
group moderator analyses of Model 5b.
Scope of the study
By collecting data only from waiting staff in 3 and 4 star hotels with table service
restaurants, the scope of the current research is limited to that context. This
narrow focus was deliberately sought to enhance the homogeneity of the sample.
The design of the survey and the data analysis are, however, suitable for
application in a wider hospitality context. That is, the service-focused
components of the two behavioural measures (Job Performance and Discretionary
Service Behaviour) of work motivation are not specific to catering service.
355
Therefore, while the findings of the current study are limited in scope, there is
potential to use the same design to test the findings in populations drawn from
other hospitality jobs.
Common method variance
In behavioural research, spurious correlation effects (common methods variance
bias, or common methods bias) between constructs can be manifest owing to the
ways in which respondents complete survey forms, rather than solely owing to
correlations between the constructs of interest.
Common method variance bias can be identified and controlled for using
approaches such as the multitrait–multimethod (MTMM) study design where
respondents are measured on a range of constructs using different methods or
survey instruments (see e.g. Podsakoff et al. 2003). Approaches such as the
MTMM were not feasible during this research owing to limitations in accessing
respondents, but future studies using similar analytical approaches might seek to
assess and/or minimise the effects of common method variance.
8.3.7 Implications of the data collection outcomes for the research
findings
Section 6.5.2 described the data collection and appraised the data in detail.
Following the development of the models and the derivation of the research
findings, it is worthwhile returning to the data collection outcomes to consider the
relevant implications that these have with regard to the research findings.
Table 8-4 enumerates the various data collection outcomes and describes the
corresponding influence of each outcome on the research findings. In summary,
the data collection outcomes have no specific implications for the model
parameter estimates. Owing to the lack of a comprehensive sampling frame for
the population of interest, the generalisability of the findings is limited according
to the strict principles of probability sampling where every (or almost every)
member of the population of interest should have an equal chance of receiving a
survey form.
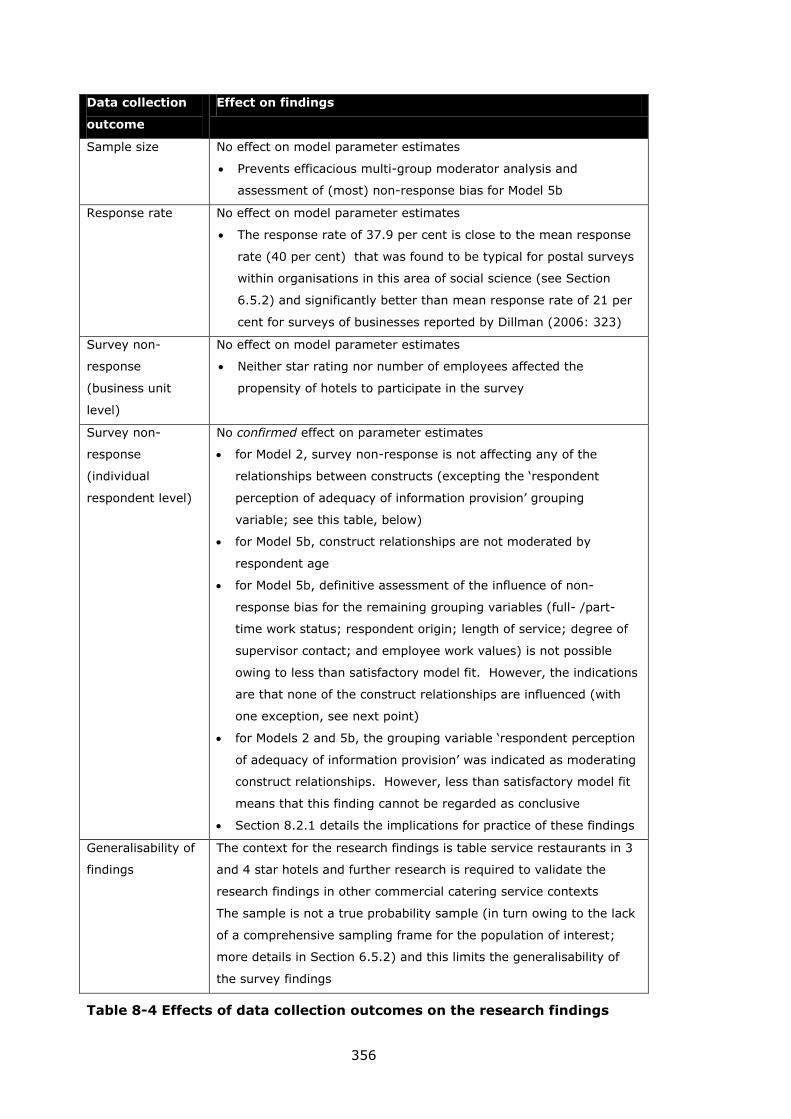
356
Data collection
outcome
Effect on findings
Sample size No effect on model parameter estimates
Prevents efficacious multi-group moderator analysis and
assessment of (most) non-response bias for Model 5b
Response rate No effect on model parameter estimates
The response rate of 37.9 per cent is close to the mean response
rate (40 per cent) that was found to be typical for postal surveys
within organisations in this area of social science (see Section
6.5.2) and significantly better than mean response rate of 21 per
cent for surveys of businesses reported by Dillman (2006: 323)
Survey non-
response
(business unit
level)
No effect on model parameter estimates
Neither star rating nor number of employees affected the
propensity of hotels to participate in the survey
Survey non-
response
(individual
respondent level)
No confirmed effect on parameter estimates
for Model 2, survey non-response is not affecting any of the
relationships between constructs (excepting the ‘respondent
perception of adequacy of information provision’ grouping
variable; see this table, below)
for Model 5b, construct relationships are not moderated by
respondent age
for Model 5b, definitive assessment of the influence of non-
response bias for the remaining grouping variables (full- /part-
time work status; respondent origin; length of service; degree of
supervisor contact; and employee work values) is not possible
owing to less than satisfactory model fit. However, the indications
are that none of the construct relationships are influenced (with
one exception, see next point)
for Models 2 and 5b, the grouping variable ‘respondent perception
of adequacy of information provision’ was indicated as moderating
construct relationships. However, less than satisfactory model fit
means that this finding cannot be regarded as conclusive
Section 8.2.1 details the implications for practice of these findings
Generalisability of
findings
The context for the research findings is table service restaurants in 3
and 4 star hotels and further research is required to validate the
research findings in other commercial catering service contexts
The sample is not a true probability sample (in turn owing to the lack
of a comprehensive sampling frame for the population of interest;
more details in Section 6.5.2) and this limits the generalisability of
the survey findings
Table 8-4 Effects of data collection outcomes on the research findings
357
8.3.8 Other areas for further research
This research has looked at group-level leadership arguing that, in the context of
the hospitality service encounter, group-level leadership (leadership in
organisations) may be more germane in terms of influencing positive
organisational outcomes than is executive-level leadership (leadership of
organisations). Arguments such as this are, however, highly contingent on the
nature and characteristics of the organisations in question.
Gore and Szivaz (2003) have discussed the application of the principles of
transformational leadership for small- and medium-sized (SME) hospitality
businesses. Aside from Gore and Szivaz, however, this research has identified no
published material addressing the interaction between leadership and size of
hospitality businesses.
Hospitality organisations are far from homogenous and alongside the global-scale
hotel groups there is a high proportion of micro- (<10 employees), small- (<50
employees) and medium-sized (51-250 employees)25 hospitality businesses
(Garay and Font in press). There is significant scope, therefore, to investigate the
linkages between motivational leadership and individual and organisational
outcomes at different levels within different types of hospitality organisations.
8.4 Conclusions
The field of hospitality leadership is at an early stage of development and
knowledge within the field is somewhat fragmented owing to the broad range of
research questions that have been addressed and the diversity of research
approaches that have been adopted.
The focus of this work has been on the contribution of motivational leadership to
hospitality employee work motivation based on a sample of catering service
employees (waiting staff) in UK hotels with table service restaurants.
The research has found that motivational leadership, employee empowerment and
employee work orientations have significant and positive effects on employee
work attitudes and job performance.
25 Categories according to (European Commission 2003)
358
These findings make a significant contribution to the field of hospitality leadership
studies by providing the first empirical evidence for motivational leadership’s
contribution to job performance.
Furthermore, the research makes a contribution to the wider field of leadership
studies by operationalising the ‘work meaning’ outcome of transformational
leadership and demonstrating that motivational leaders in hospitality catering can
enhance employees’ work meaning.
Following the hospitality leadership work of Hinkin and Tracey (1994) and Tracey
and Hinkin (1996) this research confirms the positive influence of motivational
leadership on employees’ mission clarity. This finding validates Hinkin and
Tracey’s findings in an independent sample and confirms the theory that
motivational leaders enhance followers’ understanding of organisational goals (see
e.g. Avolio and Bass 2004a: 96).
Mission clarity has also been discussed as an outcome of employee empowerment
in hospitality contexts by Lashley (1995, 1996). This connection further
strengthens the linkages between motivational leadership and empowerment as
drivers of productive organisational outcomes in hospitality service contexts and
suggests that mission clarity could usefully be included in a model of hospitality
employee work motivation that links empowerment and leadership processes as
determinants of employee attitudes and performance.
Practical implications for hospitality organisations flowing from this research are
that employee attitudes and performance can be enhanced through:
the selection of, and training for, leaders based on the types of goal-orientated
motivational behaviour that constitutes the motivational leadership construct
used in this research;
the implementation of employee empowerment programmes drawing upon
published principles for empowerment in hospitality organisations; and
the selection of service employees based on work orientations (work values).
The research design explicitly placed motivational leadership within a broader
organisational framework and it is recommended that hospitality organisations
also consider the wider organisational environment and the characteristics and
capacities of individuals when planning and implementing interventions to
enhance the work motivation of employees.

359
360
9 LIST OF REFERENCES
Aamodt, M. G., 2010. Industrial/Organisational Psychology: An applied
approach. Vol. 6. Belmont, CA: Wadsworth Cengage Learning.
Adams, J. S., 1963. Toward an understanding of inequity. Journal of
Abnormal and Social Psychology, 67, 422-436.
Adams, J. S., 1965. Inequity in social exchange. In: Berkowitz, L. ed. Advances in Experimental Social Psychology Vol. 2. San Diego, CA::
Academic Press, 267-299).
Ajzen, I., 2001. Nature and operation of attitudes. Annual Review of
Psychology, 52 (1), 27.
Alderfer, C. P., 1969. An empirical test of a new theory of human needs. Organizational Behavior and Human Performance, 4, 142-175.
Alderson, W., 1985. Value of the person: Theory R concept. Pittsburgh: Value of the Person.
Allen, N. J., and Meyer, J., P., 1990. The measurement and antecedents of affective, continuance and normative commitment to the organization. Journal of Occupational Psychology, 63 (1), 1-18.
Alliger, G., 1992. The theory and structure of industrial/organizational psychology. In: Kelly, K. ed. Issues, theory, and research in
industrial/organizational psychology. New York: Elsevier Science, 3-27.
Alvesson, M., and Deetz, S., 2000. Doing critical management research.
London: Sage.
Alvesson, M., and Sveningsson, S., 2003. The great disappearing act:
difficulties in doing "leadership". The Leadership Quarterly, 14 (3), 359-381.
Ambrose, M. L., and Kulik, C. T., 1999. Old friends, new faces: motivation
research in the 1990s. Journal of Management, 25 (3), 231-292.
Anderson, J. C., and Gerbing, D. W., 1988. Structural equation modeling
in practice: A review and recommended two-step approach. Psychological Bulletin, 103 (3), 411-423.
Anderson, T. D., 1997. Transforming leadership: equiping yourself and
coaching others to build the leadership organisation. Boca Raton: St. Lucie Press.
Antonakis, J., Avolio, B. J., and Sivasubramaniam, N., 2003. Context and leadership: an examination of the nine-factor full-range leadership
theory using the Multifactor Leadership Questionnaire. The Leadership Quarterly, 14 (3), 261-295.
361
Antonakis, J., Cianciolo, A. T., and Sternberg, R. J., 2004a. Leadership: Past, present, and future. In: Antonakis, J., Cianciolo, A. T., and
Sternberg, R. J. eds. The nature of leadership. Thousand Oaks: CA: Sage Publications, 3-15.
Antonakis, J., Schriesheim, C. A., Donovan, J. A., Gopalakrishna-Pillai, K., Pellegrini, E. K., and Rossomme, J. L., 2004b. Methods for studying leadership. In: Antonakis, J., Cianciolo, A. T., and Sternberg, R. J.
eds. The nature of leadership. Thousand Oaks: Sage Publications, 48-70.
Ardichvili, A., and Kuchinke, K. P., 2009. International Perspectives on the Meanings of Work and Working: Current Research and Theory. Advances in Developing Human Resources, 11 (2), 155-167.
Arendt, S. W., and Gregoire, M. B., 2005. Leadership Behaviors In Hospitality Management Students. Journal of Hospitality & Tourism
Education, 17 (4), 20-27.
Arendt, S. W., and Gregoire, M. B., 2008. Reflection by Hospitality Management Students Improves Leadership Practice Scores. Journal
of Hospitality & Tourism Education, 20 (2), 10-15.
Armstrong, J. S., and Overton, T. S., 1977. Estimating Nonresponse Bias
in Mail Surveys. Journal of Marketing Research (JMR), 14 (3), 396-402.
Armstrong, R. W., Mok, C., Go, F. M., and Chan, A., 1997. The importance of cross-cultural expectations in the measurement of service quality perceptions in the hotel industry. International Journal of Hospitality
Management, 16 (2), 181-190.
Arnaldo, M. J., 1981. Hotel General Managers: A Profile. The Cornell Hotel
and Restaurant Administration Quarterly, 22 (3), 53-56.
Ashour, A. S., 1973. The contingency model of leadership effectiveness: An evaluation. Organizational Behavior and Human Performance, 9
(3), 339-355.
Asree, S., Zain, M., and Razalli, M. R., 2010. Influence of leadership
competency and organizational culture on responsiveness and performance of firms. International Journal of Contemporary Hospitality Management, 22 (4), 500-516.
Atilla, A., 2006. Measuring service quality in the hotel industry: A study in a business hotel in Turkey. International Journal of Hospitality
Management, 25 (2), 170-192.
Atkinson, L., 1988. The measurement-statistics controversy: Factor anlysis and sub-interval data. Bulletin of the Psychonomic Society,
26, 361-364.
Atwater, L. E., and Bass, B. M., 1993. Transformational leadership in
teams. In: Bass, B. M., and Avolio, B. J. eds. Improving organizational effectiveness through transformational leadership. Thousand Oaks, CA: Sage, 48-77.
362
Avolio, B., and Bass, B. 2004a. Multifactor Leadership Questionnaire Third Edition Manual and Sampler Set. Palo Alto: CA: Mind Garden Inc.
Avolio, B., and Bass, B. 2004b. Multifactor Leadership Questionnaire Third Edition Manual and Sampler Set; Appendix - MLQ International
Normative Samples. Palo Alto: CA: Mind Garden Inc.
Avolio, B., Bass, B., and Jung, D., 1999. Re-examining the components of transformational and transactional leadership using multifactor
leadership questionnaire MLQ-Form 5X. Journal of Occupational and Organizational Psychology, 72, 441-462.
Avolio, B. J., and Bass, B. M. (Eds.). 2002. Developing potential across a full range of leadershlps : Cases on transactional and transformational leadership. Mahwah, NJ: Lawrence Erlbaum
Associates. Inc.
Avolio, B. J., Waldman, D. W., and Yammarino, F. L., 1991. Leading in the
1990’s: towards understanding the four I’s of transformational leadership. Journal of European Industrial Training, 15 (4), 9-16.
Babakus, E., Ferguson, C. E., and Jöreskog, K. G., 1987. The sensitivity of
confirmatory maximum likelihood factor analysis to violations of measurement scale and distributional assumptions. Journal of
Marketing Research, 24, 222-228.
Babakus, E., Yavas, U., Karatepe, O. M., and Avci, T., 2003. The Effect of
Management Commitment to Service Quality on Employees' Affective and Performance Outcomes. Journal of the Academy of Marketing Science, 31 (3), 272-286.
Bacon, D. R., Sauer, P. L., and Young, M., 1995. Composite Reliability in Structural Equations Modeling. Educational and Psychological
Measurement, 55 (3), 394-406.
Balfour, D. L., and Wechsler, B., 1996. Organizational commitment: Antecedents and outcomes in public organizations. Public
Productivity and Management Review, 19, 256-278.
Bandura, A., 1977. Social learning theory. Englewood Cliffs, NJ: Prentice
Hall.
Bandura, A., 1997. Self-efficacy: The exercise of control. New York: Freeman.
Barnett, K., Mccormick, J., and Conners, R., 2001. Transformational leadership: panacea, placebo or problem? Journal of Educational
Administration, 39 (1), 24-46.
Bartkus, K. R., Hartman, C. L., and Parent, C. R. M., 1994. The Performance Trade-off B etween Experience and Motivation: Its
Impact on Travel Service Selling. Journal of Travel Research, 33 (2), 15-20.
Bartkus, K. R., and Howell, R. D., 1999. The Relative Influence of Achievement Motivation and Irritability-Impatience on the Selling Performance of Travel Agents: Implications of the Type A Behavior
Pattern. Journal of Travel Research, 38 (2), 163-167.
363
Bartkus, K. R., Howell, R. D., Parent, C. R. M., and Hartman, C. L., 1997. Managerial Antecedents and Individual Consequences of Group
Cohesiveness in Travel Service Selling. Journal of Travel Research, 35 (4), 56-63.
Bass, B., and Avolio, B., 1989. Manual for the Multifactor Leadership Questionnaire. Palo Alto, CA: Consulting Psychologists Press.
Bass, B., and Avolio, B., 1990a. Developing transformational leadership:
1992 and beyond. European Journal of Industrial Training, 14 (5), 21-27.
Bass, B., and Avolio, B., 1990b. Manual for the Multifactor Leadership Questionnaire. Palo Alto, CA: Consulting Psychologists Press.
Bass, B., and Avolio, B., 1995. The Multifactor Leadership Questionnaire
(Form R revised). Palo Alto, CA: Mindgarden.
Bass, B., and Avolio, B., 1997. The Full Range Leadership Development
Manual for the Multifactor Leadership Questionnaire. Redwood City, CA: Mindgarden.
Bass, B., and Avolio, B., 2008. The Full Range Leadership Model.
Available from: http://www.mlq.com.au/flash_frlm.asp [Accessed: 06/03/2009].
Bass, B., and Avolio, B. (Eds.). 1994. Improving organizational effectiveness through transformational leadership. Thousand Oaks,
CA: Sage Publications.
Bass, B. M., 1981. Stodgill's handbook of leadership: A survey of theory and research. Revised and Expanded ed. New York: The Free Press.
Bass, B. M., 1985. Leadership and performance beyond expectations. New York: The Free Press.
Bass, B. M., 1988. The inspirational processes of leadership. Journal of Management Development, 7 (5), 21-31.
Bass, B. M., 1990a. From transactional to transformational leadership:
Learning to share the vision. Organizational Dynamics, 18 (3), 19-31.
Bass, B. M., 1990b. Handbook of Leadership. 3rd ed. New York, NY: Free Press.
Bass, B. M., 1998. Transformational leadership: industrial, military, and
educational impact. Mahwah, NJ: Erlbaum.
Bass, B. M., 1999. Two Decades of Research and Development in
Transformational Leadership. European Journal of Work & Organizational Psychology, 8 (1), 9-32.
Bass, B. M., and Avolio, B. J., 1993. Multifactor leadership questionnaire.
Palo Alto, CA: Consulting Psychologists Press.
Bass, B. M., and Riggio, E., 2006. Transformational Leadership. 2 ed.
Mahwah, NJ: Lawrence Erlbaum Associates, Inc.
364
Belsley, D. A., 1991. A guide to using the collinearity diagnostics. Computer Science in Economics and Management, 4 (1), 33-50.
Belsley, D. A., Kuh, E., and Welsch, R. E., 1980. Regression Diagnostics: Identification Influential Data and Sources of Collinearity. New York:
John Wiley & Sons, Inc.
Bennis, W., 1961. Revisionist Theory of Leadership. Harvard Business Review, 39 (1), 26-150.
Bennis, W., 2007. The challenges of leadership in the modern world: Introduction to the special issue. American Psychologist, 62 (1), 2-
5.
Bennis, W. G., and Nanus, B., 1985. Leaders: The strategies for taking charge. New York: Harper & Row.
Bentler, P. M., 1990. Comparative fit indexes in structural models. Psychological Bulletin, 107 (2), 238-246.
Bentler, P. M., 2005. EQS 6 structural equations program manual. Encino, CA: Multivariate Software.
Bentler, P. M., and Bonett, D. G., 1980. Significance tests and goodness of
fit in the analysis of covariance structures. Psychological Bulletin, 88 (3), 588-606.
Bentler, P. M., and Chou, C.-P., 1987. Practical Issues in Structural Modeling. Sociological Methods & Research, 16 (1), 78-117.
Berg, J. M., Wrzesniewski, A., and Dutton, J. E., 2010. Perceiving and responding to challenges in job crafting at different ranks: When proactivity requires adaptivity. Journal of Organizational Behavior,
31 (2-3), 158-186.
Berger, F., Ferguson, D. H., and Woods, R. H., 1989. Profiles in
innovation: Companies and leaders. The Cornell Hotel and Restaurant Administration Quarterly, 30 (2), 98-105.
Bitner, M. J., Booms, B. H., and Mohr, L. A., 1994. Critical service
encounters: The employee's viewpoint. Journal of Marketing, 58, 95.
Bitner, M. J., Booms, B. H., and Tetreault, M. S., 1990. The Service Encounter: Diagnosing Favorable and Unfavorable Incidents. Joumal of Marketing, 54 (January), 71-84.
Blake, R. R., and Mouton, J. S., 1964. The Managerial Grid. Houston: Gulf.
Blancero, D., and Johnson, S. A. 1997. Customer Service Employees and
Discretionary Service Behavior: A Psychological Contract Model. Ithaca, New York: CAHRS / Cornell University.
Blancero, D., and Johnson, S. A., 2001. A process model of discretionary
service behavior: Integrating psychological contracts, organizational justice, and customer feedback to manage service agents. Journal
of Quality Management, 6 (2), 307-329.
365
Blank, W., Weitzel, J. R., and Green, S. G., 1990. A test of the situational leadership theory. Personnel Psychology, 43 (3), 579-597.
Bliese, P. D., and Britt, T. W., 2001. Social Support, Group Consensus and Stressor-Strain Relationships: Social Context Matters. Journal of
Organizational Behavior, 22 (4), 425-436.
Blunch, N. J., 2008. Introduction to Structural Equation Modelling Using SPSS and AMOS. London: Sage.
Bolden, R., 2004. What is Leadership? (Leadership South West: Research Report 1): University of Exeter, Centre for Leadership Studies.
Bond, H., 1998. Lodging's new breed of leader. Hotel & Motel Management, 213 (16), 1.
Boomsma, A., 2000. Reporting Analyses of Covariance Structures.
Structural Equation Modeling, 7 (3), 461-483.
Borchgrevink, C. P., and Boster, F. J., 1994. Leader-Member Exchange: a
Test of the Measurement Model. Journal of Hospitality & Tourism Research, 17 (3), 75-100.
Borchgrevink, C. P., and Boster, F. J., 1997. Leader-member exchange
development: a hospitality antecedent investigation. International Journal of Hospitality Management, 16 (3), 241-259.
Borchgrevink, C. P., and Boster, F. J., 1998. Leader-Member Exchange and Interpersonal Relationships -- Construct Validity and Path
Model. Journal of Hospitality Marketing & Management, 5 (1), 53 - 79.
Borchgrevink, C. P., Cichy, R. F., and Mykletun, R. J., 2001. Leader-
Member Exchange: Testing the Measurement Model and Testing a Structural Equation Model in the Context of Internal Marketing.
Journal of Hospitality & Leisure Marketing, 8, 63.
Borgatta, E. F., Bales, R. F., and Couch, A. S., 1954. Some Findings Relevant to the Great Man Theory of Leadership. American
Sociological Review, 19 (6), 755-759.
Borman, W. C., 1974. The rating of individuals in organizations: An
alternate approach. Organizational Behavior and Human Performance, 12 (1), 105-124.
Borman, W. C., Ilgen, D., R., and Klimoski, R., J. (Eds.). 2003. Handbook
of psychology: Vol 12 Industrial and organizational psychology. Hoboken, NJ: John Wiley & Sons.
Bradford, D. L., and Cohen, A. R., 1984. Managing for excellence: The guide to developing high performance in contemporary organizations. New York: Wiley.
Browne, M. W., and Cudeck, R., 1989. Single Sample Cross-Validation Indices for Covariance Structures. Multivariate Behavioral Research,
24 (4), 445-455.
366
Browne, M. W., and Cudeck, R., 1993. Alternative ways of assessing model fit. In: Bollen, K. A., and Long, J. S. eds. Testing structural
equation models. Newbury Park, CA: Sage Publications, 136-162.
Brownell, J., 2005. Predicting leadership: The assessment center's
extended role. International Journal of Contemporary Hospitality Management, 17 (1), 7-21.
Brownell, J., 2008. Leading on land and sea: Competencies and context.
International Journal of Hospitality Management, 27 (2), 137-150.
Brownell, J., 2010. Leadership in the Service of Hospitality. Cornell
Hospitality Quarterly, 51 (3), 363-378.
Bryman, A., 1992. Charisma and Leadership in Organizations. Thousand Oaks, CA: Sage.
Buchanan, B., 1974. Building organisational commitment: the socialisation of managers in work organisations. Administrative Science
Quarterly, 19 (4), 533-546.
Burns, J. M., 1978. Leadership. New York: Harper Row.
Burt, R. S., 1976. Interpretational Confounding of Unobserved Variables in
Structural Equation Models. Sociological Methods & Research, 5 (1), 3-52.
Buttle, F., 1996. SERVQUAL: review, critique, research agenda. European Journal of Marketing, 30 (1), 8 - 32.
Byrne, B. M., 2010. Structural equation modeling with AMOS: Basic concepts, applications, and programming. 2 ed. New York: Routledge.
Byrne, D., and Neuman, J. H., 1992. The implications of attraction research for organizational issues. In: Kelly, K. ed. Issues, theory,
and research in industrial/organizational psychology. New York: Elsevier Science, 29-70.
Cairns, T. D., Hollenback, J., Preziosi, R. C., and Snow, W. A., 1988.
Technical Note: a Study of Hersey and Blanchard’s Situational Leadership Theory. Leadership and Organization Development
Journal, 19 (2), 113-116.
Calloway, J. A., and Awadzi, W., 2008. Leadership and organizational success: an examination of the trait, skills, and transformational
approaches. Consortium Journal of Hospitality & Tourism, 13 (1), 13-23.
Campbell, D. T., and Fiske, D. W., 1959. Convergent and discriminant validation by the multitrait-multimethod matrix. Psychological Bulletin, 56 (2), 81-105.
Carbery, R., Garavan, T., O’brien, F., and Mcdonnell, J., 2003. Predicting hotel managers’ turnover cognitions. Journal of Managerial
Psychology, 18 (7), 649-679.
367
Carlzon, J., 1987. Moments of Truth. Cambridge, MA: Ballinger.
Charles, K. R., and Marshall, L. H., 1993. Motivational Preferences of
Caribbean Hotel Workers: An Exploratory Study. International Journal of Contemporary Hospitality Management, 4 (3).
Chen, J. S., Chu, K. H., and Wu, W. C., 2000. Tourism Students' Perceptions of Work Values: A Case of Taiwanese Universities. International Journal of Contemporary Hospitality Management, 12
(6), 360-365.
Chiang, C.-F., and Jang, S., 2008. The Antecedents and Consequences of
Psychological Empowerment: The Case of Taiwan's Hotel Companies. Journal of Hospitality & Tourism Research, 32 (1), 40-61.
Chitiris, L., 1990. Who are the work-motivated managers in the hotel industry--an exploratory study. International Journal of Hospitality
Management, 9 (4), 293-304.
Chu, K. H.-L., 2008. A factorial validation of work value structure: Second-order confirmatory factor analysis and its implications. Tourism
Management, 29 (2), 320-330.
Chung-Herrera, B. G., Enz, C. A., and Lankau, M. J., 2003. Grooming
future hospitality leaders: A competencies model. The Cornell Hotel and Restaurant Administration Quarterly, 44 (3), 17-25.
Church, A. H., 1993. Estimating the effect of incentives on mail survey response rates: A meta-analysis. Public Opinion Quarterly, 57, 62-79.
Cichy, R. F., Aoki, T., Patton, M. E., and Sciarini, M. R., 1992a. The Five Foundations of Leadership in Japan's Lodging Industry. Florida
International University Hospitality Review, 10 (2), 65-77.
Cichy, R. F., Aoki, T. T., Patton, M. E., and Hwang, K. Y., 1993. Shido-sei: Leadership in Japan's commercial food-service industry. The Cornell
Hotel and Restaurant Administration Quarterly, 34 (1), 88-95.
Cichy, R. F., Cha, J., and Kim, S., 2009. The relationship between
organizational commitment and contextual performance among private club leaders. International Journal of Hospitality Management, 28 (1), 53-62.
Cichy, R. F., and Schmidgall, R. S., 1996. Leadership qualities of financial executives in the U.S. lodging industry. The Cornell Hotel and
Restaurant Administration Quarterly, 37 (2), 56-62.
Cichy, R. F., Sciarini, M. P., and Patton, M. E., 1992b. Food-service leadership: Could Attila run a restaurant? The Cornell Hotel and
Restaurant Administration Quarterly, 33 (1), 47-55.
Ciulla, J. B., 2002. Trust and the future of leadership. In: Bowie, N. E. ed.
The Blackwell guide to business ethics. Oxford: Blackwell, 334-351.
368
Clark, R. A., Hartline, M. D., and Jones, K. C., 2009. The Effects of Leadership Style on Hotel Employees' Commitment to Service
Quality. Cornell Hospitality Quarterly, 50 (2), 209-231.
Cohen, J., 1988. Statistical Power Analysis for the Behavioral Sciences. 2
ed. New York: Academic Press.
Cohen, J., Cohen, P., West, S., and Aiken, L., 2003. Applied multiple regression/correlation analysis for the behavioral sciences. Mahwah,
NJ: Lawrence Erlbaum Associates.
Cohen, S., T., K., and Mermelstein, R., 1983. A global measure of
perceived stress. Journal of Health and Social Behaviour, 24, 385-396.
Conger, J. A., and Kanungo, R. N., 1987. Toward a behavioral theory of
charismatic leadership in organizational settings. Academy of Management Review (12), 637-647.
Conger, J. A., and Kanungo, R. N., 1988a. Charismatic leadership: The elusive factor in organization effectiveness. San Francisco: Jossey-Bass.
Conger, J. A., and Kanungo, R. N., 1988b. The Empowerment Process: Integrating Theory and Practice. Academy of Management Review,
13 (3), 471-482.
Cook, J. D., Hepworth, S. J., Wall, T. D., and Warr, P. B., 1981. The
experience of work. New York: Academic Press.
Cronbach, L. J., 1951. Coefficient Alpha and the Internal Structure of Tests. Psychometrika (16), 297-334.
Curran, P. J., West, S. G., and Finch, J. F., 1996. The robustness of test statistics to nonnormality and specification error in confirmatory
factor analysis. Psychological Methods, 1 (1), 16-29.
Cutler, A., 2006. Can you solve the leadership puzzle? Hospitality, 56-58.
Cutler, A., 2010. Aspire to Inspire: Inspirational Leadership within the
Hospitality, Leisure, Travel and Tourism Industries. Coventry: Hospitaltiy Leadership Ltd.
Cutler, A., Hemmington, N., and Ladkin, A., 2006. The 2006 Hospitality Leadership Excellence Survey. Progress (The Research Newsletter for the School of Services Management), Bournemouth University,
9-10.
Dansereau, F., Graen, G., and Haga, W. J., 1975. A vertical dyad linkage
approach to leadership within formal organizations: A longitudinal investigation of the role making process. Organizational Behavior and Human Performance, 13 (1), 46-78.
Davidson, M. C. G., 2003. An Integrated Approach to Service Quality in Hotels. Journal of Quality Assurance in Hospitality & Tourism, 4
(1/2), 71-85.
369
Deery, M., 2008. Talent management, work-life balance and retention strategies. International Journal of Contemporary Hospitality
Management, 20 (7), 792-806.
Deery, M. A., and Shaw, R. N., 1999. An Investigation of the Relationship
between Employee Turnover and Organizational Culture. Journal of Hospitality & Tourism Research, 23 (4), 387-400.
Diamantopoulos, A., and Siguaw, J. A., 2000. Introducing LISREL. London:
Sage Publications.
Dillman, D., 2006. Mail and Internet Surveys: The Tailored Design Method.
3rd ed. New York: Wiley.
Downton, J. V., 1973. Rebel leadership. New York: Free Press.
Drath, W. H., Mccauley, C. D., Palus, C. J., Van Velsor, E., O'connor, P. M.
G., and Mcguire, J. B., 2008. Direction, alignment, commitment: Toward a more integrative ontology of leadership. The Leadership
Quarterly, 19 (6), 635-653.
Eagly, A. H., and Chaiken, S., 1993. The psychology of attitudes. Fort Worth, TX: Harcourt, Brace, & Jovanovich.
Eden, D., and Leviatan, U., 1975. Implicit leadership theory as a determinant of the factor structure underlying supervisory behavior
scales. Journal of Applied Psychology, 60 (6), 736-741.
Eisenberger, R., Huntington, R., Hutchinson, S., and Sowa, D., 1986.
Perceived organizational support. Journal of Applied Psychology, 71, 500-507.
El Masry, S., Kattara, H., and El Demerdash, J., 2004. A Comparative
Study on Leadership Styles Adopted by General Managers: A Case Study in Egypt. Anatolia, 15 (2), 109-124.
Elizur, D., and Koslowsky, M., 2001. Values and organizational commitment. International Journal of Manpower, 22 (7), 593-599.
Enz, C. A., 2001. What keeps you up at night? Key issues of concern for
lodging managers. The Cornell Hotel and Restaurant Administration Quarterly, 42 (2), 38-45.
Erkutlu, H., 2008. The impact of transformational leadership on organizational and leadership effectiveness: The Turkish case. The Journal Of Management Development, 27 (7).
Erkutlu, H. V., and Chafra, J., 2006. Relationship between leadership power bases and job stress of subordinates: example from boutique
hotels. Management Research News, 29 (5), 285-297.
Erstad, M., 1997. Empowerment and organizational change. International Journal of Contemporary Hospitality Management, 9 (7), 325-333.
370
Etter, J.-F., and Perneger, T. V., 1997. Analysis of non-response bias in a mailed health survey. Journal of Clinical Epidemiology, 50 (10),
1123-1128.
European Commission. 2003. Commission recommendation of 6 May 2003
concerning the definition of micro, small and medium-sized enterprises (2003/361/EC). Official Journal of the European Union C(2003) 1422, 36-41.
Everitt, B. S., and Skrondal, A. 2010. The Cambridge Dictionary of Statistics (4 ed.). Cambridge: Cambridge University Press.
Fan, X., Thompson, B., and Wang, L., 1999. Effects of Sample Size, Estimation Methods, and Model Specification on Structural Equation Modeling Fit Indexes. Structural Equation Modeling, 6 (1), 56-83.
Fei-Chuan, C., Ku, E. C. S., Yi-Hwan, S., Fei-Hung, C., and Shuo-Shiung, C., 2009. Job demand, emotional awareness, and job satisfaction in
internships: the moderating effect of social support. Social Behavior & Personality: An International Journal, 37 (10), 1429-1440.
Felfe, J., and Schyns, B., 2006. Personality and the Perception of
Transformational Leadership: The Impact of Extraversion, Neuroticism, Personal Need for Structure, and Occupational Self-
Efficacy. Journal of Applied Social Psychology, 36 (3), 708-739.
Fiedler, F. E., 1964. A contingency model of leader effectiveness. In:
Berkowitz, L. ed. Advances in experimental social psychology. New York: Academic Press, 149-190.
Fiedler, F. E., 1967. A theory of leadership effectiveness. New York:
McGraw-Hill.
Fiedler, F. E., 1971. Validation and extension of the contingency model of
leadership effectiveness: a review of empirical findings. Psychological Bulletin, 76 (2), 128-148.
Fiedler, F. E., 1996. Research on leadership selection and training: one
view of the future. Administrative Science Quarterly, 41, 241-250.
Fisher, C. D., 1985. Social Support and Adjustment to Work: A
Longitudinal Study. Journal of Management, 11 (3), 39-53.
Fleenor, J. W., Smither, J. W., Atwater, L. E., Braddy, P. W., and Sturm, R. E., 2010. Self-other rating agreement in leadership: A review.
The Leadership Quarterly, 21 (6), 1005-1034.
Fornell, C., and Larcker, D. F., 1981. Evaluating Structural Equation
Models with Unobservable Variables and Measurement Error. Journal of Marketing Research (JMR), 18 (1), 39-50.
French, J. R. P., and Raven, B., 1959. The bases of social power. In:
Cartwright, D. ed. Studies in Social Power: University of Michigan Press, Ann Arbor, MI, 150-167.
Fulford, M. D., and Enz, C. A., 1995. The impact of empowerment on service employees. Journal of Managerial Issues, 7 (2), 161-175.
371
Garay, L., and Font, X., in press. Doing good to do well? Corporate social responsibility reasons, practices and impacts in small and medium
accommodation enterprises. International Journal of Hospitality Management (0).
Gardner, W. L., Lowe, K. B., Moss, T. W., Mahoney, K. T., and Cogliser, C. C., 2010. Scholarly leadership of the study of leadership: A review of The Leadership Quarterly's second decade, 2000–2009. The
Leadership Quarterly, 21 (6), 922-958.
Garson, G. D., 4 April 2011. Data Imputation for Missing Values.
Available from: http://faculty.chass.ncsu.edu/garson/PA765/missing.htm [Accessed: 07 May 2011].
Garson, G. D., 4 April 2011. Structural Equation Modelling. Available from: http://faculty.chass.ncsu.edu/garson/PA765/structur.htm
[Accessed: 07 May 2011].
Garson, G. D., 15/3/2012. Multiple Regression. Available from: http://faculty.chass.ncsu.edu/garson/PA765/regress.htm#faq
[Accessed: 22/03/2012].
Georgopoulos, B. S., Mahoney, G. M., and Jones, N. W., Jr., 1957. A path-
goal approach to productivity. Journal of Applied Psychology, 41 (6), 345-353.
Ghitulescu, B. E., 2006. Shaping tasks and relationships at work: examining the antecedents and consequences of employee job crafting. Thesis. University Of Pittsburgh, Pittsburgh.
Gill, A. S., Fitzgerald, S., Bhutani, S., Mand, H., and Sharma, S., 2010. The relationship between transformational leadership and employee
desire for empowerment. International Journal of Contemporary Hospitality Management, 22 (2), 263-273.
Gill, A. S., Flaschner, A. B., and Shachar, M., 2006. Mitigating stress and
burnout by implementing transformational-leadership. International Journal of Contemporary Hospitality Management, 18 (6/7), 469-
481.
Gillet, S., and Morda, R., 2003. Effective Leadership in Tourism and Hospitality Organisations in the 21st Century. In: Kusluvan, S. ed.
Managing Employee Attitudes and Behaviors in the Tourism and Hospitality Industry. New York: Nova Science 599-630.
Go, F., Monachello, M., and Baum, T., 1996. Human Resource Management in the Hospitality Industry. Chichester: Wiley.
Gore, J., and Szivaz, E., 2003. Transformational Leadership and effective
small hospitality business. The Hospitality Review, 43 (April), 43-46.
Graen, G. B., and Uhl-Bien, M., 1995. Relationship-based approach to
leadership: Development of leader-member exchange (LMX) theory of leadership over 25 years: Applying a multi-level multi-domain perspective. The Leadership Quarterly, 6 (2), 219-247.
372
Grandey, A. A., 2003. When "The Show Must Go On": Surface acting and deep acting as determinants of emotional exhaustion and peer-
rated service delivery, Academy of Management Journal, 46 (1), 86-96.
Greger, K. R., and Peterson, J. S., 2000. Leadership profiles for the new millennium. The Cornell Hotel and Restaurant Administration Quarterly, 41 (1), 16-29.
Griffin, R. W., Skivington, K. D., and Moorhead, G., 1987. Symbolic and International Perspectives on Leadership: An Integrative
Framework. Human Relations, 40 (4), 199-218.
Grint, K., 2004. What is Leadership? From Hydra to Hybrid. Working paper, Saïd Business School and Templeton College, Oxford
University.
Groves, R. M., Singer, E., and Corning, A., 2000. Leverage-Saliency
Theory Of Survey Participation. Public Opinion Quarterly, 64 (3), 299-308.
Hackman, J. R., and Oldham, G. R., 1974. The Job Diagnostic Survey: An
instrument for the diagnosis of jobs and the evaluation of job redesign projects. Technical Report No. 4. New Haven, CT:
Department of Administrative Sciences, Yale University.
Hackman, J. R., and Oldham, G. R., 1975. Development of the Job
Diagnostic Survey. Journal of Applied Psychology, 60 (2), 159-170.
Hackman, J. R., and Oldham, G. R., 1976. Motivation through the design of work: Test of a theory. Organizational Behavior and Human
Performance, 16, 250-279.
Hackman, J. R., and Oldham, G. R., 1980. Work redesign. Reading, MA:
Addison-Wesley.
Hair, J. F., Black, B., Babin, B., Anderson, R. E., and Tatham, R. L., 2006. Multivariate Data Analysis. 6th ed. Upper Saddle River, New
Jersey: Pearson.
Hancer, M., and George, R. T., 2003. Psychological empowerment of non-
supervisory employees working in full-service restaurants. International Journal of Hospitality Management, 22 (1), 3-16.
Hardesty, D. M., and Bearden, W. O., 2004. The use of expert judges in
scale development: Implications for improving face validity of measures of unobservable constructs. Journal of Business Research,
57 (2), 98-107.
Harsha, E. C., 1998. Designing a seamless hotel organization. International Journal of Contemporary Hospitality Management, 10
(4), 133-138.
Hartline, M. D., and Ferrell, O. C., 1996. The Management of Customer-
Contact Service Employees: An Empirical Investigation. Journal of Marketing, 60 (4), 52-70.
373
Hater, J. J., and Bass, B. M., 1988. Superiors' evaluations and subordinates' perceptions of transformational and transactional
leadership. Journal of Applied Psychology, 73 (4), 695-702.
Hau-Siu Chow, I., Wing-Chun Lo, T., Sha, Z., and Hong, J., 2006. The
impact of developmental experience, empowerment, and organizational support on catering service staff performance. International Journal of Hospitality Management, 25 (3), 478-495.
Hawkins, D. E., and Lee, Y. T., 1990. An Empirical Analysis of Organizational Commitment Among American Hotel Sales and
Marketing Professionals. Journal of Hospitality & Tourism Research, 14 (2), 103-112.
Hayduk, L., 1987. Structural equation modeling with LISREL: Essentials
and Advances. Baltimore, MD: Johns Hopkins University Press.
Hayduk, L., Cummings, G., Boadu, K., Pazderka-Robinson, H., and
Boulianne, S., 2007. Testing! testing! one, two, three - Testing the theory in structural equation models! Personality and Individual Differences, 42 (5), 841-850.
Hersey, P., and Blanchard, K. H., 1969. Life cycle theory of leadership. Training and Development Journal, 23 (5), 26-34.
Hersey, P., and Blanchard, K. H. (Eds.). 1988. Management of organizational behavior (5th ed.). Englewood Cliffs, NJ: Prentice-
Hall.
Herzberg, F., 1966. Work and the nature of man. Cleveland, OH.: Holland.
Herzberg, F., 1968. One more time: How do you motivate employees?
Harvard Business Review, 46 (1), 53-62.
Herzberg, F. I., Mausner, B., & Snyderman, B. B., 1959. The motivation to
work. New York: John Wiley & Sons.
Hesselink, J. K., Houtman, I., Van Den Berg, R., Van Den Bossche, S., and Van Den Heuvel, F., 2004. EU hotel and restaurant sector: Work
and employment conditions. Luxembourg: European Foundation for the Improvement of Living and Working Conditions.
Hill, F. A., and Vanhoof, H. B., 1997. The Hospitality Leadership Course Dilemma: Why Hospitality Management Curricula Should Include A Separate Leadership Course. Journal of Hospitality & Tourism
Education, 9, 116.
Hinkin, T., 1998. A Brief Tutorial on the Development of Measures for Use
in Survey Questionnaires. Organizational Research Methods, 1 (1), 104-121.
Hinkin, T. R., and Schriesheim, C. A., 2008. A theoretical and empirical
examination of the transactional and non-leadership dimensions of the Multifactor Leadership Questionnaire (MLQ). The Leadership
Quarterly, 19 (5), 501-513.
374
Hinkin, T. R., and Tracey, J. B., 1994. Transformational Leadership in the Hospitality Industry. Journal of Hospitality & Tourism Research, 18
(1), 49-63.
Hoelter, J. W., 1983. The analysis of covariance structures: Goodness-of-
fit indices. Sociological Methods and Research, 11, 325-344.
Hofstede, G., 1980. Culture's consequences: International differences in work-related values. Newbury Park, CA: Sage.
Hollenbeck, G. P., Mccall, J. M. W., and Silzer, R. F., 2006. Leadership competency models. The Leadership Quarterly, 17 (4), 398-413.
Homer, P. M., and Kahle, L. R., 1988. A structural equation test of the value-attitude-behavior hierarchy. Journal of Personality and Social Psychology, 54 (4), 638-646.
Hooper, D., Coughlan, J., and Mullen, M. R., 2008. Structural Equation Modelling: Guidelines for Determining Model Fit. The Electronic
Journal of Business Research Methods, 6 (1), 53 - 60.
House, R., and Mitchell, T. R., 1974. Path-goal theory of leadership. Contemporary Business, 3 (Fall), 81-98.
House, R. J., 1971. A Path Goal Theory of Leader Effectiveness. Administrative Science Quarterly, 16 (3), 321-339.
House, R. J., 1977. A 1976 theory of charismatic leadership. In: Hunt, J. G., and Larson, L. L. eds. Leadership: The cutting edge. Carbondale,
IL: Southern Illinois University Press.
House, R. J., 1995. Leadership in the twenty-first century: A speculative inquiry. In: Howard, A. ed. The changing nature of work. San
Francisco: Jossey-Bass.
House, R. J., and Aditya, R. N., 1997. The social scientific study of
leadership: Quo vadis? Journal of Management, 23 (3), 409-473.
Hoyle, R. H. (Ed.). 1995. Structural Equation Modelling: Concepts, Issues, and Applications. Thousand Oaks, CA: Sage.
Hu, L.-T., and Bentler, P. M., 1999. Cutoff Criteria for Fit Indexes in Covariance Structure Analysis: Conventional Criteria Versus.
Structural Equation Modeling, 6 (1), 1.
Huelsman, T. 2007. Industrial and Organizational Psychology, 21st Century Psychology: A Reference Handbook: SAGE Publications.
Hunt, J. G., 1999. Transformational/charismatic leadership's transformation of the field: An historical essay. The Leadership
Quarterly, 10 (2), 129-144.
Hunt, S. D., Wood, V. R., and Chonko, L. B., 1989. Corporate Ethical Values and Organizational Commitment in Marketing Journal of
Marketing, 53 (3), 79-90.
Iaffaldano, M. T., and Muchinsky, P. M., 1985. Job satisfaction and job
performance: A meta-analysis. Psychological Bulletin, 97 (2), 251-273.
375
Ilies, R., and Judge, T. A., 2003. On the heritability of job satisfaction: The mediating role of personality. Journal of Applied Psychology, 88 (4),
750-759.
Ironson, G. H., Smith, P. C., Brannick, M. T., Gibson, W. M., and Paul, K.
B., 1989. Construction of a Job in General scale: A comparison of global, composite, and specific measures. Journal of Applied Psychology, 74 (2), 193-200.
Ivancevich, J. M., 1976. Effects of goal setting on performance and satisfaction. Journal of Applied Psychology, 5 (61), 605-612.
James, L. A., and James, L. R., 1989. Integrating work environment perceptions: Explorations into the measurement of meaning. Journal of Applied Psychology, 74 (5), 739-751.
Janta, H., 2011. Polish migrant workers in the UK hospitality industry: Profiles, work experience and methods for accessing employment.
International Journal of Contemporary Hospitality Management, 23 (6), 5-5.
Janta, H., Brown, L., Lugosi, P., and Ladkin, A., in press. Migrant
relationships and tourism employment. Annals of Tourism Research, In Press, Corrected Proof.
Janta, H., and Ladkin, A., 2009. Polish Migrant Labor in the Hospitality Workforce: Implications for Recruitment and Retention. Tourism
Culture and Communication, 9, 5-15.
Jaworski, B. J., and Kohli, A. K., 1993. Market orientation: antecedents and consequences. Journal of Marketing, 57 (3), 53-70.
Jex, S. M., and Britt, T. W., 2008. Organizational psychology: A scientist-practitioner approach. 2 ed. Hoboken, NJ: John Wiley and Sons.
Johns, G., 2001. In praise of context. Journal of Organizational Behavior, 22 (1), 31-42.
Johnson, J. W., 1996. Linking employee perceptions of service climate to
customer satisfaction. Personnel Psychology, 49 (4), 831-851.
Jöreskog, K. G., 1969. A general approach to confirmatory maximum
likelihood factor analysis. Psychometrika, 34 (2), 183-202.
Jöreskog, K. G., 1993. Testing structural equation models. In: Bollen, K. A., and Long, J. S. eds. Testing structural equation models.
Newbury Park, CA: Sage, 294-316.
Jöreskog, K. G., and Sörbom, D., 1993. LISREL 8: Structural Equation
Modeling with the SIMPLIS Command Language. Chicago: Scientific Software.
Judge, T. A., Piccolo, R. F., and Ilies, R., 2004. The Forgotten Ones? The
Validity of Consideration and Initiating Structure in Leadership Research. Journal of Applied Psychology, 89 (1), 36-51.
376
Kahn, R. L., and Katz, D., 1960. Leadership practices in relation to productivity and morale. In: Cartwright, D., and Zander, A. eds.
Group dynamics: New York: Harper & Row; London: Tavistock Publications, 554-570.
Kanste, O., Miettunen, J., and Kyngäs, H., 2007. Psychometric properties of the Multifactor Leadership Questionnaire among nurses. Journal of Advanced Nursing, 57 (2), 201-212.
Karasek, R. A., and Theorell, T., 1990. Healthy work: Stress, productivity, and the reconstruction of working life. New York: Basic Books.
Katz, D., Maccoby, N., Gurin, G., and Floor, L., 1951. Productivity, Supervision, and Morale Among Railroad Workers. Survey Research Center, Institute for Social Research, Ann Arbor, MI: University of
Michigan.
Katz, D., Maccoby, N., and Morse, N., 1950. Productivity, supervision, and
morale in an office situation. Survey Research Center, Institute for Social Research, Ann Arbor, MI: University of Michigan.
Keegan, B. M., 1983. Leadership in the hospitality Industry. In: Cassée,
E., and Reuland, R. eds. The Management of Hospitality. Oxford: Pergamon Press, 69-93.
Keegan, S. N., and Lucas, R., 2005. Hospitality to hostility: dealing with low response rates in postal surveys. International Journal of
Hospitality Management, 24 (2), 157-169.
Kerr, S., and Schriesheim, C., 1974. Consideration, initiating structure, and organizational criteria - an update of Korman's 1966 review.
Personnel Psychology, 27 (4), 555-568.
Kerr, S., Schriesheim, C. A., Murphy, C. J., and Stogdill, R. M., 1974.
Toward a contingency theory of leadership based upon the consideration and initiating structure literature. Organizational Behavior and Human Performance, 12 (1), 62-82.
Kim, B., and George, R. T., 2005. The Relationship between Leader-Member Exchange (LMX) and Psychological Empowerment: A Quick
Casual Restaurant Employee Correlation Study. Journal of Hospitality & Tourism Research, 29 (4), 468-483.
Kim, B., Lee, G., and Carlson, K. D., 2010. An examination of the nature
of the relationship between Leader-Member-Exchange (LMX) and turnover intent at different organizational levels. International
Journal of Hospitality Management, 29 (4), 591-597.
Kim, S., O'neill, J. W., and Cho, H.-M., 2010. When does an employee not help coworkers? The effect of leader-member exchange on
employee envy and organizational citizenship behavior. International Journal of Hospitality Management, 29 (3), 530-537.
Kim, W. G., Leong, J. K., and Lee, Y.-K., 2005. Effect of service orientation on job satisfaction, organizational commitment, and intention of leaving in a casual dining chain restaurant. International Journal of
Hospitality Management, 24 (2), 171-193.
377
King, C. A., 1984. Service-Oriented Quality Control. Cornell Hotel and Restaurant Administration Quarterly, 25 (3), 92-98.
Kirchner, W. K., and Mousley, N. B., 1963. A Note on Job Performance: Differences Between Respondent and Nonrespondent Salesmen to
an Attitude Survey. Journal of Applied Psychology, 47 (Summer), 223-244.
Kirkpatrick, A., and Locke, E., 1991. Leadership: Do traits matter?
Academy of Management Executive, 5 (2), 48-60.
Kivela, J., and Go, F., 1996. Total Quality Management Transfer: A Case of
Hong Kong Hotels. Asia Pacific Journal of Human Resources, 34 (1), 63-76.
Kline, R. B., 2005. Principles and Practice of Structural Equation Modelling.
Second ed. New York: The Guildford Press.
Knight, A. P., Shteynberg, G., and Hanges, P. J. 2004. The path-goal
theory of leadership. In Burns, J. M., Goethals, R., and Sorenson, G. (Eds.), Encyclopedia of Leadership (Vol. 3, pp. 1164-1169). MA: Sage.
Kohlberg, L., 1963. Moral development and identification. In: Stevenson, H. W. ed. Child psychology. Chicago: Chicago Univ. Press, 232-
277).
Korman, A., 1974. The psychology of motivation. Englewood Cliffs, New
Jersey: Prentice-Hall.
Korman, A. K., 1966. "Consideration,” “initiating structure,” and organizational criteria—A review. Personnel Psychology, 19 (4),
349-361.
Korman, A. K., Greenhaus, J. H., and Badin, I. J., 1977. Personnel
attitudes and motivation. Annual Review of Psychology, 28, 175.
Kouzes, J. M., and Posner, B. Z., 1987. The Leadership Challenge. San Francisco: Jossey-Bass.
Kovach, K. A., 1980. Why motivational theories don't work. Advanced Management Journal (03621863), 45 (2), 54.
Kovach, K. A., 1987. What motivates employees? Workers and supervisors give different answers. Business Horizons, 30 (5), 58-65.
Kozak, M. A., and Uca, S., 2008. Effective Factors in the Constitution of
Leadership Styles: A Study of Turkish Hotel Managers. Anatolia, 19 (1), 117-134.
Kuruüzüm, A., Çetin, E. I., and Irmak, S., 2009. Path analysis of organizational commitment, job involvement and job satisfaction in Turkish hospitality industry. Tourism Review, 64 (1), 4-16.
Labor Relations Insitute. 1946. Foreman Facts. New York: Labor Relations Insitute.
378
Landy, F. J., 1985. The psychology of work behavior. 3 ed. Homewood, IL: Dorsey Press.
Lashley, C., 1995. Towards an understanding of employee empowerment in hospitality services. International Journal of Contemporary
Hospitality Management, 7 (1), 27-32.
Lashley, C., 1996. Research issues for employee empowerment in hospitality organisations. International Journal of Hospitality
Management, 15 (4), 333-346.
Lashley, C., and McGoldrick, J., 1994. The Limits of Empowerment: A
Critical Assessment of Human Resource Strategy for Hospitality Operations. Empowerment in Organizations, 2 (3), 25-38.
Latham, G. P., and Pinder, C. C., 2005. Work Motivation Theory and
Research at the Dawn of the Twenty-First Century. Annual Review of Psychology, 56 (1), 485-516.
Laurie, H., Smith, R., and Scott, L., 1999. Strategies for Reducing Nonresponse in a Longitudinal Panel Survey. Journal of Official Statistics, 15 (2), 269-282.
Lawler, E. E., 1967. The Multitrait-Multirater approach to measuring managerial job performance. Journal of Applied Psychology, 51
(51), 369-381.
Lawler, E. E., and Porter, L. W., 1967. The effect of performance on job
satisfaction. Industrial Relations (October), 20-28.
Lee-Ross, D., 1995. Attitudes and Work Motivation of Subgroups of Seasonal Hotel Workers. Service Industries Journal, 15 (3), 295-
313.
Lee-Ross, D., 1998a. A practical theory of motivation applied to hotels.
International Journal of Contemporary Hospitality Management, 10 (2), 68-74.
Lee-Ross, D., 1998b. The reliability and rationale of Hackman and
Oldham's Job Diagnostic Survey and Job Characteristics Model among seasonal hotel workers. International Journal of Hospitality
Management, 17 (4), 391-406.
Lee, Y. L., and Hing, N., Measuring quality in restaurant operations: an application of the SERVQUAL instrument. International Journal of
Hospitality Management, 14 (3-4), 293-310.
Ley, D. A., 1980. The Effective GM: Leader or Entrepreneur? The Cornell
Hotel and Restaurant Administration Quarterly, 21 (3), 66-67.
Liden, R. C., Wayne, S. J., and Sparrowe, R. T., 2000. An examination of the mediating role of psychological empowerment on the relations
between the job, interpersonal relationships, and work outcomes. Journal of Applied Psychology, 85 (3), 407-416.
379
Liden, R. C., Wayne, S. J., Zhao, H., and Henderson, D., 2008. Servant leadership: Development of a multidimensional measure and multi-
level assessment. The Leadership Quarterly, 19 (2), 161-177.
Likert, R., 1961. New patterns of management. New York: McGraw-Hill.
Likert, R., 1967. The Human Organisation: Its Management and Value. New York: McGraw-Hill.
Lim, E., 2008. A review of the literature pertaining to the relationship
between leadership practices and employee turnover. Consortium Journal of Hospitality & Tourism, 13 (1), 49-71.
Limsila, K., and Ogunlana, S. O., 2008. Performance and leadership outcome correlates of leadership styles and subordinate commitment. Engineering, Construction and Architectural
Management, 15 (2), 164-184.
Lindahl, L., 1949. What Makes a Good Job? Personnel, 25, (January).
Little, R. J. A., 1988. A Test of Missing Completely at Random for Multivariate Data with Missing Values. Journal of the American Statistical Association, 83, 1198-1202.
Litwin, G. H., and Stringer, R. A. J., 1968. Motivation and organizational climate. Boston: Harvard University Graduate School of Business.
Locke, E. A., 1976. The nature and causes of job satisfaction. In: Dunnette, M. D. ed. Handbook of industrial and organizational
psychology Chicago: Rand McNally, 1297-1349.
Locke, E. A., and Latham, G. P., 1984. Goal Setting: A Motivational Technique That Works. Englewood Cliffs, NJ: Prentice Hall.
Locke, E. A., and Latham, G. P., 1990. A theory of goal setting and task performance. Englewood Cliffs, NJ: Prentice-Hall.
Locke, E. A., and Latham, G. P., 2004. What should we do about motivation theory? Six recommendations for the twenty-first century. Academy of Management Review, 29 (3), 388-403.
Loehlin, J. C., 1992. Latent variable models: An introduction to factor, path, and structural analysis. 2 ed. Hillsdale, NJ: Lawrence
Erlbaum.
London, M., 1983. Toward a Theory of Career Motivation. Academy of Management Review, 8 (4), 620-630.
Lord, R. G., Foti, R. J., and Devader, C. L., 1984. A test of leadership categorization theory: internal structure, information processing,
and leadership perceptions. Organizational Behavior and Human Performance, 34, 343-378.
Lowe, K. B., and Gardner, W. L., 2000. Ten years of The leadership
quarterly: Contributions and challenges for the future. The Leadership Quarterly, 11 (4), 459-514.
380
Lundberg, C., Gudmundson, A., and Andersson, T. D., 2009. Herzberg's Two-Factor Theory of work motivation tested empirically on
seasonal workers in hospitality and tourism. Tourism Management, 30 (6), 890-899.
Lytle, R. S., 1994. Service orientation, market orientation, and performance: an organizational culture perspective. Thesis. Arizona State University, Tempe, AZ.
Maccallum, R. C., Browne, M. W., and Sugawara, H. M., 1996. Power analysis and determination of sample size for covariance structure
modeling. Psychological Methods, 1 (2), 130-149.
Mackenzie, K. D., and Barnes, F. B., 2007. The Unstated Consensus of Leadership Approaches. The International Journal of Organizational
Analysis, 15 (2), 92-118.
Maier, T. A., 2009. Appreciative inquiry and hospitality leadership. Journal
of Human Resources in Hospitality & Tourism, 8, 106-117.
Mardia, K. V., 1970. Measures of multivariate skewness and kurtosis with applications. Biometrika, 57 (3), 519-530.
Marnburg, E., 2007. Management Principles in Hospitality and Tourism: Freshman Students' Preferences. Journal of Human Resources in
Hospitality & Tourism, 6 (2), 79-107.
Maslow, A. H., 1954. Motivation and personality. New York: Harper & Row.
Mathieu, J. E., and Zajac, D. M., 1990. A review and meta-analysis of the antecedents, correlates, and consequences of organizational commitment. Psychological Bulletin, 108 (2), 171-194.
Mccall, J. M. W., 1986. Leadership and Performance Beyond Expectations. Human Resource Management, 25 (3), 481-484.
Mcclelland, D., 1961. The achieving society. New Jersey: Van Nostrand.
McGregor, D., 1960. The Human Side of Enterprise. New York: McGraw-Hill.
McGregor, D., 1966. Leadership and Motivation. M.I.T. Press: Cambridge, MA.
McIntosh, C. 2009. Response to SEMNET thread "VIF calculation with AMOS?". SEMNET Structural Equation Modeling Discussion Group Available from: http://bama.ua.edu/cgi-
bin/wa?A2=SEMNET;652ccae9.0908 [Accessed: 22/2/2012].
Meudell, K., and Rodham, K., 1998. Money isn't everything... or is it? A
preliminary research study into money as a motivator in the licensed house sector. International Journal of Contemporary Hospitality Management, 10 (4), 128-132.
Meyer, J., and Allen, N., 1984. Testing the side bets of organisational commitment. Journal of Applied Psychology, 69, 372-378.
381
Meyer, J. P., Allen, N. J., and Smith, C. A., 1993. Commitment to organizations and occupations: Extension and test of a three-
component conceptualization. Journal of Applied Psychology, 78 (4), 538-551.
Mill, R. C., 1986. Managing the Service Encounter. Cornell Hotel and Restaurant Administration Quarterly, 26 (4), 39-46.
Miller, K. I., Ellis, B. H., Zook, E. G., and Lyles, J. S., 1990. An Integrated
Model of Communication, Stress, and Burnout in the Workplace. Communication Research, 17 (3), 300-326.
Miller, N. E., and Dollard, J., 1941. Social learning and imitation. New Haven, CT: Yale University Press.
Millward, L., 2005. Understanding Occupational and Organizational
Psychology. London: Sage.
Minett, D., Yaman, H. R., and Denizci, B., 2009. Leadership styles and
ethical decision-making in hospitality management. International Journal of Hospitality Management, 28 (4), 486-493.
Mintzberg, H., 1973. The Nature of Managerial Work. New York: Harper
and Row.
Mintzberg, H., 1975. The manager's job: folklore and fact. Harvard
Business Review, 53 (4), 49-61.
Misumi, J., 1985. The behavioral science of leadership: An interdisciplinary
Japanese research program. Ann Arbor, MI: The University of Michigan Press.
Mitchell, T. R., 1997. Matching Motivational Strategies with Organizational
Contexts. In: Cummings, L. L., and Staw, B. M. eds. Research in Organizational Behavior Contexts Vol. 19. Greenwich, Conneticut:
JAI.
Mitchell, T. R., and Daniels, D., 2002. Motivation. In: Borman, W. C., Ilgen, D. R., and Klimoski, R. J. eds. Comprehensive Handbook of
Psychology, Volume Twelve: Industrial and Organizational Psychology. New York: John Wiley, 225-254.
Mok, C., Pine, R., and Pizam, A., 1998. Work Values of Chinese Hotel Managers. Journal of Hospitality & Tourism Research, 21 (3), 1-16.
Moorhead, G., and Griffin, R. W., 1998. Organizational behavior: Managing
people and organizations. 5 ed. Boston: Houghton Mifflin.
Moos, R. H., 1981. Work Environment Scale Manual. Palo Alto, CA:
Consulting Psychologists Press.
MOW International Research Program. 1995. The Meaning of Work Survey C. Gent: University of Gent.
MOW International Research Team. 1987. The Meaning of Working. London: Academic Press.
382
Mowday, R. T., Steers, R. M., and Porter, L. W., 1979. The measurement of organizational commitment. Journal of Vocational Behavior (14),
224-247.
Moynihan, D. P., and Pandey, S. K., 2007. Finding Workable Levers Over
Work Motivation: Comparing Job Satisfaction, Job Involvement, and Organizational Commitment. Administration Society, 39 (7), 803-832.
Muenjohn, N., and Armstrong, A., 2008. Evaluating the structural validity of the Multifactor Leadership Questionnaire (MLQ), capturing the
leadership factors of transformational-transactional leadership. Contemporary Management Research, 4 (1), 3-14.
Mullins, L. J., 1992. Hospitality Management: A Human Resource
Approach. London: Pitman.
Murphy, J., Schegg, R., and Olaru, D., 2007. Quality clusters: Dimensions
of email responses by luxury hotels. International Journal of Hospitality Management, 26 (3), 743-747.
Muthén, B., and Kaplan, D., 1985. A comparison of some methodologies
for the factor analysis of non-normal Likert variables. British Journal of Mathematical and Statistical Psychology, 38 (2), 171-189.
Naipaul, S., and Wang, Y., 2009. Entrepreneurship and leadership in hospitality: Insights and implications for hospitality and tourism
education - Mr Harris Rosen in conversation with Drs Sandra Naipaul and Youcheng Wang. International Journal of Contemporary Hospitality Management, 21 (6), 639-658.
Nam, J.-H., and Lee, T. J., 2011. Foreign travelers' satisfaction with traditional Korean restaurants. International Journal of Hospitality
Management, 30 (4), 982-989.
Nebel, E. C., 1978. Motivation, Leadership, and Employee Performance: A Review. The Cornell Hotel and Restaurant Administration Quarterly,
19 (1), 62.
Nebel, E. C., and Stearns, G. K., 1977. Leadership in the hospitality
industry. The Cornell Hotel and Restaurant Administration Quarterly (November), 69-76.
Nicolaides, A., 2006. Management versus Leadership in the Hospitality
Industry. Journal of Travel & Tourism Research, 6 (1), 29-38.
Nixon, B., 1994. Facilitating Empowerment in Organizations. Leadership &
Organization Development Journal, 15 (4), 3-11.
Northouse, P., 2004. Leadership: Theory and Practice. 3rd ed. Thousand Oaks, CA: Sage Publications.
O'Gorman, K., D., and Gillespie, C., 2010. The mythological power of hospitality leaders?: A hermeneutical investigation of their reliance
on storytelling. International Journal of Contemporary Hospitality Management, 22 (5), 659-680.
383
OBWeb. (2011) About the OB Division. Official Website of the Organizational Behavior Division of the Academy of Management
Available from: http://www.obweb.org/index.php?option=com_content&view=articl
e&id=63&Itemid=67 [Accessed: 15/09/2011].
Office for National Statistics. 2000. Standard Occupational Classification: Volume 2, The Coding Index. The Stationery Office.
Office for National Statistics. 2011a. Business Population Estimates for the UK and Regions. (URN 11/92A ). Sheffield: ONS.
Office for National Statistics. Inter-Departmental Business Register (IDBR). Available from: http://www.ons.gov.uk/ons/about-ons/who-we-are/services/unpublished-data/business-
data/idbr/index.html [Accessed 22/7/2011.]
Øgaard, T., Marnburg, E., and Larsen, S., 2008. Perceptions of
organizational structure in the hospitality industry: Consequences for commitment, job satisfaction and perceived performance. Tourism Management, 29 (4), 661-671.
Olsen, M., 1999. The restaurant revolution: growth, change and strategy in the international foodservice industry. Report for the
International Hotel and Restaurant Association, Paris: IH&RA.
Olsen, M., D. 2004. Literature in strategic management in the hospitality
industry. International Journal of Hospitality Management, 23 (5), 411-424.
Organ, D. W., 1988. Organizational citizenship behavior: The good soldier
syndrome. Lexington, MA: Lexington Books.
Paarlberg, L. E., and Perry, J. L., 2007. Values Management. The American
Review of Public Administration, 37 (4), 387-408.
Parasuraman, A., Berry, L. L., and Zeithaml, V. A., 1991. Refinement and Reassessment of the SERVQUAL Scale. Journal of Retailing, 67 (4),
420.
Parasuraman, A., Zeithaml, V. A., and Berry, L. L., 1985. A Conceptual
Model of Service Quality and Its Implications for Future Research. Journal of Marketing, 49 (4), 41-50.
Parasuraman, A., Zeithaml, V. A., and Berry, L. L., 1988. SERVQUAL: A
Multiple-Item Scale for Measuring Consumer Perceptions of Service Quality. Journal of Retailing, 64 (1), 12-40.
Patiar, A., and Mia, L., 2008. The effect of subordinates' gender on the difference between self-ratings, and superiors' ratings, of subordinates' performance in hotels. International Journal of
Hospitality Management, 27 (1), 53-64.
384
Patiar, A., and Mia, L., 2009. Transformational leadership style, market competition and departmental performance: Evidence from luxury
hotels in Australia. International Journal of Hospitality Management, 28 (2), 254-262.
People 1st. 2011a. Industry Profile: Hotels. Uxbridge: People 1st.
People 1st. 2011b. Industry Profile: Restaurants. Uxbridge: People 1st.
People 1st. 2011. Labour Market Survey Statistics, Personal
communication from Alastair Galbraith People 1st Senior Research Executive, 25th May. e-Mail to Boyne, S.
Pinder, C. C., 1984. Work Motivation: Theory, Issues, and Applications. Glenview, Illinois: Scott, Foresman and Company.
Pinder, C. C., 1998. Work motivation in organizational behavior. Upper
Saddle River: Prentice-Hall.
Pinder, C. C., and Moore, L. F., 1979. The Resurrection of Taxonomy to
Aid the Development of Middle Range Theories of Organizational Behavior. Administrative Science Quarterly, 24 (1), 99-118.
Pittaway, L., Carmouche, R., and Chell, E., 1998. The way forward:
Leadership research in the hospitality industry. International Journal of Hospitality Management, 17 (4), 407-426.
Podsakoff, P. M., Mackenzie, S. B., Ahearne, M., and Bommer, W. H., 1995. Searching for a Needle in a Haystack: Trying to Identify the
Illusive Moderators of Leadership Behaviors. Journal of Management, 21 (3), 422-470.
Podsakoff, P. M., Mackenzie, S. B., Lee, J.-Y., and Podsakoff, N. P., 2003.
Common method biases in behavioral research: A critical review of the literature and recommended remedies. Journal of Applied
Psychology, 88 (5), 879-903.
Podsakoff, P. M., Mackenzie, S. B., Moorman, R. H., and Fetter, R., 1990. Transformational leader behaviors and their effects on followers'
trust in leader, satisfaction, and organizational citizenship behaviors. The Leadership Quarterly, 1 (2), 107-142.
Porter, L. W., Steers, R. M., Mowday, R. T., and Boulian, P. V., 1974. Organizational commitment, job satisfaction, and turnover among psychiatric tehnicians. Journal of Applied Psychology, 59, 603-609.
Preston, C. C., and Colman, A. M., 2000. Optimal number of response categories in rating scales: reliability, validity, discriminating power,
and respondent preferences. Acta Psychologica, 104 (1), 1-15.
Price, J. L., and Mueller, C. W., 1981. Professional turnover: The case of nurses. NewYork: SP Medical and Scientific.
Rahim, M. A., 1988. The development of a leader power inventory. Multivariate Behavioral Research, 23, 491-503.
385
Ray, J. J., 1983. Reviving the problem of acquiescent response bias. Journal of Social Psychology, 121 (1), 81.
Raykov, T., 1997. Estimation of Composite Reliability for Congeneric Measures. Applied Psychological Measurement, 21 (2), 173-184.
Raykov, T., 1998. A Method for Obtaining Standard Errors and Confidence Intervals of Composite Reliability for Congeneric Items. Applied Psychological Measurement, 22 (4), 369-374.
Raykov, T., and Marcolides, G. A., 2006. A First Course in Structural Equation Modeling. 2 ed. Mahwah, New Jersey: Lawrence Erlbaum
Associates.
Reichers, A. E., and Schneider, B., 1990. Climate and culture: an evolution of constructs. In: Schneider, B. ed. Organizational climate and
culture. San Francisco: Jossey-Bass, 5-39.
Rigdon, E. E., 1995. A Necessary and Sufficient Identification rule for
Structural Models Estimated in Practice. Multivariate Behavioral Research, 30 (3), 359.
Robertson, I. T., and Smith, M., 1985. Motivation and Job Design, Theory,
Research and Practice. London: Institute of Personnel Management.
Robinson, R. N. S., and Barron, P. E., 2007. Developing a framework for
understanding the impact of deskilling and standardisation on the turnover and attrition of chefs. International Journal of Hospitality
Management, 26 (4), 913-926.
Rohan, M. J., 2000. A rose by any name? The values construct. Personality and Social Psychology Review, 4, 255-277.
Ross, G. F., 1992. Tourism and hospitality industry job-attainment beliefs and work values among Australian schools leavers. International
Journal of Hospitality Management, 11 (4), 319-330.
Ross, L. E., and Boles, J. S., 1994. Exploring the influence of workplace relationships on work-related attitudes and behaviors in the
hospitality work environment. International Journal of Hospitality Management, 13 (2), 155-171.
Rost, J. C., 1991. Leadership for the twenty-first century. New York: Praeger.
Rousseau, D. M., and Fried, Y., 2001. Location, location, location:
contextualizing organizational research. Journal of Organizational Behavior, pp. 1-13.
Rowold, J., and Heinitz, K., 2007. Transformational and charismatic leadership: Assessing the convergent, divergent and criterion validity of the MLQ and the CKS. The Leadership Quarterly, 18 (2),
121-133.
Ruyter, K. D., and Wetzels, M., 2000. Customer equity considerations in
service recovery: a cross-industry perspective. International Journal of Service Industry Management, 11 (1), 91-108.
386
Salgado, J. F. 2006. History of Industrial/Organizational Psychology in Europe and the United Kingdom, Encyclopedia of Industrial and
Organizational Psychology: SAGE Publications.
Sashkin, M., and Garland, H., 1979. Laboratory and field research on
leadership: integrating divergent streams. In: Hunt, J. G., and Larson, L. L. eds. Crosscurrents in leadership. Carbondale, IL: Southern Illinois University Press., 64-87.
Saunders, R. E., 2004. Leadership training in hospitality. Florida International University Hospitality Review, 22 (1), 30-40.
Scheule, B., and Sneed, J., 2001. Teaching leadership in hospitality management programmes: A model for learning from leaders. Journal of Hospitality & Tourism Education, 13 (2), 34-37.
Schneider, B., and Bowen, D. E., 1985. Employee and customer perceptions of service in banks: Replication and extension. Journal
of Applied Psychology, 70 (3), 423-433.
Schneider, B., Parkington, J. J., and Buxton, V. M., 1980. Employee and Customer Perceptions of Service in Banks. Administrative Science
Quarterly, 25 (2), 252-267.
Schumaker, R. E., and Lomax, R. G., 2004. A beginner's guide to
structural equation modeling. 2 ed. New York and Hove: Psychology Press.
Schyns, B., Kroon, B., and Moors, G., 2008. Follower characteristics and the perception of leader-member exchange. Journal of Managerial Psychology, 23 (7), 772 - 788.
Scott-Halsell, S., Shumate, S. R., and Blum, S., 2008. Using a Model of Emotional Intelligence Domains to Indicate Transformational
Leaders in the Hospitality Industry. Journal of Human Resources in Hospitality & Tourism, 7 (1), 99-113.
Shortt, G., 1989. Work activities of hotel managers in Northern Ireland: a
Mintzbergian analysis. International Journal of Hospitality Management, 8 (2), 121-130.
Simons, T., 2003. Motivation research in hospitality between 1990 and 2001: A prescriptive review of the literature. In: Kusluvan, S. ed. Managing Employee Attitudes and Behaviors in the Tourism and
Hospitality Industry. New York: Nova Science Publishers, 339-356.
Simons, T., 2010. Discretionary Service Behaviour measurement scale.
e-Mail to Boyne, S., 26 Feb.
Simons, T., and Enz, C. A., 1995. Motivating Hotel Employees. Cornell Hotel and Restaurant Administration Quarterly, 36 (1), 20-27.
Simons, T., and Roberson, Q., 2003. Why managers should care about fairness: The effects of aggregate justice perceptions on
organizational outcomes. Journal of Applied Psychology, 88 (3), 432-443.
387
Singer, E., Van Hoewyk, J., Gebler, N., Raghunathan, T., and Mcgonagle, K., 1999. The Effect of Incentives on Response Rates in
Interviewer-Mediated Surveys. Journal of Official Statistics, 15 (2), 217-230.
Siu, V., Tsang, N., and Wong, S., 1997. What Motivates Hong Kong's Hotel Employees? Cornell Hotel and Restaurant Administration Quarterly, 38 (5), 44-49.
Smith, P. C., Kendall, L. M., and Hulin, C. L., 1969. The measurement of satisfaction in work and retirement. Chicago: Rand McNally.
Sparr, J. L., and Sonnentag, S., 2008. Fairness perceptions of supervisor feedback, LMX, and employee well-being at work. European Journal of Work and Organizational Psychology, 17 (2), 198-225.
Sparrowe, R. T., 1994. Empowerment in the Hospitality Industry: an Exploration of Antecedents and Outcomes. Journal of Hospitality &
Tourism Research, 17 (3), 51-73.
Spector, P. E., 1997. Job satisfaction: Application, assessment, causes, and consequences. Thousand Oaks, CA: Sage
Spreitzer, G. M., 1992. When organizations dare: the dynamics of psychological empowerment in the workplace. Thesis. University of
Michigan.
Spreitzer, G. M., 1995. An empirical test of a comprehensive model of
intrapersonal empowerment in the workplace. American Journal of Community Psychology (23), 601-629.
Stamper, C. L., and Van Dyne, L., 2003. Organizational citizenship: A
comparison between part-time and full-time service employees. The Cornell Hotel and Restaurant Administration Quarterly, 44 (1), 6-6.
Steflre, B., 1959. Concurrent validity of the Vocational Values Inventory. Journal of Educational Research, 52 (9), 339-341.
Steiger, J. H., 1990. Structural Model Evaluation and Modification: An
Interval Estimation Approach. Multivariate Behavioral Research, 25 (2), 173.
Steiger, J. H., and Lind, J. C., 1980. Statistically-based tests for the number of common factors. In: Paper presented at the annual Spring Meeting of the Psychometric Society, Iowa City.
Stevens, J. P., 1996. Applied multivariate statistics for the social sciences. 3 ed. New York and Hove: Routledge.
Stevens, J. P., 2009. Applied multivariate statistics for the social sciences. 5 ed. New York and Hove: Routledge.
Stevens, P., Knutson, B., and Patton, M., 1995. DINESERVE: A tool for
measuring service quality in restaurants. The Cornell Hotel and Restaurant Administration Quarterly, 36 (2), 5-5.
388
Stogdill, R. M., 1948. Personal factors associated with leadership: A survey of the literature. Journal of Psychology, 25, 35-71.
Stogdill, R. M., and Coons, A. E., 1957. Leader behavior: Its descriplion and measurement. Columbus: Ohio State University, Bureau of
Business Research. Res. Monogr. No. 88.
Super, D. E., 1962. The structure of work values in relation to status, achievement, interests, and adjustment. Journal of Applied
Psychology, 46 (4), 231-239.
Susskind, A. M., Borchgrevink, C. P., Brymer, R. A., and Kacmar, K. M.,
2000a. Customer Service Behavior and Attitudes among Hotel Managers: A Look at Perceived Support Functions, Standards for Service, and Service Process Outcomes. Journal of Hospitality &
Tourism Research, 24 (3), 373-397.
Susskind, A. M., Borchgrevink, C. P., Michele Kacmar, K., and Brymer, R.
A., 2000b. Customer service employees' behavioral intentions and attitudes: an examination of construct validity and a path model. International Journal of Hospitality Management, 19 (1), 53-77.
Sverko, B., and Vizek-Vidovic, V., 1995. Studies of the meaning of work: Approaches, models, and some of the findings. In: Super, D. E. ed.
Life roles, values, and careers: International findings of the work importance study. San Francisco: Jossey-Bass, 3-21.
Tabachnick, B. G., and Fidell, L. S., 1989. Using Multivariate Statistics. Vol. 2. New York: HarperCollins.
Tabachnick, B. G., and Fidell, L. S., 2007. Using Multivariate Statistics. 5
ed. New York: Allyn and Bacon.
Tamers, S. L., Beresford, S. A. A., Thompson, B., Zheng, Y., and Cheadle,
A. D., 2011. Exploring the Role of Co-worker Social Support on Health Care Utilization and Sickness Absence. Journal of Occupational and Environmental Medicine, 53 (7), 751-757
710.1097/JOM.1090b1013e318223d318242f.
Ten Eyck, L. 2007. Social Learning. In Buskist, W. F., and Davis, S. F.
(Eds.), 21st Century Psychology: A Reference Handbook (pp. 351-359). Thousand Oaks, CA: Sage Publications.
Tepper, B. J., and Percy, P. M., 1994. Structural validity of the Multifactor
Leadership Questionnaire. Educational and Psychological Measurement, 54 (3), 734-744.
Tesone, D. V., Platt, A., and Alexakis, G., 2003. The Five Mythical Habits of Highly Ineffective Leadership: The Anecdote Is the Antidote in the Games Professionals Play. Journal of Human Resources in
Hospitality & Tourism, 2 (1), 1.
Testa, M. R., 2001. Hospitality leaders : Do they know how their
employees feel about them? The Cornell Hotel and Restaurant Administration Quarterly, 42 (6), 80-89.
389
Testa, M. R., 2002. Leadership dyads in the cruise industry: the impact of cultural congruency. International Journal of Hospitality
Management, 21 (4), 425-441.
Testa, M. R., 2004. Cultural similarity and service leadership: a look at the
cruise industry. Managing Service Quality, 14 (5), 402 - 413.
Testa, M. R., 2007. A deeper look at national culture and leadership in the hospitality industry. International Journal of Hospitality
Management, 26 (2), 468-484.
Testa, M. R., 2009. National culture, leadership and citizenship:
Implications for cross-cultural management. International Journal of Hospitality Management, 28 (1), 78-85.
Testa, M. R., and Sipe, L., 2012. Service-leadership competencies for
hospitality and tourism management. International Journal of Hospitality Management, 31 (3), 648-658.
Thomas, K. W., and Tymon, W. G. 1993. Testing and refining an interpretative model of empowerment, Working paper.
Thomas, K. W., and Velthouse, B. A., 1990. Cognitive Elements of
Empowerment: An "Interpretive" Model of Intrinsic Task Motivation. Academy of Management Review, 15 (4), 666-681.
Tichy, N., and Devanna, M., 1986. The transformational leader. New York: Wiley.
Tracey, J. B., and Hinkin, T. R., 1994. Transformational leaders in the hospitality industry. The Cornell Hotel and Restaurant Administration Quarterly, 35 (2), 18-24.
Tracey, J. B., and Hinkin, T. R., 1996. How transformational leaders lead in the hospitality industry. International Journal of Hospitality
Management, 15 (2), 165-176.
Tracey, J. B., and Hinkin, T. R., 1998. Transformational Leadership or Effective Managerial Practices? Group Organization Management, 23
(3), 220-236.
Tsai, C.-W. 2008. Leadership style and employee's job satisfaction in
international tourist hotels. In Woodside, A. (Ed.), Advances in Culture, Tourism and Hospitality Research, Volume 2 (pp. 293-332): Emerald Group Publishing Limited.
Tutuncu, O., and Kozak, M., 2007. An Investigation of Factors Affecting Job Satisfaction. International Journal of Hospitality & Tourism
Administration, 8 (1), 1-19.
Uhl-Bien, M., Graen, G., and Scandura, T., 2000. Implications of Leader-Member Exchange (LMX) for strategic human resource management
systems: Relationships as social capital for competitive advantage. In: Ferris, G. R. ed. Research in personnel and human resources
management Vol. 18. Greenwich, CT: JAI Press, 137-185.
390
Upchurch, R. S., Davies, R., and Sverdlin, O., 2000. Motivation of the Russian worker: an evolutionary process. Tourism Management, 21
(5), 509-514.
Van Dyne, L., and LePine, J. A., 1998. Helping and voice extra-role
behaviors: Evidence of construct and predictive validity. Academy of Management Journal, 41, 108-119.
Van Seters, D. A., and Field, R. H. G., 1990. The Evolution of Leadership
Theory. Journal of Organizational Change Management, 3 (3), 29.
Van Vuuren, M., De Jong, M., D. T. , and Seydel, E., R., 2007. Direct and
indirect effects of supervisor communication on organizational commitment. Corporate Communications: An International Journal, 12 (2), 116-128.
Vincent, C. E., 1964. Socioeconomic Status and Familial Variables in Mail Questionnaire Responses. American Journal of Sociology, 69 (May),
647-653.
Vroom, V. H., 1964. Work and Motivation. New York: John Wiley and Sons.
Vroom, V. H., 1997. Loose-Tight Leadership: What is the Question? Applied Psychology, 46 (4), 422-427.
Vroom, V. H., and Jago, A. G., 2007. The role of the situation in leadership. American Psychologist, 62 (1), 17-24.
Vroom, V. H., and Yetton, P. W., 1973. Leadership and decision making. Pittsburgh, PA: University of Pittsburgh Press.
Weiss, H. M., 2002. Deconstructing job satisfaction: Separating
evaluations, beliefs and affective experiences. Human Resource Management Review, 12 (2), 173-194.
West, S. G., Finch, J. F., and Curran, P. J., 1995. Structural Equation Models with Nonnormal Variables: Problems and Remedies. In: Hoyle, R. H. ed. Structural Equation Modelling: Concepts, Issues,
and Applications. Thousand Oaks, CA: Sage, 56-76.
White, C., 2006. Towards an understanding of the relationship between
work values and cultural orientations. International Journal of Hospitality Management, 25 (4), 699-715.
White, M., 1973. Management style in hotels. HCIMA Journal (Hotel,
Catering and Institutional Management Association journal) (October), 9.
Whitelaw, P. A., and Morda, R., 2004. Leadership in the Hospitality Industry Boadecia v Attila - Bring it on!! Journal of Hospitality and Tourism Management, 11 (2), 139-148.
391
Wildes, V. J., 2007. Attracting and retaining food servers: How internal service quality moderates occupational stigma. International Journal
of Hospitality Management, 26 (1), 4-19.
Wilkins, H., Merrilees, B., and Herington, C., 2007. Towards an
understanding of total service quality in hotels. International Journal of Hospitality Management, 26 (4), 840-853.
Williams, K. J., and Lillibridge, J. R., 1992. Perceived Self-competence and
Organizational Behavior. In: Kelly, K. ed. Issues, theory, and research in industrial/organizational psychology. New York: Elsevier
Science, 155-184.
Winnubst, J., 1993. Organizational structure, social support, and burnout. In: Schaufeli, W. B., Maslach, C., and Marek, T. eds. Professional
burnout: Recent developments in theory and research. Philadelphia, PA: Taylor & Francis, 151-162.
Wofford, J. C., and Liska, L. Z., 1993. Path-goal theories of leadership: A meta analysis. Journal of Management, 19 (19), 858-876.
Wollack, S., Goodale, J. G., Wijting, J. P., and Smith, P. C., 1971.
Development of the survey of work values. Journal of Applied Psychology, 55 (4), 331-338.
Wong, A., and Chan, A., 2010. Understanding the leadership perceptions of staff in China's hotel industry: Integrating the macro- and micro-
aspects of leadership contexts. International Journal of Hospitality Management, 29 (3), 437-447.
Wong, N., Rindfleisch, A., and Burroughs, James e., 2003. Do Reverse-
Worded Items Confound Measures in Cross-Cultural Consumer Research? The Case of the Material Values Scale. Journal of
Consumer Research, 30 (1), 72-91.
Wong, S., Siu, V., and Tsang, N., 1999. The impact of demographic factors on Hong Kong hotel employees' choice of job-related
motivators. International Journal of Contemporary Hospitality Management, 11 (5), 230-242.
Wong, S. C.-K., and Ko, A., 2009. Exploratory study of understanding hotel employees' perception on work-life balance issues. International Journal of Hospitality Management, 28 (2), 195-203.
Wood, R. C., 1994. Organizational Behaviour for Hospitality Management. London: Butterworth-Heineman.
Wood, R. C., 1997. Working in Hotels and Catering. London: Thomson Business Press.
Worsfold, P., 1989. Leadership and managerial effectiveness in the
hospitality industry. International Journal of Hospitality Management, 8 (2), 145-155.
392
Wrzesniewski, A., and Dutton, J. E., 2001. Crafting a job: Revisioning employees as active crafters of their work. Academy of Management
Review, 2 (26), 179-201.
Yang, J.-T., 2007. Knowledge sharing: Investigating appropriate
leadership roles and collaborative culture. Tourism Management, 28 (2), 530-543.
Yang, J.-T., 2010. Antecedents and consequences of job satisfaction in the
hotel industry. International Journal of Hospitality Management, 29 (4), 609-619.
Yee, R. W. Y., Lee, P. K. C., Yeung, A. C. L., and Cheng, T. C. E., in press. The relationships among leadership, goal orientation, and service quality in high-contact service industries: An empirical study.
International Journal of Production Economics, corrected proof.
Yiing, L. H., and Ahmad, K. Z. B., 2009. The moderating effects of
organizational culture on the relationships between leadership behaviour and organizational commitment and between organizational commitment and job satisfaction and performance.
Leadership and Organization Development Journal, 30 (1), 53-86.
Yousef, D. A., 2000. Organizational commitment: a mediator of the
relationships of leadership behaviour with job satisfaction and performance in a non-western country. Journal of Managerial
Psychology, 15 (1), 6-28.
Yukl, G., 1989. Managerial Leadership: A Review of Theory and Research. Journal of Management, 15 (2), 251-289.
Yukl, G., 2006. Leadership in organizations. Sixth ed. Upper Saddle River: Pearson Prentice Hall.
Yukl, G., 2010. Leadership in organizations. Seventh ed. Upper Saddle River: Pearson Prentice Hall.
Zeithaml, V., and Bitner, M. J., 1996. Services Marketing. New York:
McGraw-Hill.
Zopiatis, A., and Constanti, P., 2010. Leadership styles and burnout: is
there an association? International Journal of Contemporary Hospitality Management, 22 (3), 300-320.
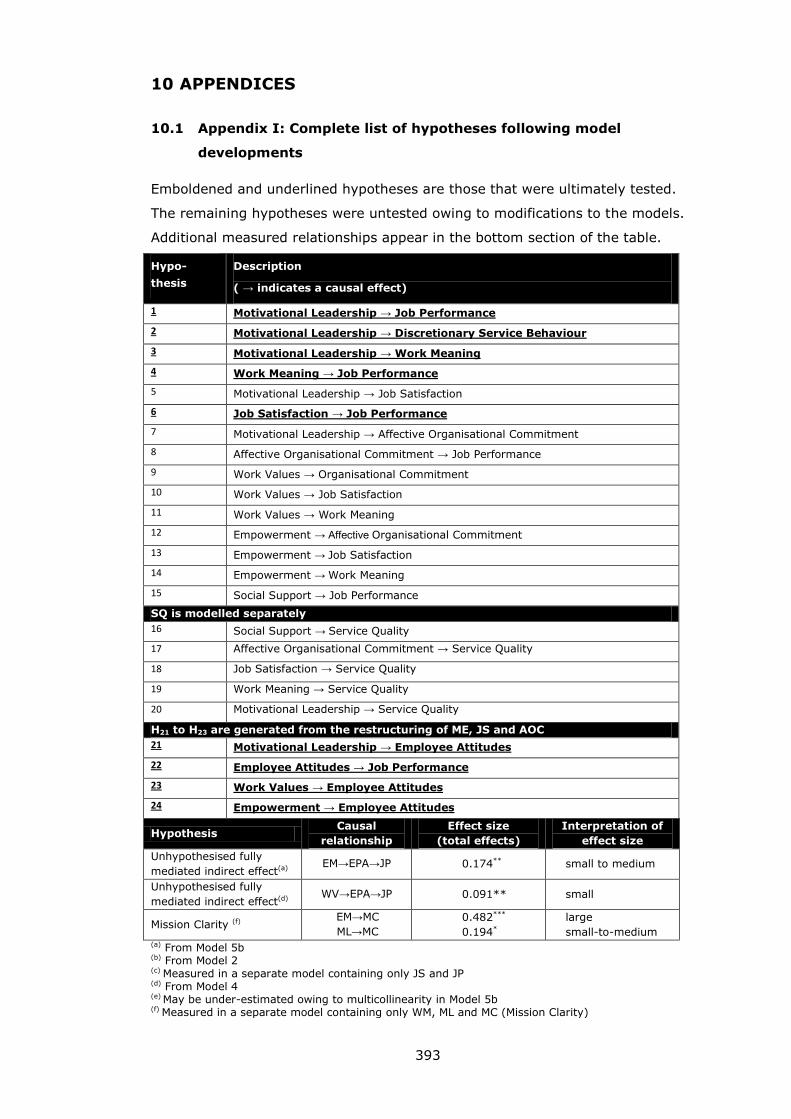
393
10 APPENDICES
10.1 Appendix I: Complete list of hypotheses following model
developments
Emboldened and underlined hypotheses are those that were ultimately tested.
The remaining hypotheses were untested owing to modifications to the models.
Additional measured relationships appear in the bottom section of the table.
Hypo-
thesis
Description
( → indicates a causal effect)
1 Motivational Leadership → Job Performance
2 Motivational Leadership → Discretionary Service Behaviour
3 Motivational Leadership → Work Meaning
4 Work Meaning → Job Performance
5 Motivational Leadership → Job Satisfaction
6 Job Satisfaction → Job Performance
7 Motivational Leadership → Affective Organisational Commitment
8 Affective Organisational Commitment → Job Performance
9 Work Values → Organisational Commitment
10 Work Values → Job Satisfaction
11 Work Values → Work Meaning
12 Empowerment → Affective Organisational Commitment
13 Empowerment → Job Satisfaction
14 Empowerment → Work Meaning
15 Social Support → Job Performance
SQ is modelled separately
16 Social Support → Service Quality
17 Affective Organisational Commitment → Service Quality
18 Job Satisfaction → Service Quality
19 Work Meaning → Service Quality
20 Motivational Leadership → Service Quality
H21 to H23 are generated from the restructuring of ME, JS and AOC
21 Motivational Leadership → Employee Attitudes
22 Employee Attitudes → Job Performance
23 Work Values → Employee Attitudes
24 Empowerment → Employee Attitudes
Hypothesis Causal
relationship
Effect size
(total effects)
Interpretation of
effect size
Unhypothesised fully
mediated indirect effect(a) EM→EPA→JP 0.174** small to medium
Unhypothesised fully
mediated indirect effect(d) WV→EPA→JP 0.091** small
Mission Clarity (f) EM→MC
ML→MC
0.482***
0.194*
large
small-to-medium (a) From Model 5b (b) From Model 2 (c) Measured in a separate model containing only JS and JP (d) From Model 4 (e)
May be under-estimated owing to multicollinearity in Model 5b (f) Measured in a separate model containing only WM, ML and MC (Mission Clarity)
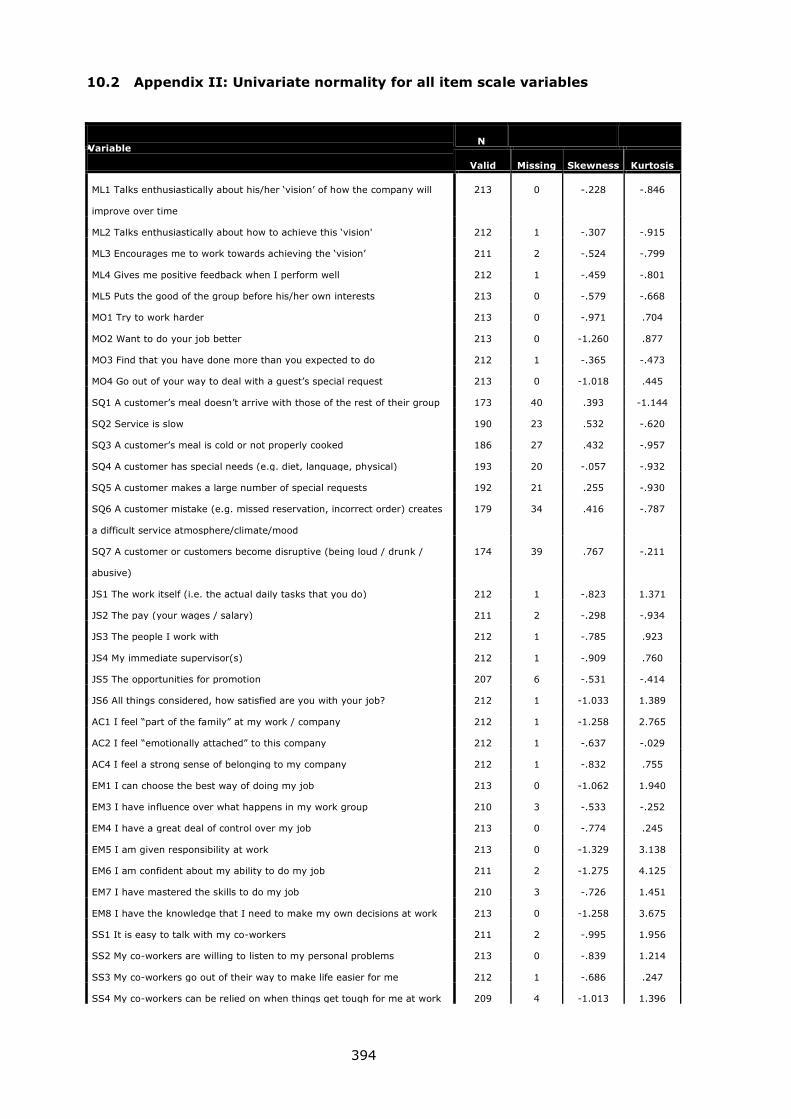
394
10.2 Appendix II: Univariate normality for all item scale variables
Variable N
Valid Missing Skewness Kurtosis
ML1 Talks enthusiastically about his/her ‘vision’ of how the company will
improve over time
213 0 -.228 -.846
ML2 Talks enthusiastically about how to achieve this ‘vision' 212 1 -.307 -.915
ML3 Encourages me to work towards achieving the ‘vision’ 211 2 -.524 -.799
ML4 Gives me positive feedback when I perform well 212 1 -.459 -.801
ML5 Puts the good of the group before his/her own interests 213 0 -.579 -.668
MO1 Try to work harder 213 0 -.971 .704
MO2 Want to do your job better 213 0 -1.260 .877
MO3 Find that you have done more than you expected to do 212 1 -.365 -.473
MO4 Go out of your way to deal with a guest’s special request 213 0 -1.018 .445
SQ1 A customer’s meal doesn’t arrive with those of the rest of their group 173 40 .393 -1.144
SQ2 Service is slow 190 23 .532 -.620
SQ3 A customer’s meal is cold or not properly cooked 186 27 .432 -.957
SQ4 A customer has special needs (e.g. diet, language, physical) 193 20 -.057 -.932
SQ5 A customer makes a large number of special requests 192 21 .255 -.930
SQ6 A customer mistake (e.g. missed reservation, incorrect order) creates
a difficult service atmosphere/climate/mood
179 34 .416 -.787
SQ7 A customer or customers become disruptive (being loud / drunk /
abusive)
174 39 .767 -.211
JS1 The work itself (i.e. the actual daily tasks that you do) 212 1 -.823 1.371
JS2 The pay (your wages / salary) 211 2 -.298 -.934
JS3 The people I work with 212 1 -.785 .923
JS4 My immediate supervisor(s) 212 1 -.909 .760
JS5 The opportunities for promotion 207 6 -.531 -.414
JS6 All things considered, how satisfied are you with your job? 212 1 -1.033 1.389
AC1 I feel “part of the family” at my work / company 212 1 -1.258 2.765
AC2 I feel “emotionally attached” to this company 212 1 -.637 -.029
AC4 I feel a strong sense of belonging to my company 212 1 -.832 .755
EM1 I can choose the best way of doing my job 213 0 -1.062 1.940
EM3 I have influence over what happens in my work group 210 3 -.533 -.252
EM4 I have a great deal of control over my job 213 0 -.774 .245
EM5 I am given responsibility at work 213 0 -1.329 3.138
EM6 I am confident about my ability to do my job 211 2 -1.275 4.125
EM7 I have mastered the skills to do my job 210 3 -.726 1.451
EM8 I have the knowledge that I need to make my own decisions at work 213 0 -1.258 3.675
SS1 It is easy to talk with my co-workers 211 2 -.995 1.956
SS2 My co-workers are willing to listen to my personal problems 213 0 -.839 1.214
SS3 My co-workers go out of their way to make life easier for me 212 1 -.686 .247
SS4 My co-workers can be relied on when things get tough for me at work 209 4 -1.013 1.396
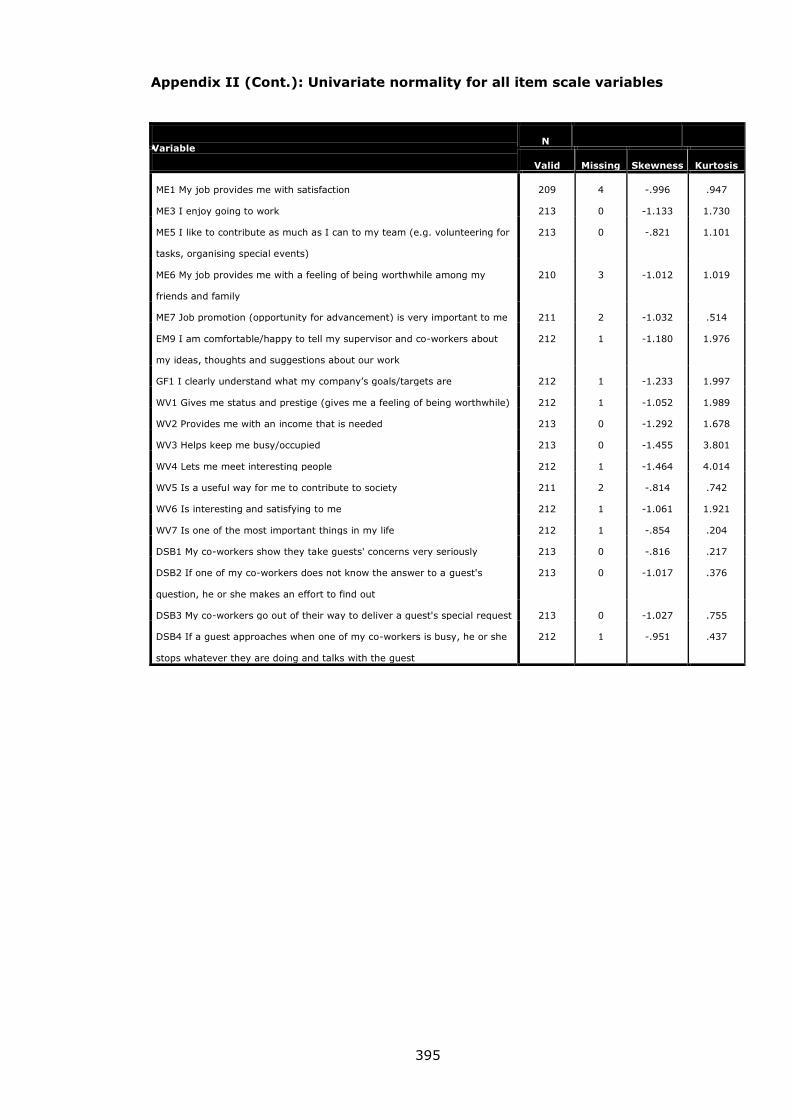
395
Appendix II (Cont.): Univariate normality for all item scale variables
Variable N
Valid Missing Skewness Kurtosis
ME1 My job provides me with satisfaction 209 4 -.996 .947
ME3 I enjoy going to work 213 0 -1.133 1.730
ME5 I like to contribute as much as I can to my team (e.g. volunteering for
tasks, organising special events)
213 0 -.821 1.101
ME6 My job provides me with a feeling of being worthwhile among my
friends and family
210 3 -1.012 1.019
ME7 Job promotion (opportunity for advancement) is very important to me 211 2 -1.032 .514
EM9 I am comfortable/happy to tell my supervisor and co-workers about
my ideas, thoughts and suggestions about our work
212 1 -1.180 1.976
GF1 I clearly understand what my company’s goals/targets are 212 1 -1.233 1.997
WV1 Gives me status and prestige (gives me a feeling of being worthwhile) 212 1 -1.052 1.989
WV2 Provides me with an income that is needed 213 0 -1.292 1.678
WV3 Helps keep me busy/occupied 213 0 -1.455 3.801
WV4 Lets me meet interesting people 212 1 -1.464 4.014
WV5 Is a useful way for me to contribute to society 211 2 -.814 .742
WV6 Is interesting and satisfying to me 212 1 -1.061 1.921
WV7 Is one of the most important things in my life 212 1 -.854 .204
DSB1 My co-workers show they take guests' concerns very seriously 213 0 -.816 .217
DSB2 If one of my co-workers does not know the answer to a guest's
question, he or she makes an effort to find out
213 0 -1.017 .376
DSB3 My co-workers go out of their way to deliver a guest's special request 213 0 -1.027 .755
DSB4 If a guest approaches when one of my co-workers is busy, he or she
stops whatever they are doing and talks with the guest
212 1 -.951 .437
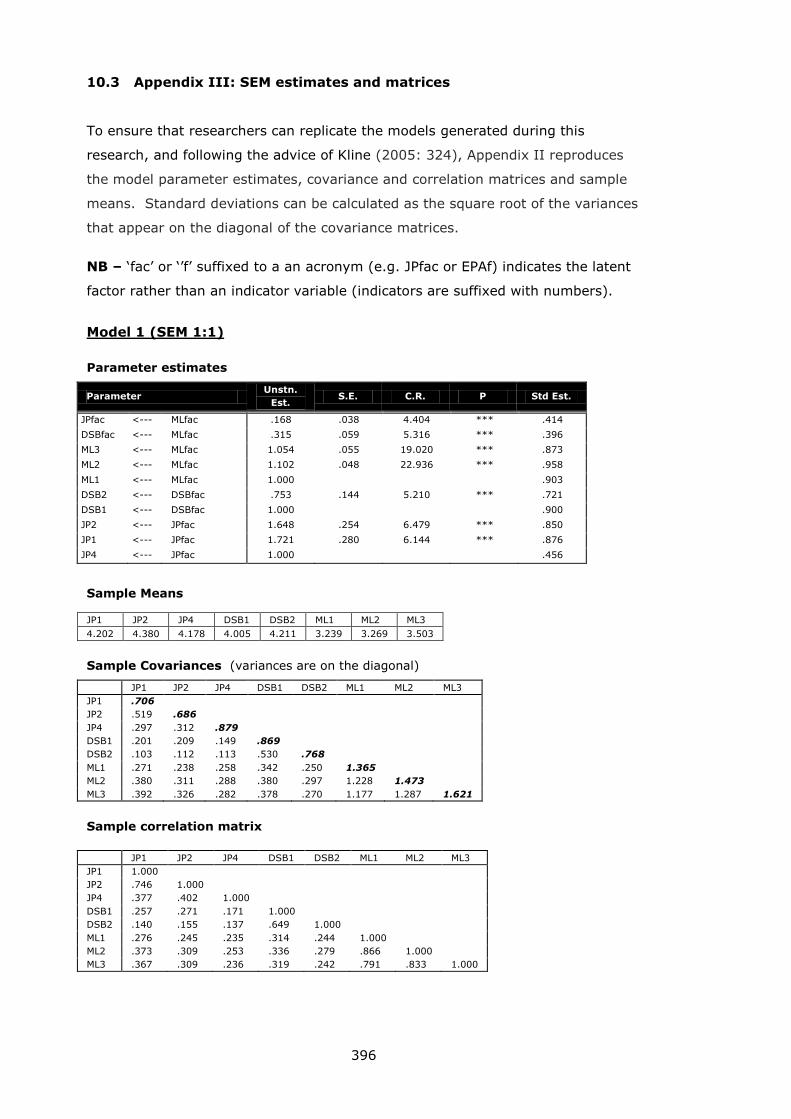
396
10.3 Appendix III: SEM estimates and matrices
To ensure that researchers can replicate the models generated during this
research, and following the advice of Kline (2005: 324), Appendix II reproduces
the model parameter estimates, covariance and correlation matrices and sample
means. Standard deviations can be calculated as the square root of the variances
that appear on the diagonal of the covariance matrices.
NB – ‘fac’ or ‘’f’ suffixed to a an acronym (e.g. JPfac or EPAf) indicates the latent
factor rather than an indicator variable (indicators are suffixed with numbers).
Model 1 (SEM 1:1)
Parameter estimates
Parameter Unstn.
Est. S.E. C.R. P Std Est.
JPfac <--- MLfac .168 .038 4.404 *** .414
DSBfac <--- MLfac .315 .059 5.316 *** .396
ML3 <--- MLfac 1.054 .055 19.020 *** .873
ML2 <--- MLfac 1.102 .048 22.936 *** .958
ML1 <--- MLfac 1.000
.903
DSB2 <--- DSBfac .753 .144 5.210 *** .721
DSB1 <--- DSBfac 1.000
.900
JP2 <--- JPfac 1.648 .254 6.479 *** .850
JP1 <--- JPfac 1.721 .280 6.144 *** .876
JP4 <--- JPfac 1.000
.456
Sample Means
JP1 JP2 JP4 DSB1 DSB2 ML1 ML2 ML3
4.202 4.380 4.178 4.005 4.211 3.239 3.269 3.503
Sample Covariances (variances are on the diagonal)
JP1 JP2 JP4 DSB1 DSB2 ML1 ML2 ML3
JP1 .706
JP2 .519 .686
JP4 .297 .312 .879
DSB1 .201 .209 .149 .869
DSB2 .103 .112 .113 .530 .768
ML1 .271 .238 .258 .342 .250 1.365
ML2 .380 .311 .288 .380 .297 1.228 1.473
ML3 .392 .326 .282 .378 .270 1.177 1.287 1.621
Sample correlation matrix
JP1 JP2 JP4 DSB1 DSB2 ML1 ML2 ML3
JP1 1.000
JP2 .746 1.000
JP4 .377 .402 1.000
DSB1 .257 .271 .171 1.000
DSB2 .140 .155 .137 .649 1.000
ML1 .276 .245 .235 .314 .244 1.000
ML2 .373 .309 .253 .336 .279 .866 1.000
ML3 .367 .309 .236 .319 .242 .791 .833 1.000
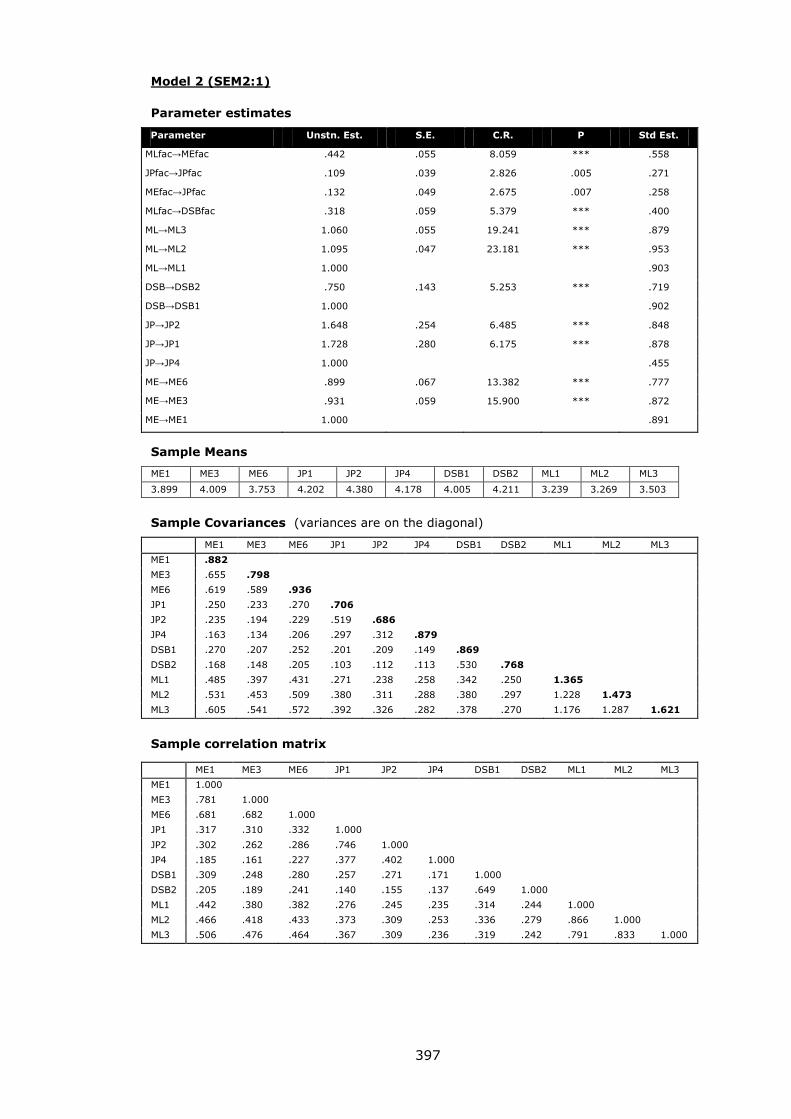
397
Model 2 (SEM2:1)
Parameter estimates
Parameter Unstn. Est. S.E. C.R. P Std Est.
MLfac→MEfac .442 .055 8.059 *** .558
JPfac→JPfac .109 .039 2.826 .005 .271
MEfac→JPfac .132 .049 2.675 .007 .258
MLfac→DSBfac .318 .059 5.379 *** .400
ML→ML3 1.060 .055 19.241 *** .879
ML→ML2 1.095 .047 23.181 *** .953
ML→ML1 1.000
.903
DSB→DSB2 .750 .143 5.253 *** .719
DSB→DSB1 1.000
.902
JP→JP2 1.648 .254 6.485 *** .848
JP→JP1 1.728 .280 6.175 *** .878
JP→JP4 1.000
.455
ME→ME6 .899 .067 13.382 *** .777
ME→ME3 .931 .059 15.900 *** .872
ME→ME1 1.000
.891
Sample Means
ME1 ME3 ME6 JP1 JP2 JP4 DSB1 DSB2 ML1 ML2 ML3
3.899 4.009 3.753 4.202 4.380 4.178 4.005 4.211 3.239 3.269 3.503
Sample Covariances (variances are on the diagonal)
ME1 ME3 ME6 JP1 JP2 JP4 DSB1 DSB2 ML1 ML2 ML3
ME1 .882
ME3 .655 .798
ME6 .619 .589 .936
JP1 .250 .233 .270 .706
JP2 .235 .194 .229 .519 .686
JP4 .163 .134 .206 .297 .312 .879
DSB1 .270 .207 .252 .201 .209 .149 .869
DSB2 .168 .148 .205 .103 .112 .113 .530 .768
ML1 .485 .397 .431 .271 .238 .258 .342 .250 1.365
ML2 .531 .453 .509 .380 .311 .288 .380 .297 1.228 1.473
ML3 .605 .541 .572 .392 .326 .282 .378 .270 1.176 1.287 1.621
Sample correlation matrix
ME1 ME3 ME6 JP1 JP2 JP4 DSB1 DSB2 ML1 ML2 ML3
ME1 1.000
ME3 .781 1.000
ME6 .681 .682 1.000
JP1 .317 .310 .332 1.000
JP2 .302 .262 .286 .746 1.000
JP4 .185 .161 .227 .377 .402 1.000
DSB1 .309 .248 .280 .257 .271 .171 1.000
DSB2 .205 .189 .241 .140 .155 .137 .649 1.000
ML1 .442 .380 .382 .276 .245 .235 .314 .244 1.000
ML2 .466 .418 .433 .373 .309 .253 .336 .279 .866 1.000
ML3 .506 .476 .464 .367 .309 .236 .319 .242 .791 .833 1.000
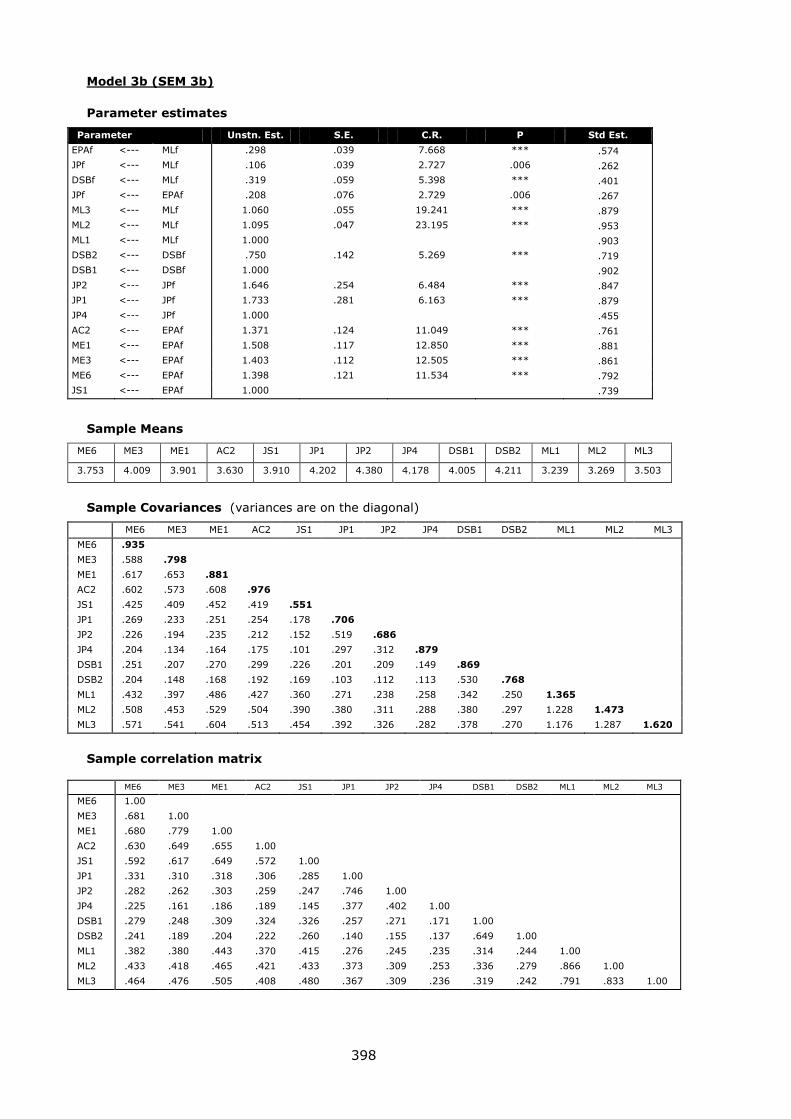
398
Model 3b (SEM 3b)
Parameter estimates
Parameter Unstn. Est. S.E. C.R. P Std Est.
EPAf <--- MLf .298 .039 7.668 *** .574
JPf <--- MLf .106 .039 2.727 .006 .262
DSBf <--- MLf .319 .059 5.398 *** .401
JPf <--- EPAf .208 .076 2.729 .006 .267
ML3 <--- MLf 1.060 .055 19.241 *** .879
ML2 <--- MLf 1.095 .047 23.195 *** .953
ML1 <--- MLf 1.000
.903
DSB2 <--- DSBf .750 .142 5.269 *** .719
DSB1 <--- DSBf 1.000
.902
JP2 <--- JPf 1.646 .254 6.484 *** .847
JP1 <--- JPf 1.733 .281 6.163 *** .879
JP4 <--- JPf 1.000
.455
AC2 <--- EPAf 1.371 .124 11.049 *** .761
ME1 <--- EPAf 1.508 .117 12.850 *** .881
ME3 <--- EPAf 1.403 .112 12.505 *** .861
ME6 <--- EPAf 1.398 .121 11.534 *** .792
JS1 <--- EPAf 1.000
.739
Sample Means
ME6 ME3 ME1 AC2 JS1 JP1 JP2 JP4 DSB1 DSB2 ML1 ML2 ML3
3.753 4.009 3.901 3.630 3.910 4.202 4.380 4.178 4.005 4.211 3.239 3.269 3.503
Sample Covariances (variances are on the diagonal)
ME6 ME3 ME1 AC2 JS1 JP1 JP2 JP4 DSB1 DSB2 ML1 ML2 ML3
ME6 .935
ME3 .588 .798
ME1 .617 .653 .881
AC2 .602 .573 .608 .976
JS1 .425 .409 .452 .419 .551
JP1 .269 .233 .251 .254 .178 .706
JP2 .226 .194 .235 .212 .152 .519 .686
JP4 .204 .134 .164 .175 .101 .297 .312 .879
DSB1 .251 .207 .270 .299 .226 .201 .209 .149 .869
DSB2 .204 .148 .168 .192 .169 .103 .112 .113 .530 .768
ML1 .432 .397 .486 .427 .360 .271 .238 .258 .342 .250 1.365
ML2 .508 .453 .529 .504 .390 .380 .311 .288 .380 .297 1.228 1.473
ML3 .571 .541 .604 .513 .454 .392 .326 .282 .378 .270 1.176 1.287 1.620
Sample correlation matrix
ME6 ME3 ME1 AC2 JS1 JP1 JP2 JP4 DSB1 DSB2 ML1 ML2 ML3
ME6 1.00
ME3 .681 1.00
ME1 .680 .779 1.00
AC2 .630 .649 .655 1.00
JS1 .592 .617 .649 .572 1.00
JP1 .331 .310 .318 .306 .285 1.00
JP2 .282 .262 .303 .259 .247 .746 1.00
JP4 .225 .161 .186 .189 .145 .377 .402 1.00
DSB1 .279 .248 .309 .324 .326 .257 .271 .171 1.00
DSB2 .241 .189 .204 .222 .260 .140 .155 .137 .649 1.00
ML1 .382 .380 .443 .370 .415 .276 .245 .235 .314 .244 1.00
ML2 .433 .418 .465 .421 .433 .373 .309 .253 .336 .279 .866 1.00
ML3 .464 .476 .505 .408 .480 .367 .309 .236 .319 .242 .791 .833 1.00
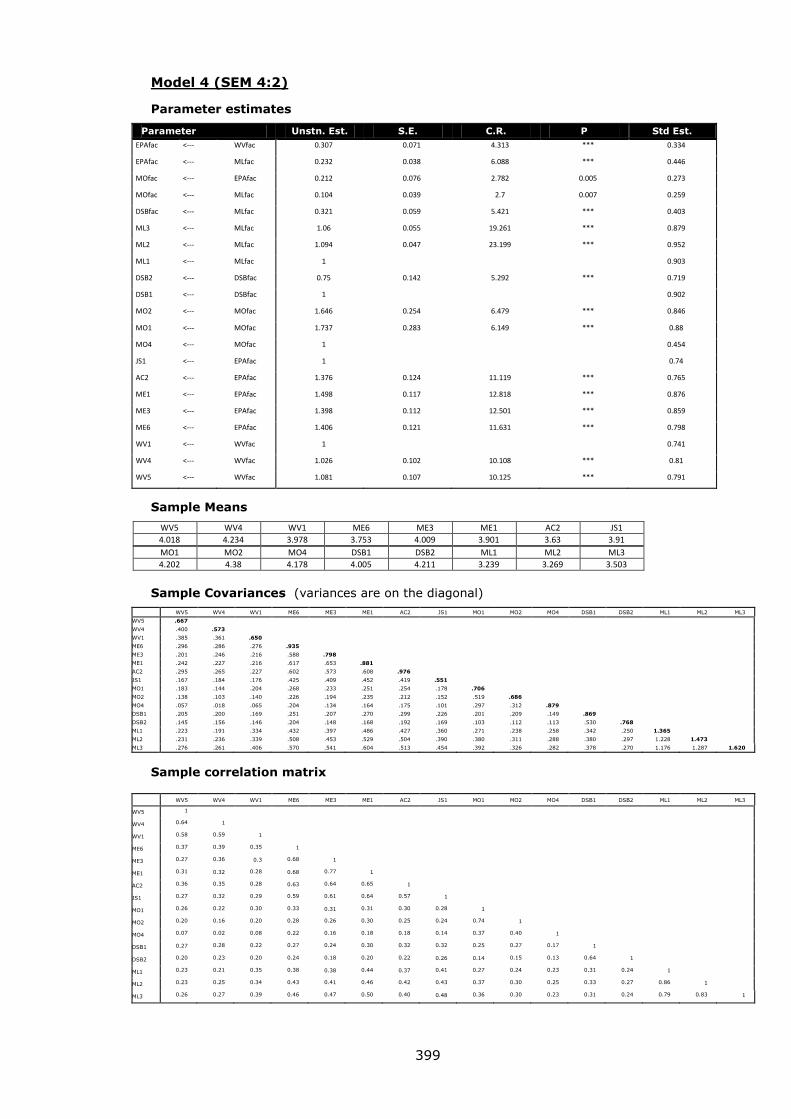
399
Model 4 (SEM 4:2)
Parameter estimates
Parameter Unstn. Est. S.E. C.R. P Std Est.
EPAfac <--- WVfac 0.307 0.071 4.313 *** 0.334
EPAfac <--- MLfac 0.232 0.038 6.088 *** 0.446
MOfac <--- EPAfac 0.212 0.076 2.782 0.005 0.273
MOfac <--- MLfac 0.104 0.039 2.7 0.007 0.259
DSBfac <--- MLfac 0.321 0.059 5.421 *** 0.403
ML3 <--- MLfac 1.06 0.055 19.261 *** 0.879
ML2 <--- MLfac 1.094 0.047 23.199 *** 0.952
ML1 <--- MLfac 1
0.903
DSB2 <--- DSBfac 0.75 0.142 5.292 *** 0.719
DSB1 <--- DSBfac 1
0.902
MO2 <--- MOfac 1.646 0.254 6.479 *** 0.846
MO1 <--- MOfac 1.737 0.283 6.149 *** 0.88
MO4 <--- MOfac 1
0.454
JS1 <--- EPAfac 1
0.74
AC2 <--- EPAfac 1.376 0.124 11.119 *** 0.765
ME1 <--- EPAfac 1.498 0.117 12.818 *** 0.876
ME3 <--- EPAfac 1.398 0.112 12.501 *** 0.859
ME6 <--- EPAfac 1.406 0.121 11.631 *** 0.798
WV1 <--- WVfac 1
0.741
WV4 <--- WVfac 1.026 0.102 10.108 *** 0.81
WV5 <--- WVfac 1.081 0.107 10.125 *** 0.791
Sample Means
WV5 WV4 WV1 ME6 ME3 ME1 AC2 JS1
4.018 4.234 3.978 3.753 4.009 3.901 3.63 3.91
MO1 MO2 MO4 DSB1 DSB2 ML1 ML2 ML3
4.202 4.38 4.178 4.005 4.211 3.239 3.269 3.503
Sample Covariances (variances are on the diagonal)
WV5 WV4 WV1 ME6 ME3 ME1 AC2 JS1 MO1 MO2 MO4 DSB1 DSB2 ML1 ML2 ML3
WV5 .667
WV4 .400 .573
WV1 .385 .361 .650
ME6 .296 .286 .276 .935
ME3 .201 .246 .216 .588 .798
ME1 .242 .227 .216 .617 .653 .881
AC2 .295 .265 .227 .602 .573 .608 .976
JS1 .167 .184 .176 .425 .409 .452 .419 .551
MO1 .183 .144 .204 .268 .233 .251 .254 .178 .706
MO2 .138 .103 .140 .226 .194 .235 .212 .152 .519 .686
MO4 .057 .018 .065 .204 .134 .164 .175 .101 .297 .312 .879
DSB1 .205 .200 .169 .251 .207 .270 .299 .226 .201 .209 .149 .869
DSB2 .145 .156 .146 .204 .148 .168 .192 .169 .103 .112 .113 .530 .768
ML1 .223 .191 .334 .432 .397 .486 .427 .360 .271 .238 .258 .342 .250 1.365
ML2 .231 .236 .339 .508 .453 .529 .504 .390 .380 .311 .288 .380 .297 1.228 1.473
ML3 .276 .261 .406 .570 .541 .604 .513 .454 .392 .326 .282 .378 .270 1.176 1.287 1.620
Sample correlation matrix
WV5 WV4 WV1 ME6 ME3 ME1 AC2 JS1 MO1 MO2 MO4 DSB1 DSB2 ML1 ML2 ML3
WV5 1
WV4 0.64
7
1
WV1 0.58
5
0.59
2
1
ME6 0.37
4
0.39
1
0.35
4
1
ME3 0.27
5
0.36
3
0.3 0.68
1
1
ME1 0.31
6
0.32 0.28
5
0.68 0.77
9
1
AC2 0.36
6
0.35
4
0.28
4
0.63 0.64
9
0.65
5
1
JS1 0.27
6
0.32
8
0.29
4
0.59
2
0.61
7
0.64
9
0.57
2
1
MO1 0.26
7
0.22
7
0.30
1
0.33
1
0.31 0.31
8
0.30
6
0.28
5
1
MO2 0.20
3
0.16
4
0.20
9
0.28
2
0.26
2
0.30
3
0.25
9
0.24
7
0.74
6
1
MO4 0.07
4
0.02
6
0.08
6
0.22
5
0.16
1
0.18
6
0.18
9
0.14
5
0.37
7
0.40
2
1
DSB1 0.27 0.28
3
0.22
5
0.27
9
0.24
8
0.30
9
0.32
4
0.32
6
0.25
7
0.27
1
0.17
1
1
DSB2 0.20
3
0.23
6
0.20
6
0.24
1
0.18
9
0.20
4
0.22
2
0.26 0.14 0.15
5
0.13
7
0.64
9
1
ML1 0.23
4
0.21
6
0.35
5
0.38
3
0.38 0.44
4
0.37 0.41
5
0.27
6
0.24
5
0.23
5
0.31
4
0.24
4
1
ML2 0.23
3
0.25
7
0.34
7
0.43
3
0.41
8
0.46
5
0.42
1
0.43
4
0.37
3
0.30
9
0.25
3
0.33
6
0.27
9
0.86
6
1
ML3 0.26
6
0.27
1
0.39
5
0.46
4
0.47
6
0.50
6
0.40
8
0.48 0.36
7
0.30
9
0.23
6
0.31
9
0.24
2
0.79
1
0.83
3
1
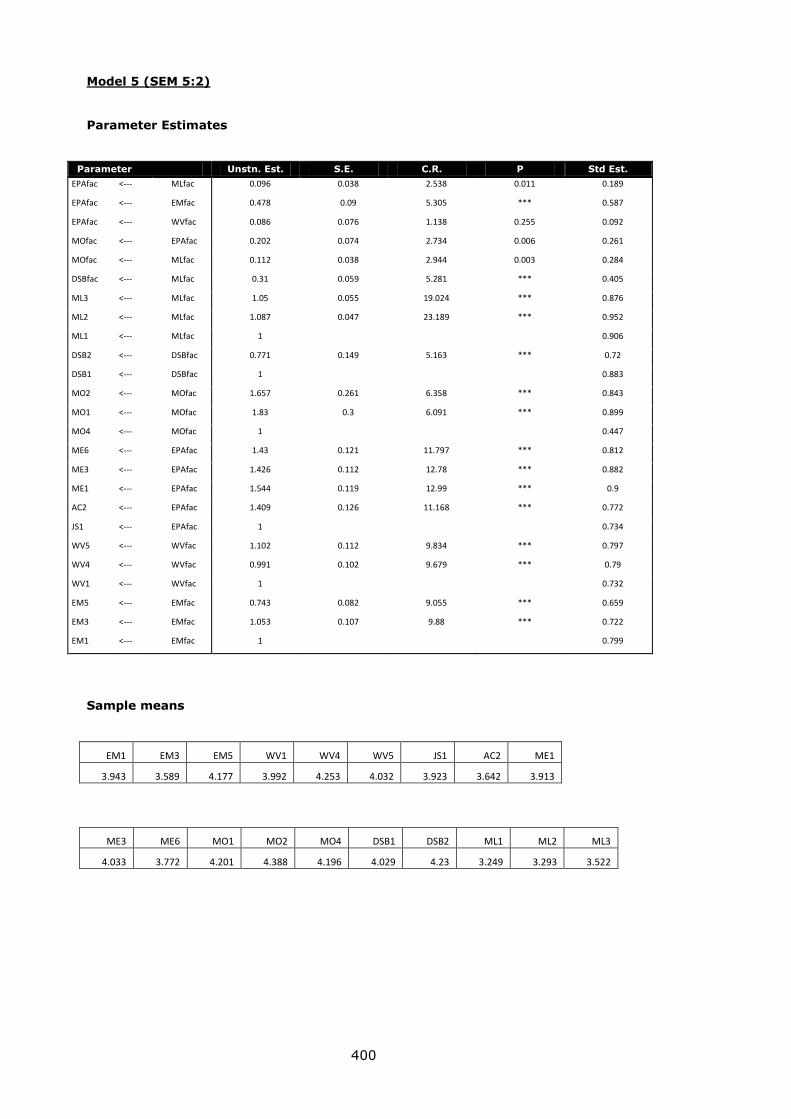
400
Model 5 (SEM 5:2)
Parameter Estimates
Parameter Unstn. Est. S.E. C.R. P Std Est.
EPAfac <--- MLfac 0.096 0.038 2.538 0.011 0.189
EPAfac <--- EMfac 0.478 0.09 5.305 *** 0.587
EPAfac <--- WVfac 0.086 0.076 1.138 0.255 0.092
MOfac <--- EPAfac 0.202 0.074 2.734 0.006 0.261
MOfac <--- MLfac 0.112 0.038 2.944 0.003 0.284
DSBfac <--- MLfac 0.31 0.059 5.281 *** 0.405
ML3 <--- MLfac 1.05 0.055 19.024 *** 0.876
ML2 <--- MLfac 1.087 0.047 23.189 *** 0.952
ML1 <--- MLfac 1
0.906
DSB2 <--- DSBfac 0.771 0.149 5.163 *** 0.72
DSB1 <--- DSBfac 1
0.883
MO2 <--- MOfac 1.657 0.261 6.358 *** 0.843
MO1 <--- MOfac 1.83 0.3 6.091 *** 0.899
MO4 <--- MOfac 1
0.447
ME6 <--- EPAfac 1.43 0.121 11.797 *** 0.812
ME3 <--- EPAfac 1.426 0.112 12.78 *** 0.882
ME1 <--- EPAfac 1.544 0.119 12.99 *** 0.9
AC2 <--- EPAfac 1.409 0.126 11.168 *** 0.772
JS1 <--- EPAfac 1
0.734
WV5 <--- WVfac 1.102 0.112 9.834 *** 0.797
WV4 <--- WVfac 0.991 0.102 9.679 *** 0.79
WV1 <--- WVfac 1
0.732
EM5 <--- EMfac 0.743 0.082 9.055 *** 0.659
EM3 <--- EMfac 1.053 0.107 9.88 *** 0.722
EM1 <--- EMfac 1
0.799
Sample means
EM1 EM3 EM5 WV1 WV4 WV5 JS1 AC2 ME1
3.943 3.589 4.177 3.992 4.253 4.032 3.923 3.642 3.913
ME3 ME6 MO1 MO2 MO4 DSB1 DSB2 ML1 ML2 ML3
4.033 3.772 4.201 4.388 4.196 4.029 4.23 3.249 3.293 3.522
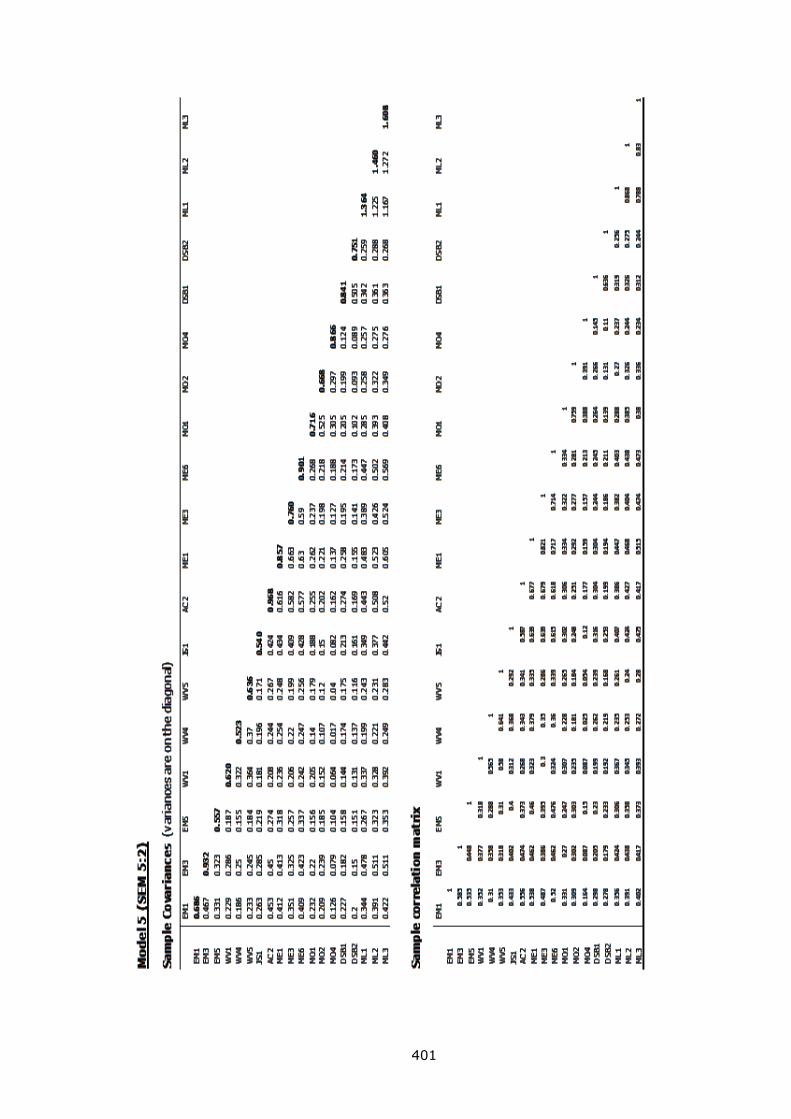
401
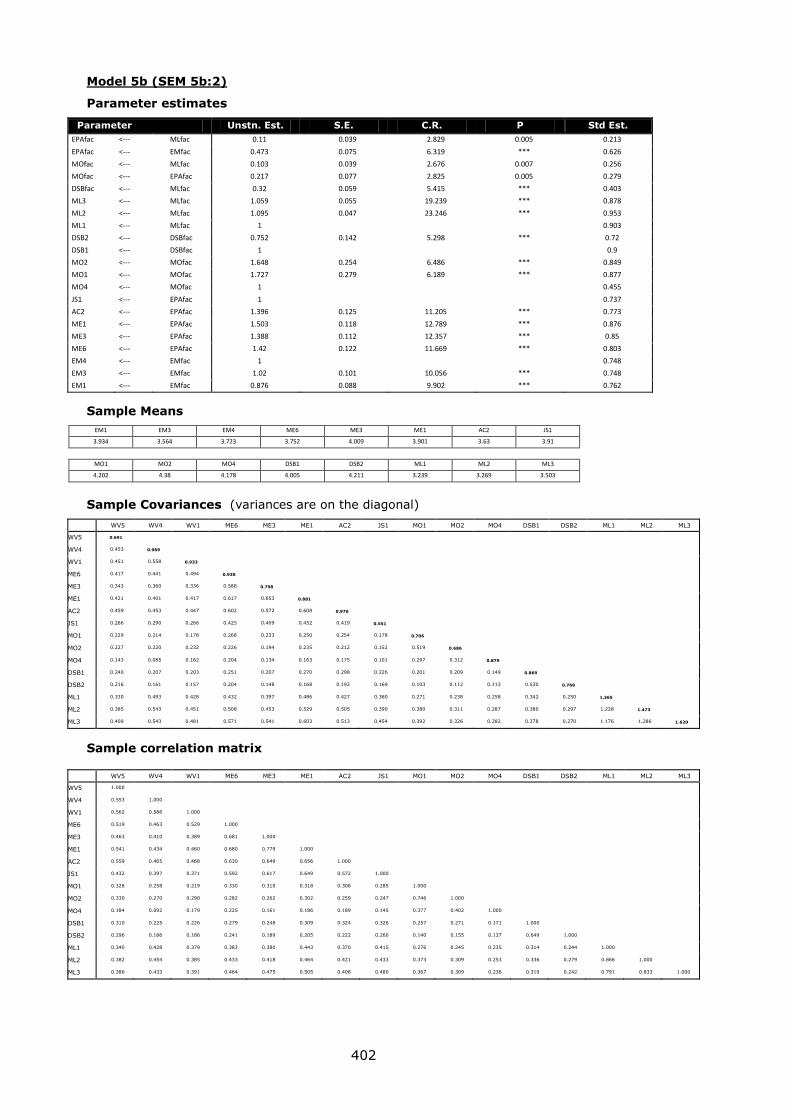
402
Model 5b (SEM 5b:2)
Parameter estimates
Parameter Unstn. Est. S.E. C.R. P Std Est.
EPAfac <--- MLfac 0.11 0.039 2.829 0.005 0.213
EPAfac <--- EMfac 0.473 0.075 6.319 *** 0.626
MOfac <--- MLfac 0.103 0.039 2.676 0.007 0.256
MOfac <--- EPAfac 0.217 0.077 2.825 0.005 0.279
DSBfac <--- MLfac 0.32 0.059 5.415 *** 0.403
ML3 <--- MLfac 1.059 0.055 19.239 *** 0.878
ML2 <--- MLfac 1.095 0.047 23.246 *** 0.953
ML1 <--- MLfac 1
0.903
DSB2 <--- DSBfac 0.752 0.142 5.298 *** 0.72
DSB1 <--- DSBfac 1
0.9
MO2 <--- MOfac 1.648 0.254 6.486 *** 0.849
MO1 <--- MOfac 1.727 0.279 6.189 *** 0.877
MO4 <--- MOfac 1
0.455
JS1 <--- EPAfac 1
0.737
AC2 <--- EPAfac 1.396 0.125 11.205 *** 0.773
ME1 <--- EPAfac 1.503 0.118 12.789 *** 0.876
ME3 <--- EPAfac 1.388 0.112 12.357 *** 0.85
ME6 <--- EPAfac 1.42 0.122 11.669 *** 0.803
EM4 <--- EMfac 1
0.748
EM3 <--- EMfac 1.02 0.101 10.056 *** 0.748
EM1 <--- EMfac 0.876 0.088 9.902 *** 0.762
Sample Means
EM1 EM3 EM4 ME6 ME3 ME1 AC2 JS1
3.934 3.564 3.723 3.752 4.009 3.901 3.63 3.91
MO1 MO2 MO4 DSB1 DSB2 ML1 ML2 ML3
4.202 4.38 4.178 4.005 4.211 3.239 3.269 3.503
Sample Covariances (variances are on the diagonal)
WV5 WV4 WV1 ME6 ME3 ME1 AC2 JS1 MO1 MO2 MO4 DSB1 DSB2 ML1 ML2 ML3
WV5 0.691
WV4 0.453 0.969
WV1 0.451 0.558 0.933
ME6 0.417 0.441 0.494 0.935
ME3 0.343 0.360 0.336 0.588 0.798
ME1 0.421 0.401 0.417 0.617 0.653 0.881
AC2 0.459 0.453 0.447 0.602 0.572 0.608 0.976
JS1 0.266 0.290 0.266 0.425 0.409 0.452 0.419 0.551
MO1 0.229 0.214 0.178 0.268 0.233 0.250 0.254 0.178 0.706
MO2 0.227 0.220 0.232 0.226 0.194 0.235 0.212 0.152 0.519 0.686
MO4 0.143 0.085 0.162 0.204 0.134 0.163 0.175 0.101 0.297 0.312 0.879
DSB1 0.240 0.207 0.203 0.251 0.207 0.270 0.298 0.226 0.201 0.209 0.149 0.869
DSB2 0.216 0.161 0.157 0.204 0.148 0.168 0.192 0.169 0.103 0.112 0.113 0.530 0.768
ML1 0.330 0.493 0.428 0.432 0.397 0.486 0.427 0.360 0.271 0.238 0.258 0.342 0.250 1.365
ML2 0.385 0.543 0.451 0.508 0.453 0.529 0.505 0.390 0.380 0.311 0.287 0.380 0.297 1.228 1.473
ML3 0.409 0.543 0.481 0.571 0.541 0.603 0.513 0.454 0.392 0.326 0.282 0.378 0.270 1.176 1.286 1.620
Sample correlation matrix
WV5 WV4 WV1 ME6 ME3 ME1 AC2 JS1 MO1 MO2 MO4 DSB1 DSB2 ML1 ML2 ML3
WV5 1.000
WV4 0.553 1.000
WV1 0.562 0.586 1.000
ME6 0.519 0.463 0.529 1.000
ME3 0.463 0.410 0.389 0.681 1.000
ME1 0.541 0.434 0.460 0.680 0.779 1.000
AC2 0.559 0.465 0.468 0.630 0.649 0.656 1.000
JS1 0.432 0.397 0.371 0.592 0.617 0.649 0.572 1.000
MO1 0.328 0.258 0.219 0.330 0.310 0.318 0.306 0.285 1.000
MO2 0.330 0.270 0.290 0.282 0.262 0.302 0.259 0.247 0.746 1.000
MO4 0.184 0.092 0.179 0.225 0.161 0.186 0.189 0.145 0.377 0.402 1.000
DSB1 0.310 0.225 0.226 0.279 0.248 0.309 0.324 0.326 0.257 0.271 0.171 1.000
DSB2 0.296 0.186 0.186 0.241 0.189 0.205 0.222 0.260 0.140 0.155 0.137 0.649 1.000
ML1 0.340 0.428 0.379 0.383 0.380 0.443 0.370 0.415 0.276 0.245 0.235 0.314 0.244 1.000
ML2 0.382 0.454 0.385 0.433 0.418 0.464 0.421 0.433 0.373 0.309 0.253 0.336 0.279 0.866 1.000
ML3 0.386 0.433 0.391 0.464 0.475 0.505 0.408 0.480 0.367 0.309 0.236 0.319 0.242 0.791 0.833 1.000
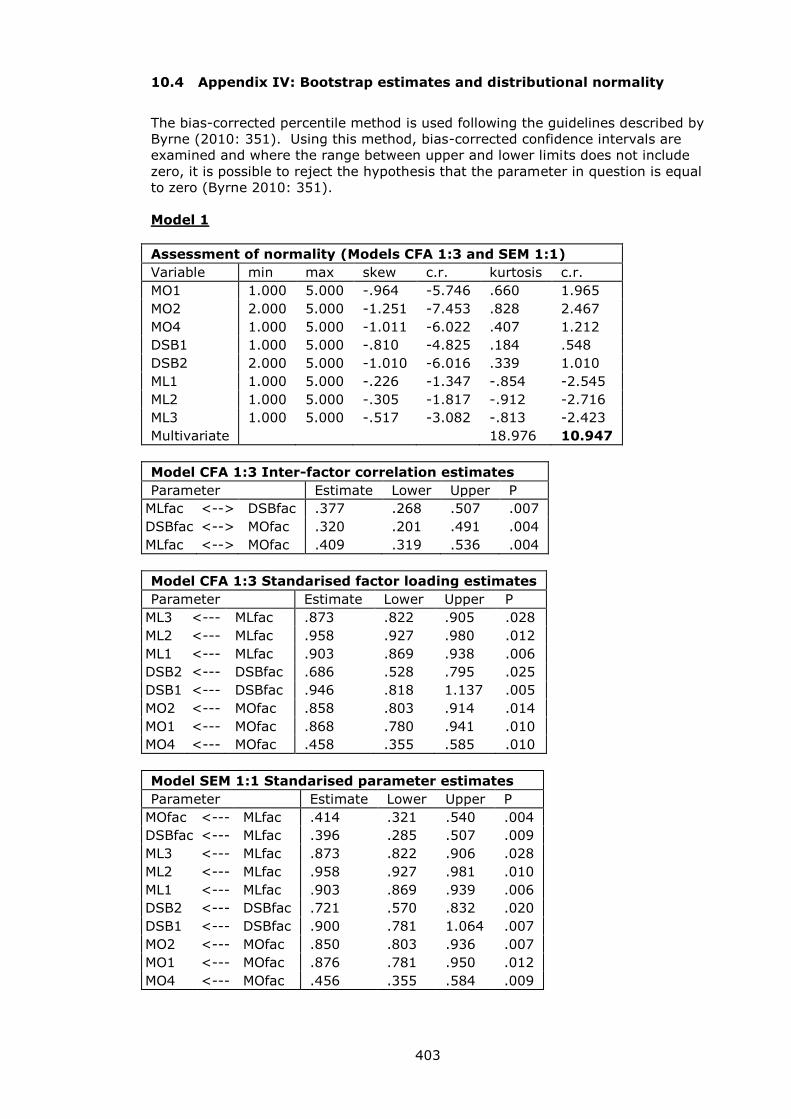
403
10.4 Appendix IV: Bootstrap estimates and distributional normality
The bias-corrected percentile method is used following the guidelines described by
Byrne (2010: 351). Using this method, bias-corrected confidence intervals are
examined and where the range between upper and lower limits does not include
zero, it is possible to reject the hypothesis that the parameter in question is equal
to zero (Byrne 2010: 351).
Model 1
Assessment of normality (Models CFA 1:3 and SEM 1:1)
Variable min max skew c.r. kurtosis c.r.
MO1 1.000 5.000 -.964 -5.746 .660 1.965
MO2 2.000 5.000 -1.251 -7.453 .828 2.467
MO4 1.000 5.000 -1.011 -6.022 .407 1.212
DSB1 1.000 5.000 -.810 -4.825 .184 .548
DSB2 2.000 5.000 -1.010 -6.016 .339 1.010
ML1 1.000 5.000 -.226 -1.347 -.854 -2.545
ML2 1.000 5.000 -.305 -1.817 -.912 -2.716
ML3 1.000 5.000 -.517 -3.082 -.813 -2.423
Multivariate
18.976 10.947
Model CFA 1:3 Inter-factor correlation estimates
Parameter Estimate Lower Upper P
MLfac <--> DSBfac .377 .268 .507 .007
DSBfac <--> MOfac .320 .201 .491 .004
MLfac <--> MOfac .409 .319 .536 .004
Model CFA 1:3 Standarised factor loading estimates
Parameter Estimate Lower Upper P
ML3 <--- MLfac .873 .822 .905 .028
ML2 <--- MLfac .958 .927 .980 .012
ML1 <--- MLfac .903 .869 .938 .006
DSB2 <--- DSBfac .686 .528 .795 .025
DSB1 <--- DSBfac .946 .818 1.137 .005
MO2 <--- MOfac .858 .803 .914 .014
MO1 <--- MOfac .868 .780 .941 .010
MO4 <--- MOfac .458 .355 .585 .010
Model SEM 1:1 Standarised parameter estimates
Parameter Estimate Lower Upper P
MOfac <--- MLfac .414 .321 .540 .004
DSBfac <--- MLfac .396 .285 .507 .009
ML3 <--- MLfac .873 .822 .906 .028
ML2 <--- MLfac .958 .927 .981 .010
ML1 <--- MLfac .903 .869 .939 .006
DSB2 <--- DSBfac .721 .570 .832 .020
DSB1 <--- DSBfac .900 .781 1.064 .007
MO2 <--- MOfac .850 .803 .936 .007
MO1 <--- MOfac .876 .781 .950 .012
MO4 <--- MOfac .456 .355 .584 .009
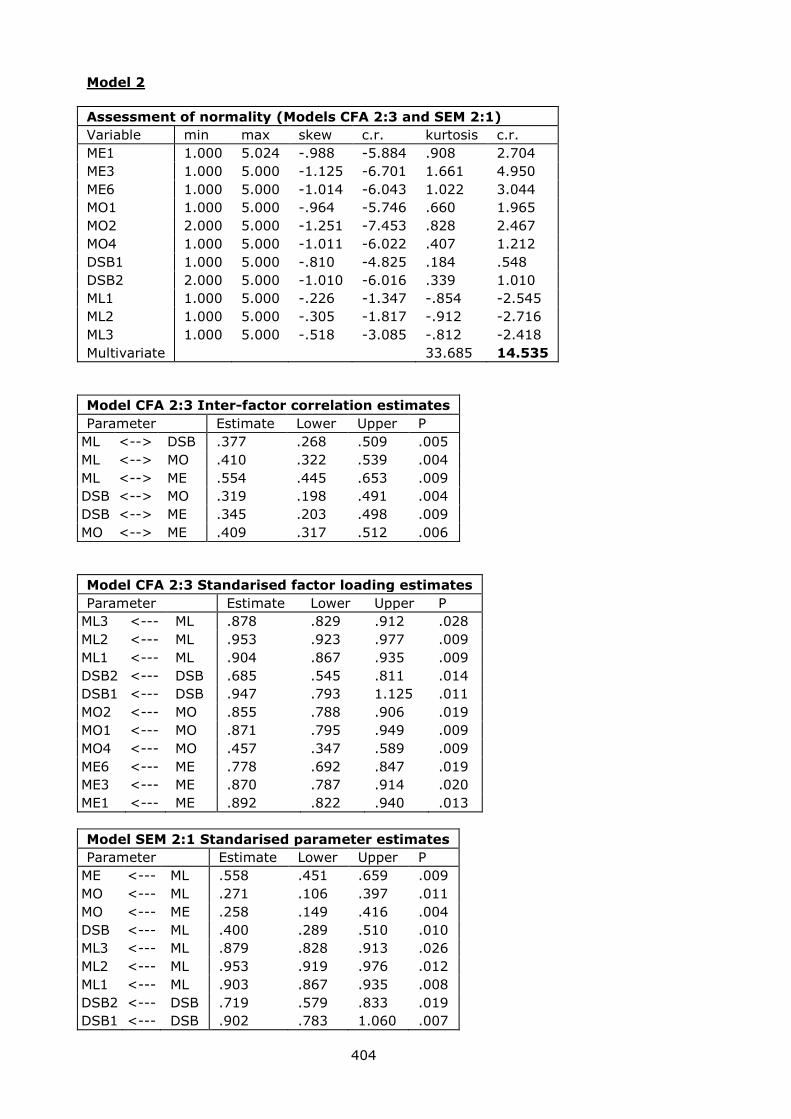
404
Model 2
Assessment of normality (Models CFA 2:3 and SEM 2:1)
Variable min max skew c.r. kurtosis c.r.
ME1 1.000 5.024 -.988 -5.884 .908 2.704
ME3 1.000 5.000 -1.125 -6.701 1.661 4.950
ME6 1.000 5.000 -1.014 -6.043 1.022 3.044
MO1 1.000 5.000 -.964 -5.746 .660 1.965
MO2 2.000 5.000 -1.251 -7.453 .828 2.467
MO4 1.000 5.000 -1.011 -6.022 .407 1.212
DSB1 1.000 5.000 -.810 -4.825 .184 .548
DSB2 2.000 5.000 -1.010 -6.016 .339 1.010
ML1 1.000 5.000 -.226 -1.347 -.854 -2.545
ML2 1.000 5.000 -.305 -1.817 -.912 -2.716
ML3 1.000 5.000 -.518 -3.085 -.812 -2.418
Multivariate
33.685 14.535
Model CFA 2:3 Inter-factor correlation estimates
Parameter Estimate Lower Upper P
ML <--> DSB .377 .268 .509 .005
ML <--> MO .410 .322 .539 .004
ML <--> ME .554 .445 .653 .009
DSB <--> MO .319 .198 .491 .004
DSB <--> ME .345 .203 .498 .009
MO <--> ME .409 .317 .512 .006
Model CFA 2:3 Standarised factor loading estimates
Parameter Estimate Lower Upper P
ML3 <--- ML .878 .829 .912 .028
ML2 <--- ML .953 .923 .977 .009
ML1 <--- ML .904 .867 .935 .009
DSB2 <--- DSB .685 .545 .811 .014
DSB1 <--- DSB .947 .793 1.125 .011
MO2 <--- MO .855 .788 .906 .019
MO1 <--- MO .871 .795 .949 .009
MO4 <--- MO .457 .347 .589 .009
ME6 <--- ME .778 .692 .847 .019
ME3 <--- ME .870 .787 .914 .020
ME1 <--- ME .892 .822 .940 .013
Model SEM 2:1 Standarised parameter estimates
Parameter Estimate Lower Upper P
ME <--- ML .558 .451 .659 .009
MO <--- ML .271 .106 .397 .011
MO <--- ME .258 .149 .416 .004
DSB <--- ML .400 .289 .510 .010
ML3 <--- ML .879 .828 .913 .026
ML2 <--- ML .953 .919 .976 .012
ML1 <--- ML .903 .867 .935 .008
DSB2 <--- DSB .719 .579 .833 .019
DSB1 <--- DSB .902 .783 1.060 .007
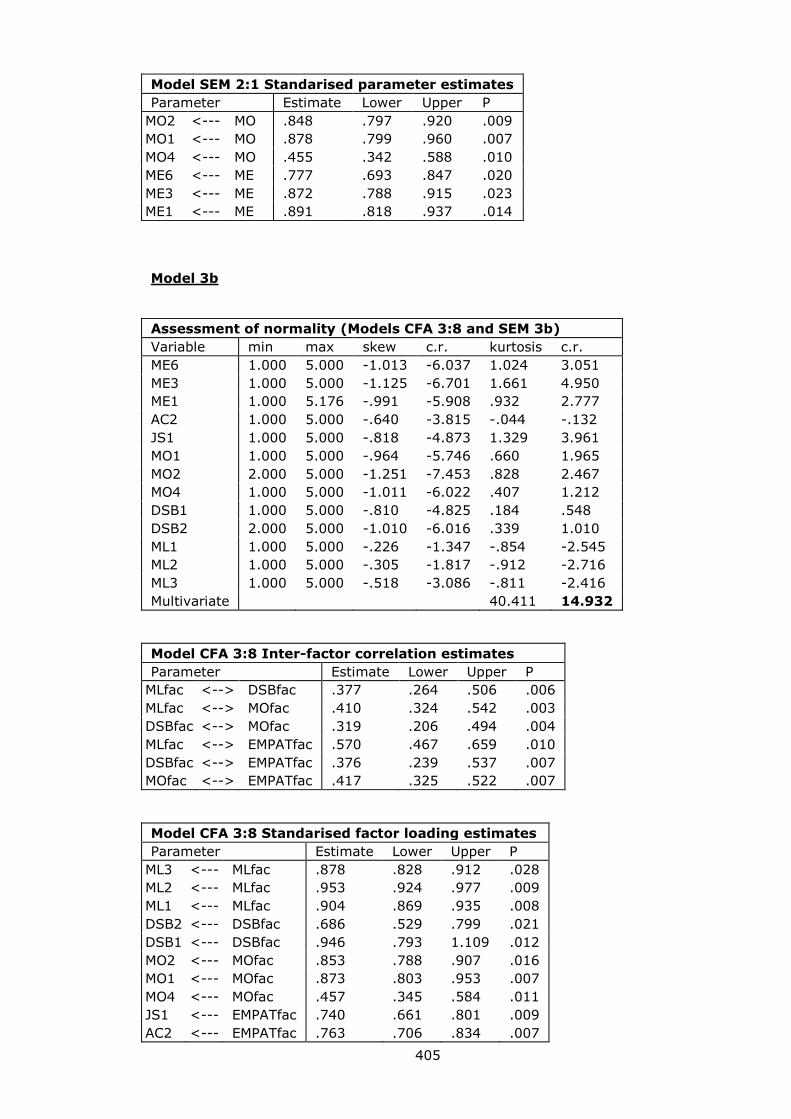
405
Model SEM 2:1 Standarised parameter estimates
Parameter Estimate Lower Upper P
MO2 <--- MO .848 .797 .920 .009
MO1 <--- MO .878 .799 .960 .007
MO4 <--- MO .455 .342 .588 .010
ME6 <--- ME .777 .693 .847 .020
ME3 <--- ME .872 .788 .915 .023
ME1 <--- ME .891 .818 .937 .014
Model 3b
Assessment of normality (Models CFA 3:8 and SEM 3b)
Variable min max skew c.r. kurtosis c.r.
ME6 1.000 5.000 -1.013 -6.037 1.024 3.051
ME3 1.000 5.000 -1.125 -6.701 1.661 4.950
ME1 1.000 5.176 -.991 -5.908 .932 2.777
AC2 1.000 5.000 -.640 -3.815 -.044 -.132
JS1 1.000 5.000 -.818 -4.873 1.329 3.961
MO1 1.000 5.000 -.964 -5.746 .660 1.965
MO2 2.000 5.000 -1.251 -7.453 .828 2.467
MO4 1.000 5.000 -1.011 -6.022 .407 1.212
DSB1 1.000 5.000 -.810 -4.825 .184 .548
DSB2 2.000 5.000 -1.010 -6.016 .339 1.010
ML1 1.000 5.000 -.226 -1.347 -.854 -2.545
ML2 1.000 5.000 -.305 -1.817 -.912 -2.716
ML3 1.000 5.000 -.518 -3.086 -.811 -2.416
Multivariate
40.411 14.932
Model CFA 3:8 Inter-factor correlation estimates
Parameter Estimate Lower Upper P
MLfac <--> DSBfac .377 .264 .506 .006
MLfac <--> MOfac .410 .324 .542 .003
DSBfac <--> MOfac .319 .206 .494 .004
MLfac <--> EMPATfac .570 .467 .659 .010
DSBfac <--> EMPATfac .376 .239 .537 .007
MOfac <--> EMPATfac .417 .325 .522 .007
Model CFA 3:8 Standarised factor loading estimates
Parameter Estimate Lower Upper P
ML3 <--- MLfac .878 .828 .912 .028
ML2 <--- MLfac .953 .924 .977 .009
ML1 <--- MLfac .904 .869 .935 .008
DSB2 <--- DSBfac .686 .529 .799 .021
DSB1 <--- DSBfac .946 .793 1.109 .012
MO2 <--- MOfac .853 .788 .907 .016
MO1 <--- MOfac .873 .803 .953 .007
MO4 <--- MOfac .457 .345 .584 .011
JS1 <--- EMPATfac .740 .661 .801 .009
AC2 <--- EMPATfac .763 .706 .834 .007
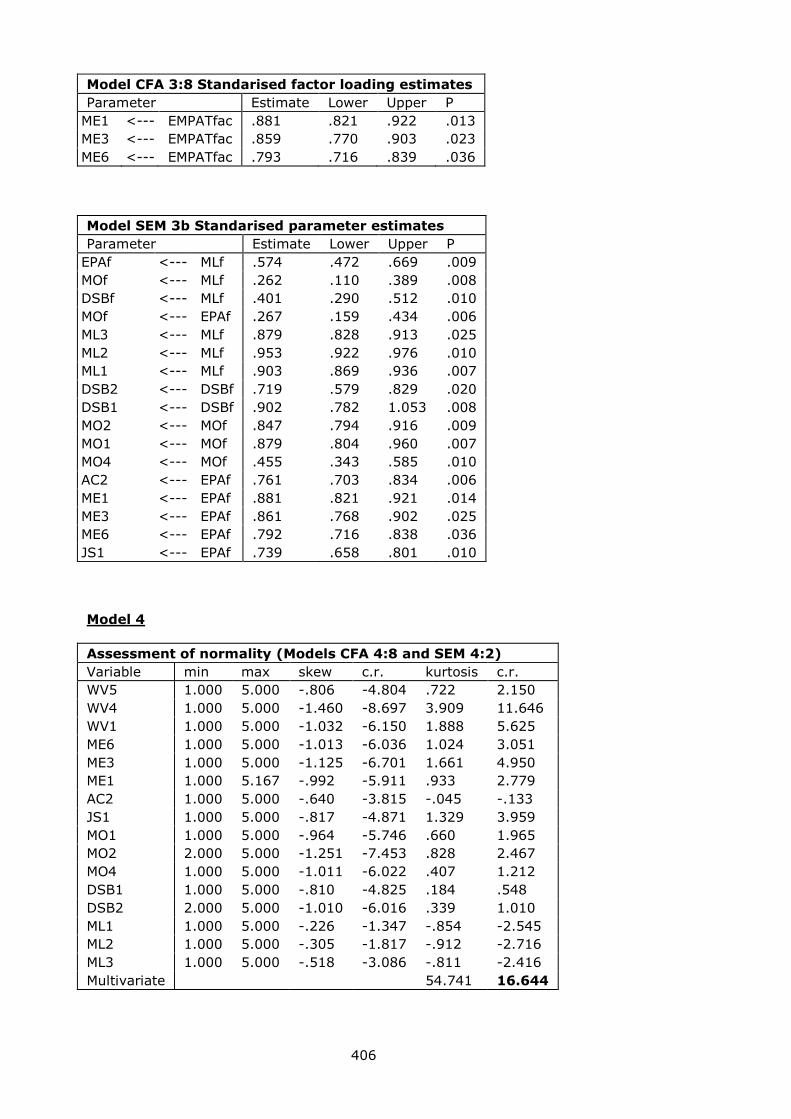
406
Model CFA 3:8 Standarised factor loading estimates
Parameter Estimate Lower Upper P
ME1 <--- EMPATfac .881 .821 .922 .013
ME3 <--- EMPATfac .859 .770 .903 .023
ME6 <--- EMPATfac .793 .716 .839 .036
Model SEM 3b Standarised parameter estimates
Parameter Estimate Lower Upper P
EPAf <--- MLf .574 .472 .669 .009
MOf <--- MLf .262 .110 .389 .008
DSBf <--- MLf .401 .290 .512 .010
MOf <--- EPAf .267 .159 .434 .006
ML3 <--- MLf .879 .828 .913 .025
ML2 <--- MLf .953 .922 .976 .010
ML1 <--- MLf .903 .869 .936 .007
DSB2 <--- DSBf .719 .579 .829 .020
DSB1 <--- DSBf .902 .782 1.053 .008
MO2 <--- MOf .847 .794 .916 .009
MO1 <--- MOf .879 .804 .960 .007
MO4 <--- MOf .455 .343 .585 .010
AC2 <--- EPAf .761 .703 .834 .006
ME1 <--- EPAf .881 .821 .921 .014
ME3 <--- EPAf .861 .768 .902 .025
ME6 <--- EPAf .792 .716 .838 .036
JS1 <--- EPAf .739 .658 .801 .010
Model 4
Assessment of normality (Models CFA 4:8 and SEM 4:2)
Variable min max skew c.r. kurtosis c.r.
WV5 1.000 5.000 -.806 -4.804 .722 2.150
WV4 1.000 5.000 -1.460 -8.697 3.909 11.646
WV1 1.000 5.000 -1.032 -6.150 1.888 5.625
ME6 1.000 5.000 -1.013 -6.036 1.024 3.051
ME3 1.000 5.000 -1.125 -6.701 1.661 4.950
ME1 1.000 5.167 -.992 -5.911 .933 2.779
AC2 1.000 5.000 -.640 -3.815 -.045 -.133
JS1 1.000 5.000 -.817 -4.871 1.329 3.959
MO1 1.000 5.000 -.964 -5.746 .660 1.965
MO2 2.000 5.000 -1.251 -7.453 .828 2.467
MO4 1.000 5.000 -1.011 -6.022 .407 1.212
DSB1 1.000 5.000 -.810 -4.825 .184 .548
DSB2 2.000 5.000 -1.010 -6.016 .339 1.010
ML1 1.000 5.000 -.226 -1.347 -.854 -2.545
ML2 1.000 5.000 -.305 -1.817 -.912 -2.716
ML3 1.000 5.000 -.518 -3.086 -.811 -2.416
Multivariate
54.741 16.644
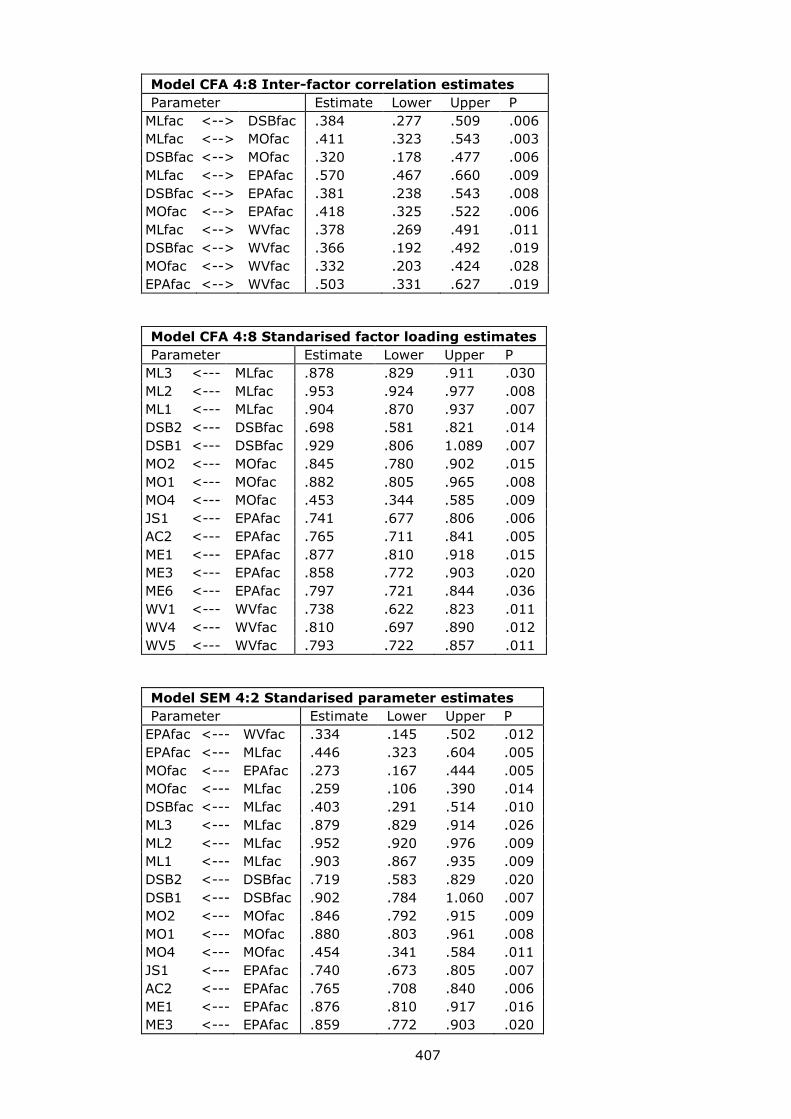
407
Model CFA 4:8 Inter-factor correlation estimates
Parameter Estimate Lower Upper P
MLfac <--> DSBfac .384 .277 .509 .006
MLfac <--> MOfac .411 .323 .543 .003
DSBfac <--> MOfac .320 .178 .477 .006
MLfac <--> EPAfac .570 .467 .660 .009
DSBfac <--> EPAfac .381 .238 .543 .008
MOfac <--> EPAfac .418 .325 .522 .006
MLfac <--> WVfac .378 .269 .491 .011
DSBfac <--> WVfac .366 .192 .492 .019
MOfac <--> WVfac .332 .203 .424 .028
EPAfac <--> WVfac .503 .331 .627 .019
Model CFA 4:8 Standarised factor loading estimates
Parameter Estimate Lower Upper P
ML3 <--- MLfac .878 .829 .911 .030
ML2 <--- MLfac .953 .924 .977 .008
ML1 <--- MLfac .904 .870 .937 .007
DSB2 <--- DSBfac .698 .581 .821 .014
DSB1 <--- DSBfac .929 .806 1.089 .007
MO2 <--- MOfac .845 .780 .902 .015
MO1 <--- MOfac .882 .805 .965 .008
MO4 <--- MOfac .453 .344 .585 .009
JS1 <--- EPAfac .741 .677 .806 .006
AC2 <--- EPAfac .765 .711 .841 .005
ME1 <--- EPAfac .877 .810 .918 .015
ME3 <--- EPAfac .858 .772 .903 .020
ME6 <--- EPAfac .797 .721 .844 .036
WV1 <--- WVfac .738 .622 .823 .011
WV4 <--- WVfac .810 .697 .890 .012
WV5 <--- WVfac .793 .722 .857 .011
Model SEM 4:2 Standarised parameter estimates
Parameter Estimate Lower Upper P
EPAfac <--- WVfac .334 .145 .502 .012
EPAfac <--- MLfac .446 .323 .604 .005
MOfac <--- EPAfac .273 .167 .444 .005
MOfac <--- MLfac .259 .106 .390 .014
DSBfac <--- MLfac .403 .291 .514 .010
ML3 <--- MLfac .879 .829 .914 .026
ML2 <--- MLfac .952 .920 .976 .009
ML1 <--- MLfac .903 .867 .935 .009
DSB2 <--- DSBfac .719 .583 .829 .020
DSB1 <--- DSBfac .902 .784 1.060 .007
MO2 <--- MOfac .846 .792 .915 .009
MO1 <--- MOfac .880 .803 .961 .008
MO4 <--- MOfac .454 .341 .584 .011
JS1 <--- EPAfac .740 .673 .805 .007
AC2 <--- EPAfac .765 .708 .840 .006
ME1 <--- EPAfac .876 .810 .917 .016
ME3 <--- EPAfac .859 .772 .903 .020
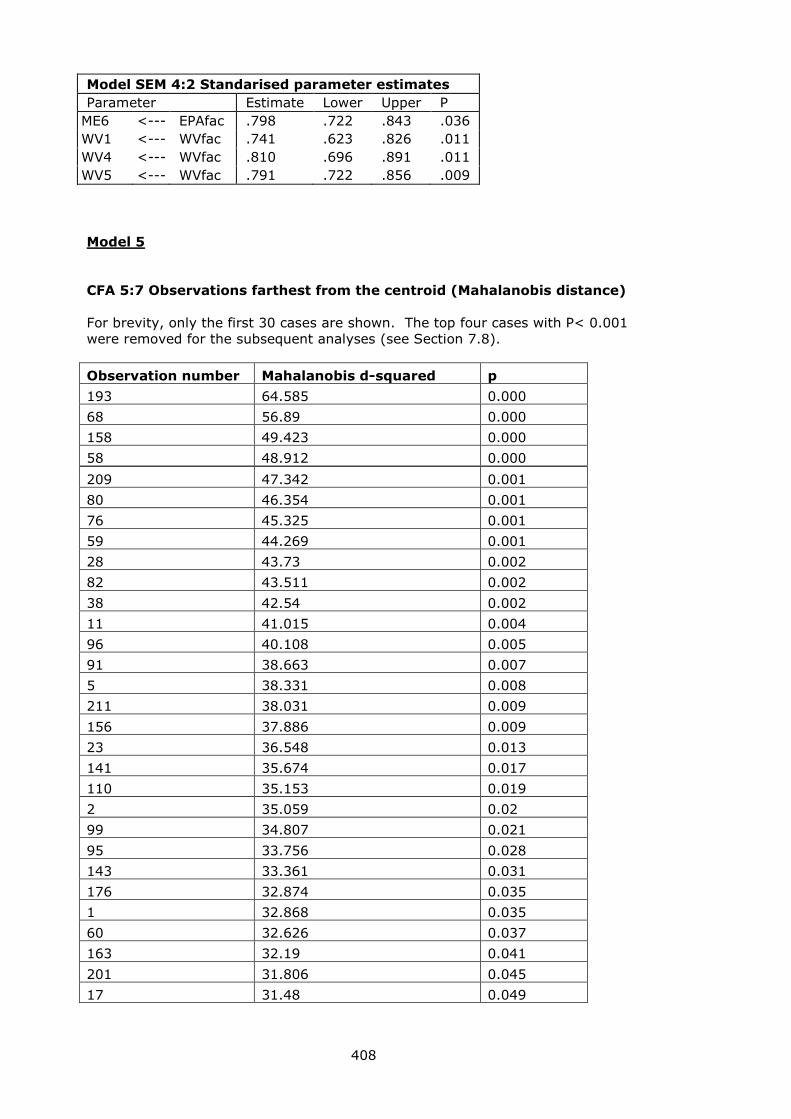
408
Model SEM 4:2 Standarised parameter estimates
Parameter Estimate Lower Upper P
ME6 <--- EPAfac .798 .722 .843 .036
WV1 <--- WVfac .741 .623 .826 .011
WV4 <--- WVfac .810 .696 .891 .011
WV5 <--- WVfac .791 .722 .856 .009
Model 5
CFA 5:7 Observations farthest from the centroid (Mahalanobis distance)
For brevity, only the first 30 cases are shown. The top four cases with P< 0.001
were removed for the subsequent analyses (see Section 7.8).
Observation number Mahalanobis d-squared p
193 64.585 0.000
68 56.89 0.000
158 49.423 0.000
58 48.912 0.000
209 47.342 0.001
80 46.354 0.001
76 45.325 0.001
59 44.269 0.001
28 43.73 0.002
82 43.511 0.002
38 42.54 0.002
11 41.015 0.004
96 40.108 0.005
91 38.663 0.007
5 38.331 0.008
211 38.031 0.009
156 37.886 0.009
23 36.548 0.013
141 35.674 0.017
110 35.153 0.019
2 35.059 0.02
99 34.807 0.021
95 33.756 0.028
143 33.361 0.031
176 32.874 0.035
1 32.868 0.035
60 32.626 0.037
163 32.19 0.041
201 31.806 0.045
17 31.48 0.049
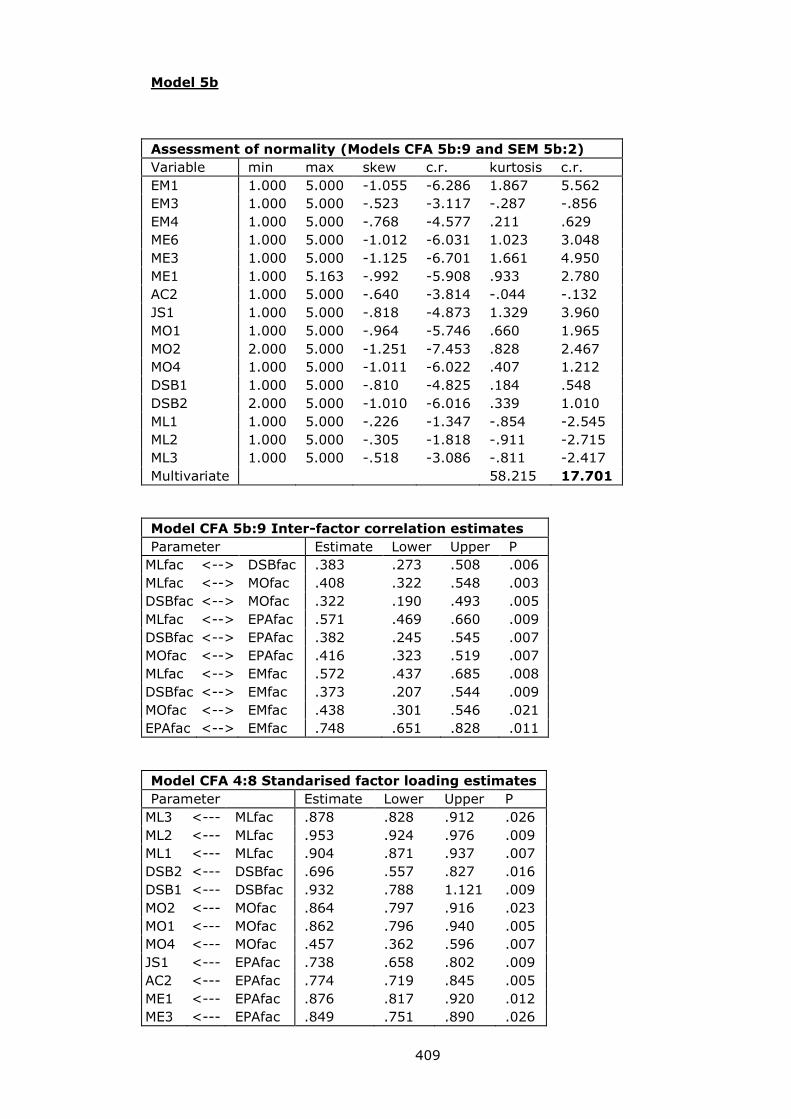
409
Model 5b
Assessment of normality (Models CFA 5b:9 and SEM 5b:2)
Variable min max skew c.r. kurtosis c.r.
EM1 1.000 5.000 -1.055 -6.286 1.867 5.562
EM3 1.000 5.000 -.523 -3.117 -.287 -.856
EM4 1.000 5.000 -.768 -4.577 .211 .629
ME6 1.000 5.000 -1.012 -6.031 1.023 3.048
ME3 1.000 5.000 -1.125 -6.701 1.661 4.950
ME1 1.000 5.163 -.992 -5.908 .933 2.780
AC2 1.000 5.000 -.640 -3.814 -.044 -.132
JS1 1.000 5.000 -.818 -4.873 1.329 3.960
MO1 1.000 5.000 -.964 -5.746 .660 1.965
MO2 2.000 5.000 -1.251 -7.453 .828 2.467
MO4 1.000 5.000 -1.011 -6.022 .407 1.212
DSB1 1.000 5.000 -.810 -4.825 .184 .548
DSB2 2.000 5.000 -1.010 -6.016 .339 1.010
ML1 1.000 5.000 -.226 -1.347 -.854 -2.545
ML2 1.000 5.000 -.305 -1.818 -.911 -2.715
ML3 1.000 5.000 -.518 -3.086 -.811 -2.417
Multivariate
58.215 17.701
Model CFA 5b:9 Inter-factor correlation estimates
Parameter Estimate Lower Upper P
MLfac <--> DSBfac .383 .273 .508 .006
MLfac <--> MOfac .408 .322 .548 .003
DSBfac <--> MOfac .322 .190 .493 .005
MLfac <--> EPAfac .571 .469 .660 .009
DSBfac <--> EPAfac .382 .245 .545 .007
MOfac <--> EPAfac .416 .323 .519 .007
MLfac <--> EMfac .572 .437 .685 .008
DSBfac <--> EMfac .373 .207 .544 .009
MOfac <--> EMfac .438 .301 .546 .021
EPAfac <--> EMfac .748 .651 .828 .011
Model CFA 4:8 Standarised factor loading estimates
Parameter Estimate Lower Upper P
ML3 <--- MLfac .878 .828 .912 .026
ML2 <--- MLfac .953 .924 .976 .009
ML1 <--- MLfac .904 .871 .937 .007
DSB2 <--- DSBfac .696 .557 .827 .016
DSB1 <--- DSBfac .932 .788 1.121 .009
MO2 <--- MOfac .864 .797 .916 .023
MO1 <--- MOfac .862 .796 .940 .005
MO4 <--- MOfac .457 .362 .596 .007
JS1 <--- EPAfac .738 .658 .802 .009
AC2 <--- EPAfac .774 .719 .845 .005
ME1 <--- EPAfac .876 .817 .920 .012
ME3 <--- EPAfac .849 .751 .890 .026
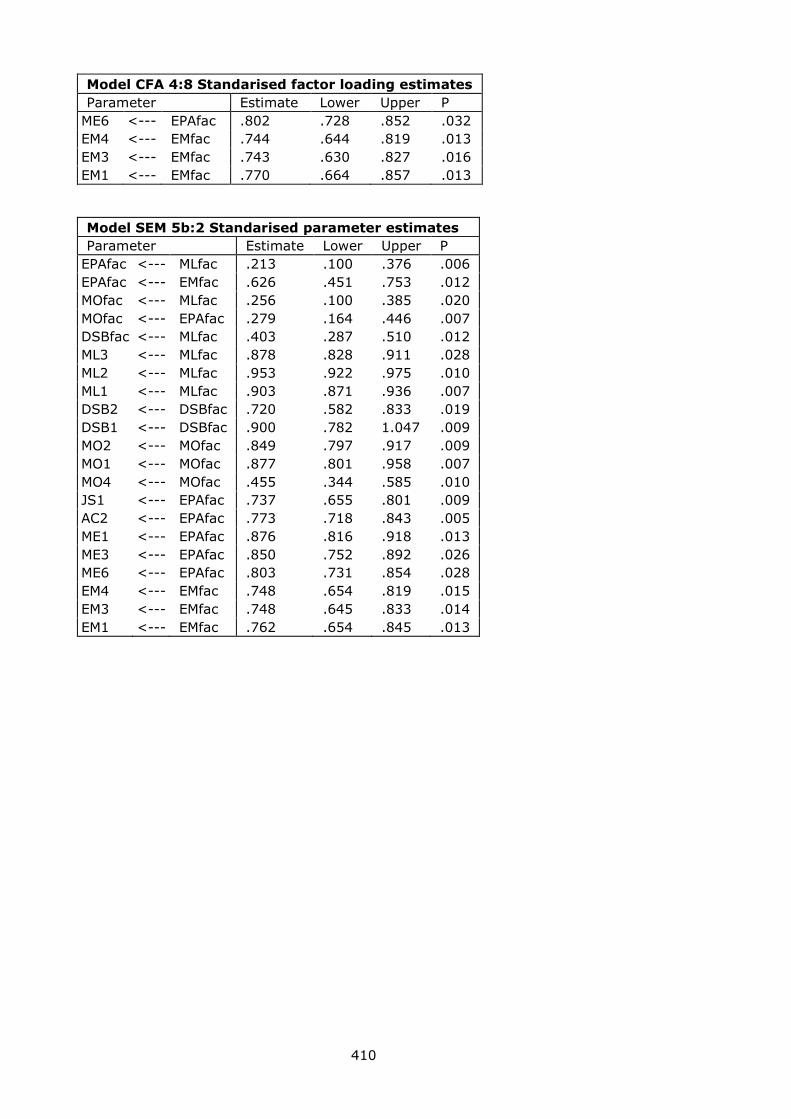
410
Model CFA 4:8 Standarised factor loading estimates
Parameter Estimate Lower Upper P
ME6 <--- EPAfac .802 .728 .852 .032
EM4 <--- EMfac .744 .644 .819 .013
EM3 <--- EMfac .743 .630 .827 .016
EM1 <--- EMfac .770 .664 .857 .013
Model SEM 5b:2 Standarised parameter estimates
Parameter Estimate Lower Upper P
EPAfac <--- MLfac .213 .100 .376 .006
EPAfac <--- EMfac .626 .451 .753 .012
MOfac <--- MLfac .256 .100 .385 .020
MOfac <--- EPAfac .279 .164 .446 .007
DSBfac <--- MLfac .403 .287 .510 .012
ML3 <--- MLfac .878 .828 .911 .028
ML2 <--- MLfac .953 .922 .975 .010
ML1 <--- MLfac .903 .871 .936 .007
DSB2 <--- DSBfac .720 .582 .833 .019
DSB1 <--- DSBfac .900 .782 1.047 .009
MO2 <--- MOfac .849 .797 .917 .009
MO1 <--- MOfac .877 .801 .958 .007
MO4 <--- MOfac .455 .344 .585 .010
JS1 <--- EPAfac .737 .655 .801 .009
AC2 <--- EPAfac .773 .718 .843 .005
ME1 <--- EPAfac .876 .816 .918 .013
ME3 <--- EPAfac .850 .752 .892 .026
ME6 <--- EPAfac .803 .731 .854 .028
EM4 <--- EMfac .748 .654 .819 .015
EM3 <--- EMfac .748 .645 .833 .014
EM1 <--- EMfac .762 .654 .845 .013
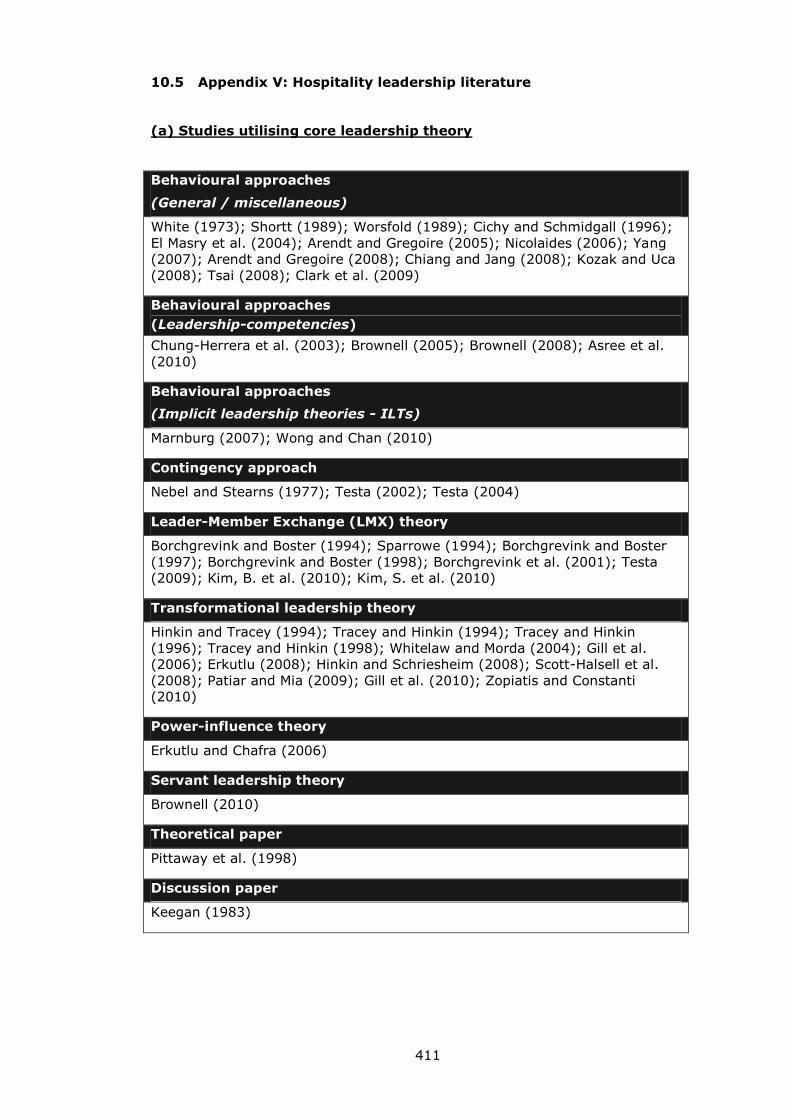
411
10.5 Appendix V: Hospitality leadership literature
(a) Studies utilising core leadership theory
Behavioural approaches
(General / miscellaneous)
White (1973); Shortt (1989); Worsfold (1989); Cichy and Schmidgall (1996);
El Masry et al. (2004); Arendt and Gregoire (2005); Nicolaides (2006); Yang
(2007); Arendt and Gregoire (2008); Chiang and Jang (2008); Kozak and Uca
(2008); Tsai (2008); Clark et al. (2009)
Behavioural approaches
(Leadership-competencies)
Chung-Herrera et al. (2003); Brownell (2005); Brownell (2008); Asree et al.
(2010)
Behavioural approaches
(Implicit leadership theories - ILTs)
Marnburg (2007); Wong and Chan (2010)
Contingency approach
Nebel and Stearns (1977); Testa (2002); Testa (2004)
Leader-Member Exchange (LMX) theory
Borchgrevink and Boster (1994); Sparrowe (1994); Borchgrevink and Boster
(1997); Borchgrevink and Boster (1998); Borchgrevink et al. (2001); Testa
(2009); Kim, B. et al. (2010); Kim, S. et al. (2010)
Transformational leadership theory
Hinkin and Tracey (1994); Tracey and Hinkin (1994); Tracey and Hinkin
(1996); Tracey and Hinkin (1998); Whitelaw and Morda (2004); Gill et al.
(2006); Erkutlu (2008); Hinkin and Schriesheim (2008); Scott-Halsell et al.
(2008); Patiar and Mia (2009); Gill et al. (2010); Zopiatis and Constanti
(2010)
Power-influence theory
Erkutlu and Chafra (2006)
Servant leadership theory
Brownell (2010)
Theoretical paper
Pittaway et al. (1998)
Discussion paper
Keegan (1983)
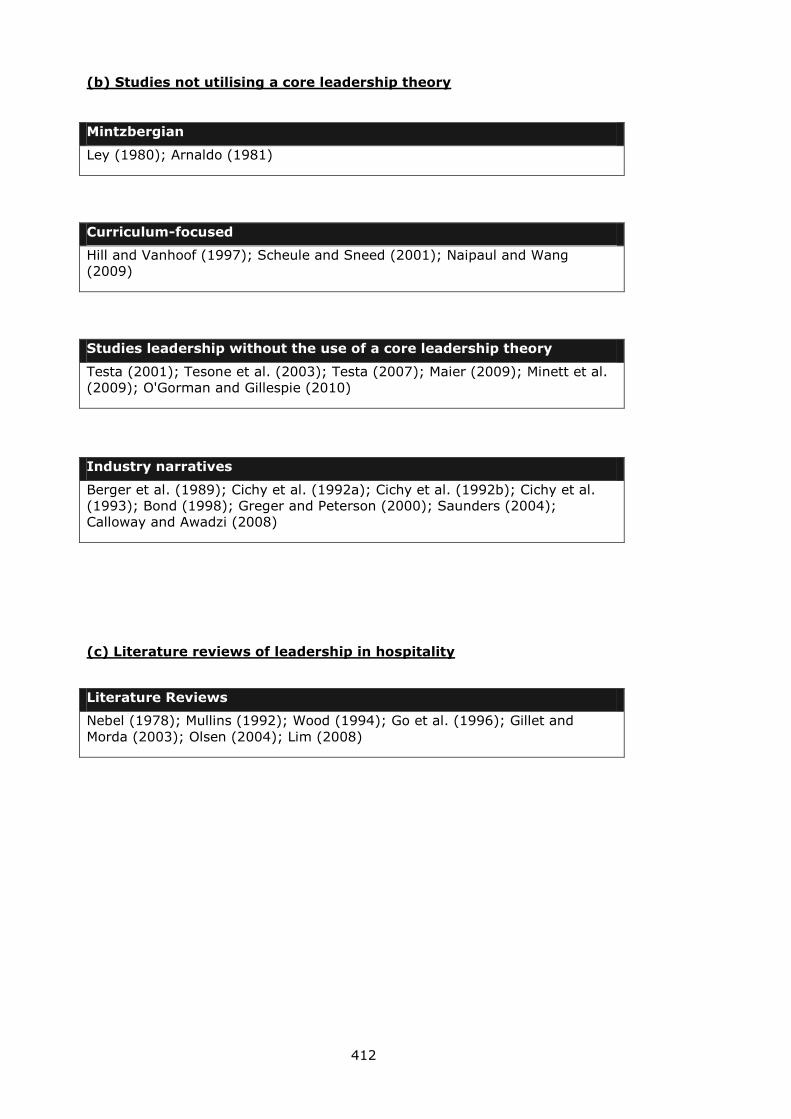
412
(b) Studies not utilising a core leadership theory
Mintzbergian
Ley (1980); Arnaldo (1981)
(Ley 1980; Arnaldo 1981)
Curriculum-focused
Hill and Vanhoof (1997); Scheule and Sneed (2001); Naipaul and Wang
(2009)
(Hill and Vanhoof 1997; Scheule and Sneed 2001; Naipaul and Wang 2009)
Studies leadership without the use of a core leadership theory
Testa (2001); Tesone et al. (2003); Testa (2007); Maier (2009); Minett et al.
(2009); O'Gorman and Gillespie (2010)
(Testa 2001; Tesone et al. 2003; Testa 2007; Maier 2009; Minett et al. 2009;
O'Gorman and Gillespie 2010)
Industry narratives
Berger et al. (1989); Cichy et al. (1992a); Cichy et al. (1992b); Cichy et al.
(1993); Bond (1998); Greger and Peterson (2000); Saunders (2004);
Calloway and Awadzi (2008)
(Berger et al. 1989; Cichy et al. 1992a; Cichy et al. 1992b; Cichy et al. 1993;
Bond 1998; Greger and Peterson 2000; Saunders 2004; Calloway and Awadzi
2008)
(c) Literature reviews of leadership in hospitality
Literature Reviews
Nebel (1978); Mullins (1992); Wood (1994); Go et al. (1996); Gillet and
Morda (2003); Olsen (2004); Lim (2008)
(Nebel 1978; Mullins 1992; Wood 1994; Go et al. 1996; Gillet and Morda 2003;
Olsen 2004; Lim 2008)
(for example Lawler 1967 and; Borman 1974 in organisational studies)
(Van Vuuren et al. 2007)
413
10.6 Appendix VI: The pre-test survey form
In Appendix IV, V and VI illustrating the survey forms used, the Job Performance
construct (JP) is labelled as MO for Work MOtivation.
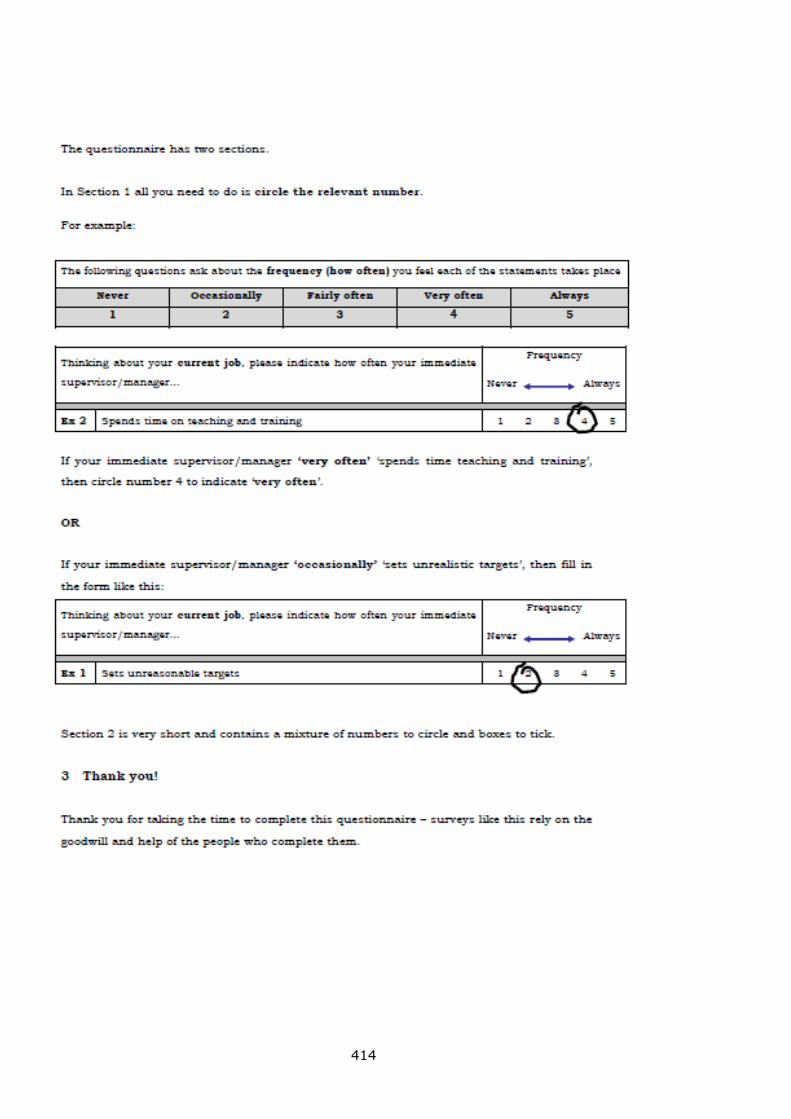
414
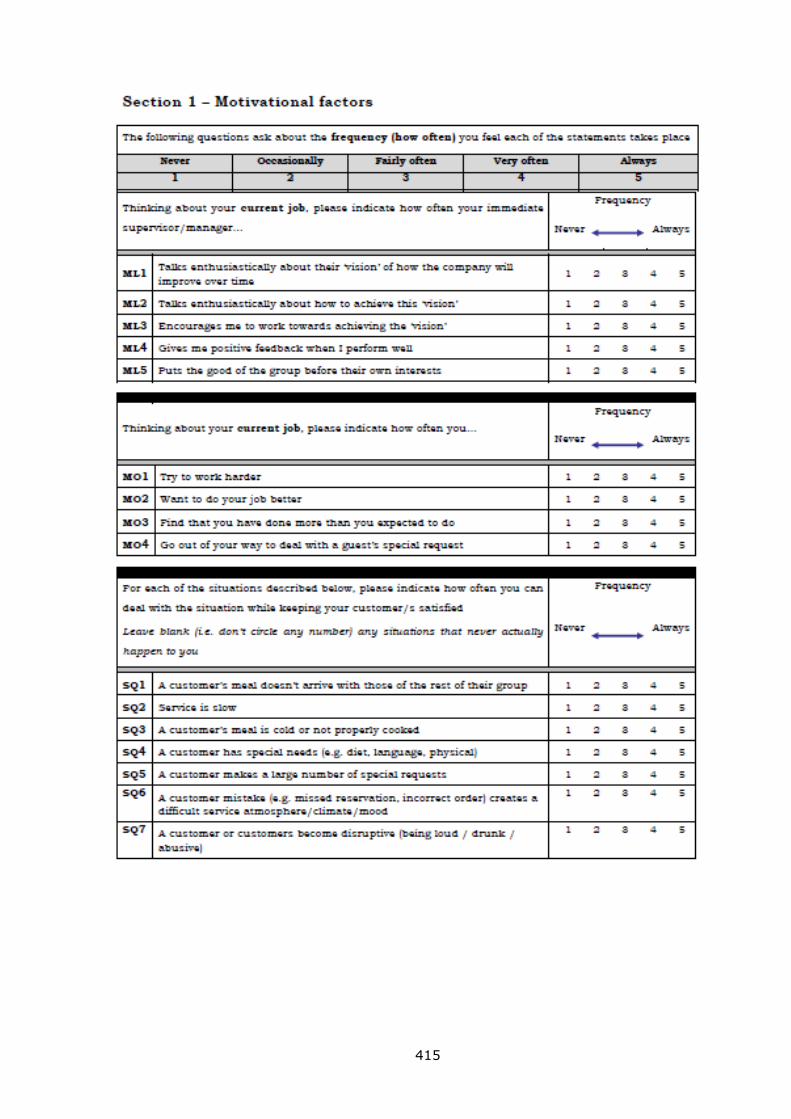
415
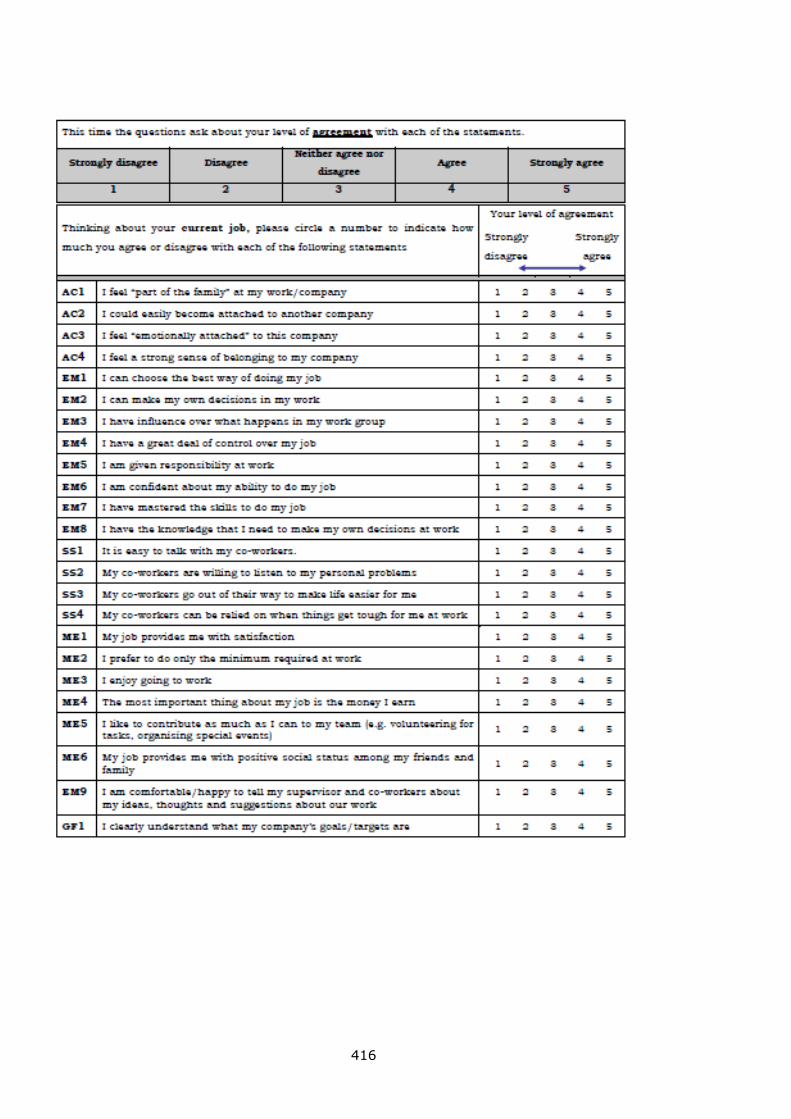
416
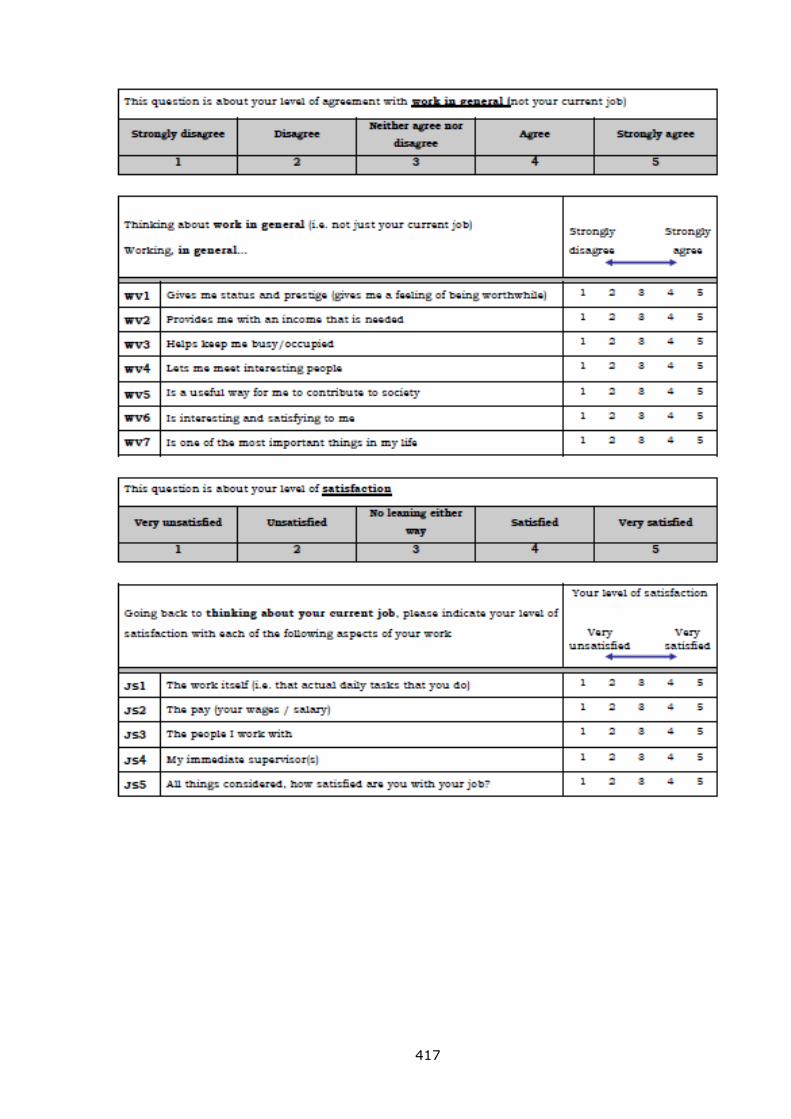
417
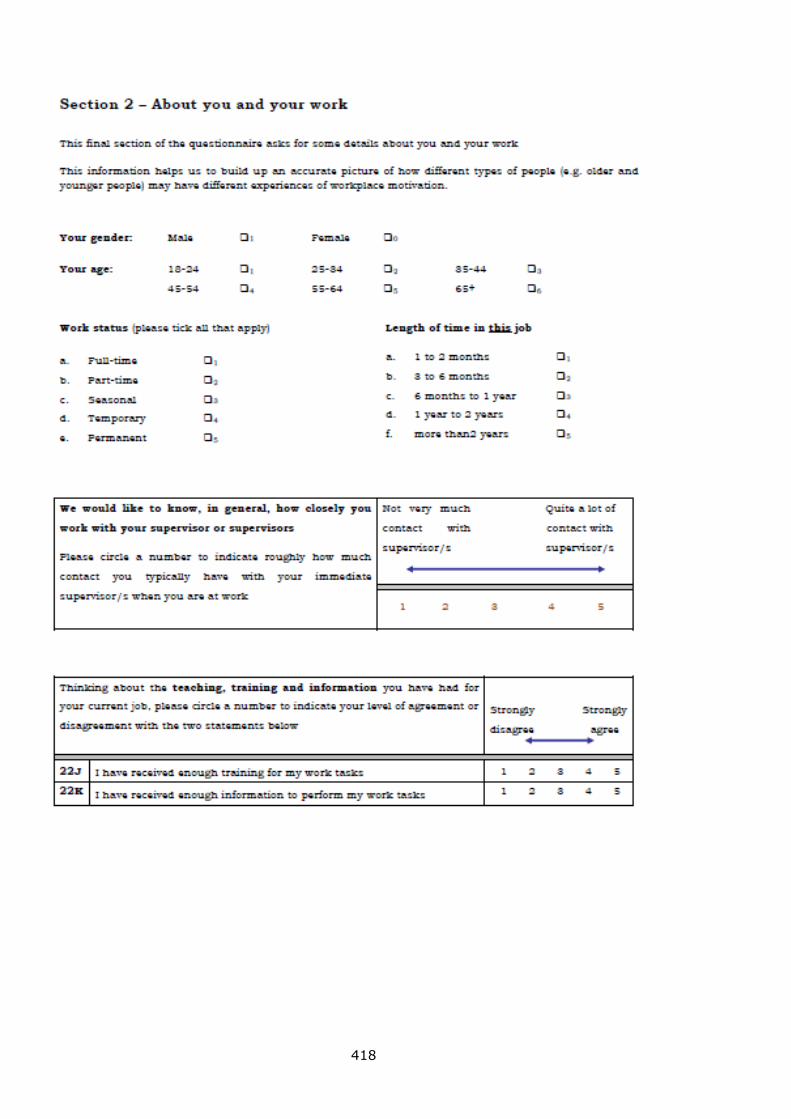
418
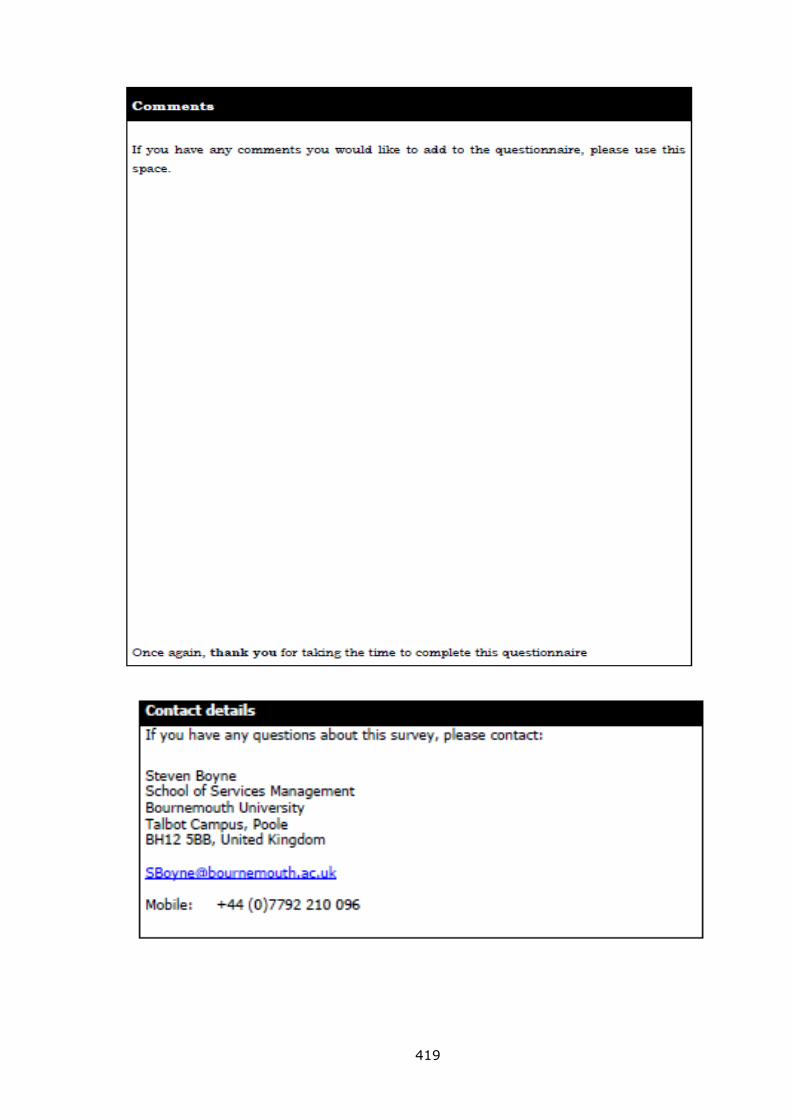
419
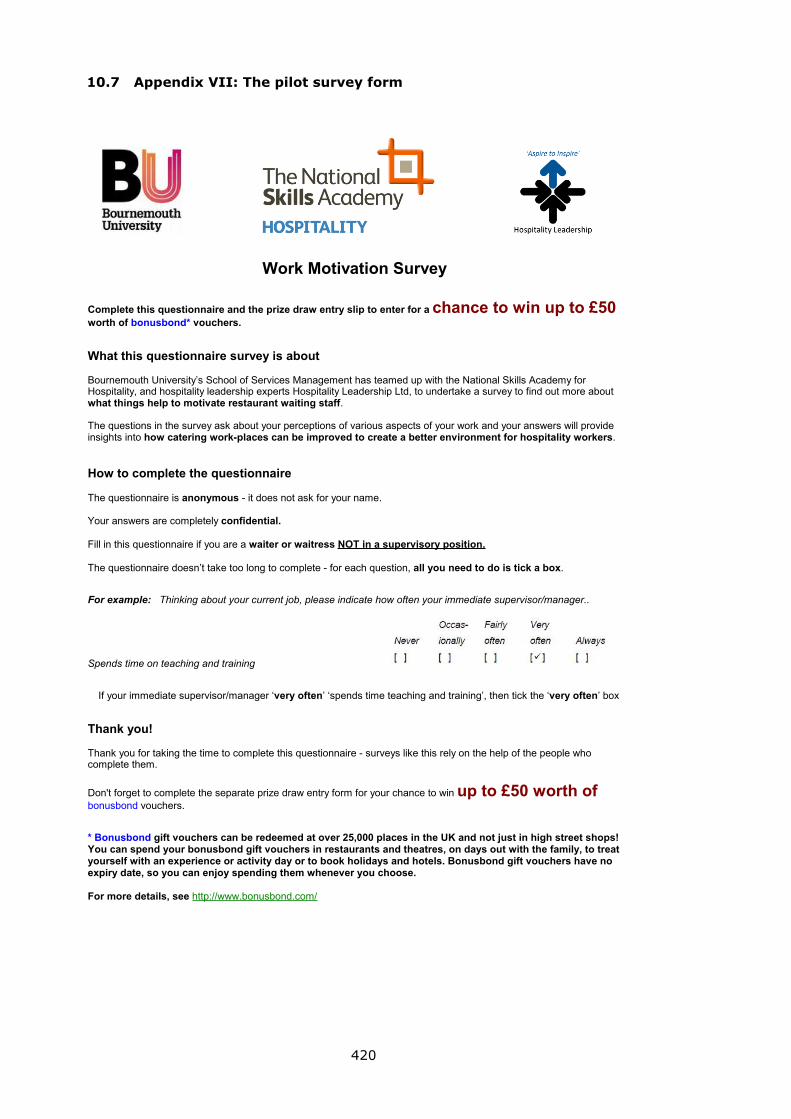
420
10.7 Appendix VII: The pilot survey form
Work Motivation Survey
Complete this questionnaire and the prize draw entry slip to enter for a chance to win up to £50worth of bonusbond* vouchers.
What this questionnaire survey is about
Bournemouth University’s School of Services Management has teamed up with the National Skills Academy forHospitality, and hospitality leadership experts Hospitality Leadership Ltd, to undertake a survey to find out more aboutwhat things help to motivate restaurant waiting staff.
The questions in the survey ask about your perceptions of various aspects of your work and your answers will provideinsights into how catering work-places can be improved to create a better environment for hospitality workers.
How to complete the questionnaire
The questionnaire is anonymous - it does not ask for your name.
Your answers are completely confidential.
Fill in this questionnaire if you are a waiter or waitress NOT in a supervisory position.
The questionnaire doesn’t take too long to complete - for each question, all you need to do is tick a box.
For example: Thinking about your current job, please indicate how often your immediate supervisor/manager..
Spends time on teaching and training
If your immediate supervisor/manager ‘very often’ ‘spends time teaching and training’, then tick the ‘very often’ box
Thank you!
Thank you for taking the time to complete this questionnaire - surveys like this rely on the help of the people whocomplete them.
Don't forget to complete the separate prize draw entry form for your chance to win up to £50 worth ofbonusbond vouchers.
* Bonusbond gift vouchers can be redeemed at over 25,000 places in the UK and not just in high street shops!You can spend your bonusbond gift vouchers in restaurants and theatres, on days out with the family, to treatyourself with an experience or activity day or to book holidays and hotels. Bonusbond gift vouchers have noexpiry date, so you can enjoy spending them whenever you choose.
For more details, see http://www.bonusbond.com/
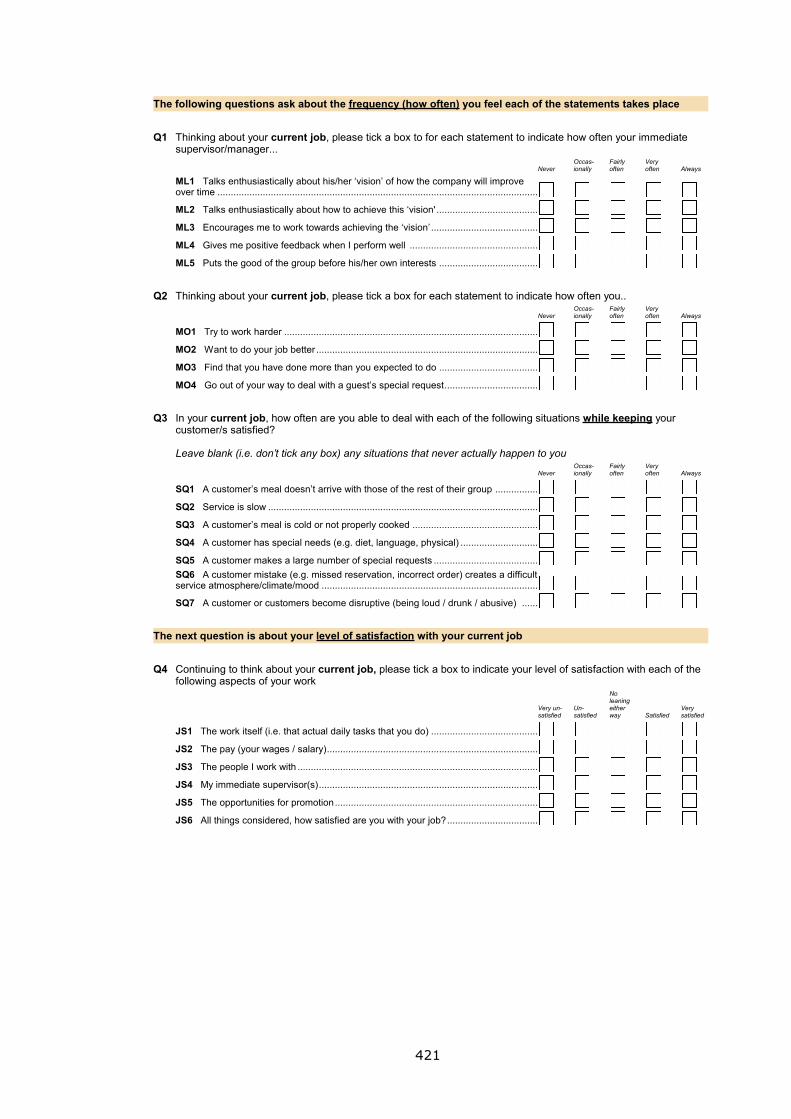
421
The following questions ask about the frequency (how often) you feel each of the statements takes place
Q1 Thinking about your current job, please tick a box to for each statement to indicate how often your immediatesupervisor/manager...
ML1 Talks enthusiastically about his/her ‘vision’ of how the company will improveover time ........................................................................................................................
NeverOccas-ionally
Fairlyoften
Veryoften Always
ML2 Talks enthusiastically about how to achieve this ‘vision' ......................................
ML3 Encourages me to work towards achieving the ‘vision’ ........................................
ML4 Gives me positive feedback when I perform well ................................................
ML5 Puts the good of the group before his/her own interests .....................................
Q2 Thinking about your current job, please tick a box for each statement to indicate how often you..
MO1 Try to work harder ...............................................................................................
NeverOccas-ionally
Fairlyoften
Veryoften Always
MO2 Want to do your job better ...................................................................................
MO3 Find that you have done more than you expected to do .....................................
MO4 Go out of your way to deal with a guest’s special request...................................
Q3 In your current job, how often are you able to deal with each of the following situations while keeping yourcustomer/s satisfied?
Leave blank (i.e. don’t tick any box) any situations that never actually happen to you
SQ1 A customer’s meal doesn’t arrive with those of the rest of their group ................
NeverOccas-ionally
Fairlyoften
Veryoften Always
SQ2 Service is slow .....................................................................................................
SQ3 A customer’s meal is cold or not properly cooked ...............................................
SQ4 A customer has special needs (e.g. diet, language, physical) .............................
SQ5 A customer makes a large number of special requests .......................................
SQ6 A customer mistake (e.g. missed reservation, incorrect order) creates a difficultservice atmosphere/climate/mood .................................................................................
SQ7 A customer or customers become disruptive (being loud / drunk / abusive) ......
The next question is about your level of satisfaction with your current job
Q4 Continuing to think about your current job, please tick a box to indicate your level of satisfaction with each of thefollowing aspects of your work
JS1 The work itself (i.e. that actual daily tasks that you do) ........................................
Very un-satisfied
Un-satisfied
Noleaningeitherway Satisfied
Verysatisfied
JS2 The pay (your wages / salary)...............................................................................
JS3 The people I work with ..........................................................................................
JS4 My immediate supervisor(s)..................................................................................
JS5 The opportunities for promotion............................................................................
JS6 All things considered, how satisfied are you with your job?..................................
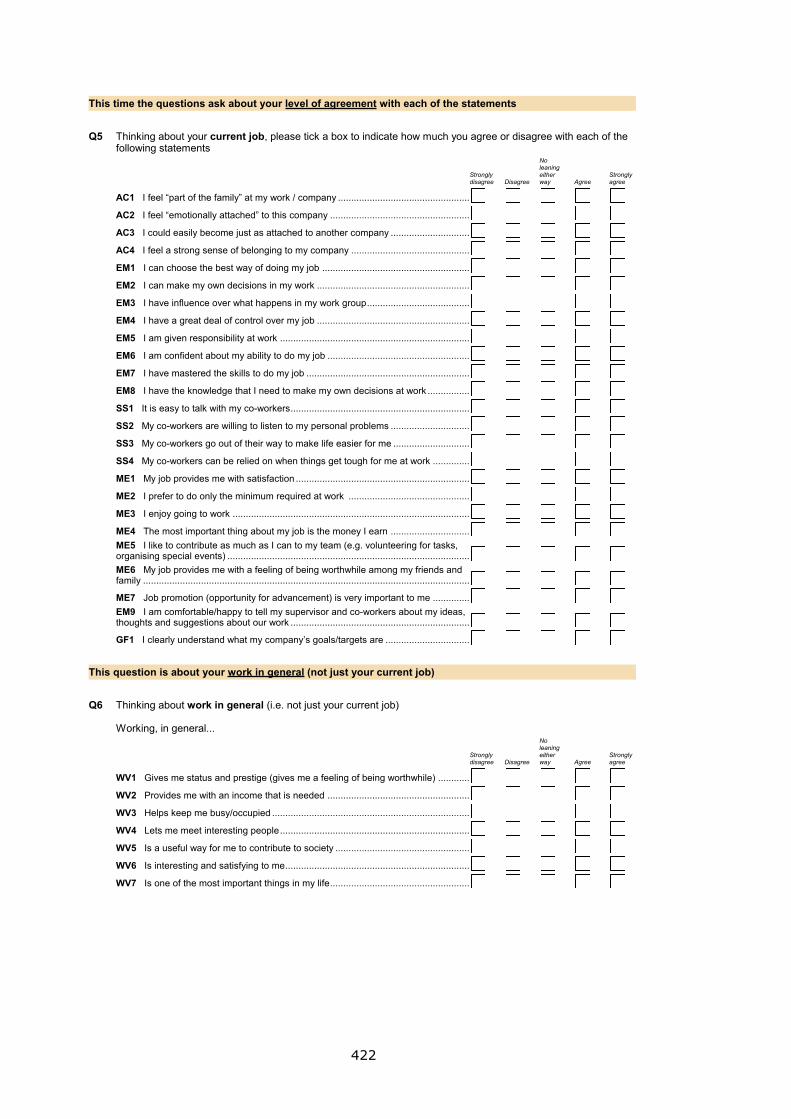
422
This time the questions ask about your level of agreement with each of the statements
Q5 Thinking about your current job, please tick a box to indicate how much you agree or disagree with each of thefollowing statements
AC1 I feel “part of the family” at my work / company ..................................................
Stronglydisagree Disagree
Noleaningeitherway Agree
Stronglyagree
AC2 I feel “emotionally attached” to this company .....................................................
AC3 I could easily become just as attached to another company ..............................
AC4 I feel a strong sense of belonging to my company .............................................
EM1 I can choose the best way of doing my job ........................................................
EM2 I can make my own decisions in my work ..........................................................
EM3 I have influence over what happens in my work group.......................................
EM4 I have a great deal of control over my job ..........................................................
EM5 I am given responsibility at work ........................................................................
EM6 I am confident about my ability to do my job ......................................................
EM7 I have mastered the skills to do my job ..............................................................
EM8 I have the knowledge that I need to make my own decisions at work ................
SS1 It is easy to talk with my co-workers....................................................................
SS2 My co-workers are willing to listen to my personal problems ..............................
SS3 My co-workers go out of their way to make life easier for me .............................
SS4 My co-workers can be relied on when things get tough for me at work ..............
ME1 My job provides me with satisfaction ..................................................................
ME2 I prefer to do only the minimum required at work ..............................................
ME3 I enjoy going to work ..........................................................................................
ME4 The most important thing about my job is the money I earn ..............................
ME5 I like to contribute as much as I can to my team (e.g. volunteering for tasks,organising special events) ............................................................................................
ME6 My job provides me with a feeling of being worthwhile among my friends andfamily ............................................................................................................................
ME7 Job promotion (opportunity for advancement) is very important to me ..............
EM9 I am comfortable/happy to tell my supervisor and co-workers about my ideas,thoughts and suggestions about our work ....................................................................
GF1 I clearly understand what my company’s goals/targets are ................................
This question is about your work in general (not just your current job)
Q6 Thinking about work in general (i.e. not just your current job)
Working, in general...
WV1 Gives me status and prestige (gives me a feeling of being worthwhile) ............
Stronglydisagree Disagree
Noleaningeitherway Agree
Stronglyagree
WV2 Provides me with an income that is needed ......................................................
WV3 Helps keep me busy/occupied ...........................................................................
WV4 Lets me meet interesting people........................................................................
WV5 Is a useful way for me to contribute to society ...................................................
WV6 Is interesting and satisfying to me......................................................................
WV7 Is one of the most important things in my life.....................................................
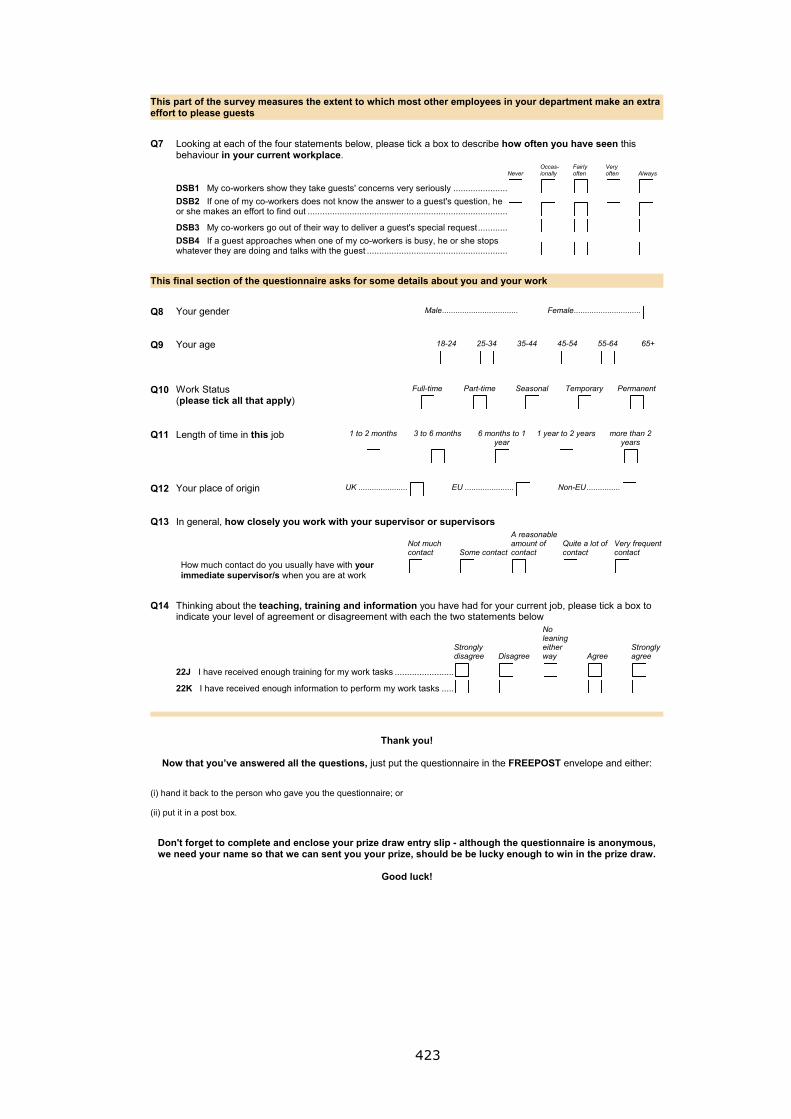
423
This part of the survey measures the extent to which most other employees in your department make an extraeffort to please guests
Q7 Looking at each of the four statements below, please tick a box to describe how often you have seen thisbehaviour in your current workplace.
DSB1 My co-workers show they take guests' concerns very seriously ......................
NeverOccas-ionally
Fairlyoften
Veryoften Always
DSB2 If one of my co-workers does not know the answer to a guest's question, heor she makes an effort to find out .................................................................................
DSB3 My co-workers go out of their way to deliver a guest's special request............
DSB4 If a guest approaches when one of my co-workers is busy, he or she stopswhatever they are doing and talks with the guest .........................................................
This final section of the questionnaire asks for some details about you and your work
Q8 Your gender Male.................................. Female..............................
Q9 Your age 18-24 25-34 35-44 45-54 55-64 65+
Q10 Work Status (please tick all that apply)
Full-time Part-time Seasonal Temporary Permanent
Q11 Length of time in this job 1 to 2 months......
3 to 6 months......
6 months to 1year
1 year to 2 years.....
more than 2years
Q12 Your place of origin UK ...................... EU ...................... Non-EU ...............
Q13 In general, how closely you work with your supervisor or supervisors
How much contact do you usually have with yourimmediate supervisor/s when you are at work
Not muchcontact Some contact
A reasonableamount ofcontact
Quite a lot ofcontact
Very frequentcontact
Q14 Thinking about the teaching, training and information you have had for your current job, please tick a box toindicate your level of agreement or disagreement with each the two statements below
22J I have received enough training for my work tasks ........................
Stronglydisagree Disagree
Noleaningeitherway Agree
Stronglyagree
22K I have received enough information to perform my work tasks .....
Thank you!
Now that you’ve answered all the questions, just put the questionnaire in the FREEPOST envelope and either:
(i) hand it back to the person who gave you the questionnaire; or
(ii) put it in a post box.
Don't forget to complete and enclose your prize draw entry slip - although the questionnaire is anonymous,we need your name so that we can sent you your prize, should be be lucky enough to win in the prize draw.
Good luck!
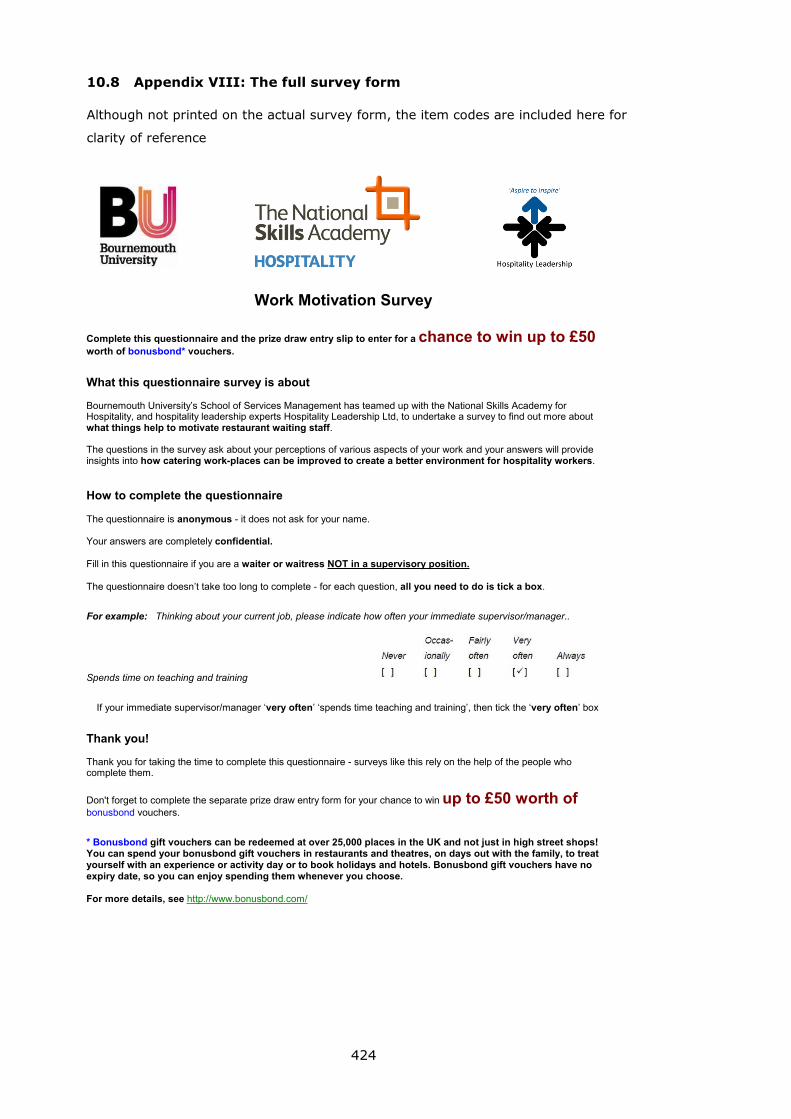
424
10.8 Appendix VIII: The full survey form
Although not printed on the actual survey form, the item codes are included here for
clarity of reference
Work Motivation Survey
Complete this questionnaire and the prize draw entry slip to enter for a chance to win up to £50worth of bonusbond* vouchers.
What this questionnaire survey is about
Bournemouth University’s School of Services Management has teamed up with the National Skills Academy forHospitality, and hospitality leadership experts Hospitality Leadership Ltd, to undertake a survey to find out more aboutwhat things help to motivate restaurant waiting staff.
The questions in the survey ask about your perceptions of various aspects of your work and your answers will provideinsights into how catering work-places can be improved to create a better environment for hospitality workers.
How to complete the questionnaire
The questionnaire is anonymous - it does not ask for your name.
Your answers are completely confidential.
Fill in this questionnaire if you are a waiter or waitress NOT in a supervisory position.
The questionnaire doesn’t take too long to complete - for each question, all you need to do is tick a box.
For example: Thinking about your current job, please indicate how often your immediate supervisor/manager..
Spends time on teaching and training
If your immediate supervisor/manager ‘very often’ ‘spends time teaching and training’, then tick the ‘very often’ box
Thank you!
Thank you for taking the time to complete this questionnaire - surveys like this rely on the help of the people whocomplete them.
Don't forget to complete the separate prize draw entry form for your chance to win up to £50 worth ofbonusbond vouchers.
* Bonusbond gift vouchers can be redeemed at over 25,000 places in the UK and not just in high street shops!You can spend your bonusbond gift vouchers in restaurants and theatres, on days out with the family, to treatyourself with an experience or activity day or to book holidays and hotels. Bonusbond gift vouchers have noexpiry date, so you can enjoy spending them whenever you choose.
For more details, see http://www.bonusbond.com/
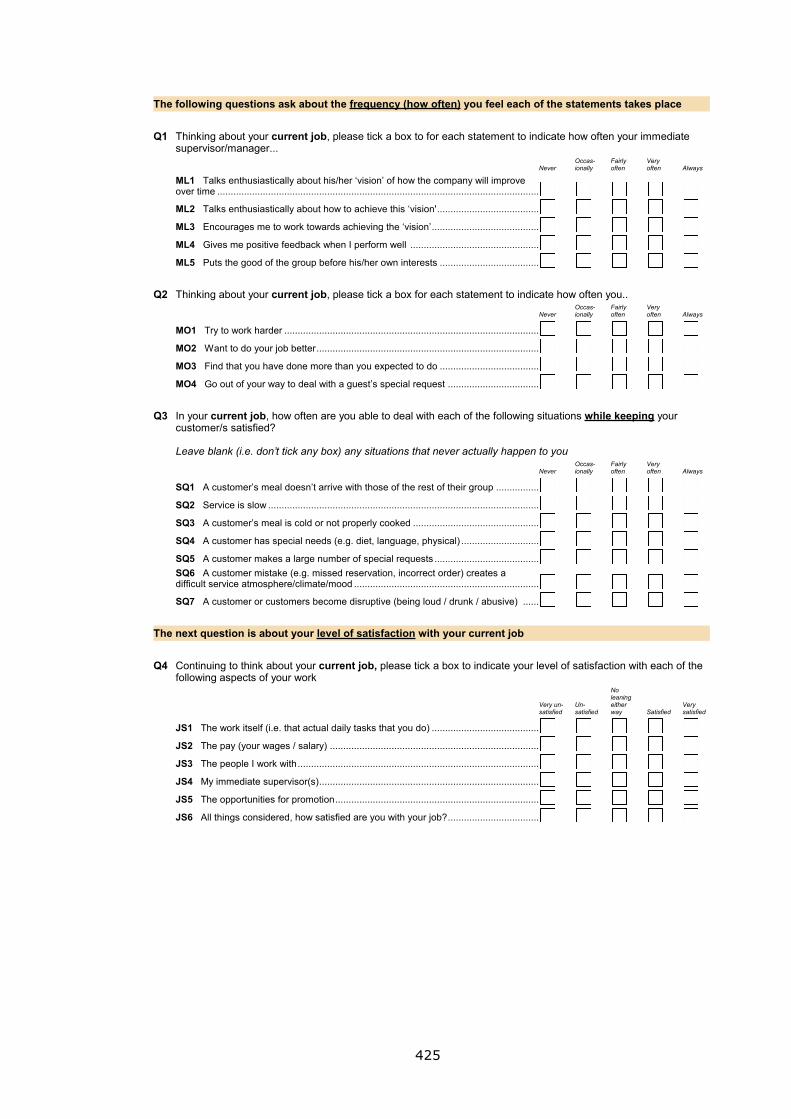
425
The following questions ask about the frequency (how often) you feel each of the statements takes place
Q1 Thinking about your current job, please tick a box to for each statement to indicate how often your immediatesupervisor/manager...
ML1 Talks enthusiastically about his/her ‘vision’ of how the company will improveover time ........................................................................................................................
NeverOccas-ionally
Fairlyoften
Veryoften Always
ML2 Talks enthusiastically about how to achieve this ‘vision'......................................
ML3 Encourages me to work towards achieving the ‘vision’........................................
ML4 Gives me positive feedback when I perform well ................................................
ML5 Puts the good of the group before his/her own interests .....................................
Q2 Thinking about your current job, please tick a box for each statement to indicate how often you..
MO1 Try to work harder ...............................................................................................
NeverOccas-ionally
Fairlyoften
Veryoften Always
MO2 Want to do your job better...................................................................................
MO3 Find that you have done more than you expected to do .....................................
MO4 Go out of your way to deal with a guest’s special request ..................................
Q3 In your current job, how often are you able to deal with each of the following situations while keeping yourcustomer/s satisfied?
Leave blank (i.e. don’t tick any box) any situations that never actually happen to you
SQ1 A customer’s meal doesn’t arrive with those of the rest of their group ................
NeverOccas-ionally
Fairlyoften
Veryoften Always
SQ2 Service is slow .....................................................................................................
SQ3 A customer’s meal is cold or not properly cooked ...............................................
SQ4 A customer has special needs (e.g. diet, language, physical) .............................
SQ5 A customer makes a large number of special requests .......................................
SQ6 A customer mistake (e.g. missed reservation, incorrect order) creates adifficult service atmosphere/climate/mood .....................................................................
SQ7 A customer or customers become disruptive (being loud / drunk / abusive) ......
The next question is about your level of satisfaction with your current job
Q4 Continuing to think about your current job, please tick a box to indicate your level of satisfaction with each of thefollowing aspects of your work
JS1 The work itself (i.e. that actual daily tasks that you do) ........................................
Very un-satisfied
Un-satisfied
Noleaningeitherway Satisfied
Verysatisfied
JS2 The pay (your wages / salary) ..............................................................................
JS3 The people I work with..........................................................................................
JS4 My immediate supervisor(s)..................................................................................
JS5 The opportunities for promotion............................................................................
JS6 All things considered, how satisfied are you with your job?..................................
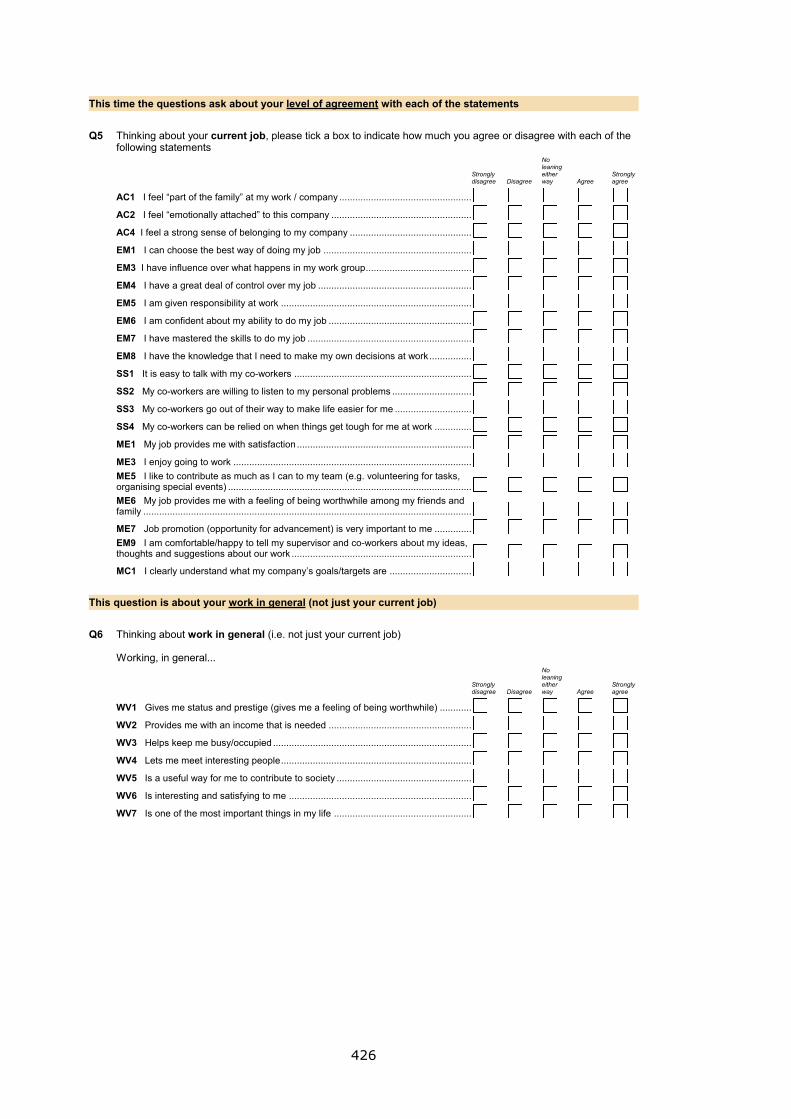
426
This time the questions ask about your level of agreement with each of the statements
Q5 Thinking about your current job, please tick a box to indicate how much you agree or disagree with each of thefollowing statements
AC1 I feel “part of the family” at my work / company ..................................................
Stronglydisagree Disagree
Noleaningeitherway Agree
Stronglyagree
AC2 I feel “emotionally attached” to this company .....................................................
AC4 I feel a strong sense of belonging to my company ..............................................
EM1 I can choose the best way of doing my job ........................................................
EM3 I have influence over what happens in my work group........................................
EM4 I have a great deal of control over my job ..........................................................
EM5 I am given responsibility at work ........................................................................
EM6 I am confident about my ability to do my job ......................................................
EM7 I have mastered the skills to do my job ..............................................................
EM8 I have the knowledge that I need to make my own decisions at work................
SS1 It is easy to talk with my co-workers ...................................................................
SS2 My co-workers are willing to listen to my personal problems ..............................
SS3 My co-workers go out of their way to make life easier for me .............................
SS4 My co-workers can be relied on when things get tough for me at work ..............
ME1 My job provides me with satisfaction ..................................................................
ME3 I enjoy going to work ..........................................................................................
ME5 I like to contribute as much as I can to my team (e.g. volunteering for tasks,organising special events) ............................................................................................
ME6 My job provides me with a feeling of being worthwhile among my friends andfamily ............................................................................................................................
ME7 Job promotion (opportunity for advancement) is very important to me ..............
EM9 I am comfortable/happy to tell my supervisor and co-workers about my ideas,thoughts and suggestions about our work ....................................................................
MC1 I clearly understand what my company’s goals/targets are ...............................
This question is about your work in general (not just your current job)
Q6 Thinking about work in general (i.e. not just your current job)
Working, in general...
WV1 Gives me status and prestige (gives me a feeling of being worthwhile) ............
Stronglydisagree Disagree
Noleaningeitherway Agree
Stronglyagree
WV2 Provides me with an income that is needed ......................................................
WV3 Helps keep me busy/occupied ...........................................................................
WV4 Lets me meet interesting people........................................................................
WV5 Is a useful way for me to contribute to society ...................................................
WV6 Is interesting and satisfying to me .....................................................................
WV7 Is one of the most important things in my life ....................................................
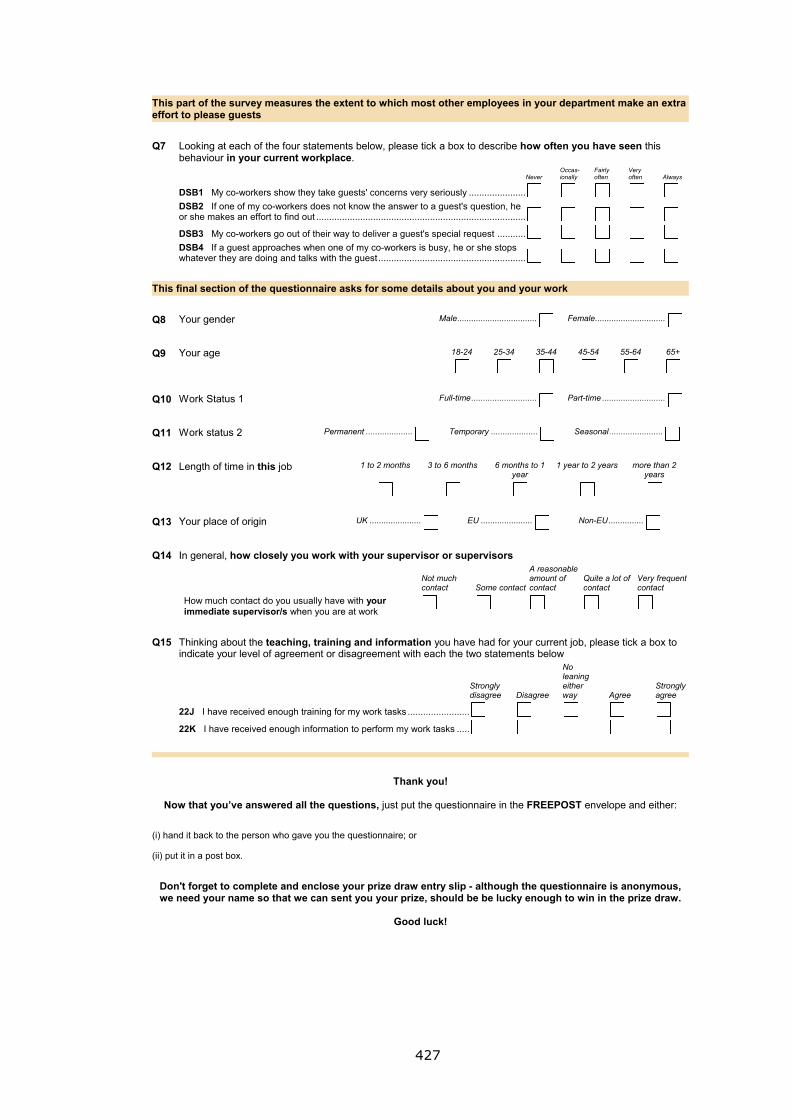
427
This part of the survey measures the extent to which most other employees in your department make an extraeffort to please guests
Q7 Looking at each of the four statements below, please tick a box to describe how often you have seen thisbehaviour in your current workplace.
DSB1 My co-workers show they take guests' concerns very seriously ......................
NeverOccas-ionally
Fairlyoften
Veryoften Always
DSB2 If one of my co-workers does not know the answer to a guest's question, heor she makes an effort to find out .................................................................................
DSB3 My co-workers go out of their way to deliver a guest's special request ...........
DSB4 If a guest approaches when one of my co-workers is busy, he or she stopswhatever they are doing and talks with the guest.........................................................
This final section of the questionnaire asks for some details about you and your work
Q8 Your gender Male.................................. Female..............................
Q9 Your age 18-24 25-34 35-44 45-54 55-64 65+
Q10 Work Status 1 Full-time............................ Part-time ...........................
Q11 Work status 2 Permanent .................... Temporary .................... Seasonal.......................
Q12 Length of time in this job 1 to 2 months......
3 to 6 months......
6 months to 1year
1 year to 2 years.....
more than 2years
Q13 Your place of origin UK ...................... EU ...................... Non-EU...............
Q14 In general, how closely you work with your supervisor or supervisors
How much contact do you usually have with yourimmediate supervisor/s when you are at work
Not muchcontact Some contact
A reasonableamount ofcontact
Quite a lot ofcontact
Very frequentcontact
Q15 Thinking about the teaching, training and information you have had for your current job, please tick a box toindicate your level of agreement or disagreement with each the two statements below
22J I have received enough training for my work tasks ........................
Stronglydisagree Disagree
Noleaningeitherway Agree
Stronglyagree
22K I have received enough information to perform my work tasks .....
Thank you!
Now that you’ve answered all the questions, just put the questionnaire in the FREEPOST envelope and either:
(i) hand it back to the person who gave you the questionnaire; or
(ii) put it in a post box.
Don't forget to complete and enclose your prize draw entry slip - although the questionnaire is anonymous,we need your name so that we can sent you your prize, should be be lucky enough to win in the prize draw.
Good luck!