leadership at work · pdf fileexecutive summary why leadership must change now fuelled by the...
TRANSCRIPT

Leadership at WorkDo Australian leaders have what it takes?

Authors: Peter Gahan, Mladen Adamovic, Andrew Bevitt, Bill Harley, Josh Healy, Jesse E Olsen, Max Theilacker with contribution from: Daejeong Choi, Jehan Gonsal, Nuzhat Lotia, Angus McDonald, Mulyadi Robin, Brigid van Wanrooy
Fieldwork Team, Sampling and Weighting Design: Social Research Centre
Design and Layout: Slinky Did It slinkydidit.com.au
Our thanks to: Damian Collins, Mark Cully, Alison Durbin, Michael Fischer, Sarah Fortuna, Karen Gomez, Andrew Lalor, Sarah Linklater, Sally Orpin, David Peetz, Zoe Piper, Johann Ponnampalam, Amanda Purdie, Mark Roddam, Lu Sexton, Ben Sievewright, Leo Vance, Kath Walters, Lace Wang, Mark Wooden.
ISBN 978-0-9946146-0-5
Citation for this report:
Gahan, P., Adamovic, M., Bevitt, A., Harley, B., Healy, J., Olsen, J.E., Theilacker, M. 2016. Leadership at Work: Do Australian leaders have what it takes? Melbourne: Centre for Workplace Leadership, University of Melbourne. Available at: workplaceleadership.com.au/sal
Study of Australian Leadership Centre for Workplace Leadership+61 3 9035 5559 [email protected] www.workplaceleadership.com.au
Approved by the University of Melbourne Human Ethics Committee HREC no. 1442681. Australian Government Statistical Clearing House Approval Number 02417 – 02.
This Centre for Workplace Leadership Study of Australian Leadership is supported by the Australian Government through the Department of Employment.
Executive Summary iWhy leadership must change now iKey findings from the Study of Australian Leadership viChapter Summaries ix
1 The Study of Australian Leadership 11.1 Introduction 11.2 The Study of Australian Leadership project 41.3 What we asked 61.4 This report 8
2 Why leadership at work is important 92.1 What is leadership? 92.2 Leadership tasks 132.3 Why leadership matters 15
3 How Australian workplaces are performing 173.1 Measuring workplace performance 173.2 Success in meeting performance targets 193.3 Overall target attainment score 213.4 Separating high and low performers 233.5 How workplace performance relates to
employee outcomes 26
4 A profile of senior leaders in Australian organisations 274.1 Demographic profile of senior leaders 274.2 The ageing of senior leadership
in Australian organisations 304.3 The gender representation gap
in senior leadership roles 314.4 Educational qualifications of leaders 334.5 Ethnic and cultural diversity among leaders 37
5 Future leadership challenges 395.1 Identifying future challenges 395.2 Information seeking:
strategic advice 415.3 Sensegiving: current challenges 455.4 Sensegiving: future challenges 47
6 Leadership and management fundamentals 516.1 Leadership versus management: is there a difference? 536.2 Management practices:
the Bloom and Van Reenen inventory 556.3 Management practices in Australian workplaces 576.4 Management practices and workplace outcomes 60
7 Leading people – the diffusion of high performance work practices 617.1 What are high performance work practices? 617.2 Measures of high performance work practices 637.3 Prevalence of practices 657.4 Workplace characteristics and high
performance work practices 677.5 Where to from here? 70
8 Leading innovation 718.1 The innovation challenge 718.2 Australia’s innovation record 738.3 Innovation in Australian organisations
– findings from SAL 758.4 Innovation and performance 778.5 Leadership and the innovation challenge 78
9 Frontline leadership and employee outcomes 819.1 Profile of frontline leaders 839.2 Frontline leadership effectiveness in
Australian workplaces 899.3 Frontline leadership effectiveness and
employee outcomes 91
10 Developing leaders for the future 9310.1 What type of leadership development is
conducted in Australian workplaces? 9610.2 Do leadership development activities relate
to leadership effectiveness? 9810.3 Do leadership development activities differ
in low- vs. high-performing workplaces? 9910.4 Do leadership development activities relate
to workplace outcomes? 101
References 103
Technical Appendix 107
Contents
Executive Summary
Why leadership must change nowFuelled by the resources boom, the Australian economy has enjoyed an unprecedented 25 years of economic growth, more than doubling in real terms over that period. But, now, the Australian economy is slowing. Productivity is sluggish, employment growth is weakening, and consumer confidence is faltering. Many economists are now predicting an extended period of slow economic growth and recovery.
Organisations need to adapt and adjust to this unfolding reality, improve productivity and reduce costs. However, this is just one of a number of critical challenges that Australia faces. Slower economic growth globally has intensified competitive pressures. The rate of technological change is accelerating and is having increasingly disruptive consequences. Automation is destroying jobs at a faster pace and is beginning to hollow out middle-skill jobs across sectors as diverse as manufacturing, professional services and financial services. Technological advances are leading to an unprecedented rate of innovation in products and services, creating new sources of competitive pressure – as well as enormous potential for future growth, profitability and cost reduction. Technology is spawning a new class of business models, which are disrupting established ways of working and doing business – from Uber in the taxi industry, AirBnB in accommodation services, and the emerging FinTech sector, to the spread of online training in education services and an array of service providers able to offshore increasingly complex work. At the same time, organisations have contended with a seismic shift in the competitive and regulatory environment - from competition policy and consumer protection, to the decentralisation of industrial relations and enterprise bargaining.
These fundamental changes in the way organisations organise and compete will impact Australian workplaces of all shapes and sizes – small and large, private and public, for-profit and not-for-profit, and across industries.
If Australia is to maintain national competitiveness and generate growth and jobs, organisations need to navigate through a phase of increased uncertainty and ambiguity, disruption and change. To survive, organisations need to innovate and adapt, and to develop new capabilities and new sources of growth.
A critical question is whether Australian organisational leaders are ready to meet these new challenges. Or whether the extended period of economic growth driven by the resources boom has made Australian organisational leaders complacent and unprepared for the future? Have Australian organisations invested adequately in their leadership and management capabilities to navigate through these complex and uncertain times? If not, will these various changes have adverse and lasting effects on future growth and prosperity? These questions have informed the surveys developed for this study.
Leadership at Work Do Australian leaders have what it takes?Page i

If Australia is to maintain national competitiveness
and generate growth and jobs, organisations
need to navigate through a phase of increased
uncertainty and ambiguity, disruption and change
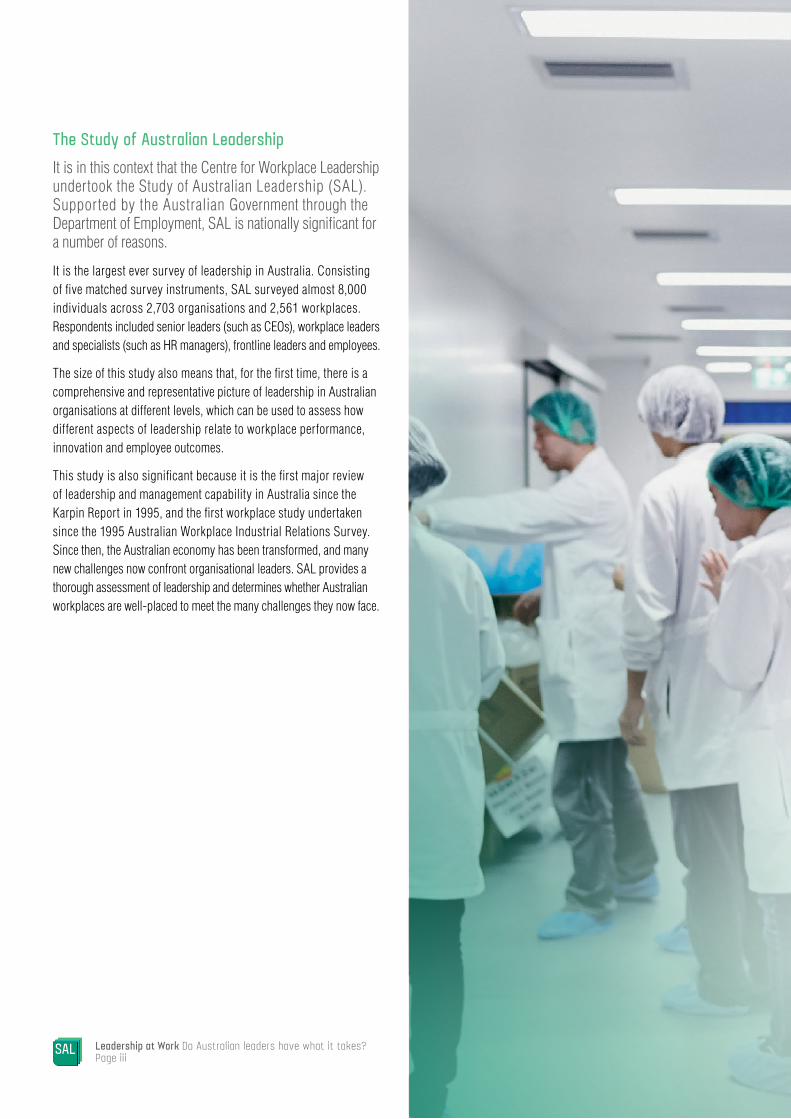
The Study of Australian LeadershipIt is in this context that the Centre for Workplace Leadership undertook the Study of Australian Leadership (SAL). Supported by the Australian Government through the Department of Employment, SAL is nationally significant for a number of reasons.
It is the largest ever survey of leadership in Australia. Consisting of five matched survey instruments, SAL surveyed almost 8,000 individuals across 2,703 organisations and 2,561 workplaces. Respondents included senior leaders (such as CEOs), workplace leaders and specialists (such as HR managers), frontline leaders and employees.
The size of this study also means that, for the first time, there is a comprehensive and representative picture of leadership in Australian organisations at different levels, which can be used to assess how different aspects of leadership relate to workplace performance, innovation and employee outcomes.
This study is also significant because it is the first major review of leadership and management capability in Australia since the Karpin Report in 1995, and the first workplace study undertaken since the 1995 Australian Workplace Industrial Relations Survey. Since then, the Australian economy has been transformed, and many new challenges now confront organisational leaders. SAL provides a thorough assessment of leadership and determines whether Australian workplaces are well-placed to meet the many challenges they now face.
Leadership at Work Do Australian leaders have what it takes?Page iii

8,000
2,703
2,561
For the first time, there is a comprehensive and representative picture of leadership in Australian organisations at different levels
organisations
workplaces
individuals
Key findings from the Study of Australian LeadershipThe impact of leadership and management on performanceSAL specifically addresses the global debate about the impact of leadership and management on performance. The findings show the significance of leadership and management in shaping Australia’s future performance and prosperity, as well as what behaviours and forms of training are most effective.
Specifically, the findings show:
1. Leadership matters in different ways at different levels of the organisation SAL confirms that the role leaders play varies considerably at different levels of any organisation. At the most senior organisational level, leaders play a critical role in scanning their external environment, making sense of the many factors likely to influence the competitive position of their organisation. At the workplace level, leaders have a critical role in building and maintaining efficient operations to meet targets and improve performance. Frontline leadership matters most for employees, shaping the experience of work and creating a positive climate for innovation and performance.
2. Leadership and management matter for workplace performance Leadership matters for performance in a number of ways. Leadership drives the development of core organisational capabilities associated with meeting and exceeding targets, performance relative to competitors and profitability.
3. Leadership and management matter for innovation Innovation is a critical source of productivity growth and competitiveness. SAL shows that workplaces with more capable leaders are more innovative – regarding both incremental and radical innovation performance. It also confirms the importance of innovation for business performance.
4. Leadership and management matter for employee engagement and talent management One of the main reasons why leadership matters is because it influences employee attitudes and behaviours. Positive attitudes and behaviours translate into greater productivity and employee creativity. SAL shows that leadership capability and efficacy are related to a range of employee outcomes, including: employee engagement, voice, creating a culture of learning and innovation, trust and intentions to quit.
5. Investment in leadership capability pays Investing in leadership matters for leader self-efficacy (a leader’s belief in their ability to lead) and leadership capabilities. Workplaces that invest in a range of leadership development activities have more capable leaders with a stronger belief in their ability to do the job. Both of these factors are associated with better performance and more innovation.
Executive Summary Page vi

Radical innovation or incremental innovation?Radical innovation relates to creating products and services that go beyond what is expected by existing customers and includes experimentation and a focus on new opportunities, new markets or new ways of bringing products and services to the market.
Incremental innovation relates to refining and improving existing products and services. With incremental innovation, the focus of development is often on improving efficiency, increasing economies of scale (i.e. reducing costs) and expanding existing markets.

Significant gaps and weaknesses in Australia’s leadership and management SAL also reveals that Australian organisations should be concerned about the state of leadership and management capability. The findings reveal a pattern of mediocre leadership in many organisations that will likely impair their capacity to shift to a knowledge economy and impede their efforts to raise productivity.
Seven gaps and weaknesses stand out as areas of concern, painting a worrying picture of the ability of Australian organisations to address future challenges:
1. Many Australian workplaces are underperforming A significant proportion of Australian workplaces – more than 40% – are not meeting their performance targets for return on investment and profitability. Around one-third of workplaces underperform against their sales targets.
2. Many Australian organisations do not get the basics right Many leaders and managers are not mastering basic management fundamentals such as performance monitoring, target setting and the appropriate use of incentives. Mastery of these is important for improved performance and better employee outcomes, above and beyond leadership capabilities and self-efficacy.
3. Few Australian organisations report high levels of innovation Innovation drives growth and productivity. Yet most organisations struggle to turn knowledge and ideas into successful innovations. Too few (18%) private sector organisations report high levels of radical innovation. Surprisingly, public sector organisations were more likely than private sector organisations to have reported high levels on both types of innovation. However, findings show those organisations that do innovate successfully achieve superior performance outcomes.
4. Many Australian leaders are not well-trained for the job Formal qualifications are not everything, but formal training provides a foundation for the diverse skills associated with leadership – from technical skills to solving problems and managing change. One in four senior leaders in private sector organisations has no formal training beyond secondary school. The same goes for majority Australian-owned, and small or medium-sized organisations.
5. Too many Australian organisations underinvest in leadership development, especially at the frontline SAL shows that investing in leadership development is positively associated with leader capabilities and self-efficacy, which in turn significantly betters workplace performance and innovation. Yet the findings reveal that many workplaces do not invest in leadership development at all, or invest very little. Those that do invest in leadership development often spend in the wrong places. SAL shows that investing in workplace and frontline leaders can be effective in improving performance through better employee outcomes and driving innovation. But recent evidence for the Asia-Pacific region (including Australia) shows that for every $10 spent on senior leaders, only $1 is spent on frontline leaders.
6. Leadership in Australian organisations does not reflect wider social diversity Diversity can be good for business performance. It can lead to greater creativity and innovation, improvements in productivity, as well as higher employee commitment and engagement at work. Yet senior leadership in Australian organisations is dominated by older men from English-speaking backgrounds. Women, younger leaders, and leaders from non-English speaking backgrounds are under-represented when compared to their numbers in the broader population.
7. Many senior leaders do not draw on strategic advice in making decisions about the future Senior leaders play a critical role in scanning the external environment and making sense of how external challenges are likely to influence the organisation. Leaders cannot do this in isolation; they require multiple sources of advice and information. Yet, the evidence presented in this report shows that few senior leaders seek advice from external sources, such as associations, consultants, experts, or other senior leaders in their industry or elsewhere. This leaves their organisations vulnerable to poor strategic insight and decision-making, especially in the current environment marked by disruption and uncertainty.
Executive Summary Page viii
Chapter SummariesChapter 1 The Study of Australian LeadershipThis chapter describes the methodology behind the Study of Australian Leadership, and what is covered in this initial findings report.
Chapter 2 Why leadership at work is importantThis chapter places SAL in the broader context of what is known about the role and importance of leadership in organisations. Experts and scholars struggle to find a shared definition of leadership. The chapter discusses different approaches and defines leadership as ‘the process of influencing others to understand and agree about what needs to be done and how to do it, and the process of facilitating individual and collective efforts to accomplish shared objectives.’ SAL differentiates between three levels of leaders: senior leaders, workplace leaders and frontline leaders. It also compares three cohorts of leaders at each of these levels: young leaders, prime-age leaders and ageing leaders.
The report examines the critical role leaders play in Australian workplaces and in determining whether an organisation is able to meet the challenges of a dynamic and competitive environment. It shows the leader’s impact on an organisation’s ability to meet its performance targets and the links with employee attitudes and behaviours, such as intention to quit, trust, organisational commitment, employee engagement and creativity.
Chapter 3 How Australian workplaces are performingSAL gathered extensive information on workplace performance, including workplace leaders’ perceptions of their performance and objective financial data to provide insights into differences in performance. This chapter describes the attributes that set high performing workplaces apart and provides evidence about the link between workplace performance and employee outcomes. Performance is calculated using a unique measure, OTAS-9 - a nine-item scale that creates an ‘overall target attainment score’ for each workplace. The chapter compares high and low performers across industries, sectors, and types of organisations and then examines the particular attributes that separate these two categories of performers. It also reports on how employee perceptions and workplace performance outcomes are related.
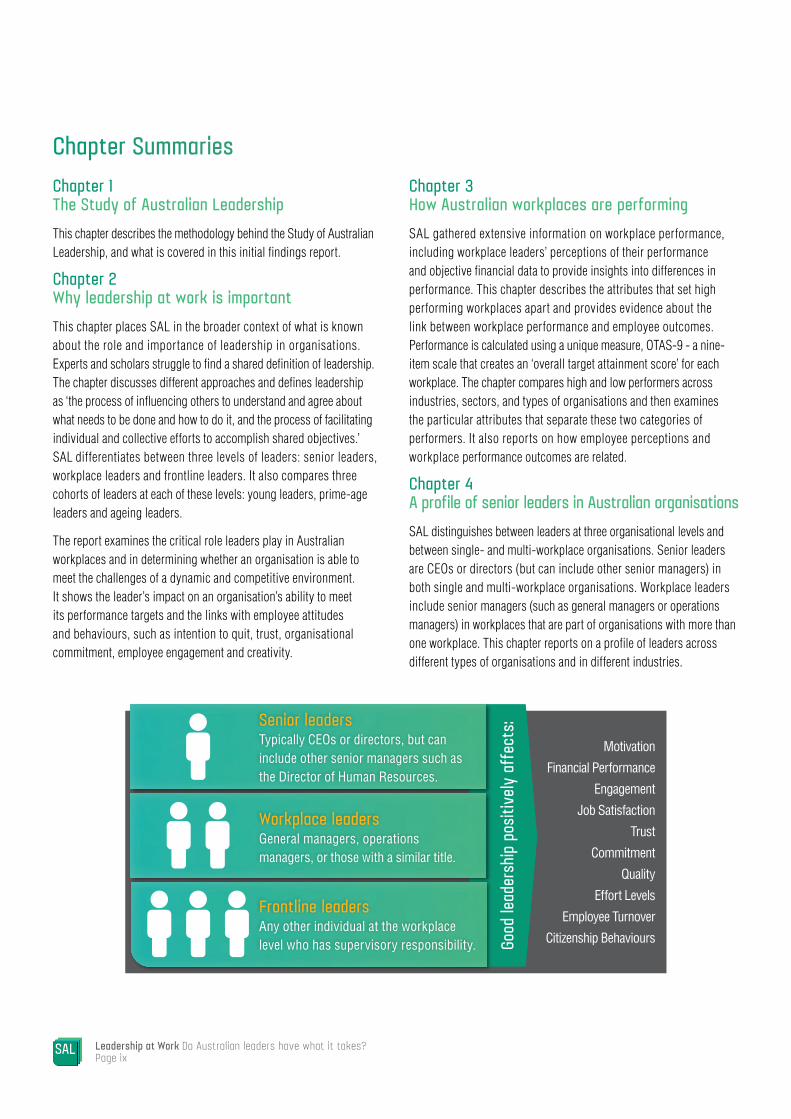
Chapter 4 A profile of senior leaders in Australian organisationsSAL distinguishes between leaders at three organisational levels and between single- and multi-workplace organisations. Senior leaders are CEOs or directors (but can include other senior managers) in both single and multi-workplace organisations. Workplace leaders include senior managers (such as general managers or operations managers) in workplaces that are part of organisations with more than one workplace. This chapter reports on a profile of leaders across different types of organisations and in different industries.
Senior leaders Typically CEOs or directors, but can include other senior managers such as the Director of Human Resources.
Workplace leaders General managers, operations managers, or those with a similar title.
Frontline leaders Any other individual at the workplace level who has supervisory responsibility.
Motivation
Financial Performance
Engagement
Job Satisfaction
Trust
Commitment
Quality
Effort Levels
Employee Turnover
Citizenship BehavioursGood
lead
ersh
ip po
sitive
ly af
fect
s:
Leadership at Work Do Australian leaders have what it takes?Page ix
Chapter 5 Future leadership challengesSenior leaders were asked to identify the most significant challenges facing their organisation over the next five years, and how they are responding to them. This chapter identifies key challenges and the ways that senior leaders source advice in making critical decisions and developing strategies to respond to these challenges.
Chapter 6 Leadership and management fundamentalsEffective leadership requires the mastery of certain fundamentals of management, including performance monitoring, target-setting, and the appropriate use of incentives. The findings presented in this chapter show that Australian workplaces have significant room for improvement across all these areas. They also confirm that workplaces with better fundamental management systems and practices experience improved workplace performance and employee outcomes, above and beyond other leadership factors.
Chapter 7 Leading people – the diffusion of high performance work practicesThis chapter explores how Australian organisations deploy HR and work practices associated with better performance. It shows work practices that improve performance are diffused across a significant proportion of workplaces. However, the take-up of these practices varies according to industry and workplace characteristics.
Chapter 8 Leading innovationAlthough innovation drives growth and productivity, the evidence shows that Australian organisations struggle to turn knowledge and ideas into successful innovation. This chapter reports on which work practices are associated with the capacity to innovate. It shows how leadership capability creates these conditions, and why improving leadership and management capability is an imperative for innovation.
Chapter 9 Frontline leadership and employee outcomesThis chapter profiles frontline leaders in Australian organisations and reports on employee perceptions of frontline leader effectiveness. It then examines the relationship between the capabilities of frontline leaders and outcomes for employees and performance.
Chapter 10 Developing leaders for the futureThe number of leadership development programs has risen markedly over the past decade, and the annual spend on leadership development has also increased substantially. This chapter reports on how various types of leadership development programs affect employee and workplace outcomes, and provides suggestions around how organisations should invest in leadership development for the future.
Executive Summary Page x

Leadership at Work Do Australian leaders have what it takes?Page 1
1 The Study of Australian Leadership
1.1 IntroductionThe Study of Australian Leadership (SAL) is the first in 20 years to ask whether Australia has the leadership capability to meet future challenges. To do so, SAL looks in detail at the relationship between leadership and organisational performance.
SAL is the first major leadership study since 1991, when the Australian Government commissioned a report into the quality of leadership and management in Australian business organisations. Chaired by David Karpin, the commissioned Taskforce presented its final report to government in 1995. Although SAL takes a different approach to evidence gathering, it in effect seeks to address a similar question to Karpin’s report: whether Australia’s organisational leaders have the requisite skills and capabilities to meet the challenges of the twenty-first century.
The Karpin Report, called Enterprising Nation, focused on whether Australian management could meet the challenges associated with the marked rise of the developing economies of Asia – dubbed the ‘Asian Century’ – and the gradual shift in the world’s economic centre of gravity from Western Europe and North America to Asia.
The Asian Century posed many challenges for Australian businesses, most of which remained dependent on domestic markets and insulated from global competition. The Asian Century also created many new opportunities for growth and expansion. The Karpin Report implored Australian business leaders to take advantage of these new opportunities.
To adapt to this new environment, the report concluded, required a marked improvement in the general quality of leadership and management (Karpin, 1995: xiv-xv):
'Australian management must improve significantly in the next decade if enterprises expect to even meet today’s world best practice standards. There are only a few enterprises meeting these standards, and the best Australian managers are equal to the best in the world. However, the evidence… clearly indicates that the majority of Australia’s managers do not have the education or skill levels of those of the major trading nations.'
In the view of the Karpin Taskforce, few businesses had invested in the leadership and management capabilities associated with best practice. The gap between existing capabilities and best practice existed across sectors and businesses of every size.
SAL asks the same question in today’s very different context. While the challenges associated with our economic integration into the growing Asian region are significant, it is now just one of many challenges that businesses in Australia face as they negotiate a rapidly evolving environment characterised by disruption, uncertainty and complexity (Clayton & Overdorf, 2000).
This complexity and ambiguity is wrought by several factors. More than ever, the Australian economy is integrated into the global economy through the flow of goods and services, capital, technology and people. Our economic prospects depend on fluctuations in the world economy and Australian-based businesses face the continued growth of competition, at home and abroad. Australia is at the forefront of expanding trade through bilateral trade agreements with the United States, Japan and, more recently, China. In 2016, Australia was a signatory to the Trans-Pacific Partnership – or TPP – which creates new trade opportunities with other Pacific nations1.
1 For details, see dfat.gov.au/trade/agreements/tpp/pages/trans-pacific-partnership-agreement-tpp.aspx.

Chapter 1 The Study of Australian Leadership Page 2
Whilst the challenges associated with Australia’s
economic integration into the growing Asian region remain
significant, it is only one of a larger number of significant
challenges that Australian businesses now face
Leadership at Work Do Australian leaders have what it takes?Page 3
New technologies are having pervasive effects across industries – accelerating the rate of innovation, enabling new business models and integrating global value chains, as well as creating new industries and occupations, and destroying or transforming old ones. It is difficult to conceive from today’s vantage point, but at the time the Karpin Taskforce undertook its investigation, the internet was in its early stages of development. Few businesses had access to the internet or viewed it as critical to their future survival. An ageing population and changing social values are also changing the way people work and their preferences around work and life. Gender roles continue to change and the workforce is increasingly diverse in many ways.
Of the many ways we will respond to these challenges, improving leadership and management is one of the most important. The quality of leadership is a critical factor in enabling organisations to understand complex problems, adapt, grow and compete. It requires, for example, new approaches to strategic planning, locating new market opportunities, and the ability to adapt and innovate, and to motivate and engage a diverse workforce. It requires a re-investment in the skills and capabilities of leaders and managers at every level of organisations to increase existing skills and develop new ones that support innovation and adaptation. SAL asks and answers the critical question of whether our leaders and managers can meet these challenges.
Chapter 1 The Study of Australian Leadership Page 4
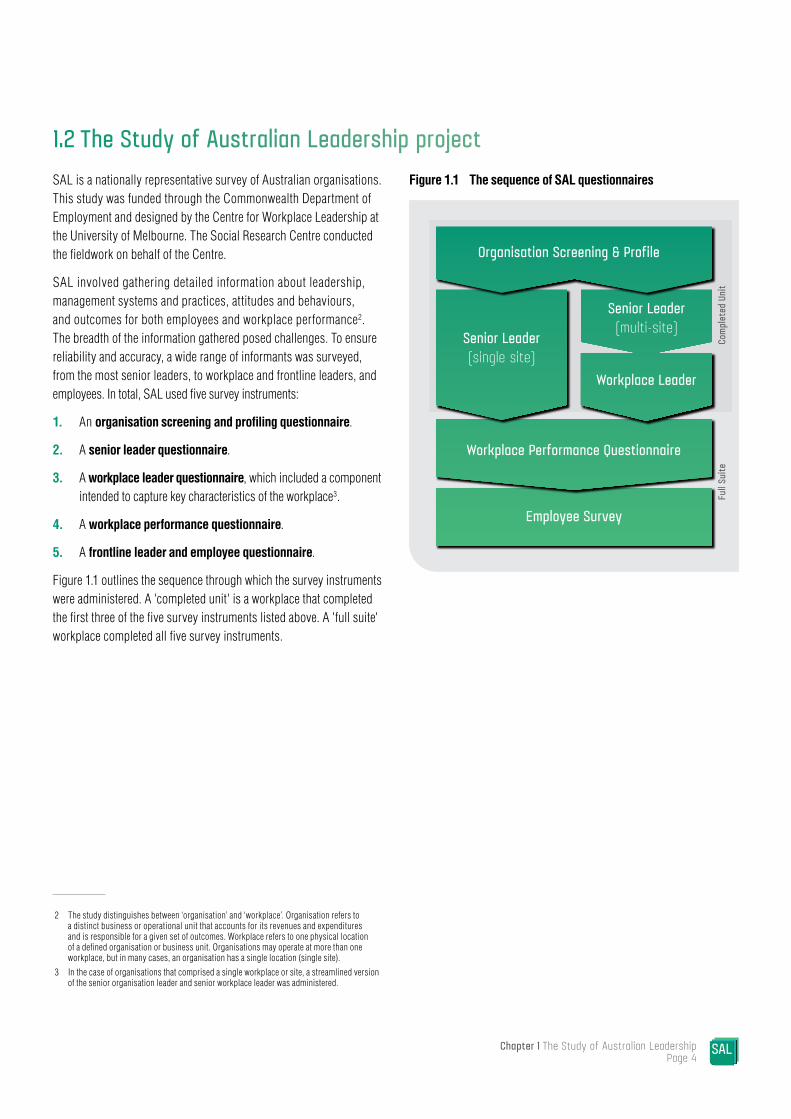
1.2 The Study of Australian Leadership projectSAL is a nationally representative survey of Australian organisations. This study was funded through the Commonwealth Department of Employment and designed by the Centre for Workplace Leadership at the University of Melbourne. The Social Research Centre conducted the fieldwork on behalf of the Centre.
SAL involved gathering detailed information about leadership, management systems and practices, attitudes and behaviours, and outcomes for both employees and workplace performance2. The breadth of the information gathered posed challenges. To ensure reliability and accuracy, a wide range of informants was surveyed, from the most senior leaders, to workplace and frontline leaders, and employees. In total, SAL used five survey instruments:
1. An organisation screening and profiling questionnaire.
2. A senior leader questionnaire.
3. A workplace leader questionnaire, which included a component intended to capture key characteristics of the workplace3.
4. A workplace performance questionnaire.
5. A frontline leader and employee questionnaire.
Figure 1.1 outlines the sequence through which the survey instruments were administered. A 'completed unit' is a workplace that completed the first three of the five survey instruments listed above. A 'full suite' workplace completed all five survey instruments.
2 The study distinguishes between ‘organisation’ and ‘workplace’. Organisation refers to a distinct business or operational unit that accounts for its revenues and expenditures and is responsible for a given set of outcomes. Workplace refers to one physical location of a defined organisation or business unit. Organisations may operate at more than one workplace, but in many cases, an organisation has a single location (single site).
3 In the case of organisations that comprised a single workplace or site, a streamlined version of the senior organisation leader and senior workplace leader was administered.
Figure 1.1 The sequence of SAL questionnaires
Employee Survey
Workplace Performance Questionnaire
Comp
lete
d Un
itFu
ll Su
ite
Organisation Screening & Profile
Senior Leader(single site)
Senior Leader(multi-site)
Workplace Leader
Leadership at Work Do Australian leaders have what it takes?Page 5
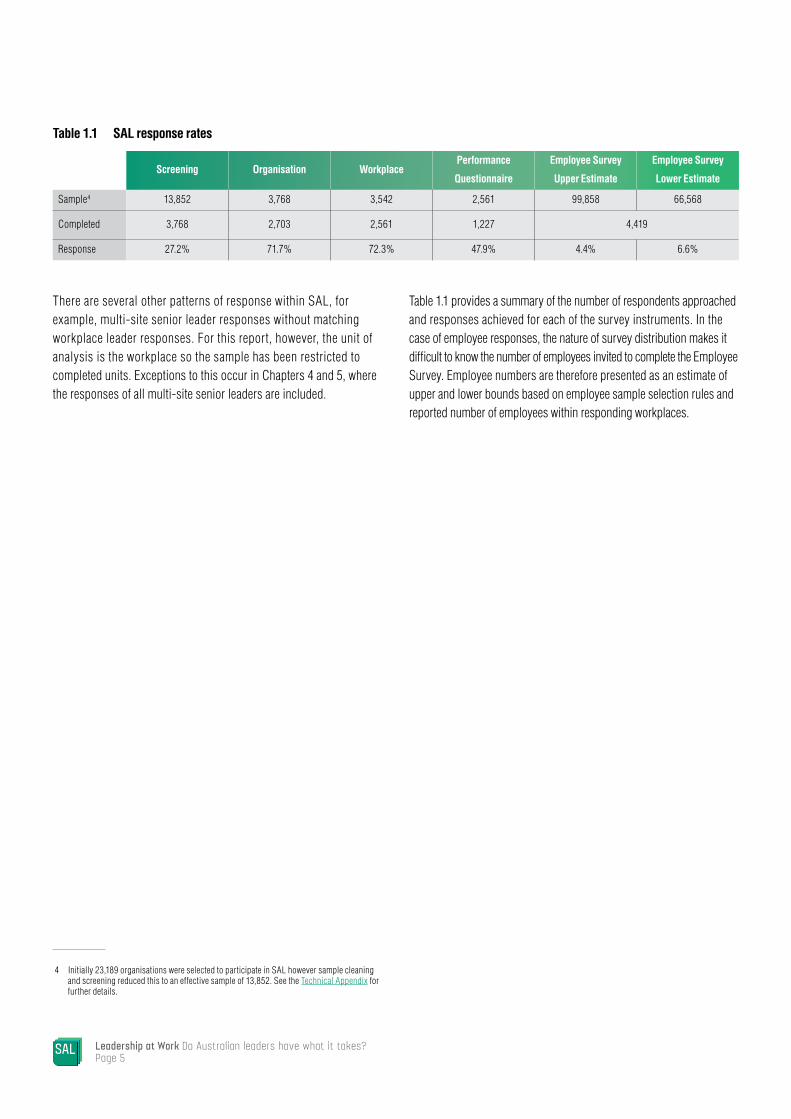
Table 1.1 SAL response rates
Screening Organisation WorkplacePerformance
Questionnaire
Employee Survey
Upper Estimate
Employee Survey
Lower Estimate
Sample4 13,852 3,768 3,542 2,561 99,858 66,568
Completed 3,768 2,703 2,561 1,227 4,419
Response 27.2% 71.7% 72.3% 47.9% 4.4% 6.6%
There are several other patterns of response within SAL, for example, multi-site senior leader responses without matching workplace leader responses. For this report, however, the unit of analysis is the workplace so the sample has been restricted to completed units. Exceptions to this occur in Chapters 4 and 5, where the responses of all multi-site senior leaders are included. 4
4 Initially 23,189 organisations were selected to participate in SAL however sample cleaning and screening reduced this to an effective sample of 13,852. See the Technical Appendix for further details.
Table 1.1 provides a summary of the number of respondents approached and responses achieved for each of the survey instruments. In the case of employee responses, the nature of survey distribution makes it difficult to know the number of employees invited to complete the Employee Survey. Employee numbers are therefore presented as an estimate of upper and lower bounds based on employee sample selection rules and reported number of employees within responding workplaces.

Chapter 1 The Study of Australian Leadership Page 6
1.3 What we askedEach survey instrument sought to capture information about the role of leaders and managers at different levels of the organisation – senior, workplace, and frontline. They contained common questions, as well as questions asked only of respondents at each level.
Senior leader questionnaireThe first survey questionnaire targeted the organisation’s chief executive officer, director, or senior leader with substantial decision-making responsibility and authority. This group of senior leaders was asked to provide a profile of organisation characteristics, such as the number of employees, industry, age, sector and ownership. These items determined whether the organisation was ‘in scope’ for the survey5.
Senior leaders were then asked about:
» Key characteristics of the external operating environment their organisation faced.
» The degree to which the organisation had the appropriate systems and practices to respond to challenges.
» The constraints they faced in responding to external challenges.
» Personal and organisational networks used to gain critical insight into their external environment and strategy development.
» Future challenges faced by the organisation.
» The extent to which the organisation was orientated towards adapting to the external market or environment within which they operated.
» An assessment of their own leadership capability and satisfaction in their role.
» A series of demographic questions about themselves.
The initial organisation screening and profiling questions were asked via a telephone interview. Senior leaders could then complete the remainder of the survey by phone or online. Of those that completed the survey, 18% did so online.
5 Organisations with less than 5 employees or those organisations that operated in Agriculture, Forestry or Fisheries were deemed out of scope and no further questions were asked. The remaining in-scope organisations were then invited to continue in the survey. In multi-site organisations the same criteria applied to workplaces.
Workplace leader questionnaireFor organisations operating more than a single workplace or site, workplace leaders – typically the general manager or director of the workplace – were asked to complete a separate survey.
The workplace leader was asked to profile their workplace, providing details such as age of workplace and composition of workforce divided across gender and labour force status and then asked a range of questions related to:
» The nature of the human resources strategy and associated practices implemented at the workplace.
» Capabilities to learn from and respond to a changing operating environment.
» An assessment of the capabilities of their frontline leaders.
» The nature of leadership development programs available at the workplace.
» An assessment of their own leadership capabilities.
» A series of demographic questions about themselves.
Within each workplace, individuals were nominated to complete the Performance Questionnaire and to distribute the Employee Survey. In most cases, the workplace leader self-nominated for these tasks: 66% self-nominated to complete the Performance Questionnaire, and 70% self-nominated to distribute the Employee Survey. Like the senior leader, the workplace leader had the option to complete the questionnaire by phone or online. Sixteen percent of respondents completed the survey online.
Leadership at Work Do Australian leaders have what it takes?Page 7
Frontline leaders and employees questionnaireFrontline leaders and employees were surveyed using a common instrument, which included additional items for frontline leaders. Respondents to this questionnaire completed the survey online, but had the option of receiving a hard copy of the survey to complete6. Five percent of respondents completed this questionnaire as a hard copy survey.
This questionnaire asked respondents about:
» Their perceptions of human resources practices and how they were applied.
» Employee engagement.
» Organisational and leadership climate of the workplace.
» The culture for engaging in learning and innovation.
» The extent to which conflict was a feature of relationships between employees and within teams.
» The different types of employee voice and opportunities to participate in decision-making.
» Their intention to quit.
» A series of demographic questions about themselves.
In the case of frontline leaders – defined as individuals with line management or supervisory responsibilities within the workplace – additional questions were asked about:
» Their self-assessment of their leadership capabilities (leader self-efficacy).
» Assessment of competence of individuals that reported to them.
6 All employees in small and medium workplaces were invited to complete the Employee Survey; larger workplaces (200+ employees) could choose to invite all employees or a 20-25% sample. Instructions for randomly sampling were provided. Further details are available in the Technical Appendix.
Workplace performance questionnaireRespondents completing the Performance Questionnaire provided information about the workplace’s performance across a range of measures. Where practical, respondents provided details for the 2013-14 financial year. The questionnaire asked for information about:
» Revenues.
» Expenditures on wages and research and development.
» Profitability.
» Setting and achievement of performance targets.
» Workplace performance relative to competitors in their industry.
» Innovation.
» A variety of management practices.
Respondents were asked to complete the Performance Questionnaire as an online survey, with the option of completing it as a telephone survey. Three percent of respondents asked to complete it as a telephone interview.
Chapter 1 The Study of Australian Leadership Page 8
1.4 This reportThis report provides the initial findings from SAL. Not all questions asked in these surveys are reported on here, and the analysis presented is descriptive in orientation. The report uses the data to provide a comprehensive profile of leaders working in Australian organisations. It also explores the relationships between the attributes of organisations and their leaders, performance outcomes and employee attitudes.
The information in each chapter has been aggregated to a national level using a weighting design. The details of this design can be found in the Technical Appendix.
This first presentation of SAL data intentionally focuses on describing the frequency and nature of the responses collected. The following chapters reveal possible links between leadership, management and performance. Further scrutiny will be given to each topic in the coming months to determine causal relationships. These additional studies will be available on the SAL website7. Researchers interested in collaborative research using SAL data are encouraged to connect with the Centre for Workplace Leadership.
7 workplaceleadership.com.au/sal
Why leadership at work is important
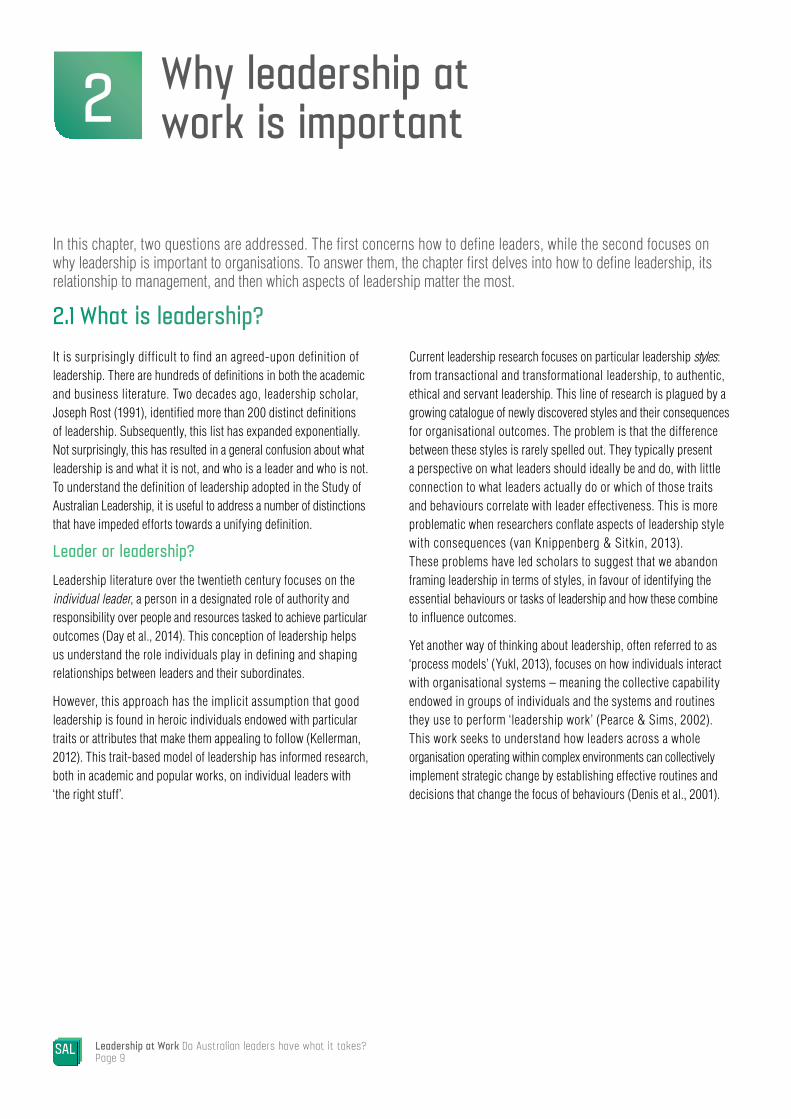
In this chapter, two questions are addressed. The first concerns how to define leaders, while the second focuses on why leadership is important to organisations. To answer them, the chapter first delves into how to define leadership, its relationship to management, and then which aspects of leadership matter the most.
2.1 What is leadership?It is surprisingly difficult to find an agreed-upon definition of leadership. There are hundreds of definitions in both the academic and business literature. Two decades ago, leadership scholar, Joseph Rost (1991), identified more than 200 distinct definitions of leadership. Subsequently, this list has expanded exponentially. Not surprisingly, this has resulted in a general confusion about what leadership is and what it is not, and who is a leader and who is not. To understand the definition of leadership adopted in the Study of Australian Leadership, it is useful to address a number of distinctions that have impeded efforts towards a unifying definition.
Leader or leadership?Leadership literature over the twentieth century focuses on the individual leader, a person in a designated role of authority and responsibility over people and resources tasked to achieve particular outcomes (Day et al., 2014). This conception of leadership helps us understand the role individuals play in defining and shaping relationships between leaders and their subordinates.
However, this approach has the implicit assumption that good leadership is found in heroic individuals endowed with particular traits or attributes that make them appealing to follow (Kellerman, 2012). This trait-based model of leadership has informed research, both in academic and popular works, on individual leaders with ‘the right stuff’.
Current leadership research focuses on particular leadership styles: from transactional and transformational leadership, to authentic, ethical and servant leadership. This line of research is plagued by a growing catalogue of newly discovered styles and their consequences for organisational outcomes. The problem is that the difference between these styles is rarely spelled out. They typically present a perspective on what leaders should ideally be and do, with little connection to what leaders actually do or which of those traits and behaviours correlate with leader effectiveness. This is more problematic when researchers conflate aspects of leadership style with consequences (van Knippenberg & Sitkin, 2013). These problems have led scholars to suggest that we abandon framing leadership in terms of styles, in favour of identifying the essential behaviours or tasks of leadership and how these combine to influence outcomes.
Yet another way of thinking about leadership, often referred to as ‘process models’ (Yukl, 2013), focuses on how individuals interact with organisational systems – meaning the collective capability endowed in groups of individuals and the systems and routines they use to perform ‘leadership work’ (Pearce & Sims, 2002). This work seeks to understand how leaders across a whole organisation operating within complex environments can collectively implement strategic change by establishing effective routines and decisions that change the focus of behaviours (Denis et al., 2001).
Leadership at Work Do Australian leaders have what it takes?Page 9
2

It is surprisingly difficult to find an agreed-upon definition of leadership
This approach is more insightful because collaborative, team-based work has become more pervasive, and individuals play a lesser role in shaping the behaviours of others. Acts of leadership are more widely distributed; they require co-ordination, through organisational systems, to make sense of external environments, internalise the resulting knowledge, and translate it into action that supports strategy (Krogh et al., 2012). In this context, followers are not merely ‘recipients’ of leadership – a more traditional approach to thinking about leadership. Rather, followers are ‘co-producers’ of leadership in a more complex set of interactions between formally-designated leaders and their followers, and among followers working interdependently (in teams) with each other (Jackson and Parry, 2008; Dennis et al., 2012). This work also relies heavily on evidence around what we know leaders do, and is less concerned with the question of what we think leaders ideally ought to be and do.
For the purposes of this study, leadership encompasses both the individual and collective (including organisational) aspects described above. This enables us to capture how leadership works at different levels of the organisation – at the senior level, and the workplace and frontline levels. Interactions between leaders at these different levels are an important, but often ignored, aspect of leadership within organisations, especially at the frontline level (DeChurch et al., 2010).
Leadership versus managementAn enduring question in the leadership literature is whether it is useful to distinguish between ‘management’ and ‘leadership’. In the classic outline of what managers do, Fayol (1929) identified the following primary functions of management: planning, organising, commanding, co-ordinating and controlling. From this perspective, management is bound up with the authority invested in the role.
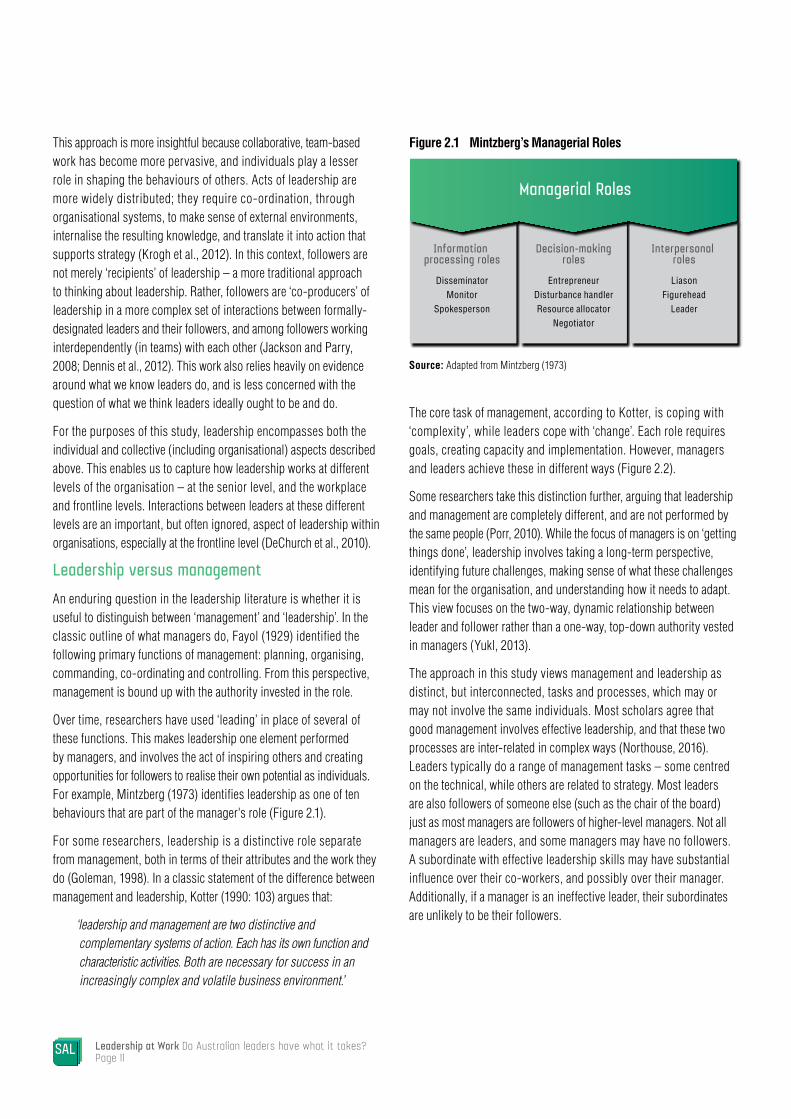
Over time, researchers have used ‘leading’ in place of several of these functions. This makes leadership one element performed by managers, and involves the act of inspiring others and creating opportunities for followers to realise their own potential as individuals. For example, Mintzberg (1973) identifies leadership as one of ten behaviours that are part of the manager's role (Figure 2.1).
For some researchers, leadership is a distinctive role separate from management, both in terms of their attributes and the work they do (Goleman, 1998). In a classic statement of the difference between management and leadership, Kotter (1990: 103) argues that:
‘leadership and management are two distinctive and complementary systems of action. Each has its own function and characteristic activities. Both are necessary for success in an increasingly complex and volatile business environment.’
Figure 2.1 Mintzberg’s Managerial Roles
Information processing roles
DisseminatorMonitor
Spokesperson
Decision-makingroles
EntrepreneurDisturbance handlerResource allocator
Negotiator
Interpersonal roles
LiasonFigurehead
Leader
Managerial Roles
Source: Adapted from Mintzberg (1973)
The core task of management, according to Kotter, is coping with ‘complexity’, while leaders cope with ‘change’. Each role requires goals, creating capacity and implementation. However, managers and leaders achieve these in different ways (Figure 2.2).
Some researchers take this distinction further, arguing that leadership and management are completely different, and are not performed by the same people (Porr, 2010). While the focus of managers is on ‘getting things done’, leadership involves taking a long-term perspective, identifying future challenges, making sense of what these challenges mean for the organisation, and understanding how it needs to adapt. This view focuses on the two-way, dynamic relationship between leader and follower rather than a one-way, top-down authority vested in managers (Yukl, 2013).
The approach in this study views management and leadership as distinct, but interconnected, tasks and processes, which may or may not involve the same individuals. Most scholars agree that good management involves effective leadership, and that these two processes are inter-related in complex ways (Northouse, 2016). Leaders typically do a range of management tasks – some centred on the technical, while others are related to strategy. Most leaders are also followers of someone else (such as the chair of the board) just as most managers are followers of higher-level managers. Not all managers are leaders, and some managers may have no followers. A subordinate with effective leadership skills may have substantial influence over their co-workers, and possibly over their manager. Additionally, if a manager is an ineffective leader, their subordinates are unlikely to be their followers.
Leadership at Work Do Australian leaders have what it takes?Page 11

Source: Adapted from Kotter (1990)
The definition of leadership used in this studyThis study worked from a widely accepted definition of leadership drawn from Gary Yukl (2013: 23). He defines leadership as:
'…the process of influencing others to understand and agree about what needs to be done and how to do it, and the process of facilitating individual and collective efforts to accomplish shared objectives.'
This definition encompasses a broad range of tasks and processes intended to influence and motivate others at work. This includes influencing the organisation’s objectives and the ways to achieve these objectives, as well as building commitment to these objectives and getting work done. It also involves building group identity and cohesion through team and workplace culture (Yukl, 1989). Depending on the organisation’s approach to work,
these tasks may be bound to formal managerial responsibilities or distributed among peers who do not relate as manager and subordinate. It also encompasses the individuals and the systems in place that enable influence over tasks and processes to be widely distributed throughout the organisation.
The focus of this report is on the role of particular groups of leaders – those in formally designated roles of authority within organisations at three levels: senior, workplace and frontline. These individuals represent the core of an organisation’s leadership capability, but do not constitute it in entirety. Leadership may be exercised by those with no designated authority. However, to focus our inquiry, the role of these other types of leaders within organisations is not examined.
Figure 2.2 Management versus leadership
Managers
Leaders
Core responsibility Means of accomplishing the taskRole
Setting goals (monthly/annual) Establishing plans and budgets
Setting direction (longer term) Establishing a vision for the future
Managers
Leaders
Implementing the plan Organising and staffing through structure and jobs
Mobilising support for the vision Aligning people and communicating
Managers
Leaders
Accomplishing the plan Controlling and problem solving
Realising the vision Motivating and inspiring people to move in the right direction
Chapter 2 Why leadership at work is important Page 12

ConceptualHigh
Interpersonal
Technical
Frontline
Low
Workplace Senior
SKIL
L LE
VEL
REQU
IRED
LEADERSHIP LEVELSource: Adapted from Yukl (2013: 161)
2.2 Leadership tasksAs the definition above implies, it is difficult to specify exactly what leaders do. Specific tasks depend on the many ways in which leadership could be exercised.
A key concern of this study is to explore leadership tasks at different levels of the organisation: senior level, workplace level and frontline level. Within this schema, leadership tasks and processes are closely associated with formal management roles.
Whatever the level of leadership, the evidence suggests effective leaders exercise a range of conceptual, interpersonal and technical skills. The nature of the mix and level of skills required varies across different levels of leadership (Figure 2.3) according to the degrees of complexity, ambiguity, breadth, and time horizon of the issues.
Senior leaders require a broader range and higher level of skills than those at workplace and frontline levels. They face the complex tasks involved in strategic planning, liaising with external stakeholders (such as shareholders, unions, community representatives and governments), monitoring and making sense of the broad and often ambiguous
external environment, identifying new opportunities and risks, and deciding how these opportunities and risks should be approached.
Such tasks are strategic in nature (Shoemaker et al., 2013), and require high levels of conceptual, interpersonal and technical understanding of the organisation and its environment. Typically, senior leaders operate in a context of uncertainty and ambiguity, actively analysing the external environment (sensemaking), interpreting available information and its consequences for the organisation’s future, and setting direction for management and employees (sensegiving).
Workplace leaders face less ambiguity in the sense that they operate within the parameters of the senior leaders' strategic decisions. Leadership at the workplace level relies on interpersonal capabilities to establish coherent goals and coordinate activities across different units and teams. Workplace leaders also promote organisational culture and values, and influence frontline leaders and employees. The technical skills of workplace leaders play a significant role in translating strategy into systems and practices.
Figure 2.3 Leadership skills for different levels of management
Leadership at Work Do Australian leaders have what it takes?Page 13
Frontline leaders manage people and implement operations. They set individual goals and motivate others to ensure targets are met. Many frontline leaders also occupy technical roles, working closely with employees.
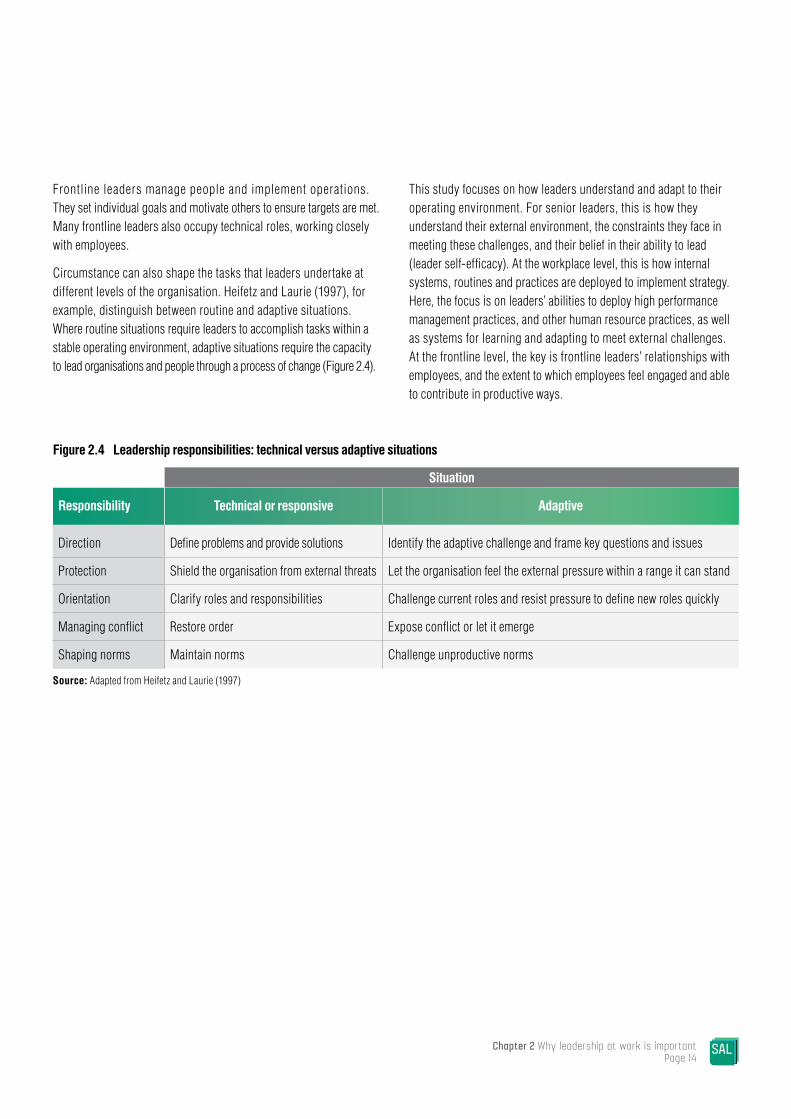
Circumstance can also shape the tasks that leaders undertake at different levels of the organisation. Heifetz and Laurie (1997), for example, distinguish between routine and adaptive situations. Where routine situations require leaders to accomplish tasks within a stable operating environment, adaptive situations require the capacity to lead organisations and people through a process of change (Figure 2.4).
This study focuses on how leaders understand and adapt to their operating environment. For senior leaders, this is how they understand their external environment, the constraints they face in meeting these challenges, and their belief in their ability to lead (leader self-efficacy). At the workplace level, this is how internal systems, routines and practices are deployed to implement strategy. Here, the focus is on leaders’ abilities to deploy high performance management practices, and other human resource practices, as well as systems for learning and adapting to meet external challenges. At the frontline level, the key is frontline leaders’ relationships with employees, and the extent to which employees feel engaged and able to contribute in productive ways.
Figure 2.4 Leadership responsibilities: technical versus adaptive situations
Situation
Responsibility Technical or responsive Adaptive
Direction Define problems and provide solutions Identify the adaptive challenge and frame key questions and issues
Protection Shield the organisation from external threats Let the organisation feel the external pressure within a range it can stand
Orientation Clarify roles and responsibilities Challenge current roles and resist pressure to define new roles quickly
Managing conflict Restore order Expose conflict or let it emerge
Shaping norms Maintain norms Challenge unproductive norms
Source: Adapted from Heifetz and Laurie (1997)
Chapter 2 Why leadership at work is important Page 14
2.3 Why leadership mattersAll research on organisational leadership seeks to understand why and how it matters. This area of research has proved contentious and difficult to draw definitive conclusions from.
Surprisingly, there are still few studies that provide concrete evidence on the link between leadership and organisational outcomes (DuBrin, 2013). Although the evidence indicates that leadership has important consequences for both employees and organisational outcomes (Avolio et al., 2009), it depends who, and over what issues, leadership is being exercised, as our discussion of the role of leaders at different levels would imply (Yukl, 2008). Many researchers have in fact suggested that leadership is becoming increasingly critical for organisational performance – especially the ability to innovate and adapt to a dynamic and external environment (Eisenhardt, 1989). However, others highlighted that the large investments made by organisations in leadership development may be misdirected – both in terms of the training content and the choice of leaders involved – and have limited impact on their effectiveness as leaders or on organisational performance (Pfeffer, 2015).
The traits and behaviours of individual leaders have been linked to a range of outcomes, including job satisfaction, motivation, trust, commitment, engagement and psychological empowerment, effort levels, citizenship behaviours, turnover, and creativity. Recent work explores ‘destructive leadership’, which arises where poor-quality relationships between leaders and followers result in negative consequences (Krasikova et al., 2013). These negative behaviours occur as an expression of resistance to leaders or retaliation to leadership practices perceived as harmful to employees.
Across a wide range of studies, leadership is found to have both positive and negative consequences for team dynamics and outcomes, including communication, learning, effectiveness, conflict and conflict resolution, and support for team creativity and emergent leaders (Morgeson et al., 2010).
At the organisational level, leadership is also linked to a range of outcomes, including productivity, innovation, customer satisfaction, quality and financial performance. These outcomes are found across different leadership styles and practices.
Despite the consistency of links between leadership and a wide range of positive and negative outcomes, the mechanisms that generate these outcomes are not well understood. This is partly due to problems with the ways leadership is measured, and is especially clear in studies examining links between leadership styles and various outcomes.
This study reports on the links between facets of leadership at the senior, workplace, and frontline levels, with different types of outcomes connected to leadership at each of these levels. At the senior leader level, the focus is on understanding the link between leadership and organisational performance. At the workplace level, leadership is closely linked to management systems and practices. In contrast, frontline leadership is expected to be associated with employee outcomes such as employee engagement, innovation and intentions to quit.
Leadership at Work Do Australian leaders have what it takes?Page 15
This study reports on the links between
facets of leadership at the senior, workplace,
and frontline levels, with different types of
outcomes connected to leadership at each
of these levels

3 How Australian workplaces are performing
The Study of Australian Leadership enables the most comprehensive examination of the relationship between workplace leadership and workplace performance in 20 years. This chapter reports on how Australian workplaces are performing. It looks at how performance varies according to fixed attributes of workplaces, such as industry, and other attributes that are able to be influenced by leaders, such as adaptability to market conditions. The analysis describes the distinctive attributes of high- and low-performing workplaces. Understanding how performance differs between workplaces is critical to assessing the role of leadership – at strategic, operational and frontline levels – in driving productivity growth and innovation.
3.1 Measuring workplace performanceTo find a valid and reliable performance measure for Australian workplaces, three important issues were considered:
» Inclusiveness: ‘Performance’ means different things for different workplaces. Sales and profits are relevant for commercial enterprises, but have little meaning for non-profit and government entities. SAL includes all types of workplaces. To generalise about Australian workplace performance, a measure is needed that includes the outcomes relevant in non-profit and government settings.
» Subjectivity: Some performance measures rely on rankings or assessments of change. For instance, leaders may be asked how their workplace performs when compared to competitors. Such measures depend on the quality of respondents’ information, which is difficult to assess. Workplace leaders may not know how well their competitors are performing in certain areas, such as customer satisfaction. Subjective performance measures are more reliable when information is available to respondents, and when there is a reasonable expectation that they are well-informed.
» Framing: Performance is complicated by expectations. This issue applies even when using quantifiable measures, such as sales. Imagine that Firm 1 increases its sales by 5% and Firm 2 by 3%. Firm 1 might be regarded as the superior performer. But what if Firm 1’s chief executive officer had forecast an 8% sales increase? Now, the 5% growth result seems disappointing. Performance metrics are more informative when they relate outcomes to expectations.
These considerations informed the assessment of workplace performance: the key measure used here is success in meeting targets. This is inclusive, as it encompasses multiple different targets. Only those targets that apply for a particular workplace are used to assess its performance. Workplace leaders’ views about meeting targets are well-informed, as they are evaluating their own workplace. And success in meeting targets takes account of expectations. Success and failure are not assessed in absolute terms, but relative to the goals each workplace has set.
Leadership at Work Do Australian leaders have what it takes?Page 17
3

Key Findings » Our workplaces do not perform uniformly well across
all measures, or across all parts of the economy.
» Performance is better in relation to customer satisfaction and employee outcomes than in relation to sales and profits. Two out of every five Australian workplaces don’t meet their profit target.
» Of the factors that workplace leaders can influence, the most important is ‘integrating’ capacity. High-performing workplaces are better at combining individual knowledge into new operational capabilities.
» High-performing workplaces have more committed and engaged employees, suggesting that employee satisfaction is another important ingredient in workplace success.
3.2 Success in meeting performance targetsWorkplace leaders answered questions about ‘the extent to which your workplace exceeded, met, or did not meet’ nine separate targets:
1. Volume of sales
2. Unit labour costs
3. Total costs
4. Profits
5. Return on investment
6. Customer or client satisfaction
7. Labour productivity
8. Labour turnover
9. Absenteeism
For each item, workplace leaders answered on a three-point scale:
1. ‘Did not meet target.’
2. ‘Met target.’
3. ‘Exceeded target.’
Workplace leaders could say that a particular target was not applicable or not measured in their workplace, and could also ‘prefer not to say’ for any item. Generally, items referring to more universal performance targets (e.g. customer satisfaction) had more responses than those referring to narrower targets (e.g. profits or return on investment).
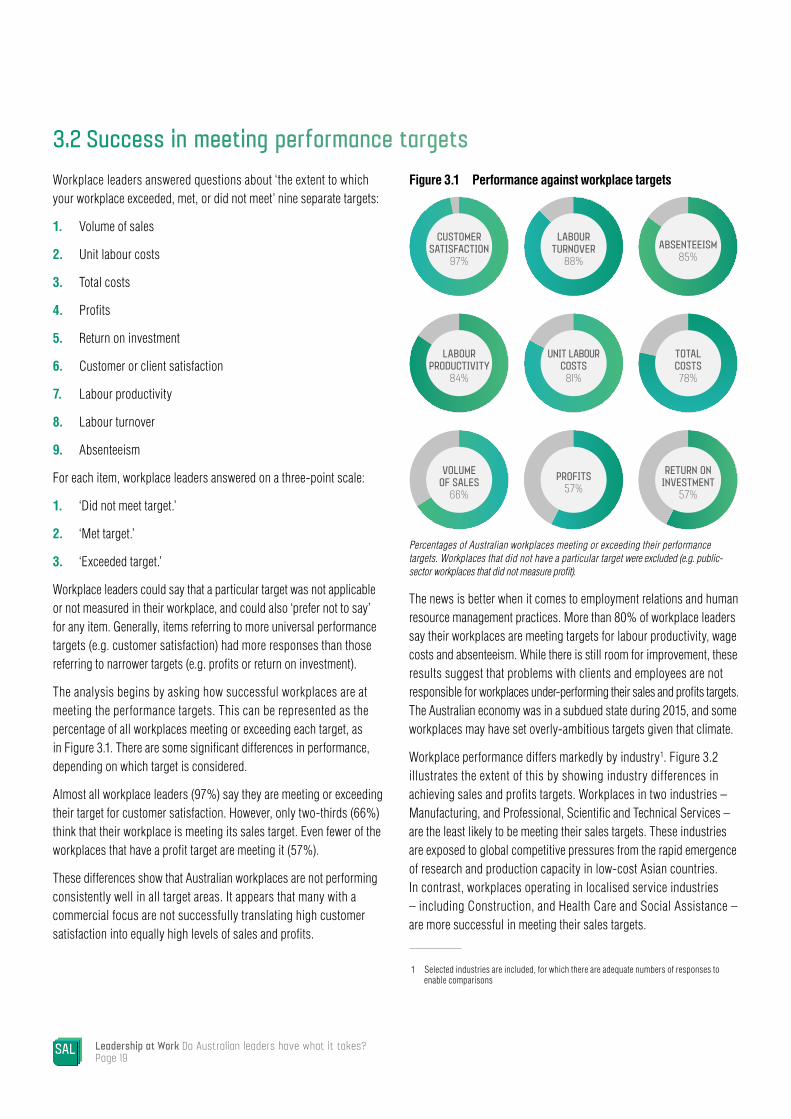
The analysis begins by asking how successful workplaces are at meeting the performance targets. This can be represented as the percentage of all workplaces meeting or exceeding each target, as in Figure 3.1. There are some significant differences in performance, depending on which target is considered.
Almost all workplace leaders (97%) say they are meeting or exceeding their target for customer satisfaction. However, only two-thirds (66%) think that their workplace is meeting its sales target. Even fewer of the workplaces that have a profit target are meeting it (57%).
These differences show that Australian workplaces are not performing consistently well in all target areas. It appears that many with a commercial focus are not successfully translating high customer satisfaction into equally high levels of sales and profits.
Figure 3.1 Performance against workplace targets
CUSTOMERSATISFACTION
97%
LABOURTURNOVER
88%ABSENTEEISM
85%
VOLUMEOF SALES
66%PROFITS
57%RETURN ON
INVESTMENT57%
LABOURPRODUCTIVITY
84%
UNIT LABOURCOSTS81%
TOTALCOSTS78%
Percentages of Australian workplaces meeting or exceeding their performance targets. Workplaces that did not have a particular target were excluded (e.g. public-sector workplaces that did not measure profit).
The news is better when it comes to employment relations and human resource management practices. More than 80% of workplace leaders say their workplaces are meeting targets for labour productivity, wage costs and absenteeism. While there is still room for improvement, these results suggest that problems with clients and employees are not responsible for workplaces under-performing their sales and profits targets.The Australian economy was in a subdued state during 2015, and some workplaces may have set overly-ambitious targets given that climate.
Workplace performance differs markedly by industry1. Figure 3.2 illustrates the extent of this by showing industry differences in achieving sales and profits targets. Workplaces in two industries – Manufacturing, and Professional, Scientific and Technical Services – are the least likely to be meeting their sales targets. These industries are exposed to global competitive pressures from the rapid emergence of research and production capacity in low-cost Asian countries. In contrast, workplaces operating in localised service industries – including Construction, and Health Care and Social Assistance – are more successful in meeting their sales targets.
1 Selected industries are included, for which there are adequate numbers of responses to enable comparisons
Leadership at Work Do Australian leaders have what it takes?Page 19

A different picture emerges for profit targets in Figure 3.2. In all but one industry (Administrative and Support Services), profit targets are reached less often than sales targets. But the gap between these outcomes is much wider in some industries than in others, with low performance in Retail Trade, and Accommodation and Food Services. Changing consumer spending patterns, spurred by better online platforms, continue to squeeze profit margins for many retail and hospitality businesses. Buyers and sellers increasingly transact online, through platforms such as retailer Etsy and accommodation provider Airbnb, where new entrants have low capital requirements
and near-zero production costs. Established players in these markets, such as department stores and hotels, are susceptible to disruption from a range of new technology-assisted business models.
Sales and profits are a useful starting point for understanding workplace performance, but these are not the only outcomes that workplaces seek to maximise. Some place equal or greater value on customer satisfaction, employee retention, and other outcomes. To cover this, a single comprehensive measure of workplace performance was developed: the overall target attainment score.
Figure 3.2 Success in meeting targets for sales and profits, by (selected) industry
Manufacturing
90
80
40
30
50
70
60
Perc
enta
ge o
f wor
kplac
es th
at m
et or
exce
eded
this
targ
et
20Construction Retail Trade Administrative &
Support ServicesEducation &
TrainingArts & Recreation
ServicesHealth Care &
Social AssistanceProfessional, Scientific & Technical Services
Accomodation& Food Services
ProfitsVolume of sales Both
Percentages of Australian workplaces meeting or exceeding their sales and profits performance targets in selected industries. Workplaces that did not have these targets were excluded. Industries with less than 50 workplace respondents are not shown.
Chapter 3 How Australian workplaces are performing Page 20
3.3 Overall target attainment scoreA broad measure of workplace performance was created by combining workplace leaders’ responses to all the questions about meeting targets.
The average score for each workplace was calculated, using whichever of the nine performance targets were measured and applicable for it2. The resulting variable is referred to as an overall target attainment score (‘OTAS-9’). It provides the basis for the remaining comparisons of workplace performance in this chapter, and in later chapters of this report.
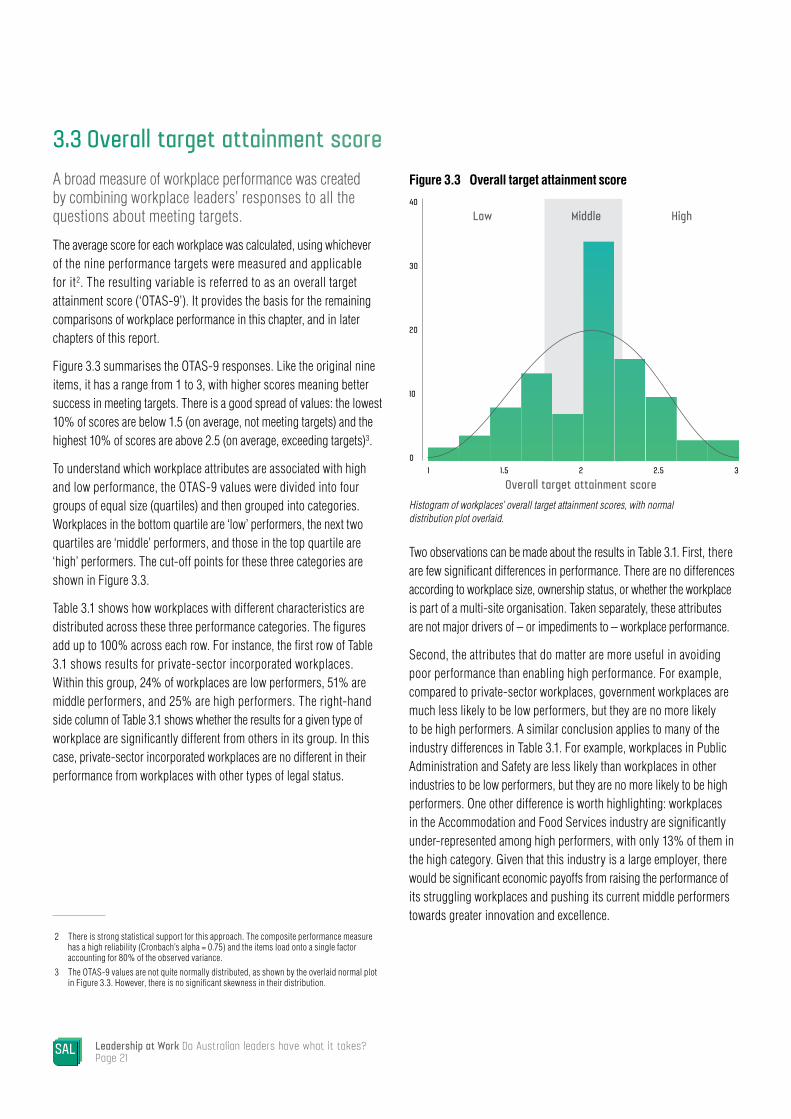
Figure 3.3 summarises the OTAS-9 responses. Like the original nine items, it has a range from 1 to 3, with higher scores meaning better success in meeting targets. There is a good spread of values: the lowest 10% of scores are below 1.5 (on average, not meeting targets) and the highest 10% of scores are above 2.5 (on average, exceeding targets)3.
To understand which workplace attributes are associated with high and low performance, the OTAS-9 values were divided into four groups of equal size (quartiles) and then grouped into categories. Workplaces in the bottom quartile are ‘low’ performers, the next two quartiles are ‘middle’ performers, and those in the top quartile are ‘high’ performers. The cut-off points for these three categories are shown in Figure 3.3.
Table 3.1 shows how workplaces with different characteristics are distributed across these three performance categories. The figures add up to 100% across each row. For instance, the first row of Table 3.1 shows results for private-sector incorporated workplaces. Within this group, 24% of workplaces are low performers, 51% are middle performers, and 25% are high performers. The right-hand side column of Table 3.1 shows whether the results for a given type of workplace are significantly different from others in its group. In this case, private-sector incorporated workplaces are no different in their performance from workplaces with other types of legal status.
2 There is strong statistical support for this approach. The composite performance measure has a high reliability (Cronbach’s alpha = 0.75) and the items load onto a single factor accounting for 80% of the observed variance.
3 The OTAS-9 values are not quite normally distributed, as shown by the overlaid normal plot in Figure 3.3. However, there is no significant skewness in their distribution.
Figure 3.3 Overall target attainment score40
30
10
20
Overall target attainment score
Low Middle High
01 1.5 2 2.5 3
Histogram of workplaces’ overall target attainment scores, with normal distribution plot overlaid.
Two observations can be made about the results in Table 3.1. First, there are few significant differences in performance. There are no differences according to workplace size, ownership status, or whether the workplace is part of a multi-site organisation. Taken separately, these attributes are not major drivers of – or impediments to – workplace performance.
Second, the attributes that do matter are more useful in avoiding poor performance than enabling high performance. For example, compared to private-sector workplaces, government workplaces are much less likely to be low performers, but they are no more likely to be high performers. A similar conclusion applies to many of the industry differences in Table 3.1. For example, workplaces in Public Administration and Safety are less likely than workplaces in other industries to be low performers, but they are no more likely to be high performers. One other difference is worth highlighting: workplaces in the Accommodation and Food Services industry are significantly under-represented among high performers, with only 13% of them in the high category. Given that this industry is a large employer, there would be significant economic payoffs from raising the performance of its struggling workplaces and pushing its current middle performers towards greater innovation and excellence.
Leadership at Work Do Australian leaders have what it takes?Page 21

Table 3.1 Attributes of Australian workplaces, by overall target attainment score
%Overall target attainment score
Sig. diff?Low Middle High
Legal status of organisationPrivate, Incorporated 24 51 25 NoPrivate, Unincorporated 29 55 15 NoGovernment 6 64 31 YesOwnership status, private sector onlyWholly Australian-owned 26 51 23 NoSome foreign ownership 20 49 32 NoSingle/multi-siteSingle 28 51 21 NoMulti 22 51 28 NoWorkplace sizeSmall (5 to 19 employees) 26 52 22 NoMedium (20 to 199 employees) 22 47 31 NoLarge (200 or more employees) 27 51 22 NoWorkplace ageLess than 5 years 28 37 36 Yes5 to less than 10 years 23 59 18 No10 to less than 20 years 26 50 24 No20 years or more 25 52 24 NoIndustryMining 27 47 26 NoManufacturing 38 38 24 NoElectricity, Gas, Water and Waste Services 20 62 18 NoConstruction 19 50 31 NoWholesale Trade 31 49 20 NoRetail Trade 22 60 17 NoAccommodation and Food Services 30 58 13 YesTransport, Postal and Warehousing 27 52 22 NoInformation Media and Telecommunications 18 49 34 NoFinancial and Insurance Services 33 25 43 YesRental, Hiring and Real Estate Services 12 67 20 YesProfessional, Scientific and Technical Services 34 41 25 NoAdministrative and Support Services 25 44 31 NoPublic Administration and Safety 7 81 13 YesEducation and Training 12 64 24 YesHealth Care and Social Assistance 12 65 23 YesArts and Recreation Services 9 62 29 YesOther Services 30 41 29 No
Chapter 3 How Australian workplaces are performing Page 22
3.4 Separating high and low performersThe next step in the analysis involved looking at whether particular attributes are associated with workplaces in the high- and low-performing groups. Rather than comparing workplace attributes one by one, regression equations were estimated, which test whether a particular attribute matters statistically after controlling for the effects of other variables. For instance, are government workplaces any more likely to be high performers, once differences in workplace size, age, and industry are removed?
Some additional variables are included beyond those shown in Table 3.1. It is of particular interest whether there are actions that leaders can take to improve workplace performance. Such ‘modifiable’ factors include workforce composition, responsiveness to market changes, and leaders’ self-rated leadership competence.
High-performing workplacesThe analysis begins with high-performing workplaces; those in the top 25% of OTAS-9 scores. Table 3.2 compares these high-performing workplaces to all others in the sample. The results show the effect of each trait – such as workplace age or size – on the probability of high performance, and whether that effect is significant. Two regression models were estimated: one including only the ‘fixed’ workplace attributes from Table 3.1, and another that includes additional modifiable attributes. Most of the estimates are percentage changes in the probability of a workplace being a high performer4.
Aside from the impact of industry (which individual leaders cannot change), few traits emerge as significant determinants of high performance. Controlling for other differences, workplaces in multi-site organisations are more likely than single-site workplaces to be high performers. Neither workplace size, nor workplace age, is independently associated with the probability of high performance.
What about the things that leaders can control? Workplace leaders were asked about a set of ‘dynamic capabilities’, including how well the workplace reads its operating environment (‘sensing’), whether new ideas and practices are readily adopted (‘learning’), and how well individual workers co-ordinate their activities (‘integrating’). The most important of these in Table 3.2 is integrating: high-performing workplaces are better at combining individual knowledge into new organisational capabilities. ‘Integrating’ is measured on a five-point scale. All else equal, a one-point increase on the integrating scale
4 For instance, the value of 0.066 on the first row implies that younger workplaces (those operating for less than five years) are more likely than older workplaces (20 or more years, the reference group) to be high performers. In this case, the difference is not statistically significant.
is associated with an 8.9% increase in the probability of a workplace being a high performer. Interestingly, in terms of leaders’ self-rated leadership competence, there are no significant differences in Table 3.2.
Low-performing workplacesThe results look quite different when considering low-performing workplaces (Table 3.3). There are more statistically significant effects, and the regression model explains more of the variation in the data. The presentation of the results is the same as in Table 3.2, except the comparison is now between low-performing workplaces and other workplaces in the sample. The regression results show the effect size and significance of each trait on the probability of low performance.
All but one of the significant effects is negative, meaning that these variables are associated with a reduced probability of low performance5. Of the fixed attributes, significant effects are evident for legal status, number of worksites, and industry. Government workplaces are much less likely to be low performers than incorporated entities of similar size and age (by 14%). Workplaces in multi-site organisations are less likely to be low performers than single sites (by 9-10%). And, compared with Manufacturing (the reference group), several industries are significantly less likely to have low-performing workplaces, including Education and Training, Health Care and Social Assistance, and Arts and Recreation Services (by 10-16%).
Of the modifiable workplace attributes, the most important in reducing the probability of low performance are ‘learning’, ‘integrating’, and ‘ambidexterity’. Again, the strongest predictor is the ability to integrate. All else equal, a one-point increase on the integrating scale reduces a workplace’s probability of low performance by 13%. Integrating is thus the only variable with benefits on both sides: improving this capability seems to reduce low-performance risk, while boosting high-performance potential. Compared to integrating, the effects of learning and ambidexterity are smaller but still significant. Ambidexterity is a measure of whether a workplace can simultaneously meet current demands and remain adaptive to future demands.
After controlling for other workplace attributes, there is again no significant evidence of individual leader competence effects. These effects are examined further in Chapter 10.
5 The one exception is the dynamic capability of ‘sensing’, which is (unexpectedly) positively correlated with low performance.
Leadership at Work Do Australian leaders have what it takes?Page 23
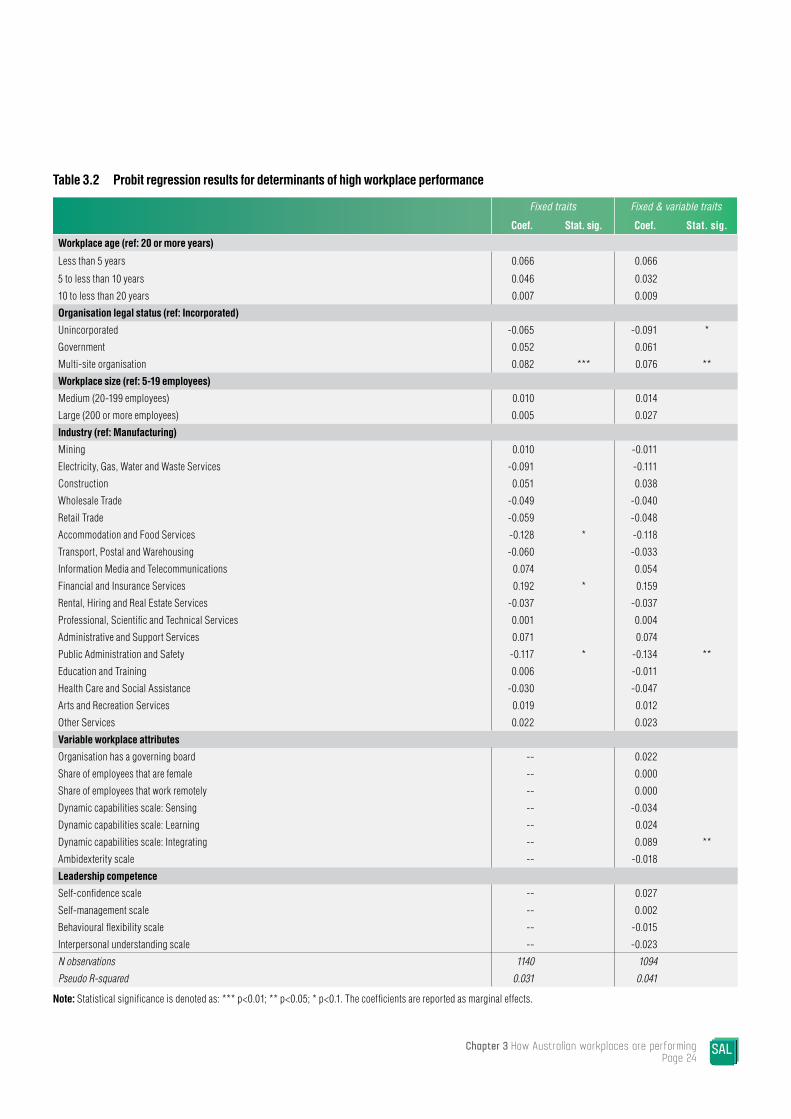
Table 3.2 Probit regression results for determinants of high workplace performance
Fixed traits Fixed & variable traits
Coef. Stat. sig. Coef. Stat. sig.
Workplace age (ref: 20 or more years)
Less than 5 years 0.066 0.066
5 to less than 10 years 0.046 0.032
10 to less than 20 years 0.007 0.009
Organisation legal status (ref: Incorporated)
Unincorporated -0.065 -0.091 *
Government 0.052 0.061
Multi-site organisation 0.082 *** 0.076 **
Workplace size (ref: 5-19 employees)
Medium (20-199 employees) 0.010 0.014
Large (200 or more employees) 0.005 0.027
Industry (ref: Manufacturing)
Mining 0.010 -0.011
Electricity, Gas, Water and Waste Services -0.091 -0.111
Construction 0.051 0.038
Wholesale Trade -0.049 -0.040
Retail Trade -0.059 -0.048
Accommodation and Food Services -0.128 * -0.118
Transport, Postal and Warehousing -0.060 -0.033
Information Media and Telecommunications 0.074 0.054
Financial and Insurance Services 0.192 * 0.159
Rental, Hiring and Real Estate Services -0.037 -0.037
Professional, Scientific and Technical Services 0.001 0.004
Administrative and Support Services 0.071 0.074
Public Administration and Safety -0.117 * -0.134 **
Education and Training 0.006 -0.011
Health Care and Social Assistance -0.030 -0.047
Arts and Recreation Services 0.019 0.012
Other Services 0.022 0.023
Variable workplace attributes
Organisation has a governing board -- 0.022
Share of employees that are female -- 0.000
Share of employees that work remotely -- 0.000
Dynamic capabilities scale: Sensing -- -0.034
Dynamic capabilities scale: Learning -- 0.024
Dynamic capabilities scale: Integrating -- 0.089 **
Ambidexterity scale -- -0.018
Leadership competence
Self-confidence scale -- 0.027
Self-management scale -- 0.002
Behavioural flexibility scale -- -0.015
Interpersonal understanding scale -- -0.023
N observations 1140 1094
Pseudo R-squared 0.031 0.041
Note: Statistical significance is denoted as: *** p<0.01; ** p<0.05; * p<0.1. The coefficients are reported as marginal effects.
Chapter 3 How Australian workplaces are performing Page 24

Table 3.3 Probit regression results for determinants of low workplace performance
Fixed traits Fixed & variable traits
Coef. Stat. sig. Coef. Stat. sig.
Workplace age (ref: 20 or more years)
Less than 5 years 0.061 0.035
5 to less than 10 years -0.022 -0.032
10 to less than 20 years 0.006 0.004
Organisation legal status (ref: Incorporated)
Unincorporated -0.004 0.011
Government -0.135 *** -0.143 ***
Multi-site organisation -0.097 *** -0.091 ***
Workplace size (ref: 5-19 employees)
Medium (20-199 employees) -0.016 -0.019
Large (200 or more employees) 0.043 0.016
Industry (ref: Manufacturing)
Mining -0.040 0.043
Electricity, Gas, Water and Waste Services -0.036 0.002
Construction -0.080 -0.063
Wholesale Trade -0.035 -0.008
Retail Trade -0.085 -0.061
Accommodation and Food Services -0.053 -0.038
Transport, Postal and Warehousing -0.018 0.014
Information Media and Telecommunications -0.087 -0.058
Financial and Insurance Services -0.098 -0.060
Rental, Hiring and Real Estate Services -0.147 *** -0.117 **
Professional, Scientific and Technical Services -0.032 0.021
Administrative and Support Services -0.076 -0.023
Public Administration and Safety -0.114 ** -0.083
Education and Training -0.142 *** -0.103 **
Health Care and Social Assistance -0.150 *** -0.102 *
Arts and Recreation Services -0.163 *** -0.134 ***
Other Services -0.044 -0.005
Variable workplace attributes
Organisation has a governing board -- -0.041
Share of employees that are female -- 0.000
Share of employees that work remotely -- 0.000
Dynamic capabilities scale: Sensing -- 0.061 **
Dynamic capabilities scale: Learning -- -0.048 *
Dynamic capabilities scale: Integrating -- -0.134 ***
Ambidexterity scale -- -0.058 **
Leadership competence
Self-confidence scale -- 0.045
Self-management scale -- -0.007
Behavioural flexibility scale -- -0.015
Interpersonal understanding scale -- 0.053
N observations 1140 1094
Pseudo R-squared 0.075 0.124
Note: Statistical significance is denoted as: *** p<0.01; ** p<0.05; * p<0.1. The coefficients are reported as marginal effects.
Leadership at Work Do Australian leaders have what it takes?Page 25
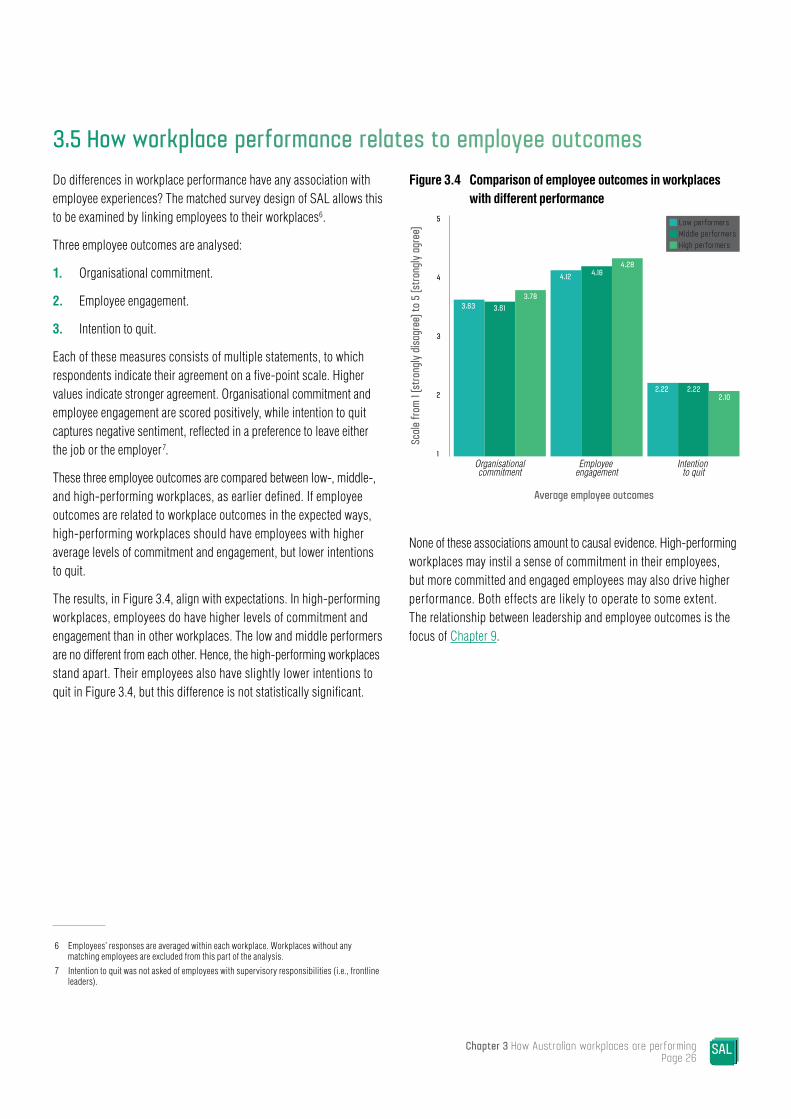
3.5 How workplace performance relates to employee outcomesDo differences in workplace performance have any association with employee experiences? The matched survey design of SAL allows this to be examined by linking employees to their workplaces6.
Three employee outcomes are analysed:
1. Organisational commitment.
2. Employee engagement.
3. Intention to quit.
Each of these measures consists of multiple statements, to which respondents indicate their agreement on a five-point scale. Higher values indicate stronger agreement. Organisational commitment and employee engagement are scored positively, while intention to quit captures negative sentiment, reflected in a preference to leave either the job or the employer7.
These three employee outcomes are compared between low-, middle-, and high-performing workplaces, as earlier defined. If employee outcomes are related to workplace outcomes in the expected ways, high-performing workplaces should have employees with higher average levels of commitment and engagement, but lower intentions to quit.
The results, in Figure 3.4, align with expectations. In high-performing workplaces, employees do have higher levels of commitment and engagement than in other workplaces. The low and middle performers are no different from each other. Hence, the high-performing workplaces stand apart. Their employees also have slightly lower intentions to quit in Figure 3.4, but this difference is not statistically significant.
6 Employees’ responses are averaged within each workplace. Workplaces without any matching employees are excluded from this part of the analysis.
7 Intention to quit was not asked of employees with supervisory responsibilities (i.e., frontline leaders).
Figure 3.4 Comparison of employee outcomes in workplaces with different performance
Organisationalcommitment
5
4
2
3
Average employee outcomes
Scale
from
1 (st
rong
ly dis
agre
e) to
5 (s
trong
ly ag
ree)
3.63 3.613.78
4.12 4.164.28
2.22 2.222.10
1Employee
engagementIntention
to quit
Middle performersLow performers
High performers
None of these associations amount to causal evidence. High-performing workplaces may instil a sense of commitment in their employees, but more committed and engaged employees may also drive higher performance. Both effects are likely to operate to some extent. The relationship between leadership and employee outcomes is the focus of Chapter 9.
Chapter 3 How Australian workplaces are performing Page 26
3 A profile of senior leaders in Australian organisations
Senior leaders play an influential role in an organisation’s future. Yet the international research indicates that many individuals fail to make the transition from operational to senior leadership roles. While much is known about the profile of senior leaders in publicly listed companies, very little is known about senior leaders in non-listed companies or those in senior workplace roles.
The Study of Australian Leadership provides a snapshot of senior leaders and workplace leaders across private and public sector organisations. The data is used in this chapter to create, for the first time, a comprehensive profile of senior leaders operating at all levels, across all types of organisations and industries. This analysis fills an important gap in our understanding of the background and capabilities of Australian leaders and managers.
4.1 Demographic profile of senior leadersSAL differentiates between leaders working at three levels of the organisation: the organisation level, the workplace level, and the frontline level (Box 4.1). This chapter focuses on senior leaders and workplace leaders, who completed different, but matched, surveys. In single-site organisations, the senior leader and workplace leader surveys were integrated and answered by the same person.
The two surveys asked questions relevant to their differing role as leaders. For senior leaders, the survey focused on:
» Assessing the external environment.
» Challenges and competitive pressures.
» External constraints faced in meeting these challenges.
» Sources of strategic advice.
» Organisational capabilities to respond to the pressures and challenges that the organisation faced.
Workplace leaders were asked, by contrast, to provide an assessment of:
» Internal capabilities of the organisation to operate effectively.
» Their own capabilities to lead the workplace operation.
At both levels, senior leaders assessed their leadership self-efficacy – or belief in their own ability to lead.
Box 4.1 Comparing organisational, workplace & frontline leaders
This box provides summary definitions of who were recruited as key respondents for each of these three surveys.
Senior leaders included individuals who occupied a senior position and had authority to commit the organisation to complete all survey instruments. These were typically CEOs or directors, but in some instances were other senior managers such as the director of human resources.
Workplace leaders were nominated by the senior organisational leader as the most senior manager in the workplace. These individuals included general managers, operational managers, or those with a similar title.
Frontline leaders were identified as any other individual at the workplace level who had supervisory responsibility.
Leadership at Work Do Australian leaders have what it takes?Page 27
4

Key Findings » The leadership of Australian organisations is less
diverse than Australian society at large. Women, young leaders, and leaders from non-English speaking backgrounds are under-represented relative to their shares of the broader population.
» Australia’s senior leadership tier is ageing. Over half of senior leaders in multi-site organisations are aged 55 years or over, whereas workplace leaders are generally younger: 43% are under 45 years of age. Our organisations must take succession planning seriously, to ensure that younger workplace leaders are ready for more senior roles.
» Around three-quarters of Australian leaders are born in Australia, and most of those born elsewhere are from English-speaking backgrounds. Senior leaders in smaller, private-sector organisations are more likely to be from ethnically-diverse backgrounds.
» Senior leadership ranks remain male-dominated. Four out of five senior leaders in multi-site organisations are men. At the workplace level, one in three leaders are women, but this remains well below the broader female population share. Too few women are taking up, and staying in, leadership roles.
» A high proportion of leaders – one in four – has no qualification beyond secondary school. Education levels are highest for leaders in large organisations, foreign-owned organisations, and in the public sector. While formal education is not the only path to leadership, it remains an important foundation for a range of critical skills.
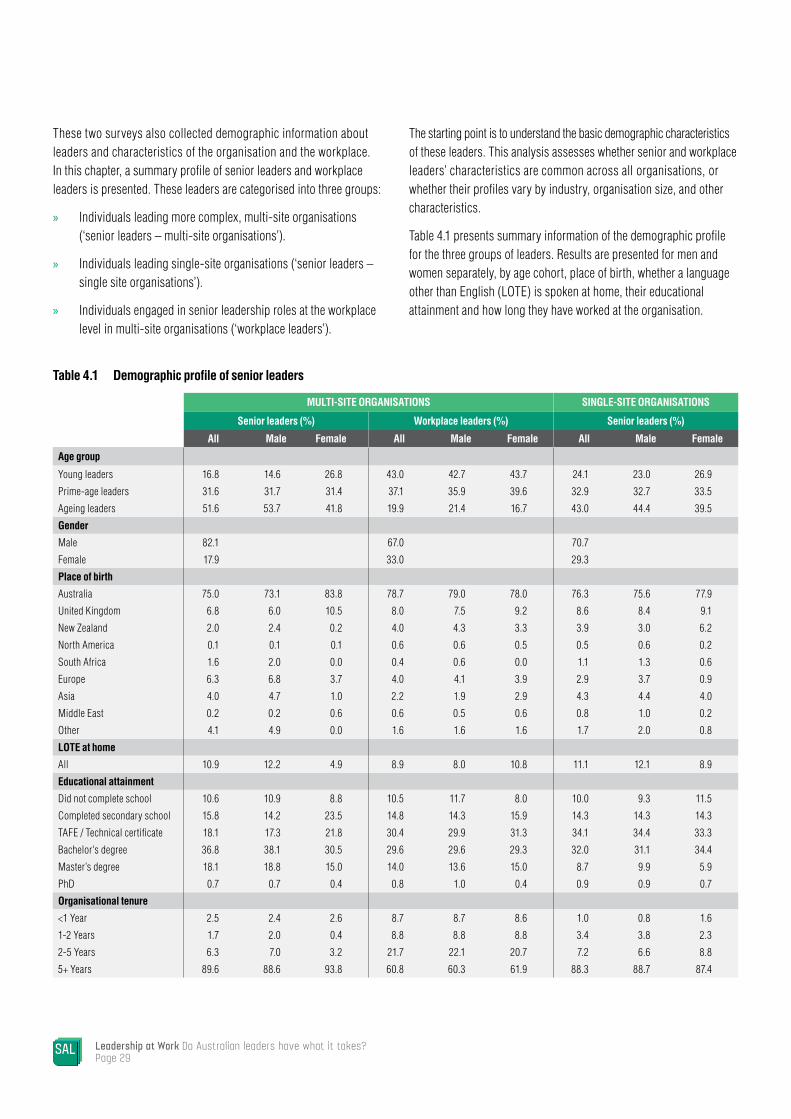
These two surveys also collected demographic information about leaders and characteristics of the organisation and the workplace. In this chapter, a summary profile of senior leaders and workplace leaders is presented. These leaders are categorised into three groups:
» Individuals leading more complex, multi-site organisations (‘senior leaders – multi-site organisations’).
» Individuals leading single-site organisations (‘senior leaders – single site organisations’).
» Individuals engaged in senior leadership roles at the workplace level in multi-site organisations (‘workplace leaders’).
The starting point is to understand the basic demographic characteristics of these leaders. This analysis assesses whether senior and workplace leaders’ characteristics are common across all organisations, or whether their profiles vary by industry, organisation size, and other characteristics.
Table 4.1 presents summary information of the demographic profile for the three groups of leaders. Results are presented for men and women separately, by age cohort, place of birth, whether a language other than English (LOTE) is spoken at home, their educational attainment and how long they have worked at the organisation.
Table 4.1 Demographic profile of senior leaders
MULTI-SITE ORGANISATIONS SINGLE-SITE ORGANISATIONS
Senior leaders (%) Workplace leaders (%) Senior leaders (%)
All Male Female All Male Female All Male Female
Age group
Young leaders 16.8 14.6 26.8 43.0 42.7 43.7 24.1 23.0 26.9
Prime-age leaders 31.6 31.7 31.4 37.1 35.9 39.6 32.9 32.7 33.5
Ageing leaders 51.6 53.7 41.8 19.9 21.4 16.7 43.0 44.4 39.5
Gender
Male 82.1 67.0 70.7
Female 17.9 33.0 29.3
Place of birth
Australia 75.0 73.1 83.8 78.7 79.0 78.0 76.3 75.6 77.9
United Kingdom 6.8 6.0 10.5 8.0 7.5 9.2 8.6 8.4 9.1
New Zealand 2.0 2.4 0.2 4.0 4.3 3.3 3.9 3.0 6.2
North America 0.1 0.1 0.1 0.6 0.6 0.5 0.5 0.6 0.2
South Africa 1.6 2.0 0.0 0.4 0.6 0.0 1.1 1.3 0.6
Europe 6.3 6.8 3.7 4.0 4.1 3.9 2.9 3.7 0.9
Asia 4.0 4.7 1.0 2.2 1.9 2.9 4.3 4.4 4.0
Middle East 0.2 0.2 0.6 0.6 0.5 0.6 0.8 1.0 0.2
Other 4.1 4.9 0.0 1.6 1.6 1.6 1.7 2.0 0.8
LOTE at home
All 10.9 12.2 4.9 8.9 8.0 10.8 11.1 12.1 8.9
Educational attainment
Did not complete school 10.6 10.9 8.8 10.5 11.7 8.0 10.0 9.3 11.5
Completed secondary school 15.8 14.2 23.5 14.8 14.3 15.9 14.3 14.3 14.3
TAFE / Technical certificate 18.1 17.3 21.8 30.4 29.9 31.3 34.1 34.4 33.3
Bachelor's degree 36.8 38.1 30.5 29.6 29.6 29.3 32.0 31.1 34.4
Master’s degree 18.1 18.8 15.0 14.0 13.6 15.0 8.7 9.9 5.9
PhD 0.7 0.7 0.4 0.8 1.0 0.4 0.9 0.9 0.7
Organisational tenure
<1 Year 2.5 2.4 2.6 8.7 8.7 8.6 1.0 0.8 1.6
1-2 Years 1.7 2.0 0.4 8.8 8.8 8.8 3.4 3.8 2.3
2-5 Years 6.3 7.0 3.2 21.7 22.1 20.7 7.2 6.6 8.8
5+ Years 89.6 88.6 93.8 60.8 60.3 61.9 88.3 88.7 87.4
Leadership at Work Do Australian leaders have what it takes?Page 29
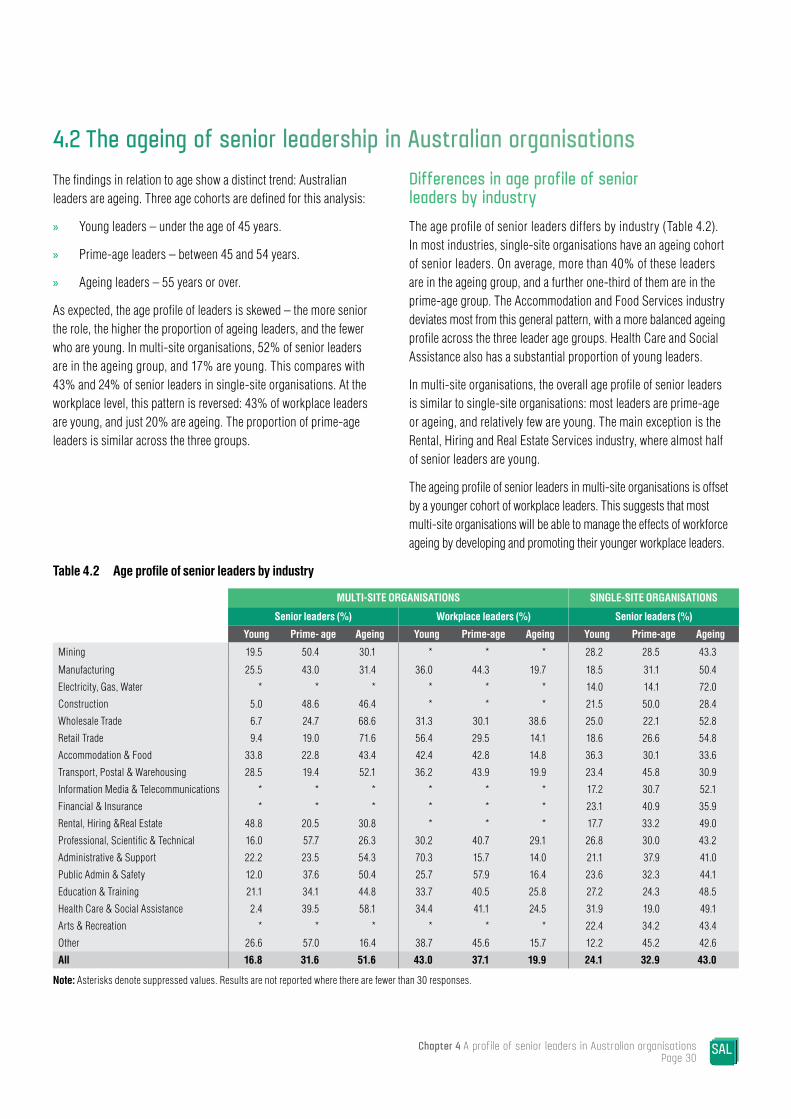
4.2 The ageing of senior leadership in Australian organisationsThe findings in relation to age show a distinct trend: Australian leaders are ageing. Three age cohorts are defined for this analysis:
» Young leaders – under the age of 45 years.
» Prime-age leaders – between 45 and 54 years.
» Ageing leaders – 55 years or over.
As expected, the age profile of leaders is skewed – the more senior the role, the higher the proportion of ageing leaders, and the fewer who are young. In multi-site organisations, 52% of senior leaders are in the ageing group, and 17% are young. This compares with 43% and 24% of senior leaders in single-site organisations. At the workplace level, this pattern is reversed: 43% of workplace leaders are young, and just 20% are ageing. The proportion of prime-age leaders is similar across the three groups.
Differences in age profile of senior leaders by industryThe age profile of senior leaders differs by industry (Table 4.2). In most industries, single-site organisations have an ageing cohort of senior leaders. On average, more than 40% of these leaders are in the ageing group, and a further one-third of them are in the prime-age group. The Accommodation and Food Services industry deviates most from this general pattern, with a more balanced ageing profile across the three leader age groups. Health Care and Social Assistance also has a substantial proportion of young leaders.
In multi-site organisations, the overall age profile of senior leaders is similar to single-site organisations: most leaders are prime-age or ageing, and relatively few are young. The main exception is the Rental, Hiring and Real Estate Services industry, where almost half of senior leaders are young.
The ageing profile of senior leaders in multi-site organisations is offset by a younger cohort of workplace leaders. This suggests that most multi-site organisations will be able to manage the effects of workforce ageing by developing and promoting their younger workplace leaders.
Table 4.2 Age profile of senior leaders by industry
MULTI-SITE ORGANISATIONS SINGLE-SITE ORGANISATIONS
Senior leaders (%) Workplace leaders (%) Senior leaders (%)
Young Prime- age Ageing Young Prime-age Ageing Young Prime-age Ageing
Mining 19.5 50.4 30.1 * * * 28.2 28.5 43.3
Manufacturing 25.5 43.0 31.4 36.0 44.3 19.7 18.5 31.1 50.4
Electricity, Gas, Water * * * * * * 14.0 14.1 72.0
Construction 5.0 48.6 46.4 * * * 21.5 50.0 28.4
Wholesale Trade 6.7 24.7 68.6 31.3 30.1 38.6 25.0 22.1 52.8
Retail Trade 9.4 19.0 71.6 56.4 29.5 14.1 18.6 26.6 54.8
Accommodation & Food 33.8 22.8 43.4 42.4 42.8 14.8 36.3 30.1 33.6
Transport, Postal & Warehousing 28.5 19.4 52.1 36.2 43.9 19.9 23.4 45.8 30.9
Information Media & Telecommunications * * * * * * 17.2 30.7 52.1
Financial & Insurance * * * * * * 23.1 40.9 35.9
Rental, Hiring &Real Estate 48.8 20.5 30.8 * * * 17.7 33.2 49.0
Professional, Scientific & Technical 16.0 57.7 26.3 30.2 40.7 29.1 26.8 30.0 43.2
Administrative & Support 22.2 23.5 54.3 70.3 15.7 14.0 21.1 37.9 41.0
Public Admin & Safety 12.0 37.6 50.4 25.7 57.9 16.4 23.6 32.3 44.1
Education & Training 21.1 34.1 44.8 33.7 40.5 25.8 27.2 24.3 48.5
Health Care & Social Assistance 2.4 39.5 58.1 34.4 41.1 24.5 31.9 19.0 49.1
Arts & Recreation * * * * * * 22.4 34.2 43.4
Other 26.6 57.0 16.4 38.7 45.6 15.7 12.2 45.2 42.6
All 16.8 31.6 51.6 43.0 37.1 19.9 24.1 32.9 43.0
Note: Asterisks denote suppressed values. Results are not reported where there are fewer than 30 responses.
Chapter 4 A profile of senior leaders in Australian organisations Page 30

4.3 The gender representation gap in senior leadership rolesWomen are under-represented among senior leaders at both the organisational and workplace levels (Table 4.1) across both single-and multi-site organisations. However, women are better represented in senior leadership ranks in single-site organisations than in multi-site organisations, and at the workplace level compared to the organisation level.
In multi-site organisations, more than three-quarters (82%) of senior leaders are men, compared to 71% of senior leaders in single-site organisations. Women are slightly better represented at the workplace level, where they account for one-third of workplace leaders.
More women than men fall into the young leader category across all three groups of leaders (multi-site, single-site, and workplace). This difference is largest among senior leaders in multi-site organisations, and smallest among their workplace leaders. In multi-site organisations, more than one-quarter (27%) of female senior leaders are young, compared with 15% of men. At the workplace level, the difference is much smaller: 44% of women compared with 43% of men. In single-site organisations, 27% of female senior leaders are young, compared with 23% of men. Optimistically, these results may reflect a changing pattern of women’s representation among the ranks of senior leaders. However, the results are also consistent with the pessimistic proposition that women leave, or are simply not promoted into, senior leadership roles.
The gender representation gap by organisational characteristicsTable 4.3 reports differences in the gender profile of leaders by a number of organisational characteristics.
There are some differences in gender representation between public and private sector organisations. Within multi-site organisations, the proportion of senior leaders who are women is slightly higher in the public sector than in the private sector (24% versus 18%). At the workplace level, the difference between public and private sector organisations is more pronounced. While one in three workplace leaders are women in multi-site private sector organisations, the figure is closer to half (48%) in multi-site public sector organisations.
There are notable differences between majority Australian- and majority foreign-owned organisations. At all levels of leadership, majority foreign-owned organisations are much less likely to have female leaders. In both single- and multi-site organisations, senior leadership roles are more than five times as likely to be filled by women if the organisation is majority Australian-owned.
Organisational size and age are also associated with differences in the gender profile of leaders, but the patterns are mixed. In both single- and multi-site organisations, women are more likely to occupy senior leadership roles in small and medium-sized organisations than in large organisations. Women are also more likely to hold leadership roles at the workplace level in younger organisations.
The gender representation gap by industryAcross industries, there are large differences in gender representation at all three leadership levels. In multi-site organisations, almost one in five senior leaders (18%) are women, but the proportion is close to zero in several industries: Construction (0.3%), Wholesale Trade (0.7%), and Transport, Postal and Warehousing (4.1%). In single site organisations, almost one in three senior leaders (29%) are women, but again several industries have decidedly low proportions, including Information Media and Telecommunications (8.2%) and Mining (9.9%). Conversely, some industries have especially high female representation in senior leadership and workplace leadership roles, most notably Health Care and Social Assistance. In a further two industries, women outnumber men in workplace leadership roles: Education and Training (58.8% female) and Accommodation and Food Services (55.2%).
Leadership at Work Do Australian leaders have what it takes?Page 31
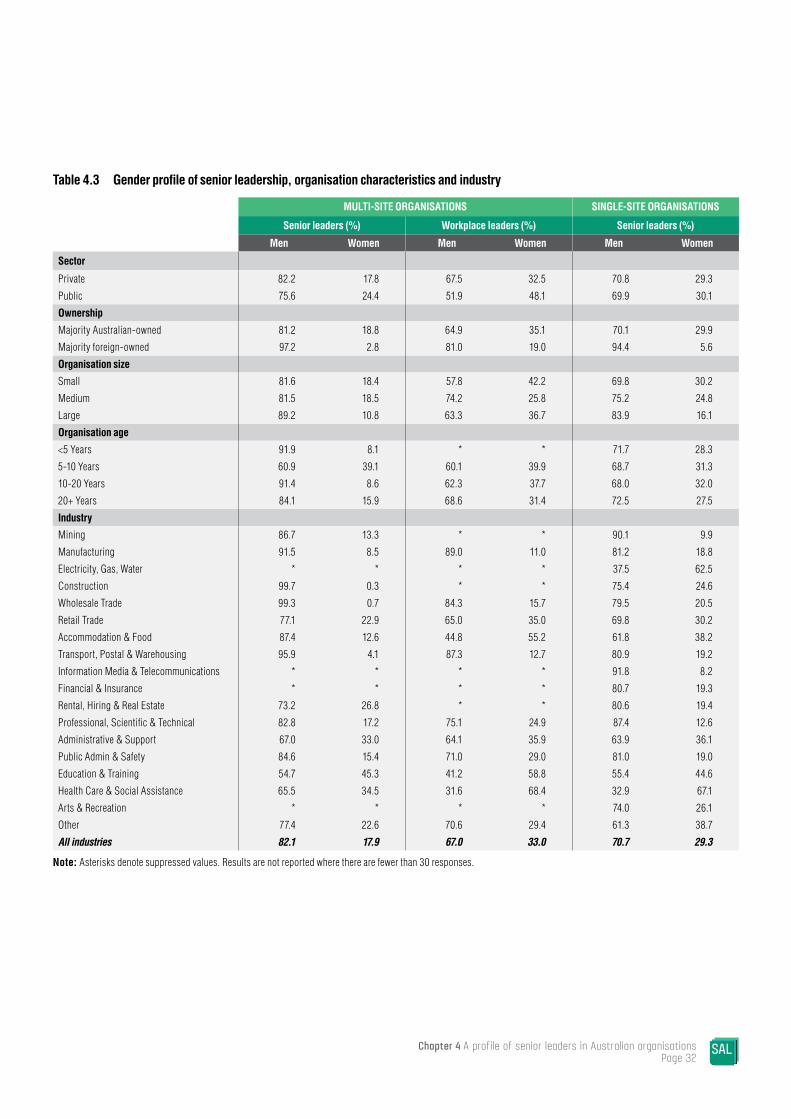
Chapter 4 A profile of senior leaders in Australian organisations Page 32
Table 4.3 Gender profile of senior leadership, organisation characteristics and industry
MULTI-SITE ORGANISATIONS SINGLE-SITE ORGANISATIONS
Senior leaders (%) Workplace leaders (%) Senior leaders (%)
Men Women Men Women Men Women
Sector
Private 82.2 17.8 67.5 32.5 70.8 29.3
Public 75.6 24.4 51.9 48.1 69.9 30.1
Ownership
Majority Australian-owned 81.2 18.8 64.9 35.1 70.1 29.9
Majority foreign-owned 97.2 2.8 81.0 19.0 94.4 5.6
Organisation size
Small 81.6 18.4 57.8 42.2 69.8 30.2
Medium 81.5 18.5 74.2 25.8 75.2 24.8
Large 89.2 10.8 63.3 36.7 83.9 16.1
Organisation age
<5 Years 91.9 8.1 * * 71.7 28.3
5-10 Years 60.9 39.1 60.1 39.9 68.7 31.3
10-20 Years 91.4 8.6 62.3 37.7 68.0 32.0
20+ Years 84.1 15.9 68.6 31.4 72.5 27.5
Industry
Mining 86.7 13.3 * * 90.1 9.9
Manufacturing 91.5 8.5 89.0 11.0 81.2 18.8
Electricity, Gas, Water * * * * 37.5 62.5
Construction 99.7 0.3 * * 75.4 24.6
Wholesale Trade 99.3 0.7 84.3 15.7 79.5 20.5
Retail Trade 77.1 22.9 65.0 35.0 69.8 30.2
Accommodation & Food 87.4 12.6 44.8 55.2 61.8 38.2
Transport, Postal & Warehousing 95.9 4.1 87.3 12.7 80.9 19.2
Information Media & Telecommunications * * * * 91.8 8.2
Financial & Insurance * * * * 80.7 19.3
Rental, Hiring & Real Estate 73.2 26.8 * * 80.6 19.4
Professional, Scientific & Technical 82.8 17.2 75.1 24.9 87.4 12.6
Administrative & Support 67.0 33.0 64.1 35.9 63.9 36.1
Public Admin & Safety 84.6 15.4 71.0 29.0 81.0 19.0
Education & Training 54.7 45.3 41.2 58.8 55.4 44.6
Health Care & Social Assistance 65.5 34.5 31.6 68.4 32.9 67.1
Arts & Recreation * * * * 74.0 26.1
Other 77.4 22.6 70.6 29.4 61.3 38.7
All industries 82.1 17.9 67.0 33.0 70.7 29.3
Note: Asterisks denote suppressed values. Results are not reported where there are fewer than 30 responses.
4.4 Educational qualifications of leadersThere are many ways to acquire the skills and capabilities needed to be an effective leader, but completing formal qualifications remains one of the most important methods, delivering specialist technical knowledge, and conceptual and analytical tools.
Yet the summary results on leaders’ educational attainment in Table 4.1 show a surprisingly high proportion of leaders without any post-school qualifications: around one-quarter of the leaders in all three groups.
Educational qualifications by industry Leaders without post-school educational qualifications are more common in some industries (Table 4.4). Among senior leaders in multi-site organisations, high proportions are not qualified beyond secondary school in the following industries: Transport, Postal and Warehousing Services (62.8%), Wholesale Trade (48.3%), and Retail Trade (45.2%). This is also true of senior leaders in single-site organisations in the industry of Electricity, Gas, Water and Waste Services (68.0%). At the other end of the education spectrum, the ‘knowledge industries’ – Education and Training, and Professional, Scientific and Technical Services – contain many senior leaders with tertiary-level (undergraduate and postgraduate) qualifications. In general, senior leaders in multi-site organisations are the least likely to have completed a TAFE/technical course as their highest qualification.
Leadership at Work Do Australian leaders have what it takes?Page 33
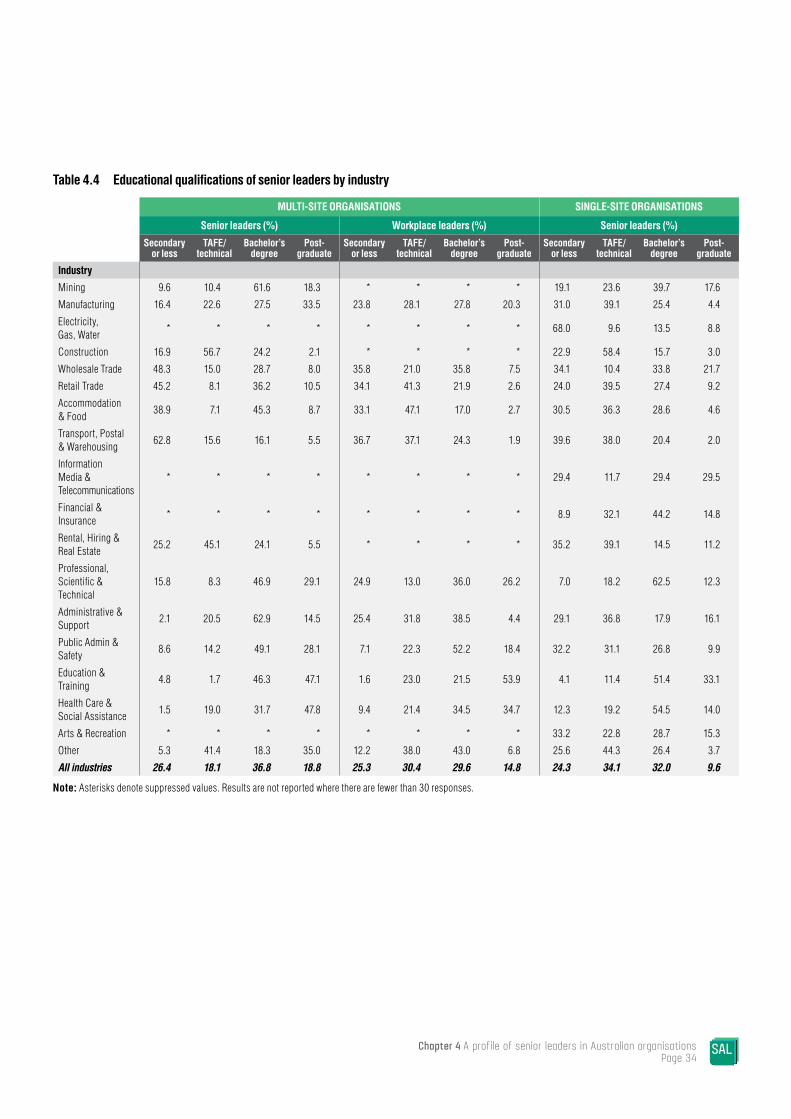
Chapter 4 A profile of senior leaders in Australian organisations Page 34
Table 4.4 Educational qualifications of senior leaders by industry
MULTI-SITE ORGANISATIONS SINGLE-SITE ORGANISATIONS
Senior leaders (%) Workplace leaders (%) Senior leaders (%)
Secondary or less
TAFE/ technical
Bachelor’s degree
Post-graduate
Secondary or less
TAFE/ technical
Bachelor’s degree
Post-graduate
Secondary or less
TAFE/ technical
Bachelor’s degree
Post-graduate
Industry
Mining 9.6 10.4 61.6 18.3 * * * * 19.1 23.6 39.7 17.6
Manufacturing 16.4 22.6 27.5 33.5 23.8 28.1 27.8 20.3 31.0 39.1 25.4 4.4
Electricity, Gas, Water
* * * * * * * * 68.0 9.6 13.5 8.8
Construction 16.9 56.7 24.2 2.1 * * * * 22.9 58.4 15.7 3.0
Wholesale Trade 48.3 15.0 28.7 8.0 35.8 21.0 35.8 7.5 34.1 10.4 33.8 21.7
Retail Trade 45.2 8.1 36.2 10.5 34.1 41.3 21.9 2.6 24.0 39.5 27.4 9.2
Accommodation & Food
38.9 7.1 45.3 8.7 33.1 47.1 17.0 2.7 30.5 36.3 28.6 4.6
Transport, Postal & Warehousing
62.8 15.6 16.1 5.5 36.7 37.1 24.3 1.9 39.6 38.0 20.4 2.0
Information Media & Telecommunications
* * * * * * * * 29.4 11.7 29.4 29.5
Financial & Insurance
* * * * * * * * 8.9 32.1 44.2 14.8
Rental, Hiring & Real Estate
25.2 45.1 24.1 5.5 * * * * 35.2 39.1 14.5 11.2
Professional, Scientific & Technical
15.8 8.3 46.9 29.1 24.9 13.0 36.0 26.2 7.0 18.2 62.5 12.3
Administrative & Support
2.1 20.5 62.9 14.5 25.4 31.8 38.5 4.4 29.1 36.8 17.9 16.1
Public Admin & Safety
8.6 14.2 49.1 28.1 7.1 22.3 52.2 18.4 32.2 31.1 26.8 9.9
Education & Training
4.8 1.7 46.3 47.1 1.6 23.0 21.5 53.9 4.1 11.4 51.4 33.1
Health Care & Social Assistance
1.5 19.0 31.7 47.8 9.4 21.4 34.5 34.7 12.3 19.2 54.5 14.0
Arts & Recreation * * * * * * * * 33.2 22.8 28.7 15.3
Other 5.3 41.4 18.3 35.0 12.2 38.0 43.0 6.8 25.6 44.3 26.4 3.7
All industries 26.4 18.1 36.8 18.8 25.3 30.4 29.6 14.8 24.3 34.1 32.0 9.6
Note: Asterisks denote suppressed values. Results are not reported where there are fewer than 30 responses.
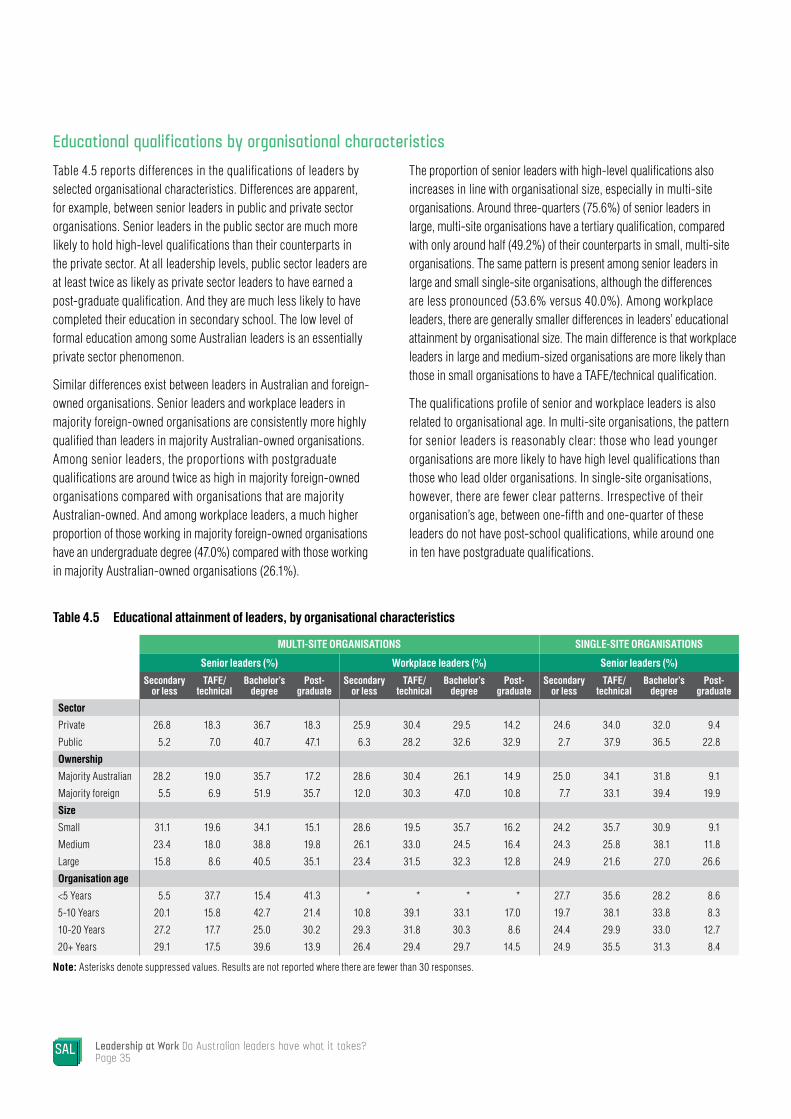
Leadership at Work Do Australian leaders have what it takes?Page 35
Educational qualifications by organisational characteristics Table 4.5 reports differences in the qualifications of leaders by selected organisational characteristics. Differences are apparent, for example, between senior leaders in public and private sector organisations. Senior leaders in the public sector are much more likely to hold high-level qualifications than their counterparts in the private sector. At all leadership levels, public sector leaders are at least twice as likely as private sector leaders to have earned a post-graduate qualification. And they are much less likely to have completed their education in secondary school. The low level of formal education among some Australian leaders is an essentially private sector phenomenon.
Similar differences exist between leaders in Australian and foreign-owned organisations. Senior leaders and workplace leaders in majority foreign-owned organisations are consistently more highly qualified than leaders in majority Australian-owned organisations. Among senior leaders, the proportions with postgraduate qualifications are around twice as high in majority foreign-owned organisations compared with organisations that are majority Australian-owned. And among workplace leaders, a much higher proportion of those working in majority foreign-owned organisations have an undergraduate degree (47.0%) compared with those working in majority Australian-owned organisations (26.1%).
The proportion of senior leaders with high-level qualifications also increases in line with organisational size, especially in multi-site organisations. Around three-quarters (75.6%) of senior leaders in large, multi-site organisations have a tertiary qualification, compared with only around half (49.2%) of their counterparts in small, multi-site organisations. The same pattern is present among senior leaders in large and small single-site organisations, although the differences are less pronounced (53.6% versus 40.0%). Among workplace leaders, there are generally smaller differences in leaders’ educational attainment by organisational size. The main difference is that workplace leaders in large and medium-sized organisations are more likely than those in small organisations to have a TAFE/technical qualification.
The qualifications profile of senior and workplace leaders is also related to organisational age. In multi-site organisations, the pattern for senior leaders is reasonably clear: those who lead younger organisations are more likely to have high level qualifications than those who lead older organisations. In single-site organisations, however, there are fewer clear patterns. Irrespective of their organisation’s age, between one-fifth and one-quarter of these leaders do not have post-school qualifications, while around one in ten have postgraduate qualifications.
Table 4.5 Educational attainment of leaders, by organisational characteristics
MULTI-SITE ORGANISATIONS SINGLE-SITE ORGANISATIONS
Senior leaders (%) Workplace leaders (%) Senior leaders (%)
Secondary or less
TAFE/ technical
Bachelor’s degree
Post-graduate
Secondary or less
TAFE/ technical
Bachelor’s degree
Post-graduate
Secondary or less
TAFE/ technical
Bachelor’s degree
Post-graduate
Sector
Private 26.8 18.3 36.7 18.3 25.9 30.4 29.5 14.2 24.6 34.0 32.0 9.4
Public 5.2 7.0 40.7 47.1 6.3 28.2 32.6 32.9 2.7 37.9 36.5 22.8
Ownership
Majority Australian 28.2 19.0 35.7 17.2 28.6 30.4 26.1 14.9 25.0 34.1 31.8 9.1
Majority foreign 5.5 6.9 51.9 35.7 12.0 30.3 47.0 10.8 7.7 33.1 39.4 19.9
Size
Small 31.1 19.6 34.1 15.1 28.6 19.5 35.7 16.2 24.2 35.7 30.9 9.1
Medium 23.4 18.0 38.8 19.8 26.1 33.0 24.5 16.4 24.3 25.8 38.1 11.8
Large 15.8 8.6 40.5 35.1 23.4 31.5 32.3 12.8 24.9 21.6 27.0 26.6
Organisation age
<5 Years 5.5 37.7 15.4 41.3 * * * * 27.7 35.6 28.2 8.6
5-10 Years 20.1 15.8 42.7 21.4 10.8 39.1 33.1 17.0 19.7 38.1 33.8 8.3
10-20 Years 27.2 17.7 25.0 30.2 29.3 31.8 30.3 8.6 24.4 29.9 33.0 12.7
20+ Years 29.1 17.5 39.6 13.9 26.4 29.4 29.7 14.5 24.9 35.5 31.3 8.4
Note: Asterisks denote suppressed values. Results are not reported where there are fewer than 30 responses.

Leadership at Work Do Australian leaders have what it takes?Page 37
4.5 Ethnic and cultural diversity among leadersUnderstanding the ethnic and cultural diversity of today’s workforce and its leadership ensures that our workplaces achieve favourable organisational and societal outcomes. As well as upholding principles of equality, management and leadership that are culturally inclusive have performance benefits (Andrevski et al., 2014). Further, it is important that organisations are inclusive at all levels of their hierarchy (Ely & Thomas, 2001; Olsen & Martins, 2012).
To better understand the ethnic and cultural makeup of Australian leaders, the analysis looks at their place of birth and whether they speak a language other than English at home (Table 4.1). These two measures provide a useful, though incomplete, indicator of ethnic and cultural diversity.
Around three-quarters of senior leaders and workplace leaders are Australian born, which is reflective of the broader Australian population1. Of the leaders born overseas, the largest proportion generally come from the United Kingdom, with significant minorities from New Zealand, Europe and Asia. Around one in ten leaders speak a language other than English at home.
Ethnic and cultural diversity by organisational characteristicsTable 4.6 provides more detailed information about leaders’ place of birth and language, by characteristics of the organisations they lead.
Senior leaders in public sector organisations are generally more likely to be born outside of Australia than private sector leaders. This is especially true of senior leaders in single-site organisations, of whom 43% in the public sector are overseas-born, compared with 23% in the private sector. At first glance, this suggests that the public sector has more diverse leadership. However, the vast majority (more than 80%) of overseas-born senior leaders in the public sector are from other English-speaking or culturally similar countries2, such as the United Kingdom and New Zealand. This is true of overseas-born leaders in both single- and multi-site public sector organisations.
1 As at June 2015, 28 percent of the Australian population was born overseas. Estimate taken from: ABS Cat. No. 3412.0 - Migration, Australia, 2014-15. Available at: .gov.au/ausstats/[email protected]/mf/3412.0. Last accessed 31 March 2016.
2 Cultural distance and similarity refer to the degree of difference in countries’ cultures (Kogut & Singh, 1988). For example, China and Indonesia are more culturally ‘distant’ from Australia than the UK or New Zealand, as they have fewer common cultural values and practices.
Compared with the public sector, the private sector is more likely to employ senior and workplace leaders from Asia and the Middle East, although their overall numbers remain small. For example, 4.7% of all private sector workplace leaders are born in Asian and Middle Eastern countries, compared with 0.5% of public sector workplace leaders. Private sector workplace leaders are more likely than their public sector counterparts to speak a language other than English at home (9.0% versus 6.4%).
A higher proportion of senior and workplace leaders in foreign-owned organisations are born overseas compared to Australian-owned organisations. This pattern is evident both for senior and workplace leaders, but is most noticeable among senior leaders. Again, however, most overseas-born leaders are from the United Kingdom or other English-speaking countries. At all three levels of leadership, more than two-thirds of overseas-born leaders in foreign-owned organisations are from English-speaking countries.
Organisational size matters for leaders’ ethnic and cultural diversity, but only for those in senior leadership roles. Senior leaders in small organisations are less likely to speak English at home, reflecting the role of these diaspora in creating and running smaller, family-owned businesses. Workplace leaders, however, look similar across organisational size categories in their place of birth and language patterns.
The results for organisational age in Table 4.6 are mixed. Younger, single-site organisations are more likely to have senior leaders that are born outside Australia and that do not speak English at home. This may again reflect the importance of ethnically-diverse diaspora who establish smaller businesses in Australia. Australian-born leaders predominate, however, in younger, multi-site organisations. And, as noted above for organisational size, there are few differences across organisational age categories in terms of workplace leaders’ place of birth and language patterns.
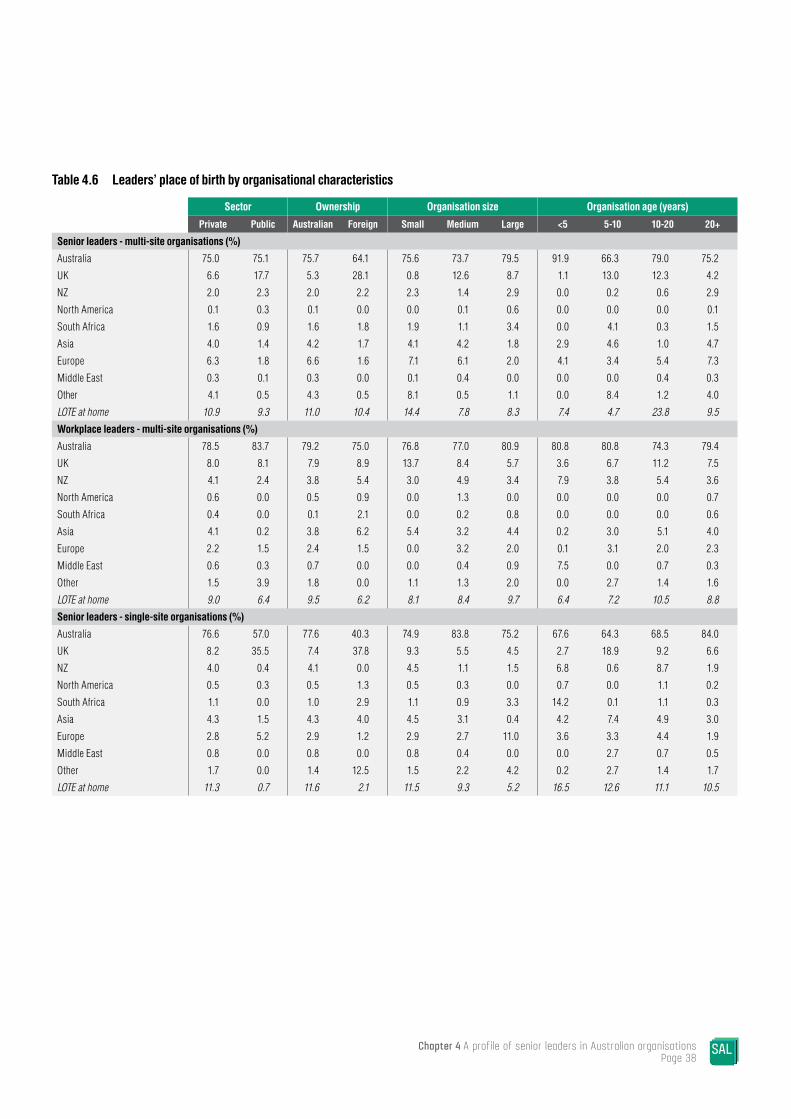
Table 4.6 Leaders’ place of birth by organisational characteristics
Sector Ownership Organisation size Organisation age (years)
Private Public Australian Foreign Small Medium Large <5 5-10 10-20 20+
Senior leaders - multi-site organisations (%)
Australia 75.0 75.1 75.7 64.1 75.6 73.7 79.5 91.9 66.3 79.0 75.2
UK 6.6 17.7 5.3 28.1 0.8 12.6 8.7 1.1 13.0 12.3 4.2
NZ 2.0 2.3 2.0 2.2 2.3 1.4 2.9 0.0 0.2 0.6 2.9
North America 0.1 0.3 0.1 0.0 0.0 0.1 0.6 0.0 0.0 0.0 0.1
South Africa 1.6 0.9 1.6 1.8 1.9 1.1 3.4 0.0 4.1 0.3 1.5
Asia 4.0 1.4 4.2 1.7 4.1 4.2 1.8 2.9 4.6 1.0 4.7
Europe 6.3 1.8 6.6 1.6 7.1 6.1 2.0 4.1 3.4 5.4 7.3
Middle East 0.3 0.1 0.3 0.0 0.1 0.4 0.0 0.0 0.0 0.4 0.3
Other 4.1 0.5 4.3 0.5 8.1 0.5 1.1 0.0 8.4 1.2 4.0
LOTE at home 10.9 9.3 11.0 10.4 14.4 7.8 8.3 7.4 4.7 23.8 9.5
Workplace leaders - multi-site organisations (%)
Australia 78.5 83.7 79.2 75.0 76.8 77.0 80.9 80.8 80.8 74.3 79.4
UK 8.0 8.1 7.9 8.9 13.7 8.4 5.7 3.6 6.7 11.2 7.5
NZ 4.1 2.4 3.8 5.4 3.0 4.9 3.4 7.9 3.8 5.4 3.6
North America 0.6 0.0 0.5 0.9 0.0 1.3 0.0 0.0 0.0 0.0 0.7
South Africa 0.4 0.0 0.1 2.1 0.0 0.2 0.8 0.0 0.0 0.0 0.6
Asia 4.1 0.2 3.8 6.2 5.4 3.2 4.4 0.2 3.0 5.1 4.0
Europe 2.2 1.5 2.4 1.5 0.0 3.2 2.0 0.1 3.1 2.0 2.3
Middle East 0.6 0.3 0.7 0.0 0.0 0.4 0.9 7.5 0.0 0.7 0.3
Other 1.5 3.9 1.8 0.0 1.1 1.3 2.0 0.0 2.7 1.4 1.6
LOTE at home 9.0 6.4 9.5 6.2 8.1 8.4 9.7 6.4 7.2 10.5 8.8
Senior leaders - single-site organisations (%)
Australia 76.6 57.0 77.6 40.3 74.9 83.8 75.2 67.6 64.3 68.5 84.0
UK 8.2 35.5 7.4 37.8 9.3 5.5 4.5 2.7 18.9 9.2 6.6
NZ 4.0 0.4 4.1 0.0 4.5 1.1 1.5 6.8 0.6 8.7 1.9
North America 0.5 0.3 0.5 1.3 0.5 0.3 0.0 0.7 0.0 1.1 0.2
South Africa 1.1 0.0 1.0 2.9 1.1 0.9 3.3 14.2 0.1 1.1 0.3
Asia 4.3 1.5 4.3 4.0 4.5 3.1 0.4 4.2 7.4 4.9 3.0
Europe 2.8 5.2 2.9 1.2 2.9 2.7 11.0 3.6 3.3 4.4 1.9
Middle East 0.8 0.0 0.8 0.0 0.8 0.4 0.0 0.0 2.7 0.7 0.5
Other 1.7 0.0 1.4 12.5 1.5 2.2 4.2 0.2 2.7 1.4 1.7
LOTE at home 11.3 0.7 11.6 2.1 11.5 9.3 5.2 16.5 12.6 11.1 10.5
Chapter 4 A profile of senior leaders in Australian organisations Page 38
3 Future leadership challenges
The question guiding the Study of Australian Leadership is whether Australian organisations have the leadership and management capabilities they need to meet twenty-first century challenges. This chapter reports on SAL findings which show how Australian business leaders make sense of the external environment and what they identify as the major organisational challenges they face.
5.1 Identifying future challengesWhen asking whether Australian organisations have the leadership and management capabilities to face the twenty-first century, Chapter 1 noted a number of existing and emergent challenges likely to shape how organisations adapt and compete. These challenges create a difficult operating environment for many organisations across most sectors. Australian businesses now face an external environment that is rapidly evolving and characterised by disruption, uncertainty and complexity.
One critical leadership capability that has attracted increasing attention from leadership researchers is ‘sensemaking’. The term sensemaking means reading cues in a dynamic setting to understand what is actually happening, why it is important, and how best to respond to change. For the classic treatment of sensemaking in organisations, see Weick (1995). This process of sensemaking is undertaken by both leaders and employees every day, but it is a particularly salient and explicit part of the role of leaders (Mumford et al., 2007).
The importance of sensemaking and its consequences increases with the seniority of leadership and its impact on strategic decision-making (Eisenhardt, 1989). Leadership scholars view sensemaking as three related processes (Gioia & Chittipeddi, 1991). These are:
» Information seeking: leaders scan their internal and external environment for issues and challenges likely to disrupt existing routines and models for operations and that require adaption. Leaders look for a new trend or issue that does not make sense or is significant for the organisation’s viability or performance.
» Sensegiving: leaders communicate their understanding of the complexity and ambiguity that marks their organisation’s operating environment and attempt to build a shared understanding among managers and employees about that environment and what it means for strategic focus, the work done, and how work is organised.
» Change: negotiating strategic and operational change on the basis of this understanding (Lant, 2002).
This chapter reports survey findings related to questions that capture these sensemaking activities of senior leaders. SAL asked senior leaders about the sources of advice they use in strategic decision-making, including from external organisational leaders, board members, industry bodies, consultants or government agencies, and whether formal benchmarking activities were used.
SAL also asked leaders about the aspects of their current operating environment that are most likely to shape strategic choices in the future. In order to capture how senior leaders understood their current operating environment, they were asked to respond to a widely used measure of the extent to which they currently face a turbulent external environment1. This turbulence may be driven by a number of factors, including the intensity of competition, the entry of new competitors, technological disruption, or regulatory factors. SAL also asked senior leaders to identify the most pressing challenges their organisation faces over the coming five-year period. This item provides a rich picture of how senior leaders make sense of the rapidly changing and complex environment to which they must adapt.
SAL also captures information about the constraints senior leaders face in meeting these challenges. To explore this SAL draws on quantitative and qualitative responses given by senior organisational leaders.
1 See ‘Environmental Turbulence’ in Technical Appendix.
Leadership at Work Do Australian leaders have what it takes?Page 39
5

Key Findings » Senior leaders draw upon a variety of sources of
information for operational and strategic decision-making, but many do not seek external advice or draw upon potential sources such as benchmarking.
» When asked an open-ended question about the most significant challenges facing their organisations over the next five years, senior leaders responded largely within six themes: market and competitive pressures, operational challenges, government and regulation, human resource challenges, technological disruption, economic volatility and uncertainty.
» Senior leaders’ perceptions of four types of environmental turbulence (relating to customers, competitive disruption, competitive intensity, and technology) vary substantially by industry, organisation size, and organisation age, but turbulence due to technological disruption is perceived as particularly high across Australian organisations.

5.2 Information seeking: strategic advice
In making sense of their external environment, senior leaders draw on information, evidence, ideas and ‘mental models’ from a variety of sources (Thomas et al., 2001). SAL asked senior leaders questions about their advice-seeking practices and the sources from which strategic advice was sought: from top managers in other organisations2; from their board and directors; and through benchmarking – gathering information about their performance relative to another organisation or industry standards. These questions were asked of senior leaders in multi-site organisations only, with the exception of the question on benchmarking, which was asked of senior leaders in all sites. Summary data are reported in Table 5.1. Around one in ten senior leaders report that, over the previous 12 months, they never sourced strategic advice from a top manager in another organisation. A further quarter (27.2%) did so rarely, while the remainder did so with varying degrees of frequency.
Even among those who had sought outside advice, 60.2% rarely or never sought advice about future strategic options.
Boards play an active role in strategic decision making, especially the process of monitoring strategic decision-making and, to a lesser degree, evaluating senior leadership performance. Little weight is placed on using outside directors as a sounding board for strategic decision-making, with around one-third of senior leaders indicating that this was never the case. The overwhelming majority of senior leaders reported that the board deferred to senior leaders on strategic decisions.
In relation to benchmarking against other organisations or industry standards – a question asked of senior leaders in both multi-and single-site organisations – Table 5.1 indicates less than half (45.3%) of all senior leaders report that benchmarking had been used over the previous two years.
2 This terminology was used in the question text: ‘In the last 12 months, how many times have you sought advice on strategic issues from a top manager at another organisation?’
Leadership at Work Do Australian leaders have what it takes?Page 41


Table 5.1 Sources of strategic insight
Source Frequency (amount of times / how often)
Stra
tegi
c adv
ice
0 1 - 2 3 - 5 6 - 10 11-20 20+
1. Strategic advice from a top manager in other organisation
22.1 27.2 29.2 14.8 4.1 2.7
Never Once or twice Several times Monthly At least weekly
2. Opinion on current strategy from a top manager in other organisation
14.2 39.6 33.5 10.0 2.7
3. Opinion on future strategy from a top manager in other organisation
22.0 38.2 29.7 8.4 1.7
Role
of b
oard
s and
dire
ctor
s
4. Director challenge on a strategic issue 23.0 31.7 32.1 11.0 2.2
5. Advice form external director outside board/committee meetings
29.0 28.2 31.0 8.2 3.6
None Some Great
6. Strength of board monitoring of strategic decision-making
1.8 3.3 8.6 40.8 45.5
7. Board evaluates senior management performance
5.7 6.8 17.3 36.8 33.4
8. Board defers to top management on strategic decisions
1.3 3.4 19.2 48.5 27.6
9. Seek board assistance to formulate strategy 1.2 4.5 13.3 33.8 47.2
10. Outside directors used as a sounding board on strategic issues
31.7 10.9 16.4 23.9 17.1
Benc
hmar
king Yes No
11. Benchmark against other organisation or industry standard?
45.3 54.7
Survey Questions
1. Strategic advice from a top manager in other organisation: How many times have you sought advice on strategic issues from a top manager at another organisation?
2. Opinion on current strategy from a top manager in other organisation: How often did you seek an opinion on your current strategy from a top manager at another organisation?
3. Opinion on future strategy from a top manager in other organisation: How often did you seek advice on your strategic options from a top manager at another organisation?
4. Director challenge on a strategic issue: How many board meetings have one or more directors challenged your position on a strategic issue?
5. Advice form external director outside board/committee meetings: How often have you sought the advice of an external director outside of board/committee meetings?
6. Strength of board monitoring of strategic decision-making: To what extent does the board monitor top management strategic decision making?
7. Board evaluates senior management performance: To what extent does the board formally evaluate your performance?
8. Board defers to top management on strategic decisions: To what extent does the board defer to your judgement on final strategic decisions?
9. Seek board assistance to formulate strategy: To what extent do you solicit board assistance in the formulation of corporate strategy?
10. Outside directors used as a sounding board: To what extent do you use outside directors as a ‘sounding board’ on strategic issues?
11. Benchmark against other organisation or industry standard: Over the last two years, has your organisation benchmarked itself against any other organisation or industry standard? (By this we mean examining the ways things are done at other organisations and comparing them with this organisation).
Leadership at Work Do Australian leaders have what it takes?Page 43

Other sources of adviceSenior leaders seek strategic advice from a range of other sources. They were asked how often they turned to other sources. Table 5.2 shows that the majority of senior leaders use external consultants or professionals and employer or industry associations. Government agencies are used less frequently. Specifically, less than one in ten (7.8%) use Enterprise Connect, while a large proportion use the Fair Work Commission or the Fair Work Ombudsman (41.1%), or another government agency (52.2%). Use of government agencies or bodies was infrequent. Around one-third of senior leaders (30.3%) seek advice or information from academic institutions or research bodies, but they do so infrequently; less than one in five senior leaders (15.1%) sought information and advice from this group on more than one or two occasions.
Table 5.2 indicates that a significant proportion of senior leaders rely on industry and employer associations for information or advice. SAL asked senior leaders if their organisation was a member of an employer association or network (Table 5.3). Around one in five (19.5%) organisations do not belong to any employer group or industry network. Most belong to an industry specific or trade association (57.8%). Far fewer belong to an employer association (21.5%), a local chamber of commerce (24.0%) or a small business association (17.9%). Slightly more than one-third of organisations (37.2%) belong to some other, less formal information group or industry network.
SAL results show that senior leaders draw upon a wide variety of sources of information and advice at both the operational and strategic decision-making levels. However, a significant proportion do not seek external advice or draw upon any of the potential sources of strategic advice included in the study.
Table 5.2 Sources of advice for senior leaders*
Frequency of use (percent)
In the last 12 months, how often have you sought information or advice from the following bodies:
Never Once or twice Several times Monthly At least weekly
Management consultants, external lawyers or accountants 7.8 27.1 29.7 29.1 6.3
Employer or industry associations 34.1 32.3 21.9 9.6 2.2
Academic institutions or bodies 69.7 15.2 8.1 5.1 1.9
Fair Work Commission or Fair Work Ombudsman 58.8 31.9 7.1 1.9 0.2
Enterprise Connect 92.1 4.4 2.6 0.8 0.0
Any other government department or agency 47.9 25.7 15.7 6.6 4.2
* The question was asked of senior leaders in both multi- and single-site organisations.
Table 5.3 Membership of employer groups or industry networks
Employer group or network: Percent
Employers association (e.g. ACCI, AIG) 21.5
Industry or trade association (e.g. Plastics and Chemical Industry Association) 57.8
A local chambers of commerce 24.0
Small business association (e.g. SBAA, FBA) 17.9
Some other information group or network of businesses 37.2
None of these 19.5
Don't know 1.2
Question: Is this organisation a member of the following membership organisations?
Chapter 5 Future leadership challenges Page 44
5.3 Sensegiving: current challengesSAL included a widely used measure of environmental turbulence faced by organisations (Table 5.4).
Shaded cells indicate those industries and organisation groups that report facing a higher than average degree of turbulence. This measure captures the degree to which a senior leader perceives their organisation as facing four different types of environmental turbulence or disruption:
» Changing customer preferences or new customers.
» Disruption from existing or new competitors.
» The intensity of competitive pressures.
» Technological disruption.
The nature of environmental turbulence varies between industries. No industry, for example, reports an above-average level of turbulence across all four types of environmental turbulence, although three of the four areas of turbulence are major factors in three industries: Retail Trade; Accommodation and Food Services; and Transport, Postal and Warehousing. Three industries reported a below-average level of turbulence across all four areas: Manufacturing; Electricity, Gas, Water and Waste Services; and Arts and Recreation Services.
Not surprisingly, across all industries, technological disruption is perceived as the most significant source of environmental turbulence, and it is most acute in Information Media and Telecommunications.
Competition is a frequent source of turbulence, in the form of both competitor disruption and competitive intensity, though the latter is more prominent across more industries. Across industries, changing customer preferences or new customers is seen as generating the highest perceived level of turbulence in Education and Training. However, senior leaders in this sector still view technological disruption as the strongest source of turbulence.
Some of the results reported here were expected – for example, the higher-than-average level of technological disruption reported among senior leaders in Information, Media and Telecommunications; Rental, Hiring and Real Estate Services; Professional, Scientific and Technical Services; and Other Services. Perceptions in some industries are more surprising. For example, senior leaders in Manufacturing report low levels of environmental turbulence across all four measures.
Some differences emerge by organisation size and age. Senior leaders in large organisations report a higher level of changing customer preferences or new customers than those in small and medium-sized organisations. Large organisations also see technological disruption as a more intense source of environmental turbulence than do small and medium-sized organisations. Leaders of medium-sized organisations perceive more competitor disruption than do leaders of other organisations. Organisations that are one to less than five years old perceive particularly high levels of environmental turbulence across all four measures, and organisations that are five to less than 10 years old perceive higher turbulence due to all sources except for technological disruption.
Leadership at Work Do Australian leaders have what it takes?Page 45
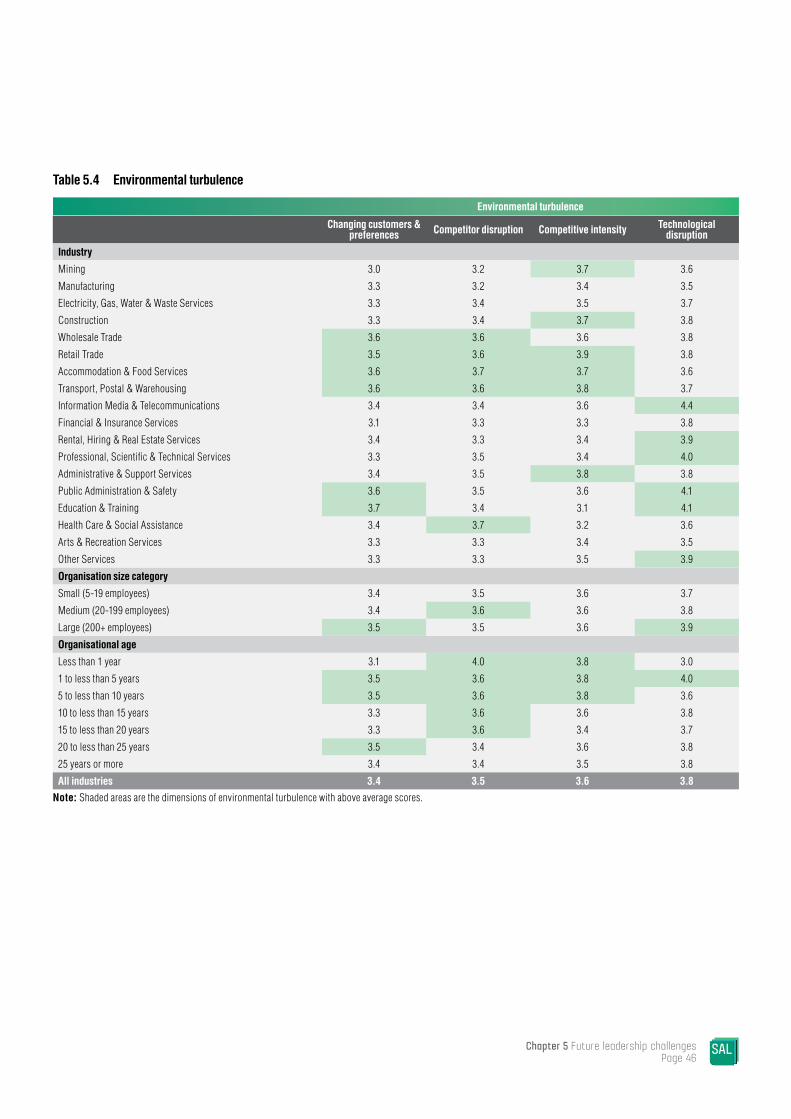
Table 5.4 Environmental turbulence
Environmental turbulence
Changing customers & preferences Competitor disruption Competitive intensity Technological
disruption
Industry
Mining 3.0 3.2 3.7 3.6
Manufacturing 3.3 3.2 3.4 3.5
Electricity, Gas, Water & Waste Services 3.3 3.4 3.5 3.7
Construction 3.3 3.4 3.7 3.8
Wholesale Trade 3.6 3.6 3.6 3.8
Retail Trade 3.5 3.6 3.9 3.8
Accommodation & Food Services 3.6 3.7 3.7 3.6
Transport, Postal & Warehousing 3.6 3.6 3.8 3.7
Information Media & Telecommunications 3.4 3.4 3.6 4.4
Financial & Insurance Services 3.1 3.3 3.3 3.8
Rental, Hiring & Real Estate Services 3.4 3.3 3.4 3.9
Professional, Scientific & Technical Services 3.3 3.5 3.4 4.0
Administrative & Support Services 3.4 3.5 3.8 3.8
Public Administration & Safety 3.6 3.5 3.6 4.1
Education & Training 3.7 3.4 3.1 4.1
Health Care & Social Assistance 3.4 3.7 3.2 3.6
Arts & Recreation Services 3.3 3.3 3.4 3.5
Other Services 3.3 3.3 3.5 3.9
Organisation size category
Small (5-19 employees) 3.4 3.5 3.6 3.7
Medium (20-199 employees) 3.4 3.6 3.6 3.8
Large (200+ employees) 3.5 3.5 3.6 3.9
Organisational age
Less than 1 year 3.1 4.0 3.8 3.0
1 to less than 5 years 3.5 3.6 3.8 4.0
5 to less than 10 years 3.5 3.6 3.8 3.6
10 to less than 15 years 3.3 3.6 3.6 3.8
15 to less than 20 years 3.3 3.6 3.4 3.7
20 to less than 25 years 3.5 3.4 3.6 3.8
25 years or more 3.4 3.4 3.5 3.8
All industries 3.4 3.5 3.6 3.8Note: Shaded areas are the dimensions of environmental turbulence with above average scores.
Chapter 5 Future leadership challenges Page 46
5.4 Sensegiving: future challengesSenior leaders identified the most significant challenges their organisations face over the next five years. Unlike the questions relating to their external environment, this question was open-ended; respondents were free to give an extended answer3. Of the 2,703 senior leaders that completed the questionnaire, 98% answered this question.
These responses were then reviewed and coded for a systematic assessment of the themes. In total, over 80 themes appear with varying degrees of frequency. The six most significant themes are discussed. Specifically, these themes are:
1. Market and competitive pressures.
2. Operational challenges.
3. Government and regulation.
4. Human resource and human capital.
5. Technological disruption.
6. The external operating environment: volatility and uncertainty.
These six themes are listed in the order of the frequency with which they were identified – from most to least frequent.
3 The question asked was: ‘Thinking about the future of your organisation, what do you see as the most critical challenges you will face in the next five years?’
Market and competitive pressuresMarkets and competition are nominated by around half of all respondents. As one respondent noted:
'Staying competitive in a changing market. Making sure price stays competitive, but while still able to be profitable given spiralling costs.'
Meeting an increasingly competitive market is the dominant theme. New competition is emerging from several sources – from international competitors in an open market, to the competitive disruption from customers and clients using the internet to gain pricing and other information from competitors, and their ability to purchase from suppliers anywhere in the world.
'The internet. People purchase differently. They now buy cheap stuff on the internet.'
'Internet sales are the biggest killer of this industry. The biggest problem is people can get on the internet and buy products from the United States and buy our products very cheaply over there.'
These pressures are most evident in Wholesale and Retail Trade, but are identified by businesses across sectors. These pressures are associated with intense price competition – especially from overseas competitors able to undercut prices – as well as a higher degree of price sensitivity from customers.
'Basically customers wanting to pay less for what they've had previously at a higher price.'
'Like all business out there the people we deal with are always looking for a lower price service. And it comes down to what they pay … you have to be really competitive with pricing.'
The issue of price competition is, not surprisingly, linked to cost pressures, with many respondents indicating they face limited ability to raise prices in line with rising costs.
Leadership at Work Do Australian leaders have what it takes?Page 47
In the context of these pressures, senior leaders commonly identified three challenges for their organisation’s competitive position:
» How to maintain or defend their existing markets/market share or position.
» How to identify and exploit new market opportunities.
» How to understand the needs of existing and new customers.
A small proportion of respondents identify ways in which their organisation is adapting to competitive pressures. For some, this is linked to a perceived need to explore new pricing models or, more fundamentally, a new business model reflecting different approaches used by online retailers and new competitors.
'Probably making sure that we continue to evolve and evolve in a way that we can respond to market requests -- it's important to be responsive and have high customer service.'
'The need for us to change our whole business model so that it is built from the customers’ needs.'
'To come up with differentiation strategies, so innovation in providing service to customers throughout the lifetime of the customer, customer lifetime value, get-keep-grow strategies -- innovation is the key.'
Online markets are also identified as creating new opportunities to expand customer base and markets in which they operate without requiring a physical presence. Some senior leaders see value in a defensive response through greater protection for domestic businesses.
Operational challengesThe next most significant theme relates to operating profitably. Specifically, senior leaders raised matters such as costs structures, operational efficiency, improving quality, and managing innovation and change.
Cost ranks highest among operational issues. Cutting costs, however, presents pressures on other drivers of business success, as the following quote highlights:
'How to reduce our costs of operations and at the same time maintain the quality of our products without compromising on compliance on environmental and safety regulations.'
Cost pressures emanate from a number of different sources including the overheard costs of running a business, costs of regulatory compliance and, most commonly, labour costs:
'The price of labour in Australia as compared to the rest of the world. Labour rates compared to imported product that comes in from China, etc.'
'The high costs of labour are a killer.'
Labour costs are an acute issue for organisations operating extended hours and those competing directly with imported goods.
Costs, however, are not the only challenge. Quality, efficiency, and the need to respond to market pressures by managing change and innovation are also critical challenges. Of these, the respondents are most expansive on the issue of managing change and innovation.
'As an organisation we need to be nimble and respond faster at lower cost. We need to rapidly adapt to innovation.'
'We need to maintain innovative marketing and promotions to ensure market share.'
'To come up with differentiation strategies, so innovation in providing service to customers throughout the lifetime of the customer, customer lifetime value, get-keep-grow strategies, innovation is the key.'
As these quotes suggest, senior leaders who see this as a key challenge identify a wide array of ways in which their organisations need to be innovative. These range from technological innovations (including operational systems) and the need to innovate products and services through to areas related to how staff are organised and managed, marketing, and customer service.
Chapter 5 Future leadership challenges Page 48
Leadership at Work Do Australian leaders have what it takes?Page 49
Government and the regulatory environmentConcern about the future role of government and regulatory burden is a prominent theme which senior leaders identify as a critical future challenge. Again, this theme captures a nuanced set of issues, including:
» Concerns about the cost associated with regulatory compliance, or overall regulatory burden, which impedes the ability for some organisations to adapt to their changing environment.
» The costs of complying with regulations across jurisdictions, and with international standards.
'The most critical challenge we will face in the next five years are probably navigating government policy changes and regulatory changes.'
'The rules and regulations are slowly drowning us…'
'The biggest hurdle that the business faces is the amount of time spent fulfilling statutory obligations versus business operations, than in the past. In a service-based industry, time is money'
More commonly, senior leaders associate the challenge of accommodating regulatory change with the fact that these changes are perceived to be driven by politics, not good policy.
'… my job's basically gone from running a business to being a pseudo solicitor. I spend most of my time reading about changes to our regulations than I do running the business.'
'The political interference and/or bureaucracy and/or creating red tape that causes local government to do business with itself.'
'The general economic climate and government regulation – too much regulation in context of political climate implemented as part of politics, not economic sense.'
'Government regulations, state and local government - too much regulation and it is confusing…. [It] also makes one nervous going ahead as we don't know how the regulations will be changed or interpreted.'
Many of these concerns reflect regulatory arrangements within specific industries – for example liquor licensing laws in Accommodation and Food Services. A significant proportion of senior leaders from this sector also highlighted the challenge of operating with penalty rates. However, perhaps surprisingly, workplace relations did not figure prominently as a future challenge facing most organisations.
Human resources and human capitalNeither workplace regulations nor labour relations and unions figure prominently in senior leaders’ most significant challenges over the next five years. These issues are identified as a challenge by a small proportion of respondents. A far more significant issue – nominated by around one in four senior leaders – are the challenges of accessing the skills and personnel required by the organisation. This challenge transcends industry and organisational size, although it is more acute for regional organisations, smaller organisations and in some sectors, such as Health Care and Social Assistance.
This challenge extends to the issue of how to retain skilled staff in the competitive or high-stress work environments of particular sectors. For some respondents, this problem represents a systemic issue:
'Tradesman coming out nowadays are not as knowledgeable as they once were. Employers aren't being offered the necessary incentives to actually train staff. You have apprentices who at completion of their trade earn a minimum of $70,000 pa but my sub-contractors are earning between $150,000-$220,000. We have to put an apprentice through four years of training, but we have to pay them, whereas if they went to uni, uni doesn't pay them to study. The employer should be subsidised, otherwise they won't train them and they're not ... None of my sub-contractors have apprentices and I'm down to my last one. I use to have three to five apprentices and I'm down to one and the only reason I have him is because he's my son.'
Some senior leaders see disincentives to invest in skills, but many others see training as an imperative to compete and grow:
'Another challenge will be up skilling our staff, having knowledge about the latest research and about how to have the best practice.'
'Training, specific training on customer service to ensure that our staff are very customer service focused, we are spending a lot of money on training, our customers are expecting more first-class valet type service.'
'The need to train people – our business model is very dependent on the skills of our people and they need to have the skills to be empowered and make decisions.'

Chapter 5 Future leadership challenges Page 50
Skill shortages are not simply an issue of a competitive market for talent. Many senior leaders see their ageing workforce as a major challenge.
'…we have a lot of senior people who will reach retirement age so recruiting and developing the right people to take us forward after that happens.'
'Generational change is a fairly big one. A lot of people in our industry [are] getting old and we need to find new, young blood, which is hard to find.'
An ageing workforce implies a host of potential issues: replacing large numbers of personnel who retire within a short period of time, transferring knowledge and skills from older to younger workers, and training younger workers quickly.
The skills shortages extend to the ageing cohort of senior and workplace leaders, especially for small, privately-held organisations.
'When I want to retire, who will look after the place? Promotions for staff, getting them ready to take over.'
'Leadership. I plan to retire, finding the right person that we want…'
'...the development of suitable leadership and management to continue to run our business.'
'Succession – we have a lot of senior people who will reach retirement age so recruiting and developing the right people to take us forward after that happens.'
'Leadership succession. I'm the founder and CEO for the last 26 years and sooner or later I'm going to retire, so I think it's important that the board works to create a new leader.'
Technological disruptionTechnological disruption is a significant future challenge for one in five senior leaders. Their concern centres on the challenge of keeping up with technological change and its likely impact on the organisation.
'Technological threats. I suspect our industry won't exist as a result of technology taking over the work we do.'
'Increasing use of new technologies without the opportunity to amortise the cost of previous investment.'
'Technology: ever evolving technology, keeping pace with technology, and managing introduction of appropriate technology advancements to the business and not investing time nor money on tech that is not going to benefit the personnel, business, or our consumers.'
Many senior leaders connect technological change to operational, workforce and market challenges. In some sectors, these effects are reflected in the way that organisations interact with customers and clients; other senior leaders identify the potential of technology to improve operational and business performance.
The external operating environment: volatility and uncertaintySenior leaders’ reflections on future economic challenges reflect what many researchers describe as a ‘perfect storm’: economic slowdown, intense market competition, technological disruption and economic volatility or uncertainty.
'Economic slowdown in Australia. The hollowing out of Australia’s business diversity generated by the mining boom, which reduced customer base and demand for our products. Finding growth in what is a very tepid economy whilst maintaining costs.'
A critical source of volatility and uncertainty is exposure to international markets, in particular, the fluctuations in the Australian dollar.
'…the exchange rate has the biggest impact on our business for our competitive pricing.'
Senior leaders associate exposure to global markets with vulnerability to global shocks and operating in a complex environment.
Beyond these issues, volatility and uncertainty are largely industry-specific challenges. For example, in the Mining industry, price volatility and falling commodity prices are of paramount concern. In Building and Construction, in contrast, uncertainty about property prices and infrastructure development is far more significant. For senior leaders in Manufacturing, the closure of the car industry and its flow on effects are more significant future challenges.
3 Leadership and management fundamentals
Effective leadership requires the mastery of management fundamentals, including performance monitoring, target-setting, and use of incentives. This chapter reports findings that suggest Australian workplaces have significant room for improvement in these regards. SAL data show that workplaces with better fundamental management practices experience improved performance and employee outcomes, above and beyond other leadership variables.
As defined in Chapter 2, leadership entails influencing people and their efforts towards the achievement of organisational objectives. Contemporary leadership scholars generally adopt a contingency approach to leadership –– meaning that the leadership approach should match or complement the organisation’s context, strategy and culture.
However, it has been proposed that there are fundamental aspects of leadership and management that are common across organisations, regardless of contextual and organisational characteristics. This chapter reviews the distinct but related concepts of leadership and management and explains the types of practices that comprise the ‘fundamentals’ of effective leadership and management. The chapter then presents findings on how Australian workplaces fare in terms of these practices and why they are important to maximise workplace outcomes.
Key Findings » Australian leaders, on the whole, have not mastered
the fundamentals of management, though there is some variation in management practices by industry, workplace size, organisational legal status, and workplace age.
» There are several particularly troubling deficiencies among Australian workplaces, with regards to the adoption of specific fundamental management practices.
» Management practices scores positively and significantly relate to a number of organisational performance outcomes and employee perceptions.
» Good management practices contribute to several of these outcomes above and beyond leadership perceptions.
Leadership at Work Do Australian leaders have what it takes?Page 51
6

Australian leaders, on the whole, have not mastered
the fundamentals of management, though
there is some variation in management practices by industry, workplace size,
organisational legal status, and workplace age

6.1 Leadership versus management: is there a difference?
Some researchers argue that leadership and management are completely distinct. However, drawing on the work of Fayol (1929) and Mintzberg (1973), others conceptualise leadership as one element performed by managers. Effective management, they argue, entails inspiring others and ensuring followers realise their full potential.
While leadership and management are distinct concepts, in practice, the distinction is not always so clear. This is why SAL adopts an approach that acknowledges that these concepts are both distinct and interrelated. A leader is most effective when they have formal recognition for their management role and are good at fulfilling their formal management responsibilities.
Likewise, a manager is most effective when they are a capable leader. In the ideal organisation, therefore, the managers are good leaders – able to exert influence over tasks, strategies, and people effectively. What is often overlooked, however, is the fact that in the ideal organisation, leaders are also good managers – able to fulfil formal responsibilities around setting and meeting targets and achieving objectives through organisational systems and practices. To this end, SAL explores the management capabilities present in Australian workplaces as discussed in the following sections.
Leadership at Work Do Australian leaders have what it takes?Page 53

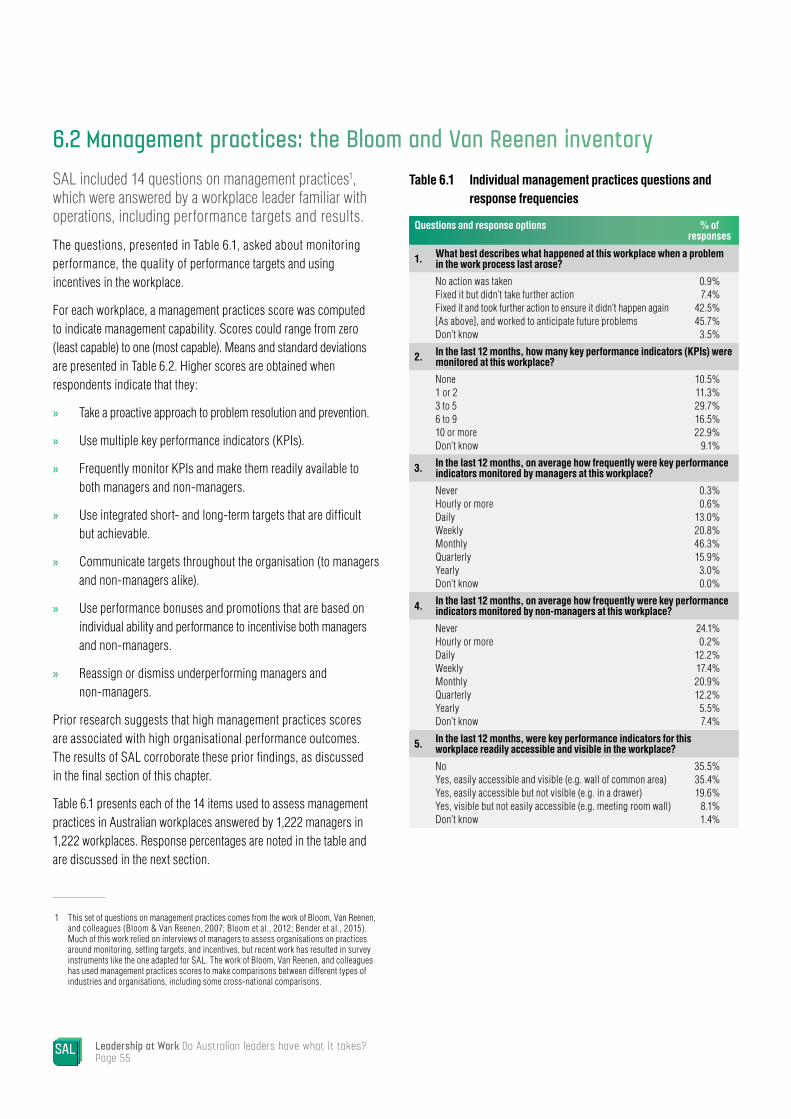
6.2 Management practices: the Bloom and Van Reenen inventorySAL included 14 questions on management practices1, which were answered by a workplace leader familiar with operations, including performance targets and results.
The questions, presented in Table 6.1, asked about monitoring performance, the quality of performance targets and using incentives in the workplace.
For each workplace, a management practices score was computed to indicate management capability. Scores could range from zero (least capable) to one (most capable). Means and standard deviations are presented in Table 6.2. Higher scores are obtained when respondents indicate that they:
» Take a proactive approach to problem resolution and prevention.
» Use multiple key performance indicators (KPIs).
» Frequently monitor KPIs and make them readily available to both managers and non-managers.
» Use integrated short- and long-term targets that are difficult but achievable.
» Communicate targets throughout the organisation (to managers and non-managers alike).
» Use performance bonuses and promotions that are based on individual ability and performance to incentivise both managers and non-managers.
» Reassign or dismiss underperforming managers and non-managers.
Prior research suggests that high management practices scores are associated with high organisational performance outcomes. The results of SAL corroborate these prior findings, as discussed in the final section of this chapter.
Table 6.1 presents each of the 14 items used to assess management practices in Australian workplaces answered by 1,222 managers in 1,222 workplaces. Response percentages are noted in the table and are discussed in the next section.
1 This set of questions on management practices comes from the work of Bloom, Van Reenen, and colleagues (Bloom & Van Reenen, 2007; Bloom et al., 2012; Bender et al., 2015). Much of this work relied on interviews of managers to assess organisations on practices around monitoring, setting targets, and incentives, but recent work has resulted in survey instruments like the one adapted for SAL. The work of Bloom, Van Reenen, and colleagues has used management practices scores to make comparisons between different types of industries and organisations, including some cross-national comparisons.
Table 6.1 Individual management practices questions and response frequencies
Questions and response options % of responses
1. What best describes what happened at this workplace when a problem in the work process last arose?
No action was takenFixed it but didn’t take further actionFixed it and took further action to ensure it didn’t happen again [As above], and worked to anticipate future problemsDon’t know
0.9%7.4%
42.5%45.7%
3.5%
2. In the last 12 months, how many key performance indicators (KPIs) were monitored at this workplace?
None1 or 23 to 56 to 910 or moreDon’t know
10.5%11.3%29.7%16.5%22.9%
9.1%
3. In the last 12 months, on average how frequently were key performance indicators monitored by managers at this workplace?
NeverHourly or moreDailyWeeklyMonthlyQuarterlyYearlyDon’t know
0.3%0.6%
13.0%20.8%46.3%15.9%3.0%0.0%
4. In the last 12 months, on average how frequently were key performance indicators monitored by non-managers at this workplace?
NeverHourly or moreDailyWeeklyMonthlyQuarterlyYearlyDon’t know
24.1%0.2%
12.2%17.4%20.9%12.2%
5.5%7.4%
5. In the last 12 months, were key performance indicators for this workplace readily accessible and visible in the workplace?
NoYes, easily accessible and visible (e.g. wall of common area)Yes, easily accessible but not visible (e.g. in a drawer)Yes, visible but not easily accessible (e.g. meeting room wall)Don’t know
35.5%35.4%19.6%
8.1%1.4%
Leadership at Work Do Australian leaders have what it takes?Page 55
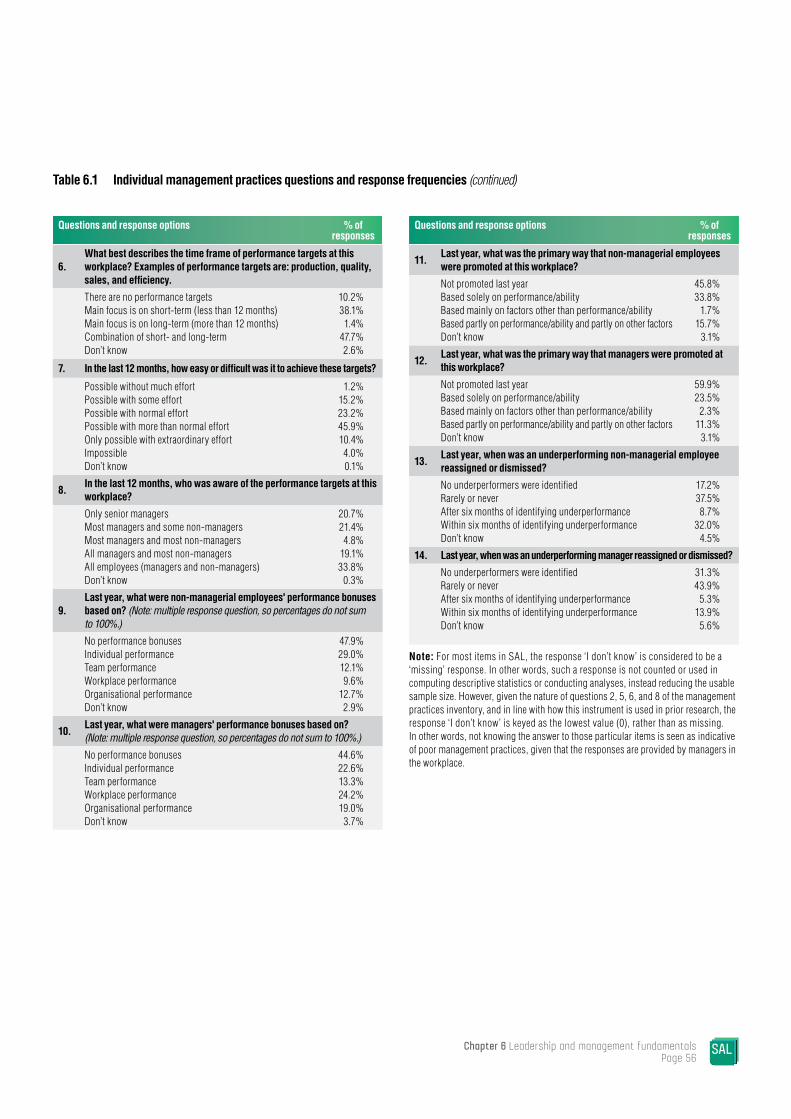
Questions and response options % of responses
6.What best describes the time frame of performance targets at this workplace? Examples of performance targets are: production, quality, sales, and efficiency.
There are no performance targetsMain focus is on short-term (less than 12 months)Main focus is on long-term (more than 12 months)Combination of short- and long-termDon’t know
10.2%38.1%1.4%
47.7%2.6%
7. In the last 12 months, how easy or difficult was it to achieve these targets?
Possible without much effortPossible with some effortPossible with normal effortPossible with more than normal effortOnly possible with extraordinary effortImpossibleDon’t know
1.2%15.2%23.2%45.9%10.4%4.0%0.1%
8.In the last 12 months, who was aware of the performance targets at this workplace?
Only senior managersMost managers and some non-managersMost managers and most non-managersAll managers and most non-managersAll employees (managers and non-managers)Don’t know
20.7%21.4%4.8%
19.1%33.8%
0.3%
9.Last year, what were non-managerial employees' performance bonuses based on? (Note: multiple response question, so percentages do not sum to 100%.)
No performance bonusesIndividual performanceTeam performanceWorkplace performanceOrganisational performanceDon’t know
47.9%29.0%12.1%9.6%
12.7%2.9%
10.Last year, what were managers' performance bonuses based on? (Note: multiple response question, so percentages do not sum to 100%.)
No performance bonusesIndividual performanceTeam performanceWorkplace performanceOrganisational performanceDon’t know
44.6%22.6%13.3%24.2%19.0%3.7%
Questions and response options % of responses
11.Last year, what was the primary way that non-managerial employees were promoted at this workplace?
Not promoted last yearBased solely on performance/abilityBased mainly on factors other than performance/abilityBased partly on performance/ability and partly on other factorsDon’t know
45.8%33.8%
1.7%15.7%
3.1%
12.Last year, what was the primary way that managers were promoted at this workplace?
Not promoted last yearBased solely on performance/abilityBased mainly on factors other than performance/abilityBased partly on performance/ability and partly on other factorsDon’t know
59.9%23.5%
2.3%11.3%
3.1%
13.Last year, when was an underperforming non-managerial employee reassigned or dismissed?
No underperformers were identifiedRarely or neverAfter six months of identifying underperformanceWithin six months of identifying underperformanceDon’t know
17.2%37.5%8.7%
32.0%4.5%
14. Last year, when was an underperforming manager reassigned or dismissed?
No underperformers were identifiedRarely or neverAfter six months of identifying underperformanceWithin six months of identifying underperformanceDon’t know
31.3%43.9%
5.3%13.9%5.6%
Note: For most items in SAL, the response ‘I don’t know’ is considered to be a ‘missing’ response. In other words, such a response is not counted or used in computing descriptive statistics or conducting analyses, instead reducing the usable sample size. However, given the nature of questions 2, 5, 6, and 8 of the management practices inventory, and in line with how this instrument is used in prior research, the response ‘I don’t know’ is keyed as the lowest value (0), rather than as missing. In other words, not knowing the answer to those particular items is seen as indicative of poor management practices, given that the responses are provided by managers in the workplace.
Table 6.1 Individual management practices questions and response frequencies (continued)
Chapter 6 Leadership and management fundamentals Page 56
6.3 Management practices in Australian workplacesTable 6.2 provides an overview of management practices (overall score) in Australia by workplace industry, workplace size (number of employees), organisational legal status, and age of the workplace. Following is a discussion of this overview, as well as several key observations with regards to specific management practices.
Overview of management practices by industryResults from SAL reveal some variation among workplaces by industry. As illustrated in Figure 6.1, workplaces in the Electricity, Gas, Water and Waste Services industry exhibit the highest management practices scores, with a score of 0.66. The Financial and Insurance Services industry (0.60) and the Administrative and Support Services industry (0.58) also score above average. While most other industries come within 0.05 points of the overall mean, the Information Media and Telecommunications industry trails with a mean of 0.42.
Overview of management practices by workplace sizeSAL also reveals differences in management practices scores between large and small workplaces. As shown in Figure 6.2, medium-sized and large workplaces achieve similar scores (0.58 and 0.59, respectively), considerably higher than small workplaces (0.49). This is consistent with prior research showing large organisations have the resources to improve management practices, and that good management practices promote growth.
Overview of management practices by organisational legal statusSAL also looked at differences by how the organisations were legally incorporated. Consistent with prior research, Family Partnerships exhibit the lowest scores (0.42), while other types of partnerships (0.64) achieve the highest scores, as can be seen in Figure 6.3. Prior research on management practices shows that organisations often need to draw on external expertise in their leadership teams to equip themselves with the leadership and managerial capabilities necessary for success.
Unsurprisingly, senior and workplace leaders who did not know their legal status are on average associated with workplaces with worse management practices scores: 0.44, the second lowest score. Prior research in other countries finds government organisations score among the lowest of all organisations, but this was not categorically true in SAL. Although Other Government Entities (0.49) had the third lowest score, Government Companies (0.59) had the second highest.
Sole Proprietorships, Trusts Regarded as Corporations, Proprietary Companies, and Other Incorporated Entities scored at or close to the overall mean of 0.51, while Public Companies (0.58), Other Trusts (0.57), and Other Unincorporated Entities (0.55) scored above the mean, coming in with the third, fourth and fifth highest scores, respectively.
Overview of management practices by age of workplaceAs illustrated in Figure 6.4, management practices scores are higher in new workplaces (0.60). But there is little variation among other workplace age categories, which scored at or very close to the overall Australian mean.
Leadership at Work Do Australian leaders have what it takes?Page 57
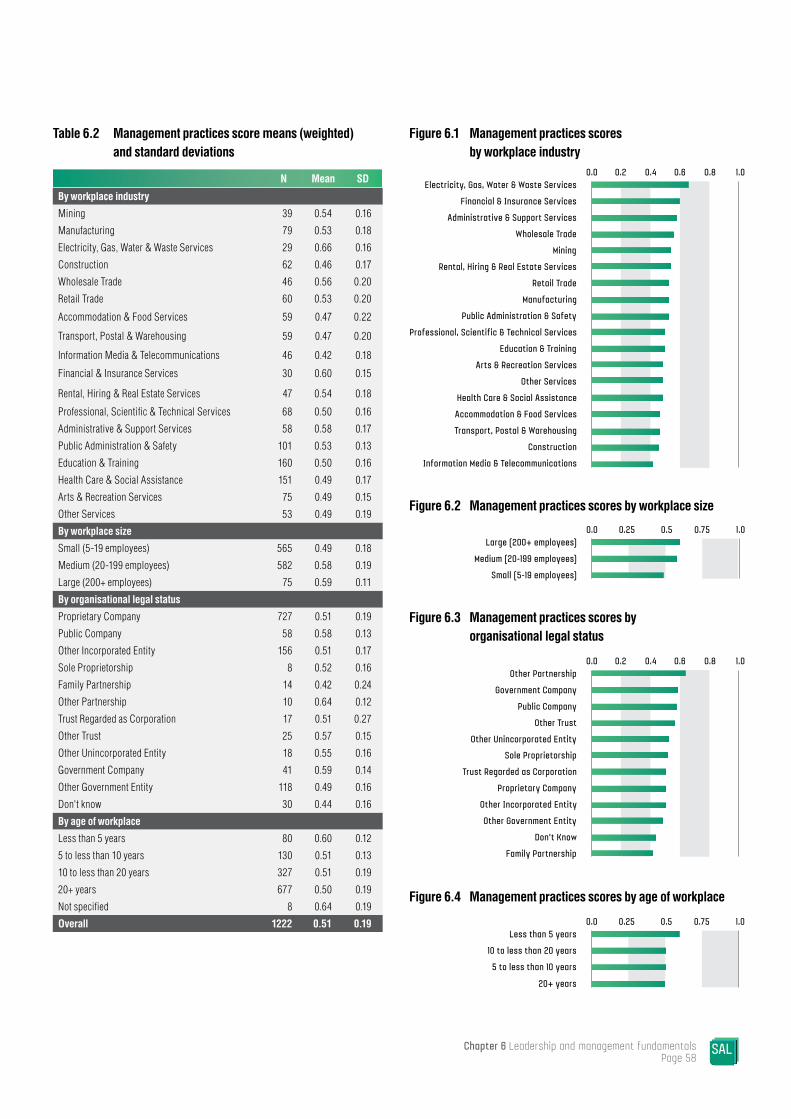
Table 6.2 Management practices score means (weighted) and standard deviations
N Mean SD
By workplace industry
Mining 39 0.54 0.16
Manufacturing 79 0.53 0.18
Electricity, Gas, Water & Waste Services 29 0.66 0.16
Construction 62 0.46 0.17
Wholesale Trade 46 0.56 0.20
Retail Trade 60 0.53 0.20
Accommodation & Food Services 59 0.47 0.22
Transport, Postal & Warehousing 59 0.47 0.20
Information Media & Telecommunications 46 0.42 0.18
Financial & Insurance Services 30 0.60 0.15
Rental, Hiring & Real Estate Services 47 0.54 0.18
Professional, Scientific & Technical Services 68 0.50 0.16
Administrative & Support Services 58 0.58 0.17
Public Administration & Safety 101 0.53 0.13
Education & Training 160 0.50 0.16
Health Care & Social Assistance 151 0.49 0.17
Arts & Recreation Services 75 0.49 0.15
Other Services 53 0.49 0.19
By workplace size
Small (5-19 employees) 565 0.49 0.18
Medium (20-199 employees) 582 0.58 0.19
Large (200+ employees) 75 0.59 0.11
By organisational legal status
Proprietary Company 727 0.51 0.19
Public Company 58 0.58 0.13
Other Incorporated Entity 156 0.51 0.17
Sole Proprietorship 8 0.52 0.16
Family Partnership 14 0.42 0.24
Other Partnership 10 0.64 0.12
Trust Regarded as Corporation 17 0.51 0.27
Other Trust 25 0.57 0.15
Other Unincorporated Entity 18 0.55 0.16
Government Company 41 0.59 0.14
Other Government Entity 118 0.49 0.16
Don't know 30 0.44 0.16
By age of workplace
Less than 5 years 80 0.60 0.12
5 to less than 10 years 130 0.51 0.13
10 to less than 20 years 327 0.51 0.19
20+ years 677 0.50 0.19
Not specified 8 0.64 0.19
Overall 1222 0.51 0.19
Figure 6.1 Management practices scores by workplace industry
Electricity, Gas, Water & Waste Services0.0 0.2 0.4 0.6 0.8 1.0
Administrative & Support Services
Financial & Insurance Services
Wholesale Trade
Rental, Hiring & Real Estate Services
Manufacturing
Professional, Scientific & Technical Services
Arts & Recreation Services
Health Care & Social Assistance
Education & Training
Other Services
Public Administration & Safety
Mining
Retail Trade
Information Media & Telecommunications
Transport, Postal & Warehousing
Accommodation & Food Services
Construction
Figure 6.2 Management practices scores by workplace size
Large (200+ employees)0.0 0.25 0.5 0.75 1.0
Small (5-19 employees)
Medium (20-199 employees)
Figure 6.3 Management practices scores by organisational legal status
Other Partnership0.0 0.2 0.4 0.6 0.8 1.0
Public Company
Government Company
Other Trust
Trust Regarded as Corporation
Other Incorporated Entity
Don’t Know
Other Government Entity
Family Partnership
Proprietary Company
Other Unincorporated Entity
Sole Proprietorship
Figure 6.4 Management practices scores by age of workplace
Less than 5 years0.0 0.25 0.5 0.75 1.0
5 to less than 10 years
10 to less than 20 years
20+ years
Chapter 6 Leadership and management fundamentals Page 58
Leadership at Work Do Australian leaders have what it takes?Page 59
Prevalence and importance of specific management practices in Australian workplacesAs can be seen from Table 6.1, some beneficial management practices are commonplace in Australian workplaces, while others are less common.
For example, most (69.1%) workplace leaders report that they monitor at least three Key Performance Indicators. These KPIs are monitored at least monthly in most (80.7%) workplaces. However, there is room for improvement, as 24.1% of workplaces report that this information is not monitored by employees.
Most workplaces were selective in communicating targets. Only 35.4% of workplaces post KPIs in a readily accessible and visible place, and 35.5% do not provide employees with any access to KPIs. Knowledge of performance targets is similarly limited, with only 33.8% of workplaces reporting that all employees – both managerial and non-managerial – had access to the workplace’s performance targets.
Research suggests that monitoring and communicating KPIs and targets across the whole organisation is an important part of achieving high performance, and SAL findings further support this notion. For example, further exploration of correlations in the data suggests that more accessible and visible KPIs are positively and significantly related to overall target attainment, employee engagement, incremental innovation, and radical innovation. Communicating targets widely is also positively and significantly related to employee engagement and both incremental and radical innovation.
Setting integrated short-term and long-term targets is positively and significantly correlated with workplaces’ overall target attainment scores (OTAS-9), employee engagement, incremental innovation and radical innovation. However, just under half (47.7%) of Australian workplaces follow what prior research has considered to be the recommended ‘best practice’ of setting both short-term and long-term targets. A further 38.1% focus on short-term targets only.
Research suggests that high performance can be incentivised through performance-based bonuses and promotions. However, almost half (44.6%) of workplaces reported that workplace leaders received no performance bonuses. Similarly, almost half (47.9%) of workplaces reported this to be the case for non-managerial employees. Exploratory correlational analyses suggest that use of performance-based bonuses is significantly related to whether a workplace reported a profit for 2013-14. This is true of performance-based bonuses for both managers and employees.
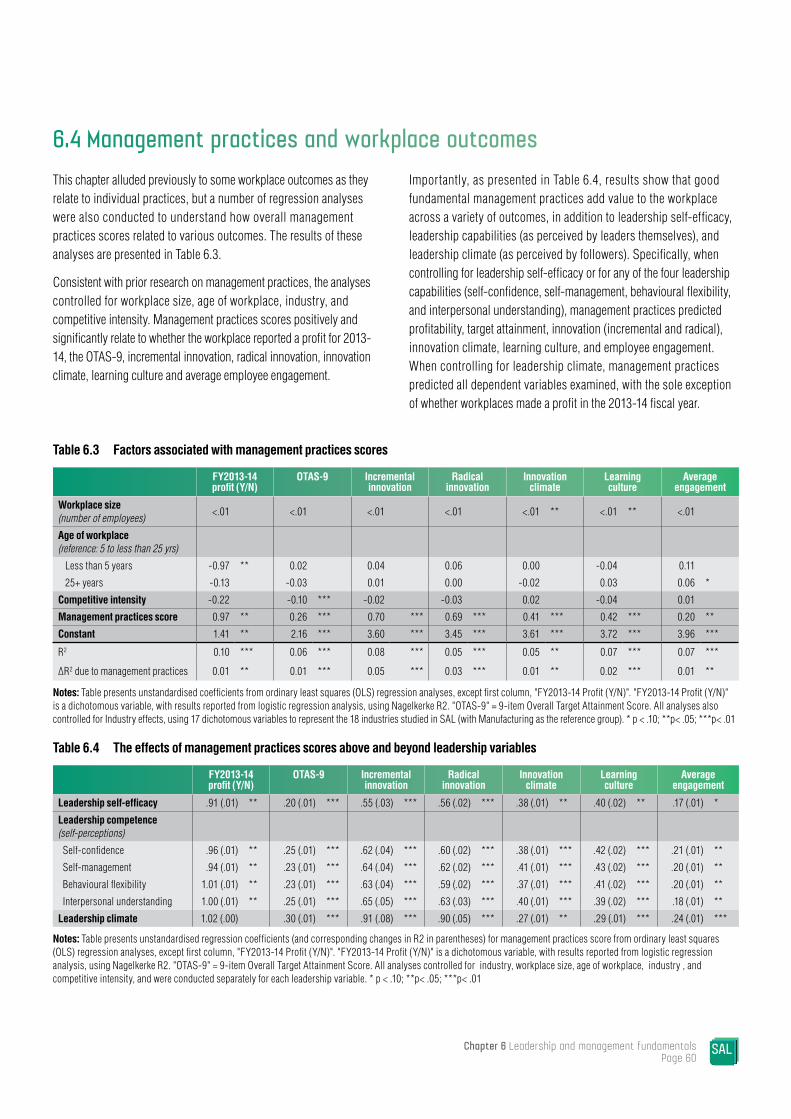
Chapter 6 Leadership and management fundamentals Page 60
6.4 Management practices and workplace outcomesThis chapter alluded previously to some workplace outcomes as they relate to individual practices, but a number of regression analyses were also conducted to understand how overall management practices scores related to various outcomes. The results of these analyses are presented in Table 6.3.
Consistent with prior research on management practices, the analyses controlled for workplace size, age of workplace, industry, and competitive intensity. Management practices scores positively and significantly relate to whether the workplace reported a profit for 2013-14, the OTAS-9, incremental innovation, radical innovation, innovation climate, learning culture and average employee engagement.
Importantly, as presented in Table 6.4, results show that good fundamental management practices add value to the workplace across a variety of outcomes, in addition to leadership self-efficacy, leadership capabilities (as perceived by leaders themselves), and leadership climate (as perceived by followers). Specifically, when controlling for leadership self-efficacy or for any of the four leadership capabilities (self-confidence, self-management, behavioural flexibility, and interpersonal understanding), management practices predicted profitability, target attainment, innovation (incremental and radical), innovation climate, learning culture, and employee engagement. When controlling for leadership climate, management practices predicted all dependent variables examined, with the sole exception of whether workplaces made a profit in the 2013-14 fiscal year.
Table 6.3 Factors associated with management practices scores
FY2013-14 profit (Y/N)
OTAS-9 Incremental innovation
Radical innovation
Innovation climate
Learning culture
Average engagement
Workplace size (number of employees) <.01 <.01 <.01 <.01 <.01 ** <.01 ** <.01
Age of workplace (reference: 5 to less than 25 yrs)
Less than 5 years -0.97 ** 0.02 0.04 0.06 0.00 -0.04 0.11
25+ years -0.13 -0.03 0.01 0.00 -0.02 0.03 0.06 *
Competitive intensity -0.22 -0.10 *** -0.02 -0.03 0.02 -0.04 0.01
Management practices score 0.97 ** 0.26 *** 0.70 *** 0.69 *** 0.41 *** 0.42 *** 0.20 **
Constant 1.41 ** 2.16 *** 3.60 *** 3.45 *** 3.61 *** 3.72 *** 3.96 ***
R2 0.10 *** 0.06 *** 0.08 *** 0.05 *** 0.05 ** 0.07 *** 0.07 ***
ΔR2 due to management practices 0.01 ** 0.01 *** 0.05 *** 0.03 *** 0.01 ** 0.02 *** 0.01 **
Notes: Table presents unstandardised coefficients from ordinary least squares (OLS) regression analyses, except first column, "FY2013-14 Profit (Y/N)". "FY2013-14 Profit (Y/N)" is a dichotomous variable, with results reported from logistic regression analysis, using Nagelkerke R2. "OTAS-9" = 9-item Overall Target Attainment Score. All analyses also controlled for Industry effects, using 17 dichotomous variables to represent the 18 industries studied in SAL (with Manufacturing as the reference group). * p < .10; **p< .05; ***p< .01
Table 6.4 The effects of management practices scores above and beyond leadership variables
FY2013-14 profit (Y/N)
OTAS-9 Incremental innovation
Radical innovation
Innovation climate
Learning culture
Average engagement
Leadership self-efficacy .91 (.01) ** .20 (.01) *** .55 (.03) *** .56 (.02) *** .38 (.01) ** .40 (.02) ** .17 (.01) *
Leadership competence (self-perceptions)
Self-confidence .96 (.01) ** .25 (.01) *** .62 (.04) *** .60 (.02) *** .38 (.01) *** .42 (.02) *** .21 (.01) **
Self-management .94 (.01) ** .23 (.01) *** .64 (.04) *** .62 (.02) *** .41 (.01) *** .43 (.02) *** .20 (.01) **
Behavioural flexibility 1.01 (.01) ** .23 (.01) *** .63 (.04) *** .59 (.02) *** .37 (.01) *** .41 (.02) *** .20 (.01) **
Interpersonal understanding 1.00 (.01) ** .25 (.01) *** .65 (.05) *** .63 (.03) *** .40 (.01) *** .39 (.02) *** .18 (.01) **
Leadership climate 1.02 (.00) .30 (.01) *** .91 (.08) *** .90 (.05) *** .27 (.01) ** .29 (.01) *** .24 (.01) ***
Notes: Table presents unstandardised regression coefficients (and corresponding changes in R2 in parentheses) for management practices score from ordinary least squares (OLS) regression analyses, except first column, "FY2013-14 Profit (Y/N)". "FY2013-14 Profit (Y/N)" is a dichotomous variable, with results reported from logistic regression analysis, using Nagelkerke R2. "OTAS-9" = 9-item Overall Target Attainment Score. All analyses controlled for industry, workplace size, age of workplace, industry , and competitive intensity, and were conducted separately for each leadership variable. * p < .10; **p< .05; ***p< .01

3 Leading people – the diffusion of high performance work practices
This chapter explores the extent to which Australian organisations have deployed human resource management practices and working arrangements associated with high performance workplaces. Over the past 25 years, researchers in the fields of management and organisational studies have demonstrated that a complementary bundle of human resource practices can have a significant impact on productivity and other measures of employee performance. The chapter starts with an overview of the underlying principles associated with high performance work systems bundles. Then it reports on a series of items contained in the SAL surveys designed to measure the diffusion of these practices across Australian workplaces. While the data indicate that these practices are found across a significant proportion of workplaces, their presence is associated with a range of industry and workplace characteristics. Given the demonstrated consequences of these practices for workplace performance, significant improvement in workplace performance may be achieved with a more systematic application of high performance work practices in many industries.
7.1 What are high performance work practices?The ways in which employees are managed are an important influence on the success or failure of organisations, and on employees’ experiences of work. However, with the emergence of ‘strategic human resource management’ in the late 1980s, there has been a sustained focus on exploring links between human resource management practices on one hand and employee and workplace outcomes on the other. Many scholars argue that effective human resource management delivers ‘win-win’ outcomes, in which employees experience enhanced quality of working life and organisations gain in a variety of performance measures.
Since the mid-1990s, research on human resource management and performance has been associated with the concept of ‘high performance work practices’ (HPWP) or ‘high performance work systems’ (HPWS) (Harley, 2005). This approach suggests specific practices can deliver enhanced employee and organisational outcomes.
There is no agreement about precisely what practices are most important, but there is consensus that the practices required must provide employees with three things:
» The ability to work effectively: organisations must ensure that employees have the skills they need through sophisticated recruitment and on- and off-the-job training.
» The motivation to work effectively: this is achieved through mechanisms such as performance-based pay, opportunities for internal promotion, and effective performance appraisal and development systems.
» The opportunity to work effectively: work is organised to allow employees to exercise discretion and make decisions about processes so they enjoy work, use their skills effectively and perform at a high level.
The three requirements are often categorised in terms of the ‘Ability, Motivation and Opportunity’ (AMO) model of human resource management and performance (Boxall & Purcell, 2003).
Evidence internationally shows that workplaces that use practices in these three categories perform better on a number of measures of performance including labour productivity, product and service quality, and reduced voluntary turnover (Combs et al., 2006). Employees who are managed using these practices are also more satisfied, committed and less likely to leave their jobs than those who are not.
Leadership at Work Do Australian leaders have what it takes?Page 61
77
Key Findings » The diffusion of high performance work practices
in Australian workplaces is somewhat uneven across different industries and different types of workplaces.
» Training opportunities are generally better in larger workplaces than in smaller ones, and in public sector workplaces. A significant minority of Australian workplaces are not providing training, which poses risks for future performance.
» Two in five workplaces offer bonuses based on organisational profits, yet nearly half do not. In addition, pay is not tied to performance at all in more than one-third of workplaces. Performance-based rewards are a non-union, private sector phenomenon.
» Highly unionised workplaces are more likely than non-union workplaces to offer clearly specified jobs, performance appraisals and training opportunities.
Australia has relied significantly on the primary sector to fuel its economic growth, but the end of the resources era challenges our economy to look to different industries and drivers for future economic prosperity
7.2 Measures of high performance work practices
Because of the disagreement about the specific high performance work practices that are most important, data was captured on a broad set of practices. SAL utilised a slightly modified set of items from Patel et al. (2013) (see Technical Appendix). These items and the scales derived from them are validated by Patel et al. (2013), which means that they can be used with confidence.
Firstly, the frequency of each practice is reported. Then composite scales are created to represent groups of practices, by calculating the mean score of all items for that group. For example, the first section of Table 7.1 shows frequencies for the four items that capture dimensions of participation. Similarly, Tables 7.2 to 7.6 show the composite scale that is created by taking the mean of the items.
Leadership at Work Do Australian leaders have what it takes?Page 63


7.3 Prevalence of practices Employee participationWorkplace leaders report high levels of employee participation across the four items. In every case over 80% of leaders agree or strongly agree with the relevant statement. The lowest levels of agreement are reported for practices that provide employees with the greatest influence and autonomy in decision-making.
Internal career pathsInternal career paths are generally less prevalent than practices to encourage employee participation. Less than half of respondents agreed that employees have opportunities for upward mobility, or that there are multiple positions which employees could be promoted to. These results are not surprising; internal career paths are a function of organisational size, and many of the responding workplaces are quite small.
TrainingThe results for training are somewhat concerning. While in every case more than half of respondents agree with the statements, there is also substantial disagreement. One in four workplaces did not provide formal training programs to increase employees’ promotability, and one in five did not provide their new recruits with training in essential job skills. According to the AMO model (Boxall & Purcell, 2003), employee ability is crucial for organisational success. More broadly, employee skills are an essential ingredient in the success of national economies (Winterton, 2007). The fact that a significant minority of Australian workplaces are not providing training poses risks for future performance.
Recruitment and selectionThe data on recruitment and selection show high levels of all practices, with over 80% of respondents agreeing with each item. This suggests Australian workplaces are therefore willing to invest resources in ensuring that they have the staff they need.
Job specificationsMost workplaces have clearly specified jobs. This is evidence that they approach work organisation in a structured way and seek to ensure that employees’ duties are clearly specified.
Performance appraisalAlthough there were high levels of agreement about the three dimensions of performance appraisal, the results show a significant minority of workplaces of concern. Over 15% of respondents indicated that performance is not usually measured with objective quantifiable results and/or that performance appraisal is not based on such results.
Leadership at Work Do Australian leaders have what it takes?Page 65
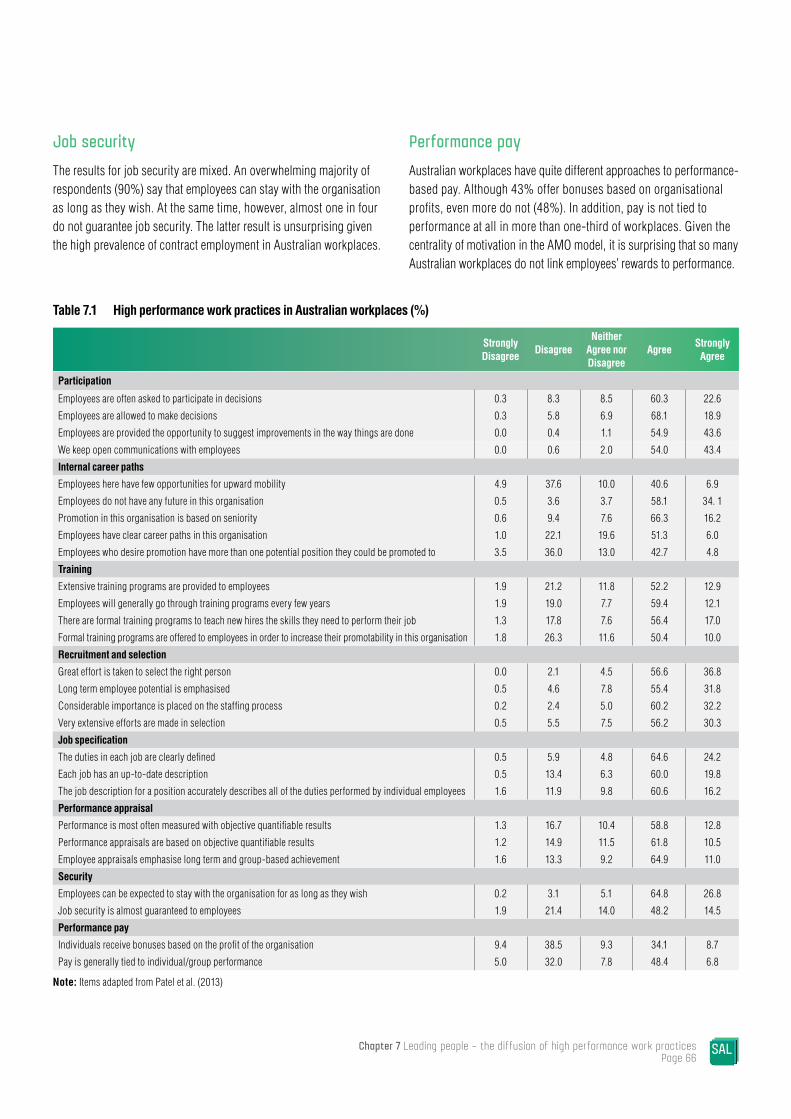
Job securityThe results for job security are mixed. An overwhelming majority of respondents (90%) say that employees can stay with the organisation as long as they wish. At the same time, however, almost one in four do not guarantee job security. The latter result is unsurprising given the high prevalence of contract employment in Australian workplaces.
Performance payAustralian workplaces have quite different approaches to performance-based pay. Although 43% offer bonuses based on organisational profits, even more do not (48%). In addition, pay is not tied to performance at all in more than one-third of workplaces. Given the centrality of motivation in the AMO model, it is surprising that so many Australian workplaces do not link employees’ rewards to performance.
Table 7.1 High performance work practices in Australian workplaces (%)
Strongly Disagree
DisagreeNeither
Agree nor Disagree
AgreeStrongly Agree
Participation
Employees are often asked to participate in decisions 0.3 8.3 8.5 60.3 22.6
Employees are allowed to make decisions 0.3 5.8 6.9 68.1 18.9
Employees are provided the opportunity to suggest improvements in the way things are done 0.0 0.4 1.1 54.9 43.6
We keep open communications with employees 0.0 0.6 2.0 54.0 43.4
Internal career paths
Employees here have few opportunities for upward mobility 4.9 37.6 10.0 40.6 6.9
Employees do not have any future in this organisation 0.5 3.6 3.7 58.1 34. 1
Promotion in this organisation is based on seniority 0.6 9.4 7.6 66.3 16.2
Employees have clear career paths in this organisation 1.0 22.1 19.6 51.3 6.0
Employees who desire promotion have more than one potential position they could be promoted to 3.5 36.0 13.0 42.7 4.8
Training
Extensive training programs are provided to employees 1.9 21.2 11.8 52.2 12.9
Employees will generally go through training programs every few years 1.9 19.0 7.7 59.4 12.1
There are formal training programs to teach new hires the skills they need to perform their job 1.3 17.8 7.6 56.4 17.0
Formal training programs are offered to employees in order to increase their promotability in this organisation 1.8 26.3 11.6 50.4 10.0
Recruitment and selection
Great effort is taken to select the right person 0.0 2.1 4.5 56.6 36.8
Long term employee potential is emphasised 0.5 4.6 7.8 55.4 31.8
Considerable importance is placed on the staffing process 0.2 2.4 5.0 60.2 32.2
Very extensive efforts are made in selection 0.5 5.5 7.5 56.2 30.3
Job specification
The duties in each job are clearly defined 0.5 5.9 4.8 64.6 24.2
Each job has an up-to-date description 0.5 13.4 6.3 60.0 19.8
The job description for a position accurately describes all of the duties performed by individual employees 1.6 11.9 9.8 60.6 16.2
Performance appraisal
Performance is most often measured with objective quantifiable results 1.3 16.7 10.4 58.8 12.8
Performance appraisals are based on objective quantifiable results 1.2 14.9 11.5 61.8 10.5
Employee appraisals emphasise long term and group-based achievement 1.6 13.3 9.2 64.9 11.0
Security
Employees can be expected to stay with the organisation for as long as they wish 0.2 3.1 5.1 64.8 26.8
Job security is almost guaranteed to employees 1.9 21.4 14.0 48.2 14.5
Performance pay
Individuals receive bonuses based on the profit of the organisation 9.4 38.5 9.3 34.1 8.7
Pay is generally tied to individual/group performance 5.0 32.0 7.8 48.4 6.8
Note: Items adapted from Patel et al. (2013)
Chapter 7 Leading people – the diffusion of high performance work practices Page 66

7.4 Workplace characteristics and high performance work practicesPrior research shows that high performance work practices vary across workplaces (Harley, 2007). To understand this variation, mean values of the scales are compared across workplace characteristics including size, industry, sector, single- and multi-site, and level of unionisation.
It is notable how little variation there is in the mean values of the scales across the different workplace characteristics. All of the items are measured on a five-point scale (‘strongly disagree’ to ‘strongly agree’) and in most cases the differences between the highest and lowest scores are less than 0.3. In what follows, only differences greater than 0.3 are reported, which highlights those characteristics for which there is substantial variation. Statistically significant differences are indicated in the tables below. For example, in Table 7.2, the first statistically significant result is for Manufacturing. The mean score for workplaces in this industry is significantly different from workplaces in all other industries.
TrainingTraining practices vary widely across Australian workplaces, and a number of the differences are statistically significant. Training opportunities are generally better in larger workplaces than in smaller ones, in public sector workplaces, and in workplaces with higher levels of unionisation. Workplaces in Manufacturing, Information Media and Telecommunications, and Arts and Recreation Services, have low levels of training when compared with other industries.
Table 7.2 Mean scores of training scale by industry, size, sector and level of unionisation
Workplace Characteristics Scale Mean
Industry
Mining 3.7
Manufacturing 3.4***
Electricity, Gas, Water & Waste Services 3.8
Construction 3.5
Wholesale Trade 3.5
Retail Trade 3.5
Accommodation & Food Services 3.4
Transport, Postal & Warehousing 3.6
Information Media & Telecommunications 3.2***
Financial & Insurance Services 3.6
Rental, Hiring & Real Estate Services 3.7
Professional, Scientific & Technical Services 3.5
Administrative & Support Services 3.6
Public Administration & Safety 3.8
Education & Training 3.7
Health Care & Social Assistance 3.9***
Arts & Recreation Services 3.4**
Other Services 3.7***
Size
Small (5-19 employees) 3.5***
Medium (20-199 employees) 3.7**
Large (200+ employees) 4.0***
Sector
Private Sector 3.6***
Public Sector 3.9***
Unionisation
No Union Members 3.5***
< 26% Unionised 3.6
26-50% Unionised 3.8**
51-75% Unionised 3.8**
> 75% Unionised 3.9***
Overall 3.6
*<=0.1; **<=0.05; ***<=0.01
Leadership at Work Do Australian leaders have what it takes?Page 67
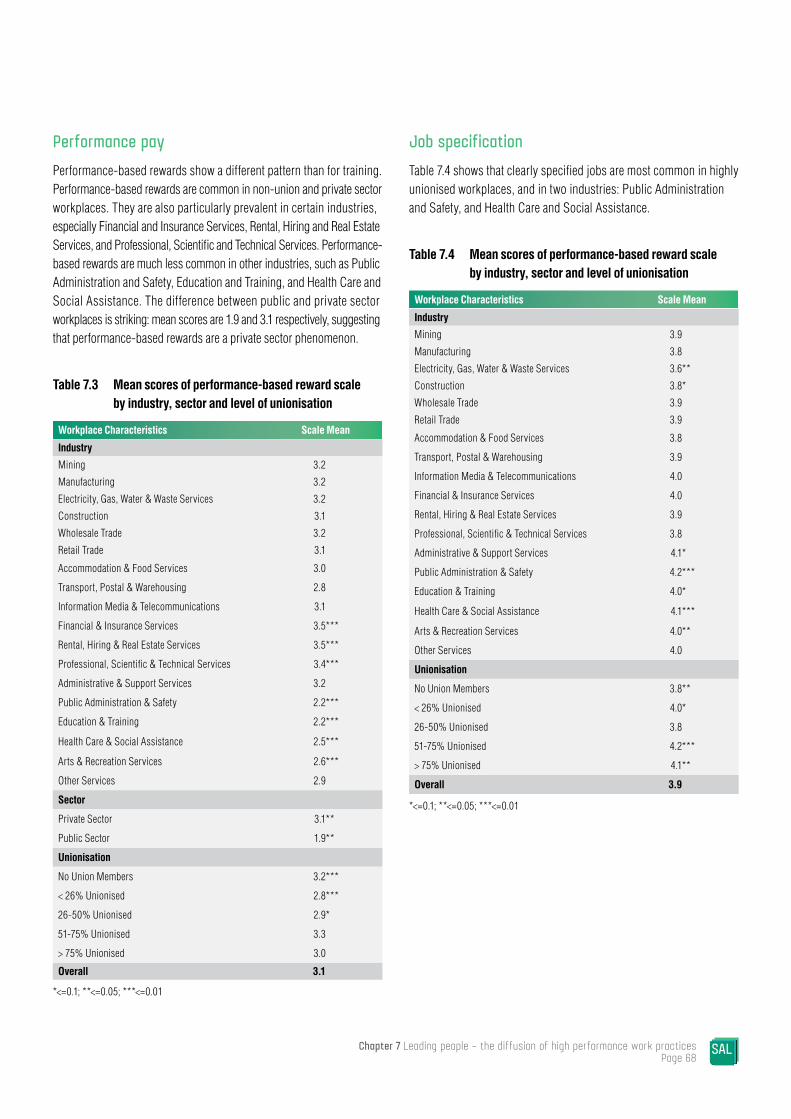
Performance payPerformance-based rewards show a different pattern than for training. Performance-based rewards are common in non-union and private sector workplaces. They are also particularly prevalent in certain industries, especially Financial and Insurance Services, Rental, Hiring and Real Estate Services, and Professional, Scientific and Technical Services. Performance-based rewards are much less common in other industries, such as Public Administration and Safety, Education and Training, and Health Care and Social Assistance. The difference between public and private sector workplaces is striking: mean scores are 1.9 and 3.1 respectively, suggesting that performance-based rewards are a private sector phenomenon.
Table 7.3 Mean scores of performance-based reward scale by industry, sector and level of unionisation
Workplace Characteristics Scale Mean
Industry
Mining 3.2
Manufacturing 3.2
Electricity, Gas, Water & Waste Services 3.2
Construction 3.1
Wholesale Trade 3.2
Retail Trade 3.1
Accommodation & Food Services 3.0
Transport, Postal & Warehousing 2.8
Information Media & Telecommunications 3.1
Financial & Insurance Services 3.5***
Rental, Hiring & Real Estate Services 3.5***
Professional, Scientific & Technical Services 3.4***
Administrative & Support Services 3.2
Public Administration & Safety 2.2***
Education & Training 2.2***
Health Care & Social Assistance 2.5***
Arts & Recreation Services 2.6***
Other Services 2.9
Sector
Private Sector 3.1**
Public Sector 1.9**
Unionisation
No Union Members 3.2***
< 26% Unionised 2.8***
26-50% Unionised 2.9*
51-75% Unionised 3.3
> 75% Unionised 3.0
Overall 3.1
*<=0.1; **<=0.05; ***<=0.01
Job specificationTable 7.4 shows that clearly specified jobs are most common in highly unionised workplaces, and in two industries: Public Administration and Safety, and Health Care and Social Assistance.
Table 7.4 Mean scores of performance-based reward scale by industry, sector and level of unionisation
Workplace Characteristics Scale Mean
Industry
Mining 3.9
Manufacturing 3.8
Electricity, Gas, Water & Waste Services 3.6**
Construction 3.8*
Wholesale Trade 3.9
Retail Trade 3.9
Accommodation & Food Services 3.8
Transport, Postal & Warehousing 3.9
Information Media & Telecommunications 4.0
Financial & Insurance Services 4.0
Rental, Hiring & Real Estate Services 3.9
Professional, Scientific & Technical Services 3.8
Administrative & Support Services 4.1*
Public Administration & Safety 4.2***
Education & Training 4.0*
Health Care & Social Assistance 4.1***
Arts & Recreation Services 4.0**
Other Services 4.0
Unionisation
No Union Members 3.8**
< 26% Unionised 4.0*
26-50% Unionised 3.8
51-75% Unionised 4.2***
> 75% Unionised 4.1**
Overall 3.9
*<=0.1; **<=0.05; ***<=0.01
Chapter 7 Leading people – the diffusion of high performance work practices Page 68

Job securityJob security varies significantly by industry. Workplaces in Rental, Hiring and Real Estate Services, and Health Care and Social Assistance have high levels of job security, while those in Mining, Manufacturing, and Information Media and Telecommunications have low levels.
Table 7.5 Mean scores of job security scale by industry
Workplace Characteristics Scale Mean
Industry
Mining 3.5***
Manufacturing 3.7***
Electricity, Gas, Water & Waste Services 3.8
Construction 3.9
Wholesale Trade 3.9
Retail Trade 3.8
Accommodation & Food Services 3.8
Transport, Postal & Warehousing 3.7
Information Media & Telecommunications 3.5***
Financial & Insurance Services 3.8
Rental, Hiring & Real Estate Services 4.0***
Professional, Scientific & Technical Services 3.7
Administrative & Support Services 3.9
Public Administration & Safety 3.9
Education & Training 3.8
Health Care & Social Assistance 4.1***
Arts & Recreation Services 3.8
Other Services 3.9
Overall 3.8
*<=0.1; **<=0.05; ***<=0.01
Performance appraisalPerformance appraisal is associated with higher levels of workplace unionisation (Table 7.6). Where unions are present, they influence the extent to which employee performance and development are evaluated in a structured way. Workplaces in Public Administration and Safety also have higher levels of performance appraisal.
Table 7.6 Mean scores of performance appraisal scale by industry and level of unionisation
Workplace Characteristics Scale Mean
Industry
Mining 3.6
Manufacturing 3.6*
Electricity, Gas, Water & Waste Services 3.8
Construction 3.6
Wholesale Trade 3.7
Retail Trade 3.7
Accommodation & Food Services 3.7
Transport, Postal & Warehousing 3.5
Information Media & Telecommunications 3.7
Financial & Insurance Services 3.8
Rental, Hiring & Real Estate Services 3.7
Professional, Scientific & Technical Services 3.6
Administrative & Support Services 3.7
Public Administration & Safety 4.0**
Education & Training 3.7
Health Care & Social Assistance 3.7
Arts & Recreation Services 3.6
Other Services 3.8
By Unionisation
No Union Members 3.7
< 26% Unionised 3.6
26-50% Unionised 3.7
51-75% Unionised 4.0*
> 75% Unionised 3.9*
Overall 3.7
*<=0.1; **<=0.05; ***<=0.01
Leadership at Work Do Australian leaders have what it takes?Page 69
Chapter 7 Leading people – the diffusion of high performance work practices Page 70
7.5 Where to from here?This chapter provides a preliminary account of the diffusion of high performance work practices in Australian workplaces. The evidence indicates that compared with earlier surveys (such as the Australian Workplace Industrial Relations surveys undertaken in the 1990s), high performance work practices have become more common in Australia. Nonetheless the evidence presented in this chapter suggests that this process of diffusion has continued to be somewhat uneven across different industries and different types of workplaces.
While the analysis presented here does not directly assess the consequences of these practices for workplace performance, based on a large number of previous studies, a substantial performance dividend is possible with the further take up of these practices. Further analysis needs to be undertaken to assess the likely barriers associated with the absence of these practices.
3 Leading innovation
Chapter 8 examines innovation in Australian workplaces. The chapter first compares workplaces which are more innovative with those that are failing to engage with innovation. It then investigates the relationships between innovation and performance and between management and leadership related variables and innovation outcomes.
8.1 The innovation challenge Australia has relied significantly on the primary sector to fuel its economic growth, but the end of the resources era challenges our economy to look to different industries and drivers for future economic prosperity. Innovation is a critical determinant of future productivity growth, as well as a critical factor in the competitiveness and performance of organisations. The evidence for this is compelling: many of the best performing nations in terms of Gross Domestic Product per capita – Luxembourg, Switzerland, Ireland, the Netherlands, Sweden, and Austria (IMF, 2015) – have little or no natural resources, but are built on the production, use and distribution of knowledge and information in the form of innovation.
The simple reason for these countries’ success could be that, in the absence of resources, they had to find alternative ways to progress – they ‘learned’ how to efficiently generate and distribute new knowledge and information, and to develop and commercialise new products and service based on it. While Australia is very efficient in, for example, extracting an ounce of gold from tons of rock (so efficient that up to 90 tons of rock per ounce of gold can still be profitable), we now have to become more efficient in creating and disseminating knowledge and in innovating on the basis of this knowledge to achieve the productivity growth rates of the past. Developing these capabilities is dependent on effective business leadership.
In their review of the leadership and management research, Crossan and Apaydin (2010) conclude that a number of leadership, management and organisation attributes explain why some organisations are able to innovate successfully while others do not.
Those factors include:
» Attention to user needs.
» Leadership that develops a culture of innovation and facilitates innovation by encouraging personnel to connect with each other within the organisation.
» Efficient management of innovation projects and accountability for delivering outcomes.
» Processes and systems for running and capitalising on innovation activity.
» Effective marketing and commercialisation skills.
» Knowledge management.
» The capability to draw on skills and knowledge external to the organisation, including research communities and other technology developers.
Identifying and isolating empirically any one of these factors is difficult. However, most organisation-level enablers for innovation are in some way related to management and leadership, be that on the individual, team and organisational or the inter-organisational level. For example, organisational learning capabilities, team structures and management, organisational culture, climate and work processes have all be shown to impact on innovative performance (Crossan & Apaydin, 2010).
In explaining why innovation performance varies across organisations, even within the same industry, it is important to note that few organisations can pursue all the activities necessary to develop and commercialise any innovation on their own. Rather, organisations innovate through interactions and connections within their innovation ecosystems to access critical skills and capabilities – a process which needs to be managed effectively to result in successful innovation.
Leadership at Work Do Australian leaders have what it takes?Page 71
88
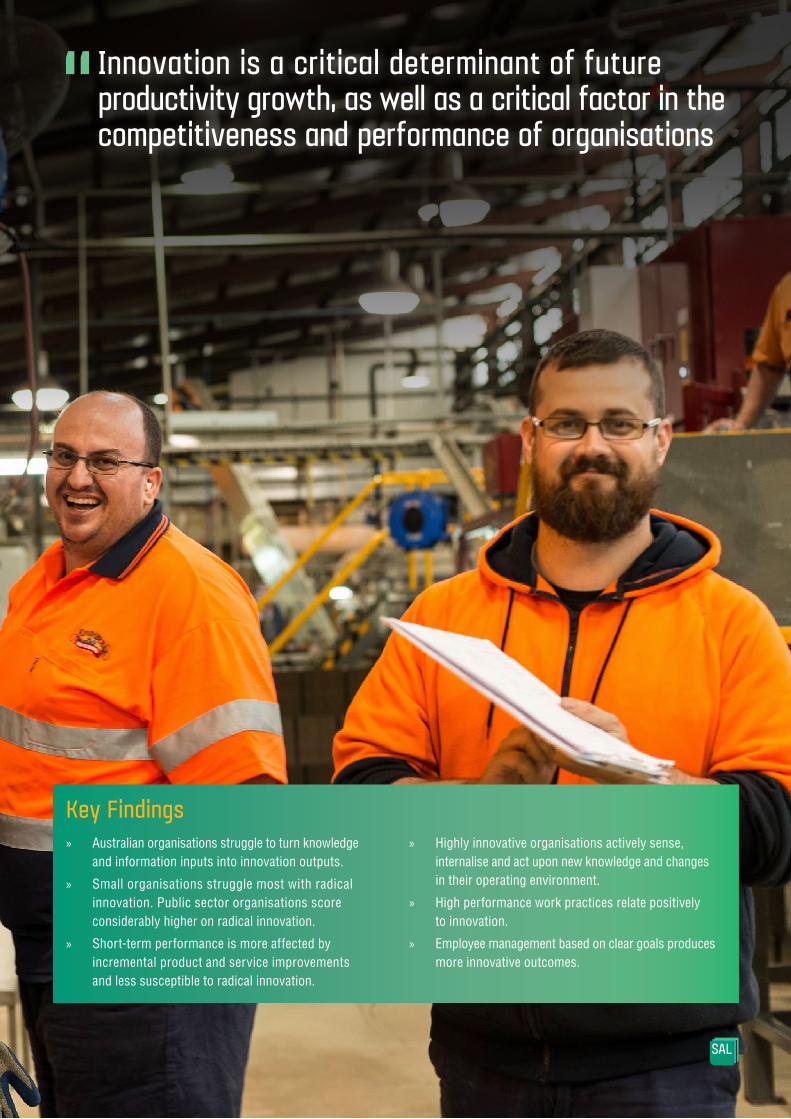
Key Findings » Australian organisations struggle to turn knowledge
and information inputs into innovation outputs.
» Small organisations struggle most with radical innovation. Public sector organisations score considerably higher on radical innovation.
» Short-term performance is more affected by incremental product and service improvements and less susceptible to radical innovation.
» Highly innovative organisations actively sense, internalise and act upon new knowledge and changes in their operating environment.
» High performance work practices relate positively to innovation.
» Employee management based on clear goals produces more innovative outcomes.
Innovation is a critical determinant of future productivity growth, as well as a critical factor in the competitiveness and performance of organisations
8.2 Australia’s innovation record In its global comparison of national innovation systems, the Global Innovation Index (Cornell University, INSEAD & WIPO, 2015) gives a comprehensive overview of input and output factors relevant to innovation (see Table 8.1). This analysis reveals that the most innovative countries include resource-limited ones, such as Switzerland, the United Kingdom, Sweden, the Netherlands, Finland, Singapore, and Ireland.
Overall, Australia scores a respectable 17th out of the 141 countries included in the Global Innovation Index. However, the Index also reveals that while Australia is ranked 10th on measures of inputs into innovation; it ranks only 24th on innovation outputs. This discrepancy implies a lack of capability in turning innovation inputs into outputs. The input scores in Table 8.1 show a clear shortcoming in business sophistication (ranking 23rd), with particularly low scores on innovation linkages (38th) and knowledge absorption (63rd). These factors are strongly related to leadership and management capacity.
A deeper look at innovation outputs shows Australia performs well in terms of creative outputs (7th), but lacks in knowledge and technology outputs (39th). Particularly revealing with regard to factors associated with leadership and management are the low ranks relating to knowledge impact (32nd) and knowledge diffusion (99th). The diffusion of knowledge in the form of products, services or publications is highly dependent on management and leadership.
Further evidence of the extent to which Australian organisations adapt and grow through innovation can be drawn from the Business Characteristics Survey (BCS) conducted by the Australian Bureau of Statistics (ABS)1. The BCS collects data on innovation activity2 from a large, representative sample of Australian businesses.
1 ABS Catalogue Number 8167.0 - Selected Characteristics of Australian Business, 2013-14, available at abs.gov.au/AUSSTATS/[email protected]/Lookup/8167.0Main+Features12013-14?OpenDocument. Last accessed 29 February 2016.
2 It is important to note here that ‘innovation-active’ businesses are not necessarily successful innovators. Success depends on whether innovation activities can be translated and implemented into actual innovations.
The data show that even innovation-active organisations fail to deliver innovative outputs for several reasons. Skill shortages are the most common obstacle to innovation, with one-quarter of all innovation-active businesses citing this barrier. Almost one in five innovation-active organisations indicates skill shortages within the business and around one in seven indicates general skill shortages in the labour market as a barrier to innovation.
The presence of these barriers to innovation, especially access to skills and capabilities, is not simply a product of organisation characteristics, but also reflects how organisations are managed and thus their ability to access resources and capabilities, both internally and externally.
In line with the Global Innovation Index findings for Australia, the BCS reveals few Australian organisations engage in research and collaboration with other businesses or research institutions. More than 90% of organisations surveyed reported they had no co-operative arrangements in place. While innovation-active organisations are more likely to collaborate than non-innovation active organisations, their rate of collaboration – at around 15 percent – is still low compared with collaboration between organisations and research institutions globally.
Leadership at Work Do Australian leaders have what it takes?Page 73
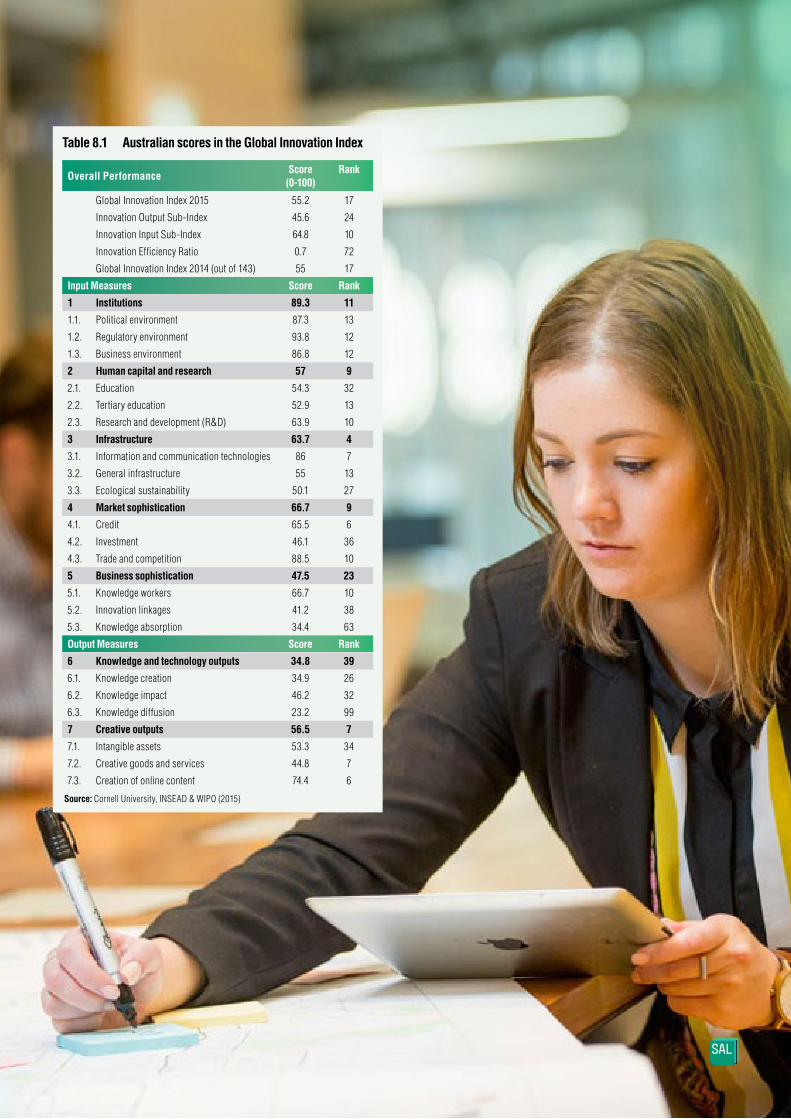
Table 8.1 Australian scores in the Global Innovation Index
Overall Performance Score
(0-100)Rank
Global Innovation Index 2015 55.2 17
Innovation Output Sub-Index 45.6 24
Innovation Input Sub-Index 64.8 10
Innovation Efficiency Ratio 0.7 72
Global Innovation Index 2014 (out of 143) 55 17
Input Measures Score Rank
1 Institutions 89.3 11
1.1. Political environment 87.3 13
1.2. Regulatory environment 93.8 12
1.3. Business environment 86.8 12
2 Human capital and research 57 9
2.1. Education 54.3 32
2.2. Tertiary education 52.9 13
2.3. Research and development (R&D) 63.9 10
3 Infrastructure 63.7 4
3.1. Information and communication technologies 86 7
3.2. General infrastructure 55 13
3.3. Ecological sustainability 50.1 27
4 Market sophistication 66.7 9
4.1. Credit 65.5 6
4.2. Investment 46.1 36
4.3. Trade and competition 88.5 10
5 Business sophistication 47.5 23
5.1. Knowledge workers 66.7 10
5.2. Innovation linkages 41.2 38
5.3. Knowledge absorption 34.4 63
Output Measures Score Rank
6 Knowledge and technology outputs 34.8 39
6.1. Knowledge creation 34.9 26
6.2. Knowledge impact 46.2 32
6.3. Knowledge diffusion 23.2 99
7 Creative outputs 56.5 7
7.1. Intangible assets 53.3 34
7.2. Creative goods and services 44.8 7
7.3. Creation of online content 74.4 6
Source: Cornell University, INSEAD & WIPO (2015)
8.3 Innovation in Australian organisations – findings from SALLack of leadership for innovation is a longstanding challenge for Australian organisations; it was identified as a major issue in the Karpin Report (1995) and subsequent Australian studies (Green, 2009). SAL findings bring this research up to date, assessing the state of management and leadership expertise and its association with innovation outcomes. This chapter first provides an overview of the innovation performance of workplaces in SAL by comparing and contrasting differences in high-performing innovators (upper 25% of the sample) and low-performers (bottom 25% of the sample). The data collected through SAL allow for distinguishing between ‘radical’ and ‘incremental’ innovation – see Box 8.1. Table 8.2 profiles high-performing innovators and low-performing innovators for both radical and incremental innovation. The results distinguish between organisations in the sample along a range of workplace characteristics and examine whether differences relative to other groups are statistically significant.
The following sections only report statistically significant variations in the data.
With few exceptions, innovation performance does not vary by workplace age. A significantly smaller proportion of very young workplaces (less than five years old) are among low performers on radical innovation, and a significantly lower proportion of workplaces in operation for 20 years or more are among low performers on incremental innovation.
Site diversity positively relates to radical innovation. A significantly smaller proportion of single single-site organisations are high performers on radical innovation. Multi-site organisations represent a significantly higher proportion of high performers.
A medium size is conducive to radical innovation. Small organisations appear to struggle most with both forms of innovation. With regards to size, significantly lower proportions of small organisations and significantly higher proportions of medium-sized organisations are high performers on radical innovation.
Across industry sectors, a larger proportion of high performers on radical innovation operate in Health Care and Social Assistance, while Rental, Hiring and Real Estate accounts for a significantly smaller proportion. There are also significantly larger proportions of low performers on radical innovation in Mining and Transport, Postal and Warehousing. There are no significantly high-performing industries with regards to incremental innovation. However workplaces in Education and Training, and Arts and Recreation Services are significantly less likely to be low-performing.
Comparing sector affiliation, public organisations are more innovative than private ones. A significantly smaller proportion of private organisations and a significantly larger proportion of public organisations are among high performers on radical innovation. Consistently, a significantly larger proportion of private organisations and a significantly lower proportion of public organisations are among low performers on radical innovation. There are no significant differences with regards to incremental innovation.
Multi-nation organisations – typically foreign-owned – are widely assumed to be more innovative. Surprisingly, the SAL findings do not support this. Rather, there are no significant differences on innovation performance based on whether organisations are foreign or Australian owned.
Box 8.1: Measuring innovationThe two measures used in SAL are radical and incremental innovation. Radical innovation relates to creating products and services that go beyond what is expected by existing customers and includes experimentation and a focus on new opportunities, new markets or new ways of bringing products and services to the market. Incremental innovation relates to refining and improving existing products and services. With incremental innovation, the focus of development is often on improving efficiency, increasing economies of scale (i.e. reducing costs) and expanding existing markets. The scales are based on well accepted measures for exploratory and exploitative innovation (Jansen et al., 2006). For further details see the Technical Appendix.
Leadership at Work Do Australian leaders have what it takes?Page 75

Table 8.2 Innovation performance by workplace attribute (% of workplaces)
Innovation performanceRadical innovation Incremental innovation
High (upper 25%)
Low (lower 25%)
High (upper 25%)
Low (lower 25%)
Workplace age (years in operation)
Less than 5 years 17.6 16.5 * 29.3 26.9
5 to less than 10 years 14.2 21.2 20.4 39.1
10 to less than 20 years 21.6 29.2 26.5 32.5
20 years or more 17.5 25.0 20.9 21.5 **
Single/Multi-site
Single site 15.3 ** 25.3 20.6 27.0
Multi-site 22.8 ** 24.8 26.9 28.2
Workplace size
Small (5-19 employees) 16.5 * 25.2 22.9 29.3
Medium (20-199 employees) 24.0 * 24.9 24.3 23.4
Large (200 or more employees) 19.3 24.2 24.4 21.8
Industry
Mining 22.5 44.2 * 19.0 37.9
Manufacturing 20.9 21.9 24.4 36.9
Electricity, Gas, Water & Waste Services 18.7 39.8 29.0 30.0
Construction 13.2 29.4 21.6 32.9
Wholesale Trade 22.2 18.5 30.6 19.1
Retail Trade 11.2 20.5 15.8 29.2
Accommodation & Food Services 16.9 28.6 19.4 26.3
Transport, Postal & Warehousing 11.2 45.1 * 13.4 * 34.5
Information Media & Telecommunications 26.9 24.8 31.1 27.4
Financial & Insurance Services 29.4 42.3 42.5 36.7
Rental, Hiring & Real Estate Services 9.6 ** 19.4 16.6 27.8
Professional, Scientific & Technical Services 16.2 26.5 27.8 23.4
Administrative & Support Services 18.7 25.9 25.1 20.7
Public Administration & Safety 21.4 20.7 18.6 16.1 *
Education & Training 20.0 19.1 31.4 15.2 ***
Health Care & Social Assistance 28.4 ** 17.6 ** 19.3 22.3
Arts & Recreation Services 11.6 20.8 33.5 12.2 ***
Other Services 24.1 31.7 30.0 24.0
Sector
Private 18.0 * 25.4 * 23.1 27.8
Public 34.6 * 14.4 * 29.0 17.0
Ownership
Foreign/International 20.2 35.6 23.4 39.6
Majority Australian 17.8 24.3 23.1 26.6
*p<0.1, **p<0.05, ***p<0.01 indicate significant difference relative to other groups in the same column
Chapter 8 Leading innovation Page 76
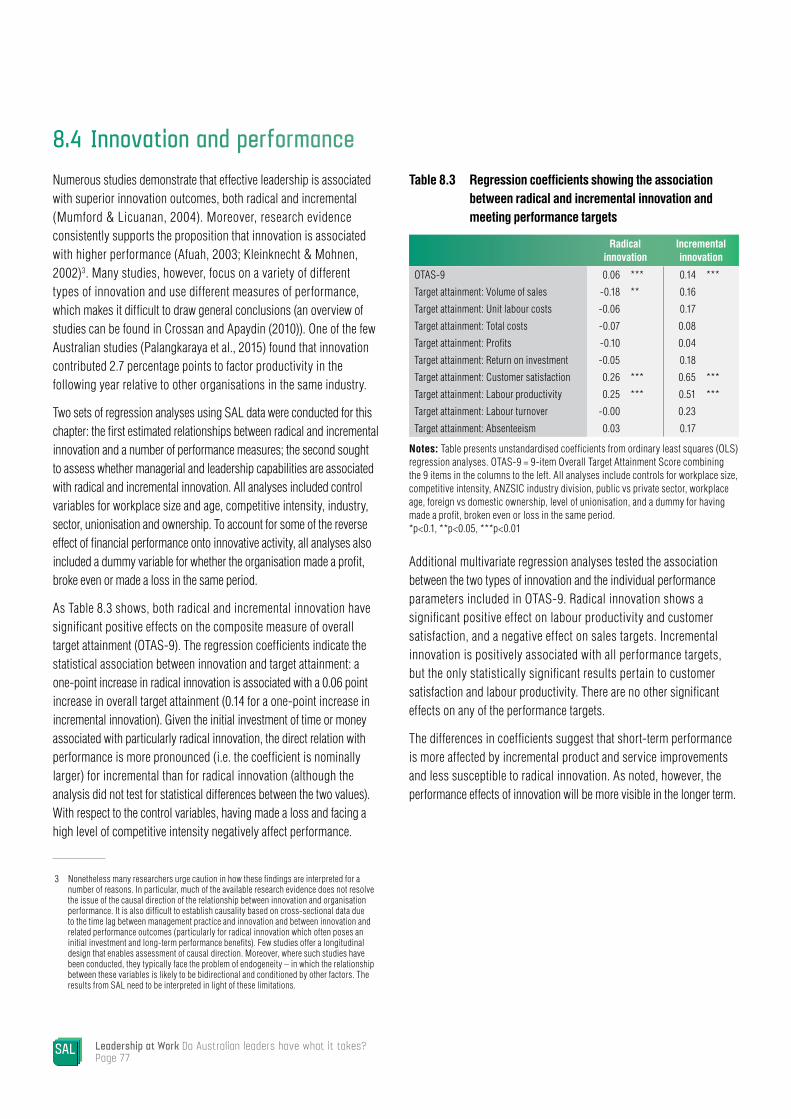
8.4 Innovation and performanceNumerous studies demonstrate that effective leadership is associated with superior innovation outcomes, both radical and incremental (Mumford & Licuanan, 2004). Moreover, research evidence consistently supports the proposition that innovation is associated with higher performance (Afuah, 2003; Kleinknecht & Mohnen, 2002)3. Many studies, however, focus on a variety of different types of innovation and use different measures of performance, which makes it difficult to draw general conclusions (an overview of studies can be found in Crossan and Apaydin (2010)). One of the few Australian studies (Palangkaraya et al., 2015) found that innovation contributed 2.7 percentage points to factor productivity in the following year relative to other organisations in the same industry.
Two sets of regression analyses using SAL data were conducted for this chapter: the first estimated relationships between radical and incremental innovation and a number of performance measures; the second sought to assess whether managerial and leadership capabilities are associated with radical and incremental innovation. All analyses included control variables for workplace size and age, competitive intensity, industry, sector, unionisation and ownership. To account for some of the reverse effect of financial performance onto innovative activity, all analyses also included a dummy variable for whether the organisation made a profit, broke even or made a loss in the same period.
As Table 8.3 shows, both radical and incremental innovation have significant positive effects on the composite measure of overall target attainment (OTAS-9). The regression coefficients indicate the statistical association between innovation and target attainment: a one-point increase in radical innovation is associated with a 0.06 point increase in overall target attainment (0.14 for a one-point increase in incremental innovation). Given the initial investment of time or money associated with particularly radical innovation, the direct relation with performance is more pronounced (i.e. the coefficient is nominally larger) for incremental than for radical innovation (although the analysis did not test for statistical differences between the two values). With respect to the control variables, having made a loss and facing a high level of competitive intensity negatively affect performance.
3 Nonetheless many researchers urge caution in how these findings are interpreted for a number of reasons. In particular, much of the available research evidence does not resolve the issue of the causal direction of the relationship between innovation and organisation performance. It is also difficult to establish causality based on cross-sectional data due to the time lag between management practice and innovation and between innovation and related performance outcomes (particularly for radical innovation which often poses an initial investment and long-term performance benefits). Few studies offer a longitudinal design that enables assessment of causal direction. Moreover, where such studies have been conducted, they typically face the problem of endogeneity – in which the relationship between these variables is likely to be bidirectional and conditioned by other factors. The results from SAL need to be interpreted in light of these limitations.
Table 8.3 Regression coefficients showing the association between radical and incremental innovation and meeting performance targets
Radical innovation
Incremental innovation
OTAS-9 0.06 *** 0.14 ***
Target attainment: Volume of sales -0.18 ** 0.16
Target attainment: Unit labour costs -0.06 0.17
Target attainment: Total costs -0.07 0.08
Target attainment: Profits -0.10 0.04
Target attainment: Return on investment -0.05 0.18
Target attainment: Customer satisfaction 0.26 *** 0.65 ***
Target attainment: Labour productivity 0.25 *** 0.51 ***
Target attainment: Labour turnover -0.00 0.23
Target attainment: Absenteeism 0.03 0.17
Notes: Table presents unstandardised coefficients from ordinary least squares (OLS) regression analyses. OTAS-9 = 9-item Overall Target Attainment Score combining the 9 items in the columns to the left. All analyses include controls for workplace size, competitive intensity, ANZSIC industry division, public vs private sector, workplace age, foreign vs domestic ownership, level of unionisation, and a dummy for having made a profit, broken even or loss in the same period. *p<0.1, **p<0.05, ***p<0.01
Additional multivariate regression analyses tested the association between the two types of innovation and the individual performance parameters included in OTAS-9. Radical innovation shows a significant positive effect on labour productivity and customer satisfaction, and a negative effect on sales targets. Incremental innovation is positively associated with all performance targets, but the only statistically significant results pertain to customer satisfaction and labour productivity. There are no other significant effects on any of the performance targets.
The differences in coefficients suggest that short-term performance is more affected by incremental product and service improvements and less susceptible to radical innovation. As noted, however, the performance effects of innovation will be more visible in the longer term.
Leadership at Work Do Australian leaders have what it takes?Page 77

8.5 Leadership and the innovation challengeThe second set of analyses assesses associations between managerial and leadership capabilities and radical and incremental innovation.
The statistical analyses reported in Table 8.4 report on the relationship between management and leadership and innovation at three levels:
1. Senior leader perceptions of management and leadership capabilities within the organisation.
2. Workplace leader perceptions of management practices, leadership capabilities and employee performance.
3. Employee perceptions of senior leadership, workplace management practices and organisational climate (i.e. employee-perceived flexibility, clarity of goals, trust and commitment).
The regression coefficients denote the statistical increase (in scale points) in the outcome variables (innovation) based on a one-point increase in the input variables (management and leadership capabilities and practices).
Table 8.4 Regression coefficients for the association between management and leadership variables and innovation outcomes
Radical innovation
Incremental innovation
Strategic implementation of objectives 0.29 *** 0.23 ***
High performance work systems 0.37 *** 0.34 ***
Employee participation 0.12 *** 0.15 ***
Internal career paths -0.06 -0.07 *
Training 0.14 *** 0.11 ***
Recruitment and selection 0.22 *** 0.20 ***
Job specification 0.12 *** 0.09 ***
Performance appraisal 0.17 *** 0.15 ***
Job security 0.07 ** 0.06 ***
Performance pay 0.02 0.06 ***
Dynamic capabilities 0.60 *** 0.49
Absorptive capacity 0.47 *** 0.39 ***
Transformative capability 0.42 *** 0.29 ***
Senior leader self-efficacy 0.06 0.09
Management practices score (0-1) 0.71 *** 0.71 ***
Leadership development (number of activities)
0.01 0.01
Leadership development present (yes/no) 0.01 0.04
Workplace leader self-efficacy 0.36 *** 0.31 ***
Organisational climate 0.37 *** 0.23 ***
Learning culture 0.17 *** 0.14 ***
Frontline manager self-efficacy 0.13 0.06
Frontline manager transformative capability
0.13 ** 0.12 ***
Employee engagement 0.17 ** 0.16 ***
Employee voice 0.10 * 0.11 ***
Managerial solicitation 0.05 0.08 **
Employee voice behaviour 0.00 0.05
Futility of speaking up (reverse coded) 0.10 *** 0.07 **
Creative self-efficacy -0.00 0.17 ***
Notes: The managerial and leadership variables included in these analyses are highly correlated. To avoid estimation bias associated with multicollinearity, statistical analyses were run separately for each of the independent variables. All analyses include controls for workplace size, competitive intensity, ANZSIC industry division, public vs private sector, workplace age, foreign vs domestic ownership and level of unionisation. *p<0.1, **p<0.05, ***p<0.01
Chapter 8 Leading innovation Page 78
Organisation characteristicsThe strategic implementation of objectives describes the extent to which strategic goals are implemented, communicated and understood within the organisation (Barrick et al., 2015). Strategic implementation is positively related to both radical and incremental innovation. This confirms results from prior research which associates deliberate goal setting with goal achievement – assuming that one of the organisational goals is indeed innovation.
High performance work practices (HPWP) are discussed in detail in Chapter 7 of this report. When deployed effectively, HPWP deliver enhanced employee and organisational outcomes. The analyses show that HPWP – overall and individually – tend to positively relate to both radical and incremental innovation. Although clear employee career paths show no direct relation with innovation outcomes, the results show a consistent positive association between employee management practices and innovation outcomes.
Organisational capabilities include among others dynamic capabilities and absorptive capacity. Organisational capabilities describe ‘the role of strategic management in appropriately adapting, integrating, and re-configuring internal and external organisational skills, resources, and functional competences toward changing environments’ (Teece & Pisano, 1994: 538). Many studies show that organisational capabilities strongly influence innovative outcomes.
Dynamic capabilities are higher order capabilities required to change the products, production processes, or markets (customers) served, and to reconfigure operational (day-to-day) capabilities to keep them relevant (Collis, 1994). SAL measures dynamic capabilities along three dimensions – sensing, learning and integrating (Pavlou & El Sawy, 2011). Based on the analyses, dynamic capabilities appear to have the largest positive association with radical and incremental innovation.
Absorptive capacity is a related concept and describes an organisation’s capability to recognise new external knowledge, assimilate it and apply it to commercial ends (Cohen & Levinthal, 1990). Measured along four dimensions – acquisition, assimilation, transformation and exploitation (Jansen et al., 2005), the SAL data show absorptive capacity to be positively related to both types of innovation. The strong relationships for both dynamic capabilities and absorptive capacity support the notion that management which promotes awareness, learning and integration of new external information, and effectively adapts organisational processes to this new knowledge benefits innovative outcomes.
Transformative capability measures an individual leader’s ability to utilise existing knowledge and (re-)combine it with new knowledge to develop new ideas and insights (Löwik, 2013). Analyses based on SAL show this capability – seen by Löwik as a micro-foundation for absorptive capacity – to be positively related to radical and incremental innovation. Leaders and managers need to have strong external relations and need to observe and readily react to changes in their business environment.
A senior leader’s self-efficacy describes their self-perceived competence for leading change in terms of setting direction, gaining followers' commitment, and overcoming obstacles to change (Paglis & Green, 2002). The analyses show no direct association with radical or incremental innovation.
Workplace levelMeasures on the workplace level are based on the workplace leaders’ perceptions. Most encompassing on this level is the management practices score (Bloom & Van Reenen, 2007), which includes a number of workplace organisation and management factors and gives an overall score (between 0 and 1) for the sophistication of management practices in a workplace. As expected, the management practices score not only positively relates to workplace performance (see Chapter 6), but is also positively associated with both radical and incremental innovation. Well-managed workplaces are more efficient all around, and generate more innovations.
Unlike at the senior leader level, leader self-efficacy at the workplace level is clearly related to innovation. The workplace leader’s ‘drive’ for change (Paglis & Green, 2002), shows positive associations with both radical and incremental innovation.
Leadership at Work Do Australian leaders have what it takes?Page 79
Employee perceptionsThe next block of measures relates to factors based on employee perceptions, aggregated to provide a workplace-level index. Organisational climate is measured as perceived flexibility, clarity of goals and pressure to produce (Patterson et al., 2005) and along factors related to affect- and cognition-based trust and normative commitment (Colquitt et al., 2012). The composite measure of organisational climate shows positive associations with radical and incremental innovation; that is, a flexible and trust-based organisational climate (and thus more satisfied employees) is conducive to both types of innovation.
Learning culture, that is, the extent to which employees perceive they are being encouraged to learn and share new knowledge (Gold & Arvind Malhotra, 2001) is positively associated with radical and incremental innovation.
The same measure of self-efficacy as utilised on the other levels (Paglis & Green, 2002) yielded no association with innovation outcomes on the frontline leader level. That workplace leader self-efficacy appears to influence innovative activity at the workplace, but not senior or frontline leader level suggests innovation is driven from middle management. Structural factors, such as frontline leaders not being empowered to make meaningful decisions and senior leaders being above product/service innovation decisions may play a role in explaining these results.
The positive association between transformative capability (Löwik, 2013) at the frontline leader level is less pronounced than at higher leadership levels, but there is nevertheless a positive relation to radical and incremental innovation.
Employee engagement was assessed based on measures by Barrick et al. (2015) and Rich et al. (2010). The level of effort and enthusiasm employees express for their work is positively related to radical as well as incremental innovation.
Employee voice encompasses perceived managerial solicitation, employees’ active voicing behaviour and perceived futility of speaking up (Fast et al., 2014). The futility of speaking up (reverse coded) shows a positive association, meaning futility is negatively associated with radical innovation. Other than that, the analyses show no direct relationships between employee voice dimensions and radical innovation. Incremental innovation is positively associated with managerial solicitation. Also the futility of speaking up (reverse coded) has a negative effect on incremental innovation. As a composite, employee voice shows no significant direct influence on radical innovation but appears to benefit incremental innovation.
Creative self-efficacy (Tierney & Farmer, 2002) describes an individual’s belief in their ability to produce creative outputs. While the analyses show no direct association with radical innovation, self-assessed creativity is positively associated with incremental innovation.
Across analyses, the control variables showed relatively few associations with innovation outcomes. Radical innovation appears to vary more by industry than incremental innovation. Organisations operating in the Mining, Electricity, Gas, Water and Waste Services, and Transport, Postal and Warehousing sectors tend to produce less radical innovation, while public (rather than private) organisations show positive outcomes. Industry differences are, overall, far less pronounced for incremental innovation.
In summary, organisational and workplace factors are associated consistently with both types of innovation outcomes. Employee-level factors show more consistent effects on incremental innovation. Also, the effects of managerial and leadership variables appear more pronounced for radical than for incremental innovation. These results are consistent with theoretical expectations when incremental improvements of products and services are considered the ‘day-to-day’ responsibilities of ‘lower-level’ employees, and radical innovation is seen as requiring senior leader approval. On the flipside, this also means that innovation, particularly radical innovation, requires explicit senior leadership commitment and support.
Chapter 8 Leading innovation Page 80
3 Frontline leadership and employee outcomes
This chapter focuses on frontline leadership. It starts with a profile of frontline leaders (individuals, other than senior leaders and workplace leaders, who have supervisory responsibilities within the workplace) in Australian organisations. The chapter then reports on employee perceptions of frontline leader effectiveness. The relationship between employees’ perceptions of frontline leadership and their work-related perceptions and outcomes is discussed.
Frontline leaders play a key role as intermediaries between senior leaders and employees. They have to implement strategies and decisions passed down from senior leadership, provide updates to senior leadership, and escalate issues and problems from the frontline. In addition, frontline leaders must satisfy the needs and expectations of employees on a day-to-day basis, again while relaying information back to senior leaders.
Despite the critical role played by frontline leaders, most leadership research has neglected them, focusing instead on the role and influence of senior leaders at the top of the organisation (Olsen et al., 2016). Yet, it is difficult to generalise research findings from the study of top leaders to frontline leadership. As noted in Chapter 2, frontline leaders and senior leaders perform distinct tasks and face different challenges. The Study of Australian Leadership provides data on this important group of leaders.
Key Findings » The demographic profile of frontline leaders is
characterised by a more gender diverse and younger cohort than is present among senior and workplace leaders, but with an ethnically and culturally similar makeup. Other characteristics were largely consistent with patterns identified among senior and workplace leaders discussed in Chapter 4.
» On average, employees are moderately satisfied with their frontline leaders.
» Frontline leadership effectiveness has a positive relationship with employee engagement.
» Frontline leadership effectiveness has a positive relationship with employee voice, learning culture perceptions and innovation climate perceptions.
» Frontline leadership effectiveness has a positive relationship with employees’ trust in their leaders.
» Frontline leadership effectiveness has a positive relationship with organisational commitment and a negative relationship with employees’ intentions to quit.
Box 9.1 Defining frontline leaders by age cohorts
This study reduced the more fine-grained age categories used to collect data to identify three groups of frontline leaders:
» Young frontline leaders defined as individuals in frontline leadership roles aged under 45 years.
» Prime-age frontline leaders defined as individuals in frontline leadership roles aged between 45 and 54 years.
» Ageing frontline leaders defined as individuals in frontline leadership roles aged 55 years or more.
Leadership at Work Do Australian leaders have what it takes?Page 81
9
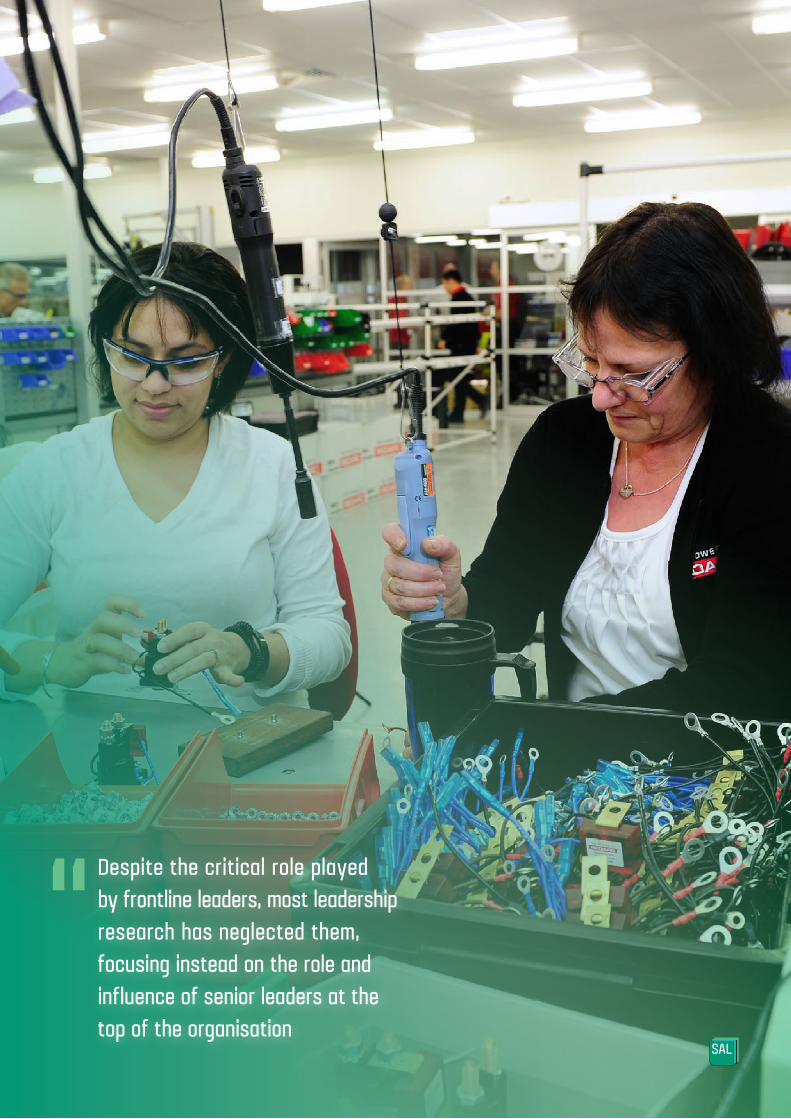
Despite the critical role played by frontline leaders, most leadership research has neglected them, focusing instead on the role and influence of senior leaders at the top of the organisation
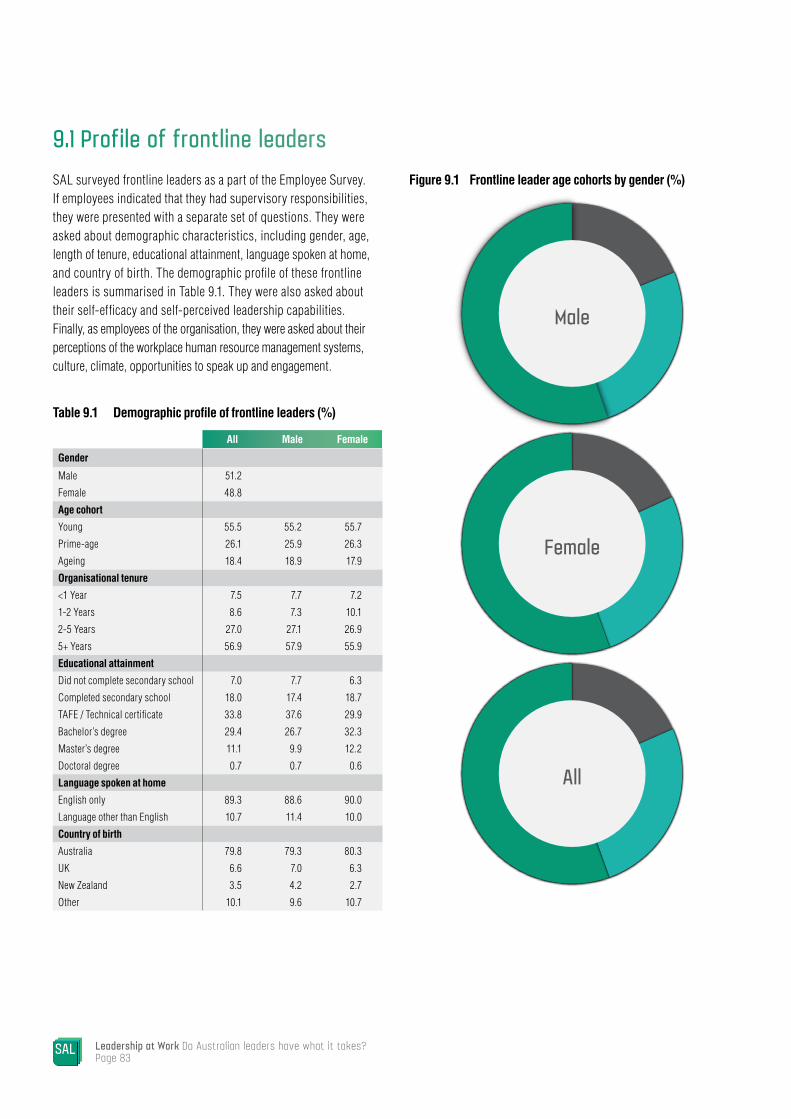
9.1 Profile of frontline leadersSAL surveyed frontline leaders as a part of the Employee Survey. If employees indicated that they had supervisory responsibilities, they were presented with a separate set of questions. They were asked about demographic characteristics, including gender, age, length of tenure, educational attainment, language spoken at home, and country of birth. The demographic profile of these frontline leaders is summarised in Table 9.1. They were also asked about their self-efficacy and self-perceived leadership capabilities. Finally, as employees of the organisation, they were asked about their perceptions of the workplace human resource management systems, culture, climate, opportunities to speak up and engagement.
Table 9.1 Demographic profile of frontline leaders (%)
All Male Female
Gender
Male 51.2
Female 48.8
Age cohort
Young 55.5 55.2 55.7
Prime-age 26.1 25.9 26.3
Ageing 18.4 18.9 17.9
Organisational tenure
<1 Year 7.5 7.7 7.2
1-2 Years 8.6 7.3 10.1
2-5 Years 27.0 27.1 26.9
5+ Years 56.9 57.9 55.9
Educational attainment
Did not complete secondary school 7.0 7.7 6.3
Completed secondary school 18.0 17.4 18.7
TAFE / Technical certificate 33.8 37.6 29.9
Bachelor’s degree 29.4 26.7 32.3
Master’s degree 11.1 9.9 12.2
Doctoral degree 0.7 0.7 0.6
Language spoken at home
English only 89.3 88.6 90.0
Language other than English 10.7 11.4 10.0
Country of birth
Australia 79.8 79.3 80.3
UK 6.6 7.0 6.3
New Zealand 3.5 4.2 2.7
Other 10.1 9.6 10.7
Figure 9.1 Frontline leader age cohorts by gender (%)
Leadership at Work Do Australian leaders have what it takes?Page 83
All
Female
Male

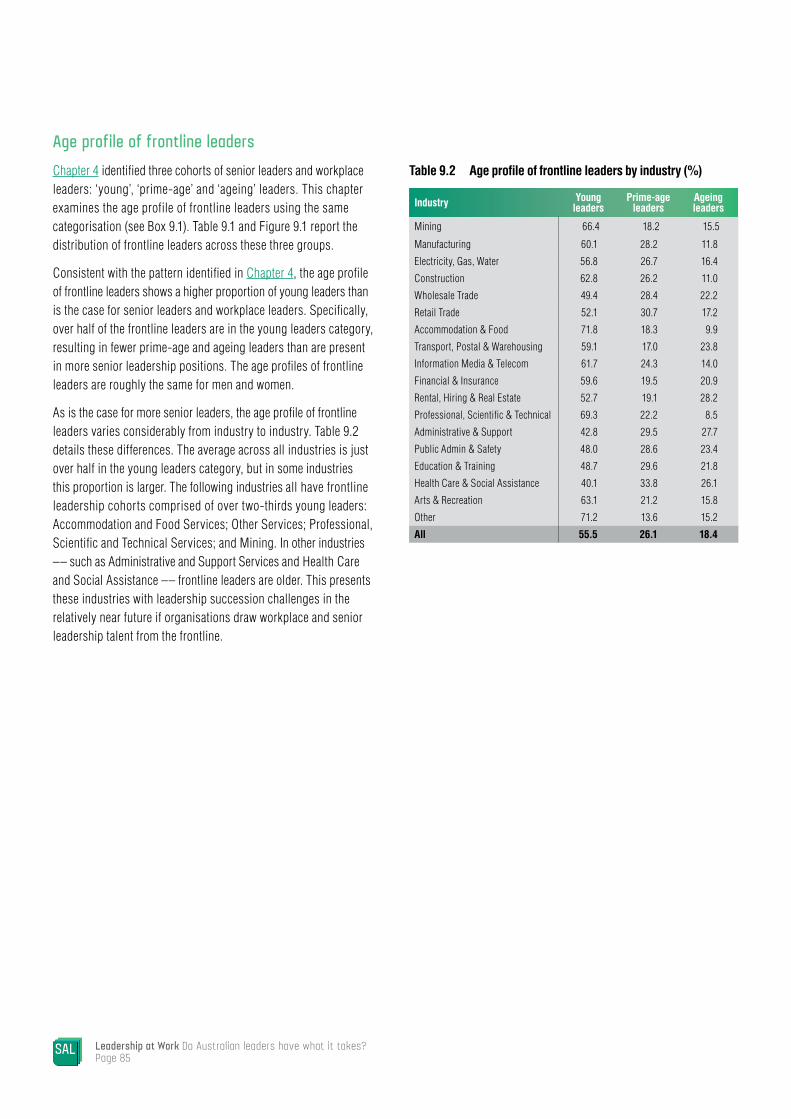
Age profile of frontline leadersChapter 4 identified three cohorts of senior leaders and workplace leaders: ‘young’, ‘prime-age’ and ‘ageing’ leaders. This chapter examines the age profile of frontline leaders using the same categorisation (see Box 9.1). Table 9.1 and Figure 9.1 report the distribution of frontline leaders across these three groups.
Consistent with the pattern identified in Chapter 4, the age profile of frontline leaders shows a higher proportion of young leaders than is the case for senior leaders and workplace leaders. Specifically, over half of the frontline leaders are in the young leaders category, resulting in fewer prime-age and ageing leaders than are present in more senior leadership positions. The age profiles of frontline leaders are roughly the same for men and women.
As is the case for more senior leaders, the age profile of frontline leaders varies considerably from industry to industry. Table 9.2 details these differences. The average across all industries is just over half in the young leaders category, but in some industries this proportion is larger. The following industries all have frontline leadership cohorts comprised of over two-thirds young leaders: Accommodation and Food Services; Other Services; Professional, Scientific and Technical Services; and Mining. In other industries –– such as Administrative and Support Services and Health Care and Social Assistance –– frontline leaders are older. This presents these industries with leadership succession challenges in the relatively near future if organisations draw workplace and senior leadership talent from the frontline.
Table 9.2 Age profile of frontline leaders by industry (%)
Industry Young leaders
Prime-age leaders
Ageing leaders
Mining 66.4 18.2 15.5
Manufacturing 60.1 28.2 11.8
Electricity, Gas, Water 56.8 26.7 16.4
Construction 62.8 26.2 11.0
Wholesale Trade 49.4 28.4 22.2
Retail Trade 52.1 30.7 17.2
Accommodation & Food 71.8 18.3 9.9
Transport, Postal & Warehousing 59.1 17.0 23.8
Information Media & Telecom 61.7 24.3 14.0
Financial & Insurance 59.6 19.5 20.9
Rental, Hiring & Real Estate 52.7 19.1 28.2
Professional, Scientific & Technical 69.3 22.2 8.5
Administrative & Support 42.8 29.5 27.7
Public Admin & Safety 48.0 28.6 23.4
Education & Training 48.7 29.6 21.8
Health Care & Social Assistance 40.1 33.8 26.1
Arts & Recreation 63.1 21.2 15.8
Other 71.2 13.6 15.2
All 55.5 26.1 18.4
Leadership at Work Do Australian leaders have what it takes?Page 85

Chapter 9 Frontline leadership and employee outcomes Page 86
Gender profile of frontline leadersNearly half of frontline leaders are women (Table 9.1). This is in contrast to the low proportions of women in senior leader and workplace leader roles, as discussed in Chapter 4. However, Figure 9.2 indicates that in eight of the eighteen industries, women make up more than half of frontline leaders, but proportions vary across industries. Consistent with the patterns among senior leaders and workplace leaders described in Chapter 4, certain industries are particularly male-dominated and female-dominated among even frontline leaders. In the traditionally male-dominated industries of Mining; Construction; Manufacturing; and Transport, Postal and Warehousing, frontline leadership is comprised of more than two-thirds men. Conversely, Health Care and Social Assistance; Education and Training; and Rental, Hiring and Real Estate have female-dominated frontline leadership, comprised of over 60% women. The remaining industries approach equal representation of genders among frontline leaders.
It is encouraging to see equal representation across these industries. However, when taken together with findings presented in Chapter 4, the data show women still face a ‘glass ceiling’, meaning that fewer women are promoted to senior and workplace leadership roles. If senior leaders and workplace leaders are drawn from talent at the frontline, one should observe equal proportions throughout the hierarchy. It is possible that many workplaces have recently embarked on genuine efforts in gender equality, but SAL results in Table 9.1 do not indicate that hiring efforts have shifted to increase the proportions of women in the recent past.
Sceptics of organisational efforts towards gender equality may reasonably argue that senior and workplace leadership in Australia is still not gender-inclusive and that organisations may be filling lower-level leadership positions to boost proportions of female leaders. To address these concerns, future measurement efforts should follow SAL’s lead and focus on proportions at different levels of leadership, rather than just on a ‘leader’ versus ‘non-leader’ distinction.
Figure 9.2 The gender profile of frontline leaders by industry (%)
Industry Male (%)
Female (%)
Mining 87.2 12.8
Manufacturing 72.5 27.5
Electricity, Gas, Water 65.6 34.5
Construction 82.9 17.1
Wholesale Trade 60.0 40.0
Retail Trade 47.9 52.1
Accommodation & Food 45.4 54.6
Transport, Postal & Warehousing 70.7 29.3
Information Media & Telecom 46.2 53.8
Financial & Insurance 59.4 40.6
Rental, Hiring & Real Estate 36.3 63.7
Professional, Scientific & Technical 52.5 47.6
Administrative & Support 60.5 39.3
Public Admin & Safety 65.6 34.4
Education & Training 34.8 65.2
Health Care & Social Assistance 18.9 81.1
Arts & Recreation 48.7 51.3
Other 45.9 54.1
All 51.2 48.8
MaleFemale
All

Educational qualifications of frontline leadersAs summarised in Table 9.1, the educational attainment status of frontline leaders varies. Only 7% have not completed high school –– a smaller proportion than observed among their more senior counterparts (Chapter 4). Additionally, frontline leaders exhibit larger proportions of individuals with secondary education as their highest qualification, compared to senior leaders. However, similar to single-site senior leaders and multi-site workplace leaders, 33.8% of frontline leaders have a TAFE or technical certificate and 29.5% have a bachelor’s degree as their highest educational attainment.
There is some difference between the educational attainment of men and women frontline leaders, in terms of their attainment of TAFE / technical certificates (37.6% among men versus 29.9% among women), bachelor’s degrees (26.7% among men versus 32.3% among women, and master’s degrees (9.9% among men versus 12.2% among women). However, there is considerably more variation by industry, as depicted in Figure 9.3. As with senior leaders, for a number of industries, completing secondary school (or less) represents the highest qualification.
This is the case for 66.2% of frontline leaders in Retail Trade, 46.1% in Rental, Hiring and Real Estate, and 43.3% in Wholesale Trade. Other industries require higher levels of educational attainment, consistent with patterns reported in Chapter 4 for more senior leaders. In the Education and Training industry, for example, only 6.6% of frontline leaders have a secondary school (or less) level, but 18.9% have a TAFE or technical certificate, and the largest proportion (45.7%) have a bachelor’s degree, with 28.9% at even higher levels. The Professional, Scientific and Technical industry exhibits a similar pattern.
As indicated in Table 9.3, there is some variation in educational attainment according to workplace age groups. Across all workplace age groups, frontline leaders with postgraduate degrees are few (from 10.4% to 13%), while over 60% have TAFE or undergraduate qualifications. This proportion is lowest among older (20+ years) workplaces, which also have the largest proportion (28.8%) of frontline leaders with secondary school qualifications, or less. Workplaces that are less than five years old have the greatest proportion (45.1%) of undergraduate degree-holding frontline leaders, and this proportion decreases with workplace age, to 27.1% for the oldest category.
Leadership at Work Do Australian leaders have what it takes?Page 87
Figure 9.3 Highest qualification of frontline leader by industry (%)
IndustrySecondary
school or less
TAFE / Technical
Bachelor’s degree
Post-graduate
Mining 33.4 33.9 28.0 4.7
Manufacturing 19.7 50.9 22.7 6.8
Electricity, Gas, Water 31.7 14.7 41.5 12.1
Construction 22.7 50.5 21.6 5.2
Wholesale Trade 43.3 31.6 12.1 13.0
Retail Trade 66.2 25.9 2.4 5.6
Accommodation & Food 28.1 31.4 38.6 2.0
Transport, Postal & Warehousing 29.4 45.4 19.1 6.1
Information Media & Telecom 32.3 31.1 28.8 7.8
Financial & Insurance 27.9 27.4 32.7 12.0
Rental, Hiring & Real Estate 46.1 36.1 16.0 1.8
Professional, Scientific & Technical 6.7 20.0 49.2 24.2
Administrative & Support 30.1 46.0 18.0 5.9
Public Admin & Safety 16.6 42.8 25.3 16.1
Education & Training 6.6 18.9 45.7 28.9
Health Care & Social Assistance 14.8 31.9 40.2 13.1
Arts & Recreation 24.2 26.4 41.0 8.3
Other 19.9 36.8 26.8 16.5
All 25.0 33.8 29.5 11.7
Secondary school or lessTAFE / technicalBachelor’s degreePostgraduate
All
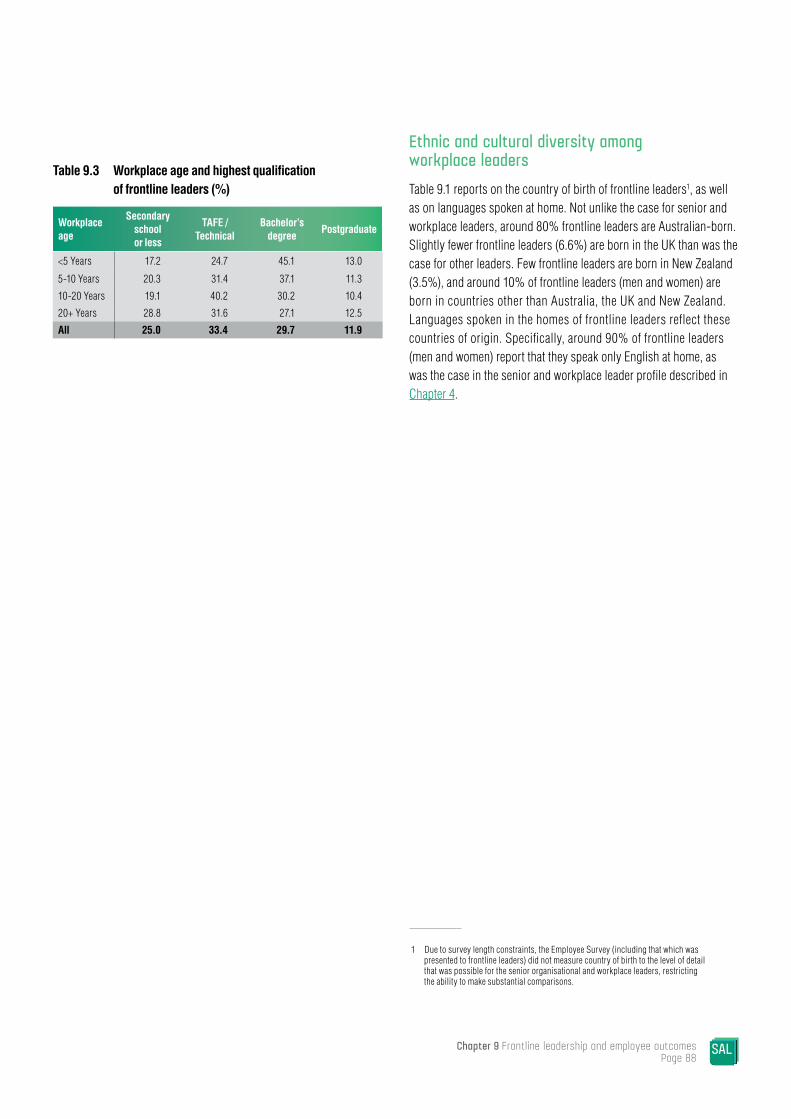
Chapter 9 Frontline leadership and employee outcomes Page 88
Table 9.3 Workplace age and highest qualification of frontline leaders (%)
Workplace age
Secondary school or less
TAFE / Technical
Bachelor’s degree
Postgraduate
<5 Years 17.2 24.7 45.1 13.0
5-10 Years 20.3 31.4 37.1 11.3
10-20 Years 19.1 40.2 30.2 10.4
20+ Years 28.8 31.6 27.1 12.5
All 25.0 33.4 29.7 11.9
Ethnic and cultural diversity among workplace leadersTable 9.1 reports on the country of birth of frontline leaders1, as well as on languages spoken at home. Not unlike the case for senior and workplace leaders, around 80% frontline leaders are Australian-born. Slightly fewer frontline leaders (6.6%) are born in the UK than was the case for other leaders. Few frontline leaders are born in New Zealand (3.5%), and around 10% of frontline leaders (men and women) are born in countries other than Australia, the UK and New Zealand. Languages spoken in the homes of frontline leaders reflect these countries of origin. Specifically, around 90% of frontline leaders (men and women) report that they speak only English at home, as was the case in the senior and workplace leader profile described in Chapter 4.
1 Due to survey length constraints, the Employee Survey (including that which was presented to frontline leaders) did not measure country of birth to the level of detail that was possible for the senior organisational and workplace leaders, restricting the ability to make substantial comparisons.
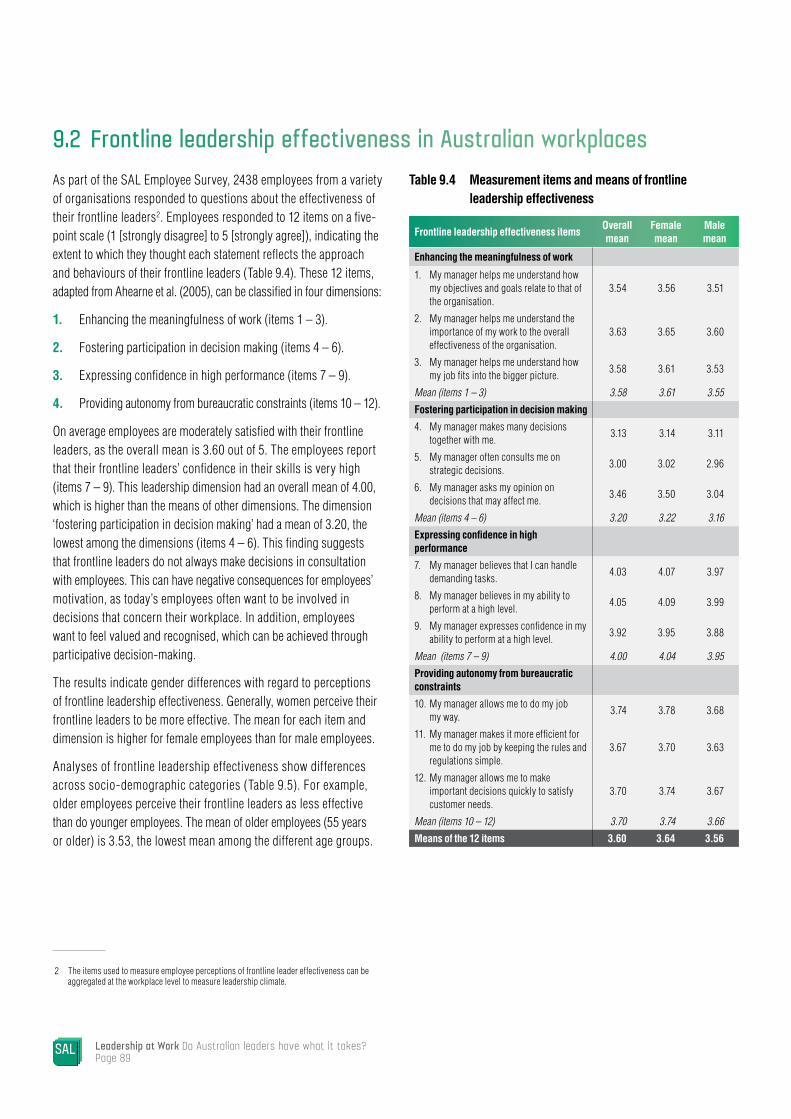
Leadership at Work Do Australian leaders have what it takes?Page 89
9.2 Frontline leadership effectiveness in Australian workplacesAs part of the SAL Employee Survey, 2438 employees from a variety of organisations responded to questions about the effectiveness of their frontline leaders2. Employees responded to 12 items on a five-point scale (1 [strongly disagree] to 5 [strongly agree]), indicating the extent to which they thought each statement reflects the approach and behaviours of their frontline leaders (Table 9.4). These 12 items, adapted from Ahearne et al. (2005), can be classified in four dimensions:
1. Enhancing the meaningfulness of work (items 1 – 3).
2. Fostering participation in decision making (items 4 – 6).
3. Expressing confidence in high performance (items 7 – 9).
4. Providing autonomy from bureaucratic constraints (items 10 – 12).
On average employees are moderately satisfied with their frontline leaders, as the overall mean is 3.60 out of 5. The employees report that their frontline leaders’ confidence in their skills is very high (items 7 – 9). This leadership dimension had an overall mean of 4.00, which is higher than the means of other dimensions. The dimension ‘fostering participation in decision making’ had a mean of 3.20, the lowest among the dimensions (items 4 – 6). This finding suggests that frontline leaders do not always make decisions in consultation with employees. This can have negative consequences for employees’ motivation, as today’s employees often want to be involved in decisions that concern their workplace. In addition, employees want to feel valued and recognised, which can be achieved through participative decision-making.
The results indicate gender differences with regard to perceptions of frontline leadership effectiveness. Generally, women perceive their frontline leaders to be more effective. The mean for each item and dimension is higher for female employees than for male employees.
Analyses of frontline leadership effectiveness show differences across socio-demographic categories (Table 9.5). For example, older employees perceive their frontline leaders as less effective than do younger employees. The mean of older employees (55 years or older) is 3.53, the lowest mean among the different age groups.
2 The items used to measure employee perceptions of frontline leader effectiveness can be aggregated at the workplace level to measure leadership climate.
Table 9.4 Measurement items and means of frontline leadership effectiveness
Frontline leadership effectiveness itemsOverall mean
Female mean
Male mean
Enhancing the meaningfulness of work
1. My manager helps me understand how my objectives and goals relate to that of the organisation.
3.54 3.56 3.51
2. My manager helps me understand the importance of my work to the overall effectiveness of the organisation.
3.63 3.65 3.60
3. My manager helps me understand how my job fits into the bigger picture.
3.58 3.61 3.53
Mean (items 1 – 3) 3.58 3.61 3.55
Fostering participation in decision making
4. My manager makes many decisions together with me.
3.13 3.14 3.11
5. My manager often consults me on strategic decisions.
3.00 3.02 2.96
6. My manager asks my opinion on decisions that may affect me.
3.46 3.50 3.04
Mean (items 4 – 6) 3.20 3.22 3.16
Expressing confidence in high performance
7. My manager believes that I can handle demanding tasks.
4.03 4.07 3.97
8. My manager believes in my ability to perform at a high level.
4.05 4.09 3.99
9. My manager expresses confidence in my ability to perform at a high level.
3.92 3.95 3.88
Mean (items 7 – 9) 4.00 4.04 3.95
Providing autonomy from bureaucratic constraints
10. My manager allows me to do my job my way.
3.74 3.78 3.68
11. My manager makes it more efficient for me to do my job by keeping the rules and regulations simple.
3.67 3.70 3.63
12. My manager allows me to make important decisions quickly to satisfy customer needs.
3.70 3.74 3.67
Mean (items 10 – 12) 3.70 3.74 3.66
Means of the 12 items 3.60 3.64 3.56
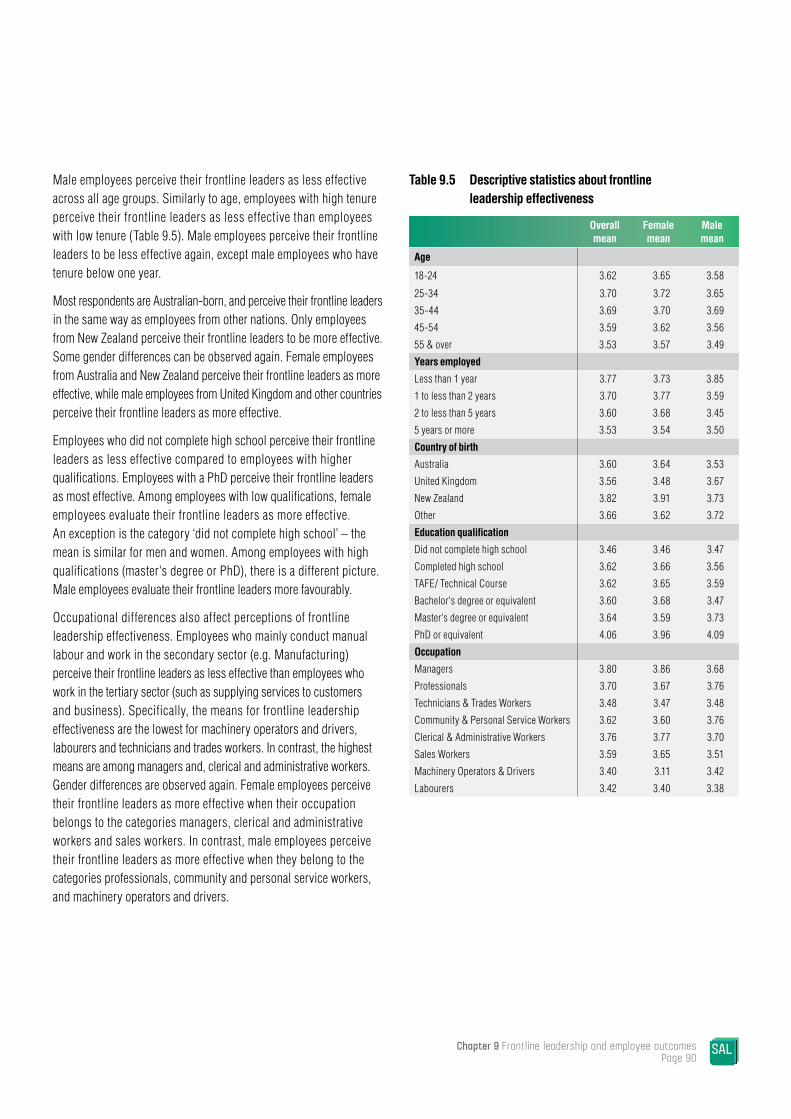
Chapter 9 Frontline leadership and employee outcomes Page 90
Male employees perceive their frontline leaders as less effective across all age groups. Similarly to age, employees with high tenure perceive their frontline leaders as less effective than employees with low tenure (Table 9.5). Male employees perceive their frontline leaders to be less effective again, except male employees who have tenure below one year.
Most respondents are Australian-born, and perceive their frontline leaders in the same way as employees from other nations. Only employees from New Zealand perceive their frontline leaders to be more effective. Some gender differences can be observed again. Female employees from Australia and New Zealand perceive their frontline leaders as more effective, while male employees from United Kingdom and other countries perceive their frontline leaders as more effective.
Employees who did not complete high school perceive their frontline leaders as less effective compared to employees with higher qualifications. Employees with a PhD perceive their frontline leaders as most effective. Among employees with low qualifications, female employees evaluate their frontline leaders as more effective. An exception is the category ‘did not complete high school’ – the mean is similar for men and women. Among employees with high qualifications (master's degree or PhD), there is a different picture. Male employees evaluate their frontline leaders more favourably.
Occupational differences also affect perceptions of frontline leadership effectiveness. Employees who mainly conduct manual labour and work in the secondary sector (e.g. Manufacturing) perceive their frontline leaders as less effective than employees who work in the tertiary sector (such as supplying services to customers and business). Specifically, the means for frontline leadership effectiveness are the lowest for machinery operators and drivers, labourers and technicians and trades workers. In contrast, the highest means are among managers and, clerical and administrative workers. Gender differences are observed again. Female employees perceive their frontline leaders as more effective when their occupation belongs to the categories managers, clerical and administrative workers and sales workers. In contrast, male employees perceive their frontline leaders as more effective when they belong to the categories professionals, community and personal service workers, and machinery operators and drivers.
Table 9.5 Descriptive statistics about frontline leadership effectiveness
Overall mean
Female mean
Male mean
Age
18-24 3.62 3.65 3.58
25-34 3.70 3.72 3.65
35-44 3.69 3.70 3.69
45-54 3.59 3.62 3.56
55 & over 3.53 3.57 3.49
Years employed
Less than 1 year 3.77 3.73 3.85
1 to less than 2 years 3.70 3.77 3.59
2 to less than 5 years 3.60 3.68 3.45
5 years or more 3.53 3.54 3.50
Country of birth
Australia 3.60 3.64 3.53
United Kingdom 3.56 3.48 3.67
New Zealand 3.82 3.91 3.73
Other 3.66 3.62 3.72
Education qualification
Did not complete high school 3.46 3.46 3.47
Completed high school 3.62 3.66 3.56
TAFE/ Technical Course 3.62 3.65 3.59
Bachelor's degree or equivalent 3.60 3.68 3.47
Master's degree or equivalent 3.64 3.59 3.73
PhD or equivalent 4.06 3.96 4.09
Occupation
Managers 3.80 3.86 3.68
Professionals 3.70 3.67 3.76
Technicians & Trades Workers 3.48 3.47 3.48
Community & Personal Service Workers 3.62 3.60 3.76
Clerical & Administrative Workers 3.76 3.77 3.70
Sales Workers 3.59 3.65 3.51
Machinery Operators & Drivers 3.40 3.11 3.42
Labourers 3.42 3.40 3.38

Leadership at Work Do Australian leaders have what it takes?Page 91
9.3 Frontline leadership effectiveness and employee outcomesTo evaluate the practical importance of frontline leadership, the relationship between frontline leadership effectiveness (evaluated by employees) and employee outcomes such as employee engagement, voice and learning (self-reported by employees) was examined. Employee engagement predicts job performance (see Technical Appendix for measurement of engagement). The results of a regression analysis which includes gender, age and organisational tenure as control variables are provided in Table 9.6.
The results indicate that frontline leadership effectiveness has a positive and significant relationship with employee engagement. A one-unit increase in frontline leadership effectiveness (based on a five-point Likert scale) is related to a 0.31 unit increase in engagement. This finding suggests that frontline supervisors could play a key role in increasing the engagement of employees.
Today’s dynamic and competitive business environment emphasises the importance of innovation. Employee voice, perceptions of a learning culture and perceptions of an innovation climate are predictors of innovation. The relationships between frontline leadership effectiveness and these employee outcomes were analysed. To measure employee voice, employees reported the degree to which they have the opportunity to express their opinions and to participate in the decision-making process. To measure learning culture perceptions, employees reported the degree to which they are encouraged to share knowledge and try new things. To measure innovation climate, employees evaluated the flexibility and adaptability of their organisation as well as acceptance of new ideas. The Technical Appendix has further information about the measurement.
Three regression analyses were conducted, controlling for employees’ gender, age and organisational tenure (Table 9.6). The results indicate that frontline leadership effectiveness has a positive and significant relationship with employee voice, learning culture perceptions and innovation climate perceptions. A one-unit increase in frontline leadership is related to a 0.72 unit increase in employees’ perceptions of voice, to a 0.65 unit increase in employees’ perceptions of learning culture and to a 0.73 unit increase in employees’ perceptions of innovation climate. Frontline leadership seems to be an important factor for employee outcomes that are crucial for innovation.
Other important employee outcomes are organisational commitment and employee turnover. Both variables are important factors for organisations. Employees feel less committed to organisations today and do not stay most of their work life in the same organisation. Instead, it is common for young employees to change organisations after few years to advance their career and gain new work experiences. Organisations suffer from employee turnover as they have to recruit and train new employees. This recruitment and training takes financial resources as well as time and effort from the current workforce. Most organisations are interested in increasing employees’ commitment to the organisation and in reducing employee turnover.
SAL includes data about employees’ organisational commitment and employees’ intentions to quit, which are direct predictors of employee turnover. To measure organisational commitment, employees evaluated statements that deal, for example, with their emotional attachment to their organisation and their feeling of belonging to their organisation (see Technical Appendix). To measure intentions to quit, employees evaluated statements such as whether they plan to leave the organisation in the near future.
Table 9.6 Regression results about the relationship between frontline leadership effectiveness and employee outcomes
Employee engagement
Voice Learning Innovation climate
Organisational commitment
Intentions to quit
Trust in management
Frontline leadership effectiveness 0.31** 0.72** 0.65** 0.73** 0.55** -0.78** 0.86**
Sample Size for Analysis (N) 2435 2431 2432 2432 2434 2414 2432
R2 0.18** 0.54** 0.47** 0.37** 0.29** 0.29** 0.58**
ΔR2 due to frontline leadership effectiveness
0.15** 0.53** 0.43** 0.32** 0.28** 0.26** 0.55**
Notes: Table presents unstandardized coefficients from ordinary least squares (OLS) regression analyses We controlled for gender, age and organisational tenure. * p< .05; ** p< .01; † p < .10
Chapter 9 Frontline leadership and employee outcomes Page 92
Two regression analyses were conducted, controlling for employees’ gender, age and organisational tenure. These are also reported in Table 9.6. The results show a positive and significant relationship between frontline leadership effectiveness and organisational commitment and a negative and significant relationship between frontline leadership effectiveness and employees’ intentions to quit. A one-unit increase in frontline leadership effectiveness is related to a 0.55 unit increase in organisational commitment, while a one-unit increase in frontline leadership effectiveness is associated with a 0.78 unit decrease in employees’ intentions to quit. Effective frontline leaders seem to play a key role in motivating employees to commit to their organisation and continue their career there.
Employees’ trust in their frontline leaders and its relationship with frontline leadership effectiveness was also considered. Management researchers often highlight the importance of trust in management and business. Trust has grown in importance for employees because of the recent global financial crises and related lay-offs. Lay-offs cause distrust in leadership. To investigate these links further, employee data from SAL was analysed to determine whether frontline leadership effectiveness has a positive relationship with employees’ trust. To measure employees’ trust, employees evaluated, through several statements, the trustworthiness of their frontline leaders (see Technical Appendix).
The statements dealt with relational and professional aspects of trustworthiness. A regression analysis was conducted, controlling for employees’ gender, age and organisational tenure. The regression results suggest a positive and significant relationship between frontline leadership effectiveness and employees’ trust in their supervisors. More precisely, a one-unit increase in frontline leadership effectiveness is related to a 0.86 unit increase in employees’ trust in their frontline leaders.
Frontline leaders play a key role in organisations. They deal, day-to-day, with employees, so they are in a good position to motivate and inspire them. This is reflected through the results of our statistical analysis, indicating that employees’ perceptions of their frontline leaders are related to key employee outcomes such as work engagement, voice, learning culture, innovation climate, organisational commitment, intention to quit and trust3.
3 Due to the cross-sectional nature of the study, information about causality can not be inferred.

10 Developing leaders for the future
This chapter focuses on the practices used to develop leaders in Australian workplaces. It provides an overview of the different types of leadership development in Australian workplaces. To evaluate the practical importance of leadership development, the relationships between leadership development with leadership effectiveness and workplace outcomes are analysed. Few international studies assess the effectiveness of leadership development activities. The Study of Australian Leadership (SAL) addresses this gap.
The previous chapters illustrate the importance of leadership at different levels within organisations – from senior leaders to frontline leaders. Effective leadership – embodied by diverse individuals within an organisation – is positively related to workplace performance, innovation and employee engagement. In light of these findings, it is important for organisations to understand how best to invest in developing effective leadership capabilities at all levels.
The importance of leadership development is not lost on organisations. Many recognise the key role of leadership. The number of leadership development activities increased markedly over the past decade (Day et al., 2013; Orazi et al., 2014), and the annual spend on leadership development also increased substantially. In the United States, for example, between $15 billion and $20 billion per year is spent on leadership development (O'Leonard & Loew, 2012) – far more than organisations spend on any other training and development (Berson, 2014). World-wide, this estimate is in the order of more than $50 billion per year (Kellerman, 2012: 154). In Australia, less evidence exists on leadership development outlays, but survey data suggest that Australian firms spend significantly less than their counterparts in Asia, Europe and the United States (Mercer, 2013).
Leadership development takes many forms. Based on recent reviews (Day et al., 2013; Orazi et al., 2014), leadership development activities can be classified in the following categories:
1. Formal leadership qualification programs provided externally through technical colleges, vocational institutes and universities.
2. Leadership seminars and workshops as well as online webinars, courses and workshops, often offered in-house.
3. Leadership assessment programs, such as 360-degree feedback assessments, developmental assessment centres and leadership simulation programs.
4. Special developmental assignments, such as job rotation programs, learning by observing (‘shadowing’) and action learning.
5. Mentoring programs, such as in-house mentoring, executive coaching, advisory and support networks.
While these activities apply across all levels of leadership within organisations, most initiatives target chief executives and other senior leaders. Again, while there are few studies comparing investments in senior and frontline leadership development, evidence for the Asia-Pacific region (including Australia) suggests that the difference is large: $10 spent on senior leaders for every $1 spent on frontline leaders (Mercer, 2013).
Leadership at Work Do Australian leaders have what it takes?Page 93
10

Key Findings » Around one in seven workplaces in multi-site
organisations do not provide any leadership development arrangements.
» Underperforming workplaces offer fewer leadership development arrangements.
» Leadership development has a positive relationship with leadership effectiveness as well as a positive indirect relationship with workplace performance and innovation.
» The indirect relationships between leadership development with workplace performance and innovation are explained through leadership effectiveness.
» Leadership development relates positively to leader self-efficacy and leadership capability of workplace leaders, which in turn relate positively to workplace outcomes. It is therefore important that leadership development is provided to workplace leaders.
Paradoxically, the amount spent on leader development is not reflected in the participants’ levels of satisfaction with these activities, or organisational assessments of the leader talent pool. In fact, the leadership development industry is subject to growing criticism. In her influential book, The End of Leadership, Barbara Kellerman (2012) concludes that investment in leadership development by US organisations has been misdirected and fails to address the enormous changes that organisations face. In her view, changes in organisational culture and new technologies have fundamentally altered the relationship between leaders and followers.
In an equally compelling view of leadership development, Jeffery Pfeffer (2015) argues that leadership development activities are plagued by idealistic models that bear little relationship to the reality of the day-to day role of leaders. In his view, our understanding of leadership, and how we develop leadership, also needs a fundamental reappraisal.
These critiques are based on US evidence. Even so, few studies assess the effectiveness of leadership development activities. The Study of Australian Leadership (SAL) addresses this gap. The study captured different types of leadership development activities among Australian organisations and their effectiveness. Specifically, through SAL the following questions can be addressed:
1. What type of leadership development is conducted in Australian workplaces?
2. Do leadership development activities relate to leadership effectiveness?
3. Do leadership development activities differ in low- vs. high-performing workplaces?
4. Do leadership development activities relate to workplace outcomes?
Leadership at Work Do Australian leaders have what it takes?Page 95
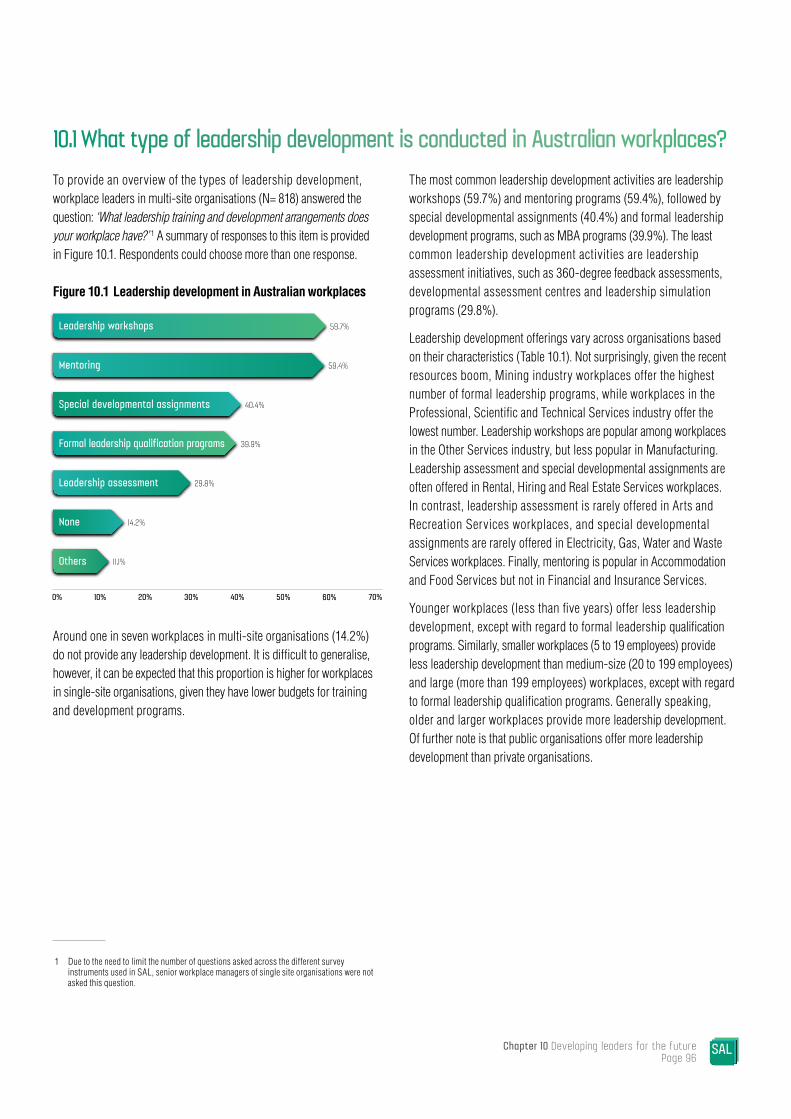
10.1 What type of leadership development is conducted in Australian workplaces?To provide an overview of the types of leadership development, workplace leaders in multi-site organisations (N= 818) answered the question: ‘What leadership training and development arrangements does your workplace have?’ 1 A summary of responses to this item is provided in Figure 10.1. Respondents could choose more than one response.
Figure 10.1 Leadership development in Australian workplaces
Around one in seven workplaces in multi-site organisations (14.2%) do not provide any leadership development. It is difficult to generalise, however, it can be expected that this proportion is higher for workplaces in single-site organisations, given they have lower budgets for training and development programs.
1 Due to the need to limit the number of questions asked across the different survey instruments used in SAL, senior workplace managers of single site organisations were not asked this question.
The most common leadership development activities are leadership workshops (59.7%) and mentoring programs (59.4%), followed by special developmental assignments (40.4%) and formal leadership development programs, such as MBA programs (39.9%). The least common leadership development activities are leadership assessment initiatives, such as 360-degree feedback assessments, developmental assessment centres and leadership simulation programs (29.8%).
Leadership development offerings vary across organisations based on their characteristics (Table 10.1). Not surprisingly, given the recent resources boom, Mining industry workplaces offer the highest number of formal leadership programs, while workplaces in the Professional, Scientific and Technical Services industry offer the lowest number. Leadership workshops are popular among workplaces in the Other Services industry, but less popular in Manufacturing. Leadership assessment and special developmental assignments are often offered in Rental, Hiring and Real Estate Services workplaces. In contrast, leadership assessment is rarely offered in Arts and Recreation Services workplaces, and special developmental assignments are rarely offered in Electricity, Gas, Water and Waste Services workplaces. Finally, mentoring is popular in Accommodation and Food Services but not in Financial and Insurance Services.
Younger workplaces (less than five years) offer less leadership development, except with regard to formal leadership qualification programs. Similarly, smaller workplaces (5 to 19 employees) provide less leadership development than medium-size (20 to 199 employees) and large (more than 199 employees) workplaces, except with regard to formal leadership qualification programs. Generally speaking, older and larger workplaces provide more leadership development. Of further note is that public organisations offer more leadership development than private organisations.
0% 10% 20% 30% 40% 50% 60% 70%
59.7%
59.4%
40.4%
39.9%
29.8%
14.2%
11.1%Others
None
Leadership assessment
Formal leadership qualification programs
Special developmental assignments
Mentoring
Leadership workshops
Chapter 10 Developing leaders for the future Page 96
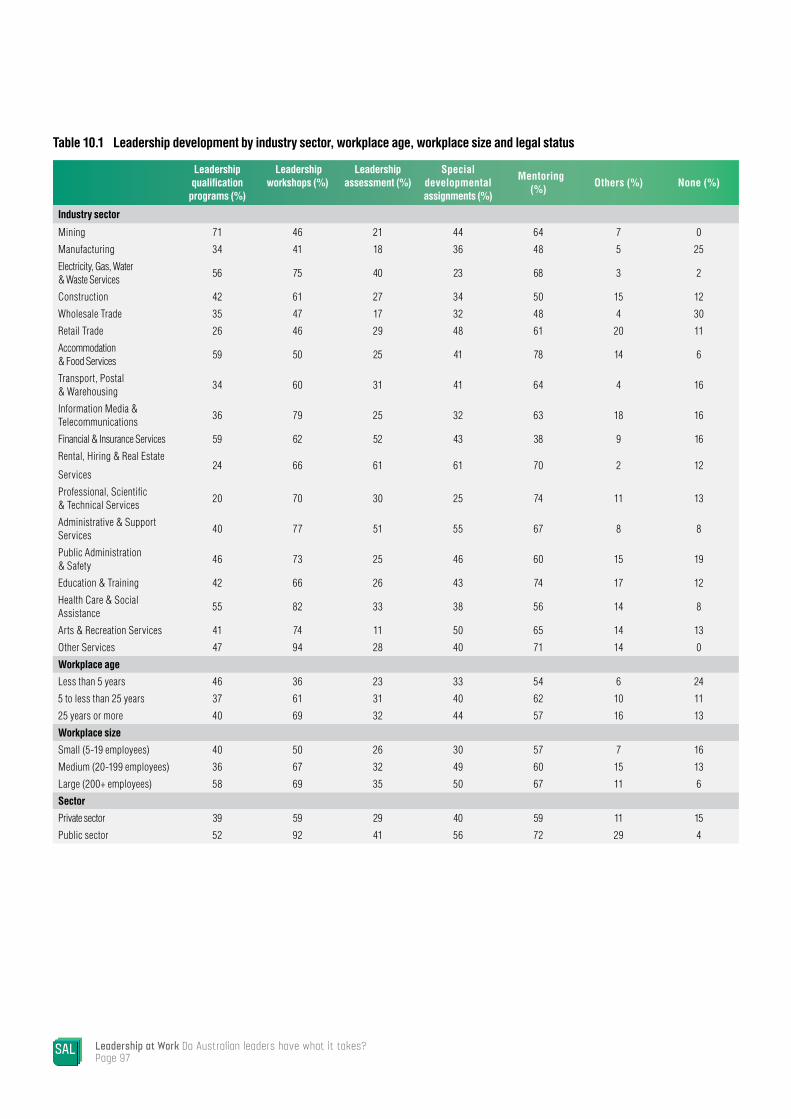
Table 10.1 Leadership development by industry sector, workplace age, workplace size and legal status
Leadership qualification
programs (%)
Leadership workshops (%)
Leadership assessment (%)
Special developmental assignments (%)
Mentoring (%)
Others (%) None (%)
Industry sector
Mining 71 46 21 44 64 7 0
Manufacturing 34 41 18 36 48 5 25
Electricity, Gas, Water & Waste Services
56 75 40 23 68 3 2
Construction 42 61 27 34 50 15 12
Wholesale Trade 35 47 17 32 48 4 30
Retail Trade 26 46 29 48 61 20 11
Accommodation & Food Services
59 50 25 41 78 14 6
Transport, Postal & Warehousing
34 60 31 41 64 4 16
Information Media & Telecommunications
36 79 25 32 63 18 16
Financial & Insurance Services 59 62 52 43 38 9 16
Rental, Hiring & Real Estate
Services24 66 61 61 70 2 12
Professional, Scientific & Technical Services
20 70 30 25 74 11 13
Administrative & Support Services
40 77 51 55 67 8 8
Public Administration & Safety
46 73 25 46 60 15 19
Education & Training 42 66 26 43 74 17 12
Health Care & Social Assistance
55 82 33 38 56 14 8
Arts & Recreation Services 41 74 11 50 65 14 13
Other Services 47 94 28 40 71 14 0
Workplace age
Less than 5 years 46 36 23 33 54 6 24
5 to less than 25 years 37 61 31 40 62 10 11
25 years or more 40 69 32 44 57 16 13
Workplace size
Small (5-19 employees) 40 50 26 30 57 7 16
Medium (20-199 employees) 36 67 32 49 60 15 13
Large (200+ employees) 58 69 35 50 67 11 6
Sector
Private sector 39 59 29 40 59 11 15
Public sector 52 92 41 56 72 29 4
Leadership at Work Do Australian leaders have what it takes?Page 97
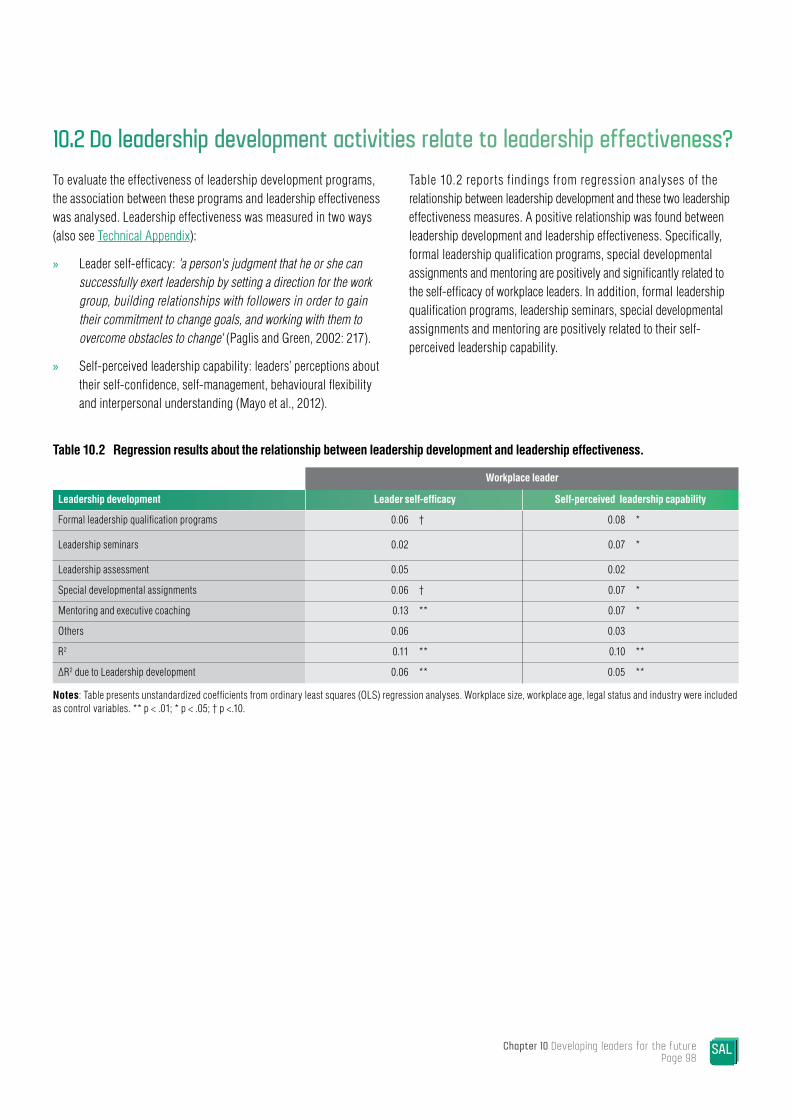
10.2 Do leadership development activities relate to leadership effectiveness?To evaluate the effectiveness of leadership development programs, the association between these programs and leadership effectiveness was analysed. Leadership effectiveness was measured in two ways (also see Technical Appendix):
» Leader self-efficacy: 'a person's judgment that he or she can successfully exert leadership by setting a direction for the work group, building relationships with followers in order to gain their commitment to change goals, and working with them to overcome obstacles to change' (Paglis and Green, 2002: 217).
» Self-perceived leadership capability: leaders’ perceptions about their self-confidence, self-management, behavioural flexibility and interpersonal understanding (Mayo et al., 2012).
Table 10.2 reports findings from regression analyses of the relationship between leadership development and these two leadership effectiveness measures. A positive relationship was found between leadership development and leadership effectiveness. Specifically, formal leadership qualification programs, special developmental assignments and mentoring are positively and significantly related to the self-efficacy of workplace leaders. In addition, formal leadership qualification programs, leadership seminars, special developmental assignments and mentoring are positively related to their self-perceived leadership capability.
Table 10.2 Regression results about the relationship between leadership development and leadership effectiveness.
Workplace leader
Leadership development Leader self-efficacy Self-perceived leadership capability
Formal leadership qualification programs 0.06 † 0.08 *
Leadership seminars 0.02 0.07 *
Leadership assessment 0.05 0.02
Special developmental assignments 0.06 † 0.07 *
Mentoring and executive coaching 0.13 ** 0.07 *
Others 0.06 0.03
R2 0.11 ** 0.10 **
ΔR2 due to Leadership development 0.06 ** 0.05 **
Notes: Table presents unstandardized coefficients from ordinary least squares (OLS) regression analyses. Workplace size, workplace age, legal status and industry were included as control variables. ** p < .01; * p < .05; † p <.10.
Chapter 10 Developing leaders for the future Page 98
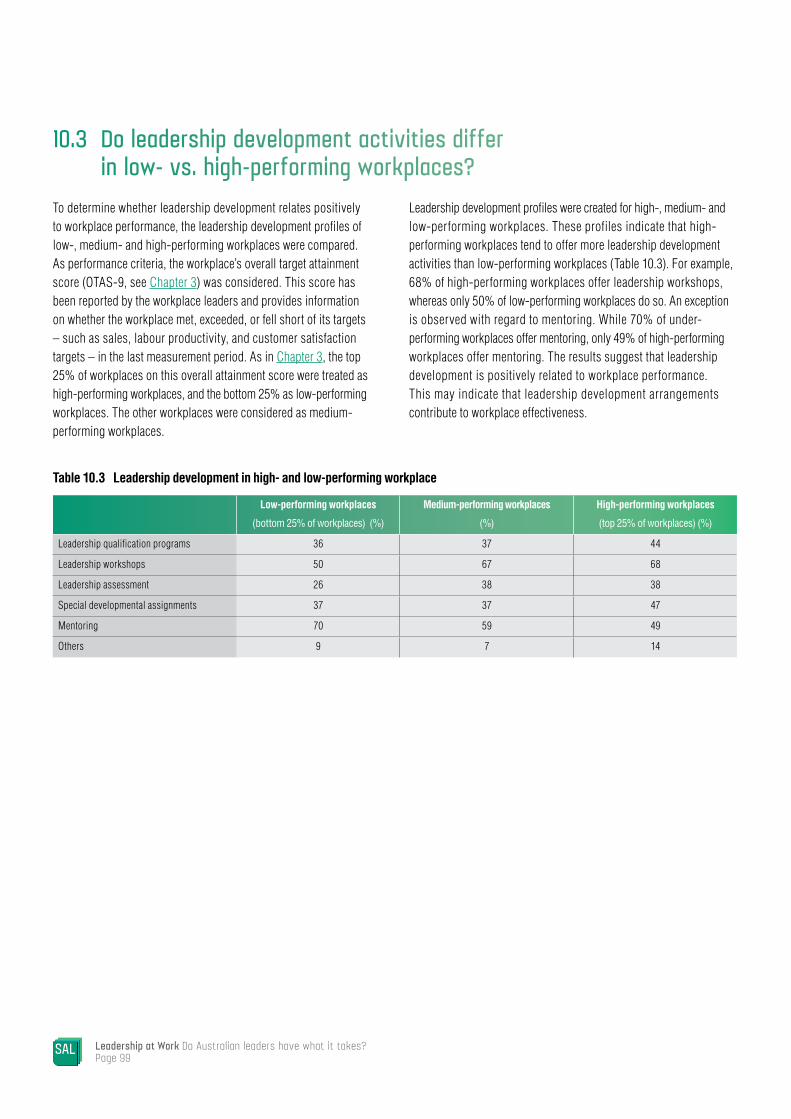
10.3 Do leadership development activities differ in low- vs. high-performing workplaces?
To determine whether leadership development relates positively to workplace performance, the leadership development profiles of low-, medium- and high-performing workplaces were compared. As performance criteria, the workplace’s overall target attainment score (OTAS-9, see Chapter 3) was considered. This score has been reported by the workplace leaders and provides information on whether the workplace met, exceeded, or fell short of its targets – such as sales, labour productivity, and customer satisfaction targets – in the last measurement period. As in Chapter 3, the top 25% of workplaces on this overall attainment score were treated as high-performing workplaces, and the bottom 25% as low-performing workplaces. The other workplaces were considered as medium-performing workplaces.
Leadership development profiles were created for high-, medium- and low-performing workplaces. These profiles indicate that high-performing workplaces tend to offer more leadership development activities than low-performing workplaces (Table 10.3). For example, 68% of high-performing workplaces offer leadership workshops, whereas only 50% of low-performing workplaces do so. An exception is observed with regard to mentoring. While 70% of under-performing workplaces offer mentoring, only 49% of high-performing workplaces offer mentoring. The results suggest that leadership development is positively related to workplace performance. This may indicate that leadership development arrangements contribute to workplace effectiveness.
Table 10.3 Leadership development in high- and low-performing workplace
Low-performing workplaces
(bottom 25% of workplaces) (%)
Medium-performing workplaces
(%)
High-performing workplaces
(top 25% of workplaces) (%)
Leadership qualification programs 36 37 44
Leadership workshops 50 67 68
Leadership assessment 26 38 38
Special developmental assignments 37 37 47
Mentoring 70 59 49
Others 9 7 14
Leadership at Work Do Australian leaders have what it takes?Page 99


10.4 Do leadership development activities relate to workplace outcomes?To evaluate the practical importance of leadership development, the relationship between leadership development activities and two workplace outcomes was analysed:
» Innovation
» Workplace performance
The findings in section 10.2 of this chapter suggest that leadership development is positively related to leader self-efficacy and leadership capability of workplace leaders. The ultimate aim of leadership development is improving leadership. Therefore, an indirect relationship between leadership development and workplace outcomes can be expected. In other words, when workplace leaders improve their leadership self-efficacy and leadership capability through leadership development, workplace outcomes also improve as an indirect result (see Figure 10.2). To investigate this indirect relationship, several mediation analyses were conducted at the workplace level. Workplace outcomes were measured in the following ways:
» To measure innovation, workplace leaders responded to several items that measured either radical or incremental innovation.
» Workplace leaders evaluated workplace performance in two different ways. The first is a composite measure of meeting targets (for example, with regard to sales, labour productivity and customer satisfaction). The second measure asked workplace leaders to compare the performance of their workplace with that of other workplaces. (See Technical Appendix for further information about the measurement scales.)
The results, shown in Table 10.4, suggest that leadership development does have a positive indirect relationship with key workplace outcomes by increasing leader self-efficacy and leadership capability. More precisely, all six leadership development activities are positively related to leader self-efficacy, which in turn is positively related to both workplace performance measures. When workplace development leads to higher leader self-efficacy, the highest number of indirect relationships on workplace performance is observed.
In contrast, the indirect relationships between leadership development and workplace performance (overall target attainment score: OTAS-9) through leadership capability are less significant. This suggests that leader self-efficacy (rather than leadership capability) is the key mechanism mediating the relationship between leadership development and workplace performance (OTAS-9). Formal leadership qualification programs, leadership assessment, special developmental assignments and mentoring had a positive but only marginally significant indirect relationship with workplace performance through leadership capability. Nevertheless, leadership capability intervenes few times in the relationship between leadership development and the second workplace performance measure (performance compared to other workplaces). More precisely, leadership capability explains the link between five leadership development activities (formal leadership qualification programs, leadership seminars, leadership assessment, special developmental assignments, mentoring and executive coaching) and workplace performance compared to other workplaces. In other words, these leadership development activities are positively related to leadership capability, which is in turn positively related to workplace performance.
Figure 10.2 Indirect relationship between leadership development and workplace outcomes.
Improved workplace outcomes
Improved leader self-efficacy
Leadership development Improved leadership capability
Leadership at Work Do Australian leaders have what it takes?Page 101
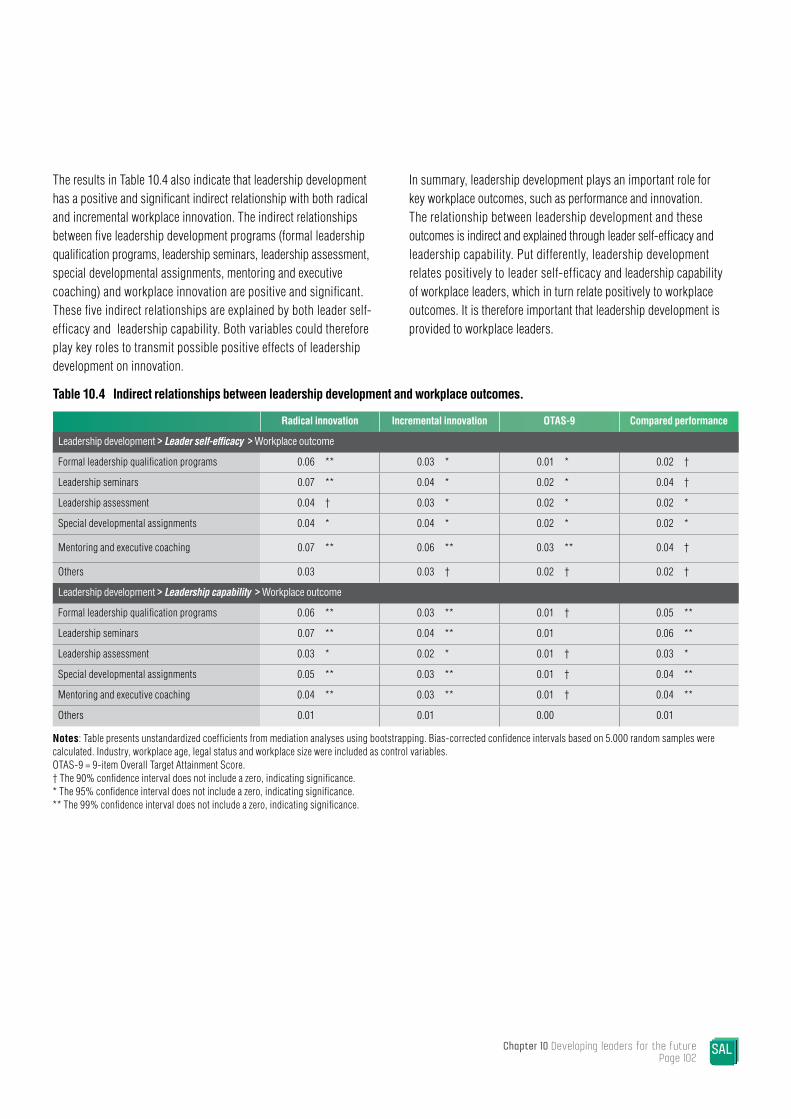
The results in Table 10.4 also indicate that leadership development has a positive and significant indirect relationship with both radical and incremental workplace innovation. The indirect relationships between five leadership development programs (formal leadership qualification programs, leadership seminars, leadership assessment, special developmental assignments, mentoring and executive coaching) and workplace innovation are positive and significant. These five indirect relationships are explained by both leader self-efficacy and leadership capability. Both variables could therefore play key roles to transmit possible positive effects of leadership development on innovation.
In summary, leadership development plays an important role for key workplace outcomes, such as performance and innovation. The relationship between leadership development and these outcomes is indirect and explained through leader self-efficacy and leadership capability. Put differently, leadership development relates positively to leader self-efficacy and leadership capability of workplace leaders, which in turn relate positively to workplace outcomes. It is therefore important that leadership development is provided to workplace leaders.
Table 10.4 Indirect relationships between leadership development and workplace outcomes.
Radical innovation Incremental innovation OTAS-9 Compared performance
Leadership development > Leader self-efficacy > Workplace outcome
Formal leadership qualification programs 0.06 ** 0.03 * 0.01 * 0.02 †
Leadership seminars 0.07 ** 0.04 * 0.02 * 0.04 †
Leadership assessment 0.04 † 0.03 * 0.02 * 0.02 *
Special developmental assignments 0.04 * 0.04 * 0.02 * 0.02 *
Mentoring and executive coaching 0.07 ** 0.06 ** 0.03 ** 0.04 †
Others 0.03 0.03 † 0.02 † 0.02 †
Leadership development > Leadership capability > Workplace outcome
Formal leadership qualification programs 0.06 ** 0.03 ** 0.01 † 0.05 **
Leadership seminars 0.07 ** 0.04 ** 0.01 0.06 **
Leadership assessment 0.03 * 0.02 * 0.01 † 0.03 *
Special developmental assignments 0.05 ** 0.03 ** 0.01 † 0.04 **
Mentoring and executive coaching 0.04 ** 0.03 ** 0.01 † 0.04 **
Others 0.01 0.01 0.00 0.01
Notes: Table presents unstandardized coefficients from mediation analyses using bootstrapping. Bias-corrected confidence intervals based on 5.000 random samples were calculated. Industry, workplace age, legal status and workplace size were included as control variables. OTAS-9 = 9-item Overall Target Attainment Score. † The 90% confidence interval does not include a zero, indicating significance. * The 95% confidence interval does not include a zero, indicating significance. ** The 99% confidence interval does not include a zero, indicating significance.
Chapter 10 Developing leaders for the future Page 102
References
Afuah, A. 2003. Innovation management: strategies, implementation and profits (2nd Ed.). New York: Oxford University Press, USA.
Ahearne, M., Mathieu, J., & Rapp, A. 2005. To empower or not to empower your sales force? An empirical examination of the influence of leadership empowerment behavior on customer satisfaction and performance. Journal of Applied Psychology, 90(5): 945-955.
Andrevski, G., Richard, O. C., Shaw, J. D., & Ferrier, W. J. 2014. Racial diversity and firm performance: The mediating role of competitive intensity. Journal of Management, 40: 820-844.
Avolio, B. J., Reichard, R. J., Hannah, S. T., Walumbwa, F. O., & Chan, A. 2009. A meta-analytic review of leadership impact research: Experimental and quasi-experimental studies. The Leadership Quarterly, 20(5): 764-784.
Barrick, M. R., Thurgood, G. R., Smith, T. A., & Courtright, S. H. 2015. Collective organizational engagement: Linking motivational antecedents, strategic implementation, and firm performance. Academy of Management Journal, 58(1): 111-135.
Bender, S., Bloom, N., Card, D., Van Reenen, J., & Wolter, S. 2015. Management practices, workforce selection and productivity. Working paper no. 22101, NBER Working Paper Series, Cambridge, MA.
Berson, J. 2014. Spending on corporate training soars: Employee capabilities now a priority. Forbes Magazine. forbes.com/sites/joshbersin/2014/02/04/the-recovery-arrives-corporate-training-spend-skyrockets/. Published 4 February 2014. Last Accessed 10 April 2016.
Bloom, N., & Van Reenen, J. 2007. Measuring and explaining management practices across firms and countries. Quarterly Journal of Economics, 122(4): 1351-1408.
Bloom, N., Sadun, R., & Van Reenen, J. 2012. The organization of firms across countries. Quarterly Journal of Economics, 127(4): 1663-1705.
Boxall, P., & Purcell, J. 2003. Strategy and Human Resource Management. Basingstoke, UK: Palgrave Macmillan.
Chen, G., Gully, S. M., & Eden, D. 2001. Validation of a new general self-efficacy scale. Organizational Research Methods, 4(1): 62-83.
Clayton, C., & Overdorf, M. 2000. Meeting the challenge of disruptive change. Harvard Business Review, 78(2): 66-76.
Cohen, W. M., & Levinthal, D. A. 1990. Absorptive capacity: a new perspective on learning and innovation. Administrative Science Quarterly: 35(1): 128-152.
Collis, D. J. 1994. Research note: how valuable are organizational capabilities? Strategic Management Journal, 15(S1): 143-152.
Colquitt, J. A., LePine, J. A., Piccolo, R. F., Zapata, C. P., & Rich, B. L. 2012. Explaining the justice–performance relationship: Trust as exchange deepener or trust as uncertainty reducer? Journal of Applied Psychology, 97(1): 1-15.
Combs, J., Liu, Y., Hall, A., & Ketchen, D. 2006. How much do High-Performance Work Practices matter? A meta-analysis of their effects on organisational performance. Personnel Psychology, 59(3): 501-528.
Crossan, M. M., & Apaydin, M. 2010. A multi-dimensional framework of organizational innovation: A systematic review of the literature. Journal of Management Studies, 47(6): 1154-1191.
Cornell University, INSEAD, & WIPO. 2015. The Global Innovation Index 2015: Effective innovation policies for development. globalinnovationindex.org/content/page/gii-full-report-2015/. Last Accessed 7 March 2016.
Day, D. V., Fleenor, J. W., Atwater, L. E., Sturm, R. E., & McKee, R. A. 2014. Advances in leader and leadership development: A review of 25 years of research and theory. The Leadership Quarterly, 25(1): 63-82.
DeChurch, L. A., Hiller, N. J., Murase, T., Doty, D., & Salas, E. 2010. Leadership across levels: Levels of leaders and their levels of impact. The Leadership Quarterly, 21(6): 1069–1085.
Denis, J. L., Lamothe, L., & Langley, A. 2001. The dynamics of collective leadership and strategic change in pluralistic organizations. Academy of Management Journal, 44(4): 809-837.
Dennis, J. L., Langley, A., & Sergi, V. 2012. Leadership in the plural. Academy of Management Annals, 6(1): 211-283.
Leadership at Work Do Australian leaders have what it takes?Page 103
DeSarbo, W.S., Di Benedetto, C.A., Song, M., & Sinha, I. 2005. Revisiting the Miles and Snow strategic framework: Uncovering interrelationships between strategic types, capabilities, environmental uncertainty, and firm performance. Strategic Management Journal, 26(1): 47-74.
DuBrin, A. J. 2013. Leadership: Research findings, practice, and skills (7th ed.). Mason, OH: South-Western Cengage Learning.
Eisenhardt, K. M. 1989. Making fast, strategic decisions in high velocity environments. Academy of Management Journal, 32: 543-576.
Ely, R. J., & Thomas, D. A. 2001. Cultural diversity at work: The moderating effects of work group perspectives on diversity. Administrative Science Quarterly, 46: 229-273.
Fast, N. J., Burris, E. R., & Bartel, C. A. 2014. Managing to stay in the dark: Managerial self-efficacy, ego defensiveness, and the aversion to employee voice. Academy of Management Journal, 57(4): 1013-1034.
Fayol, H. 1929. General and Industrial Management (J. A. Conbrough, Trans.). Geneva: International Management Institute.
Gibson, C., & Birkinshaw, J. 2004. The antecedents, consequences and mediating role of organizational ambidexterity. Academy of Management Journal, 47(2): 209-226.
Gioia, D. A., & Chittipeddi, K. 1991. Sensemaking and sensegiving in strategic change initiation. Strategic Management Journal, 12: 433-448.
Gold, A. H., & Arvind Malhotra, A. H. S. 2001. Knowledge management: An organizational capabilities perspective. Journal of Management Information Systems, 18(1): 185-214.
Goleman, D. 1998. What makes a leader? Harvard Business Review, 76(6): 92-102.
Green, R. 2009. Management Matters in Australia: Just how productive are we? industry.gov.au/industry/OtherReportsandStudies/Documents/ManagementMattersinAustraliaReport.pdf. Last Accessed 18 March 2016.
Harley, B. 2005. Hope or Hype? High Performance Work Systems. In B. Harley, J. Hyman & P. Thompson (Eds), Participation and Democracy at Work: Essays in Honour of Harvie Ramsay: 38-54. Houndmills, UK: Palgrave Macmillan.
Harley, B. 2007. Making the macro-micro link: Organisation and industry characteristics and the adoption of high performance work systems in Britain. Paper presented to the International Labour Process Conference, Amsterdam.
Hayes, A. F. 2013. An introduction to mediation, moderation, and conditional process analysis: A regression-based approach. New York: Guilford Press.
Heifetz, R. A., & Laurie, D. L. 1997. The work of leadership. Harvard Business Review, 75(1): 124-134.
IMF. 2015. World Economic Outlook Database. imf.org/external/pubs/ft/weo/2015/01/weodata/index.aspx. Last Accessed 24 March 2016.
Jackson, B., & Parry, K. 2008. A very short, fairly interesting and reasonably cheap book about studying leadership. London: Sage.
Jansen, J. J., Van Den Bosch, F. A., & Volberda, H. W. 2005. Managing potential and realized absorptive capacity: How do organizational antecedents matter? Academy of Management Journal, 48(6): 999-1015.
Jansen, J. J., Van Den Bosch, F. A., & Volberda, H. W. 2006. Exploratory innovation, exploitative innovation, and performance: Effects of organizational antecedents and environmental moderators. Management Science, 52(11): 1661-1674.
Joshi, A., & Sharma, S. 2004. Customer knowledge development: Antecedents and impact on new product performance. Journal of Marketing, 68: 47-59.
Karpin, D., 1995. Enterprising nation: Renewing Australia’s managers to meet the challenges of the Asia-Pacific century, report of the industry task force on leadership and management skills. voced.edu.au/content/ngv%3A21108. Last Accessed 15 March 2016. Canberra: Australian Government Publishing.
Kellerman, B. 2012. The End of Leadership. New York: HarperCollins Publishers.
References Page 104
Leadership at Work Do Australian leaders have what it takes?Page 105
Kleinknecht, A., & Mohnen, P. A. 2002. Innovation and firm performance: Econometric explorations of survey data: Basingstoke, UK: Palgrave.
Kogut, B., & Singh, H. 1988. The effect of national culture on the choice of entry mode. Journal of International Business Studies, 19: 411-432.
Kotter, J. P. 1990. What leaders really do. Harvard Business Review, 68(3): 103-111.
Krasikova, D. V., Green, S. G., & LeBreton, J. M. 2013. Destructive leadership: A theoretical review, integration, and future research agenda. Journal of Management, 39(5): 1308-1338.
Lant, T. K. 2002. Organizational cognition and interpretation. In J.A.C. Baum (Ed.), The Blackwell companion to organizations: 344-362. Oxford, UK: Blackwell.
O’Leonard, K., & Loew, L. 2012. Leadership development factbook 2012: Benchmarks and trends in U.S. leadership development. bersin.com/Store/details.aspx?docid=15587. Last Accessed 7 April 2014.
Löwik, S. J. A. 2013. Micro-foundations of absorptive capacity: A study on knowledge processes for innovation in SMEs. Unpublished doctoral dissertation, Universiteit Twente, Enschede, NL.
Mayo, M., Kakarika, M., Pastor, J. C., & Brutus, S. 2012. Aligning or inflating your leadership self-image? A longitudinal study of responses to peer feedback in MBA teams. Academy of Management Learning & Education, 11(4): 631-652.
Mercer. 2013. Asia Pacific Leadership Development Practices Study Report. mercer.com.au/content/dam/mercer/attachments/global/Talent/Develop-APLdrshpDevPractStudyRpt.pdf. Last Accessed 7 April 2016.
Mintzberg, H. 1973. The Nature of Managerial Work. New York: Harper & Row.
Morgeson, F. P., DeRue, S. D., & Karam, E. P. 2010. Leadership in teams: A functional approach to understanding leadership structures and processes. Journal of Management, 36(1): 5-39.
Mumford, M. D., & Licuanan, B. 2004. Leading for innovation: Conclusions, issues, and directions. The Leadership Quarterly, 15(1): 163-171.
Mumford, M. D., Friedrich, T. L., Caughron, J. J., & Byrne, C. L. 2007. Leader cognition in real-world settings: How do leaders think about crises? Leadership Quarterly, 18: 515-543.
Northouse, P. G. 2016. Leadership: Theory and practice, Thousand Oaks, CA: Sage.
Olsen, J. E., & Martins, L. L. 2012. Understanding organizational diversity management programs: A theoretical framework and directions for future research. Journal of Organizational Behavior, 33: 1168-1187.
Olsen, J., Gahan. P., & Butar, I. 2016. Leading from the Frontline. workplaceleadership.com.au/app/uploads/2016/02/OlsenEtAl-LeadingFromTheFrontline-2016-1.pdf. Last Accessed 25 May 2016.
Orazi, D., Good, L., Robin, M., van Wanrooy, B., Butar, I., Olsen, J., & Gahan, P. 2014. Workplace leadership - A review of prior research. workplaceleadership.com.au/app/uploads/2014/07/Workplace-Leadership-A-Review-of-Prior-Research-20142.pdf. Last Accessed 24 May 2016.
Paglis, L. L., & Green, S. G. 2002. Leadership self-efficacy and managers’ motivation for leading change. Journal of Organizational Behavior, 23(2): 215-235.
Palangkaraya, A., Spurling, T., & Webster, E. 2015. Does innovation make (SME) firms more productive? In A. Moore & J. Simon (Eds.), Small Business Conditions and Finance: 181-199. Sydney: Reserve Bank of Australia Conference.
Patterson, M. G., West, M. A., Shackleton, V. J., Dawson, J. F., Lawthom, R., Maitlis, S., Robinson, D. L., & Wallace, A. M. 2005. Validating the organizational climate measure: Links to managerial practices, productivity and innovation. Journal of Organizational Behavior, 26(4): 379-408.
Pavlou, P. A., & El Sawy, O. A. 2011. Understanding the elusive black box of dynamic capabilities. Decision Sciences, 42(1): 239-273.
Pearce, C. L., & Sims, H. P. 2002. Vertical versus shared leadership as predictors of the effectiveness of change management teams: An examination of aversive, directive, transactional, transformational, and empowering leader behaviors. Group Dynamics: Theory, Research, and Practice, 6(2): 172-197.
Pfeffer, J. 2015. Leadership BS: Fixing workplaces and careers one truth at a time. New York: Harper Business.
Porr, D. 2010. Toward more inclusive leadership pedagogy: Expanding the management versus leadership comparison. The International Journal of Learning, 17(5): 133-141.
Rost, J. C. 1991. Leadership for the 21st Century, Westport, CT: Praeger.
References Page 106
Patel, P., Messersmith, J., & Lepak, D. 2013. Walking the tightrope: An assessment of the relationship between high-performance work systems and organizational ambidexterity. Academy of Management Journal, 56(5): 1420-1442.
Rich, B. L., Lepine, J. A., & Crawford, E. R. 2010. Job engagement: Antecedents and effects on job performance. Academy of Management Journal, 53(3): 617-635.
Shoemaker, P. J. H., Krupp, S., & Howland, S. 2013. Strategic leadership: The essential skills. Harvard Business Review, 91(1/2): 131-134.
Solon, G., Haider, S.J., & Wooldridge, J.M. 2015. What are we weighting for? The Journal of Human Resources, 50(2): 301-316.
Teece, D., & Pisano, G. 1994. The dynamic capabilities of firms: An introduction. Industrial and Corporate Change, 3(3): 537-556.
Thomas, J. B., Sussman, S. W., & Henderson, J. C. 2001. Understanding “strategic learning”: Linking organizational learning, knowledge management, and sensemaking. Organization Science, 12(3): 331-345.
Tierney, P., & Farmer, S. M. 2002. Creative self-efficacy: Its potential antecedents and relationship to creative performance. Academy of Management Journal, 45(6): 1137-1148.
Van Knippenberg, D., & Sitkin, S. B. 2013. A critical assessment of charismatic-transformational leadership research: Back to the drawing board? The Academy of Management Annals, 7(1): 1–60.
von Krogh, G., Nonaka, I., & Rechsteiner, L. 2012. Leadership in organizational knowledge creation: A review and framework. Journal of Management Studies, 49(1): 240–277.
Weick, K. E. 1995. Sensemaking in organizations. Thousand Oaks, CA: Sage.
Winship, C., & Radbill, L. 1994. Sampling weights and regression analysis. Sociological Methods and Research, 23(2): 230-57.
Winterton, J. 2007. Training, development and competence. In P. Boxall, J. Purcell & P. Wright (Eds.), The Oxford Handbook of Human Resource Management : 324-343. Oxford: Oxford University Press.
Yukl, G. 1989. Managerial leadership: A review of theory and research. Journal of Management, 15(2): 251-290.
Yukl, G. 2008. How leaders influence organizational effectiveness. The Leadership Quarterly, 19(6): 708-722.
Yukl, G. 2013. Leadership in Organizations (8th ed.), Boston: Pearson.
Zhang, X., & Bartol, K. 2010. Linking empowering leadership and employee creativity: The influence of psychological empowerment, intrinsic motivation, and creative process engagement. The Academy of Management Journal, 53(1): 107-128.
Technical Appendix
SamplingThe target sampling unit for SAL was Australian workplaces. However, no population frame of Australian workplaces exists. A two-stage sampling procedure was used, involving first sampling at the organisation level, and then sampling at the workplace level within responding organisations.
Organisations were drawn from an extract of the Dun & Bradstreet business listings database as at 9 February 2015. In-scope organisations were those with five or more employees in any industry other than Agriculture, Forestry and Fishing (i.e., Division A of the Australian and New Zealand Standard Industrial Classification, ANZSIC).
The population of in-scope organisations was stratified by ANZSIC industry division and three size categories: small (5-19 employees), mid-sized (20-199 employees) and large (200+ employees)1. The selection probabilities within each stratum were designed to achieve an overall margin of error (MOE) of no more than 2.2% for the whole Study and no more than 10% for detailed (industry by size) cells2.
Workplaces were then selected within responding organisations at stage two of the sampling. All workplaces within single-site organisations were selected by definition. In multi-site organisations, different numbers of workplaces were selected, depending on the total number of sites: one workplace was selected if the organisation had five or fewer workplaces; two were selected if the organisation had six to 20 workplaces; and three were selected if the organisation had 21 or more workplaces.
1 This yields 54 sample strata: 18 industry divisions by three organisational size categories.
2 Calculated with reference to Australian Bureau of Statistics (2014) Counts of Australian Businesses, including Entries and Exits, June 2009-2013, cat. no. 8165.0, http://bit.ly/1qQ33gg
The initial sample draw consisted of 16,502 organisations. To boost response rates in some strata, the initial draw was supplemented during fieldwork by a second draw of 6,687 organisations, bringing the total selections to 23,189.
During pre-field sample cleaning, 3,909 of the selected organisations were discarded as ineligible. Many of these were ‘paper companies’ or non-employing entities of larger organisations. A further 2,254 organisations were deemed out of scope during screening, as they had fewer than five employees or were operating in Agriculture, Forestry and Fishing. Finally, 3,174 selected organisations were unusable, due to inaccuracies in the information extracted from the Dun & Bradstreet frame, including wrong phone numbers or entities that were no longer in operation. These various exclusions left 13,852 useable organisation selections as the basis for the survey fieldwork.
Employees were approached within their workplace. A representative in each responding workplace was asked to distribute the Employee Survey to all employees in the workplace. Larger workplaces could choose to invite a sample of their employees (25% for workplaces with 200-499 employees, and 20% for workplaces with 500+ employees) to reduce response burden. Instructions on how to randomise the employee selection process were provided to the workplace representative. Employees responded directly to the survey fieldwork company. Workplace managers were eligible to complete the Employee Survey, but few did so3.
3 There is no way to check this precisely as the identity of employees is unknown, and there was no mechanism for preventing duplication across the survey instruments. Comparisons of respondents’ demographic attributes suggest that fewer than 2% of workplace managers completed the Employee Survey.
Leadership at Work Do Australian leaders have what it takes?Page 107
WeightingSurvey weights were developed to enable population inferences from the organisation, workplace and employee samples. All weights were calculated with respect to ABS population benchmarks.
1. The organisation level weight is a selection weight which has been adjusted using the ABS counts of Australian businesses4 and post-stratified organisation counts. The selection weight was calculated within strata as the ratio of live organisations on the frame to the number of completed responses. The number of live organisations per strata was estimated from the proportions of selected organisations that were operating and in-scope.
2. The workplace level weight is also a selection weight, but is based on survey responses about the number of workplaces per organisation. The selection weight was calculated within strata as the ratio of workplaces reported by responding organisations to the number of completed responses. As this weight is based on survey data, it is subject to sampling variability. To minimise relative standard errors in some strata, the medium and large workplace size categories were collapsed in calculating the workplace weights.
3. The employee level weight was calculated independently of organisation and workplace weights. An iterative proportional fitting was used to weight employee responses to ABS population benchmarks with respect to industry (ANZSIC Division), occupation (ANZSCO Major Group) and organisation size (small, medium, large). Benchmarks were sourced from the ABS Survey of Employee Earnings and Hours5. Employee occupation was imputed for a small number of respondents using other reported characteristics.
4 ABS, Customised report, 2016: Counts of Australian Businesses (cat. no. 8165.0, June 2014) by selected ANZSIC divisions by customised employment size ranges [data available on request].
5 ABS, Customised report, 2015: Survey of Employee Earnings and Hours (cat. no. 6306.0, May 2014).
All population estimates in this report (e.g. means and proportions) have been calculated with weights applied. None of the regression analyses are weighted, but the regression models include controls for the variables used to derive the weights; for instance, regressions using the workplace data control for workplace size and industry6.
The multi-instrument structure of SAL introduces sample attrition issues and, thus, complications for data weighting. Not all senior workplace leaders completed the Performance Questionnaire and some responding workplaces do not have any matching employees. (See Chapter 1 for further information.) In some parts of the analysis, we use the full workplace sample. In others, we focus on the subsample of workplaces that completed the Performance Questionnaire. However, we have only one workplace data weight. We have undertaken a series of data checks to ensure that this weight yields appropriate estimates of underlying population parameters when used with the restricted workplace sub samples. Specifically, we tested for differences in the estimated workplace population proportions by size and industry when using different sub-sets of the workplace data. In each case, the estimates deviate only slightly and the proportional errors are well within the Study’s overall design margin of error of 2.2%.
6 The use of weights in regression analysis is discussed in Solon et al. (2015) and Winship and Radbill (1994).
Technical Appendix Page 108
Leadership at Work Do Australian leaders have what it takes?Page 109
Other notes on interpretation of the resultsMean scores were used for many measures in this report, without list-wise deletion. Generally, where ‘Don’t know’ or ‘Refused’ were presented as response options, these were treated as missing values in the analysis. An exception is Chapter 6, where ‘Don’t Know’ is treated as a legitimate response in the analysis of some management practices.
Many of the scale measures reported are taken directly from published academic sources (see below). Some scales were adapted to better reflect SAL terminology, this mainly involved replacing words like ‘firm’ or ‘business’ with ‘organisation’ and ‘workplace’. All scales were retested for reliability; Cronbach’s alpha statistics are reported below.
In some analyses, employee responses are aggregated within workplaces by calculating mean scores. For example, employee engagement at the workplace level is the mean for all responding employees in that workplace.
‘Bootstrapping’ is the random sampling of observations (with replacement) from the dataset (Hayes, 2013). We use this technique in Chapter 10 to test the statistical significance of an indirect relationship (in this case, between leadership development practices and workplace performance).
‘High’ and ‘low’ performers are defined as workplaces in the top and bottom quartiles (25%) of the distribution for a particular measure, such as in the discussion of workplace performance (Chapter 3) and in the discussion of innovation performance (Chapter 8).
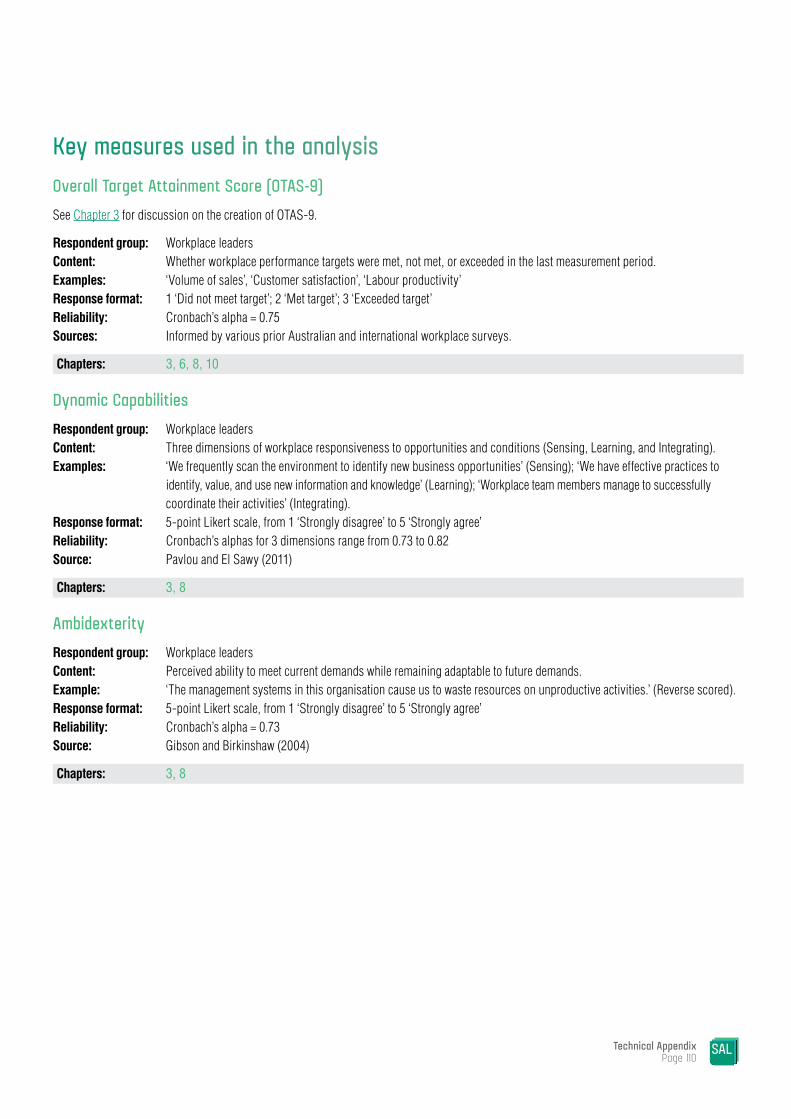
Technical Appendix Page 110
Key measures used in the analysisOverall Target Attainment Score (OTAS-9)See Chapter 3 for discussion on the creation of OTAS-9.
Respondent group: Workplace leadersContent: Whether workplace performance targets were met, not met, or exceeded in the last measurement period.Examples: ‘Volume of sales’, ‘Customer satisfaction’, ‘Labour productivity’Response format: 1 ‘Did not meet target’; 2 ‘Met target’; 3 ‘Exceeded target’Reliability: Cronbach’s alpha = 0.75Sources: Informed by various prior Australian and international workplace surveys.
Chapters: 3, 6, 8, 10
Dynamic CapabilitiesRespondent group: Workplace leadersContent: Three dimensions of workplace responsiveness to opportunities and conditions (Sensing, Learning, and Integrating).Examples: ‘We frequently scan the environment to identify new business opportunities’ (Sensing); ‘We have effective practices to
identify, value, and use new information and knowledge’ (Learning); ‘Workplace team members manage to successfully coordinate their activities’ (Integrating).
Response format: 5-point Likert scale, from 1 ‘Strongly disagree’ to 5 ‘Strongly agree’Reliability: Cronbach’s alphas for 3 dimensions range from 0.73 to 0.82Source: Pavlou and El Sawy (2011)
Chapters: 3, 8
Ambidexterity Respondent group: Workplace leadersContent: Perceived ability to meet current demands while remaining adaptable to future demands.Example: ‘The management systems in this organisation cause us to waste resources on unproductive activities.’ (Reverse scored).Response format: 5-point Likert scale, from 1 ‘Strongly disagree’ to 5 ‘Strongly agree’Reliability: Cronbach’s alpha = 0.73Source: Gibson and Birkinshaw (2004)
Chapters: 3, 8

Leadership at Work Do Australian leaders have what it takes?Page 111
Leadership CompetenceRespondent group: Workplace leadersContent: Four dimensions capturing leaders’ perceptions of themselves and their role as a manager in the workplace (Self-
confidence, Self-management, Behavioural flexibility, and Interpersonal understanding).Examples: ‘I show confidence when facing unforeseen situations’ (Self-confidence); ‘I know how to get organised to balance the
pressures of work’ (Self-management); ‘I do not feel stressed or frustrated when doing several tasks at the same time’ (Behavioural flexibility); ‘I put myself in the place of others and respect their opinions’ (Interpersonal understanding).
Response format: 5-point Likert scale, from 1 ‘Strongly disagree’ to 5 ‘Strongly agree’Reliability: Cronbach’s alphas for 4 dimensions range from 0.57 to 0.78Source: Mayo et al. (2012)
Chapters: 3, 6, 10
Organisational CommitmentRespondent group: EmployeesExample: ‘I would be very happy to spend the rest of my career with this organisation.’Response format: 5-point Likert scale, from 1 ‘Strongly disagree’ to 5 ‘Strongly agree’Reliability: Cronbach’s alpha = 0.86Sources: Colquitt et al. (2012); Patterson et al. (2005)
Chapters: 3, 9, 8
Employee EngagementRespondent group: EmployeesExample: ‘I gain considerable pride from performing my job well.’Response format: 5-point Likert scale, from 1 ‘Strongly disagree’ to 5 ‘Strongly agree’Reliability: Cronbach’s alpha = 0.90Sources: Barrick et al. (2015); Rich et al. (2010)
Chapters: 3, 6, 8, 9
Intention to QuitRespondent group: EmployeesExample: ‘I often think about quitting this job.’Response format: 5-point Likert scale, from 1 ‘Strongly disagree’ to 5 ‘Strongly agree’Reliability: Cronbach’s alpha = 0.93Source: Fast et al. (2014)
Chapters: 3, 9
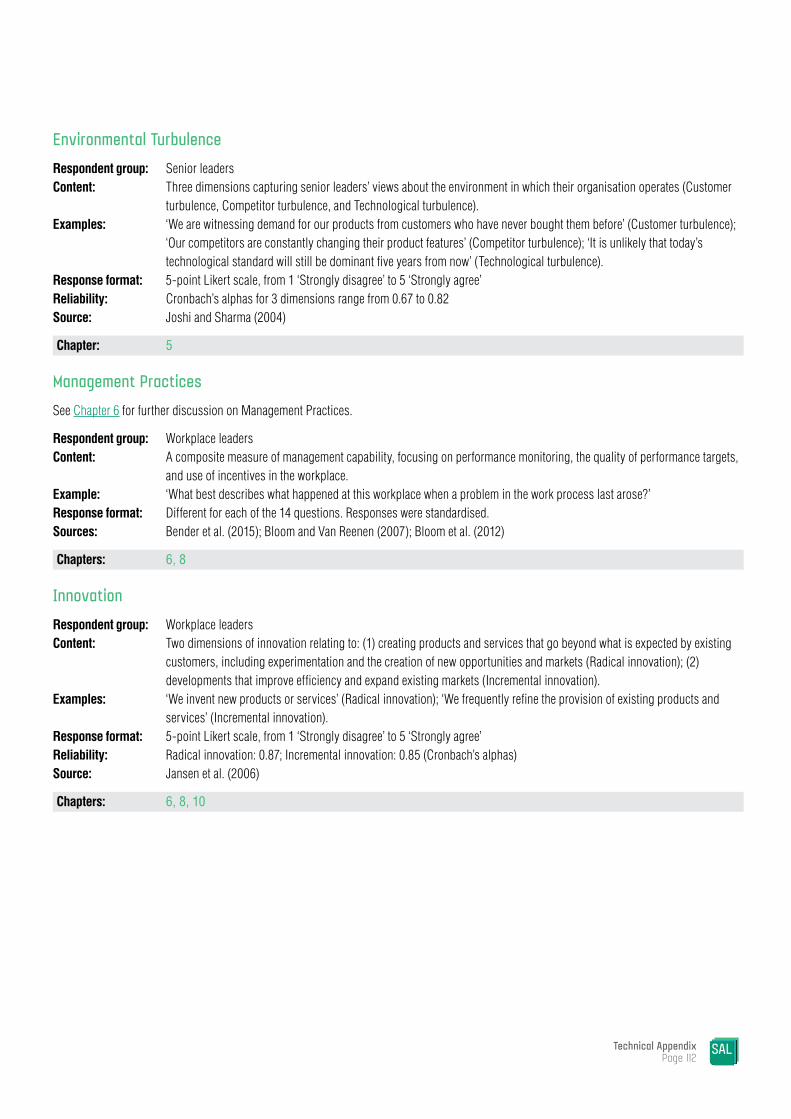
Environmental TurbulenceRespondent group: Senior leadersContent: Three dimensions capturing senior leaders’ views about the environment in which their organisation operates (Customer
turbulence, Competitor turbulence, and Technological turbulence).Examples: ‘We are witnessing demand for our products from customers who have never bought them before’ (Customer turbulence);
‘Our competitors are constantly changing their product features’ (Competitor turbulence); ‘It is unlikely that today’s technological standard will still be dominant five years from now’ (Technological turbulence).
Response format: 5-point Likert scale, from 1 ‘Strongly disagree’ to 5 ‘Strongly agree’Reliability: Cronbach’s alphas for 3 dimensions range from 0.67 to 0.82Source: Joshi and Sharma (2004)
Chapter: 5
Management PracticesSee Chapter 6 for further discussion on Management Practices.
Respondent group: Workplace leadersContent: A composite measure of management capability, focusing on performance monitoring, the quality of performance targets,
and use of incentives in the workplace.Example: ‘What best describes what happened at this workplace when a problem in the work process last arose?’Response format: Different for each of the 14 questions. Responses were standardised.Sources: Bender et al. (2015); Bloom and Van Reenen (2007); Bloom et al. (2012)
Chapters: 6, 8
InnovationRespondent group: Workplace leadersContent: Two dimensions of innovation relating to: (1) creating products and services that go beyond what is expected by existing
customers, including experimentation and the creation of new opportunities and markets (Radical innovation); (2) developments that improve efficiency and expand existing markets (Incremental innovation).
Examples: ‘We invent new products or services’ (Radical innovation); ‘We frequently refine the provision of existing products and services’ (Incremental innovation).
Response format: 5-point Likert scale, from 1 ‘Strongly disagree’ to 5 ‘Strongly agree’Reliability: Radical innovation: 0.87; Incremental innovation: 0.85 (Cronbach’s alphas)Source: Jansen et al. (2006)
Chapters: 6, 8, 10
Technical Appendix Page 112

Leadership at Work Do Australian leaders have what it takes?Page 113
Leader Self-EfficacyRespondent groups: Senior leaders, Workplace leaders, and Frontline leadersContent: Three dimensions reflecting leaders’ judgments of their own capabilities in: (1) setting a direction for where the work
group should be headed (Direction setting); (2) gaining followers’ commitment to change goals (Gaining commitment); (3) overcoming obstacles standing in the way of meeting change objectives (Overcoming obstacles).
Examples: ‘I can figure out the best direction for where my workplace needs to go in the future’ (Direction setting); ‘I can develop trusting relationships with my employees such that they will embrace change goals with me’ (Gaining commitment); ‘I can figure out ways for overcoming resistance to change from others whose cooperation we need to improve things’ (Overcoming obstacles).
Response format: 5-point Likert scale, from 1 ‘Strongly disagree’ to 5 ‘Strongly agree’Reliability: Cronbach’s alphas for 3 dimensions range from 0.70 to 0.86 Source: Paglis and Green (2002)
Chapters: 6, 8, 10
High Performance Work PracticesRespondent group: Workplace leadersContent: Measures of workplace human resource practices in eight areas: (1) Employee participation; (2) Internal career paths; (3)
Training; (4) Recruitment and selection; (5) Job specification; (6) Performance appraisal; (7) Job security; (8) Incentive rewards.Examples: ‘Employees are allowed to make decisions’ (Employee participation); ‘Great effort is taken to select the right person’
(Recruitment and selection); ‘Employees can be expected to stay with this organisation for as long as they wish’ (Job security).
Response format: 5-point Likert scale, from 1 ‘Strongly disagree’ to 5 ‘Strongly agree’Reliability: Cronbach’s alphas for 8 dimensions range from 0.57 to 0.81Source: Patel et al. (2013)
Chapters: 7, 8
Strategic Implementation of ObjectivesRespondent group: Workplace leadersContent: Measures how well the goals of the workplace are aligned with the wider goals of the organisation and how effectively
progress towards those wider goals is monitored.Example: ‘The senior management team…regularly monitors how well we are meeting our organisational strategies and goals.’Response format: 5-point Likert scale, from 1 ‘Strongly disagree’ to 5 ‘Strongly agree’Reliability: Cronbach’s alpha = 0.84Source: Barrick et al. (2015)
Chapter: 8
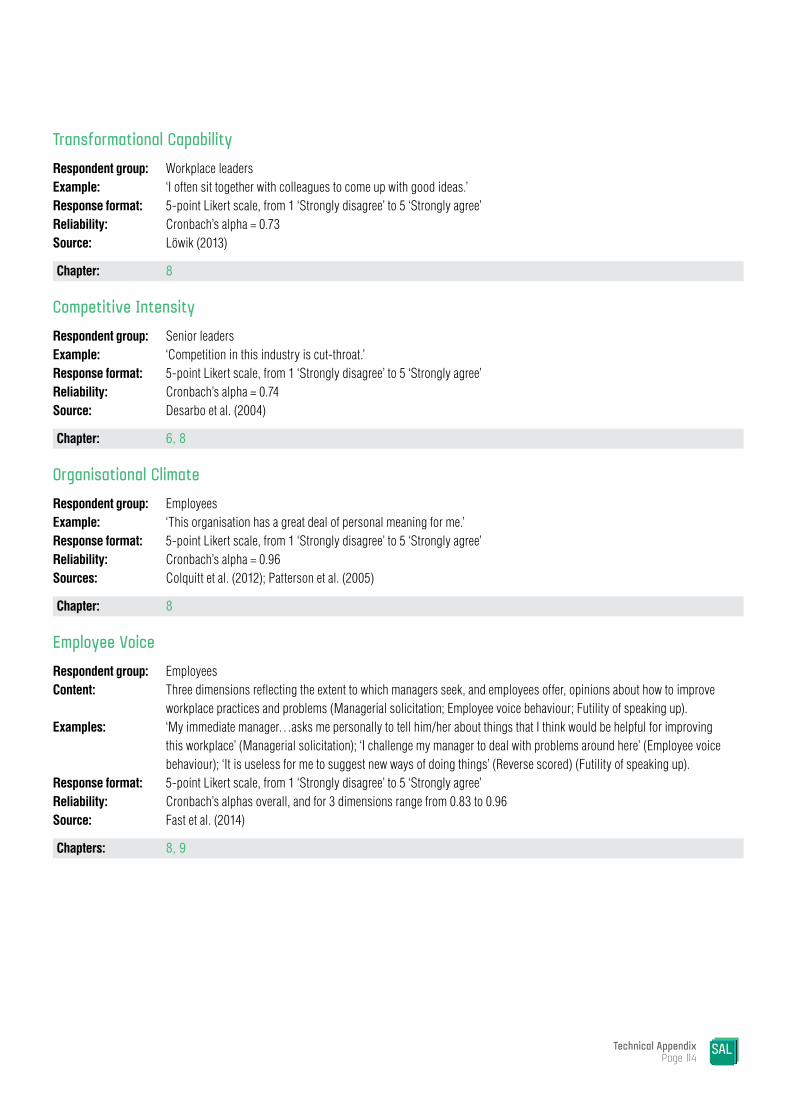
Transformational CapabilityRespondent group: Workplace leadersExample: ‘I often sit together with colleagues to come up with good ideas.’Response format: 5-point Likert scale, from 1 ‘Strongly disagree’ to 5 ‘Strongly agree’Reliability: Cronbach’s alpha = 0.73Source: Löwik (2013)
Chapter: 8
Competitive IntensityRespondent group: Senior leadersExample: ‘Competition in this industry is cut-throat.’Response format: 5-point Likert scale, from 1 ‘Strongly disagree’ to 5 ‘Strongly agree’Reliability: Cronbach’s alpha = 0.74Source: Desarbo et al. (2004)
Chapter: 6, 8
Organisational ClimateRespondent group: EmployeesExample: ‘This organisation has a great deal of personal meaning for me.’Response format: 5-point Likert scale, from 1 ‘Strongly disagree’ to 5 ‘Strongly agree’Reliability: Cronbach’s alpha = 0.96Sources: Colquitt et al. (2012); Patterson et al. (2005)
Chapter: 8
Employee VoiceRespondent group: EmployeesContent: Three dimensions reflecting the extent to which managers seek, and employees offer, opinions about how to improve
workplace practices and problems (Managerial solicitation; Employee voice behaviour; Futility of speaking up).Examples: ‘My immediate manager…asks me personally to tell him/her about things that I think would be helpful for improving
this workplace’ (Managerial solicitation); ‘I challenge my manager to deal with problems around here’ (Employee voice behaviour); ‘It is useless for me to suggest new ways of doing things’ (Reverse scored) (Futility of speaking up).
Response format: 5-point Likert scale, from 1 ‘Strongly disagree’ to 5 ‘Strongly agree’Reliability: Cronbach’s alphas overall, and for 3 dimensions range from 0.83 to 0.96Source: Fast et al. (2014)
Chapters: 8, 9
Technical Appendix Page 114
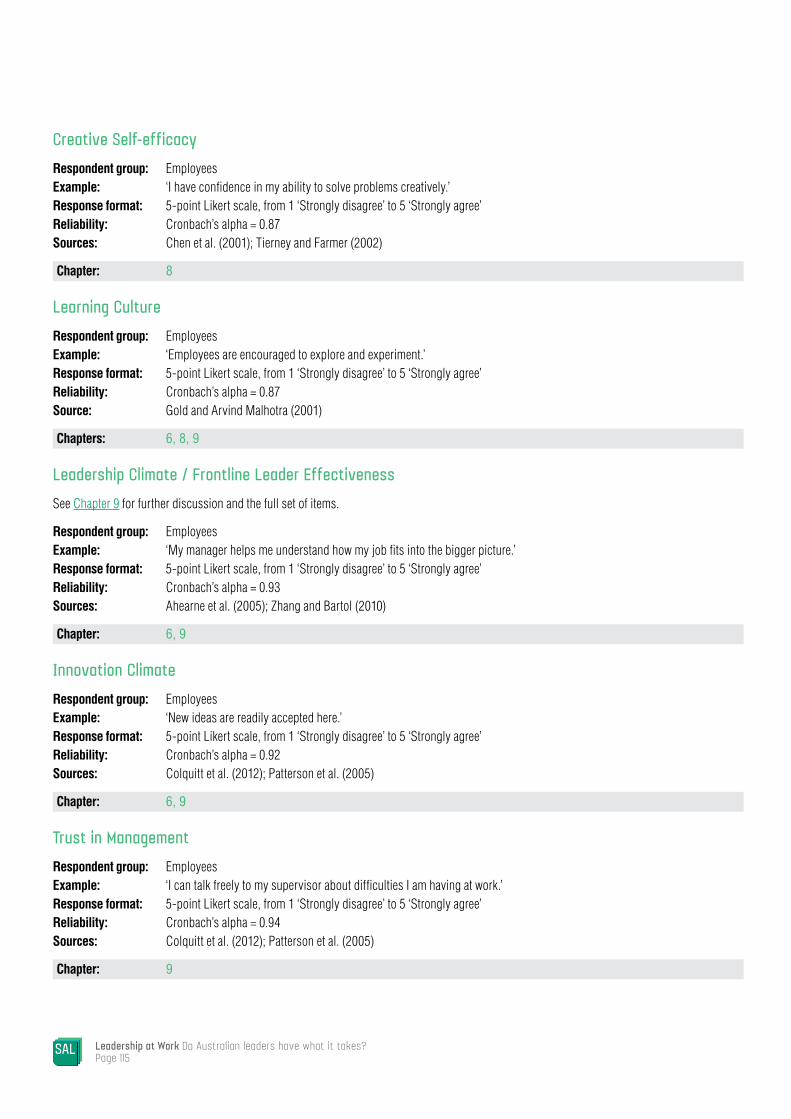
Leadership at Work Do Australian leaders have what it takes?Page 115
Creative Self-efficacyRespondent group: EmployeesExample: ‘I have confidence in my ability to solve problems creatively.’Response format: 5-point Likert scale, from 1 ‘Strongly disagree’ to 5 ‘Strongly agree’Reliability: Cronbach’s alpha = 0.87Sources: Chen et al. (2001); Tierney and Farmer (2002)
Chapter: 8
Learning CultureRespondent group: EmployeesExample: ‘Employees are encouraged to explore and experiment.’Response format: 5-point Likert scale, from 1 ‘Strongly disagree’ to 5 ‘Strongly agree’Reliability: Cronbach’s alpha = 0.87Source: Gold and Arvind Malhotra (2001)
Chapters: 6, 8, 9
Leadership Climate / Frontline Leader EffectivenessSee Chapter 9 for further discussion and the full set of items.
Respondent group: EmployeesExample: ‘My manager helps me understand how my job fits into the bigger picture.’Response format: 5-point Likert scale, from 1 ‘Strongly disagree’ to 5 ‘Strongly agree’Reliability: Cronbach’s alpha = 0.93Sources: Ahearne et al. (2005); Zhang and Bartol (2010)
Chapter: 6, 9
Innovation ClimateRespondent group: EmployeesExample: ‘New ideas are readily accepted here.’Response format: 5-point Likert scale, from 1 ‘Strongly disagree’ to 5 ‘Strongly agree’Reliability: Cronbach’s alpha = 0.92Sources: Colquitt et al. (2012); Patterson et al. (2005)
Chapter: 6, 9
Trust in ManagementRespondent group: EmployeesExample: ‘I can talk freely to my supervisor about difficulties I am having at work.’Response format: 5-point Likert scale, from 1 ‘Strongly disagree’ to 5 ‘Strongly agree’Reliability: Cronbach’s alpha = 0.94Sources: Colquitt et al. (2012); Patterson et al. (2005)
Chapter: 9

About the Centre for Workplace LeadershipThe Centre for Workplace Leadership was established in 2013 as a joint initiative supported by the Federal Government and the University of Melbourne’s Faculty of Business and Economics. We are dedicated to excellence in leadership research, improving the quality of leadership in Australian workplaces, and developing individual leaders. Our work bridges the gap between research insights and leadership practice.
workplaceleadership.com.au

Study of Australian Leadership Centre for Workplace Leadership+61 3 9035 5559 [email protected] www.workplaceleadership.com.au
This Centre for Workplace Leadership Study of Australian Leadership is supported by the Australian Government through the Department of Employment.