leading edge forum | csc papers 2012 earned...
TRANSCRIPT

© 2012 Computer Sciences Corporation. All rights reserved.
LEADING EDGE FORUM | CSC PAPERS 2012
EARNED SCHEDULE: FROM EMERGING PRACTICE TO PRACTICAL APPLICATION
ABSTRACT
As technology expands at an ever increasing pace we are challenged to efficiently apply and utilize it
in ever shorter cycles of new products, processes, and methods, with the ultimate goal of achieving
business objectives. Accurate project performance metrics provide not only vital data for project
managers but also for business executives charged with managing complex portfolios of projects The
ability to forecast conditions at project completion and to develop corrective actions facilitates the
proper balance of schedule and budget priorities for the project manager and assists business
leaders in achieving the optimum balance of risk, return, and value.
All projects regardless of their industry or nature inevitably are faced with two fundamental questions:
are we on budget, and are we on time? As technology and project complexity increased in the 1950’s
it became apparent that traditional methods of measuring project progress were not working,
particularly on large defense projects. The United States Department of Defense’s efforts led to the
birth of Earned Value Management, EVM, to measure and forecast project cost and schedule
performance by using ratios of work value, work accomplished, and cost of work. While time has
shown that EVM’s budget metrics are very reliable, the same can’t be said for corresponding
schedule metrics. Earned Schedule, an extension to Earned Value Management, is an emerging
practice in project management that offers significant improvement in monitoring and forecasting
project schedule performance.
Earned Schedule offers methods that are straightforward yet powerful while simplifying reporting and
communication across all levels of an organization. Why do project managers at times say “the
project is x dollars behind schedule?” The answer is simply because Earned Value techniques
calculate time in terms of money. Earned Schedule provides schedule quantities directly in units of
time. Why do some projects reach 99% complete and remain there forever? The answer is that
Earned Value schedule measurements have limitations in measuring late projects and projects that
are past their planned end dates, with subtleties that aren’t always well understood by project
managers. Earned Schedule provides improved accuracy over the project’s entire duration, while
overcoming a major limitation of EVM by providing data for projects that have exceeded their planned
end date.
This paper’s target audience is the intermediate to advanced level project management practitioner,
although the introduction to Earned Value Management and Earned Schedule is very useful for a
more general audience. The paper provides background information on Earned Value Management
(EVM) and introduces the Earned Schedule (ES) method. The two methods are compared with both
theoretical and real world project data, demonstrating that Earned Schedule provides significant
management benefits over EVM. Cautions and caveats for the project management practitioner for
both methods are discussed. Improvements offered by Earned Schedule are shown with a
retrospective analysis of an actual project. Equations and examples for enhanced project forecasting
and recovery are given with example applications.
1 INTRODUCTION
Earned Schedule (ES), an extension to Earned Value Management (EVM), is an emerging practice in
project management that offers significant improvement in monitoring and forecasting project
schedule performance. Among the benefits of Earned Schedule are the expressions of schedule
variances directly in units of time, improved metrics accuracy in the latter periods of project
Author
Bill Mowery MPM, PMP
Keywords
Earned Value Management,
Earned Schedule, Project
Management, Cost
Performance Index, Schedule
Performance Index, Project
Recovery, Earned Duration,
Project Forecasting,
Cost/Schedule Control System
Criteria

EARNED SCHEDULE: FROM EMERGING PRACTICE TO PRACTICAL APPLICATION
© 2012 Computer Sciences Corporation. All rights reserved. 2
performance, and meaningful project metrics for the entire period of project performance. Earned
Schedule overcomes a major limitation of EVM analysis by providing meaningful metrics for late
projects, i.e. projects that have exceeded their planned end date.
The paper presents as background for the discussion of Earned Schedule a brief review of the
evolution and use of Earned Value Management (EVM) and some of its limitations in measuring and
predicting project schedule performance. The paper next provides an introduction to Earned
Schedule theory and application, with example calculations and a comparison with EVM results for
both example and actual project data, followed by a discussion of some challenges and issues with
Earned Value methods that affect both traditional EVM and ES. A section on the integration of
Earned Schedule methods with existing CSC project management tools demonstrates how to derive
immediate benefit in a practical application of the new methods. The paper concludes with
conclusions and directions for further research and application of Earned Schedule.
2 PROJECT SCHEDULE PERFORMANCE METRICS AND FORECASTING
2.1 EARNED VALUE MANAGEMENT OVERVIEW
Project management emphasizes management of the classic “triple constraints” of scope, budget,
and schedule. Budget and schedule management focus on monitoring status and forecasting future
performance against an approved project plan. As projects in the defense industry in the 1950s
increased in technical complexity and size, measuring progress using simple ratios of money and
time expended versus money and time planned without considering the actual amount of project work
accomplished resulted in some significant overruns of budget and schedule. The demand for more
sophisticated management tools led to the Program Evaluation and Review Technique (PERT) in the
defense industry and its related Critical Path Method (CPM) in the construction industry. With a focus
on analysis of resource loaded networks, PERT and CPM proved to be important early methods to
address management reporting concerns and provided the earliest methods of Earned Value
Management. While providing a significant improvement, the challenges in the complexity of the
PERT method before computerized tools were generally available, attempts to make one set of tools
fit all project types, and administrative challenges within the government resulted in limited industry
adoption of these tools. Building on experience gained from PERT, the United States Air Force
formed the Cost / Schedule Planning and Control Specifications group in 1963. Shifting focus from
requiring contractors to adopt a single method to requiring adherence to specific criteria led to the
development of the Cost/Schedule Control System Criteria (C/SCSC) in 1967 (Fleming, 1988). In
addition to establishing a new collaborative approach between the defense department and private
industry, C/SCSC was a major factor in the beginning of the widespread application of EVM (Abba,
2000). There are many excellent references on Earned Value Management available (Fleming &
Koppelman, 2000) so only a brief overview of EVM concepts is presented in this paper.
In discussing EVM topics this paper uses the current terminology found in the latest version of the
Project Management Institute’s A Guide to the Project Management Body of Knowledge (Project
Management Institute, 2008). Readers may be more familiar with older versions of terminology that
are still commonly in use. Some of the terms where differences exist include:
Budgeted Cost of Work Scheduled (BCWS) / Planned Value (PV) – the amount of work planned to
be accomplished at a point in time or cumulatively.
Actual Cost of Work Performed (ACWP) / Actual Cost (AC) – the amount of money or resources
expended in order to accomplish the amount of work achieved for the reporting period.
Budgeted Cost of Work Performed (BCWP) / Earned Value (EV) – the amount of planned work
actually accomplished or achieved, or the value of work earned.
Earned Value Management establishes a time-phased Performance Measurement Baseline (PMB)
for assessing the progress of project objectives and compares the resources expended at a point in

EARNED SCHEDULE: FROM EMERGING PRACTICE TO PRACTICAL APPLICATION
© 2012 Computer Sciences Corporation. All rights reserved. 3
time to the actual amount of work accomplished. While measurement may be defined in units
appropriate for a particular project, the PMB is usually expressed in terms of money spent. When
considering EVM techniques it is important to maintain the distinction between the value of work and
the cost of work. Many projects express the value of work in terms of money, and of course, cost is
likewise expressed in the same terms. But while it is logical to express cost as money, expressing the
deliverable of a project in terms of money is in reality an indirect reference, since the actual project
deliverable is a good or service, and that good or service tendered is in fact the objective of the
project. In project planning there is a logical reason to consider the cost and value synonymous, but
once the project is under way and attention turns to monitoring progress the difference between cost
and value should be quickly apparent.
Consider a hypothetical project with the objective of installing 18,000 feet of fiber optic cable over 18
months (Planned Duration) at a total cost (Budget at Completion) of $231,280. Table 1 shows the
Performance Measurement Baseline for periodic and cumulative values for the example.
Table 1. Example Performance Measurement Baseline
Now let’s determine the project’s status after 12 months. Suppose that 12,326 feet of cable are
installed at a total cost of $179,820. Earned Value is calculated as the ratio of work accomplished to
total work planned:
We also find that we have spent $179,820 (Actual Cost). Considering only cost alone would lead us
to believe that the project is $179,820 / $231,280 = 77.75% complete without considering that at the
current spending rate using the entire budget would not allow installation of all cable planned, but
only
ft.
Looking strictly at work implies that the project is 12,326 / 18,000 = 68.48% complete without
recognizing the unpleasant truth that installing the planned 18,000 feet of cable at current actual rates
is likely to cost
or $31,316 over budget. The integration of cost and schedule information relative to actual work
accomplished is a major advantage of EVM over previous methods that considered the factors
separately.
As a project progresses EVM analysis compares the relationship of Planned Value (PV), Earned
Value (EV), and Actual Cost (AC) over time as shown in Figure 1. The Planned Value curve as
defined by the PMB terminates at Budget at Completion (BAC), the project’s total planned value. In
understanding the limitations and mechanisms of EVM schedule metrics it is important to keep in
mind that project completion is defined as EV = PV = BAC.

EARNED SCHEDULE: FROM EMERGING PRACTICE TO PRACTICAL APPLICATION
© 2012 Computer Sciences Corporation. All rights reserved. 4
Figure 1. Earned Value Performance Curves and Equations1
The Actual Cost and Earned Value curves are plotted based on actual measurement of project
performance, and using these values, we begin to develop metrics for analysis and reporting. We find
Cost Variance from Equation 1, with a positive result indicating under budget performance
Equation 1. Earned Value Cost Variance
and we find Schedule Variance similarly by
Equation 2. Earned Value Schedule Variance
EVM uses performance indices, ratios of actual and planned values, to describe efficiency of
schedule and budget achieved and to forecast future performance. The most common of these
indices are the Cost Performance Index (CPI), calculated by Equation 3.
Equation 3. Earned Value Cost Performance Index
and the Schedule Performance Index, shown in Equation 4.
Equation 4. Earned Value Schedule Performance Index
A performance index value greater than one indicates better than planned actual performance and a
value less than one indicates less than planned performance. Using these performance indices, next
1 Figure 1 was updated July 2012.

EARNED SCHEDULE: FROM EMERGING PRACTICE TO PRACTICAL APPLICATION
© 2012 Computer Sciences Corporation. All rights reserved. 5
our attention turns to the questions of how much the project is likely to cost, what the total variance
will be, and how long it will take to complete the project. These questions are answered by the
Estimate at Completion
Equation 5. Estimate at Completion
the Variance at Completion
Equation 6. Variance at Completion
and the Estimate at Completion for Time
Equation 7. Variance at Completion, Time
Returning to the fiber optic cable installation project, we can see the results of the calculations for
each of these equations applied to performance data in Table 2. The EVM equations offer
calculations to answer each of the preceding questions in a simple and straightforward manner.
Table 2. Example Project Actual Performance
While performance indices may be used in various advanced calculations, the CPI value of 0.88 in
Table 2 indicates that each dollar spent is producing only 88 cents’ worth of work, and the SPI value
of 0.94 implies that each eight-hour day worked results in only 7.5 hours of effective work. What is the
long-term effect of this less-than-optimal performance on project completion? VAC forecasts that the
project will finish $31,310 over budget and EACt predicts finishing late by 1.1 months.
A metric related to CPI, the To Complete Performance Index (TCPI), defines the level of performance
required to meet an objective and is calculated by
with the p subscript indicating that the equation is for baseline plan analysis. In simple terms, what
level of efficiency (CPI) must be reached in order to achieve the plan? In addition to defining a target
performance level, TCPI has interesting characteristics of its own (Lipke, 2009c). If TCPI is less than
EARNED SCHEDULE: FROM EMERGING PRACTICE TO PRACTICAL APPLICATION
© 2012 Computer Sciences Corporation. All rights reserved. 6
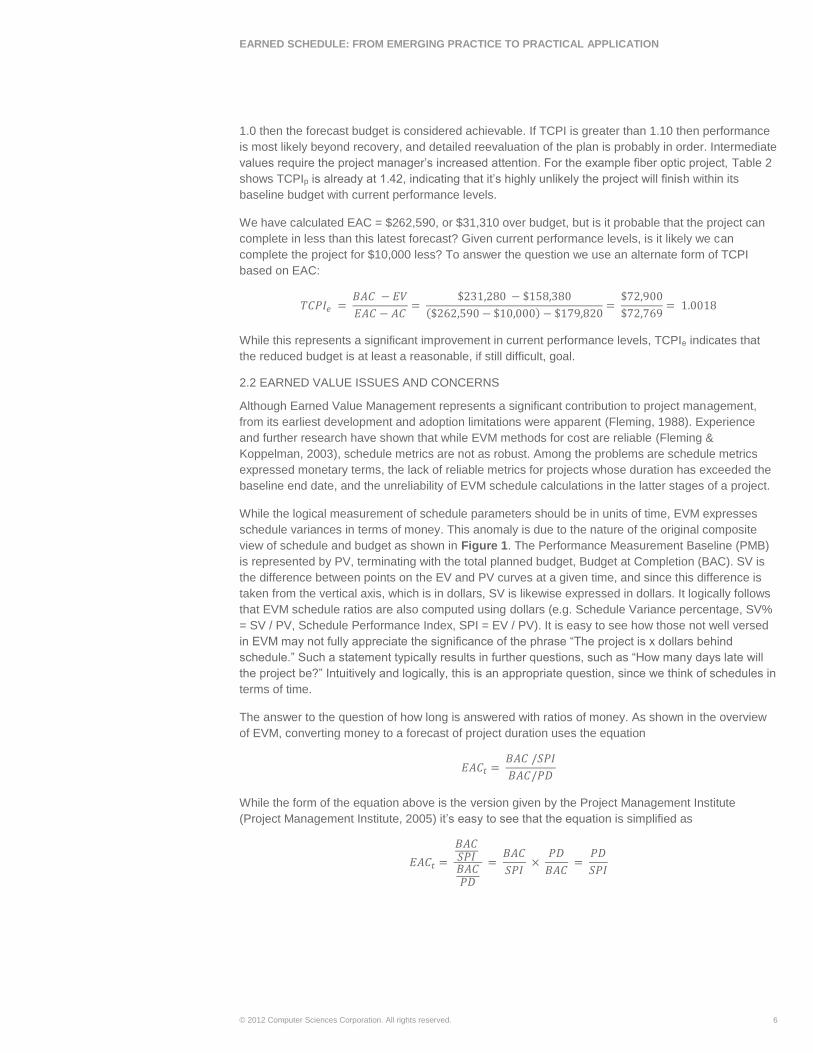
1.0 then the forecast budget is considered achievable. If TCPI is greater than 1.10 then performance
is most likely beyond recovery, and detailed reevaluation of the plan is probably in order. Intermediate
values require the project manager’s increased attention. For the example fiber optic project, Table 2
shows TCPIp is already at 1.42, indicating that it’s highly unlikely the project will finish within its
baseline budget with current performance levels.
We have calculated EAC = $262,590, or $31,310 over budget, but is it probable that the project can
complete in less than this latest forecast? Given current performance levels, is it likely we can
complete the project for $10,000 less? To answer the question we use an alternate form of TCPI
based on EAC:
While this represents a significant improvement in current performance levels, TCPIe indicates that
the reduced budget is at least a reasonable, if still difficult, goal.
2.2 EARNED VALUE ISSUES AND CONCERNS
Although Earned Value Management represents a significant contribution to project management,
from its earliest development and adoption limitations were apparent (Fleming, 1988). Experience
and further research have shown that while EVM methods for cost are reliable (Fleming &
Koppelman, 2003), schedule metrics are not as robust. Among the problems are schedule metrics
expressed monetary terms, the lack of reliable metrics for projects whose duration has exceeded the
baseline end date, and the unreliability of EVM schedule calculations in the latter stages of a project.
While the logical measurement of schedule parameters should be in units of time, EVM expresses
schedule variances in terms of money. This anomaly is due to the nature of the original composite
view of schedule and budget as shown in Figure 1. The Performance Measurement Baseline (PMB)
is represented by PV, terminating with the total planned budget, Budget at Completion (BAC). SV is
the difference between points on the EV and PV curves at a given time, and since this difference is
taken from the vertical axis, which is in dollars, SV is likewise expressed in dollars. It logically follows
that EVM schedule ratios are also computed using dollars (e.g. Schedule Variance percentage, SV%
= SV / PV, Schedule Performance Index, SPI = EV / PV). It is easy to see how those not well versed
in EVM may not fully appreciate the significance of the phrase “The project is x dollars behind
schedule.” Such a statement typically results in further questions, such as “How many days late will
the project be?” Intuitively and logically, this is an appropriate question, since we think of schedules in
terms of time.
The answer to the question of how long is answered with ratios of money. As shown in the overview
of EVM, converting money to a forecast of project duration uses the equation
While the form of the equation above is the version given by the Project Management Institute
(Project Management Institute, 2005) it’s easy to see that the equation is simplified as

EARNED SCHEDULE: FROM EMERGING PRACTICE TO PRACTICAL APPLICATION
© 2012 Computer Sciences Corporation. All rights reserved. 7
Figure 2 – Earned Value Project Completion
which seems to be most commonly used. It is worthwhile to note that while the general form of the
equation implies the use of EVM’s SPI, we can substitute alternate or more complex / compound
performance indices in this equation. While this ratio does provide a time based measure it is still
limited by its dependence on SPI, a performance measure based on money and bound by the
relationship of EV, PV, and BAC.
We can see EVM’s inability to provide meaningful schedule metrics for projects that have exceeded
their planned duration by examining the schedule equations and by practical example. In analyzing
the equation for EACt above, recall that PD and BAC are fixed quantities defined during project
planning, while SPI = EV/PV. At a project’s baseline completion date PV = BAC as illustrated in
Figure2. Likewise at project completion EV = BAC, and we begin to infer that there are limits on how
project duration may be forecasted based on the relationship of SPI and BAC. We can analyze the
equation using calculus to determine
or by looking at the simplified version of the equation
we see that when SPI = 1 then EACt = PD. When a project’s baseline end date has passed (PV =
BAC) and the value of EV is approaching BAC, the forecasted duration begins to decrease, and
eventually reaches its limit of PD once all work is complete (EV=PV=BAC) as illustrated in Figure 3.

EARNED SCHEDULE: FROM EMERGING PRACTICE TO PRACTICAL APPLICATION
© 2012 Computer Sciences Corporation. All rights reserved. 8
Figure 3 - Earned Value Performance for Late Projects
While the preceding discussion addresses the values that EACt can have, it does not consider when
those values are calculated. Let’s examine a scenario for a late project. Assume a project has
completed most of its planned work, with EV = 990, PV = 1,000, BAC = 1,000, and PD = 12. These
metrics yield SPI = EV/PV = 0.99, which when applied in
EACt=
BACSPIBACPD
gives a final duration of 12.12 months. Figure 2 shows that as EV approaches the final value for PV,
forecasted project duration decreases because the limit for EV is always BAC. Regardless of whether
we perform the calculation during performance period ten or fifteen, this cost-based ratio yields the
same result, and can show that an in-progress project has a forecasted completion date in the past.
Let’s examine this inconsistency by returning to our struggling fiber optic cable installation project.
The performance data in Table 3 includes EVM metrics and calculations for schedule and budget
through month 22, indicating that the project has now completed four months after its originally
planned 18-month duration. Cost and schedule variance data are graphed in Figure 3. Note that in
month 18 schedule variance begins to improve as EV starts to converge on PV and BAC. Likewise,
forecasted duration (EACt) begins to improve from month 18 forward and indicates in month 21 that
the forecasted end of the project, at 18.32 months, should have been reached 2.68 months ago.
The preceding analysis shows that for a late project EVM schedule data is unreliable, which leads to
the conclusion that if the metrics are in error for a project that is late then the tendency toward
inaccuracy must begin at some point before the completion date.

EARNED SCHEDULE: FROM EMERGING PRACTICE TO PRACTICAL APPLICATION
© 2012 Computer Sciences Corporation. All rights reserved. 9
Table 3. Late Project EVM Metrics Example
At what point, and to what degree, does this inaccuracy affect EVM metrics? Although the nature of
the problem makes determining the period and magnitude of the potential error difficult, we can see
the existence of inaccuracies in Figure 4.
Figure 4. SV / SPI Divergence for a Late Project
Typically, we display SPI with only two significant digits, but Figure 4 compares SPI with five
significant digits to a corresponding value of SV. Note that in month 14 an interesting trend begins as
Schedule Variance, in absolute terms, continues to show worsening performance while SPI begins to
show improving performance as it converges to PV/BAC. This contradiction clearly indicates that
EVM is providing inconsistent data beginning in month 14 of the project.
2.3 INTRODUCTION TO EARNED SCHEDULE
2.3.1 EARNED SCHEDULE CONCEPTS AND CALCULATIONS
The problems with Earned Value schedule metrics contributes to the tendency for practitioners to
focus on the cost management tools provided by EVM while acknowledging the limitations of EVM’s
schedule components. The search for better schedule performance metrics led to the development of
the Earned Schedule method. Based on Earned Value data, the goal of Earned Schedule is to have
“a set of schedule indicators which perform correctly over the entire period of project performance”
(Lipke, 2009a). Walter Lipke provided a formalized description of Earned Schedule and calculations
for its use in 2003 (Lipke, 2003) while noting that time-based analysis of the Performance

EARNED SCHEDULE: FROM EMERGING PRACTICE TO PRACTICAL APPLICATION
© 2012 Computer Sciences Corporation. All rights reserved. 10
Measurement Baseline is not a new idea, citing Fleming’s foundation book on Earned Value
(Fleming, 1988).
By utilizing existing Earned Value data for time based measurements, Earned Schedule exhibits
consistent performance shown to deliver better results than previous EVM techniques in both a
retrospective analysis of a small set of projects (Henderson, 2003) as well as in a study of a broad
range of project conditions using computer generated schedule networks (Vanhoucke &
Vandevoorde, 2007). In their extensive simulation study Vanhoucke and Vandevoorde compared
Earned Schedule’s performance to Anbari’s Planned Value method (Anbari, 2003) and Jacob and
Kane’s Earned Duration method (Jacob, 2003) and found that on average Earned Schedule
outperforms either method.
The concept of Earned Schedule is relatively simple: derive a time based measurement of schedule
performance by comparing a project’s Earned Value today (Actual Time, AT) to the point on the
Performance Measurement Baseline (Planned Value curve, PV) where it should have been earned.
The difference between AT and PV represents a true time-based Schedule Variance, or in Earned
Schedule notation, SV (t). The derivation of Earned Schedule metrics is shown in Figure 5.
Figure 5. Earned Schedule, Adapted from Lipke (Lipke, 2003)
In Figure 5 at the end of July (Actual Time, or AT = 7) measured EV actually should have been
earned at some point in June, Period 6, seen by mapping Earned Value to its corresponding Planned
Value point on the Performance Measurement Baseline. In other words, the portion of the schedule
that is actually “Earned Schedule” consists of the work performed through all of the last full period
(May, period 5) and a portion of June. Earned Schedule is calculated by the formula

EARNED SCHEDULE: FROM EMERGING PRACTICE TO PRACTICAL APPLICATION
© 2012 Computer Sciences Corporation. All rights reserved. 11
where C is the number of time increments on the PMB where EV ≥ PV, PVc is the value of PV at the
last full performance period, and PVc+1 is the value of PV at the end of the partial performance period.
Thus, Earned Schedule (ES) in Figure 5 becomes:
Note that an interpolation is required to determine ES for partial time periods, represented by the ratio
of the Earned Value to the Work Scheduled. It is an easily overlooked point that this ratio is implicitly
multiplied by one time unit and is therefore is in units of time and not a simple ratio. This fact has
resulted in some differing opinions in existing literature in interpretation of the algebra underlying
Earned Schedule (Book, 2006a). Once ES is calculated, Schedule Variance, SV(t), is found by the
equation
and expressed directly in units of time. A Schedule Performance Index based on time, SPI(t), is found
by
which is analogous to its EVM counterpart.
Returning to the example in Table 2 on page 8 we see that in month 12 work with a value of
$168,030 should have been accomplished per plan but only $158,380 worth of work is complete.
Let’s use Earned Schedule to answer the common questions of “What is the schedule status and
when will we finish?” Using the general form equation for ES
we find actual progress as
and applying the ES equation for Schedule Variance we find that the project is behind schedule by
Although calculation of project duration can take different forms depending on the anticipated future
performance of project work (Anbari, 2003), (Vanhoucke & Vandevoorde, 2007) most depend on a
performance index. For Earned Schedule in this example we find a performance index by
Applying this performance factor with the ES equation for Independent Estimate at Completion for
Time (IEAC(t)), the total forecasted project duration is
Another metric easily calculated with ES is the To Complete Schedule Performance Index, TSPI.
TSPI corresponds to EVM’s cost To Complete Performance Index, TCPI, and is used to determine
efficiency required to complete according to either a plan or desired target duration. Like TCPI, if < 1

EARNED SCHEDULE: FROM EMERGING PRACTICE TO PRACTICAL APPLICATION
© 2012 Computer Sciences Corporation. All rights reserved. 12
the target is considered achievable, if > 1.10 it is generally believed that the schedule estimate is not
achievable, and of course intermediate values would bear close scrutiny (Lipke, 2009a). The equation
to determine TSPI for the planned duration is
Calculating TSPIP for the example project yields
And so it would seem that our example project is facing serious challenges in completing within its 18
month planned duration. The alternate form of the equation given by
where ED is the Estimated Duration in question, is used to evaluate the probability of completing a
project within an alternate planned duration. Examining the viability of completing the project with an
additional month added to the schedule we find
This implies an achievable goal, since TSPIe, the minimum performance level required, is less than
the current value of 0.95.
Comparing schedule status derived from EVM and ES for the example provides the data shown
Table 4.
Metric Earned Value Earned Schedule
Schedule Variance (SV) -$9,650 -0.57 Months
Schedule Performance Index (SPI) 0.94 0.95
Forecast Duration (IEAC) 19.10 Months 18.89 Months
Table 4. Comparison of Earned Value and Earned Schedule Metrics
The elegance of Earned Schedule is its calculations based on Actual Time, and unlike Earned Value,
will yield a valid result regardless of whether the project has exceeded its planned duration. An
additional aspect of ES is that it does not suffer inaccuracies in the latter stages of a project, and in
fact it has been demonstrated that as a project progresses the accuracy of ES forecasts improves
(Vanhoucke & Vandevoorde, 2007). For comparison with EVM performance, we first revisit the final
months of our sample project with Earned Schedule metrics included as shown in Table 5.

EARNED SCHEDULE: FROM EMERGING PRACTICE TO PRACTICAL APPLICATION
© 2012 Computer Sciences Corporation. All rights reserved. 13
Table 5. Metrics Comparison for Late Project
Unlike EVM’s SPI and derived metrics, Earned Schedule’s SPI(t) portrays a steadily declining
performance trend from month 12 until project completion in month 22.
2.3.2 EARNED SCHEDULE CRITIQUES AND CONCERNS
While Earned Schedule methods offer promising advances project management, as with any new
technique caution is required. Considerations for the potential practitioner include apparent slow
industry adoption, viewpoints on alternative methods, and the general caveats pertaining to Earned
Value methods in general.
Deemed an “emerging practice” by the Project Management Institute (Project Management Institute,
2005), Earned Schedule is a relatively new method that is not yet supported by the broad base of
research and practical use that EVM enjoys. Despite the promising indications provided by existing
data (Henderson, 2003), (Henderson, 2005), (Vanhoucke & Vandevoorde, 2007) continuing research,
particularly with real world project data, will be required to establish Earned Schedule comfortably
among proven project management techniques. Just as it has supporters, Earned Schedule also has
its critics. In one of the better known critiques, Book (Book, 2006a), (Book, 2006b) offers some minor
criticisms of Earned Schedule calculation that are overcome with a bit of further analysis (Lipke,
2006), but more importantly offers a general observation on Earned Value analysis. Book observes
that when analyzing aggregate EVM data for a project individual tasks may be early or late, but
cumulative values will not indicate a behind schedule condition. While Lipke’s rebuttal to Book’s
objections (Lipke, 2006) resolves these questions the issues raised emphasize the importance of fully
understanding the state of the art in Earned Schedule. As with any method, the practitioner would be
well advised to evaluate Earned Schedule’s applicability in a particular project environment.
Earned Schedule is not the only proposed improvement to EVM methods. Jacob’s Earned Duration
method (Jacob, 2006) also presents an alternative to EVM schedule methods. Figure 6 shows
Earned Duration calculated from the Performance Measurement Baseline.

EARNED SCHEDULE: FROM EMERGING PRACTICE TO PRACTICAL APPLICATION
© 2012 Computer Sciences Corporation. All rights reserved. 14
Figure 6. Graphic Representation of the Earned Duration Method (Jacob, 2006)
There is considerable similarity between Earned Schedule and Earned Duration. Both methods rely
on creating a “measurement yardstick” by projecting current Earned Value to a point on the PMB
where that amount of Earned Value should occur. The difference between the methods is that while
Earned Schedule calculates variance from the present period to the yardstick, Earned Duration
measures from the beginning of the project to the “yardstick” and the present performance period to
calculate variances. Computer simulation has shown that Earned Duration provides valid data, but is
not as robust as the Earned Schedule method for all project conditions (Vanhoucke & Vandevoorde,
2007). The Earned Duration method should not be dismissed, but evaluated in the context of a
particular project environment and the data available for analysis.
In evaluating the application of Earned Schedule, it is important to remember that calculations and
metrics are derived from basic Earned Value data, and therefore results are subject to some of the
same considerations and dependencies as any EVM method. Section 2.4 discusses some common
cautions and considerations with Earned Value methods.
2.4 EVM AND ES: CAVEATS AND COMMENTS
2.4.1 BASELINE DEFINITION AND CONTROL
Regardless of the tracking and forecasting method selected, an accurate basis for measurement and
comparison is required. Earned Value Management’s Performance Measurement Baseline provides
the intersection of two essential components, Planned Value and the period of performance.
Planned Value at the task level is considered the measure of work to be accomplished. While most
often expressed in monetary terms such as dollars, measures may be established for other units of
work as appropriate to the task or project. The units of work must reflect and directly translate to the
work defined for the task. For example, a project to wire a facility with network access might include a
task to install 1,000 network jacks, at a cost of $80 per jack for a total cost of $80,000. While we can
translate installation of jacks to cost terms, it is the installation of the jacks, not the expenditure of the
money that determines the Earned Value for the task. If we find the actual cost of installing a jack is
$90 each after installing 250 jacks for a total expenditure of $22,500, the budget expended is %28.1
of plan, while the measure of target work, the number of jacks installed, is only %25 complete.

EARNED SCHEDULE: FROM EMERGING PRACTICE TO PRACTICAL APPLICATION
© 2012 Computer Sciences Corporation. All rights reserved. 15
The planned value of a task is scheduled for a period of performance with assigned start and end
dates within the project network and project schedule, contributing to the overall PMB. Continuing
with the network installation example in the previous paragraph, the installation of 1,000 network
jacks might be evenly distributed across four workweeks to plan for installation of 250 per week, or 50
per day for a five-day workweek. Practical circumstances may not allow updating the task’s Earned
Value on a daily basis, but work accomplished may be measured at a very detailed level for any
period of performance desired. The task could also be resource dependent, and planned for
installation of 300 jacks in each of the first two weeks and the installation of 200 jacks in each of the
remaining weeks. Again, total Planned Value will be accomplished in the required overall
performance period but at a different point in time. Ensuring the proper understanding and definition
of both time and work in the Performance Measurement Baseline are essential for reliable schedule
metrics. Not all project types allow straightforward measurement of Earned Value. For example,
software development projects can prove notoriously difficult to measure in the software coding and
testing phases, requiring care in defining and measuring actual work accomplished.
In misplaced enthusiasm for Earned Value techniques project work can be inappropriately structured
in ways that can distort the view of true project performance. Creation of actual value, as viewed by
the customer of the project, is through the realization of the project’s product. While administrative,
overhead, and project management functions certainly contribute to project delivery they are ancillary
items that should not affect proper assessment of true project deliverables. Proper classification of
Level of Effort and Apportioned type tasks (Project Management Institute, 2005) should be used to
provide the proper structure of a project’s work.
2.4.2 MEASUREMENT OF EARNED VALUE
Once the project is underway progress toward objectives, the Earned Value, must be measured. As
noted in the example in Section 3.4.1 care is required in defining and measuring project work versus
cost. In the installation of network jacks in that example, it is clear to see the implications of
measuring progress strictly in terms of cost versus work accomplished, and the importance of
accurate EV measurement and reporting cannot be overemphasized. Perhaps the easiest problems
to avoid are those created by the lack of understanding of Earned Value Management fundamentals
among project team members. Careful planning and a pristine measurement baseline are all for
naught if project team members do not understand and appreciate the fundamentals of progress
reporting. Simply asking team members “what percent complete is task x” without an appreciation for
how such data is used is an almost certain path to failure. Team members do not have to be Earned
Value Management experts, but should understand Earned Value, remaining work, and actual work
in order to provide sufficient information to fulfill the project management plan’s requirements for
reporting. Every project should include team familiarization with reporting requirements as part of its
startup plan, and EVM measurement techniques should be clearly and unambiguously defined in the
project’s governance plan.
Without proper familiarization and training, team members are subject to multiple reporting errors and
among these is the “work equals progress” syndrome. In its simplest form the team member’s logic
runs thus: “My new project task is allocated 200 total hours, I was supposed to work on it for 20 hours
this week, and I did . . . therefore my task is 10% complete.” This variety of reporting indicates perfect
performance until either the task is abruptly completed ahead of schedule or until the task is late and
the team member attempts to report 110% complete.
2.4.3 NETWORK TOPOLOGY AND SCHEDULE PREDICTION RELIABILITY
In their simulation study on the reliability of schedule prediction metrics Vanhoucke and Vandevoorde
(Vanhoucke & Vandevoorde, 2007) found that the structure of the project schedule network affects
forecast accuracy. The study shows that as a project becomes more “serial,” or has fewer parallel
tasks, the better schedule prediction metrics perform. Intuitively it easy to appreciate that a project

EARNED SCHEDULE: FROM EMERGING PRACTICE TO PRACTICAL APPLICATION
© 2012 Computer Sciences Corporation. All rights reserved. 16
completed a single step or task at a time in sequence is easier to analyze than a project with multiple
tasks in progress simultaneously. As a simple example of the potential effects of network topology,
consider Figure 7 and project critical path. A project’s critical path is the longest sequence of steps
through a project’s tasks, and thus determines the overall project duration. The path is considered
“critical” since any delay of the component tasks of the critical path results in a corresponding delay in
project completion. The six task Gantt chart in Figure 7 shows Tasks A & B as critical path tasks,
while Tasks C – G are sets of parallel non-critical tasks. Alternative points of view suggest that the
project is not behind schedule if the non-critical tasks are delayed but the critical path is not affected.
While EVM metrics would indicate that the project is falling behind schedule if the Planned Value for
tasks C – F is not accomplished at the planned time, nonetheless the project can finish on its
baseline end date and therefore no real overall negative schedule variance exists as long as the
critical path remains the same.
Figure 7. Simple Network Topology
The question of when a non-critical path task becomes a problem is an issue. If Tasks D through F
are sufficiently delayed they could replace Task B as critical path tasks. This scenario has led to
debate around the proper way to apply any EVM-based methods, from recommendations that EVM
be applied at the discrete task level (Jacob, 2006) to the application of metrics to a subset of the PMB
(Lipke, 2006). In either case, it is important to have an understanding of this area of concern, as well
as to understand the measurement limitations in each project design.
2.4.4 AGGREGATE EARNED VALUE AND CRITICAL PATH DETECTION
Another problem in accurate EVM schedule prediction concerns tasks completed ahead of schedule
or out of sequence. Tasks completed ahead of schedule add Earned Value to the project’s total,
precluding detection of lagging critical path tasks since schedule performance is calculated based on
aggregate Earned Value without regard to which tasks contribute that value (Vanhoucke &
Vandevoorde, 2007). Tasks completed ahead of schedule but out of sequence are possibly
completed without complete data provided by predecessor tasks and have greater potential for future
rework (Lipke, 2009b). A relatively new technique called Schedule Adherence (Lipke, 2009b), (Lipke,
2011) offers methods to address these issues.
3 EARNED SCHEDULE IN THE REAL WORLD
3.1 OVERVIEW
The introduction to Earned Schedule has shown the potential for significant improvement in schedule
monitoring and forecasting in its extension to Earned Value Management. This section presents the
retrospective application of Earned Schedule metrics to a real world completed project in order to
demonstrate some of the practical applications of Earned Schedule. Of particular interest is the
application of Earned Schedule to a project selected in a pseudo-random manner from a large
portfolio of actual projects. While simulated data or carefully managed and controlled projects can
provide “pure” data for evaluation, it is often the case in real project environments that variations in
data collection and recording, accuracy of schedule metrics and maintenance, and the experience
level of staff involved, among other factors, can result in less than textbook perfect analysis. A

EARNED SCHEDULE: FROM EMERGING PRACTICE TO PRACTICAL APPLICATION
© 2012 Computer Sciences Corporation. All rights reserved. 17
measure of the utility of any method is how well it can perform in less than ideal conditions, and how
it applies to “real world” situations. The following example compares Earned Schedule to the Earned
Value metrics as actually recorded and used to manage the example project.
3.2 PROJECT DESCRIPTION
The example project’s objective was to provide user interface enhancements for a commercial
software product. Project metrics were collected weekly via a proprietary system used in conjunction
with Microsoft Project©. Actual labor hours were collected from an employee time accounting system,
transferred directly to the Microsoft Project plan, and translated to Earned Value with an established
algorithm. The project plan had an original baseline duration of 73.6 weeks and 14,757 labor hours.
To coordinate with other projects competing for testing infrastructure and resources, during week 40
of project execution the baseline duration was reduced to 55.3 weeks without a reduction in planned
effort. Typical projects in the performing organization employ a Project Control Officer (PCO) who
works with the project manager to collect, analyze, and report on project metrics. The PCO was
interviewed to gain insight into the basis of the decision to reduce project duration. The PCO related
that the decision to reduce duration was based on analysis of Earned Value schedule metrics and the
consensus of the project team that the shorter schedule was achievable.
3.3 PROJECT DATA ANALYSIS
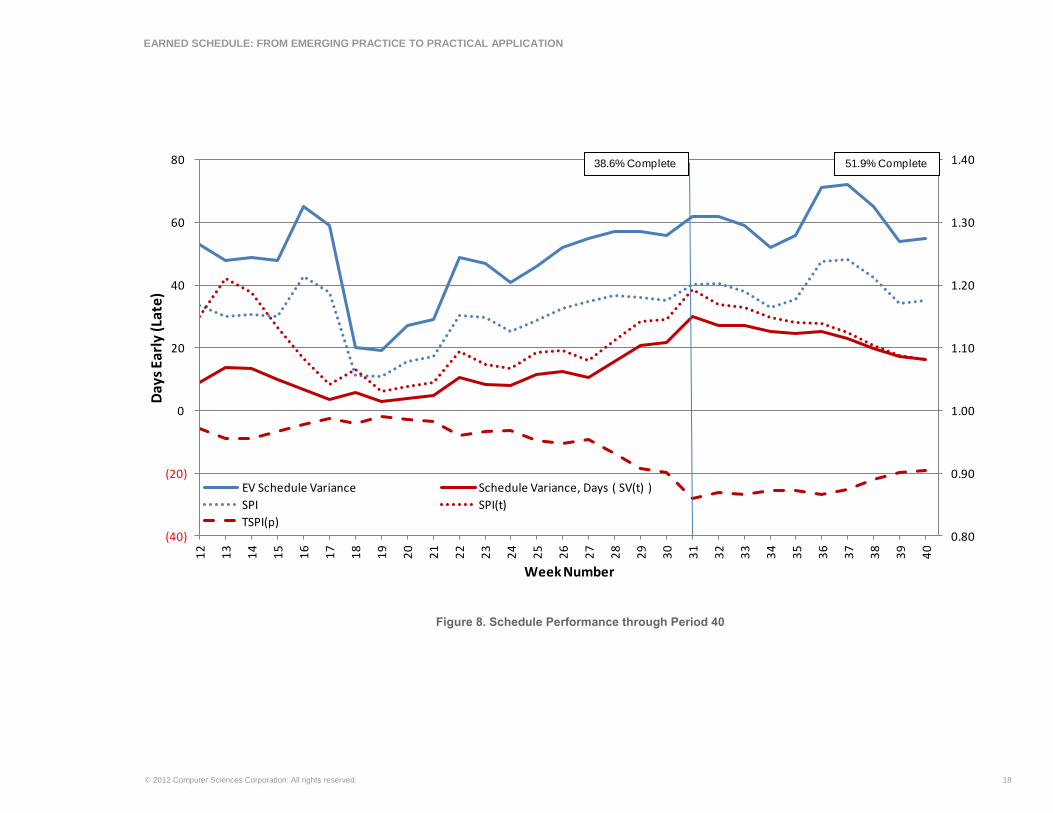
Figure 8 shows schedule metrics through week 40 / 51.9% complete, the point at which the decision
to reduce the project’s duration was made. The graph depicts SPI and SPI(t) schedule performance
indices as well as the schedule variance in days calculated with each metric in addition to the To
Complete Schedule Performance Index for the planned duration (TSPI(p)). Note that in week 40 SPI
has a value of 1.18, producing a forecasted 55 days ahead of schedule. While showing very good
project performance, Earned Schedule metrics do not present a picture as favorable, with SPI(t) =
1.08 and forecasting 16.09 days ahead of schedule. The TSPI(p) = .90 metric indicates a high degree
of confidence in an on time finish for the original baseline duration when compared to the SPI(t)
current value of 1.08. While both metrics show good project performance to date, the trend of the
data from week 31 reveals cause for concern. While SPI is trending positive despite the range of
variation displayed, SPI(t) declines steadily over the 9-week period from week 31 to week 40,
indicating declining project performance. Recall from the overview of Earned Schedule that the TSPI
equation can be used to evaluate the likelihood of completion within estimated project duration.
Applying the equation to the metrics shown yields
which produces a value well above the 1.0 level that indicates a schedule is reasonably achievable
and the SPI(t) current value of 1.08.
EARNED SCHEDULE: FROM EMERGING PRACTICE TO PRACTICAL APPLICATION
© 2012 Computer Sciences Corporation. All rights reserved. 18
Figure 8. Schedule Performance through Period 40
0.80
0.90
1.00
1.10
1.20
1.30
1.40
(40)
(20)
0
20
40
60
80
12
13
14
15
16
17
18
19
20
21
22
23
24
25
26
27
28
29
30
31
32
33
34
35
36
37
38
39
40
Day
s Ea
rly
(Lat
e)
Week Number
EV Schedule Variance Schedule Variance, Days ( SV(t) )
SPI SPI(t)
TSPI(p)
38.6% Complete 51.9% Complete

EARNED SCHEDULE: FROM EMERGING PRACTICE TO PRACTICAL APPLICATION
© 2012 Computer Sciences Corporation. All rights reserved. 19
After week 40 the baseline duration was reduced to 55.4 weeks. Comparing Figure 9 with Figure 8
shows that rebaselining the project resulted in a proportional shift in Earned Value, and while the
magnitude of the performance curves shifted, the overall trend and data indications remained intact.
For example, in the original baseline the value of SPI(t) at week 40 is 1.08 while after rebaselining
SPI(t) at week 40 is 1.03. This curious effect is the result of shifting Earned Value to past periods
rather than distributing remaining work to future periods within the reduced baseline duration.
Following project performance in Figure 9 from week 40 shows a continuing negative performance
trend to week 48, where TSPI(p) exceeds 1.10, indicating that the schedule has virtually reached the
point of no recovery only 8 weeks after replanning and rebaselining. At week 53 we see SPI exhibit
its classical unreliability as it levels off and begin its convergence to BAC, while Earned Schedule’s
SPI(t) continues to show deteriorating schedule performance. TSPI(p) also provides an additional
visual status at the project baseline duration as its value assumes a negative value and appears as a
vertical marker. Perhaps the most significant display of project performance is the steadily declining
values of SPI(t) from week 31 through week 63. Although brief periods of improvement can be seen
over the course of 2 to 3 weeks, the long-term trend clearly indicates worsening schedule
performance over half the project’s duration and clearly provides a better indication of true project
performance than EVM’s SPI counterpart provides.

EARNED SCHEDULE: FROM EMERGING PRACTICE TO PRACTICAL APPLICATION
© 2012 Computer Sciences Corporation. All rights reserved. 20
Figure 9. Schedule Performance through Project Completion
0.80
0.85
0.90
0.95
1.00
1.05
1.10
1.15
1.20
1.25
1.30
(30)
(20)
(10)
0
10
20
30
40
50
12
13
14
15
16
17
18
19
20
21
22
23
24
25
26
27
28
29
30
31
32
33
34
35
36
37
38
39
40
41
42
43
44
45
46
47
48
49
50
51
52
53
54
55
56
57
58
59
60
61
62
63
Day
s Ea
rly
(Lat
e)
Week Number
EV Schedule Variance
Schedule Variance, Days ( SV(t) )
SPI
SPI(t)
TSPI(p)

EARNED SCHEDULE: FROM EMERGING PRACTICE TO PRACTICAL APPLICATION
© 2012 Computer Sciences Corporation. All rights reserved. 21
4 EARNED SCHEDULE ADOPTION IN CSC
4.1 BACKGROUND
CSC has been recognized as a successful adopter of Earned Value cost management methods in
information technology projects (Fleming & Koppelman, 2003). Through commitments in internal
training programs, establishment of consistent processes, and development of custom tools and
systems CSC continues to enhance organizational maturity in project management and Earned Value
Management. It is the environment and culture of continuous evolution that provides CSC the
opportunity to adopt, quickly and efficiently, Earned Schedule methods into regular practice by
building on an established foundation of tools and methods.
4.2 INTEGRATION VIA THE CSC TOOLKIT
The CSC Toolkit is a proprietary custom extension to Microsoft Project that supports tracking,
reporting, auditing, and exporting project performance data. The CSC Toolkit used in conjunction with
the Earned Schedule Workbook, a Microsoft Excel workbook developed by the author, can provide
Earned Schedule data for any CSC project manager using Microsoft Project with the CSC Toolkit
extension. The Earned Schedule Workbook calculates not only Earned Schedule values and metrics
but also conventional Earned Value budget and schedule metrics, including budget TCPI indicators.
The Workbook provides graphs for schedule and budget to allow easy interpretation of project
performance and to compare EVM and ES metrics. More reliable schedule metrics provided by
Earned Schedule provide the basis for advanced schedule and budget control tools as described in
the following sections.
Figure 10. CSC Toolkit Earned Value Export
Earned Schedule information is available by 3 simple steps:
1. Using the CSC Toolkit’s Analyze Earned Value function, export actual performance data to an
Excel spreadsheet. The appropriate data fields as documented in the Earned Schedule
Workbook are selected and the CSC Toolkit exports data to Excel.
2. Paste the exported data sheet to the Earned Schedule Workbook
3. Enter the project’s baseline start, baseline finish, current status date and Budget at Completion in
the Earned Schedule Workbook. Optionally an Estimate at Completion (EAC) may be entered for
calculation of the TCPIe metric.
EARNED SCHEDULE: FROM EMERGING PRACTICE TO PRACTICAL APPLICATION
© 2012 Computer Sciences Corporation. All rights reserved. 22
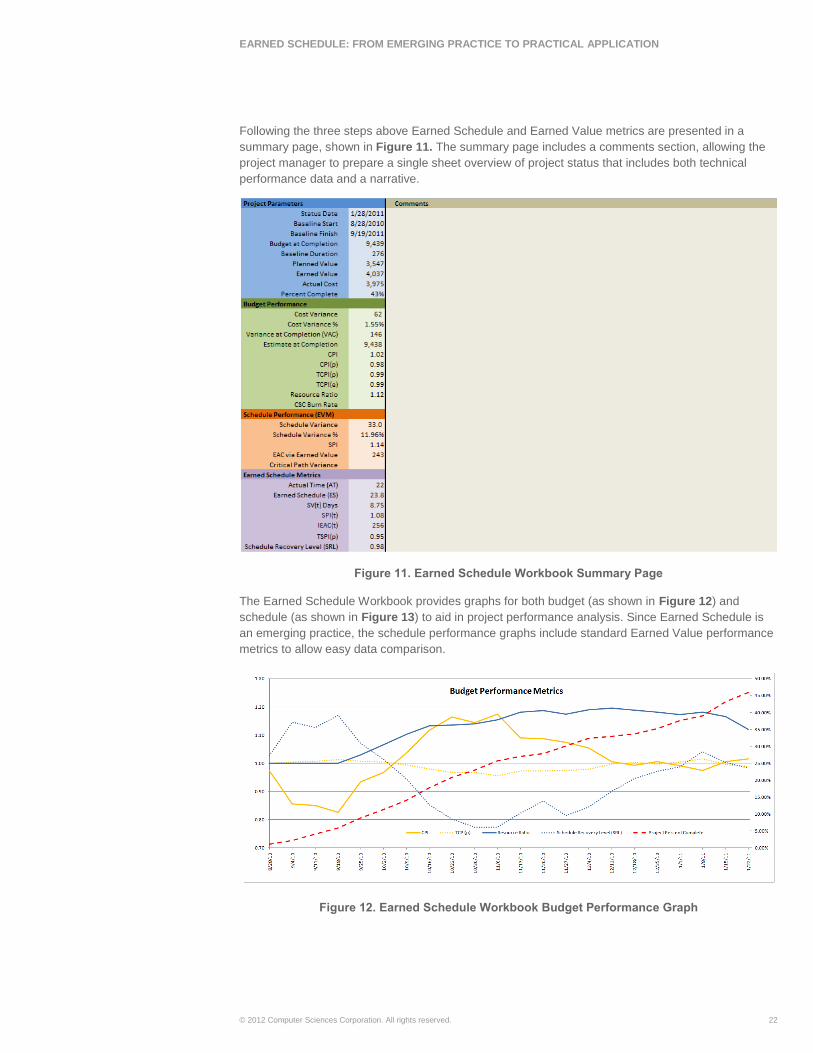
Following the three steps above Earned Schedule and Earned Value metrics are presented in a
summary page, shown in Figure 11. The summary page includes a comments section, allowing the
project manager to prepare a single sheet overview of project status that includes both technical
performance data and a narrative.
Figure 11. Earned Schedule Workbook Summary Page
The Earned Schedule Workbook provides graphs for both budget (as shown in Figure 12) and
schedule (as shown in Figure 13) to aid in project performance analysis. Since Earned Schedule is
an emerging practice, the schedule performance graphs include standard Earned Value performance
metrics to allow easy data comparison.
Figure 12. Earned Schedule Workbook Budget Performance Graph

EARNED SCHEDULE: FROM EMERGING PRACTICE TO PRACTICAL APPLICATION
© 2012 Computer Sciences Corporation. All rights reserved. 23
Figure 13. Earned Schedule Workbook Schedule Performance Graph
4.3 FROM PERFORMANCE MONITORING TO PERFORMANCE ADJUSTMENT
Calculating and interpreting reliable project performance metrics is certainly a challenge, and
determining an appropriate course of action for effective project control is an important step.
Schedule often seems to be the driving factor among the “triple constraints” of schedule, scope, and
budget. How do the metrics presented provide practical help in finishing a project on time? Once a
more reliable schedule metric via Earned Schedule is achieved to complement the CPI cost metric,
multiple techniques based on balancing performance indicators become available. Lipke provides a
good overview of project recovery techniques (Lipke, 2009c) and his work serves as a basis for
examining some proposed project recovery data that can be useful in CSC’s project portfolio.
Recall from Section 2.1 that Earned Value uses the Schedule Performance Index, SPI, and from
Section 2.3 that Earned Schedule uses the Schedule Performance Index for Time, SPI(t), as
indicators of project performance, with a value of 1.0 indicating on time performance while values less
than 1.0 show that a project is behind schedule. We have also seen that the Earned Schedule metric
To Complete Schedule Performance Index, TSPIp, indicates the target value that SPI(t) must achieve
for on time performance. While it is unlikely that any equation will ever provide a universal method for
schedule recovery under all circumstances, it is possible to gauge a relative level of resources
required for schedule recovery based on present resource usage and efficiency. The author
developed the Schedule Recovery Level metric, SRL, for integration into the Financial Services
Group’s project reporting methods for trial and evaluation. SRL defines the percentage of the
project’s planned resources required to achieve on time performance.
Note that Figure 11 shows a calculated value for Resource Ratio. Resource Ratio is defined as
Given the CSC convention of measuring cost in true labor hours instead of actual dollars we have a
ratio of actual labor hours expended to labor hours planned. We deduce that the actual progress
efficiency against planned schedule (SPI(t)) was achieved using this proportion of planned. This
interrelationship between these metrics serves as the basis for computing Schedule Recovery Level.
We achieve on time schedule performance when the Schedule Performance Index, SPI(t), is greater
than or equal to TSPIp. Therefore, the goal of driving the schedule toward on time completion is to
apply sufficient resources to transform SPI(t) from its current level to the value of TSPIp. Using the
equation for the Schedule Performance Index for Time

EARNED SCHEDULE: FROM EMERGING PRACTICE TO PRACTICAL APPLICATION
© 2012 Computer Sciences Corporation. All rights reserved. 24
and TSPIp
we can use the ratio of the normalized values of the equations multiplied by the Resource Ratio to
define Schedule Recovery Level as the percentage of planned labor hours required to achieve on
time performance.
Obviously, the SRL metric only offers guidance to the project manager, since applying the calculated
resource level may prove too expensive to improve the project’s schedule to be practical given the
project’s budget. Conversely, SRL may help in avoiding unnecessary project expense. In the
circumstance where project metrics indicate a significantly earlier than required finish it is possible
that the project may be overspending for no benefit. Rather than finish early with a budget overrun,
SRL may guide the project manager to a better conclusion through on time, on budget completion.
Evaluating SRL in the example data in Figure 11 we find that the project is 1.8 weeks ahead of
schedule with a comfortable SPI(t) of 1.08. CPI shows good cost performance with a value of 1.02.
The indicators suggest that the project could spend less and still finish on time, with SRL showing we
could use 98% of originally planned resources to reduce expense. The prudent project manager
would not reduce resources in a single step, but gradual reduction in resources while monitoring the
resulting metrics could result in a better balance between schedule and budget.
The logical extension of the Schedule Recovery Level metric is a corresponding measure for budget.
Using the same rationale, a Budget Recovery Level (BRL) is found by
With the foundation of the Earned Schedule technique and simple algebraic manipulation of the
metrics presented, CSC practitioners can easily add valuable tools to their project management
repertoire. As an example, substituting TSPIe in the SRL equation allows evaluation of the resource
level required to achieve a revised forecasted project duration.
5 CONCLUSIONS AND FURTHER RESEARCH
5.1 CONCLUSIONS
This paper has presented an overview of the history and application of Earned Value Management
(EVM) methods in predicting project schedule performance. An introduction to the theory and
application of Earned Schedule has been presented along with a simple example of its application.
Earned Schedule was applied retroactively to analyze its predictive capabilities when compared to
classical Earned Value schedule metrics, showing that ES and its associated metrics provide both a

EARNED SCHEDULE: FROM EMERGING PRACTICE TO PRACTICAL APPLICATION
© 2012 Computer Sciences Corporation. All rights reserved. 25
more reliable present status and forecast of project performance. From the theory, example, and
foundation of the literature cited it appears that Earned Schedule offers significant potential
improvement in project schedule reporting and forecasting.
Reviewing the application of standard Earned Value techniques shows converting budget variance to
time, lack of metrics for projects past their planned baseline, and the unreliability of EVM schedule
data in the final third of a project’s execution present serious limitations. While formulas and
techniques exist and have been used to convert dollars to time, the counterintuitive nature of the
method illustrates the need for a more straightforward technique. When considering a standard
normal distribution of possible project outcomes it is inevitable that some projects are destined to
finish later than planned, and for these projects, Earned Value schedule methods provide no useable
data when project status and forecasting are essential to minimize adverse outcomes. Likewise, as
projects move into the final third of their planned duration, Earned Value perhaps does a greater
disservice to the project based organization by providing data that, while available and theoretically
useable, is shown to be inaccurate with errors that are difficult to quantify. As discussed, the
inaccuracies of Earned Value are amplified in late projects, again, failing to provide dependable
information at the very point when accurate data can assist in effecting project recovery. These
limitations have motivated the search for other methods, resulting in the evolution of Earned
Schedule.
Earned Schedule provides a simple and straightforward method for schedule analysis that overcomes
the limitations in Earned Value methods. The evolution of commodity computer technology in
conjunction with ever more common project scheduling tools in the desktop environment are
providing the automated analytical platforms required for widespread adoption of Earned Schedule.
This paper shows that Earned Schedule extensions are easily applied to existing tools, techniques,
and data to provide an enhanced dimension to project schedule analysis and management.
As shown in the retroactive project analysis provided, Earned Schedule can offer not only a better
view of a project’s current status, but perhaps more importantly it offers predictive methods that can
help avoid missteps in project planning as well as assist in developing project recovery plans. Using
the To Complete Schedule Performance Index (TCPI) equations to analyze the probability of success
provides valuable insight in evaluating alternative project completion scenarios. Reliable performance
indices calculated by CPI and SPI(t) allow derivative metrics that may include, among others,
Schedule Recovery Level and Budget Recovery Level, to enable better control and more predictable
results in project execution.
The advantages of Earned Schedule methods are readily available to the CSC project management
community. Leveraging the corporate investment in the CSC Toolkit with the author’s Earned
Schedule Workbook enables evaluation and practical application of advanced project metrics. The
infrastructure of collaboration and training that CSC applies throughout the organization is well suited
to promote quick evaluation and adoption of these promising new methods.
5.2 FURTHER RESEARCH
Research and validation of ES metrics have been conducted retrospectively on individual projects
(Vandevoorde & Vanhoucke, 2006), a small sample of six actual projects (Henderson, 2003) as well
as on an extensive set of generated project data (Vanhoucke & Vandevoorde, 2007). Between these
boundaries of existing research lies the need and opportunity to evaluate the performance of Earned
Schedule on a larger sample set of actual projects. While time and coordination challenges precluded
conducting this broader based research as the subject of this paper, the research and findings
presented here indicate that further analysis based on available project data is warranted, with the
objective of validating the application of Earned Schedule in an established project environment. Just

EARNED SCHEDULE: FROM EMERGING PRACTICE TO PRACTICAL APPLICATION
© 2012 Computer Sciences Corporation. All rights reserved. 26
as a single design for a project organization or a single method can’t be used for all scenarios, tools
and metrics must be tailored for and perform in real world environments.
In considering project environments, it can’t be assumed that what works in one industry,
geographical region, or technical infrastructure will work in another. Differences in organizational
maturity, infrastructure, tools, and reporting methods can have a significant impact on the viability of
any given method. Based on the research and findings presented here CSC’s Financial Services
Group is currently working to integrate Earned Schedule metrics into its normal project reporting
methods. Given the significant size of FSG’s project portfolio, collecting and analyzing resulting data
will provide an opportunity not only to advance CSC’s best practices in project management but also
to make a significant contribution to the project management community at large by contributing to
the Earned Schedule body of knowledge with a large sample of real world data. The results of this
effort should be presented in a subsequent paper.
As demonstrated via the derivation of Schedule Recovery Level, reliable schedule metrics provided
by Earned Schedule facilitate the creation of advanced budget and schedule metrics and techniques.
Enhancements of existing tools to automate the calculation of optimal resource levels to achieve a
desired schedule outcome using Monte Carlo simulation could provide a family of performance
curves at any point during project execution, allowing the project manager to evaluate multiple project
recovery strategies. Earned Schedule as an emerging practice is not an end goal, but rather a
building block to improve CSC’s core competency in project management.
EARNED SCHEDULE: FROM EMERGING PRACTICE TO PRACTICAL APPLICATION
© 2012 Computer Sciences Corporation. All rights reserved. 27
6 WORKS CITED
Abba, W. (2000). How Earned Value Got to Primetime: A Short Look Back and Glance Ahead. Paper
presented at the PMI Seminars & Symposium. Proceedings, 2000, 20436.PDF, Houston, TX.
Anbari, F. T. (2003). Earned Value Project Management Method and Extensions. [Article]. Project
Management Journal, 34(4), 12-23.
Book, S. A. (2006a). Earned Schedule and Its Possible Unreliability as an Indicator. The Measurable
News, 7.
Book, S. A. (2006b). Earned Schedule and Its Possible Unreliability as an Indicator: Correction Note.
The Measurable News, 3.
Fleming, Q. W. (1988). Cost/Schedule Control Systems Criteria : The Management Guide to
C/SCSC. Chicago, Ill.: Probus Pub. Co.
Fleming, Q. W., & Koppelman, J. M. (2000). Earned Value Project Management (2nd ed.). Newton
Square, Pa., USA: Project Management Institute.
Fleming, Q. W., & Koppelman, J. M. (2003). What's Your Project's Real Price Tag? Harvard Business
Review, 81(9), 20.
Henderson, K. (2003). Earned Schedule: A Breakthrough Extention to Earned Value Theory? A
Retrospective Analysis of Real Project Data. The Measurable News, 6.
Henderson, K. (2005). Earned Schedule in Action. The Measurable News, 7.
Jacob, D. (2003). Forecasting project schedule completion with earned value metrics. The
Measureable News, 2003(3), 3.
Jacob, D. (2006). Is “Earned Schedule” an Unreliable Indicator? No, but It’s Not Necessarily the
Premier Indicator for Assessing Schedule Performance. The Measurable News, 6.
Lipke, W. (2003). Schedule is Different. The Measureable News, March 2003, 5.
Lipke, W. (2006). Applying Earned Schedule to Critical Path Analysis and More. The Measurable
News, 3.
Lipke, W. (2009a). Earned Schedule (First ed.): Lulu Publishing.
Lipke, W. (2009b). Schedule Adherence…A Useful Measure for Project Management. The
Measureable News, 2009(3), 6.
Lipke, W. (2009c). The TCPI Indicator Transforming Project Performance. Projects & Profits, March
2009.
Lipke, W. (2011). Schedule Adherence and Rework. The Measureable News, 2011(1), 6.
Project Management Institute. (2005). Practice Standard for Earned Value Management. Newtown
Square, PA: Project Management Institute, Inc.
Project Management Institute. (2008). A Guide to the Project Management Body of Knowledge
(PMBOK Guide), Fourth Edition (4th ed.). Newtown Square, Pa.: Project Management Institute.

EARNED SCHEDULE: FROM EMERGING PRACTICE TO PRACTICAL APPLICATION
© 2012 Computer Sciences Corporation. All rights reserved. 28
Vandevoorde, S., & Vanhoucke, M. (2006). A Comparison of Different Project Duration Forecasting
Methods Using Earned Value Metrics. International Journal of Project Management, 24(4), 289-302.
doi: 10.1016/j.ijproman.2005.10.004
Vanhoucke, M., & Vandevoorde, S. (2007). A Simulation and Evaluation of Earned Value Metrics to
Forecast the Project Duration. The Journal of the Operational Research Society, 58(10), 1361-1374.
DISCLAIMER
The information, views and opinions expressed in this paper constitute solely the authors’ views and
opinions and do not represent in any way CSC’s official corporate views and opinions. The authors
have made every attempt to ensure that the information contained in this paper has been obtained
from reliable sources. CSC is not responsible for any errors or omissions or for the results obtained
from the use of this information. All information in this paper is provided “as is,” with no guarantee by
CSC of completeness, accuracy, timeliness or the results obtained from the use of this information,
and without warranty of any kind, express or implied, including but not limited to warranties of
performance, merchantability and fitness for a particular purpose. In no event will CSC, its related
partnerships or corporations, or the partners, agents or employees thereof be liable to you or anyone
else for any decision made or action taken in reliance on the information in this paper or for any
consequential, special or similar damages, even if advised of the possibility of such damages.