leading in a global environment - brookings · leading in a global environment ... department of...
TRANSCRIPT

LEADING IN A GLOBAL ENVIRONMENT
Remarks by Lael BrainardVice President and Director
Brookings Global Economy & DevelopmentBernard L. Schwartz Chair in International Economics
Tuesday, October 24th, 2006

More of the Same?More of the Same?
How Sustained?How Sustained?
The New Wave of Globalization

SpeedSpeed
ScaleScale
ScopeScope
Unprecedented New Chapter in Globalization

SpeedSpeed
ScaleScale
ScopeScope
Unprecedented New Chapter in Globalization

Foreign Direct Investment into ChinaForeign Direct Investment into China
0
10
20
30
40
50
60
70
1984
1986
1988
1990
1992
1994
1996
1998
2000
2002
2004
Bill
ions
of
Dol
lars

China China –– Export Led Growth on SteroidsExport Led Growth on Steroids
02468
10121416
1 2 3 4 5 6 7 8 9 10 11 12 13 14 15 16 17 18 19 20 21 22 23 24 25 26
Years of Economic Expansion
Per
cent
of T
otal
Wor
ld
Exp
orts
China (1990-2005) Hong Kong (1975-2000) Japan (1960-1985)South Korea (1975-2000) Singapore (1975-2000) Taipei, Chinese (1975-2000)China Extrapolation (2005-2015)
Source: IMF International Financial Statistics
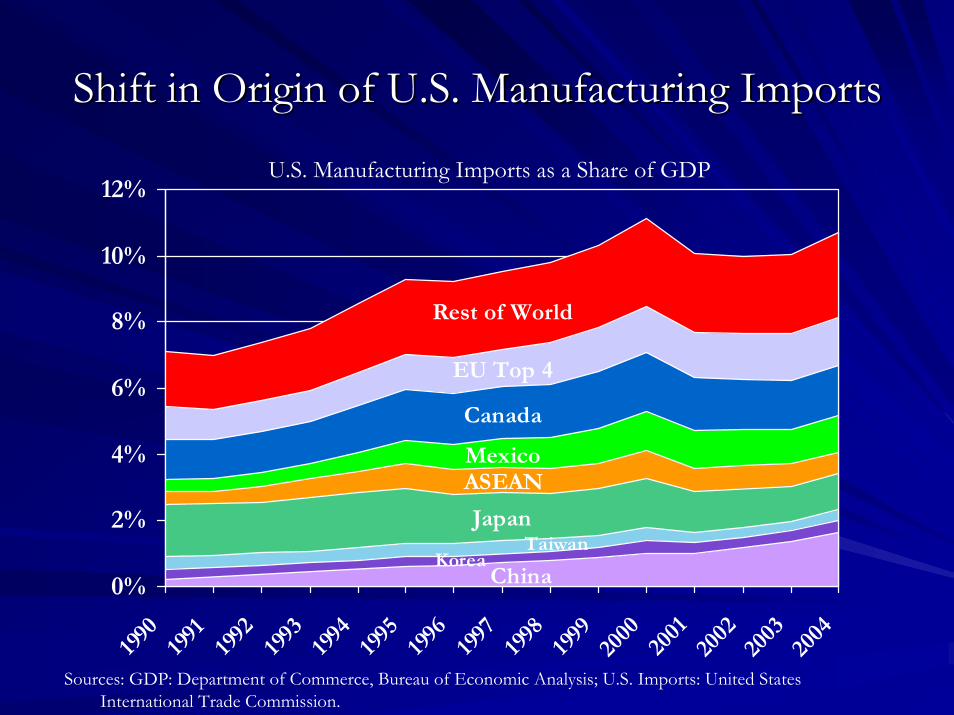
Shift in Origin of U.S. Manufacturing ImportsShift in Origin of U.S. Manufacturing Imports
ChinaKorea
TaiwanJapan
ASEANMexico
Canada
EU Top 4
Rest of World
0%
2%
4%
6%
8%
10%
12%
1990
1991
1992
1993
1994
1995
1996
1997
1998
1999
2000
2001
2002
2003
2004
Sources: GDP: Department of Commerce, Bureau of Economic Analysis; U.S. Imports: United States International Trade Commission.
U.S. Manufacturing Imports as a Share of GDP

U.S. Dominates Manufacturing but Challenged
Source: World Development Indicators, constant 2000 US$.
China
United States
Japan
BrazilMexico
$0.0
$0.2
$0.4
$0.6
$0.8
$1.0
$1.2
$1.4
$1.6
1990
1991
1992
1993
1994
1995
1996
1997
1998
1999
2000
2001
Tri
llion
s
Manufacturing Value Added by Country

SpeedSpeed
ScaleScale
ScopeScope
Unprecedented New Chapter in Globalization

World
United States
China
India
World
0.0
0.5
1.0
1.5
2.0
2.5
3.0
3.5
World 43% Expansion 27% Expansion Total Post-Expansion
Bill
ion
s
Source: World Development Indicators
Massive Labor Force IntegrationMassive Labor Force Integration

Dwarfs Previous Episodes of Integration Dwarfs Previous Episodes of Integration
Mexico
China
0 200 400 600 800 1,000 1,200 1,400
1970-1990
1990-1994
1995-2003
Labor Force Integration
Japan, S. Korea, Taiwan,Hong Kong & Singapore
India
Source: World Development Indicators

India
China
0100200300400500600700800900
1000
1970
1972
1974
1976
1978
1980
1982
1984
1986
1988
1990
1992
1994
1996
1998
2000
2002
Annual Per Capita Income, 1995 $US
Source: World Bank
New Paths out of Poverty

SpeedSpeed
ScaleScale
ScopeScope
Unprecedented New Chapter in Globalization

Source: BEA and Treasury
Different Growth Models with Different Impacts
Share of World Exports Share of World Exports Share of World Inward FDIShare of World Inward FDI20042004
India
China
0%
1%
2%
3%
4%
5%
6%
7%
8%
1989 1991 1993 1995 1997 1999 2001 20030%1%
2%3%4%5%
6%7%8%
9%10%
China India

Manufacturing MigrationManufacturing Migration
MexicoMexico
Sun BeltSun Belt
ChinaChina
Rust BeltRust Belt

Business Processing MigrationBusiness Processing Migration
HobokenHoboken
NYCNYC
BangaloreBangalore
Sioux FallsSioux Falls

Millions of JobsMillions of Jobs
Annual Layoffs Relative to US TotalAnnual Layoffs Relative to US Total
0
2
4
6
8
10
12
14
16
Forrester PeakAnnual Offshoring
Average AnnualInvoluntary Layoffs
Source: Forrester and BLS
0
5
10
15
20
25
30
35
ForresterResearch
Alan Blinder BerkeleyStudy
McKinseyStudy

Perceptions of Complexity Perceptions of Complexity Are ComplementaryAre Complementary
Source: Aron (2005)
US US FIRMSFIRMS
UK UK FIRMSFIRMS
Indian Indian BPOBPO
UK FIRMSUK FIRMS.89.89
Indian BPOIndian BPO --.47.47 --.56.56
SingaporeanSingaporeanBPOBPO
--.54.54 --.63.63 .84.84
CORRELATION: CORRELATION: CODIFIABILITY & CODIFIABILITY & COMPLEXITYCOMPLEXITY
US FIRMSUS FIRMS .59.59
INDIAN FIRMSINDIAN FIRMS --.52.52


Major Shift in Resources MarketMajor Shift in Resources Market
Major Shift in Global Distribution of PowerMajor Shift in Global Distribution of Power
New PlayersNew Players
New Rules?New Rules?
New Global Distribution of Power

Tectonic Demographic ShiftTectonic Demographic Shift
Rich Countries
Poor Countries
0123456789
2005 2025
Bil
lion
s of
Peo
ple
Source: Population Division of the Department of Economic and Social Affairs of the United Nations Secretariat, World Population Prospects: The 2004 Revision and World Urbanization Prospects
Rich Countries
Poor Countries
0
5
10
15
20
25
30
35
2005
Percentage of Population under the age of 14Projected Population in 20 Years

Prices Surge for Key ResourcesPrices Surge for Key Resources……
0.6
0.7
0.8
0.9
1
1.1
1.2
1.3
1.4
1.5
1.6
1996 1997 1998 1999 2000 2001 2002 2003 2004 2005
Copper Iron Aluminium
Average US Market Spot Prices, Indexed to 1996 PricesAverage US Market Spot Prices, Indexed to 1996 Prices
Source:: Robert F. Westcott, Source:: Robert F. Westcott, KeybridgeKeybridge ResearchResearch

……Where ChinaWhere China’’s Demand has Growns Demand has Grown
0%
10%
20%
30%
40%
50%
60%
70%
1996 1997 1998 1999 2000 2001 2002 2003 2004 2005
Coppper Iron Aluminium
ChinaChina’’s Share of World Imports of Metal Ores & Concentratess Share of World Imports of Metal Ores & Concentrates
Source:: Robert F. Westcott, Source:: Robert F. Westcott, KeybridgeKeybridge ResearchResearch

““All across Africa today, China is acquiring control All across Africa today, China is acquiring control of natural resource assets, outbidding Western of natural resource assets, outbidding Western contractors on major infrastructure projects, and contractors on major infrastructure projects, and providing soft loans and other incentives to providing soft loans and other incentives to bolster its competitive advantage.bolster its competitive advantage.””CFR Task ForceCFR Task Force
New Players New Rules?

““Zambian Hopeful Takes a Swing at China; Presidential Challenger Zambian Hopeful Takes a Swing at China; Presidential Challenger Stirs Resentment at Asian Power's Growing Influence in AfricaStirs Resentment at Asian Power's Growing Influence in Africa””
The Washington Post, September 25, 2006The Washington Post, September 25, 2006
““China Competes With West in Aid to Its NeighborsChina Competes With West in Aid to Its Neighbors””
New York Times, September 18, 2006New York Times, September 18, 2006
New Players New Rules?
““Russian Aluminum Producer Seeks Russian Aluminum Producer Seeks Edge in Global Market; Edge in Global Market; RusalRusal--SualSualCombination Would Create Powerhouse Combination Would Create Powerhouse Larger Than Alcoa, AlcanLarger Than Alcoa, Alcan””
The Wall Street Journal, August 31st, 2006The Wall Street Journal, August 31st, 2006