lean it - portal do conhecimento: página principal · esta dissertação apresenta uma abordagem...
TRANSCRIPT

Polytechnic Institute of Setubal
College of Business Administration (ESCE)
Lean IT
Application of 5S/6S Technique in a SME
Janet da Luz
Dissertation submitted for fulfillment of the requirements for the degree
in
MASTER OF ORGANIZATIONAL INFORMATION SYSTEMS
Supervisor: Prof. Ana Mendes
Setúbal, 2012

ii
“Posso ter defeitos, viver ansioso e ficar irritado algumas vezes,
mas não esqueço de que a minha vida é a maior empresa do mundo.
E que posso evitar que ela vá à falência.
Ser feliz é reconhecer que vale a pena viver apesar de todos os desafios,
incompreensões e períodos de crise.
Ser feliz é deixar de ser vítima dos problemas
e se tornar um autor da própria história.
É atravessar desertos fora de si, mas ser capaz de encontrar
um oásis no recôndito da tua alma.
É agradecer a Deus a cada manhã pelo milagre da vida.
Ser feliz é não ter medo dos próprios sentimentos.
É saber falar de si mesmo.
É ter coragem para ouvir um ‘não’.
É ter segurança para receber uma crítica, mesmo que injusta.
Pedras no caminho?
Guardo todas, um dia vou construir um castelo…”
(Fernando Pessoa)

iii
Acknowledgments
This dissertation is dedicated to my parents: “Mamy” and “Papy” for all their love,
support and kindness. The path was not easy at all but it was meaningful.
The struggle finally ended with a new personal conquest and for hereafter my goal is
to continue to give it my best and never let barriers stop me from reaching new horizons.
For my sisters Jocelyne and Jennifer (friends and good advisers): your presence and
support has been an inspiration and motivation for me to keep working on my
achievements and encourage me to have a fighting spirit.
To my supervisor Prof. Ana Mendes, for her great contribution towards my success
therefore my personal thank you for her contribution, patience, attention to details and
motivational words. It was a new environment to be explored but with her help everything
was much more clear to understand and easy to work with.
A special acknowledgment to all my teachers and colleagues from the Master of
Information Organizational Systems (4th
Edition) and coworkers from CENI (Center for
Integration and Process Innovation). It is such a pleasure to find an inspirational
environment that helps to support and achieve new goals.
Special thanks to Professor Leonilde Reis (Information Organizational Systems
coordinator) who really worked on pushing our standards to higher levels.
Thanks to Andreia Cabrita who always gave me support and helped me with articles,
books and excellent ideas, to Marisa Gertrudes who was the team leader on this
dissertation Case study (all documentation and archival records, systematic observation,
photos and graphics were under her supervision) and to Arshed Jamil (Senior Software
Test Engineer at CAPITA ITS – Derby (United Kingdom)), Elsa Patrícia Santos (Research
and Administrative Assistant at International Maritime Organization) and Afonso Braga
(IT Fujitsu) who reviewed this dissertation plan and gave suggestions about this paper.
At last but not least important, to all my truly friends: names are not necessary when
they know who they are and what they have done for me.

iv
TABLE OF CONTENTS
Acknowledgments .................................................................................................................. iii
List of Illustrations ................................................................................................................... v
List of Tables ........................................................................................................................... v
List of Acronyms and Abbreviations ........................................................................................ vi
Abstract ................................................................................................................................. vii
Resumo ...................................................................................................................................ix
1. Introduction ..................................................................................................................... 1
1.1. Framework ............................................................................................................................. 1
1.2. Proposition ............................................................................................................................. 3
1.3. Objectives ............................................................................................................................... 4
1.4. Motivation .............................................................................................................................. 6
1.5. Methodology .......................................................................................................................... 6
1.6. Dissertation Structure ............................................................................................................ 9
2. Literature Review ........................................................................................................... 11
2.1. Lean ...................................................................................................................................... 11
2.2. Lean IT .................................................................................................................................. 14
2.2.1. 5S/6S Technique ...................................................................................................... 27
2.3. Chapter Synthesis Section .................................................................................................... 31
3. Methodological Approach .............................................................................................. 33
4. Case Study ..................................................................................................................... 41
5. Data Analysis and Discussion .......................................................................................... 45
5.1. Case Study: Application of 5S/6S Technique in a SME .......................................................... 45
5.1.1. Results ..................................................................................................................... 52
6. Conclusions and Future Work Perspectives ..................................................................... 67
6.1. Conclusions .......................................................................................................................... 67
6.2. Future Work Perspectives .................................................................................................... 69
References ............................................................................................................................ 73
Appendix ............................................................................................................................... 81

v
List of Illustrations
Illustration 1 – Methodological Approach Adopted .......................................................................... 8
Illustration 2 – The 5 Lean Principles ............................................................................................... 13
Illustration 3 – Lean IT Roles ........................................................................................................... 17
Illustration 4 – IT Value Stream ....................................................................................................... 19
Illustration 5 – PDCA-5S Cycle ......................................................................................................... 25
Illustration 6 – House of Lean .......................................................................................................... 26
Illustration 7 – 5S/6S Technique ...................................................................................................... 29
Illustration 8 – Process Way to Search for Information ................................................................... 34
Illustration 9 – SME Organogram .................................................................................................... 43
Illustration 10 – Cabinet with Archival Records ............................................................................... 46
Illustration 11 – Personal Computer Screenshot ............................................................................. 47
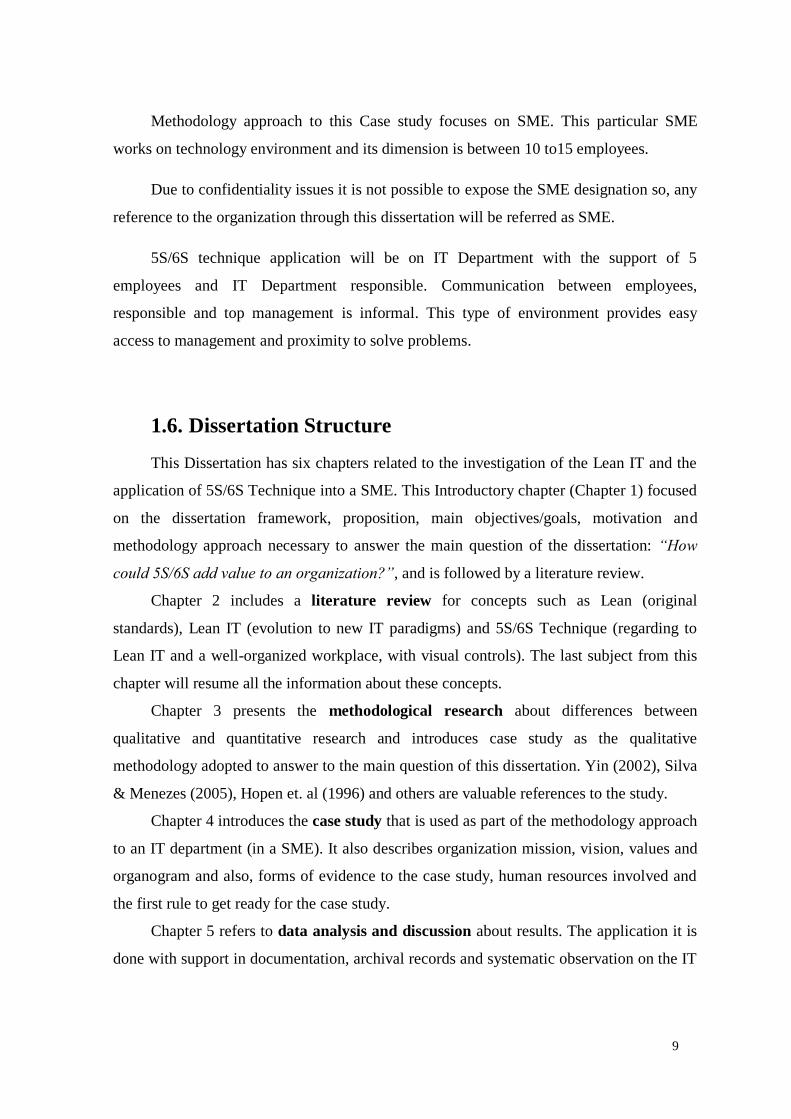
Illustration 12 – 6S Evaluation: Phase One ...................................................................................... 48
Illustration 13 – 5S Work Area Form: Level One.............................................................................. 50
Illustration 14 – Disorganization and Unnecessary Items ................................................................ 52
Illustration 15 – 5S Work Area Form: Level Two ............................................................................. 53
Illustration 16 – Organization with Necessary Items ....................................................................... 55
Illustration 17 – Targets of Quality Models ..................................................................................... 56
Illustration 18 – Microsoft Excel Projects’ Screenshot .................................................................... 57
Illustration 19 – Screenshot of Communication Between Stakeholders ......................................... 58
Illustration 20 – Microsoft SharePoint Screenshot .......................................................................... 59
Illustration 21 – Microsoft SharePoint: Users and Permissions’ Screenshot ................................... 60
Illustration 22 – Microsoft Project Screenshot ................................................................................ 61
Illustration 23 – 5S Work Area Form: Level Three ........................................................................... 62
Illustration 24 – 6S Evaluation: Final Phase ..................................................................................... 64
Illustration 25 – Red Tag System ..................................................................................................... 65
List of Tables
Table 1 – The Seven Wastes ............................................................................................................ 23
Table 2 – Comparison between Qualitative and Quantitative Research ......................................... 37
Table 3 – Comparison of Quantitative and Qualitative Research Approaches ................................ 38
Table 4 – Important Sources of Evidence ........................................................................................ 41

vi
List of Acronyms and Abbreviations
BI – Business Intelligence
BPM – Business Process Management
CIO – Chief Information Officer
CRM – Customer Relationship Management
DVD – Digital Versatile Disk
ESCE – Escola Superior de Ciências Empresariais
IRIS – Information & Research Instruction Suite
ISO/IEC – International Standard Organization/International Electrotechnical
Commission
IT – Information Technology
ITIL – Information Technology Infrastructure Library
JIT – Just In Time
KPIs – Key Performance Indicators
OIS – Organizational Information Systems
PDCA – Plan-Do-Check-Act
PME – Pequena, Média Empresa
ROI – Return of Investment
SME – Small, Medium Enterprises
TI – Tecnologias de Informação
TPS – Toyota Production System
VSM – Value Stream Mapping
WFM – Workflow Management

vii
Abstract
Lean is not just a practice. It is a revolution on Information Technology (IT) with
management providing a higher and better optimization of resources and “chasing” lower
costs than what exist today.
It is a lot more than series of tools and methodologies and to be implemented we
need to change cultural behaviors and encourage all the organizations to think differently
about the power of information instead of value in the business.
Usually, we associate Lean to create value for the organization. But value is
meaningful when it is brought with efficiency and resulting in eliminating processes that
cost unnecessary time, resources and space.
Lean principles can help organizations on quality improvement, cost reduction and
achieving efficiency through better productivity.
There are many Lean concepts that can be associated to different goals for problem
solving. In particular, this paper is a dissertation programmed to discuss a new paradigm
about Lean that emerged recently – Lean for Information Technology (Lean IT).
This dissertation presents an approach to Lean IT (framework, objectives, and
methodology) to conduct the paper and use one single Case study with 5S/6S technique
evaluation (up to level three) on an IT Small, Medium Enterprises (SME) to demonstrate
value added and the advantages of eliminating wasted processes. Technique also shows the
evolution before and after its deployment.
This particular single Case study evaluates an IT Department (with a team of five
employees and one Chief Department) through systematic observation, documentation and
archived records. Equipment represented through computers, workstations and projects
(developed code, portals and other IT services).
As a guideline the methodology includes work preparation with IT Department
responsible, follow operations, identify value stream for each activity, develop the
communication plan and analyse each step of the process flow evaluation.
Main results are reflected on new work tools (Microsoft SharePoint and Microsoft
Project instead of Microsoft Excel) that provide remote communication and projects’

viii
control to all project stakeholders such as top management, 3rd
party IT team (some
organization integrated with 3rd
party IT to get particular development) and customers.
Results are also reflected on: work quality, deadline, logical and physical security,
employees’ motivation and customer’ satisfaction.
5S/6S technique helps to clarify Lean concepts and principles, practicability and
enhance the curiosity about this thematic implementation in other environments such as
Finance and Human Resources Departments.
As a way of work consolidation it became possible to organize an assessment in
order to apply for an International Standard Organization/International Electrotechnical
Commission (ISO/IEC) 25010:2011 certification in software quality model (software is the
core business from this SME). But it will only be possible if the entire organization achieve
standardization on its processes.
This Case study shows that Lean concepts and the application of one or more of its
technique (in this particular case, 5S/6S technique) helps to achieve better results through
its core services management and improvement.
Key-words:
Lean | Information Technology | 5S/6S Technique | IT Department

ix
Resumo
O Lean não é apenas uma prática. É uma revolução nas Tecnologias de Informação
(TI) proporcionando uma maior e melhor utilização dos recursos e procurando alcançar
custos mais baixos dos que existem atualmente.
É muito mais do que uma lista de ferramentas e metodologias e para que seja
estabelecido é necessário mudar comportamentos culturais e incentivar todas as
organizações a pensarem de forma diferente sobre o poder da informação versus o valor do
negócio.
Normalmente associa-se o Lean à criação de valor para a organização. Mas o valor é
significativo quando é trazido com eficiência e resultando na eliminação de processos que
consomem tempo, recursos e espaço desnecessário.
Os princípios Lean podem ajudar as organizações na melhoria da qualidade, redução
de custos e no alcance da eficiência através de uma melhor produtividade.
Existem vários conceitos Lean que podem ser associados a diferentes objetivos de
resolução de problemas. Em particular, este trabalho é uma dissertação programada para
analisar um novo paradigma sobre o Lean que surgiu recentemente - Lean para
Tecnologias de Informação (Lean IT).
Esta dissertação apresenta uma abordagem para o Lean IT (enquadramento, objetivos
e metodologia) para realizar o trabalho e utiliza um único estudo de caso, com abordagem
à técnica 5S/6S (até o terceiro nível de avaliação), numa Pequena, Média Empresa (PME),
de forma a demonstrar a agregação de valor e as vantagens na eliminação de
resíduos/desperdícios nos seus processos. A técnica também mostra a evolução da
avaliação antes e depois da sua aplicação.
Este estudo de caso individual avalia um Departamento de TI (com uma equipe de
cinco colaboradores e um chefe de Departamento) através da observação direta,
documentação e arquivos de registos e os equipamentos analisados são computadores,
postos de trabalho e projetos (código desenvolvido, portais e outros serviços de TI).

x
Como guia, a metodologia inclui a preparação da avaliação em conjunto com o
responsável/chefe do Departamento de TI, o desenrolar das operações, a identificação do
fluxo de valor para cada atividade, o desenvolvimento de um plano de comunicação e a
análise de cada passo da avaliação do fluxo de processamento.
Os principais resultados estão refletidos nas novas ferramentas de trabalho
(Microsoft SharePoint e Microsoft Project em detrimento do Microsoft Excel) que
fornecem comunicação remota e controlo de projetos para todos os stakeholders, tais
como, a gestão de topo, parceiros e clientes (algumas organizações incluem o Outsourcing
no desenvolvimento de funcionalidades específicas). Os resultados também refletem-se na
qualidade do trabalho, no cumprimento de prazos, na segurança física e lógica, na
motivação dos colaboradores e na satisfação dos clientes.
A técnica 5S/6S ajuda a esclarecer os conceitos e princípios Lean, exequibilidade e
aumenta a curiosidade sobre a implementação da técnica noutros departamentos tais como
o Financeiro e ou o de Recursos Humanos.
Como forma de consolidação do trabalho tornou-se possível organizar a avaliação
para que a organização possa candidatar-se a uma certificação na norma ISO/IEC
25010:2011, no modelo de qualidade de software (software é o core business desta PME).
Mas tal só será possível se toda a organização atingir a padronização dos seus processos.
Este estudo de caso mostra que os conceitos Lean e a aplicação de uma ou mais das
suas técnicas (neste caso particular a técnica 5S/6S) ajuda a obter melhores resultados
através da gestão e melhoria dos seus principais serviços.
Palavras-chave:
Lean | Tecnologias de Informação | Técnica 5S/6S | Departamento de TI

1
1. Introduction
There has been a dramatic rise on Information Technology (IT) environment since
World Wide communication through Internet became one of the most powerful ways of
business trade.
It is important to understand the differences between standard commercial
organizations (that are constantly being developed since centuries ago) and new forms of
organizations that are highly performed with technology and global communication.
But in order to increase an organizations’ performance and capability to deal with
this new business environment we must realize how IT can influence the internal
resources, how process works and how to manage and establish communication with the
external stakeholders.
According to Sanli (2010), an actual IT organization has many supporting roles
regarding to helpdesk, operations, software development, project management, hardware
(data center services, computers, and machines), network and control.
Monitoring the development through new paradigms seems to be another way of
improvement. So, this chapter performs an introduction to Lean concepts across previous
research about IT and several thematic such as: IT evolution and nowadays perspective, IT
Departments and operations, Software for data security, Lean Thinking and strategies, IT
services, Hardware, Lean techniques, and so on.
1.1. Framework
Accomplish the transmission of a new paradigm has always been a challenge.
Therefore it is essential to understand its concepts, principles and techniques in order to
draw the line of knowledge and possible implementation of learned methods.
With the Information Systems integration, Poppendieck et. al (2006) talks about IT
and Organizational purposes. Lean philosophy brought to IT, new perspectives about
organization management regarding to processes flow and the elimination of existing
waste (Bell (2006b)).
For such development it is necessary to demonstrate that most of Lean concepts
emerged from production activities to IT models and are still viable in this new context.

2
With this in mind (think about Lean IT models) some steps should be stated:
Identify value and waste in the IT environment;
Apply one specific technique (in this case, 5S/6S Technique);
Enable continuous process flow during the application;
Manage the workplace organization and office structure;
Identify, map and analyse value streams;
Monitor Lean metrics for IT performance;
Reflect results in visual management;
Discuss changes within the IT environment.
Applying Lean principles should be related to eliminate process waste, sustain
knowledge, plan future changes, deliver as fast as possible and, with the required features,
to empower the operational team with build quality associated and optimize the whole
process flow and related resources related.
Ultimately the biggest challenge is to decrease cost while successfully implementing
the technique according to the needs of the business: promoting efficiency and better
service to customers and improving productivity (ComputerWorld (2008)).
Finally, the technique should reflect benefits and areas of possible implementation.
So, this paperwork investigation and development consists in clarifying all the
descriptions above, trying to get answers for business sustainability.
According to Yin (2002) one single Case study should reveal details about relevant
procedures in SME environment that could be replicated in other circumstances, although
it does not mean that all the references should be the same as some features are intrinsic in
each organization.
This might make a contribution to understand the Lean paradigm associated to IT
and launch new perspectives of work definition: clean, fast, with value added and residual
or no waste.

3
1.2. Proposition
The purpose of this dissertation is to understand how the Lean IT concept and one of
its technique (5S/6S) could improve or add value to an organization.
It is known that Lean applied to technology is a new approach and it is still a huge
challenge to clarify if it is a good and proper step to follow.
The final research question is: “How could 5S/6S add value to an organization?”,
starting in a SME.
It was a sort of junction of different concepts connected to Lean and Information
Technology.
As inspiration were the questions formulated at the book “Lean IT: Enabling and
Sustaining Your Lean Transformation” wrote by Steve Bell and Mike Orzen (2010). Such
questions were:
Is business process improvement part of Lean IT?
What about best practices and benchmarking?
Is agile software development a Lean IT practice?
What about IT operational excellence?
Is applying Lean techniques to project management considered a Lean IT
practice?
They formulated one ‘simple’ answer to those questions: yes. But there are still other
questions to be made and experimented.
A literature review involving the process of concepts’ transmission (Lean Principles,
IT, and so on) was made as well as a presentation of ideas from other authors.
The literature research words were:
Lean | Lean Thinking | Lean Manufacturing | Lean Toolbox;
Technology | IT | Software;
Value | Lean IT | Lean Techniques | 5S/6S Technique.
Also, to add value to this paper, it is proposed to experiment and analyse the 5S/6S
Technique according to a single case study planned to a SME.

4
Case study is a simulation technique that allows us to observe practical knowledge.
After collecting and evaluating the facts, one or various problems must be defined
and alternate solutions should be generated. According to observation and analysis,
determined by the organization culture and position, the author must elaborate and present
a plan to solve the problem.
When final conclusions about Lean and its practicability are delivered to the
administration (with emphasis in IT on the enterprise dynamics) they should demonstrate if
the topics where the process flow and value aggregated are or are not essential to the
system delivery path.
The Dissertation should respond to the main question, aligning perspectives of future
general development in other departments or SMEs.
1.3. Objectives
General objectives are related to topics that should be perceived by everyone. They
contribute to understand the main purpose of the investigation. Usually they are associated
to the research execution and possible impact on a specific environment.
As an approach, this paperwork started to study some articles, thesis and
dissertations about the thematic or similar (Lean regarding to IT is a relative new concept
so it is necessary to refer to themes such as Lean Manufacturing, Production or Services as
original approaches) and consider the characteristics from a specific SME (each SME
represents one particular structure and work methodology).
It is necessary to clarify the main concept (Lean applied to IT) but to accomplish that
it is imperative to understand the qualitative and quantitative investigation, different
approaches, methodologies and techniques.
Generally, the objective is to demonstrate the applicability of 5S/6S Technique
regarding to an IT Department and according to analysis and future results, if possible,
extrapolate to other departments and/or global organization, the benefits of Lean
implementation in these kinds of environments.

5
However, just general purposes are difficult to summarize and understand. Specific
objectives with minor goals, when globally accomplished go against the general ones and
help to reach the main purpose. They are concrete targets for the project scope and
correspond to the expected results.
1. This dissertation aims to present Lean concepts, principles and methodologies so
that the Information System Community and general public can learn and absorb new
terms, definitions and practicability;
2. Study and analyse Lean IT phenomenon and 5S/6S Technique.
3. Last, but not the least, demonstrate the 5S/6S Technique applicability (through a
case study) in a SME context (IT Department).
To correctly build specific objectives they should:
Determine or quantify the desired result;
Analyse according to specific methodology (it could be a set of various
methodologies);
Identify an effect and its cause.
According to the characteristics above specific objectives to this dissertation are:
1. Identify, describe, measure and eliminate (or reduce) waste incorporated in
information system process flow in a SME;
2. Involve, teach and discuss with team or department the advantages, limitations
and future work including Lean IT concepts and principles;
3. Increase the amount of necessary value that should be added in a process (use
some metrics to establish the comparison before and after the implementation);
4. Implement and test the 5S/6S Technique in a SME;
5. Propose improvements to the administration based on Case study observation and
analysis.
If one or more targets are not fulfilled, it should be reported what were the causes
and how they could turn into positive or better approaches.

6
1.4. Motivation
Lean is a paradigm that explores new forms of processes’ organization. It is a
perception of processes workflow and how we should act to minimize or even try to
eliminate waste in our workstations.
Although all the applications of this thematic is mainly in production systems (there
are Lean metrics constantly being applied since the practices were established in Toyota
Production System (TPS) by Taiichi Ohno and Kiichiro Toyoda, in the 1930s), Lean
regarding to IT takes less than ten years (now we can verify the exponential growth of Web
communication, applications and usage of IT equipment to communicate).
According to Spanos (2012) “…the software maintenance definition refers to
changes for defect correction, performance improvements, or adaptations to a changed
environment (enhancements).”
There are not enough case studies about Lean IT. Some dissertations talked about
Lean supporting IT but did not mention a practical approach to a specific department with
a specific technique (Eriksson (2011) explored these thematic doing a qualitative study of
municipalities, questioning if they knew about this new paradigm, its benefits and
applications and recently Guedes (2011) talked about Lean IT on bank environment).
So, it became motivating to try to understand the applicability of one specific
technique that could express the benefits of Lean IT to an organization. If it is possible to
prove that it actually helps to improve the workstation flow, somehow it might help in
other IT environments or departments.
1.5. Methodology
To define a methodology, Yin (2002) emphasizes that there are likewise, other ways
to explore and observe a phenomenon: through experiments, surveys, histories and analysis
of archival information. Yin (2002) also established a comparison to choose the right
research strategy: experiment, survey archival analysis, history or case study. These
strategies are adopted according to:

7
Type of research question;
The control that an investigator has over actual behavioral events;
Focus on contemporary as opposed to historical phenomena (real-life context).
In the same book, Yin (2002) explains that data provided for case studies can come
from different sources of evidence. Some of them are: documentation, archival records,
interviews, direct observations, participant-observations and physical artifacts, but a
complete list of sources can be quite extensive. Usually, these are the most adopted.
The benefits from these sources of evidence can be maximized if we take in
consideration, three principles (Yin (2002)):
1. Use multiple sources of evidence: if possible;
2. Create a Case study database: organizing and documenting the data collected for
case studies;
3. Maintain a chain of evidence: to increase the reliability of the information.
Because the main goal of this paper is to answer the research question “How could
5S/6S add value to an organization?” (“How”: one of the forms of research questions in
case studies) and the focus is on contemporary events and not in controlling behavioral
events, the formulation of a Case study is the most appropriate research strategy.
To implement the strategy, three sources of evidence support the method:
1. Documentation;
2. Archival records;
3. Direct Observations.
Reporting a Case study means to relate and find results to the research question and
understands if such paradigm is valid to be adopted. The report does not follow any
particular or stereotypic form. Illustration 1 is the methodological approach adopted to
respond to the main question of this dissertation.

8
Illustration 1 – Methodological Approach Adopted
Source: Oneself, 2012
9
Methodology approach to this Case study focuses on SME. This particular SME
works on technology environment and its dimension is between 10 to15 employees.
Due to confidentiality issues it is not possible to expose the SME designation so, any
reference to the organization through this dissertation will be referred as SME.
5S/6S technique application will be on IT Department with the support of 5
employees and IT Department responsible. Communication between employees,
responsible and top management is informal. This type of environment provides easy
access to management and proximity to solve problems.
1.6. Dissertation Structure
This Dissertation has six chapters related to the investigation of the Lean IT and the
application of 5S/6S Technique into a SME. This Introductory chapter (Chapter 1) focused
on the dissertation framework, proposition, main objectives/goals, motivation and
methodology approach necessary to answer the main question of the dissertation: “How
could 5S/6S add value to an organization?”, and is followed by a literature review.
Chapter 2 includes a literature review for concepts such as Lean (original
standards), Lean IT (evolution to new IT paradigms) and 5S/6S Technique (regarding to
Lean IT and a well-organized workplace, with visual controls). The last subject from this
chapter will resume all the information about these concepts.
Chapter 3 presents the methodological research about differences between
qualitative and quantitative research and introduces case study as the qualitative
methodology adopted to answer to the main question of this dissertation. Yin (2002), Silva
& Menezes (2005), Hopen et. al (1996) and others are valuable references to the study.
Chapter 4 introduces the case study that is used as part of the methodology approach
to an IT department (in a SME). It also describes organization mission, vision, values and
organogram and also, forms of evidence to the case study, human resources involved and
the first rule to get ready for the case study.
Chapter 5 refers to data analysis and discussion about results. The application it is
done with support in documentation, archival records and systematic observation on the IT

10
department. Forms to 6S evaluation and 5S work area will help to understand the
application of 5S/6S technique.
The final chapter, Chapter 6, summarizes conclusions about Lean concepts, research
methodologies, literature review and case study implemented in an IT department. It will
answer the question: “How could 5S/6S add value to an organization?”. It indicates the
cycle time and project ROI (Return of Investment) as key factors to have good improved
results.
A future work perspective leads to a whole range of Lean IT concepts and
techniques that could be applied on other departments, consolidating the Lean perspective
to the entire organization.

11
2. Literature Review
The dissertation involves the concept of a new paradigm that is emerging in our
society: Lean applied to IT. However, the Lean concept as a different background – it
appears from a manufacturing concept.
Technology is networked across organizations, stakeholders and World Wide.
Due to the revolution in business performance it is crucial to manage the instances
around it.
The literature review is supported in theoretical principles about lean, information,
computation and algorithmic processes.
They are also related to computational complexity, communication between
organizations’ structures, business versus IT and decisions made on virtual environment.
IT is important to understand what is the information impact allowed on business
processes, what adaptations or improvements should be adopted and how people can
interact with those concepts.
The Lean approach has been originally attached to manufacturing processes. So, in
1st instance, it might appear to be a production issue but with the exponential increase of
hardware, software and web utilization, enterprises had the necessity to organize their
processes, teams, departments and administration according to specific information
parameters and to reflect the customers’ requirements properly.
For such reasons it was crucial to adopt a philosophy that justified and could
implement a row of basic workflows, controlling the processes and, if possible, reduce
costs and add value to the service or product requested. That is how Lean IT emerged,
combining the Lean principles with the information and technology surround it.
2.1. Lean
According to Womack et. al (1990), the philosophy was inspired on the TPS created
by Taiichi Ohno and Kiichiro Toyoda although there are other founding concepts
approaches.

12
“...it occurred to them that a series of simple innovations might make it more
possible to provide both continuity in process flow and a wide variety in product
offerings”. (Lean Enterprise Institute, 2009)
Also, according to Poppendieck & Poppendieck (2006, p.19), “principles are the
underlying truths that do not change in time or space.”
Do more adding value with less waste is the Lean Thinking philosophy (Womack et.
al (1996)). The essence is to specify value and simultaneously, eliminate or reduce waste
(Curran et. al (2009)). And yes, Lean is a business philosophy, not a technique.
As cited by Aitken (2010, p.2), “Lean is concerned with delivering more value for
the business and its customers by increasing the velocity of throughput and minimizing
wasteful practices by balancing process flow.”
The thought process of Lean was thoroughly described in the book “The Machine
That Changed the World” published in 1990 and written by James Womack, Daniel Roos
and Daniel Jones. They classified five Lean principles:
1. Specify the value desired by the customer;
2. Identify the value stream for each product;
3. Make the product flow continuously;
4. Introduce pull between all steps where continuous flow is possible;
5. Manage to reach the perfection (number of steps, amount of time and information
needed are exactly what was claimed by the customer).
The five-step processes to implement the Lean concept are represented bellow on
Illustration 2.
The principles and practices are originated from the Lean Manufacturing concept and
they can be incrementally implemented and apply subsequent practices.
The focus of Lean is to eliminate waste on all the processes concerning to an
organization. Waste is any activity that does not aggregate value to the product or service.
It can be reached in various formats: waiting time, erroneous information, unnecessary
complexity, poor data quality, and so on. Wastes in all processes drives to higher costs and
longer lead times (Scherrer-Rathje et. al (2009), Medina (2011), Cottyn et. al (2008)).

13
Illustration 2 – The 5 Lean Principles
Source: Lean Enterprise Institute, 2009, p.1
Known also as the seven wastes (Muda is the Japanese word to define waste or
anything that does not add value), they were identified by Taiichi Ohno (a pioneer of the
TPS) and Shigeo Shingo.
Initially, Shigeo Shingo (from 1948 until 1975) identified seven types of wastes. The
forward concepts are explained in Schmidt (2009), Aitken (2010), Haaster et. al (2010) and
Venitz (2011):
1. Overproduction: produce more than the necessary or required; the result is the
excess of inventory which consumes space and requires extra investment; it takes the focus
away of what customer really wants;
2. Over processing or non-add-value processing: over effort to something that
does not add value to the process; add extra quality (not required) to the product or service
aggregates more resources’ time; it is work above and beyond specification;
3. Inventory: excess of material that occupies space and is capital that is not
circulating; some materials could become obsolete or in need of new reshape; there is no
value added;

14
4. Defects: inspection or repair of material in inventory; when repair is needed it is a
waste of time and resources, in something that should be already done correctly; right at
the first time is the key to succeed;
5. Transportation: movement of people, information or material that does not add
value to the product or service; there is a risk of damage and loss of product or service;
delay, waiting times and human resources’ management are characteristics to be watched;
6. Waiting: any idle time created when the flow is waiting for a determined process;
resources that wait for a determined cycle to be completed; it could be caused by poor
workflow continuity, long lead times, failed delivery dates, and so on;
7. Motion: movement of resources; time and effort are wasted when human
resources make excess of movement to complete a process.
Underutilized people or no or barely employee involvement should not occur. It is
necessary to involve the right human resources according to their best abilities. They are the
best resources to identify where waste is being generated in the process flow.
The sources of waste can be found everywhere in the process flow. Anything more
than customer request is considered as a waste.
But in reality it is about eliminating waste without operating with fewer resources.
Instead, it should re-distribute them through the process flow. And it is not necessary to
apply the same level of Lean principles, at the same time, to the entire organization.
2.2. Lean IT
As Lean has been adopted by several areas of knowledge, its tools and principles are
applied in manufacturing, logistics, distribution, services, retail, healthcare, construction,
maintenance, government and recently to IT (Vedpuriswar (2010), Cottyn et. al (2008)).
IT is very unpredictable and difficult to understand when it is going to fail or how
improvements can be made. Its applications require huge investments in software,
hardware, infrastructures, storage, facilities and more (Riezebos et. al (2009a)).
First Lean IT approach was on Steve Bell book “Lean Enterprise Systems: Using It
for Continuous Improvement” (2006).

15
Nowadays, IT is not just viewed as an investment. It is part of core business of any
organization that wants to communicate with stakeholders or operate and manage its
processes. So, it must exist a balance between flexibility, delivery time and cost reduction.
Specific actions should be sustained beyond short timeline regarding that human
resources are still the most critical component of the process.
Lean and IT pursue the same objectives but their complementarity remains an open
issue. IT usually supports Lean practices and techniques (Riezebos et. al (2009b)).
As Melville (2010, p.1) wrote, “information systems innovation for environmental
sustainability demonstrates the critical role that IS can play in shaping beliefs about the
environment, in enabling and transforming sustainable processes and practices in
organizations, and in improving environmental and economic performance.”
Information Communication and Technologies drove to fundamental changes on the
process of technology management (Zhang (2004), Veraszto et. al (2007)). It is nowadays,
essential to understand the adaptability and flexibility of businesses in a virtual transaction
World and due to that reason many organizations changed their critical business functions
to the Internet/Web technology. Goods and services are attached to treatment, processing
and information storage. Functions became intrinsic to businesses’ primary activities such
as online information, database management, desktop control or delivery information
(Nicoletti (2011), Sacks et. al (2010), Daft (2008), Carpenter (2009)).
To increase collaborators’ productivity, IT provides software and communications
technologies that allow them to interact with other stakeholders (administration, other
departments, suppliers, customers and so on) (Gupta (2008)).
According to Lean Enterprise Institute (2009) and emphasized by Lean IT
Strategies1, “Lean IT empowers enterprise agility, enabling leaders to leverage cutting-
edge IT capability to deliver enhanced customer value and achieve lasting competitive
advantage.”
Such advantages are associated to projects and services. They must be better, faster
and cheaper. It is a possibility to save time and money, reducing costs. It is also an
opportunity to quickly align resources with strategy (Curran et. al (2009)).
1 leanitstrategies.com

16
When applied effectively and with the right tools and frameworks, Lean IT has
benefits for organizations such as described by APMG-International (2012):
Increased customer satisfaction and productivity;
Reduction of IT costs;
Reduction in time to changes and clients specifications;
Increased ability to manage demand.
APMG-International2 also reminds us that Lean IT is one of the extensions of Lean
Manufacturing / Lean Services concepts and principles directed to IT management. It is the
materialization of technology information efforts into aggregated value to business and
customers and it allows the management of IT initiatives with strategic value. It could be a
natural response to all the changes in economics and technology concentrated in specific
areas of the process flow (the objective is to reduce development timeline through waste
elimination; maps explore waste over delays on the process flow).
But Lean IT is most of all directed to people, not machines. To achieve the last
principle of perfection it is crucial that human resources can raise the level of
professionalism, learning how to manage this new paradigm, solve problems, improve as a
team and be fully motivated to achieve the result intended (Ambler et. al (2011), Bell
(2006a), Carpenter (2009)).
As suggested by McDonald (2010) and shown in the following illustration
(Illustration 3) the result is an organization shaped in order to balance different actors that
collaborate to enhance productivity (noticing that Agile Solution Engineering is not the
only solution; different forms, methodologies and software could be aggregated).
It concentrates all the organization on the essential roles to achieve cost reduction.
The final dimension of the triangle is to achieve sustainability. From this, Chief
Information Officer (CIO) can ensure that IT services or products are in according with
existing orders.
It continues to have the same purpose: eliminate waste and add value to the work (in
these terms, regarding to waste in IT processes). Its implementation should be continuous
and a long-term process (Ci&T (2012)).
2 http://www.apmg-international.com/

17
Examples of IT waste, according to Guidon (2009) could be: significant amount of
support work done outside of service desk process, excessive alerts and warnings, constant
interruptions, perform multiple roles at the same time, unnecessary documentation, lack of
prioritization guidelines, roles technically overspecialized limiting resource flexibility, and
so on.
Illustration 3 – Lean IT Roles
Source: Gartner cited by McDonald, M., 2010, p.3
Other classic varieties identified are: rework on past specifications, coders waiting
for specifications to be stabilize, testers overproduced, unnecessary overhead for simple
tasks, and so on.
System variability is the main source of waste but Information Systems are not just
that, it could be tools for business improvement. IT also provides more productivity by

18
allowing human resources to interact with technologies and increase collaboration on the
process flow.
Adapt IT to Lean Principles and methodologies to a digital service oriented flow
process it is only beginning. Its services must become more standardized.
Bell (2011a) declared that “One of the many challenges of an enterprise
transformation is the tension between the continuous improvement of business processes
and the lack of supporting information systems”.
Bell (2011a) also emphasizes that is necessary a holistic framework to establish a
systematic cultural transformation, aligning business with IT. To organize that framework
through IT perspective, it is possible to use Lean principles.
According to Bell & Orzen (2010) fundamental factors that contribute to adjust the
perspective are:
Waste (Muda, non-add-value that can or cannot be necessary for the system to
function);
Unnecessary Variation (Mura);
Overburden (Muri);
Local Optimization.
The transformation must be coordinated by a higher level on the organization
(administration) and not exclusively attached to individual teams. The transformation
effort should improve the service level and relationships between different areas.
Lean IT Principles, according to the five ones established in Loader et. al (2011) are
reflected in:
1. Value: aggregated on IT services or products and defined by the customer; IT has
changed the view the whole organization has to this specific domain: IT is not anymore
just a back office support function it has a center role in delivering customer value.
Indeed, Lean IT initiates with the definition and establishment of balance between
value and its cost to the organization and helps the organization to deliver value to its
customers.

19
2. Value Stream: is associated to IT functions, which are used by internal
departments, customers, suppliers, human resources and other stakeholders. Services could
be for businesses such as supply chain, ecommerce, transaction processing, reporting or IT
resources such as backups, performance management, catalogs.
Lean IT Principles principle includes Value Stream Mapping (VSM) technique that
is use for analyzing the flow of materials and information which represents all that happens
at the organization, from the time of demand to the delivery and the purpose is to build and
analyse services’ diagrams on their process flow. The required service or product must be
delivery with the proper amount of value, as quickly as possible (Bell (2011b), Jones
(2011)).
Orzen (2011) presented on the 1st European Lean IT Summit (October 2011)
3 an
illustration (Illustration 4) of IT Services value stream:
Illustration 4 – IT Value Stream
Source: Orzen, M., 2011, p.7
3 http://www.lean-it-summit.com/

20
Lean IT depends on processes that usually are not physical and tangible but digital
and intangible. To manage such information, the organizations need tools to visualize and
analyse abstract context (McKendrick (2010)). So, it is important to build a VSM to
identify opportunities or mistakes to be solved, study the processes’ complexity and impact
and create ways to measure it.
But first, it is necessary to understand the maturity of the core processes and involve
the right resources to each step of the way.
In order to improve the value stream, a Plan-Do-Check-Act (PDCA or so called
Deming Cycle) could be adopted to manage the process (Medina (2011), Bell (2012)).
3. Flow: represented through code (familiar internal language) or visual controls is
the path through which value stream try to deliver value; it should have a minimum of
interruptions or stockpiles;
4. Pull: it is a service/product requested and the value stream through its delivery;
Lean IT insists that one step only occurs when a request signal appears; for instance, an
online acquisition, database consult, customer information, supply chain management, and
so on;
5. Perfection: value, value stream and process flow should be major management
concern; improvement must be visible and reachable for the whole organization and all the
actors on the value stream must know the quality requirements.
When the target is the software development, Poppendieck & Poppendieck (2006)
introduce the following principles, related to the specific encoding field:
1. Eliminate Waste: reduce the timeline when waste do not add value to the process
flow (since the client request until the delivery and payment);
2. Integrate Quality: build quality code from the beginning of the process; for
instance: requirements analysis, system, architecture and module design, system testing,
user acceptance and release testing (verification and validation);
3. Build knowledge: a developed process focused on creating knowledge will
expect the project to evolve during the encoding before waste time in subdivide
prematurely;

21
4. Postpone Commitments: plan irreversible decisions to the last possible moment;
5. Fast Delivery: deliver software faster so that customers do not have time to
change their minds or customers have their system on time and in line with their business
(so they can achieve their finance and customer service goal accordingly).
6. Respect People: team must purchase the organization culture and the technical
workforce should be specialized. Responsibility is based on planning and control;
7. Optimize the Hole: Lean organizations must optimize the value flow, since the
request (that should respond to the customer requirement) until software is implemented
and customer demand is successfully delivered.
All these principles should develop capacities that aggregate value and are truly
relevant to the processes going on. It is also fundamental to understand the information
asking questions such as (after exploring the book “Information Systems” by Watson
(2007)):
What is the cost add to each step of the process flow?
How can improvement be measured?
To always perpetuate the best optimization, how could stakeholders share
information?
How can efficiency be controlled?
Relating these domains with the Organizational Information Systems (OIS) is not
difficult. They all search for the best methods, techniques and technologies to sustain an
organization.
The focus is on understanding problems that could happen in stakeholders’ cycle and
apply technologies and information where is needed but with emphasis on the decision
level: top management (administration), middle management (departments’ chiefs) or
bottom management (operational teams) (Naveed (2009)).
Initially, IT components were just related to operations problems (computers
failures). Nowadays they have accomplished a bigger role at the whole organization
management. They are supporting decisions (financial performance goals, customer
service goals, business process goals and optimization) and they now have a leading role as
strategic tools to internal and external coordination (Llebrand et. al (2010)).

22
Besides that, Web as completely revolutionized concepts and notion about what
should be available online to customers’ knowledge and demands. Management is still the
ultimate area to be studied and to those who operated exclusively on the online market it is
a question of organization survival.
Also, the supporting equipment attached to the Web concept must be 24 hours / 7
days available and it should allow interoperability (reuse of server resources and software
components cooperation) (Wegner (1996)). Characteristics such as time, language, cultural
features are essential to spread the word.
Regarding specifically to Lean IT, Schmidt (2009) listed the following types of waste
within IT operations:
1. Overproduction: when unnecessary applications or IT services are produced and
there is no add value to the process flow; that will increase costs for datacenter space,
energy and maintenance;
2. Over processing or non-add-value processing: miscommunication between
business managers and IT Department with different metrics to evaluate the IT
performance (for instance, doing the work better than requested by the customers);
3. Inventory: multiple repositories for similar information, unutilized or
underutilized hardware or additional server capacity, and so on, increase the costs
associated;
4. Defects: changes on service or operational level agreements, systems or
applications plus different standards for project execution provide poor customer service
and consequently, more costs;
5. Transportation: hardware or physical software security, documents from process
to be audit, issues to solve hardware or software problems must be protected; they are the
source and higher capital for an organization supported on IT;
6. Waiting: slow applications response times and no manuals with procedures to
begin processes flow or to solve a problem reflects on a poor customer service and loss of
productivity;
7. Motion: problems with fires, floods and security within IT infrastructure and
applications.

23
Furthermore if human resources capabilities to innovate or make changes are not part
of organization culture, it will reflect on talent leakage, increase of low job satisfaction and
maintenance costs.
Also, according to Poppendieck & Poppendieck (2006) and Hibbs & Jewett (2010)
the reason of Lean IT is to discover waste, reduce costs and make IT products more
effective. There are specific wastes for software development. Types of waste were
inspired by the seven production wastes from Shigeo Shingo and are related as shown next
at Table 1:
Production Software Development
Inventory Inadequate Work
Overproduction Extra Functionalities
Over processing or non-add-value processing Relearning
Transportation Transfer Control
Motion Task Switching
Waiting Delays
Defects Failure
Table 1 – The Seven Wastes
Source: Poppendieck, M. & Poppendieck T., 2006, p.93
1. Inadequate Work: is stock unnecessary. System value flow should comprise
encoding, tests, reports and delivery. It is appropriated to work in batch or iterations.
Inadequate work examples are: documentation still not coded, code not synchronized or
not tested;
2. Extra Functionalities: features that or not in use and or not necessary to do the
work (extras).

24
For instance, create a framework for a speculative application is not a good idea
because usually it represents record of failure;
3. Relearning: it is essential to leverage the knowledge of every human resource,
drawing on the expertise they have built over time;
4. Transfer Control: it is usual to loose knowledge (tacit knowledge is difficult to
be reported). What it is possible is to minimize waste. For example, reducing the transfer
number using direct observation, interaction with models, prototypes or simulations.
Another way is ask for feedback during the process;
5. Task Switching: generates distracting, time consuming and often worsening
results of both tasks. Perform multiple tasks at once usually makes no sense and causes
delays;
6. Delays: to reduce delays it is not important the team physical location. Instead, it
is necessary to make sure that knowledge is available exactly when and where it should be
used;
7. Failure: encoding should include tests failsafe that does not allow defects in code.
It is important to find unexpected failures as soon as possible and test it (costs increase
with time).
When all the wastes are eradicated or decreased, the organization should
continuously control the processes and try to integrate optimization on the delivery service
or product (that could also be software).
In the article “Reshaping IT management for turbulent times” from the consulting
firm McKinsey & Company and elaborate by Roberts et al. (2010) and cited by Orzen et.
al (2010), two categories of Lean IT are specified:
1. “Enabling IT”: to implement innovation and acquire competitive advantage, IT
workgroups are attached to several areas – support experimentation, collaboration and data
mining;
2. “Factory IT”: to accomplish improvements, Lean management techniques and
the process flow should be integrated at the same package. Two other perspectives that can
help on this category are: Cloud Computing and software development.

25
Bell & Orzen (2010) described also, two different dimensions:
1. Outward-facing Lean IT: Engaging information, Information Systems, and the
IT organization in partnership with the business to continuously improve and innovate
business processes and management systems;
2. Inward-facing Lean IT: Helping the IT organization achieves operational
excellence, applying the principles and tools of continuous improve.
Bell & Orzen (2010) and Bell (2012) reflected that cost reduction is natural to Lean
products but is not the primary goal. Value creation adopts iterative cycles of learning
(PDCA cycle on Illustration 5).
Illustration 5 – PDCA-5S Cycle
Source: Orticio, R., 2010
The process improvement is detected when the right information is delivered at the
right time and format, to the customer. When a process standard is created, that will
increase the efficiency. The information system should be designed to align the process
and the process flow that it should adopt (White et. al (2008)).

26
According to Aitken (2010, p.7), “it is the responsibility of management to ensure
that new IT process automation plans are driven by improved process control and
management standards”.
Process optimization tools are established by developments in workflow and
Business Process Management (BPM). Aalst et al. (2003, p.1) refers that “Business
Process Management (BPM) includes methods, techniques, and tools to support the
design, enactment, management, and analysis of operational business processes. It can be
considered as an extension of classical Workflow Management (WFM) systems and
approaches.”
Policies and standards should be applied on the processes’ development. According
to their achievement, right decisions must be established, measured and controlled.
Measures and controls (techniques such as VSM, Pareto or Fishbone Analysis, Poke
Yoke reported by Aitken (2010)); Just In Time (JIT is to make only what is needed, when it
is needed and in the amount needed); Kanban (means signalization card in Japanese and it
is the way to control the material flow; the challenge is to control the card content with the
appropriate location (Cunningham et. al (2007)); Jidoka (automation with a human touch);
Heijunka described by Haaster et. al (2010) or even Kaizen (representatives from different
functional areas attempt to work together and solve organization problems (Caseau (2011),
Cunningham et. al (2007))), A3 Thinking, Kaikaku and Standardized Work analysed by
Bell & Orzen (2010)) need to be adjusted to the specific risks aggregated in each process.
When the risk is high, the focus must be on mitigate or eliminate such probability.
Illustration 6 – House of Lean
Source: Citynetevents, 2012, p.1

27
Illustration 6 is an example of metrics that can help to improve the business.
All these techniques are largely used on production industry or even on services’
processes but in IT field it is more difficult to specify IT attributes as resources to be
measured or controlled.
Orzen (2011, p.5) specifies that “IT enables people to solve problems and create
value. Information is primary and functionality is secondary”.
Raichura & Rao (2009, p.2) argues that “…despite heavy investments by
organizations in IT, there is a huge gap between what businesses expects from IT and what
IT can deliver-back to the business”.
There are fewer experiences and examples of techniques applied on IT applications
(IT teams, Software, Hardware, Storage, Data Centers and so on). 5S/6S Technique seems
to be the one that is more applied on IT environments because it can be applied on physical
and/or logical environments. 5S/6S Technique organize the workplace and is not
aggregated to any particular business. It should be taken in consideration in any field.
2.2.1. 5S/6S Technique
5S/6S is a technique and management approach that results from a well-organized
workplace with visual controls and brings efficiency to any work environment. It was
developed by Hiroyuki Hirano (1995) in his book “5 Pillars of the Visual Workplace” (1st
book edition was in 1990).
There is a place for everything and it should stay clean, uncluttered, safe and
organized. Human resources and process should be linked and the product adopts a process
flow since it is requested, to the final delivery (Bresko (2009), Caseau (2011)).
The technique should engage all human resources to accomplish and contribute to
the organizational culture change. It is not just a manufacturing tool. It could be applied in
different office settings and it requires perseverance and determination, attention to details
and the ability to separate what is really important from what is waste.
This technique aggregates some principles from time management (time is a crucial
asset and it must not be wasted in unnecessary effort) and physical work space area.
Focus seems to be set for the workplace but it is not all we can accomplish. Focus
should be also on work process that is being executed on that specific workplace.

28
Initially, it is necessary to identify the work process in study and what benefits are
going to be provided through that.
The 5S/6S’ technique includes five Japanese words that symbolize the five tenets of
good housekeeping (Illustration 7). They are described in Hirano (1995), Roll (2005),
Philbrick (2008), McMahon (2008) and Bell & Orzen (2010):
Seiri (Sort): remove all the items that are not needed to the current operation;
items that are necessary to the functioning of the work must continue on the process flow,
however, they must be split in two groups: those which are regular used and occasional
used. Any item should be tagged with its information and position so an item/tool could be
for example, a software program;
Seiton (Set in Order/Straighten): establish location to items they are usually on the
process flow. It is a technique to reduce the distance and timing of searching. Visual
controls should be created (visual Scoreboard, Jidoka lights, floor paint, Kanbans and so
on) so that others can follow the same efficient workflow;
Seiso (Shine/Scrub/Sweep): clean the entire area usually implements a more
positive attitude on human resources and increases the productivity. It also helps to detect
leaks and problems with equipment more quicker;
Seiketsu (Standardize/Systematize): create new habits and levels of performance
expectations, which should be easy to understand, communicate and prevent constant
maintenance. The goal is to keep everything that is necessary and ready to use;
Shitsuke (Sustain): establish schedules and systems to maintain the rules that
were previously adopted and became a routine. All human resources must be properly
trained and understand how tasks could be continuously improved;
Safety (the 6th
S): it is inherent of every past S words and intertwined with all of
them.
5S/6S is a cyclical methodology: sort, set, shine, standardize and sustain, always
looking for safety, complete the cycle (Appendix 1 demonstrates an example of 5S/6S
Technique form and related questions to each S techniques).

29
Some organizations established a sixth S called precisely, Safety. That is why
sometimes the technique is also called 6S (Roll (2005)).
Illustration 7 – 5S/6S Technique
Source: EPA – United States Environmental Protection Agency, 2011, p.1
The methodology allows collaborators to control their environment, reducing time
spent in searching for documents, tools or applications.
According to Hirano (1995), Philbrick (2008), McMahon (2008) and Saxena (2009)
some benefits from 5S/6S Technique are:
Directly improves productivity, performance, morale and self-discipline;

30
Makes cleaner and safer work area which increases credibility with customers,
suppliers and visitors;
Reduces the amount of time wasted in unnecessary resources and costs related;
Visual tools can be used to raise the understanding of proper waste handling and
management procedures;
Good technique implementation on a team or department is usually an indicator of
probable success at the whole organization.
Because Lean has some purposes like: eliminate waste (waste in search, travel,
transporting materials and so on) and maximize value-added to each process it is necessary
to pay attention to them.
Value should be readily grasped because there is a place for everything and
everything has a specific place to be attached. Also, because people get involved on their
own work settings, this technique creates a huge sense of achievement.
To be implemented, 5S/6S Technique has 3 phases approach (according to Roll
(2005)):
First is to get ready to the event. The major steps are to understand the customer
expectations, build a document with the references, define goals, understand if the events
makes sense on the process flow and match between people and tasks;
Second is to take action according to what was established before the event. To
start the event, one team should be prepared to process the information, locate waste,
generate improvement ideas and select the best ones;
Third is to make sure that improvements are sustained and controlled. Also,
improvements should be analysed so that parameters could be perfectly understood and
executed in the future.
Another approach largely admitted is to establish 5 implementation levels (by
Leading Edge Group (2012)):
Level 1: Just beginning;
Level 2: Focus on basic;
Level 3: Make it visual;
Level 4: Focus on reliability;
Level 5: Continuously improve.

31
Usually it is used to building teams who share the same workplace and to measure
this technique achievement it is necessary to look at each component and understand how
each level or phase (according to the approach adopted) is being worked.
According to Popescu et. al (2010), human resources should be able to identify
anything necessary in their workplace in less than 30 seconds which widely increase the
answer time. That is the key points for a well succeed implementation of 5S/6S Technique.
2.3. Chapter Synthesis Section
After reviewing literature regarding to Lean concepts, IT perspectives and existent
techniques that are actually used to describe, analyse and represent (most of the time)
improvements on the process workflow of different sectors, it is time to focus on the
chosen technique to this particular Case study: 5S/6S Technique concerning to the 5
implementation levels described in Chapter 2.2.1.
Unlike the 3 phase’s approaches that are not exclusively reported in any statement,
analysis or book (they are open perspectives that can be adjusted to any environment) with
5 levels it is possible to use a form elaborated by Leading Edge Group (Appendix 2: Five S
Work Area Form) that helps the author to visualize (through systematic observation) and
simultaneously describe what is happening in each phase of the process flow.
This method takes in consideration on each level, all “S” words introduced on 5S/6S
Technique (standards/steps): sort, set in order, shine, standardize and sustain (Chapter
2.2.1).
It is important to understand the level that the organization has been working on and
then, move forward to achieve better results.
Previous concepts are expected to prove the real impact of Lean and its techniques
on an IT environment and what should be necessary to model and design the best
development process, not adding unnecessary value and corresponding to customers’
needs.

32

33
3. Methodological Approach
This chapter includes an approach about the research methods and their applicability.
As a first perspective it will analyse the differences between qualitative and
quantitative methods and why the dissertation was driven to the qualitative ones. To start
this methodological perspective it is important to clarify the definition of research.
To establish a methodology it is necessary to understand how the search for
particular topics and answers is done. It includes the references to the theoretical addressed
issue and the associated analysis tools (Hoppen et. al (1996)).
Research is to find a solution to a specific problem based on rational and systematic
procedures. It is an operation that cannot be controlled or predicted therefore, the adoption
of a particular methodology depends on the chosen path (Murtonen (2005)).
As singled by Galliers & Land (1987, cited by Hoppen et al., 1996) the choice of a
research method depends on the object to be studied so as the knowledge, skills and
preferences of the author.
For Minayo (1995, cited by Silva & Menezes, 2005) research is also a phenomenon
of successive approximations to reality which fits the theory and the data involved.
Adds Demo (1996, cited by Silva & Menezes, 2005) that research is an everyday
activity that questions systematically, to establish a critical intervention and with
theoretical and practical sense on the subject.
Research criteria’s must define scientific accuracy so that the conclusions add value
to an Information System domain (referring to Information System in this context as the
subject related to the dissertation thematic).
But the quality of research cannot be based simply on methodological choices that
were applied on the study. Criteria’s and weighing are also very important to analyse and
summarize the thematic (Wainer (2007)).
According to Luna (1988, cited by Silva & Menezes, 2005) to investigate it should
exist a problem to solve, the development of steps to discover one or more solutions and
the degree of reliability in response.

34
Also related to Silva & Menezes (2005), the planning and implementation of
research adopt a process flow: choice of topic, literature review, formulation and
justification of the problem, determine the research objectives, methodologies, data
collection, processing, analysis and data discussion and conclusion draw from them.
As a perspective of the steps that should be learned and adopted, Information &
Research Instruction Suite (IRIS) (2009) published an article to teach how to do a research
process and a way to organize the search for information.
The article explores the follow steps illustrated bellow on Illustration 8:
Illustration 8 – Process Way to Search for Information
Source: Information & Research Instruction Suite, 2005, p.3
In order to structure the research it should be classified by its approach. As described
by Silva & Menezes (2005) it is possible to research:

35
Taking into account the research nature: generation of new knowledge that is
useful to science but where there is no practical application provided or apply the practical
applications of knowledge to generate and specifically, solve a determined problem;
Considering how to approach the problem: quantitative based on experimentation
and quantification of data that is translated into numbers which can elicit views and
information for analysis and results’ classification that also uses statistical techniques such
as mode, media, standard deviation etc, for the correlation analysis’ between the available
variables. Also qualitative in sense of a research that is focused in a thematic and does not
employ a statistical tool for data analysis that is descriptive. Its primary objective is the
process and its interpretation, which is used to find and open space to the perception and
interpretation of concepts.
Corresponding to objectives (Gil, 1991, cited by Silva et al., 2001): exploratory
(understand the problem in order to make it explicit or build hypotheses through it;
literature searches or case studies on the established thematic), descriptive (uses standard
techniques for collecting data about a given population or event; these techniques can be
questionnaires or systematic observation) or explanatory (identify the factors that establish
the occurrence of a certain event; usually works with experimental searches or Expost-
Fact);
Finally, regarding technical procedures: literature (through the analysis of books,
articles, newspapers, magazines and content available on the Internet), documentary (for
content analysis that does not follow an analytical line for data treatment), experimental
(an object is tested according to established variables and also defines forms of control and
observation of achieved results in the implementation of those variables in specific
objects), survey (suggests a direct contact with the human resources allocated to the
problem analysis), Case study (study of a subject in an exhaustive way in order to increase
knowledge on the subject in question), research Expost-Fact (when tests are performed
after the facts), action research (for the establishment of a collective solving problem in
which the participants of the resolution are also, actively integrated in the problem) and
participatory research (where there is interaction between authors and the team involved on
the subject).

36
“The qualitative methods consist of a set of techniques’ interpretations that are
targeted towards to retrace, decrypt or translate natural social phenomena, in order to
obtain relevant evidence to describe or explain these phenomena.” (Van Maanen, 1983,
cited by Hoppen et al., 1996, p.19)
Based on scientific perspectives, qualitative methods consist on a set of the following
characteristics (Günther (2006)):
Try to find answers from a predetermined question;
Use a predefined set of procedures to answer the question that is being
investigated;
Search for evidences, case studies and interpretations about the thematic;
The search seeks for new perspectives’ approaches that can or cannot be
applicable on a certain domain.
Qualitative methods aim to express the meaning of the phenomena and reduce the
discrepancy between theory and data.
Theory is still a huge perspective but the major aim is to provide new theories and
perspectives. The main research instrument for qualitative methods is the author. It is
her/his point of view that will personalize the investigation and its conclusions.
As specified by Bowen (2005, p.219), “In qualitative research, findings do not result
from statistical procedures, correlations, and similar mathematical calculations; instead,
they come from an interpretation of non-numerical or largely text-based data. Yet,
numerical data have a place in qualitative studies; they should be included where
available and where appropriate.”
To quantity it should be validated by a past theoretical knowledge about the subject
because the thematic has been already studied (Sutherland et. al (2011)). Hypotheses are
formulated after the theory and they should be the more general as possible so that they
would not be directly assumed as a specific case explored before.
Quantitative research is concerned with counting and measuring data, producing
evaluations about a determined group and its aim is at explanation. Those phenomenon
expressed in numeric terms are analysed by statistical methods.

37
Indeed, “Unlike quantitative research, qualitative methods face interaction with the
researcher’s field and its members, as a whole part of the explicit production knowledge,
rather than exclude them as participant variables from the research. The researcher
subjectivity and the subjects studied are part of the research process.” (Flick, 2005 cited
by Duarte, 2009, p.7).
The illustration bellow (Table 2) summarizes the research aspects between
qualitative and quantitative methods: purpose, approach, data collection approach, author
independence and samples.
Comparing Qualitative & Quantitative Research
Qualitative Research Research Aspect Quantitative Research
Discover Ideas, with General
Research Objects
COMMOM PURPOSE Test Hypotheses or Specific
Research Questions
Observe and Interpret APPROACH Measure and Test
Unstructured. Free Form DATA COLLECTION
APPROACH
Structured Response
Categories Provided
Research is intimately
involved. Results are
subjective
RESEARCHER
INDEPENDENCE
Researcher uninvolved Observer.
Results are Objective
Small samples – often in
Natural setting
SAMPLES Large sample to Produce
Generalizable Results [Results that
Apply to Other Situations]
Table 2 – Comparison between Qualitative and Quantitative Research
Source: Shaya’a, O., 2011, p.1
The qualitative and quantitative methods can be combined in different ways in the
same research. Both of them can be applied to describe a social reality (Neves (1996)).

38
Comparison of Quantitative and Qualitative Research Approaches
Quantitative Qualitative
General Framework Seek to confirm hypotheses about
phenomena
Seek to explore phenomena
Instruments use more rigid style of
eliciting and categorizing responses to
questions
Instruments use more flexible, iterative
style of eliciting and categorizing
responses to questions
Use highly structured methods such as
questionnaires, surveys, and structured
observation
Use semi-structured methods such as in-
depth interviews, focus groups, and
participant observation
Analytical Objectives To quantify variation To describe variation
To predict causal relationships To describe and explain relationships
To describe characteristics of a
population
To describe individual experiences
To describe group norms
Question Format Close-ended Open-ended
Data Format Numerical (obtained by assigning
numerical values to responses)
Textual (obtained from audiotapes,
videotapes and field notes)
Flexibility in Study
Design
Study design is stable from beginning
to end
Some aspects of the study are flexible (for
example, the addition, exclusion, or
wording of particular interview questions)
Participant responses do not influence
or determine how and which questions
researchers ask next
Participant responses affect how and
which questions researchers ask next
Study design is subject to statistical
assumptions and conditions
Study design is iterative, that is, data
collection and research questions are
adjusted according to what is learned
Table 3 – Comparison of Quantitative and Qualitative Research Approaches
Source: Mack, N. et al., 2005, p.3

39
Another study care out by Mack et al. (2005) (Table 3) expressed comparison of
quantitative and qualitative research approaches through its general frameworks, analytical
objects, the question and data format adopted and the method flexibility when faced with
the correlation between study and participants.
As Bowen (2005, p.208) declared, “researching and writing a dissertation –
particularly one based on qualitative research methods – demand a different set of skills
and offer some special challenges because of its nature and scope.”
Qualitative research adopts an in-depth investigation with the emphasis on maximize
the information about a specific topic.
That is the challenge facing the qualitative methodological perspective for a
dissertation thematic.
According to the types of research methodologies studied before and thinking about
the general and specific objectives related to this paper work and the problem observed
(waste and non-add value to processes), the proposed methodology is the qualitative
approach based on investigation issues and a Case study.
With previous methodological approach represented on this chapter, the
methodology adopted considering how to understand the problem is the qualitative
research with focus on data analysis.
According to Yin (2002) design and methods and the chosen SME, single case study
is the approach technique. The objective is to describe the object through systematic
observation supported by organization documentation and archival records (evidences),
focus on an IT Department (Comer (2012)). The units to be analysed are computers,
workstations and software development (projects).
For work completion, the chosen methodological approach was to run a Case study
based on direct observation with forms that helps the author to observe, analyse and later
on, understand certain work standards.
To Yin (2002), case study is one of several ways to achieve social science research.
This approach is used in many and different situations and contribute to increase our
knowledge of various kind of phenomena.

40

41
4. Case Study
To Strauss & Corbin (1998) most of authors use qualitative methodology probably
hoping that the work could have impact or potential relevance for both academic and
nonacademic environment.
Usually a Case Study goes beyond simple and easy observation and testimonials. It
represents real examples of how organizations can accomplish their goals and, at the same
time, satisfies their customers (Duarte (2010)).
To understand relevant situations for a Case Study research strategy, Yin (2002)
proposes to explore questions like “how” and “why” in order to establish certain values in
contemporary events.
Following the same thought line, this Case Study represents a real organization, with
its activities and daily routines for provided IT services (projects and software
development).
The information included in this chapter takes part of SME archival records,
documentations and website (examples of source evidences described by Yin (2002)).
These were the sources of evidence allowed by the company (described in Table 4).
Sources of Evidence Examples
Documentation Letters, memoranda, agendas, minutes of meetings, other written reports of
events, proposals, progress reports, formal studies, evaluations, newspaper
clippings and so on.
Archival Records Computer files, service records (number of clients), organizational records
(charts and budgets), maps (layouts), list of names, survey data (census
records), personal records (calendars, diaries) and so on.
Direct Observations Observe relevant behaviors or environmental conditions, meetings,
sidewalk activities, factory work, classrooms and so on (passive observer).
Physical Artifacts Technological device, tool or instrument, work of art, physical evidence
and so on.
Table 4 – Important Sources of Evidence
Source: Oneself adapted from Yin, R., 2002, p.85-96

42
Since its debut in Information Systems and Innovation Management, SME has been
working on several projects and areas such as: outsourcing, document management,
innovation, consulting, business intelligence and portals.
Mission: develop innovative solutions in the areas of Information Technology,
advance Communication Design and contribute toward development of customers, partners
group and employees.
Vision: to be a reference point and a source of innovation in the Information System,
technology and innovation area.
The values associated with this SME are:
1. Promote respect, responsibility, team spirit and human development and
professional employees;
2. Assist and contribute to ensure the effectiveness and improve the efficiency of the
SME customers and partners;
3. Social Responsibility and sustainability;
4. Culture of innovation and future technology perspectives.
SME service solutions are established between Design and Communication
(websites), IT services (i.e. Business Intelligence (BI) and Customer Relationship
Management (CRM)).
This organization has two hierarchical levels (Illustration 9) with a total of 11
employees, including top management. Note: the number is variable because it depends on
projects’ dimension; human resources can be from Outsourcing environment):
Top Management: the owner;
IT, Finance and Human Resources Departments (2 Department Chiefs).

43
Illustration 9 – SME Organogram
Source: Oneself, 2012
With the present time crisis and impact of new forms of technology on any
organization daily work, the SME top management is interested in further necessary
changes to methods which may help to improve the organization skills and achievements.
Working on different technology environments, the SME must use only what is
essential to accomplish the standard established and agreed in the early meetings with
customers and meet the deadline.
As a first approach the IT Department was chosen to start implementing Lean
concepts and 5S/6S Technique. The choice was made because the study provides the use of
Lean techniques related to Information Technology and it works with the core business of
the organization.
To start and prepare the Case Study, the first step is that the author meets with the
top management and with the responsible for the IT Department to identify what is
expected for the event; however this work is usually performed by a team of experts in
Lean methodologies. In this particular case the author is the responsible to present the case,
share perspectives, concepts to be learnt and produce the Case Study. It should be seen as a
singular form of management implementation.
This particular department is an open space area where 6 employees are constantly
discussing about new projects, deadlines and improvements on their work.

44
There is no boundary about what specifically each one of them should work on,
which equipment is important to complete their tasks and there is no implemented
desktop/archival standard so that anyone involved on a particular project has immediate
access to security copies, documents and developed code (if it is a software development
project).
The first contact should be to explain to the IT Department personnel why it is so
important to try new methods to improve their work. Resistance to change is critical to
achieve goals and future work perspectives.
After introducing some Lean concepts, the author explains what is 5S/6S work
technique, how is it done, its purpose and benefits and also demonstrates with proof such
as pictures or documentation of previous work areas where this technique was already
used.
Untidy workplace areas seem obviously waste but what it is not so obvious is that it
also affects business performance. When we detect and measure how waste affects the
operations we can also estimate the cost associated and the price of keeping specific waste
on the process flow. And it is fundamental to remember that to eliminate or decrease waste
is one of the pillars of Lean.
It is also important to set a list of rules so that human resources will keep doing their
work without external interference.
After technique implementation and results analysis (Chapter 5.1.1.), we shall expose
the conclusions and future work perspectives with 5S/6S Technique in Chapter 6,
including new approaches to other departments and top management.

45
5. Data Analysis and Discussion
Author is the main process manager used for the analysis of a Case study. This
instrument makes use of its intuitive function to do detailed analysis, recognize the
influence of context, investigate and focus on the problem at and.
Another important function of systematic observation is interpretation and its goal is
to reformulate the case according to the process flow and seek for improvements.
After systematic observation and consultation of the archived records, author must
be able to apply the “Five S Work Area Form” (Appendix 2):
Level one: “Just Beginning”;
Level two: “Focus on Basics”;
Level three: “Make it Visual”;
Level four: “Focus on Reliability”; and
Level five: “Continuously Improve”.
However, it should be noted that to achieve all five levels a large amount of time is
necessary, improvements are incrementally brought to the organization and future results
measurements are time consuming. Therefore, in order to achieve relevant results within
the time-frame of this project, the “Five S Work Area Form” was applied up to level three.
In other words, the results obtained from this analysis reflect the current position and
strategy of the organization according to the application of the “Five S Work Area Form”
from level one to three.
5.1. Case Study: Application of 5S/6S Technique in a SME
According to Yin (2002) there are at least 6 forms of evidence for a case study
(Table 4, Chapter 4). For the purpose of this project, and after previous literature review
about 5S/6S Technique, the case study was divided in three main parts that enabled the
analysis of the SME: documentation and archival records, systematic observation and
application of 5S/6S form. Please note that due to confidentiality issues, some information
regarding this SME could not be displayed in this document at this time (some illustrations
are not readable).

46
Documentation and Archival Records
The first step to be carried out is data collection. For this purpose, it is detrimental
that author understands how the IT Department works and what substantial references
exist that enable the distinction of standard projects and software development.
Author should further analyse the methodology applied to accomplish the cycle time
established for each project or software development and verify if all documents are used
according to each project specifications.
Most of the IT Department information is available in an unlocked cabinet
(Illustration 10). Therefore, everyone (within the organization) can have access to
documentation, processes and information about the developed projects (Information
Commissioner’s Office has data protection and security measures for organizations,
personal data or official information for the public that should be adopted on IT
organizations). Furthermore, there is little content in digital format and there is no control
over the accessibility of certain files.
Illustration 10 – Cabinet with Archival Records
Source: Oneself, 2012

47
Systematic Observation
At this stage of the case study it is important to develop a workplace layout, take
pictures of the area (to compare between before and after the application of the technique)
and identify where the highest visual waste in the process flow is (i.e.: in individual
workplace organization). Then, for the identification and understanding of the location of
major problem, 6S evaluation (Appendix 1) is applied.
From the first evaluation of the IT Department, August 2012, the following was
observed:
In general, Sort (Organization), Stabilize (Set in Order / Orderliness) and Shine
(Cleanliness) are the most problematic areas. There is a necessity to remove some
superfluous items and identify accurately all work areas and work procedures;
Several problems arose when posing the following questions: Have all
unnecessary items been removed? Is there a place for everything? Are work areas,
equipment, tools, desks clean and free of debris, etc.?;
The non-problematic areas were: employees adhere to changes, there is a system
and audit feedback in place and the safety equipment is well identified and accessible
providing zero incidents.
One of the identified areas in need of a possible reorganization was the computer
screen, as it should only be visible what is necessary to work and respond to certain
procedures (Illustration 11).
Illustration 11 – Personal Computer Screenshot
Source: Oneself, 2012
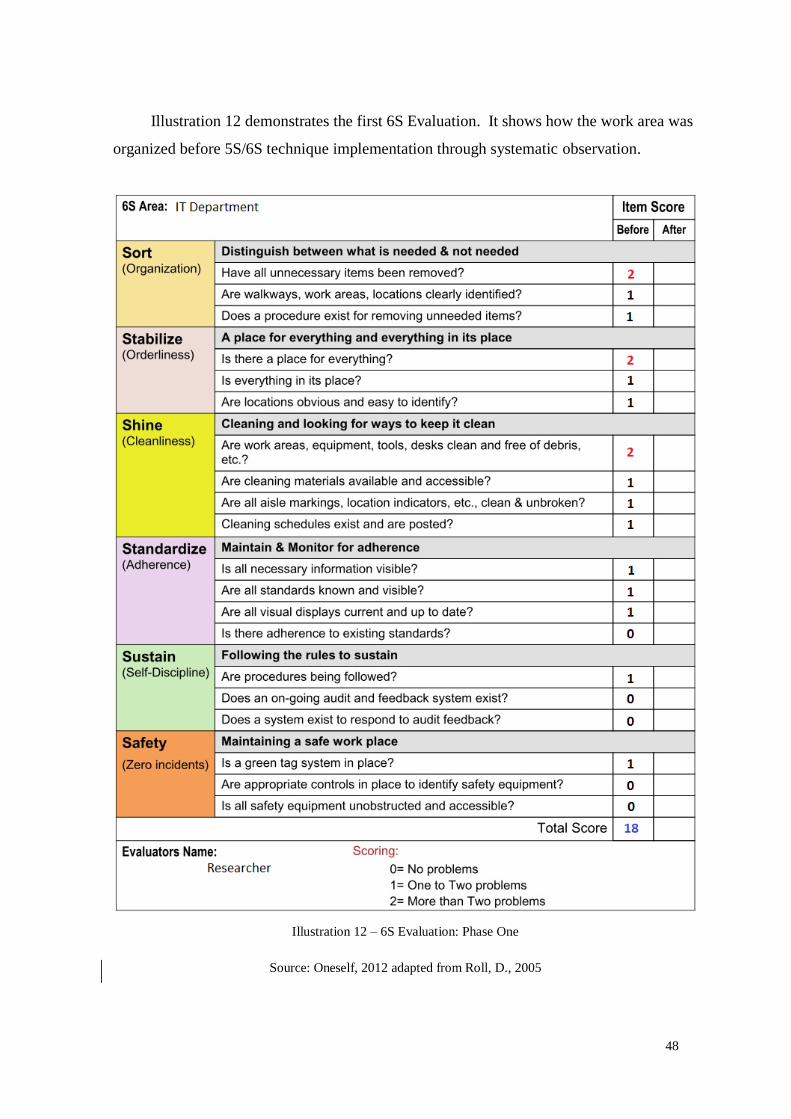
48
Illustration 12 demonstrates the first 6S Evaluation. It shows how the work area was
organized before 5S/6S technique implementation through systematic observation.
Illustration 12 – 6S Evaluation: Phase One
Source: Oneself, 2012 adapted from Roll, D., 2005

49
From Illustration 12 it is visible that the total score for phase one of the 6s Evaluation
is of 18, this is not bad, but it could be improved. Although, there was already a notion of
organization of documentation and keeping visible and safe what is important, some
problems still need to be removed to improve the process flow. The aim is to reduce the
number and try to have a cleaner organization with less wastage.
In order to compare the impact of the 5S/6S technique on this particular IT
Department, the same 6S Evaluation was carried out after the application of the “Five S
Work Area Form” (levels one, to three), enabling the visualization and measurement of the
differences between the before and after the 5S/6S implementation..
Five S Work Area Form
Each level of the “Five S Work Area Form” studies the 5S methodology: Sort (Seiri),
Set in Order (Seiton), Shine (Seiso), Standardize (Seiketsu) and Sustain (Shitsuke). Note
that the sixth S (Safety) is reflected on the other S perspectives and that it is always
inherent to each step of the process.
Examples of the 5S methodology are as follows:
Seiri: organize workstations objects, data servers, software versions, archived
records, old reports, security copies and reduce code (when, in developed software, code,
variables, methods, functions and classes that are unutilized can be found);
Seiton: organize projects according to workstations layout, archival structure,
reduce dependencies and layout for common workspace area;
Seiso: clean physical workspace area and archival records on developed software
that is crucial to solve failures and bugs on tests;
Seiketsu: reduce complexity through the cycle time to facilitate posterior
maintenance, safe copies on a constant basis and build patterns for workspace area;
workstation should only have the essential resources to execute a determined project;
Shitsuke: maintain discipline using standard procedures.
Prior to the 5S/6S evaluation, an introduction was given to top management and IT
regarding this dissertation proposal to solve some management problems through Lean
techniques. After one week it was approved that the IT Department could be used as a case
study.

50
During this period there was a continuous exchange of information about Lean
examples and other case studies (mostly in industrial environments).
The first “Five S Work Area Form”, level one was applied in August 2012
(Illustration 13).
Illustration 13 – 5S Work Area Form: Level One
Source: Oneself, 2012 adapted from Leading Edge Group, 2012

51
It took two weeks to analyse and work through the different phases that are listed
below:
First phase: present concepts of Lean principles, types of waste, Lean techniques,
5S/6S, games and videos. The training session took two days.
Second phase: analyse documentation and archived records and systematic
observation.
Third phase: define and identify physical waste and locate equipment in the
surrounding area which includes safety equipment, cleaning equipment, and so on.
After the IT Department evaluation it was time to start working on the environment
that needs to be transformed into a Lean project. Level one was the first step and its goal
was to make employees aware of the IT Department responsibilities and encourage them to
look at new ways of thinking about their work, to improve workflow and work
environment. It is worth noting that some cleaning aspects, supplies and diagrams of daily
cleaning responsibilities are secured through outsourcing.
The completion of level one led to a defined workplace area and an inventory of
computers, files, archival records, backups, diagram of responsibility of each project
deadline and a communication and decision plan.
The interrogation mark – ‘?’ – on the 5S Work Area Form (Illustration 13) represents
the questions that are being reorganized constantly or that are not yet established at this
level. For instance, who is responsible for the different work areas locations and what
groups are responsible for the communication are not yet represented because the first goal
is to elucidate employees, organize workplace and then start to think about procedures and
other responsibilities.
One example of waste was found on workplace organization (Illustration 14).
Illustration 14 is a typical desktop on this IT Department. Even though, current workplace
methods do exist, it can change according to each project (project or software
development).
Due to the on-going changes, methods have not yet been completely defined:
different types of software development are in different processing stages and a corporate
portal was two weeks away being released online due to test phase.

52
Illustration 14 – Disorganization and Unnecessary Items
Source: Oneself, 2012
Projects and software should be released and compared to enable definition of what
is necessary to accomplish tasks, process flow and files.
5.1.1. Results
After applying Systematic Observation via 6S Evaluation and starting to work with
level one from 5S Form, it took three weeks to consider and implement some criteria,
define whether items were required or not, remove redundant equipment, and determine
each item location in the workflow process.
This evaluation began in September 2012 and three phases were implemented in
order to accomplish this particular level:
First phase: logical waste detection on developed projects and programming, and
team meeting to consider errors and problems;
Second phase: documentation perception according to existing projects;
integration of tools that provide a structured environment with less waste (project
management using Microsoft Excel is not sufficient to eliminate waste and decrease cycle
time);
Third phase: tags (colours or patterns) to locate necessary and unnecessary
equipment.

53
Through Illustration 15 it is possible to visualize that from level one to level two
evaluations, Sorting, Set in Order and Cleaning became easier to manage. The challenge
was not in visualizing where waste was but in understanding if that waste was necessary or
not.
Illustration 15 – 5S Work Area Form: Level Two
Source: Oneself, 2012 adapted from Leading Edge Group, 2012

54
Items that promote waste but are necessary to the work process flow should have a
specific holding area and should only be moved and integrated in the process flow when
necessary. If no consensus is achieved on this matter, there will be no improvement in the
work process flow and standardization will become very difficult. It is challenging to
document agreements and check acceptable Key Performance Indicators (KPIs) if there is
no notion of needed items.
Some of the KPIs discussed to evaluate labour costs and possible improvements are:
Work quality (procedures; software quality);
Meeting deadlines (planned dates);
Re-work (coding; information/data not available in time);
Additional employee effort (wasted non-planned time; re-work);
Communication issues (technology; remote communication);
Security risk (standard utilization; logical and physical security);
Intellectual property risk (loss or gain of knowledge); and
Organization brand (marketing).
Another concern is with the cleaning management. Employees should be aware of
their responsibilities within their work area boundaries. When they gain notion about what
is necessary for the work and where it should be located, the process cycle time will
decrease because there is no wasted time searching for files, software or records.
Hereafter, when emphasizing the social responsibility value, some items could be
donated to aid and solidarity institutions. For instance, unused office computer, equipment
and office supplies.
Workplace organization begins with personal employees’ desktops. Items are
grouped according to frequency and purpose of their use (Illustration 16).
.

55
Illustration 16 – Organization with Necessary Items
Source: Oneself, 2012
There was no previous standard for colour-coding and no one is obliged to use visual
colours or markers. If each employee meets the established order through visual code
standard which is displayed in Illustration 16 there will be no difficulty to use proper
equipment (including software and documentation) from anyone involved in a specific
project. And all equipment is accessible in less than 30 seconds. This illustration takes into
account an individual workplace with equipment necessary to work on two projects
(yellow mark has Digital Versatile Disks (DVDs) with software being used for the
development of code) and one portal (green mark has the website being tested). Within
blue mark is the documentation that needs to be filled according to each project or
software.
In order to progress to level three and prior to making everything visual, it was
necessary to work with the head of the development team on standard documents with
content about the rules and procedures for each type of project.
The search for templates for standard documents led to a discussion of the
advantages and disadvantages of standardizing according to the 5S/6S technique
evaluation. Even though, it was not the initial idea and it was not part of the evaluation
technique, the ISO/IEC 25010:2011 certification turned out to be a good form of
evaluation of the influence of the 5S/6S technique and documentation on this particular IT
Department that develops the core product for this SME.
ISO/IEC – Systems and Software Engineering – Systems and Software Quality
Requirements and Evaluation (SQuaRE) – System and Software Quality Models (former

56
ISO/IEC 9126-1:2011 – Software Engineering – Product Quality) analyses and validates
the quality model of any IT project, code development and information systems.
The International Standard Organization defines that quality in a used model is
related to a product within a particular context. It is applicable to computer system and
software products. The use of quality models can benefit activities on product development
such as:
Identifying software and system requirements, design objectives, testing
objectives, quality control criteria;
Validating the comprehensiveness of requirement’s definition; and
Establishing measures to quality characteristics.
The targets of ISO/IEC 25010:2011 quality models are shown by Illustration 17. This
would be helpful to coordinate standard documents from the IT Department.
Illustration 17 – Targets of Quality Models
Source: ISO, 2011
According to ISO/IEC 25010:2011 (2011, p.4) “the product quality model focuses on
the target computer system that includes the target software product, and the quality in use

57
model focuses on the whole human-computer system that includes the target computer
system and target software product”.
With 5S/6S evaluation determined by PDCA cycle and standards’ approach
regarding ISO/IEC 25010:2011 validation it became clear that entire organization must be
aware of implications and methods re-evaluation to accomplish this certification and its
possible impact on organization brand: software and projects with certificated quality.
Before this analysis, all project resources were defined and visualized on elementary
Microsoft Excel spreadsheets (Illustration 18) and communication between team leaders,
stakeholders and customers were made by email (Illustration 19).
Illustration 18 – Microsoft Excel Projects’ Screenshot
Source: Oneself, 2012
It should be emphasized that these screenshots are not legible due to organization
confidentiality issues. Project requirements, scheduling, data exchange and associated
resources cannot be exposed and shared with third parties.

58
Illustration 19 – Screenshot of Communication Between Stakeholders
Source: Oneself, 2012
With the aim of supporting computer system and target software product, this
particular IT Department established two document management platforms (Microsoft
SharePoint (Illustration 20 e 21) and Microsoft Project – using team knowledge about
Microsoft tools) to process each developed project, stakeholders, files, meetings and
deadlines (logging in to projects is managed by team leaders; only those who work in a
specific project have access to information about its development). Further, Microsoft
SharePoint manages a wide range of data and permissions.
The team leader and consequently, the SharePoint Site leader, needs to perform
constant checks on permissions, updates and deadlines to ensure that the confidentiality of
each project is maintained. This Microsoft tool allows the team manager to create new
forms, documents, links to test software, websites and work areas.

59
Illustration 20 – Microsoft SharePoint Screenshot
Source: Oneself, 2012
The diagrams from Microsoft Project 2010 (Appendix 3) will help to visualize and
meet deadlines according to rules previously adopted. Microsoft (2012) says that Project
2010 “visually select the right mix of resources – it’s as easy as grab and drop with the
new team planner. Enhance team collaboration to realize results – connect your teams
with Microsoft SharePoint”.
Website management will be carried out by the team manager who will ensure that
benefits are assigned according to projects’ specifications, requirements and aggregate
resources.

60
Illustration 21 – Microsoft SharePoint: Users and Permissions’ Screenshot
Source: Oneself, 2012
The benefits of the above mentioned Microsoft tools are as follows:
Decrease the number of archives and projects portfolio (less paper, less amount of
items). If necessary, DVDs copies can be used as backup for future reference;
Remote communication between stakeholders without spending an excessive
amount of time in physical meetings (resources and project information to be developed
must be present on Microsoft SharePoint and references to deadlines are updated through
Microsoft Project); and

61
Both platforms are associated with PDCA cycle for software development.
Improvements on each evaluation must be implemented on software and shared between
Microsoft SharePoint and Microsoft Project (PDCA cycle is reflected on 5S/6S technique).
Regarding the use of the above mentioned Microsoft tools, it was firstly discussed
with the team about responsibilities delegation and how to establish the patterns for
Microsoft SharePoint users, their role and communication via Microsoft Project
(Illustration 22), updates (resources, schedule, responsibilities) and the data exchange at
real time. It is important to keep both tools at the same information level so that procedures
are followed in the right direction, without compromising projects delivery.
Illustration 22 – Microsoft Project Screenshot
Source: Oneself, 2012
Secondly, after having established concepts and rules to software development and
other projects, each Microsoft tool was adapted according to workers’ needs to fulfil
deadlines and reporting.

62
Microsoft Project was integrated with Gantt charts on PDCA cycle and resources
aggregated to each step of the process flow. For instance, for the step “Plan” the outlined
responsibility is to analyse documentation, verify process flow, and define meetings and
necessary equipment to start work on projects.
With the development of the case study it necessary to understand the evaluation
differences between 5S Work Area Form: Level Two versus Level Three (Illustration 23).
Illustration 23 – 5S Work Area Form: Level Three
Source: Oneself, 2012 adapted from Leading Edge Group, 2012

63
This evaluation level began at the end of September 2012 and was implemented in 5
weeks:
First phase: integration tests of new Microsoft tools (SharePoint and Project);
remote access, data exchange and communication tests between IT Department manager,
stakeholders and customer.
Second phase: customers collaboration on platform tests, errors and bugs
detection.
Third phase: production of standard documentation to developed and future
projects in accordance with ISO/IEC 25010:2011software model quality.
Sort, Set in Order and Shine were not the priority at this level. Previous levels had a
greater focus on physical waste elimination and part of the work was done on an
outsourcing basis (Illustration 23).
Waste was also on unnecessary items of a project: software used on other ended
project; all kind of documentation on employee’s desktops and some rework because not
all of them were aware of certain projects’ development.
At this stage of the evaluation it was critical to start standardizing some documents,
procedures and resources distribution in Microsoft SharePoint and Microsoft Project.
Documentation and visual controls are associated with diagrams in Microsoft Project
and with Microsoft SharePoint reporting.
The next team meeting was to clarify questions, unsolved issues and understand
employees’ motivation. It was also time to carry out another employee evaluation
regarding to their expectations, facility to work with Microsoft tools and communication
between them and other stakeholders.
Scheduling, graphic reports and updated information are fundamental to
understanding of whether a project is being well implemented and within the budget.
Errors, problems and opportunities must be examined and then improved through PDCA
cycle. It is necessary to prioritize problems that need solving.
The final 6S Evaluation (Illustration 24) brought significant differences to the
process flow: unnecessary items do not have place in this philosophy although some items
need to be stored for use by sporadic projects.
Score shows that 50% of visual problems, bugs and errors were removed from the
process flow: work areas and equipment location are colour-coded or follow a certain
64
pattern; locations are obvious and easy to identify according to each project; security
procedures and equipment are visible and functional.
Illustration 24 – 6S Evaluation: Final Phase
Source: Oneself, 2012 adapted from Roll, D., 2005

65
However, due to 5S Work Area Form evaluation being carried out only up to level
three, some patterns were not totally accomplished:
Standard documentation to all procedures including Microsoft tools (reporting,
graphics and resources);
Visual displays were established on employees’ desktop and cabinet (where now
unnecessary items or items that are not usually necessary to the process flow are stored)
but a full Tag System (“a method for ensuring a safe workplace. The system prescribes
that each piece of equipment is inspected for compliance with safety standards with regard
to its construction and current condition”, Roll (2005)) is yet to be adopted by this IT
Department.
Krueger (2004) talks about Red Tag System as part of the Sort step (moving items to
holding areas). Red Tag process has a specific label for each item (Illustration 25) and it
targets inventories, equipment, furniture, storage, clutter, and so on.
Illustration 25 – Red Tag System
Source: Krueger, K., 2004, p.5
The final evaluation (up to level three) has shown significant changes on the IT
Department workplace and particularly, benefits the nonphysical aspect from a
technological environment: the organization of software and developed projects through
new work tools. Using 5S/6S represents a small percentage of Lean tools but as an
experimental thematic on this particular context (taking into account organization
dimension) it revealed that it is possible to reorganize technology and work with less waste
and more added value.

66

67
6. Conclusions and Future Work Perspectives
This chapter summarizes the work carried out to complete the master degree in
Organizational Information Systems.
Chapter 6.1. resumes the importance of Lean/ Lean IT to an organization and
provides answers to the research question “How could 5S/6S add value to an
organization?” and Chapter 6.2. analyses the impact of 5S/6S Technique in one specific IT
Department and what would be the future work perspectives for other departments or even
the entire organization.
6.1. Conclusions
The fundamental Lean measurement is the cycle time; it is what feeds the system
level indicator and its processing capacity. It is through cycle time that the waste can be
discovered. Cycle time is influenced by the implementation process, therefore, each
failure or bad implementation will increase the cycle time. It should also be noted that the
definition of waste can vary, depending on problem to be solved and on the understanding
of who is trying to solve the problem.
In this project, a standard approach was used to interpret the problem, this involved
defining the problem, analysing the situation, creating hypotheses, running tests or
releasing prototypes, verifying results and monitoring. This approach was found to be a
good way of optimizing the entire organization whilst respecting people, increasing
knowledge and integrating quality in internal processes. Further, it was found that services
and software should be made quickly; taking into consideration the developed standards;
and that commitment and process waste elimination contributed to the clarification and
pursuit of the improvement plan.
It has also be seen that a reliable and repeatable cycle time should be established for
each project and then reduced through continuous improvement, for this purpose it has
been found that human resources play a crucial part in the time reduction and increased
value. For such cooperation the organization should perpetuate quality services and
reformulate patterns whenever it benefits the whole department/organization.
68
Time reduction is important as it is reflected on meeting deadlines, quantity of
productive work, delivery speed and proper resources use.
This project concludes that Lean development meets the cycle time analysis and
customer satisfaction and that the true challenge resides in solving internal problems on a
process flow such as delays, waste, and so on; and in the optimization of the necessary
resources to accomplish goals. Focus should rely on the processes efficiency, capacity to
respond quickly to any demand, customer value and knowledge.
Another concern for any organization is the financial return that comes from each
project (ROI) through monitoring outcomes. Development teams should be aware of the
financial implications and work towards decision making that respects associated
costs/benefits.
With this project, it was possible to approach Lean to IT environment, being this just
the initial step (nonetheless, bearing in mind that the general Lean evaluation and
techniques are already widely respected and well implemented in different sectors). Even
though concepts can vary, they can still be adjusted to analyse the environment and fix
possible problems. Lean principles and types of waste are integrated in IT perspectives
providing the relevant tools to the understanding of the process flow and improved results.
Indeed, Lean IT may be complementary to Information Technology Infrastructure
Library (ITIL) (“ITIL is the most widely accepted approach to IT service management in
the world. ITIL provides a cohesive set of best practice…” by APM Group Ltd (2012)),
Green IT (“Green IT refers to the study and practice of using computers and IT resources
in a more efficient and environmentally responsible way.” by McCabe (2009)) and
ISO/IEC 20000 standards (“ISO/IEC 20000…allows companies to demonstrate excellence
and prove best practice in IT management.” by APGM International (2012)).
When applying 5S/6S technique in an IT environment it was possible to understand
how the workspace area could be organized and visualized so that the time consuming
waste decreases and other problems could be solved within the process flow.
After the initial studies about Lean technique, principles, types of waste, IT and the
implementation in a particular IT Department, the results responded positively to the

69
research question “How could 5S/6S add value to an organization?”. It was observed that
this addition of value could be achieved through the organization of the process flow,
resources, physical workspace area, communication with other departments and focus on
each step of the developed software or service.
There are various other techniques recommended to be applied in IT environments,
however, for his case study the focus was on the application of the 5S/6S technique as it
served as an example of Lean technique application. Nonetheless, it would still be
interesting to apply other techniques and compare them (for instance, Kanban, Kaizen and
so on).
5S/6S technique focus is on the work process. Is useful to organize archival records
(physical or nonphysical), decrease cycle time (gaining time on deadlines), and involve
employees on their work environment. As a Lean methodology 5S/6S helps to produce
products (in this case, software or developed projects) that add value to customers.
6.2. Future Work Perspectives
The IT Department is not the only one that accumulates waste and cost money to any
organization. Like other departments it is necessary to coordinate all the resources
according to each project.
5S/6S technique is one of the possible Lean methodologies that could be applied to
IT environment. Work space area is adjusted as the main physical space to work on IT
projects but it is crucial to pay also attention to technology equipment and software
management. After applying 5S/6S technique on development environment (up to level
Three evaluation) significant improvements were detected:
Rapid and effective utilization of files required for a project evaluation;
Re-distribution of work according to specific skills of each human
resource/project skills;
Mechanics for internal IT Department communication and other stakeholders (for
example, daily meetings with 15 minutes to discuss what was previously done and what is
missing to accomplish deadlines);

70
Constant communication between the Project Manager and customers, reporting
mini tests or prototypes of the project and receiving feedback (through Microsoft
SharePoint and Microsoft Project tools);
Metrics such as number of projects delivered in time, accomplish of personal team
motivation to each project, registration of errors, bugs, delays, and so on.
All these improvements must be measured and analysed preferentially with statistical
software. To understand what is written and what should be the evaluation, the chief
department and top management are crucial to the process. The final improvement
decisions are made by them.
But it is necessary to understand that this evaluation must continue up to Level Five
in order to emerge a method to share and implement improvement ideas across other areas
and determine common methods and standards. When all the possible improvements are
implemented, tested and documented, it is time to raise the level and try new IT,
Innovation and Management Certificates which fall into IT environment and development.
It will collaborate to enhance marketing, brand, sales and customer trust. Metrics and
benefits can be replicated to other departments and that is how Lean philosophy will spread
to the entire organization.
5S/6S technique will also help to write standard documents and evidence to
accomplish ISO/IEC 25010:2011 certification. Hereafter, to achieve this certification it is
necessary to accomplished all evaluation levels.
All processes should be supported on PDCA cycle (described on this dissertation on
Chapter 2.2 about dimensions of Lean IT studied by Bell & Orzen (2010)).
It works as a concept that helps to plan, act and revise concepts. The search is for
continuous improvement on the process flow, following the sequence below:
Plan: identity work team, problems, waste, deadlines; analyse definitions, causes
and start to work on resolutions (plan must contemplate customers and other stakeholders
involved on the process);
Do: communicate with team, understand team responsibilities, design diagrams
with responsibilities, deadlines and sprints (amount of work to each step); develop an
resolution plan (according to each project or software development) and execute it;
Check: control and monitor all process flow steps, for instance, document
management, remote communication and necessary items;

71
Act: analyse results; rework on defects; improve standards (if possible).
According to Orticio (2010), “…combined with PDCA cycle, also called the Deming
Cycle, 5S/6S ensures continuous quality improvement starting from the top of the
corporate ladder”. PDCA is a continual cycle, meaning that it is always important to
return to “Plan” step and start to think again about improvements on specific projects.
When all departments are covered by this paradigm, we can call the entire
organization as a Lean environment, with standard procedures, less waste, achieved KPIs,
always seeking for improvements, motivated employees and satisfied customers.

72

73
References
Aalst, W. (2003). Business Process Management: A Survey. BPM'03 Proceedings of the
2003 international conference on Business process management, Berlin, Germany, URL:
http://www.springerlink.com/content/9yh5wyawlwv20uae/fulltext.pdf.
Addintools (2012). Demo of Classic Menu for Project 2010 and 2013. Available in: n.a.,
n.a., 2012, URL: http://www.addintools.com/office2010/project/demo.html.
Ambler, S. & Kroll, P. (2011). IBM – Applying agile and lean principles to the governance
of software and systems development. Available in: May, 05, 2011, URL:
http://www.slideshare.net/ibmrational/applying-agile-and-lean-principles-to-the-
governance-of-software-and-systems-development.
Aitken, A. (2010). Lean: Concepts and Realities. Available in: December, 19, 2010, URL:
http://www.lanner.com/en/pdf/lean_and_lanner.pdf.
APMG-International (2012). A Guide to our Qualifications. Available in: n.a., n.a., 2012,
URL: http://viewer.zmags.com/publication/8df99afd#/8df99afd/29.
APM Group Ltd (2012). Welcome to the Official ITIL® Website. Available in: September,
9, 2012, URL: http://www.itil-officialsite.com/.
Bell, S. (2006a). Lean Enterprise Systems: Using IT For Continuous Improvement. New
Jersey: John Wiley & Sons Inc.
Bell, S. (2006b, April). Time Fence Secrets: Uncovering the bridge between planning and
lean execution, APICS Magazine, p. 1-3.
Bell, S. (2011a). Lean Business – IT Integration, Part One: Who wants to go talk to IT
about this one?. Available in: August, 8, 2011, URL:
http://www.lean.org/common/display/?o=1900.
Bell, S. (2011b). Lean Business – IT Integration, Part Two: Obstacles to Value Stream
Transformation. Available in: October, 15, 2011, URL:
http://www.lean.org/common/display/?o=1951.
Bell, S. (2012). Chapter 1: In Pursuit of Growth and Innovation. Run Grow Transform:
Integrating Business and Lean IT. New York: Productivity Press.
Bell, S. & Orzen, M. (2010). Lean IT: Enabling and Sustaining Your Lean Transformation.
New York: Productivity Press.
Bowen, G. (2005). Preparing a Qualita+tive Research-Based Dissertation: Lessons
Learned. The Qualitative Report, 10: 208-222.

74
Bresko, M. (2009). The 5S Method of Improvement - Enhancing Safety, Productivity and
Culture. Up Time Magazine, Number n.a., 42-45. Available in: August/September, 2009,
URL:
http://www.nxtbook.com/nxtbooks/reliabilityweb/uptime_20090809/index.php?startid=42.
Carpenter, T. (2009). Lean Information Technology. Available in: February, 25, 2009,
URL: http://www.sysedco.com/index.php/professional-skills-library/10-leanit.
Caseau, Y. (2011). Lean Enterprise 2.0. 1st European Lean IT Summit, Paris, France.
Citynetevents (2012). Course: Implementation System Guidance – (TPM – Total
Productive Maintenance). Available in: n.a., n.a., 2012, URL:
http://www.citynetevents.com/saigon/courses/course-implementation-system-guidance-
tpm-total-productive-maintenance-november-16th-2012.
Ci&T (2012). Lean IT. Available in: 2011, URL: http://www.ciandt.com/br-pt/proposta-
de-valor/lean-it.
Comer, S. (2012). To Do More with Less, Consider Lean IT. Available in: February, 28,
2012, URL: http://www.cunacfocouncil.org/news/4668.html.
ComputerWorld (2008). Lean IT Organization. Available in: September, 11, 2008, URL:
http://computerworld.uol.com.br/gestao/leticia_costa/idgcoluna.2008-09-11.8177144844/.
Cottyn, J., Stockman, K. & Van Landeghem, H. (2008). The Complementary of Lean
Thinking and the ISA 95 Standard. WBF, The Organization for Production Technology
2008 European Conference, Barcelona, Spain.
Cunningham, J. & Jones, D. (2007). Easier, Simpler, Faster: Systems Strategy For Lean
IT. New York: Productivity Press.
Curran, C., Legnine, S. & Boudrow, R. (2009). The Skinny on Lean IT – CIO Dashboard.
Available in: August, 07, 2009, URL: http://www.ciodashboard.com/it-management/the-
skinny-on-lean-it/.
Daft, R. (2008). Using IT for Coordination and Control. Organization Theory and Design,
10th
Edition (pp. 294-330). USA: Cengage Learning. URL:
http://www.google.pt/books?hl=pt-
PT&lr=&id=CmFjF5tNmuEC&oi=fnd&pg=PR19&dq=scientific+area+organizational+inf
ormation+systems&ots=XqyLxLGVs5&sig=gT9WA6OHDENCiHVlq0SMg4JKQg8&red
ir_esc=y#v=onepage&q&f=false.
Duarte, S. (2010). O Método (do estudo) de caso. Available in: August, 16, 2010, URL:
http://www.slideshare.net/PROFESSORSERGIODUARTE/como-fazer-um-estudo-de-
caso.

75
Duarte, T. (2009). A possibilidade da investigação a 3: reflexões sobre triangulação
(metodológica), CIES e-Working Papers, p. 1-24. URL:
http://repositorio.iscte.pt/bitstream/10071/1319/3/CIES-WP60%20_Duarte.pdf.
EPA – United States Environmental Protection Agency (2011). The Lean and Chemicals
Toolkit. Available in: 2011, URL:
http://www.epa.gov/lean/environment/toolkits/chemicals/ch5.htm.
Eriksson, P. (2011). The role for IT – support in Lean concepts: A qualitative study of
municipalities (1ª ed.). Trollhättan (Sweden): University West, Institution of Economy and
IT.
Guedes, J. (2011). Introdução de conceitos Lean às Tecnologias de Infomação: um caso de
estudo em Banca. Porto (Portugal): Universidade do Porto, Faculdade de Engenharia –
FEUP. URL: http://repositorio-aberto.up.pt/bitstream/10216/58841/1/000146278.pdf.
Guidon Performance Solutions (2009). LeanSigma Information Technology. Available in:
December, 14, 200, URL: http://www.slideshare.net/guidon/lean-information-technology-
webinar.
Günther, H. (2006, May/August). Pesquisa Qualitativa Versus Pesquisa Quantitativa: Esta
é a Questão?. Psicologia: Teoria e Pesquisa, 2: 201-210.
Gupta, S. (2008). How to Shrink Your Waste with Lean IT. Available in: October, 06, 2008,
URL: http://www.eweek.com/c/a/IT-Management/How-to-Shrink-Your-Waste-with-Lean-
IT/.
Haaster, R., Hoogenboom, P., Ingen, J., Knoben, V., Overkamp, P., Romijn, K. & Vermeij,
R. (2010, 3rd
November). Lean for Jet Support, University of Applied Sciences Amsterdam:
Domain Technology – Aviation Studies, p. 1-10.
Hibbs, C. & Jewett, S. (2010). Lean Software Development: One Step at a Time. 22nd
Systems & Software Technology Conference (SSTC), Salt Lake City, United States of
America.
Hirano, H. (1995). 5 Pillars of the Visual Workplace. Portland: Productivity Press.
Hoppen, N., Lapointe, L. & Moreau, E. (1996, November). Um Guia para a Avaliação de
Artigos de Pesquisas em Sistemas de Informação, REAd, p.1.
Information & Research Instruction Suite – IRIS (2009). Research Process. Available in:
August, 28, 2009, URL:
http://www.clark.edu/Library/iris/types/research_process/research_process.shtml.
ISO (2011). ISO/IEC 25010:2011 – Systems and Software Engineering – Systems and
Software Quality Requirements and Evaluation (SQuaRE) – System and Software Quality
Models. First Edition. Geneva: International Standard.

76
Jones, D. (2011). Scoping Lean IT: Asking the right questions. 1st European Lean IT
Summit, Paris, France.
Krueger, K. (2004). The Red Tag System Used in the 5S Process. Available in: n.a., n.a.,
2012, URL: http://www.wisc-online.com/objects/ViewObject.aspx?ID=eng10703.
Leading Edge Group (2012). 5S – Work Area Form. Available in: n.a., n.a., 2012, URL:
http://www.findtoyou.co.id/freexls/get/MRdK666D/5s-work-area-form-leading-edge-
group.html.
Lean Enterprise Institute (2009). What is Lean?: Principles of Lean. Available in: 2009,
URL: http://www.lean.org/WhatsLean/Principles.cfm.
Loader, N., Mijatovic, D. & Kompier, H. (2011). Lean IT Foundation Training –
Supporting publication. Lean IT Foundation, 1: 1-9, URL:
http://www.goodsense.nl/documenten/Lean_IT_Foundation_Publication_v1_0.pdf.
Llebrand, N., Mesoy, T. & Vlemmix, R. (2010). Using IT to enable a lean transformation.
McKinsey on Business Technology, 18: 1-3.
Mack, N., Woodsong, C., MacQueen, K., Guest, G. & Namey E. (2005). Qualitative
Research Methods Overview. Qualitative Research Methods: A Data Collector’s Field
Guide (pp. 1-12). North Carolina: Family Health International.
McCabe, L. (2009). What is Green IT, and Why Should You Care?. Available in:
December, 30, 2009, URL:
http://www.smallbusinesscomputing.com/testdrive/article.php/3855806/What-Is-Green-IT-
and-Why-Should-You-Care.htm.
McDonald, M. (2010). A model for the Lean IT organization. Available in: June, 25, 2010,
URL: http://blogs.gartner.com/mark_mcdonald/2010/06/25/a-model-for-the-lean-it-
organization/.
McKendrick, J. (2010). Eight steps to achieve ‘lean IT’. Available in: December, 27, 2010,
URL: http://www.zdnet.com/blog/service-oriented/eight-steps-to-achieve-lean-it/6346.
McMahon, T. (2008). An Introduction to 6S. Available in: September, 11, 2011, URL:
http://www.slideshare.net/ALeanJourney/introduction-to-6s.
Medina, R. (2011). Lean IT in a nutshell. 1st European Lean IT Summit, Paris, France.
Melville, N. (2010). Information Systems Innovation For Environmental Sustainability.
MIS Quartely, 1: 1-21.
Microsoft (2012). Microsoft Project 2010. Available in: n.a., n.a., 2010, URL:
http://www.microsoft.com/project/en-us/project-management.aspx.

77
Murtonen, M. (2005). Learning of Quantitative Research Methods – University Students’
Views, Motivations and Difficulties in Learning (1ª ed.). Turku (Finland): Faculty of
Education, University of Turku.
Naveed, K. (2009). Organizational Information System. Available in: February, 20, 2009,
URL: http://www.slideshare.net/naveedtaji/organizational-information-system.
Neves, J. (1996, 2nd
Semester). Pesquisa Qualitativa – Características, Usos e
Possibilidades, Caderno de Pesquisas em Administração, p. 1-5.
Nicoletti, B. (2011, 4th
August). Lean and digitize sourcing, Journal of Internet and
Information System, p. 35-42. URL:
http://www.academicjournals.org/jiis/PDF/Pdf2011/Oct/Nicoletti.pdf.
Orticio, R. (2010). The PDCA-5S Cycle. Available in: December, 31, 2010, URL:
http://www.brighthubpm.com/methods-strategies/101396-the-pdca-5s-cycle/#imgn_3.
Orzen, M. (2011). Lean IT From Theory to Application: Moving beyond the what to the
how!. 1st European Lean IT Summit, Paris, France.
Orzen, M. & Bell, S. (2010). Lean IT as a Factory?. Available in: December, 23, 2010,
URL: http://www.lean.org/common/display/?o=1717.
Othman, S. (2011). Qualitative vs Quantitative Research. Available in: April, 9, 2011,
URL: http://shayaaresearch.blogspot.com/2011/04/qualitative-vs-quantitative-research-
v.html.
Philbrick, H. (2008). The Select-a-Seal Edge. Available in: December, 03, 2008, URL:
http://www.slideshare.net/Harbrick/5-s-intro-presentation.
Popescu, L., Zerbes, M., Blaj, M., Pascu R. & Blaj, R. (2010). Research Regarding the Use
of Quality Tecniques and Instruments in View of Maintaining and Improving Quality
Management Systems. Tehnomus Journal, 17: 239-244. URL:
http://www.fim.usv.ro/conf_1/tehnomusjournal/pagini/journal2011/files/40.pdf.
Poppendieck, M. & Poppendieck T. (2006). Implementing Lean Software Development:
From Concept to Cash. USA: Addison-Wesley Professional.
Raichura, B. & Rao, V. (2009, April). Lean IT Transformation: Reduce Total Cost of
Ownership, Guarantee Quality-of-Service and Achieve Business Agility, Infosys –
Building Tomorrow’s Enterprise, p. 1-6.
Riezebos, J. & Klingenberg, W. (2009a, May). Advancing lean manufacturing, the role of
IT in, Computers in Industry, p. 235-236.
Riezebos, J., Klingenberg, W. & Hicks, C. (2009b, May). Lean Production and information
technology: Connection or contradiction?, Computers in Industry, p. 237-247.

78
Roberts, R., Sarrazin, H. & Sikes, J. (2010). Reshaping IT management for turbulent times.
Available in: December, 2010, URL:
http://www.ihrim.org/Pubonline/Wire/Dec10/ReshapingITManagement.pdf.
Roll, D. (2005). An Introduction to 6S. Available in: February, 13, 2005, URL:
http://www.vitalentusa.com/learn/6s_article.php.
Sacks, R., Koskela, L., Bhargav, D. & Doven, R. (2010). Interaction of Lean and Building
Information Modeling in Construction. Journal of Construction Engineering and
Management, 9: 968-980.
Sanli, O. (2010). Management Issues in Information Technology. Available in: n.a., n.a.,
2010, URL: http://oyasanli.com/Sanli.pdf.
Saxena, A. (2009). The 5S Technique and Kaizen. Available in: February, 8, 2009, URL:
http://pt.scribd.com/doc/18014670/The-5-S-Technique-and-Kaizen.
Shaya’a, O. (2011). Mix Qualitative & Quantitative Research : Benefits of Combining
Qualitative & Quantitative Methods. Available in: April, 9, 2011, URL:
http://shayaaresearch.blogspot.pt/.
Scherrer-Rathje, M., Boyle, T. & Deflorin, P. (2009, Januray/February). Lean, take two!
Reflections from the second attempt at lean implementation, Business Horizons, p. 79-88.
Schmidt, J. (2009). 10 Weeks to Lean Integration. Available in: January, 14, 2009, URL:
http://blogs.informatica.com/perspectives/index.php/2009/01/14/10-weeks-to-lean-
integration/.
Silva, E. & Menezes, E. (2005). Metodologia da Pesquisa e Elaboração de Dissertação (4ª
Edição revisada e actualizada), Florianópolis: Universidade Federal de Santa Catarina,
URL: http://www.portaldeconhecimentos.org.br/index.php/por/content/view/full/10232.
Spanos, N. (2012). Why is application maintenance necessary?. Available in: March, 26,
2012, URL: http://www.leanitblog.com/lean-it/why-is-application-maintenance-necessary/.
Stake, R. (2011). Pesquisa Qualitativa: estudando como as coisas funcionam. Porto
Alegre: Penso.
Strauss, A. & Corbin, J. (1998). Basics of Qualitative Research: Techniques and
Procedures for Developing Grounded Theory (Second Edition). California: Sage
Publications.
Sutherland, W., Goulson, D., Potts, S. & Dicks, L. (2011). Quantifying the Impact and
Relevance of Scientific Research, PLoS ONE. 11, 1-10. Available in: November, 16, 2011,
URL:
http://www.plosone.org/article/fetchObjectAttachment.action;jsessionid=627BC51D9A6E
79
510C5BA2FAEB8451D552?uri=info%3Adoi%2F10.1371%2Fjournal.pone.0027537&am
p;representation=PDF.
Vedpuriswar, A. (2010). Lean Product Development. Available in: November, 12, 2010,
URL: http://ebookbrowse.com/lean-product-development-doc-d24266170.
Venitz, U. (2011). Lean Management. Available in: July, 14, 2011, URL:
http://pt.scribd.com/sbeuria/d/60000910-Lean-Management.
Veraszto, E., Silva, D., Miranda, N. & Simon, F. (2007, July/December). O Atual Processo
de Globalização e as Novas Tecnologias da Informação e Comunicação, SANTA LÚCIA
em revista, p. 21-27.
Wainer, J. (2007). Métodos de pesquisa quantitativa e qualitativa para a Ciência da
Computação. JAI 2007 – Jornadas de Atualizações em Informática, Rio de Janeiro, Brazil.
Watson, R. (2007). Information Systems. 1st Edition. Georgia: Global Text Project. URL:
http://globaltext.terry.uga.edu/userfiles/pdf/Information%20Systems.pdf.
Wegner, P. (1996). Interoperability. ACM Computing Surveys (CSUR), 28: 285-287. URL:
http://delivery.acm.org/10.1145/240000/234424/p285-
wegner.pdf?ip=193.137.47.114&acc=ACTIVE%20SERVICE&CFID=84800716&CFTOK
EN=40769694&__acm__=1329216904_72ce278f0b34c298b2db93033b93c3fa.
White, J. & Chaiken, S. (2008, May). Lean Information Technology Service Management:
Bottom-Up Process Improvement that Addresses the Bottom Line, Contract Management,
p. 22-28. URL: http://www.ncmahq.org/files/Articles/CMApr08p22.pdf.
Womack, J., Jones, D. & Roos, D. (1990). The Machine That Changed The World: The
Story of Lean Production – Toyota’s Secret Weapon in the Global Car Wars That is Now
Revolutionizing World Industry. Edition 2007. USA: Free Press.
Womack, J. & Jones, D. (1996). Lean Thinking: Banish Waste and Create Wealth in Your
Corporation, Revised and Updated (Edition 2003). USA: Free Press.
Yin, R. (2002). Case study research: design and methods (3rd
Edition). USA: Sage
Publications. URL: http://pt.scribd.com/doc/39240596/1Yin-Case-Study-Research-3rd.
Zhang, J. (2004). Using ICT to Prepare Learners for the 21st Century: The Perspectives of
the Eastern APEC Economies. APEC Summit on Educational Innovation: "Striking
Balance: Sharing Practice from East and West", Beijing, China.
*n.a. means not available

80

81
Appendix
Appendix 1: 6S Evaluation by Don Roll

82
Appendix 2: Five S Work Area Form by Leading Edge Group
Appendix A: Level One

83
Appendix B: Level Two

84
Appendix C: Level Three

85
Appendix D: Level Four

86
Appendix E: Level Five

87
Appendix 3: Demo Microsoft Project 2010 by Addintools