lean manufacturing undercarriage inspection at asiatrak · lean manufacturing – undercarriage...
TRANSCRIPT
1
Lean Manufacturing – Undercarriage Inspection
at AsiaTrak
Major Qualifying Project Report
submitted to:
The Faculty of Worcester Polytechnic Institute (WPI
In partial fulfillment of the requirements for the
Degree of Bachelor of Science
By:
Nolan Murphy
Tuan Pham
Joe Thomas
In Cooperation With:
Huazhong University of
Science and Technology
With Project Partners:
Dong Qui
Hao Lu Approved By:
Haoliang Yang
Co-Advisor: Professor Liang Gao
______________________________
Advisor: Professor Yiming Rong
August, 2009
2
Abstract
AsiaTrak manufactures and assembles undercarriage components for Caterpillar in Tianjin, China. Assemblies are shipped to Caterpillar and original equipment manufacturers (OEM) customers primarily located in China and Japan. The project focuses on two types of inspection
processes, receiving and process inspection, for the undercarriage components. The company would like to know if their current lab inspection frequency and overall process is efficient or
not. The goal of the project is to maintain AsiaTrak’s production quality while lowering inspection frequency.
3
Acknowledgements
We would like to thank AsiaTrak Ltd. (ATL) for sponsoring this project and hosting us in Tianjian.
We would also like to thank Link Lin, Gary Yerby, Aileen Wang, Paul Tan, Bill Zhou and the people at CMT for their constant assistance throughout the entirety of this project; without
them we would not have been able to complete this project. We would also like to thank Huazhong University of Science and Technology (HUST) for their
hospitality. Although our stay on campus was short, we thoroughly enjoyed it and are
extremely grateful. Finally, we would like to thank Professor Rong for setting up this project
between WPI and HUST and providing us with advice and guidance throughout the project.
4
Table of Contents Abstract .............................................................................................................................................2
Acknowledgements............................................................................................................................3
1.0 Introduction ..............................................................................................................................6
2.0 Background ...............................................................................................................................7
2.1 Lean Manufacturing ..................................................................................................................7
2.1.1 Value Stream Mapping ........................................................................................................8
2.1.2 Spaghetti Chart .................................................................................................................10
2.2 Caterpillar ...............................................................................................................................10
2.2.1 Caterpillar Production System (CPS) ...................................................................................11
2.3 AsiaTrak Ltd. (ATL) - Tianjian ....................................................................................................11
2.4 China Material Technology (CMT).............................................................................................12
2.4.1 Process Inspection ............................................................................................................12
2.4.2 Receiving Inspection..........................................................................................................13
3.0 Methods ...................................................................................................................................13
3.1 Site Specific Problems..............................................................................................................13
3.1.1 Value Stream Maps (VSM) and Spaghetti Charting ..............................................................13
3.1.2 Evaluating and Comparing the Pre/Post Tempering of the Bushings .....................................14
3.1.3 Inner Depth and Outer Depth Bushing Problems from the Source ........................................15
3.2 Process Check Inspection Frequency ........................................................................................16
3.3 Receiving Inspection ................................................................................................................16
4.0 Results .....................................................................................................................................18
4.1 Site Specific Problems..............................................................................................................18
4.1.1 Value Stream Map (VSM)...................................................................................................18
4.1.2 Pre Tempering and Post Tempering Inspection Results........................................................19
4.2 Process Check Inspection Frequency ........................................................................................20
4.2.1 Process Inspection Cost Analysis ........................................................................................25
4.3 Receiving Inspection ................................................................................................................25
4.3.1 Risk Analysis .....................................................................................................................27
4.3.2 Batch Inspection Frequency and Risk Evaluation .................................................................30
4.3.3 Cost Saving Analysis ..........................................................................................................30
5.0 Recommendations ..................................................................................................................32
5
5.1 Site Specific Problems..............................................................................................................32
5.1.1 Value Stream Maps and Spaghetti Chart Recommendations ................................................32
5.1.2 Pre-Tempering and Post Tempering Recommendations ......................................................32
5.1.3 Outer Depth and Inner Depth Bushing Problem Recommendations .....................................33
5.2 Process Check Inspection Frequency ........................................................................................33
5.3 Receiving Inspection ................................................................................................................34
6. Conclusions ..................................................................................................................................34
References .....................................................................................................................................35
Appendix A: Bushings VSM...............................................................................................................36
6
1.0 Introduction In the world of business today, companies are continually competing with one another to produce with the best quality while at the same time making more of a profit. One way to
increase profit for a company while staying competitive in the market along with reducing cost
is to eliminate any unnecessary factors involved in the manufacturing process. This is accomplished through a variety of techniques. One method, is called lean manufacturing, which
is a process designed to reduce the time and effort it takes to make a product. Time, material waste, man power and idle equipment usage are all taken into account. The term “lean” can,
however, be used in any area of business and industry. For example, the relevant method of creating a more lean inspection process will be the basis of the WPI project team.
AsiaTrak manufactures and assembles undercarriage components for Caterpillar in Tianjin,
China. Caterpillar currently has thirteen technicians and two engineers committed to maintaining the quality inspection of AsiaTrak’s products. This inspection process of
undercarriage components at AsiaTrak has never been evaluated for efficiency. The company would like an analysis of their current inspection process evaluating whether the process is efficient or not in an attempt to reduce cost while maintaining quality.
The main component to the inspection process is the frequency of inspections that are deemed necessary. Since AsiaTrak spends approximately $100k annually on consumable materials to complete inspection, the unidentified necessary frequency of inspections must be analyzed. A large part of the inspection results are data driven and provided with statistical models designed to display the necessary manufacturing and sampling strength for the company.
Given that there has never been a full evaluation of the current inspection process there was much room for possible areas of recommendations that the project team could provide. The data that we have been given along with the data collected during our stay at the company in China were used to indicate what areas needed to be further evaluated and what areas of inspection were to be maintained. As we went from location to location and are actually able to view the process in live time we were able to provide our recommendations from a true outsider’s view, which we felt was most beneficial to all parties. The overall goal of this project was to reduce cost while maintaining by re-deploying or reducing inspection and to reduce
consumable expense and destroyed components. We were able to generate new frequencies after analyzing all the data and if placed in practice, could potential save the company a good
sum of money.
7
2.0 Background This section relates to all the basic background information necessary to working on such a project involving the idea of lean manufacturing. This section is essential for us to understand
the overall scope of our project, the process we are focusing on, as well as providing us an
initial direction of what to focus on.
2.1 Lean Manufacturing The process of Lean Manufacturing has been the main concern and issue of many manufacturing companies throughout the world. Many processes leading up to the final idea of lean manufacturing has influenced the process itself greatly such as: Interchangeable parts, Just in Time Production, the Ford Assembly line, and the Toyota Production Systems. Eli Whitney is considered to be the founding father of this process with his idea of interchangeable parts. Later on in the 1900s, Henry Ford introduced the idea of the assembly line; this built and
assembled his automobiles at a very rapid rate. From this, there has been much advancement in technology which has lead to faster production times and reduction of ineffectual
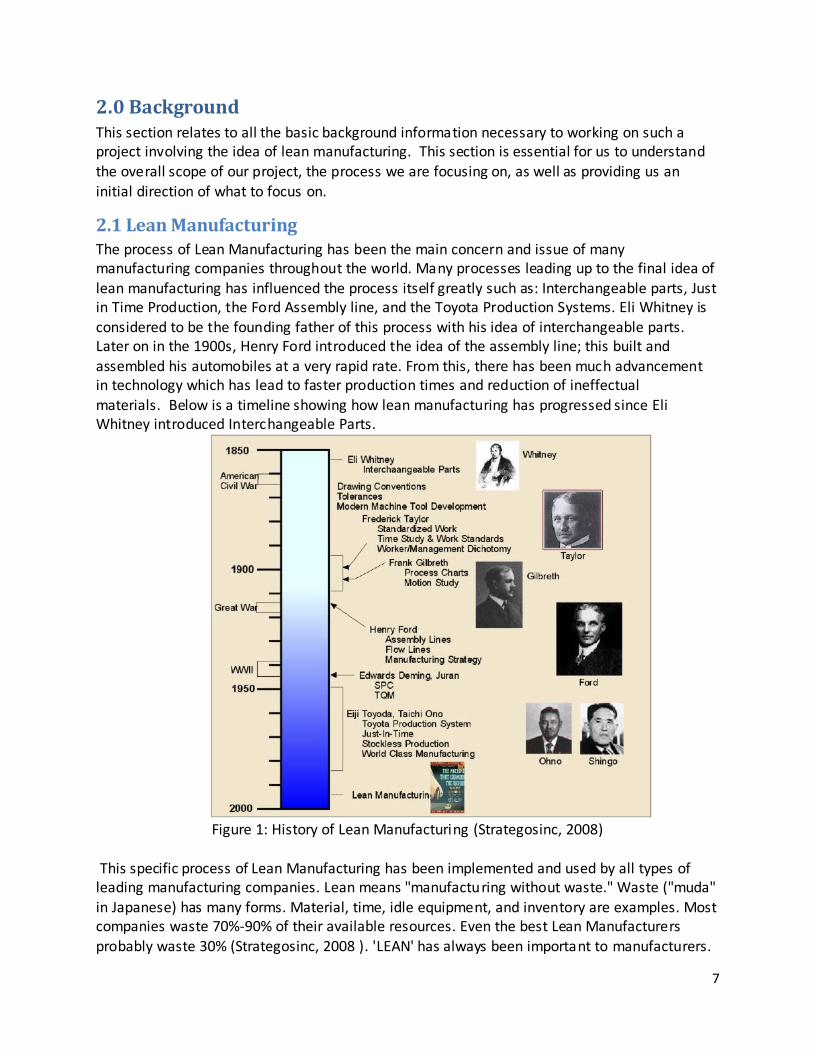
materials. Below is a timeline showing how lean manufacturing has progressed since Eli Whitney introduced Interchangeable Parts.
Figure 1: History of Lean Manufacturing (Strategosinc, 2008)
This specific process of Lean Manufacturing has been implemented and used by all types of leading manufacturing companies. Lean means "manufacturing without waste." Waste ("muda"
in Japanese) has many forms. Material, time, idle equipment, and inventory are examples. Most companies waste 70%-90% of their available resources. Even the best Lean Manufacturers
probably waste 30% (Strategosinc, 2008 ). 'LEAN' has always been important to manufacturers.
8
When you reduce inventories, assets, overhead, wait times and out-of-specs, you generally
increase profits. Simply put, lean manufacturing is a key contributor to high performance - the ability to consistently outpace competitors across economic cycles, industry cycles and
generations of leadership (Russell, 2006). Overall, this process improves the manufacturing time, reduces costs and the reduction of wastes and defects.
The Japanese began to look into improving the processing of lean manufacturing in depth. They
repeatedly used the word “Kaizen” which means improvement in Japanese. This strategy consists of continuous improvement of a system involving a whole company, or industry. This strategy, known as the Kaizen event, consists of using all members of a company, mapping the existing process, brainstorming on improvement and implementing these new ideas. The godfather of lean manufacturing was the Kaizen-based Toyota Production System (TPS). This system's underlying philosophy of continuous improvement became a blueprint for others - most notably Danaher Corporation, which turned it into the Danaher Business System (DBS). DBS operates on two levels. (Russell, 2006) In the Toyota Production System, the main goal is
to reduce waste. This waste consists of Material, time, idle equipment, and inventories are examples. TPS emphasizes the identification of waste (often problematic) followed by specific tools and techniques to eliminate it. TPS emphasizes the participation of all employees. It uses teams integrated with work cells for motivation, work management and problem solving (Strategosinc, 2008).
2.1.1 Value Stream Mapping
Value Stream Mapping (VSM), also known as Material and Information Flow Mapping , is a lean manufacturing technique that is used to analyze the flow of materials and information currently
essential to bring a product or service to a consumer . This thought visual based concept originated from the TPS and while it is most commonly used in manufacturing it is also used in
logistics, supply chain, service related industries, software development, and product
development. For the most part, it is used primarily to identify, demonstrate, and decrease waste (any activity that does not add value to the final product), as well as create flow in the
manufacturing process. Value-stream mapping provides a visual waste display to the manufacturers. Due to the value of what VSM can provide companies, it not just a
communication tool but also a strategy planning tool and a change planning tool.
Value-stream maps can be created by simply using paper and pencil. More complex maps complex maps are created using computer software such as Microsoft Visio or Microsoft Excel,
which allow the user to create more specific areas of the VSM down to smaller details in a faster time. VSM maps look somewhat like flow charts and an example of what one looks like
9
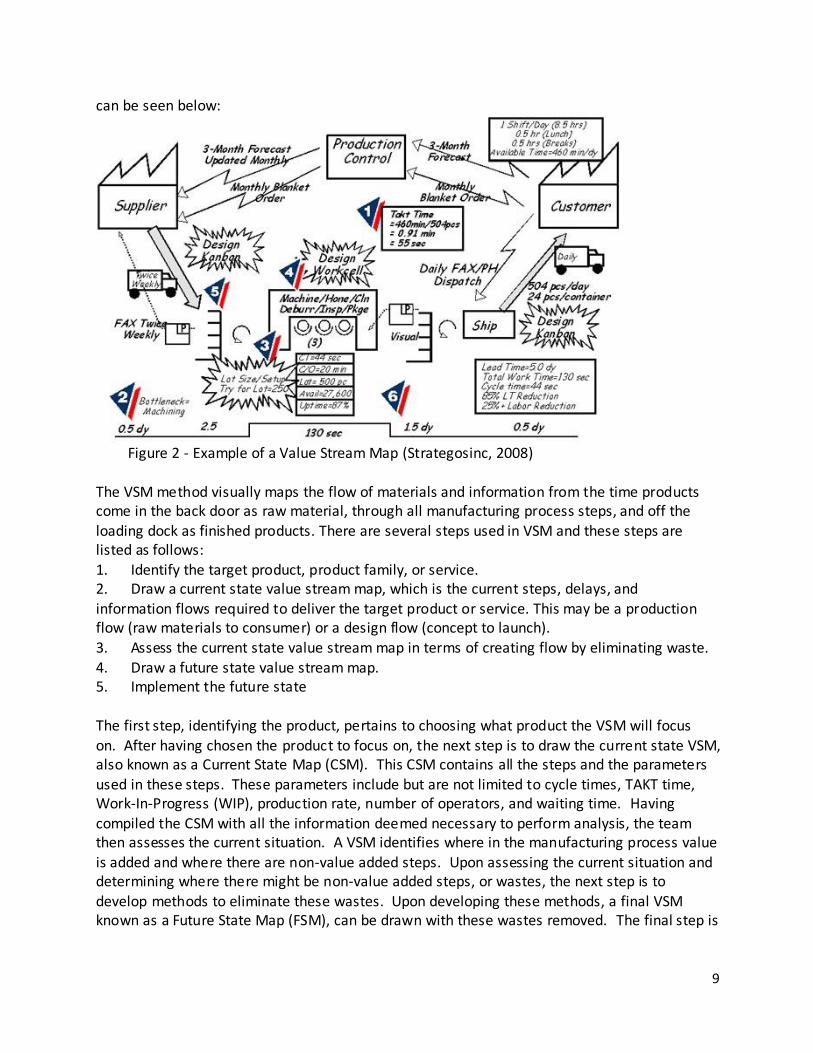
can be seen below:
Figure 2 - Example of a Value Stream Map (Strategosinc, 2008)
The VSM method visually maps the flow of materials and information from the time products come in the back door as raw material, through all manufacturing process steps, and off the loading dock as finished products. There are several steps used in VSM and these steps are listed as follows: 1. Identify the target product, product family, or service. 2. Draw a current state value stream map, which is the current steps, delays, and information flows required to deliver the target product or service. This may be a production flow (raw materials to consumer) or a design flow (concept to launch).
3. Assess the current state value stream map in terms of creating flow by eliminating waste. 4. Draw a future state value stream map. 5. Implement the future state The first step, identifying the product, pertains to choosing what product the VSM will focus on. After having chosen the product to focus on, the next step is to draw the current state VSM, also known as a Current State Map (CSM). This CSM contains all the steps and the parameters used in these steps. These parameters include but are not limited to cycle times, TAKT time, Work-In-Progress (WIP), production rate, number of operators, and waiting time. Having
compiled the CSM with all the information deemed necessary to perform analysis, the team then assesses the current situation. A VSM identifies where in the manufacturing process value
is added and where there are non-value added steps. Upon assessing the current situation and determining where there might be non-value added steps, or wastes, the next step is to
develop methods to eliminate these wastes. Upon developing these methods, a final VSM known as a Future State Map (FSM), can be drawn with these wastes removed. The final step is
10
to implement the changes so that the drawn FSM can be followed as closely as possible. This
will in turn make a more efficient lean manufacturing process.
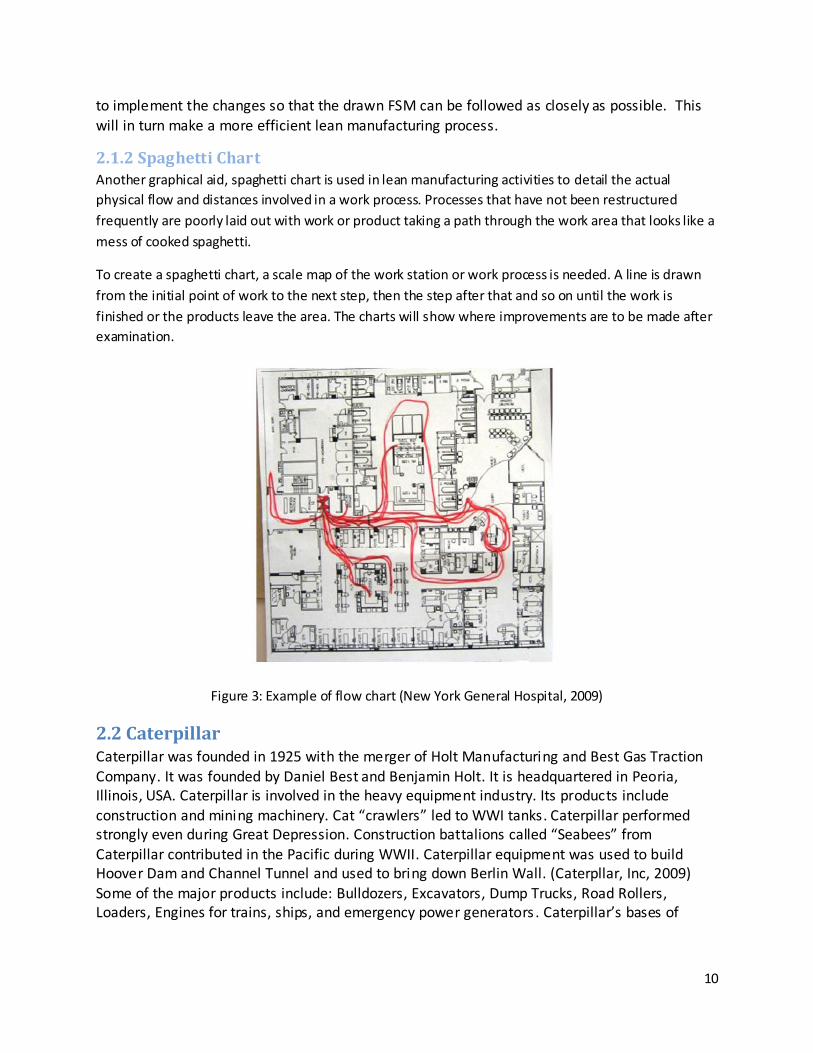
2.1.2 Spaghetti Chart Another graphical aid, spaghetti chart is used in lean manufacturing activities to detail the actual
physical flow and distances involved in a work process. Processes that have not been restructured
frequently are poorly laid out with work or product taking a path through the work area that looks like a
mess of cooked spaghetti.
To create a spaghetti chart, a scale map of the work station or work process is needed. A line is drawn
from the initial point of work to the next step, then the step after that and so on until the work is
finished or the products leave the area. The charts will show where improvements are to be made after
examination.
Figure 3: Example of flow chart (New York General Hospital, 2009)
2.2 Caterpillar Caterpillar was founded in 1925 with the merger of Holt Manufacturing and Best Gas Traction Company. It was founded by Daniel Best and Benjamin Holt. It is headquartered in Peoria, Illinois, USA. Caterpillar is involved in the heavy equipment industry. Its products include construction and mining machinery. Cat “crawlers” led to WWI tanks . Caterpillar performed strongly even during Great Depression. Construction battalions called “Seabees” from Caterpillar contributed in the Pacific during WWII. Caterpillar equipment was used to build Hoover Dam and Channel Tunnel and used to bring down Berlin Wall. (Caterpllar, Inc, 2009)
Some of the major products include: Bulldozers, Excavators, Dump Trucks, Road Rollers, Loaders, Engines for trains, ships, and emergency power generators . Caterpillar’s bases of
11
operation include: USA, China (Beijing, Tianjin, Suzhou, and Shanghai), Japan, England, Germany,
Brazil, and India.
2.2.1 Caterpillar Production System (CPS)
CPS is inspired by the Toyota Production System. Caterpillar has provided clarity to the future state of its business. It outlines that three of the top priorities as a company are Safety, Quality, and Velocity. The Caterpillar Production System was created to reinforce these priorities. It will help Team Caterpillar set the “gold standard” for the industry as they produce the highest
quality products, as efficiently and as safely as possible. (CAT 2020)
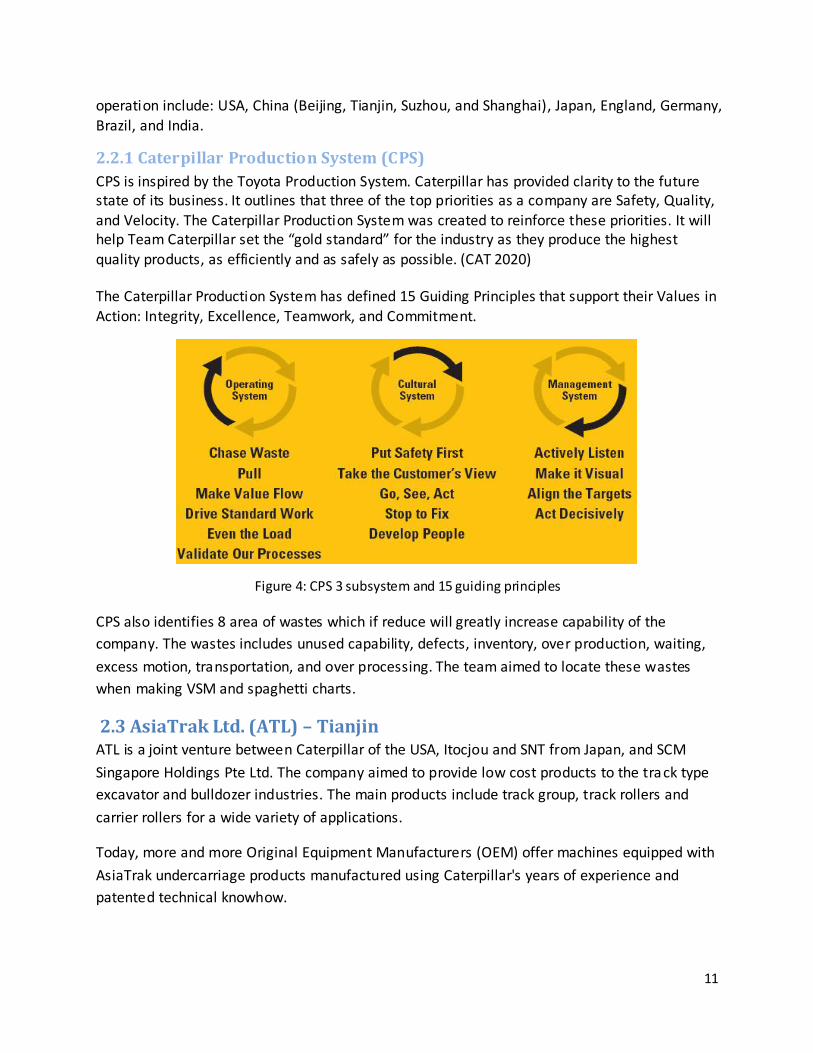
The Caterpillar Production System has defined 15 Guiding Principles that support their Values in Action: Integrity, Excellence, Teamwork, and Commitment.
Figure 4: CPS 3 subsystem and 15 guiding principles
CPS also identifies 8 area of wastes which if reduce will greatly increase capability of the
company. The wastes includes unused capability, defects, inventory, over production, waiting,
excess motion, transportation, and over processing. The team aimed to locate these wastes
when making VSM and spaghetti charts.
2.3 AsiaTrak Ltd. (ATL) – Tianjin ATL is a joint venture between Caterpillar of the USA, Itocjou and SNT from Japan, and SCM
Singapore Holdings Pte Ltd. The company aimed to provide low cost products to the track type
excavator and bulldozer industries. The main products include track group, track rollers and
carrier rollers for a wide variety of applications.
Today, more and more Original Equipment Manufacturers (OEM) offer machines equipped with
AsiaTrak undercarriage products manufactured using Caterpillar's years of experience and
patented technical knowhow.

12
2.4 China Material Technology (CMT) CMT supports Caterpillar’s operation by performing quality inspection which is the testing of a
product’s quality through various methods depending on the specific type of inspection. At
AsiaTrak, CMT performs several different types of quality inspections :
– Steel Pre-shipment Inspection, Receiving Inspection, Process Inspection, Daily
Inspection, Field Return Analysis, and Outsourcing Inspection
The team focused on two types of inspection, receiving inspection and process inspection.
These two types use destructive methods which mean the parts are destroyed in the inspection
process. This relate to our problem statement more than any other inspection types in terms of
cost, inspection time, and number of parts destroyed.
2.4.1 Process Inspection
At Caterpillar’s China Material Technology center (CMT) in Tianjin, process check inspection is
performed on components that are heat treated by AsiaTrak. Heat treating the components
gives them the specified material properties which enable them to withstand the different
forces during operation. CMT checks these properties to ensure that these components fall
within the specification. In this project, two components, bushings and links, were analyzed to
check for efficiency of the inspection process. These components have different properties due
to different heat treatment practices. The relevant properties for bushings are surface hardness,
hardened depth (inner depth and outer depth), and core-hardness. The relevant properties for
links are surface hardness, hardened depth, core-hardness, and Hardened-length (H-length).
The Process Inspection includes two parts:
1. Setup check during part change over
– The production lines wait for the preliminary inspection results before starting
up again when a new part number is introduced
2. Process Check every 8 hours after setup check is completed
– The production line continues uninterrupted
Results from the inspections are inputted into the Laboratory Reporting System (LRS) in the
CMT’s lab. LRS is a database containing all results from every type of inspections for the past 10
years. Data analyzed for this project were obtained from the LRS.
The capability of the heat treatment process was evaluated using the process capability index:
Cpk. Cpk is an index that measures how close a process is to its specification limits in relation to
the process spread. A high Cpk value means that the process meets it’s mean with minimum
variation. A process performing within minimum variation but skewed more toward one of the
13
specification limits instead of meeting the mean will result in a lower Cpk. A Cpk value of 1.33 is
the minimum acceptable value in machining processes for the process capability statistics. A
value less than 1 indicates that the process variation is wider than the specification range.
Nonetheless, for heat treatment processes, the company indicated that a Cpk value ranging
from 0.7 to 1 is acceptable since heat treatment processes are much harder to control in
comparison to machining processes.
A statistical program called Minitab is used to calculate the Cpk in this project. Minitab uses a
confidence level of 95% in the calculation of the Cpks. Along with the Cpk, Minitab also
calculate the expected performance in terms of nonconforming parts per million (PPM) based
on the inputted data. The expected performance is the expected number of nonconforming
parts with respect to the upper, lower, and both the specification limits out of a million parts.
The observed performance is the actual number of nonconforming parts with respect to the
upper, lower, and both specifications out of million parts in the process.
2.4.2 Receiving Inspection
Receiving inspection is the inspection of components received from suppliers to ensure quality.
If the quality is not up to AsiaTrak’s standard, the components will be sent back and a new
batch is sent to the company. AsiaTrak is currently inspecting every batch of parts they acquire
for the receiving check aspect of inspection.
3.0 Methods This section explains all the methods used during the project to collect data. Along with these
explanations are details pertaining to why we used these methods, the data we aimed to collect
from these methods, and what this data would be able to show.
3.1 Site Specific Problems The group was asked to analyze the current process to identify any problems that could
potentially eliminate unnecessary wastes. Several problems were identified and were analyzed
for possible solutions.
3.1.1 Value Stream Maps (VSM) and Spaghetti Charting
Since the Caterpillar engineers and employees had never been provided a full layout of the
inspection area along with other details of inspection we decided to focus on providing the
company with documentation similar to this. Value Stream maps and spaghetti charts seemed
to be the most logical for the time allotted to us as well as the purpose they would provide. In
order to make suggestions that can improve the production process of the undercarriage
products, we first had to understand how the production process works. We needed to see,
first hand, how all the steps worked and from there develop methods to collect data that the
14
company would find useful to make significant suggestions. Upon our arrival in Tianjin, one of
the first things we did was receive a tour of the entire production and inspection areas of
AsiaTrak and China Materials Technology laboratories. After having done the tour, the team
got together and determined what data we needed and what methods to use to collect the
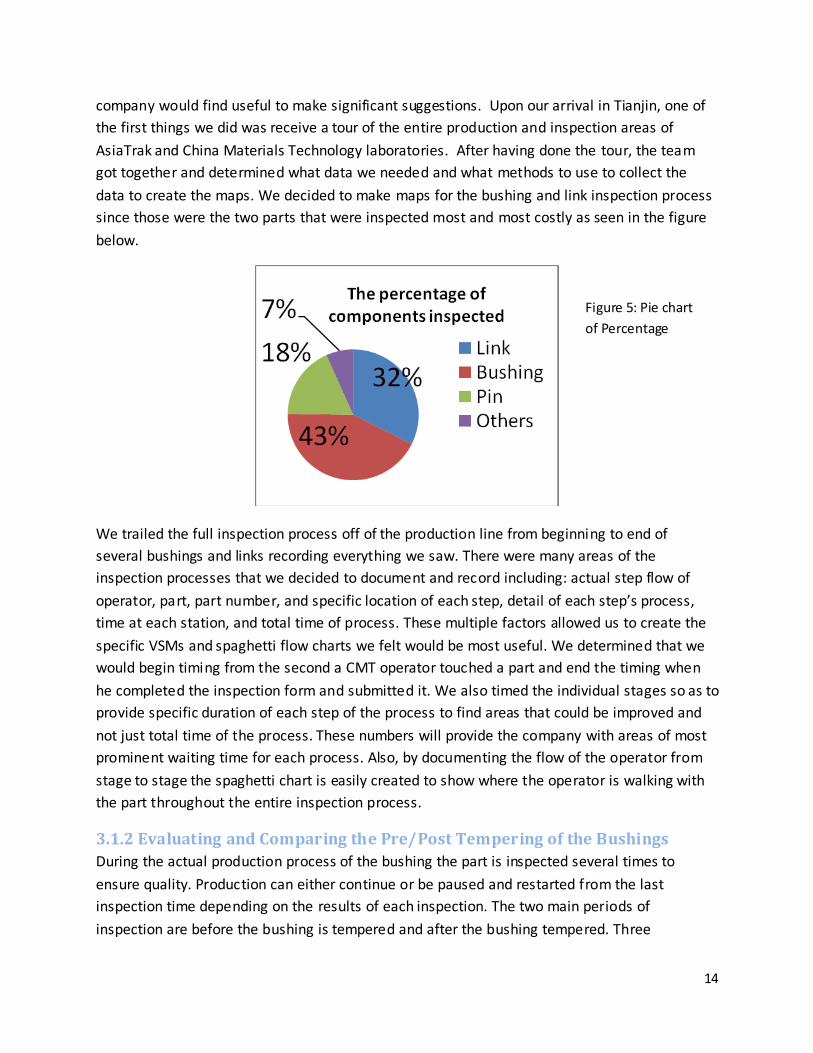
data to create the maps. We decided to make maps for the bushing and link inspection process
since those were the two parts that were inspected most and most costly as seen in the figure
below.
We trailed the full inspection process off of the production line from beginning to end of
several bushings and links recording everything we saw. There were many areas of the
inspection processes that we decided to document and record including: actual step flow of
operator, part, part number, and specific location of each step, detail of each step’s process,
time at each station, and total time of process. These multiple factors allowed us to create the
specific VSMs and spaghetti flow charts we felt would be most useful. We determined that we
would begin timing from the second a CMT operator touched a part and end the timing when
he completed the inspection form and submitted it. We also timed the individual stages so as to
provide specific duration of each step of the process to find areas that could be improved and
not just total time of the process. These numbers will provide the company with areas of most
prominent waiting time for each process. Also, by documenting the flow of the operator from
stage to stage the spaghetti chart is easily created to show where the operator is walking with
the part throughout the entire inspection process.
3.1.2 Evaluating and Comparing the Pre/Post Tempering of the Bushings
During the actual production process of the bushing the part is inspected several times to
ensure quality. Production can either continue or be paused and restarted from the last
inspection time depending on the results of each inspection. The two main periods of
inspection are before the bushing is tempered and after the bushing tempered. Three
Figure 5: Pie chart
of Percentage
15
properties are tested in between the tempering stage: outer depth, inner depth, and actual
hardened depth. After many conversations with the employees and engineers we were
informed that OD and ID were the two areas of inspection that had the most valuable
information regarding whether or not the part would either pass or fail the inspection. We then
met as a group and worked on finding a method of making a correlation between the two sets
of inspection results to see if there were any patterns. By doing this we could provide the
company with concrete data displaying any relationship between the pre and post tempering
inspection stages. This would potentially allow the company to make adjustments to the
inspection procedures saving time and eventually money. We would gather the results for a
three month period of the inner and outer depth for both before the tempering stage and for
after the tempering stage. We then decided to graph the results to show the correlation
between the two stages.
3.1.3 Inner Depth and Outer Depth Bushing Problems from the Source
During the setup check portion of the process inspection a new part number is introduced with
new settings and new parameters for heat treating. Since the majority of the tribulations occur
from the inner depth and hardened depth we decided to go to the actual production line to
possibly find out why. What we found was something of a simple yet complex problem all in
one. When the bushings are manufactured they go through a heat treatment process in which
they are placed in a metal fixture and heated with a coil for several minutes with certain
settings involved depending on the specific bushing number. The bushing is held by the fixture
and the coil is lowered down from an elevated position into the center of the bushing as seen
below………….
We were able to determine that the problem is located in the fixture and coil alignment. The
coil must be perfectly centered within the bushing when lowered to heat or else the coil will
touch the sides of the bushing causing the heated depth to produce off range results and
therefore fail inspection wasting the bushing from inspection, and the time that the production
line is down waiting for the results. We determined that this can happen as a result from two
separate scenarios happening. One scenario comes from the operator positioning the coil in the
wrong location or off center, causing the bushing and coil to touch during the heat treatment.
The second scenario is that over time the fixture holding the bushings can wear down around
the edges that are touching the bushing which can cause a small but significant gap between
the bushing and the fixture. With this gap existing when the coil begins to heat the bushing the
bushing fluctuates within the fixture and the coil touches the sides of the bushing causing the
failure.
16
3.2 Process Check Inspection Frequency The current inspection frequency for bushings is 2 bushings every 8 hours and for links it is 1
link every 8 hours. The inspection frequency is currently too high resulting in many areas of
wastes. Reducing the frequency means reducing the unnecessary wastes.
The team was tasked in calculating a new inspection frequency, one that was much lower than
the current. Inspection frequency was calculated using the monthly lot size (N), production rate,
and the Cpk as background information. Minitab was used to find the monthly Cpk of the heat
treatment process, first for bushings and then for links. Separate Cpks were calculated for
different part numbers. The months with highest production were chosen for the Cpk
calculation since they had the most amounts of inspection data in LRS (Laboratory Reporting
System). Most data means that the calculated Cpks would be closest to the actual one. The
default confidence level of 95 % in Minitab was used in all calculations.
At AsiaTrak, there are 4 induction machines for outside hardened depth heat treatment and 4
machines for inside hardened depth heat treatment. Monthly lot size was calculated from the
amount of time it takes for a machine to perform heat treatment of a single part. For each part
number a sample size code was identified in MIL-STD-105E, the US Military Standard of
Sampling Procedures and Tables for Inspection by Attributes, depending on the value of the
monthly lot size. Appropriate reduced monthly sample size based on the sample size code was
found using sample size equation and table from GB/T8051, New National (Chinese) Standard
for Sample Tests. A general Cpk for each part number was used in the sample size equation.
Reduced inspection frequency was calculated by dividing the total number of hours in a month
(720) by the monthly sample size. Inspection frequency is the number of hours between two
instances when parts are taken off the production line for quality analysis. Cost analysis was
performed to estimate the possible savings for the company.
3.3 Receiving Inspection Currently CMT inspects every batch of components from suppliers. The major components that
suppliers provide are pins and links. CMT chooses five parts from each batch for inspection and
perform destructive inspection on one out of the five. The other four inspections are non-
destructive.
There are two ways to possibly reduce the number of inspected parts in receiving inspection.
One is to reduce the number of inspected parts from each batch that is inspected and the other
is to reduce the number of inspected batches. One batch could consist of a few hundred parts
to a few thousand parts. Since only one part per batch is inspected destructively it is not
practical to reduce the number of parts inspected every batch. The data from 2008 indicates
17
that the pass rate for batches is very high. So the possibility to skip batches during inspection is
also high.
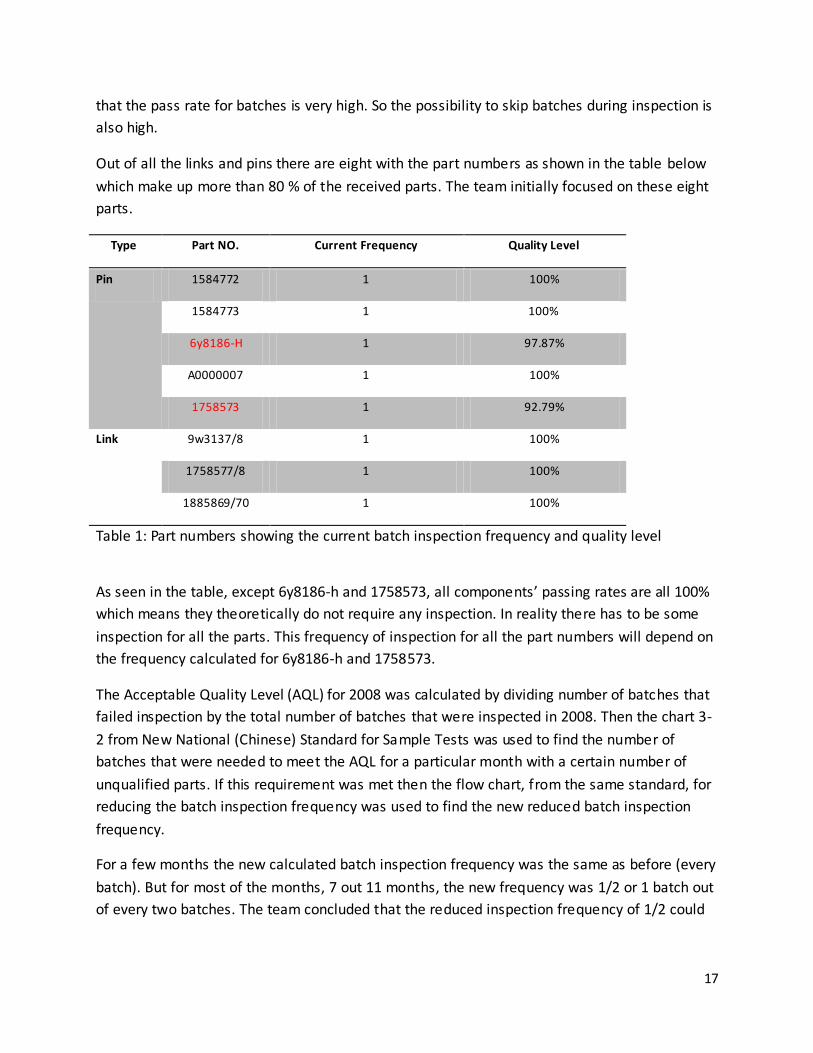
Out of all the links and pins there are eight with the part numbers as shown in the table below
which make up more than 80 % of the received parts. The team initially focused on these eight
parts.
Type Part NO. Current Frequency Quality Level
Pin 1584772 1 100%
1584773 1 100%
6y8186-H 1 97.87%
A0000007 1 100%
1758573 1 92.79%
Link 9w3137/8 1 100%
1758577/8 1 100%
1885869/70 1 100%
Table 1: Part numbers showing the current batch inspection frequency and quality level
As seen in the table, except 6y8186-h and 1758573, all components’ passing rates are all 100%
which means they theoretically do not require any inspection. In reality there has to be some
inspection for all the parts. This frequency of inspection for all the part numbers will depend on
the frequency calculated for 6y8186-h and 1758573.
The Acceptable Quality Level (AQL) for 2008 was calculated by dividing number of batches that
failed inspection by the total number of batches that were inspected in 2008. Then the chart 3-
2 from New National (Chinese) Standard for Sample Tests was used to find the number of
batches that were needed to meet the AQL for a particular month with a certain number of
unqualified parts. If this requirement was met then the flow chart, from the same standard, for
reducing the batch inspection frequency was used to find the new reduced batch inspection
frequency.
For a few months the new calculated batch inspection frequency was the same as before (every
batch). But for most of the months, 7 out 11 months, the new frequency was 1/2 or 1 batch out
of every two batches. The team concluded that the reduced inspection frequency of 1/2 could
18
be implemented with some risk. The next step was to calculate the ris k. The risk was calculated
using probability theory.
The above steps were repeated for all the other part numbers. Then the cost savings from
implementation of the new reduced batch inspection frequency was calculated.
4.0 Results This section contains all the results found during our data collection period. Not only did we
find the data we thought to expect, we also found some additional answers as well.
Throughout the project time period, we met weekly with our advisors at Caterpillar and CMT to
discuss what could be the reasons for some of these results we were coming up with.
4.1 Site Specific Problems
4.1.1 Value Stream Map (VSM)
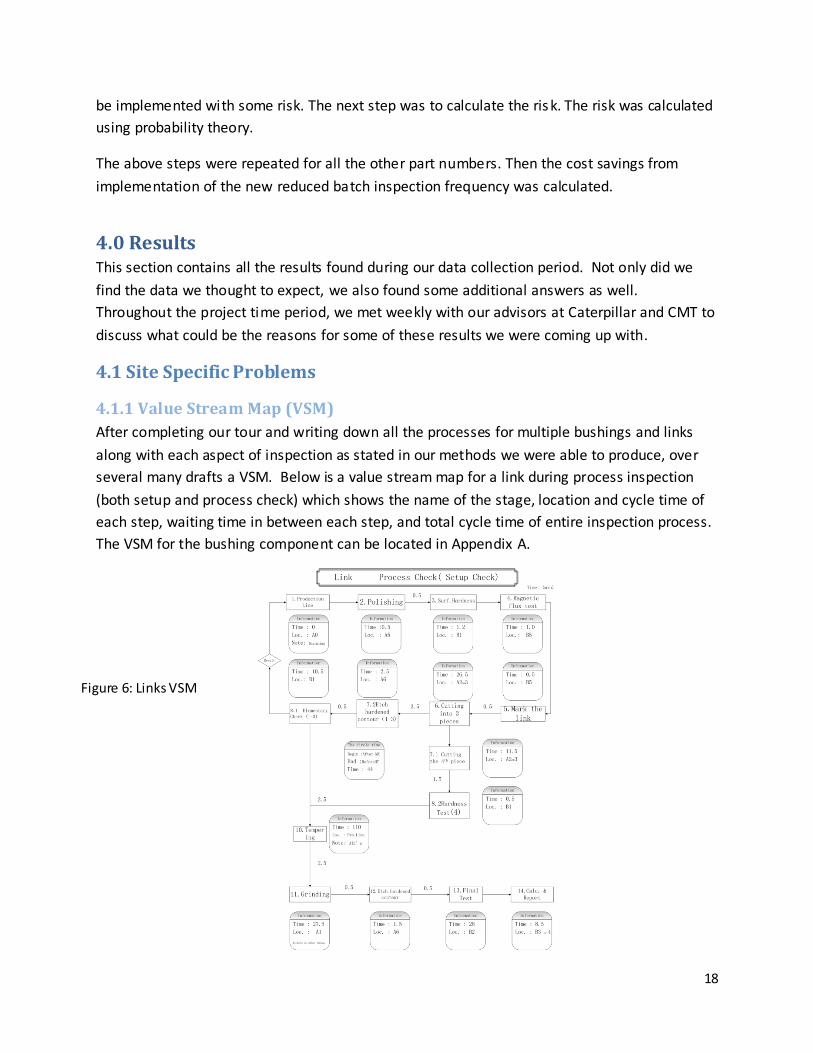
After completing our tour and writing down all the processes for multiple bushings and links
along with each aspect of inspection as stated in our methods we were able to produce, over
several many drafts a VSM. Below is a value stream map for a link during process inspection
(both setup and process check) which shows the name of the stage, location and cycle time of
each step, waiting time in between each step, and total cycle time of entire inspection process.
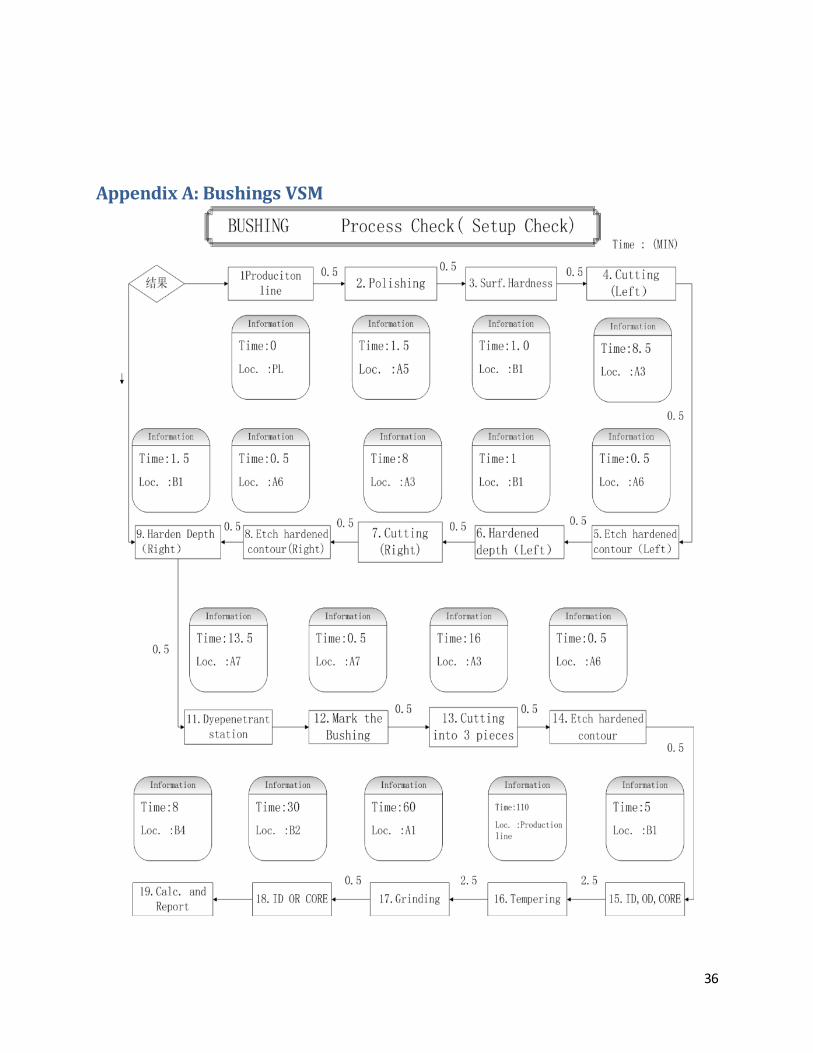
The VSM for the bushing component can be located in Appendix A.
Figure 6: Links VSM

19
After following the CMT operators and documenting their every move with location and steps taken
during the process for many different cycles we were able to produce two sets of spaghetti maps for the
link and the bushing. This is a map of the bushing process inspection process which contains the
direction of a full process the part goes in, along with every different step taken by the operator.
4.1.2 Pre Tempering and Post Tempering Inspection Results
To make the correlation between the pre and post tempering stages of inspections’ results we
had to collect past results documented over a three month period. The company provided us
with several different part numbers for the bushing and gave us the OD and ID results for each
inspection over the three month period. We then placed the results into one excel sheet and
chronologically separated the sets into ID results and OD results; from here the results were
graphed using the program MiniTab as displayed below.
Figure 7: Bushings Spaghetti Chart
20
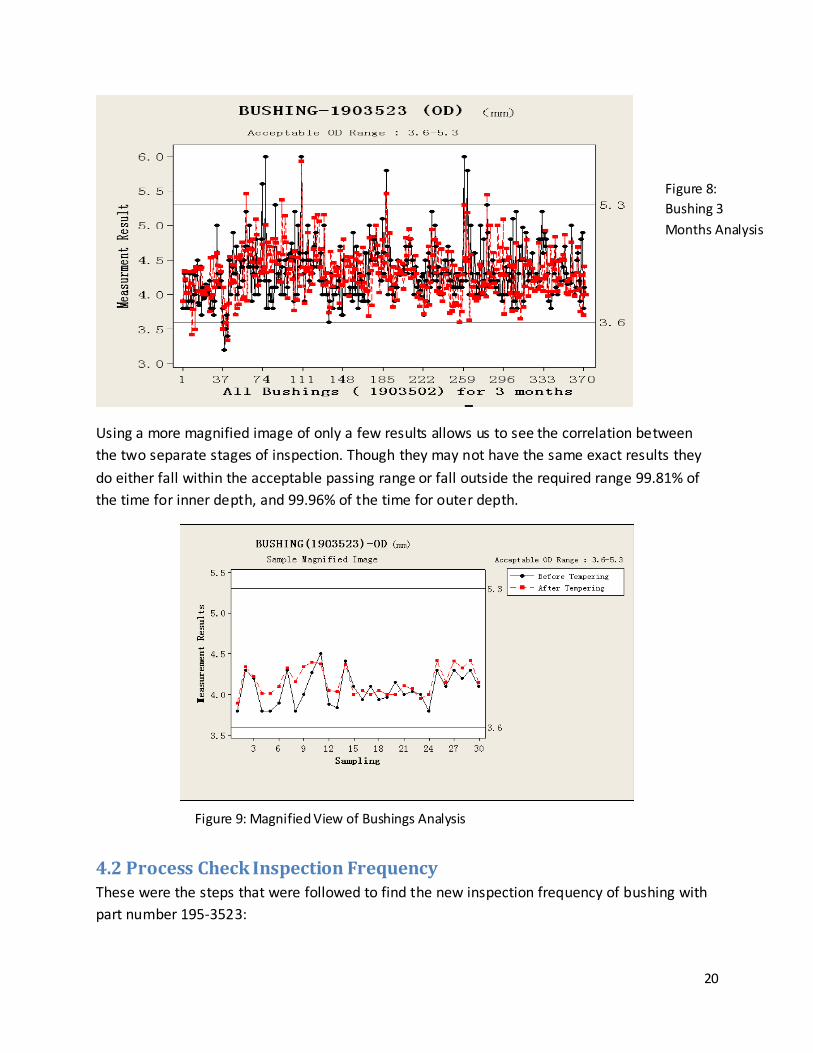
Using a more magnified image of only a few results allows us to see the correlation between
the two separate stages of inspection. Though they may not have the same exact results they
do either fall within the acceptable passing range or fall outside the required range 99.81% of
the time for inner depth, and 99.96% of the time for outer depth.
4.2 Process Check Inspection Frequency These were the steps that were followed to find the new inspection frequency of bushing with
part number 195-3523:
Figure 8:
Bushing 3
Months Analysis
Figure 9: Magnified View of Bushings Analysis
21
On average it takes 27 seconds per machine for induction heat treatment
906 pieces of bushing are treated by each machine during one shift (1 shift is 8 hours and there are 3 shifts every day),
During full production 76104 pieces are heat treated every month This equates to 38052 pairs of bushing from left and right spindles of every induction
machine every month Thus the lot size, N, was taken to be 38052
Current inspection frequency is two pieces every 8 hours
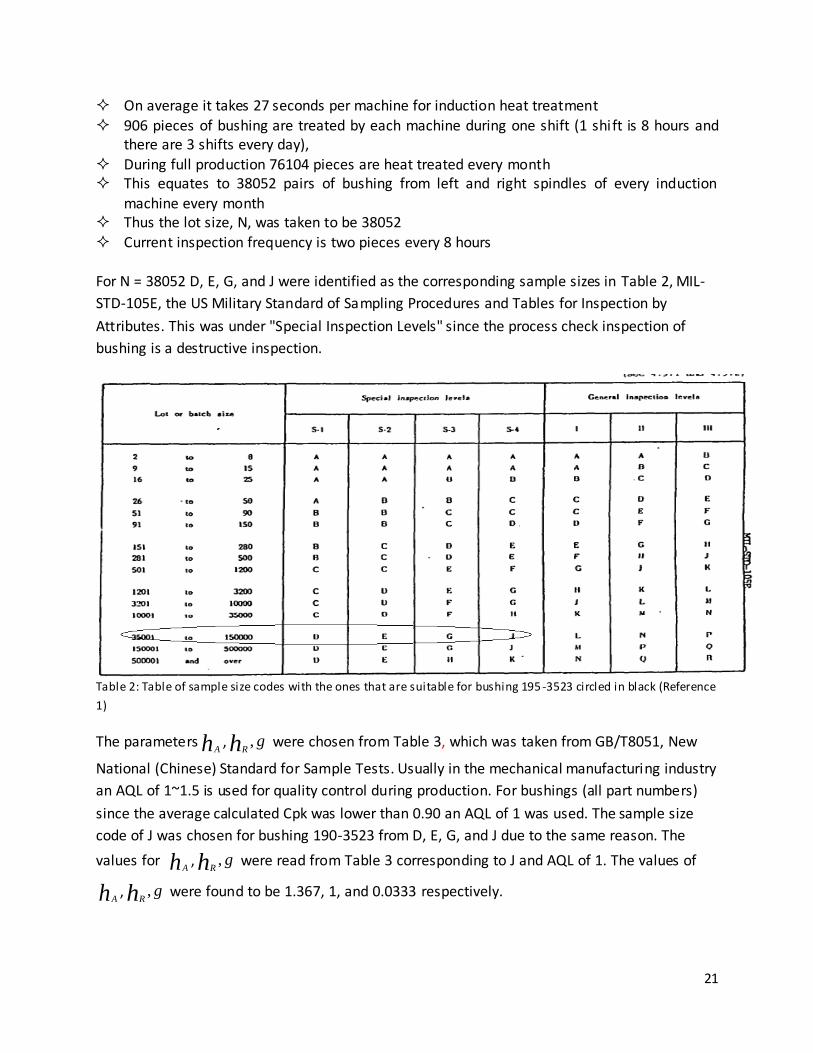
For N = 38052 D, E, G, and J were identified as the corresponding sample sizes in Table 2, MIL-
STD-105E, the US Military Standard of Sampling Procedures and Tables for Inspection by
Attributes. This was under "Special Inspection Levels" since the process check inspection of
bushing is a destructive inspection.
Table 2: Table of sample size codes with the ones that are suitable for bushing 195-3523 circled in black (Reference
1)
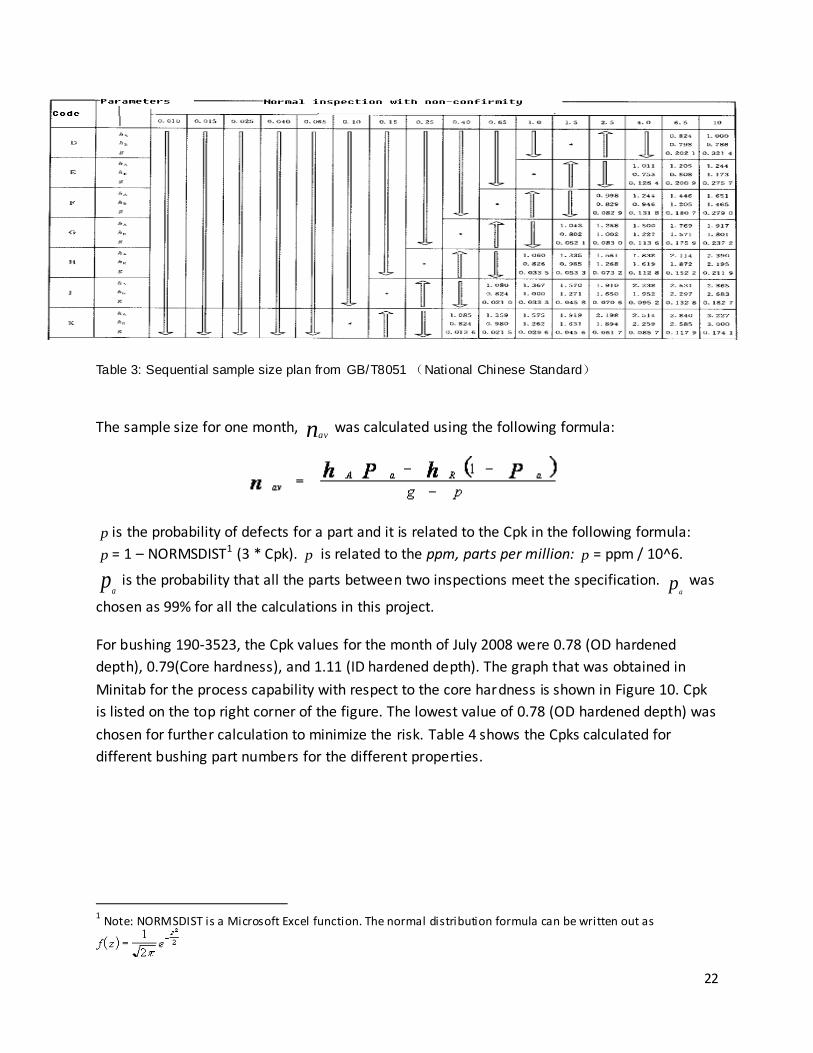
The parameters hA, ghR
, were chosen from Table 3, which was taken from GB/T8051, New
National (Chinese) Standard for Sample Tests. Usually in the mechanical manufacturing industry
an AQL of 1~1.5 is used for quality control during production. For bushings (all part numbers)
since the average calculated Cpk was lower than 0.90 an AQL of 1 was used. The sample size
code of J was chosen for bushing 190-3523 from D, E, G, and J due to the same reason. The
values for hA, ghR
, were read from Table 3 corresponding to J and AQL of 1. The values of
hA, ghR
, were found to be 1.367, 1, and 0.0333 respectively.
22
Table 3: Sequential sample size plan from GB/T8051 (National Chinese Standard)
The sample size for one month, nav was calculated using the following formula:
p is the probability of defects for a part and it is related to the Cpk in the following formula:
p = 1 – NORMSDIST1 (3 * Cpk). p is related to the ppm, parts per million: p = ppm / 10^6.
pa
is the probability that all the parts between two inspections meet the specification. pa
was
chosen as 99% for all the calculations in this project.
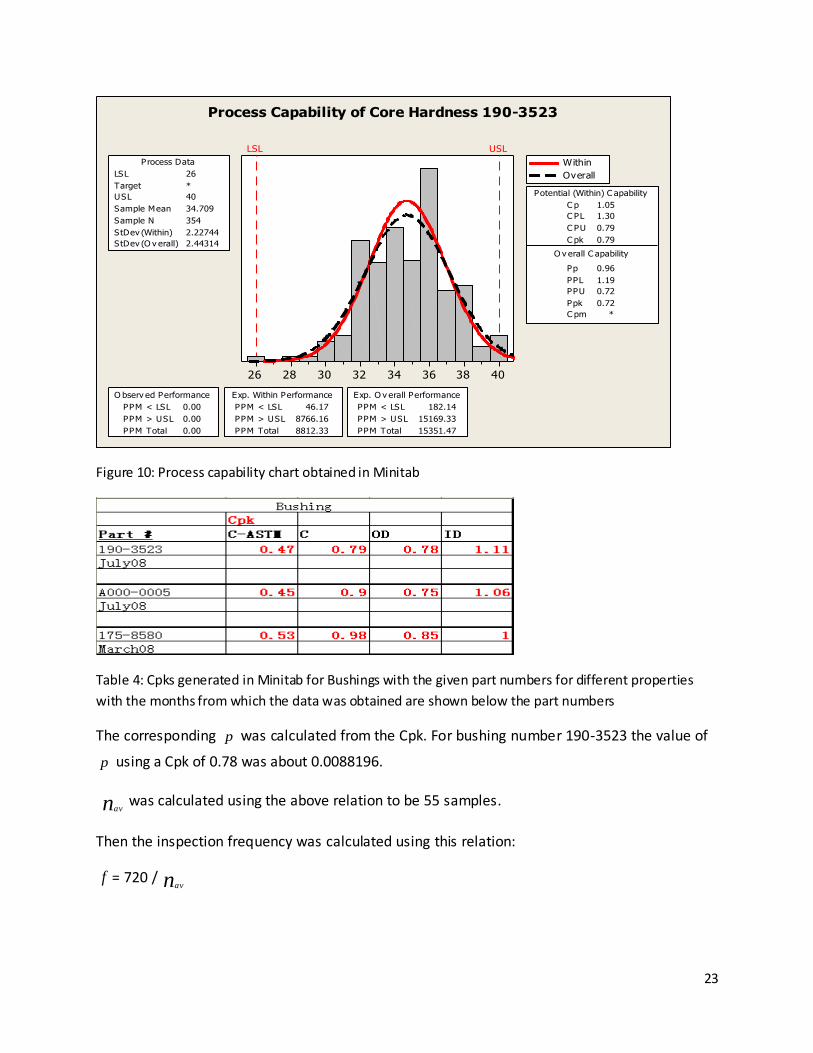
For bushing 190-3523, the Cpk values for the month of July 2008 were 0.78 (OD hardened
depth), 0.79(Core hardness), and 1.11 (ID hardened depth). The graph that was obtained in
Minitab for the process capability with respect to the core hardness is shown in Figure 10. Cpk
is listed on the top right corner of the figure. The lowest value of 0.78 (OD hardened depth) was
chosen for further calculation to minimize the risk. Table 4 shows the Cpks calculated for
different bushing part numbers for the different properties.
1 Note: NORMSDIST is a Microsoft Excel function. The normal distribution formula can be written out as
23
4038363432302826
LSL USL
LSL 26
Target *
USL 40
Sample Mean 34.709
Sample N 354
StDev (Within) 2.22744
StDev (O v erall) 2.44314
Process Data
C p 1.05
C PL 1.30
C PU 0.79
C pk 0.79
Pp 0.96
PPL 1.19
PPU 0.72
Ppk 0.72
C pm *
O v erall C apability
Potential (Within) C apability
PPM < LSL 0.00
PPM > USL 0.00
PPM Total 0.00
O bserv ed Performance
PPM < LSL 46.17
PPM > USL 8766.16
PPM Total 8812.33
Exp. Within Performance
PPM < LSL 182.14
PPM > USL 15169.33
PPM Total 15351.47
Exp. O v erall Performance
Within
Overall
Process Capability of Core Hardness 190-3523
Figure 10: Process capability chart obtained in Minitab
Table 4: Cpks generated in Minitab for Bushings with the given part numbers for different properties
with the months from which the data was obtained are shown below the part numbers
The corresponding p was calculated from the Cpk. For bushing number 190-3523 the value of
p using a Cpk of 0.78 was about 0.0088196.
nav was calculated using the above relation to be 55 samples.
Then the inspection frequency was calculated using this relation:
f = 720 / nav
24
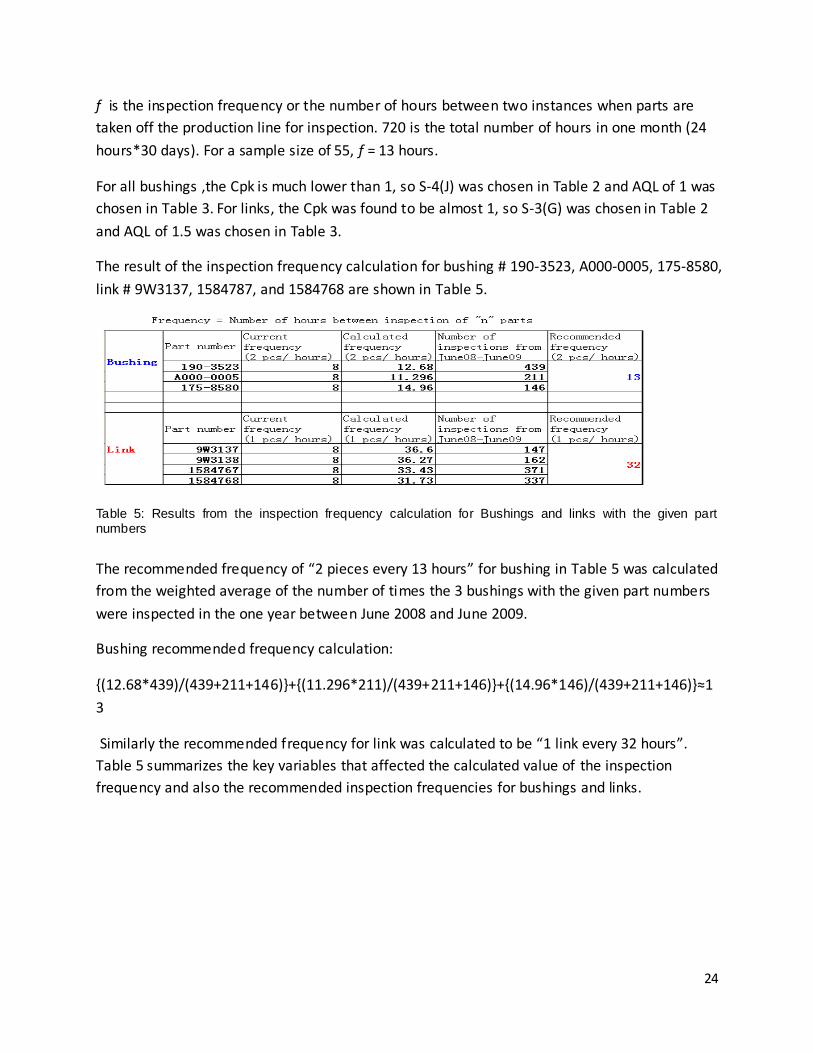
f is the inspection frequency or the number of hours between two instances when parts are
taken off the production line for inspection. 720 is the total number of hours in one month (24
hours*30 days). For a sample size of 55, f = 13 hours.
For all bushings ,the Cpk is much lower than 1, so S-4(J) was chosen in Table 2 and AQL of 1 was
chosen in Table 3. For links, the Cpk was found to be almost 1, so S-3(G) was chosen in Table 2
and AQL of 1.5 was chosen in Table 3.
The result of the inspection frequency calculation for bushing # 190-3523, A000-0005, 175-8580,
link # 9W3137, 1584787, and 1584768 are shown in Table 5.
Table 5: Results from the inspection frequency calculation for Bushings and links with the given part numbers
The recommended frequency of “2 pieces every 13 hours” for bushing in Table 5 was calculated
from the weighted average of the number of times the 3 bushings with the given part numbers
were inspected in the one year between June 2008 and June 2009.
Bushing recommended frequency calculation:
{(12.68*439)/(439+211+146)}+{(11.296*211)/(439+211+146)}+{(14.96*146)/(439+211+146)}≈1
3
Similarly the recommended frequency for link was calculated to be “1 link every 32 hours”.
Table 5 summarizes the key variables that affected the calculated value of the inspection
frequency and also the recommended inspection frequencies for bushings and links.
25
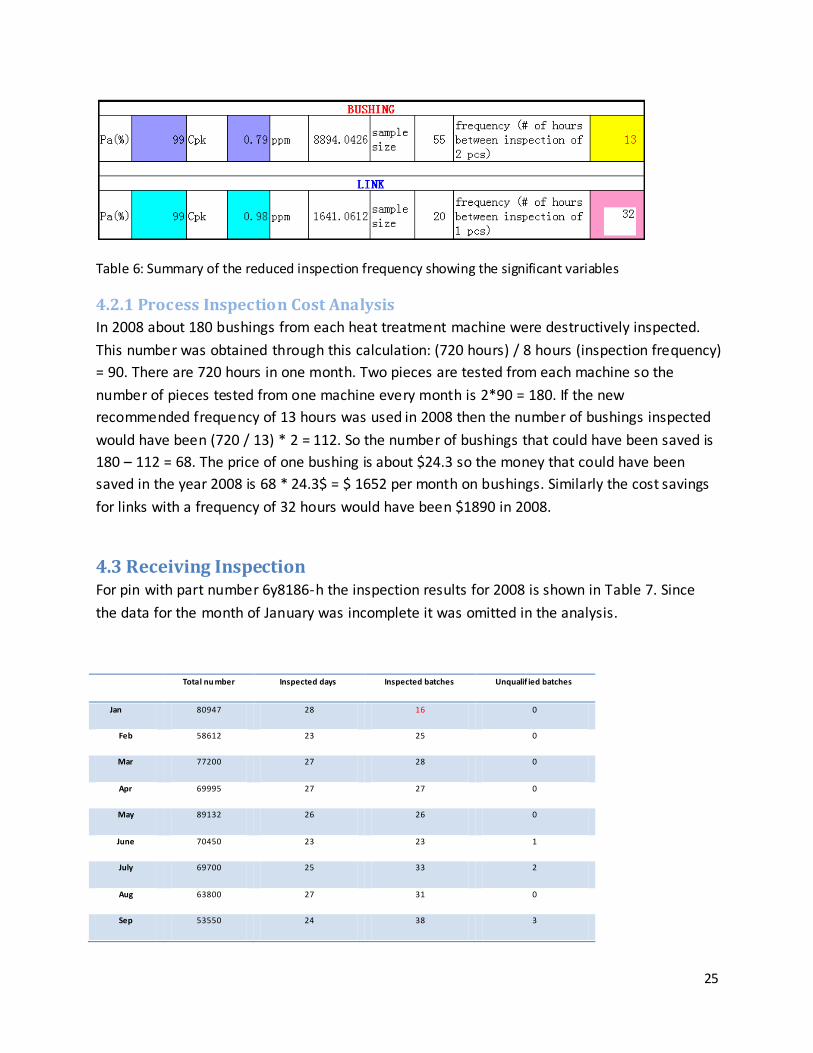
Table 6: Summary of the reduced inspection frequency showing the significant variables
4.2.1 Process Inspection Cost Analysis
In 2008 about 180 bushings from each heat treatment machine were destructively inspected.
This number was obtained through this calculation: (720 hours) / 8 hours (inspection frequency)
= 90. There are 720 hours in one month. Two pieces are tested from each machine so the
number of pieces tested from one machine every month is 2*90 = 180. If the new
recommended frequency of 13 hours was used in 2008 then the number of bushings inspected
would have been (720 / 13) * 2 = 112. So the number of bushings that could have been saved is
180 – 112 = 68. The price of one bushing is about $24.3 so the money that could have been
saved in the year 2008 is 68 * 24.3$ = $ 1652 per month on bushings. Similarly the cost savings
for links with a frequency of 32 hours would have been $1890 in 2008.
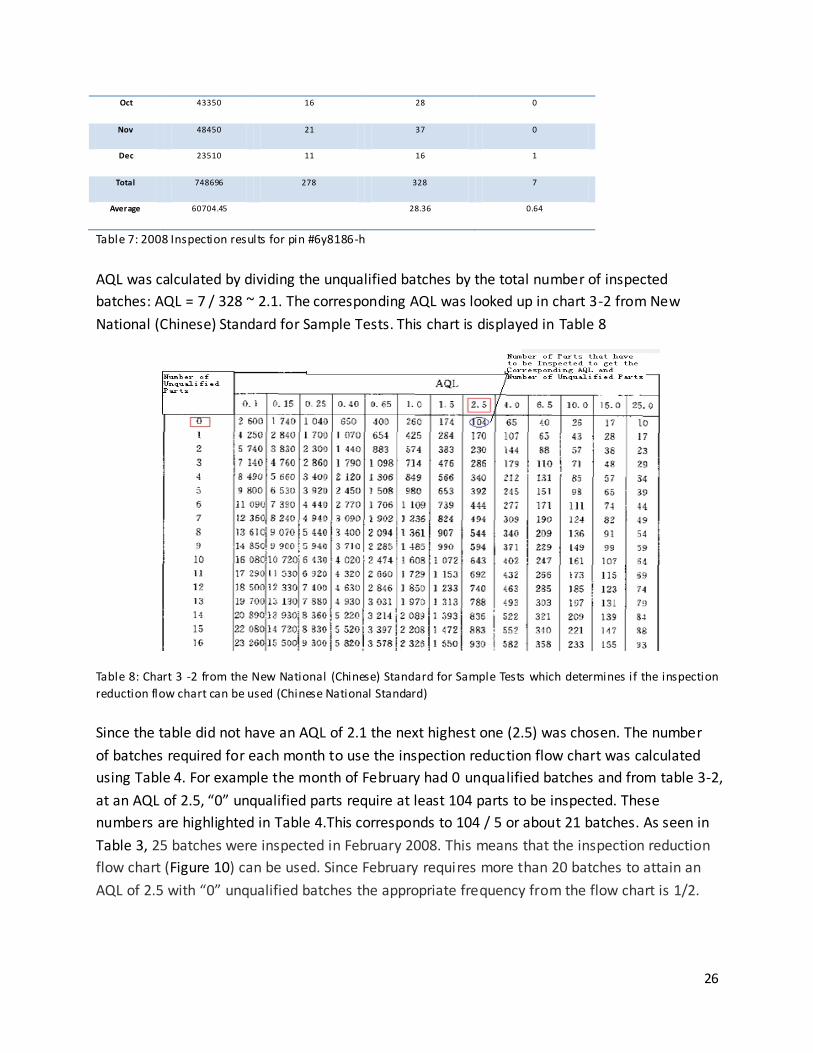
4.3 Receiving Inspection For pin with part number 6y8186-h the inspection results for 2008 is shown in Table 7. Since
the data for the month of January was incomplete it was omitted in the analysis.
Total nu mber Inspected days Inspected batches Unqualif ied batches
Jan 80947 28 16 0
Feb 58612 23 25 0
Mar 77200 27 28 0
Apr 69995 27 27 0
May 89132 26 26 0
June 70450 23 23 1
July 69700 25 33 2
Aug 63800 27 31 0
Sep 53550 24 38 3
26
Oct 43350 16 28 0
Nov 48450 21 37 0
Dec 23510 11 16 1
Total 748696 278 328 7
Average 60704.45 28.36 0.64
Table 7: 2008 Inspection results for pin #6y8186-h
AQL was calculated by dividing the unqualified batches by the total number of inspected
batches: AQL = 7 / 328 ~ 2.1. The corresponding AQL was looked up in chart 3-2 from New
National (Chinese) Standard for Sample Tests. This chart is displayed in Table 8
Table 8: Chart 3 -2 from the New National (Chinese) Standard for Sample Tests which determines if the inspection
reduction flow chart can be used (Chinese National Standard)
Since the table did not have an AQL of 2.1 the next highest one (2.5) was chosen. The number
of batches required for each month to use the inspection reduction flow chart was calculated
using Table 4. For example the month of February had 0 unqualified batches and from table 3-2,
at an AQL of 2.5, “0” unqualified parts require at least 104 parts to be inspected. These
numbers are highlighted in Table 4.This corresponds to 104 / 5 or about 21 batches. As seen in
Table 3, 25 batches were inspected in February 2008. This means that the inspection reduction
flow chart (Figure 10) can be used. Since February requires more than 20 batches to attain an
AQL of 2.5 with “0” unqualified batches the appropriate frequency from the flow chart is 1/2.
27
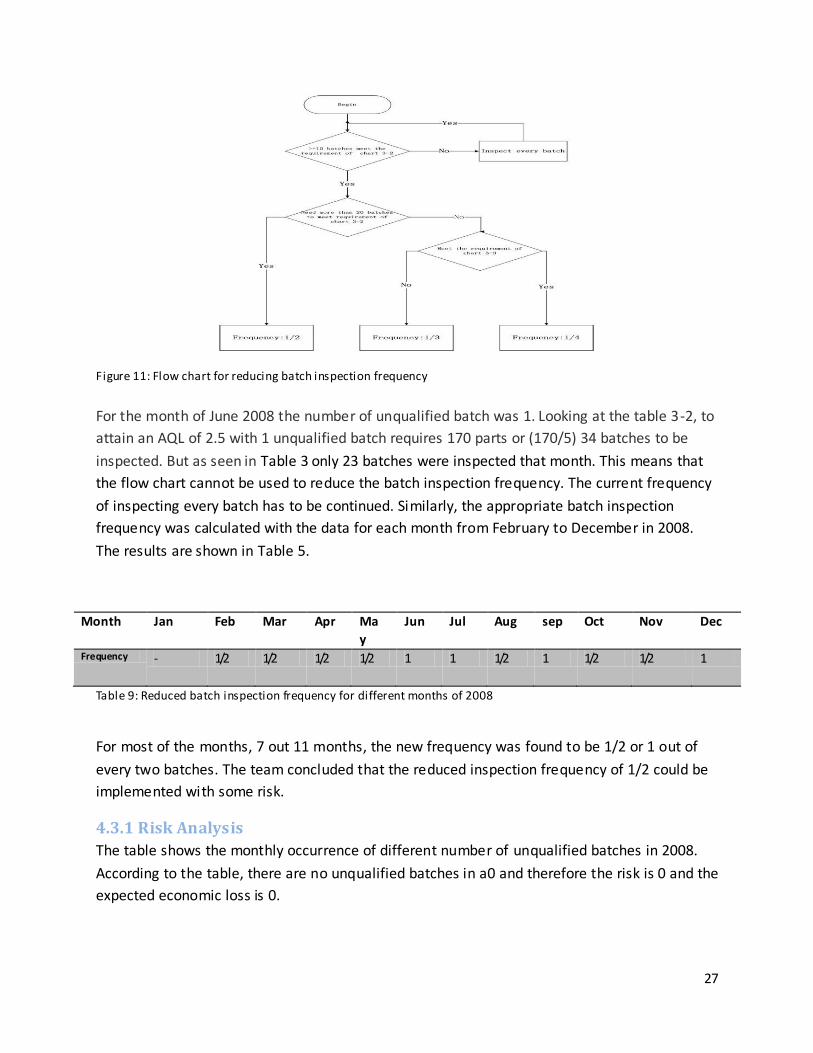
Figure 11: Flow chart for reducing batch inspection frequency
For the month of June 2008 the number of unqualified batch was 1. Looking at the table 3-2, to
attain an AQL of 2.5 with 1 unqualified batch requires 170 parts or (170/5) 34 batches to be
inspected. But as seen in Table 3 only 23 batches were inspected that month. This means that
the flow chart cannot be used to reduce the batch inspection frequency. The current frequency
of inspecting every batch has to be continued. Similarly, the appropriate batch inspection
frequency was calculated with the data for each month from February to December in 2008.
The results are shown in Table 5.
Month Jan Feb Mar Apr Ma
y
Jun Jul Aug sep Oct Nov Dec
Frequency - 1/2 1/2 1/2 1/2 1 1 1/2 1 1/2 1/2 1
Table 9: Reduced batch inspection frequency for different months of 2008
For most of the months, 7 out 11 months, the new frequency was found to be 1/2 or 1 out of
every two batches. The team concluded that the reduced inspection frequency of 1/2 could be
implemented with some risk.
4.3.1 Risk Analysis
The table shows the monthly occurrence of different number of unqualified batches in 2008.
According to the table, there are no unqualified batches in a0 and therefore the risk is 0 and the
expected economic loss is 0.
28
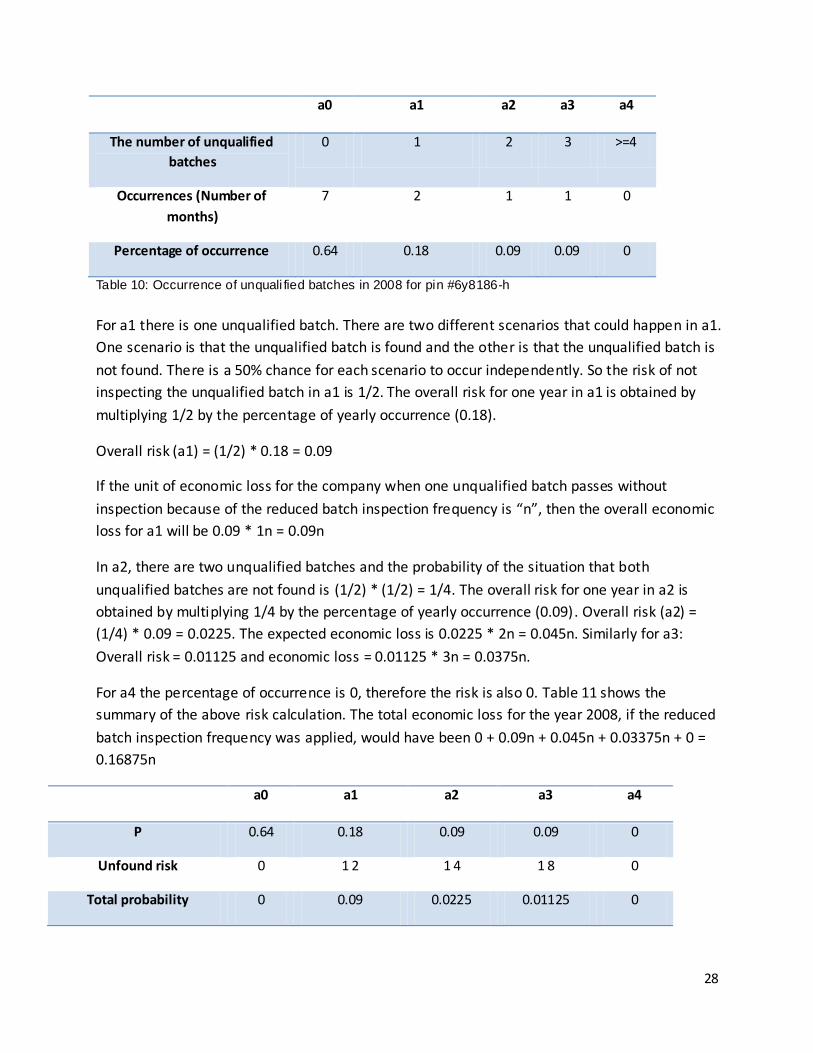
a0 a1 a2 a3 a4
The number of unqualified
batches
0 1 2 3 >=4
Occurrences (Number of
months)
7 2 1 1 0
Percentage of occurrence 0.64 0.18 0.09 0.09 0
Table 10: Occurrence of unquali fied batches in 2008 for pin #6y8186-h
For a1 there is one unqualified batch. There are two different scenarios that could happen in a1.
One scenario is that the unqualified batch is found and the other is that the unqualified batch is
not found. There is a 50% chance for each scenario to occur independently. So the risk of not
inspecting the unqualified batch in a1 is 1/2. The overall risk for one year in a1 is obtained by
multiplying 1/2 by the percentage of yearly occurrence (0.18).
Overall risk (a1) = (1/2) * 0.18 = 0.09
If the unit of economic loss for the company when one unqualified batch passes without
inspection because of the reduced batch inspection frequency is “n”, then the overall economic
loss for a1 will be 0.09 * 1n = 0.09n
In a2, there are two unqualified batches and the probability of the situation that both
unqualified batches are not found is (1/2) * (1/2) = 1/4. The overall risk for one year in a2 is
obtained by multiplying 1/4 by the percentage of yearly occurrence (0.09). Overall risk (a2) =
(1/4) * 0.09 = 0.0225. The expected economic loss is 0.0225 * 2n = 0.045n. Similarly for a3:
Overall risk = 0.01125 and economic loss = 0.01125 * 3n = 0.0375n.
For a4 the percentage of occurrence is 0, therefore the risk is also 0. Table 11 shows the
summary of the above risk calculation. The total economic loss for the year 2008, if the reduced
batch inspection frequency was applied, would have been 0 + 0.09n + 0.045n + 0.03375n + 0 =
0.16875n
a0 a1 a2 a3 a4
P 0.64 0.18 0.09 0.09 0
Unfound risk 0 1 2 1 4 1 8 0
Total probability 0 0.09 0.0225 0.01125 0
29
Expected economic loss 0 0.09n 0.045n 0.03375n 0
Table 11: Risk and economic loss for 2008 if the reduced inspection was implemented for pin #6y8186 -h
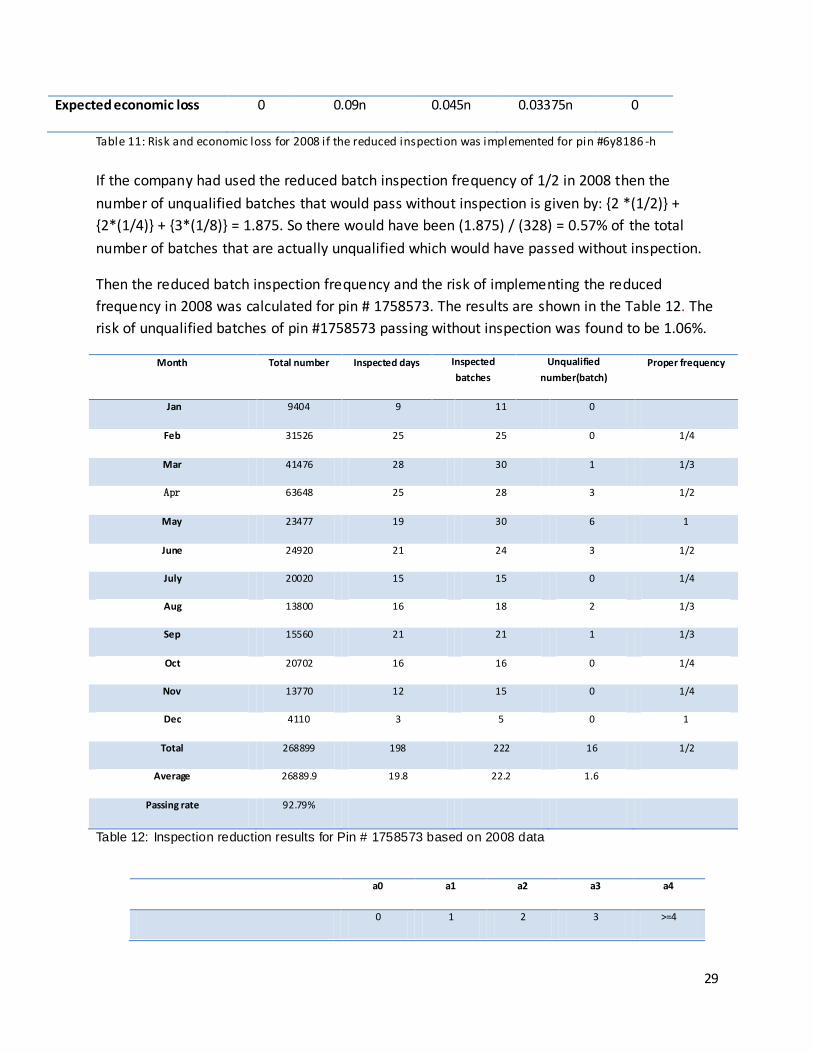
If the company had used the reduced batch inspection frequency of 1/2 in 2008 then the
number of unqualified batches that would pass without inspection is given by: {2 *(1/2)} +
{2*(1/4)} + {3*(1/8)} = 1.875. So there would have been (1.875) / (328) = 0.57% of the total
number of batches that are actually unqualified which would have passed without inspection.
Then the reduced batch inspection frequency and the risk of implementing the reduced
frequency in 2008 was calculated for pin # 1758573. The results are shown in the Table 12. The
risk of unqualified batches of pin #1758573 passing without inspection was found to be 1.06%.
Month Total number Inspected days Inspected
batches
Unqualified
number(batch)
Proper frequency
Jan 9404 9 11 0
Feb 31526 25 25 0 1/4
Mar 41476 28 30 1 1/3
Apr 63648 25 28 3 1/2
May 23477 19 30 6 1
June 24920 21 24 3 1/2
July 20020 15 15 0 1/4
Aug 13800 16 18 2 1/3
Sep 15560 21 21 1 1/3
Oct 20702 16 16 0 1/4
Nov 13770 12 15 0 1/4
Dec 4110 3 5 0 1
Total 268899 198 222 16 1/2
Average 26889.9 19.8 22.2 1.6
Passing rate 92.79%
Table 12: Inspection reduction results for Pin # 1758573 based on 2008 data
a0 a1 a2 a3 a4
0 1 2 3 >=4
30
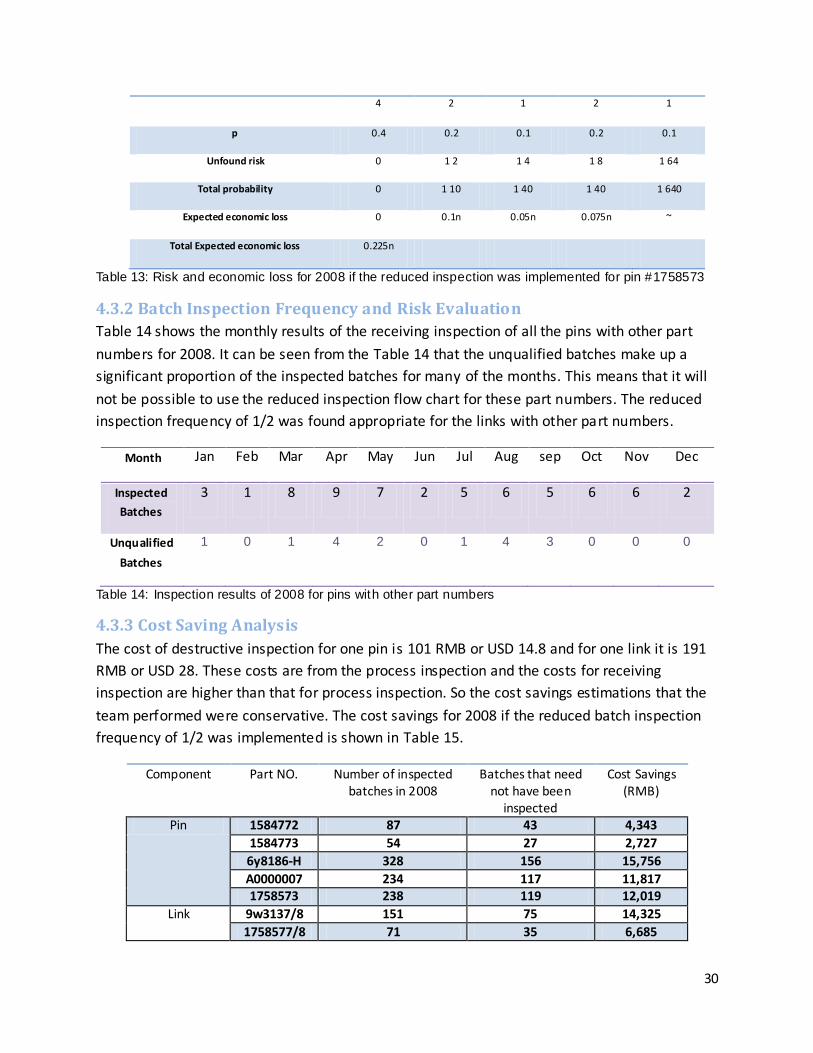
4 2 1 2 1
p 0.4 0.2 0.1 0.2 0.1
Unfound risk 0 1 2 1 4 1 8 1 64
Total probability 0 1 10 1 40 1 40 1 640
Expected economic loss 0 0.1n 0.05n 0.075n ~
Total Expected economic loss 0.225n
Table 13: Risk and economic loss for 2008 if the reduced inspection was implemented for pin #1758573
4.3.2 Batch Inspection Frequency and Risk Evaluation
Table 14 shows the monthly results of the receiving inspection of all the pins with other part
numbers for 2008. It can be seen from the Table 14 that the unqualified batches make up a
significant proportion of the inspected batches for many of the months. This means that it will
not be possible to use the reduced inspection flow chart for these part numbers. The reduced
inspection frequency of 1/2 was found appropriate for the links with other part numbers.
Month Jan Feb Mar Apr May Jun Jul Aug sep Oct Nov Dec
Inspected
Batches
3 1 8 9 7 2 5 6 5 6 6 2
Unqualified
Batches
1 0 1 4 2 0 1 4 3 0 0 0
Table 14: Inspection results of 2008 for pins with other part numbers
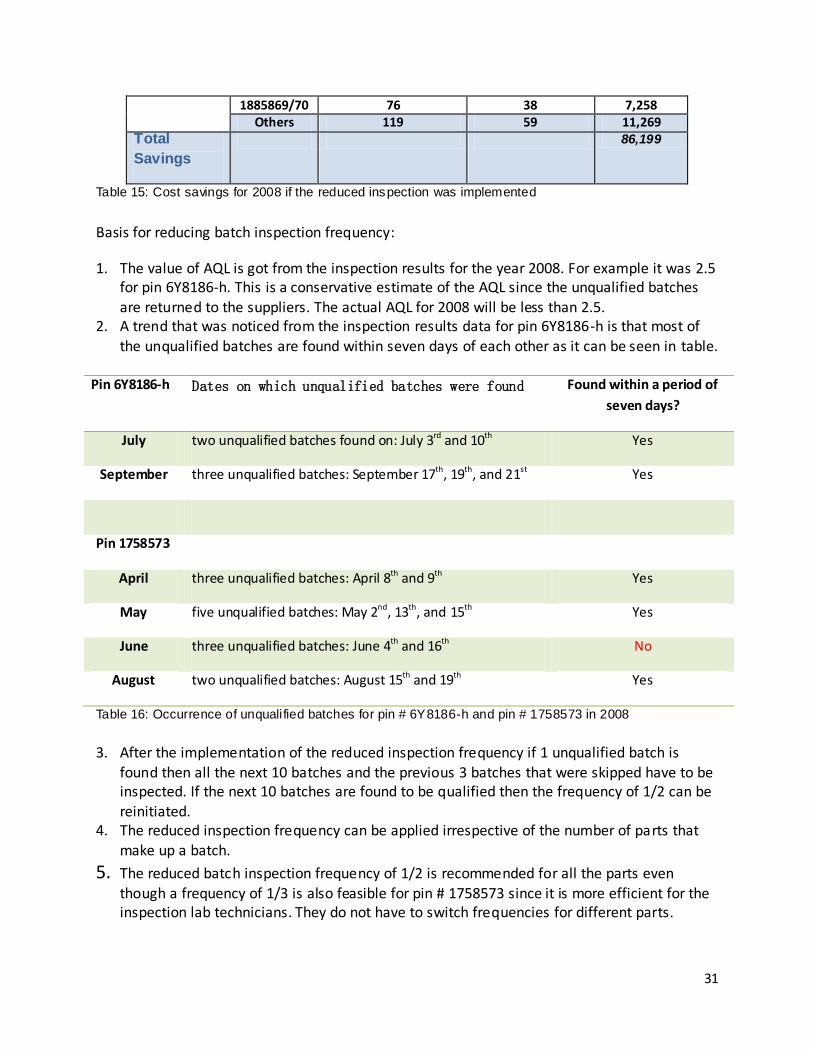
4.3.3 Cost Saving Analysis
The cost of destructive inspection for one pin is 101 RMB or USD 14.8 and for one link it is 191
RMB or USD 28. These costs are from the process inspection and the costs for receiving
inspection are higher than that for process inspection. So the cost savings estimations that the
team performed were conservative. The cost savings for 2008 if the reduced batch inspection
frequency of 1/2 was implemented is shown in Table 15.
Component Part NO. Number of inspected batches in 2008
Batches that need not have been
inspected
Cost Savings (RMB)
Pin 1584772 87 43 4,343
1584773 54 27 2,727
6y8186-H 328 156 15,756
A0000007 234 117 11,817
1758573 238 119 12,019
Link 9w3137/8 151 75 14,325
1758577/8 71 35 6,685
31
1885869/70 76 38 7,258
Others 119 59 11,269
Total
Savings
86,199
Table 15: Cost savings for 2008 if the reduced inspection was implemented
Basis for reducing batch inspection frequency:
1. The value of AQL is got from the inspection results for the year 2008. For example it was 2.5 for pin 6Y8186-h. This is a conservative estimate of the AQL since the unqualified batches
are returned to the suppliers. The actual AQL for 2008 will be less than 2.5. 2. A trend that was noticed from the inspection results data for pin 6Y8186-h is that most of
the unqualified batches are found within seven days of each other as it can be seen in table.
Pin 6Y8186-h Dates on which unqualified batches were found Found within a period of
seven days?
July two unqualified batches found on: July 3rd and 10th Yes
September three unqualified batches: September 17th, 19th, and 21st Yes
Pin 1758573
April three unqualified batches: April 8th and 9th Yes
May five unqualified batches: May 2nd, 13th, and 15th Yes
June three unqualified batches: June 4th and 16th No
August two unqualified batches: August 15th and 19th Yes
Table 16: Occurrence of unqualified batches for pin # 6Y8186-h and pin # 1758573 in 2008
3. After the implementation of the reduced inspection frequency if 1 unqualified batch is found then all the next 10 batches and the previous 3 batches that were skipped have to be inspected. If the next 10 batches are found to be qualified then the frequency of 1/2 can be reinitiated.
4. The reduced inspection frequency can be applied irrespective of the number of parts that make up a batch.
5. The reduced batch inspection frequency of 1/2 is recommended for all the parts even
though a frequency of 1/3 is also feasible for pin # 1758573 since it is more efficient for the inspection lab technicians. They do not have to switch frequencies for different parts.
32
5.0 Recommendations This section includes all of our recommendations we have made to improve certain areas of the
inspection process that we were able to view and analyze at Caterpillar. In this section we
make recommendations for the issues we found and mentioned in the previous sections.
Should Caterpillar implement these recommendations, they will be able to save parts destroyed
and money for the company.
5.1 Site Specific Problems
5.1.1 Value Stream Maps and Spaghetti Chart Recommendations
After critically analyzing the charts and diagrams that we formulated we were able to conclude
that there were not many large areas of waste within the full layout. This fact, combined with
the individual steps having areas that could be improved allowed us to come up with a list of
recommendations based on the charts and maps. Firstly, we believe that Caterpillar should
work and develop methods to shortening the heat treatment time and reducing some of the
current procedure as a whole. By shortening the heat treatment process the company would
save overall inspection time and eventually parts inspected. There are some aspects of the
inspection that are not needed, and do not have to be completed as consistently as they are
currently being completed. Removing these less meaningful processes will save the company
time without sacrificing quality.
The second recommendation that can be made after analyzing the charts is that time
regulations for operators need to be implemented for all inspections. There is currently no set
time limit for not only the entire process, but the time to complete each step as well. By
implementing time regulations for certain stages of inspection a more consistent output and
management accessible process will be formed.
5.1.2 Pre-Tempering and Post Tempering Recommendations
Since we were able to discover an accurate correlation between the inspection results of the
pre-tempering and post-tempering it is safe to conclude that the pass/fail results will be similar.
The production line can now continue where it was once halted in between the two stages of
tempering during inspection at a confident level without worry of quality reducing. Since the
only results we used were during a three month period of time, we recommend that Caterpillar
experiments comparing the pre/post tempering results of the ID and OD hardened depths for
one full year. This will give a definite correlation between the results and conclusions could be
confidently made with no chance of lapse in discovery. If after one year the direct correlation
between the two stages of testing still exists than several different conclusions could be drawn.
The pre-tempering results for both OD and ID can replace the results of the post tempering
inspection eliminating any inspection of parts after they are tempered, and therefore cutting
33
the parts inspected and destroyed in half. This would also save 77% of the time for inspection
of 3 hrs and 30 minutes throughout the inspection process.
5.1.3 Outer Depth and Inner Depth Bushing Problem Recommendations
The team made its conclusions as to why the bushing’s OD and ID results were producing failing
results at times through conversations with operators, engineers and personal observations
which allowed us to make some recommendations to improve the current process. We believe
that if a sensor and program were installed within the heat treatment process to monitor the
fixture and the heat treating coil with its fluctuation at all times the rate of failing OD and IDs
for the bushing would drastically decrease if not disappear completely. A sensor would allow
the operator to use precise controls to line up the bushing with the heated coil and eliminate
the need for him to line up the part by using his eyes as a judgment to where the bushing lines
up directly under center with the coil. The sensor could also monitor the fluctuation that goes
on during the process with the fixture holding the bushing in. If the part was fluctuating too
much where the bushing was being heated off center the process would stop and time would
be saved from inspecting the part for the proper OD and ID results. Other benefits would be the
pass rate would as previously stated drastically improve as well as the quality of the heat
treated part through fixture and coil location adjustments made directly at the line. The quality
would also be determined directly at the source of production where the heating is done
instead of at the inspection station where it is destroyed. We recommend either further
research within the company for a cost analysis of the actual worth of implementing a sensor of
this magnitude, further study into possible sensors with similar characteristics as described, or a
possible project for the future to fully explore the idea of improving the OD/ID results.
5.2 Process Check Inspection Frequency The inspection frequency for both links and bushings are too high. Reducing the frequency will enable the company to reduce unnecessary wastes.
Currently, the inspection frequency for bushings is 2 bushings every 8 hours. After the team
calculated a new frequency, we suggested that the company should change the inspection frequency to 2 bushings every 13 hours. By doing so, the company could reduce the number of bushings inspected every month by 38%. Not only that, the company could also be reducing its
expenses by 11,274¥ or $1,652 per month.
As for links, the current inspection frequency is 1 link every 8 hours. The team suggested the company change the frequency to 1 link every 32 hours based off of the calculations. This could
reduce the number of links inspected every month by 75% and reduce the expenses by 12,892
¥ or $1,890 per month
34
5.3 Receiving Inspection After applying all the theories and analyzing possible risks, the team suggested that the best batch inspection frequency for receiving inspection is 1 out of every 2 batches. This reduction
would save the company 86,199 ¥ or $13,000 every year if the number of parts received from
the suppliers is the same as in 2008. Since the majority of the parts do not carry a risk, the new frequency can be confidently implemented.
6. Conclusions From the recommendations we have based off all the data we collected and analyzed we have
determined that it is possible to improve AsiaTrak’s inspection frequency and inspection
procedure to reduce cost while maintaining quality. The total potential savings the company
could have for the whole year could be as much as $56k and that is just after looking at two
types of inspection, process and receiving and only some major components such as bushing
and link for process inspection and pin and link for receiving inspection.
Value Stream Mapping was very useful for us in being able to visually see how the entire production process worked, as well as seeing how the individual processes worked. By being able to combine information and material on one map, this allowed us to see where possible issues were. Since time was short, the team was not able to analyze all the different types of inspection. Not
only that, but the company was also not operating at full capacity throughout the whole 7
weeks we were there. Although, we were able to give the company many recommendations,
we felt we could’ve done more since we fell short of our original goal of possible saving of up to
$100k.
35
References US Military, MIL-STD-105E: The US Military Standard of Sampling Procedures and Tables
for Inspection by Attributes, Table 1, 1993
http://www.wtoqc.cn/html/08/t-7908.html (Chinese website)
Dou Koucai, New National Standard for Sample Tests, Standards Press of China, 2004,
Page 352
Caterpllar, Inc. (2009). Caterpillar History. Retrieved May 18, 2009, from Caterpillar:
http://www.cat.com/cda/layout?m=38033&x=7
Taylor, A. (2007, August 13). Caterpillar: Big trucks, big sales, big attitude. Retrieved May 18,
2009, from Fortune:
http://money.cnn.com/magazines/fortune/fortune_archive/2007/08/20/100166166/in
dex.htm
Katzenbach, JR Smith, DK 1993, Strategos, Inc. (2007) Retrieved 17 July 2008 at:
http://www.strategosinc. com/workteam4.htm, 12
iSixSigma Magazine (February,2006). © 2005-2009 iSixSigma, a division of Ideal Media
LLC.
Amit Goyal (January, 2008). Oak Ridge National Laboratory, http://www.ornl.gov/
New York General Hospital, (2009, August 26th ) , Retrieved on August 26th , 2009 from:
http://www.patientflowtoolkit.ca/lean_spaghetti.html
36
Appendix A: Bushings VSM