learning from data - santa fe...
TRANSCRIPT
Aaron Clauset @aaronclauset !Assistant Professor of Computer Science University of Colorado Boulder External Faculty, Santa Fe Institute
Learning from Data
© 2013 Aaron Clauset
distribution
the fraction of times we observe an event of size x
p(x)
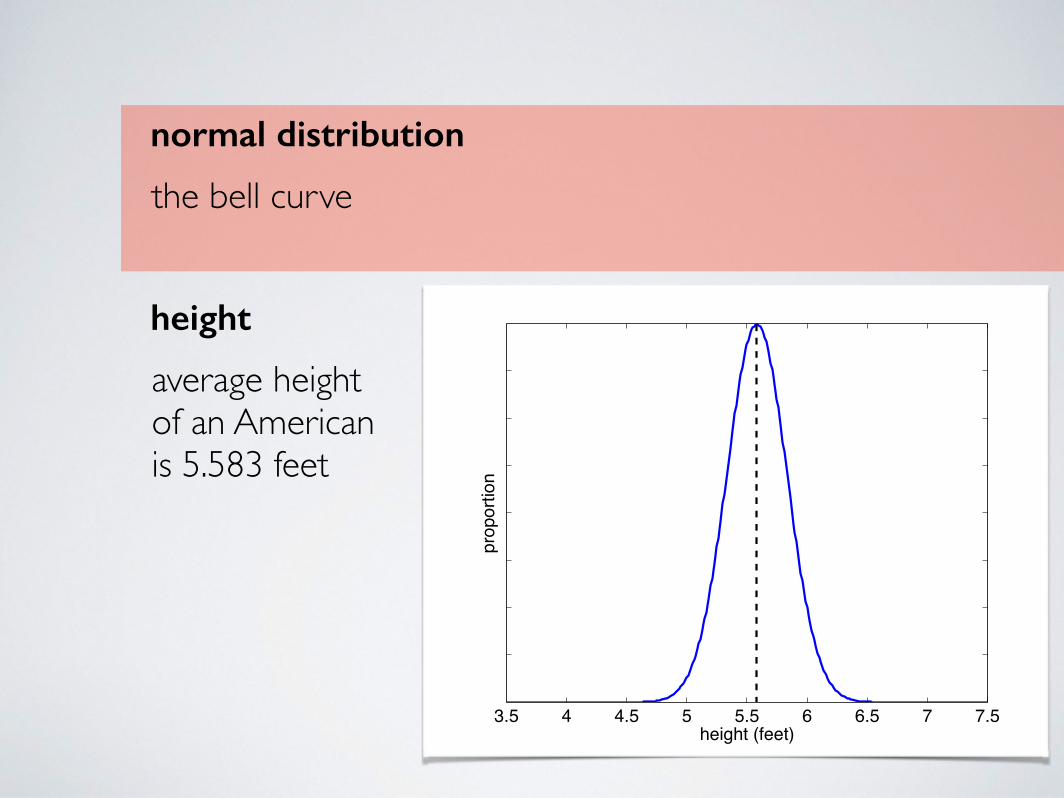
normal distribution
the bell curve
3.5 4 4.5 5 5.5 6 6.5 7 7.5height (feet)
prop
ortio
n
height
average height of an American is 5.583 feet

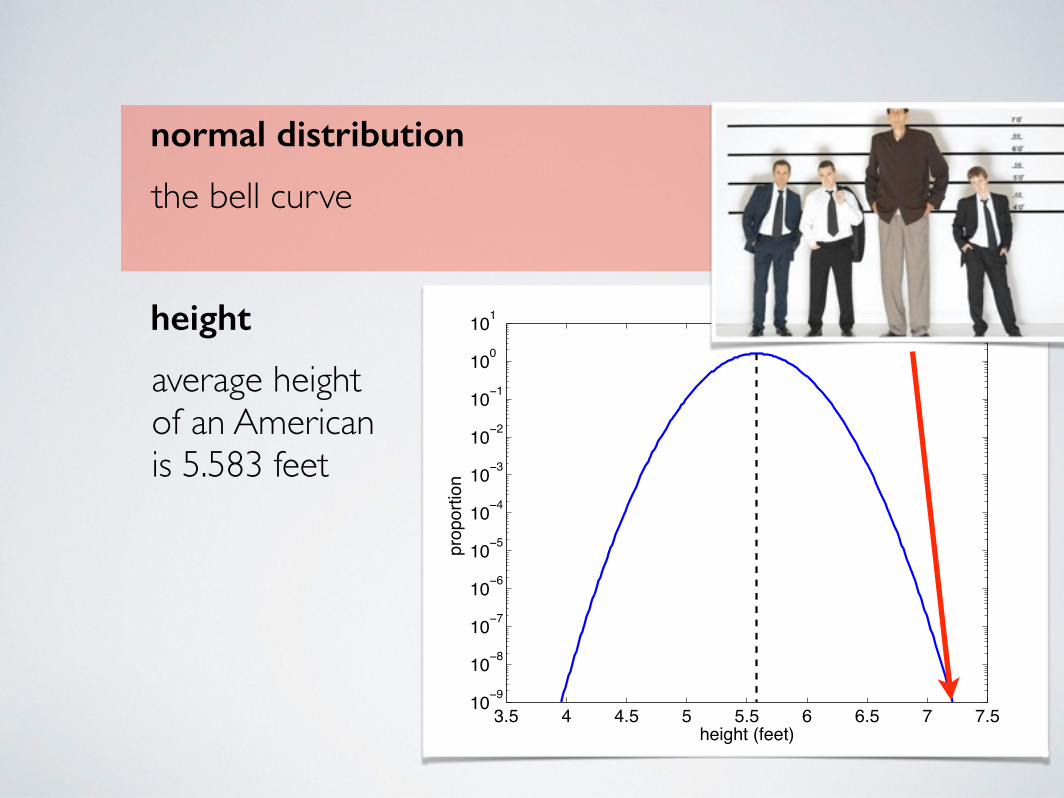
normal distribution
the bell curve
3.5 4 4.5 5 5.5 6 6.5 7 7.510−9
10−8
10−7
10−6
10−5
10−4
10−3
10−2
10−1
100
101
height (feet)
prop
ortio
n
height
average height of an American is 5.583 feet
normal distribution
the bell curve
3.5 4 4.5 5 5.5 6 6.5 7 7.510−9
10−8
10−7
10−6
10−5
10−4
10−3
10−2
10−1
100
101
height (feet)
prop
ortio
n
height
average height of an American is 5.583 feet

normal distribution
the bell curve
average is representative
lengths (human height, etc.) weights (human or otherwise) speeds (highway, running, etc.)
power law distributions
“heavy-tailed” patterns
average is not representative
1 2 3 4 5 6 7 8 9 10size
proportion
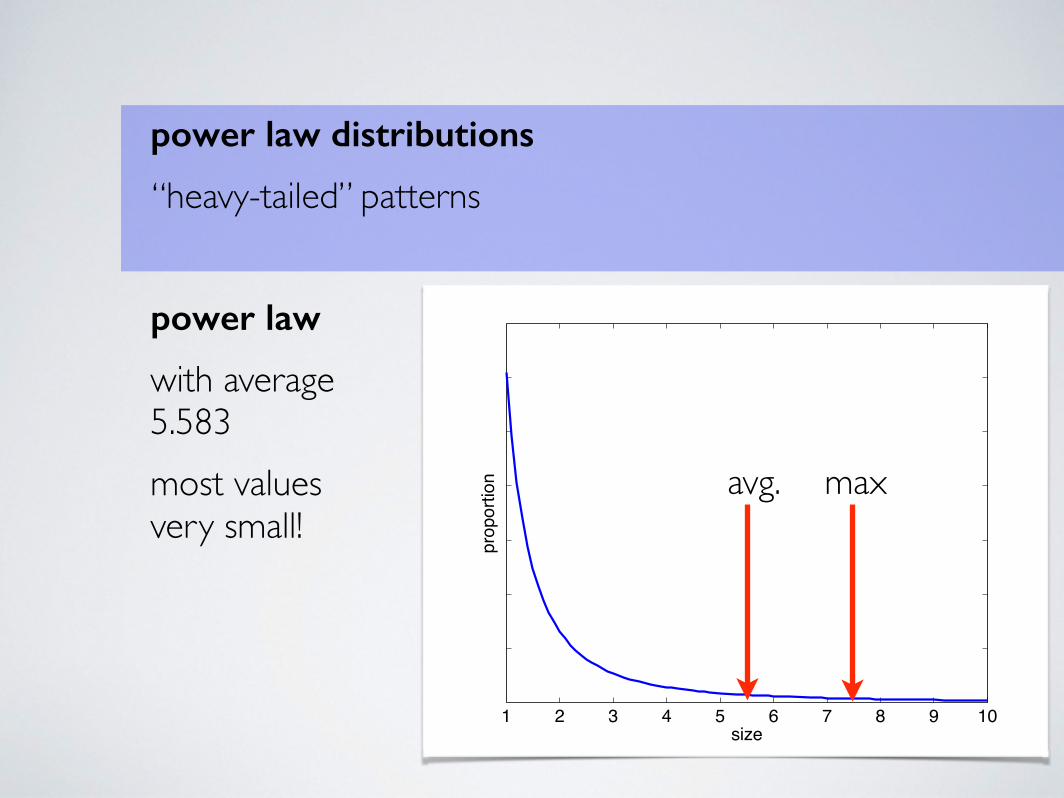
power law distributions
“heavy-tailed” patterns
power law
with average 5.583 most values very small!
avg. max
101 102 10310−8
10−7
10−6
10−5
10−4
10−3
10−2
10−1
100
size
proportion
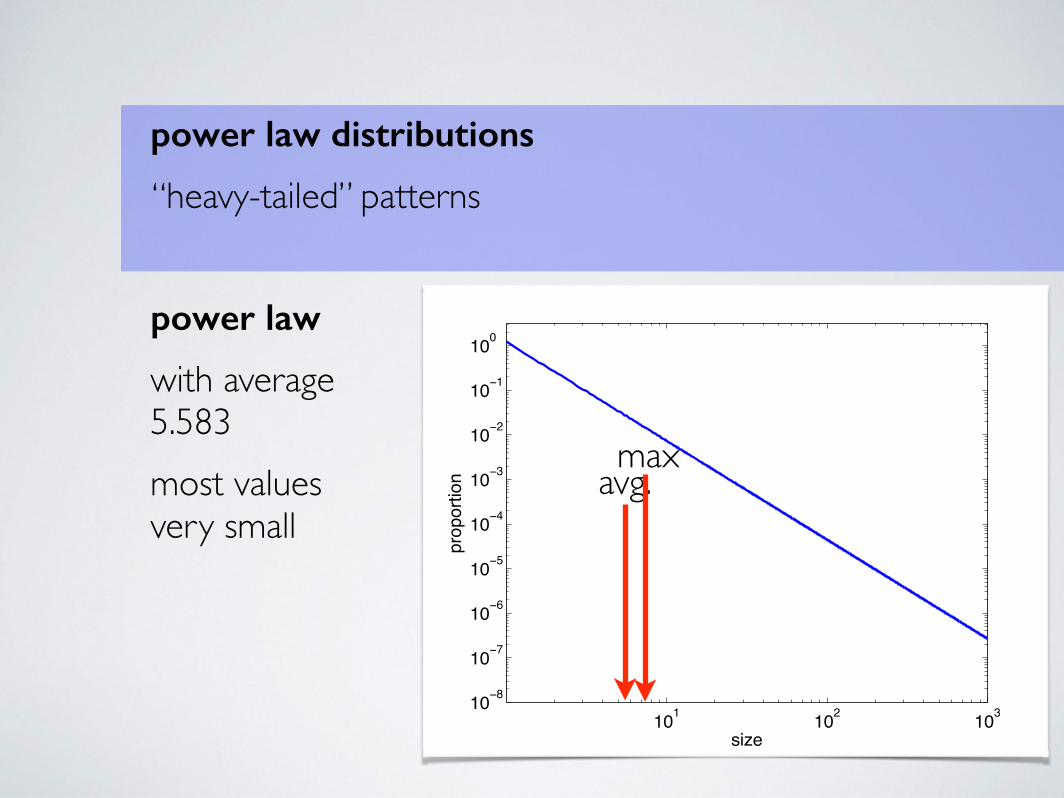
power law distributions
“heavy-tailed” patterns
power law
with average 5.583 most values very small
avg.max
101 102 10310−8
10−7
10−6
10−5
10−4
10−3
10−2
10−1
100
size
proportion
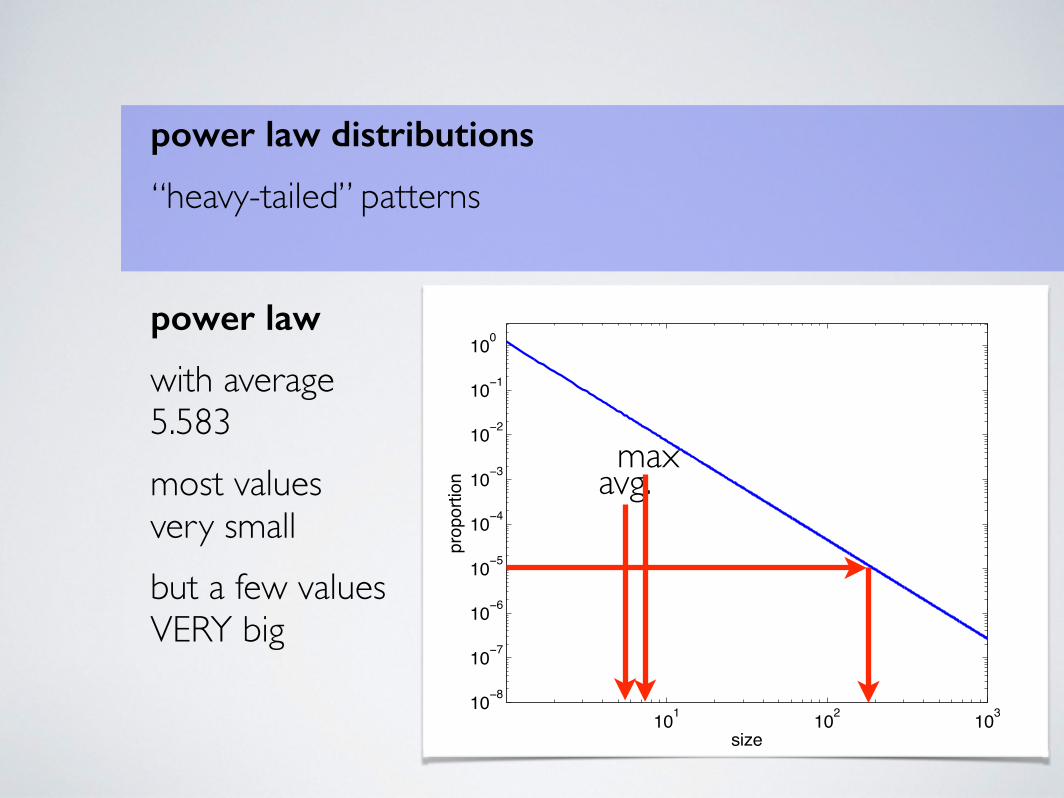
power law distributions
“heavy-tailed” patterns
power law
with average 5.583 most values very small but a few values VERY big
avg.max

power law distributions
“heavy-tailed” patterns
power law distributions
average is not representative
earthquake energy solar flare energy flood water volume forest fire size landslide size lunar crater size
terrorism events international wars book sales electrical blackouts financial wealth city population financial returns surname frequency

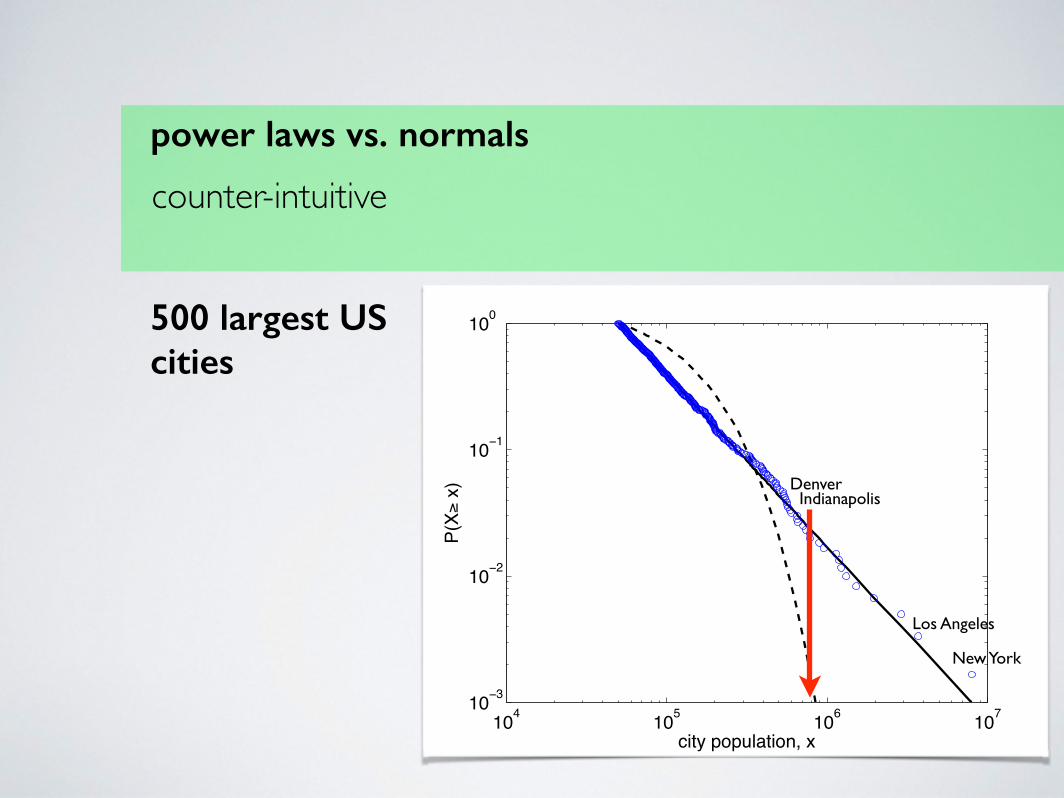
power laws vs. normals
counter-intuitive
power laws vs. normals
counter-intuitive
104 105 106 10710−3
10−2
10−1
100
city population, x
P(X*
x)
500 largest US cities
New York
Los Angeles
IndianapolisDenver
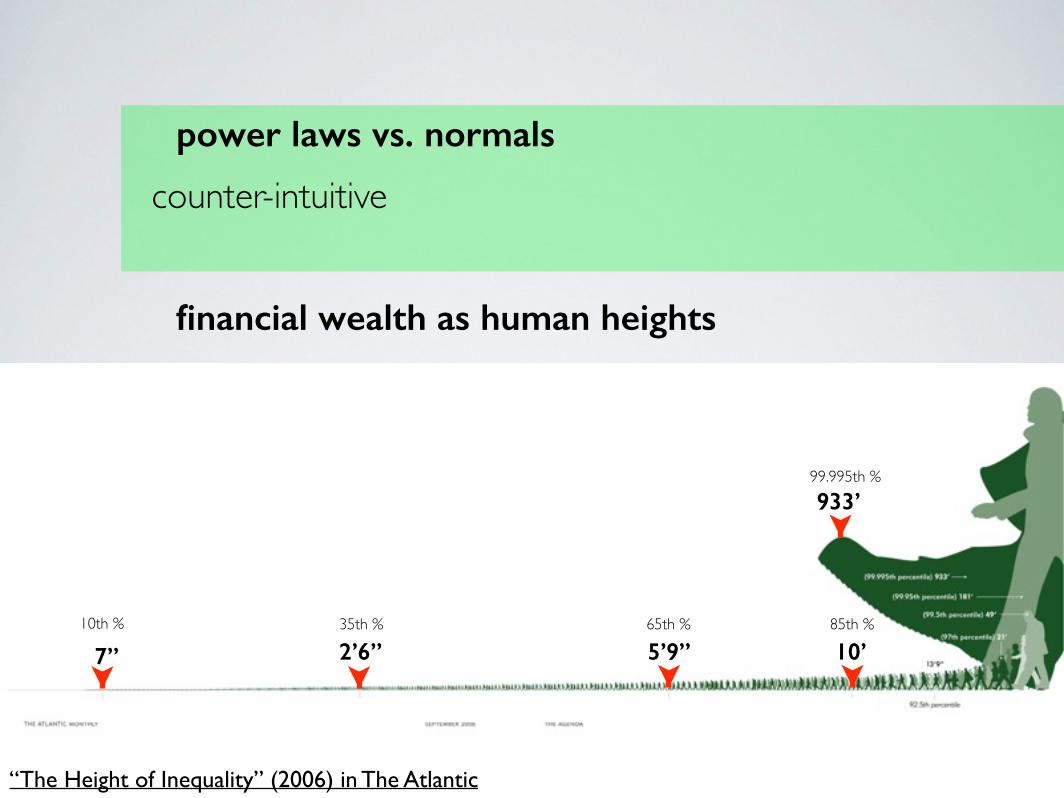
power laws vs. normals
counter-intuitive
financial wealth as human heights
“The Height of Inequality” (2006) in The Atlantic
7” 2’6” 5’9” 10’
933’
10th % 35th % 65th % 85th %
99.995th %

terrorism
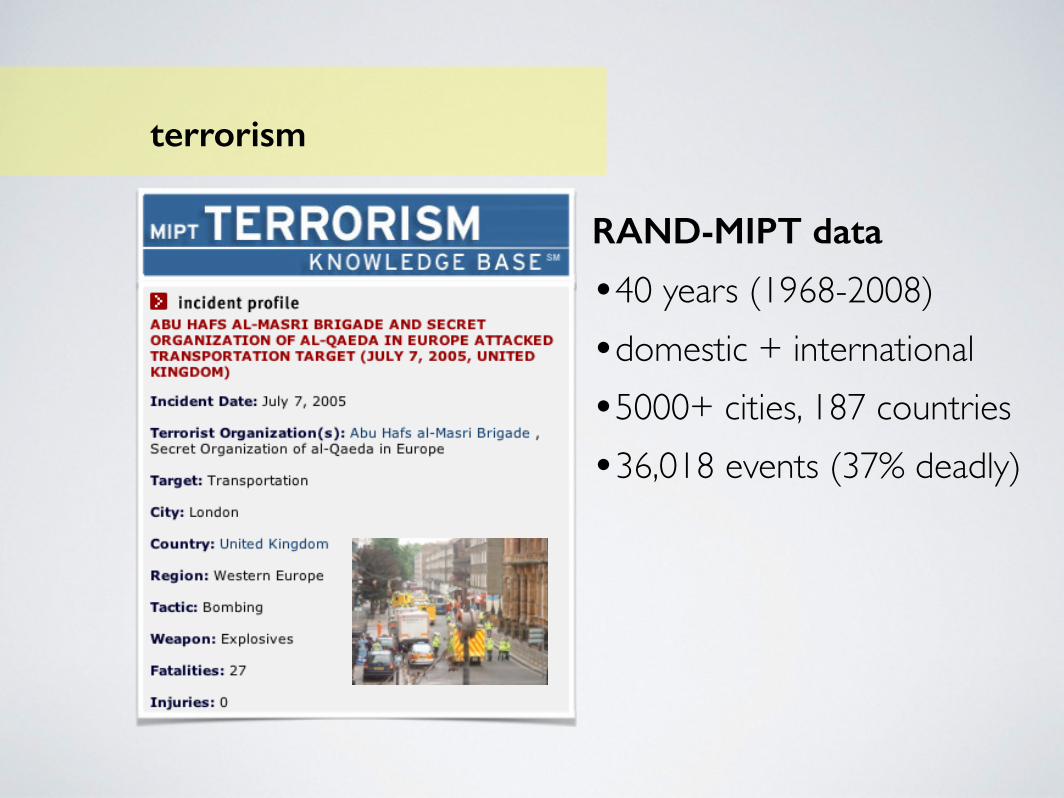
RAND-MIPT data
•40 years (1968-2008) •domestic + international •5000+ cities, 187 countries •36,018 events (37% deadly)
terrorism
terrorism
• where does terrorism occur?
• what is risk of dying from terrorism?
data analysis:
1. take all events 1998-2007
2. count deaths in each country
3. divide total by country’s population
4. yields per capita risk of death
5. visualize on a world map
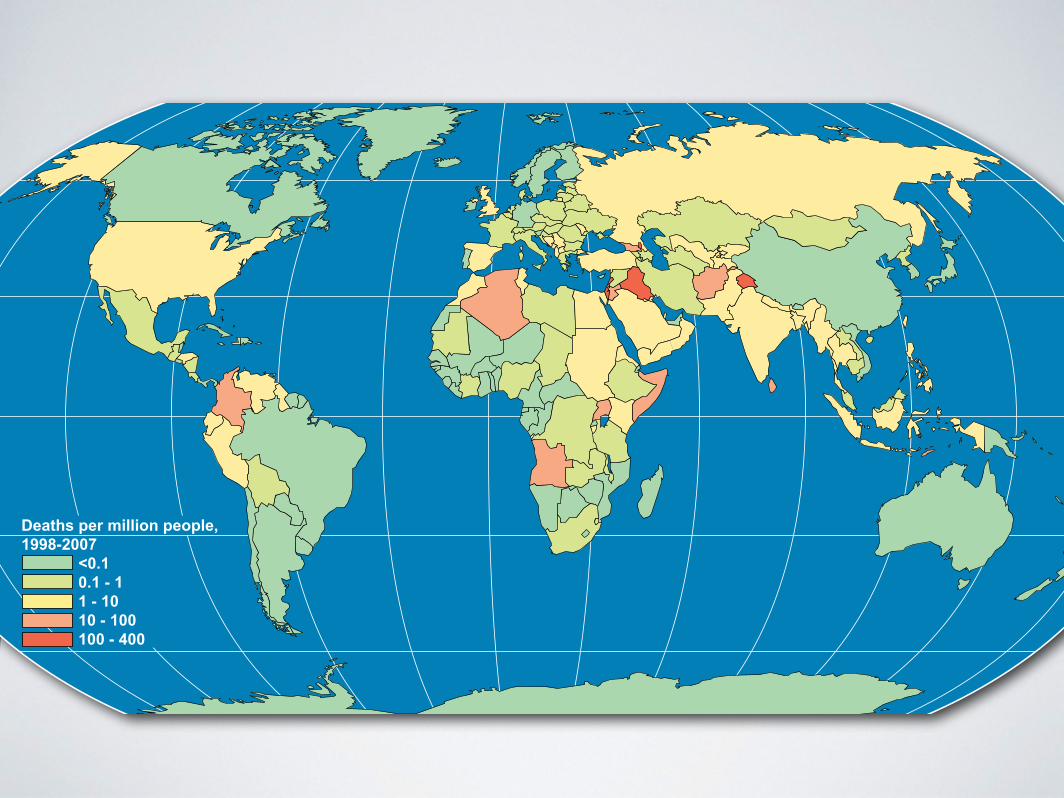
Deaths per million people,1998-2007� <0.1 � 0.1 - 1� 1 - 10 � 10 - 100� 100 - 400
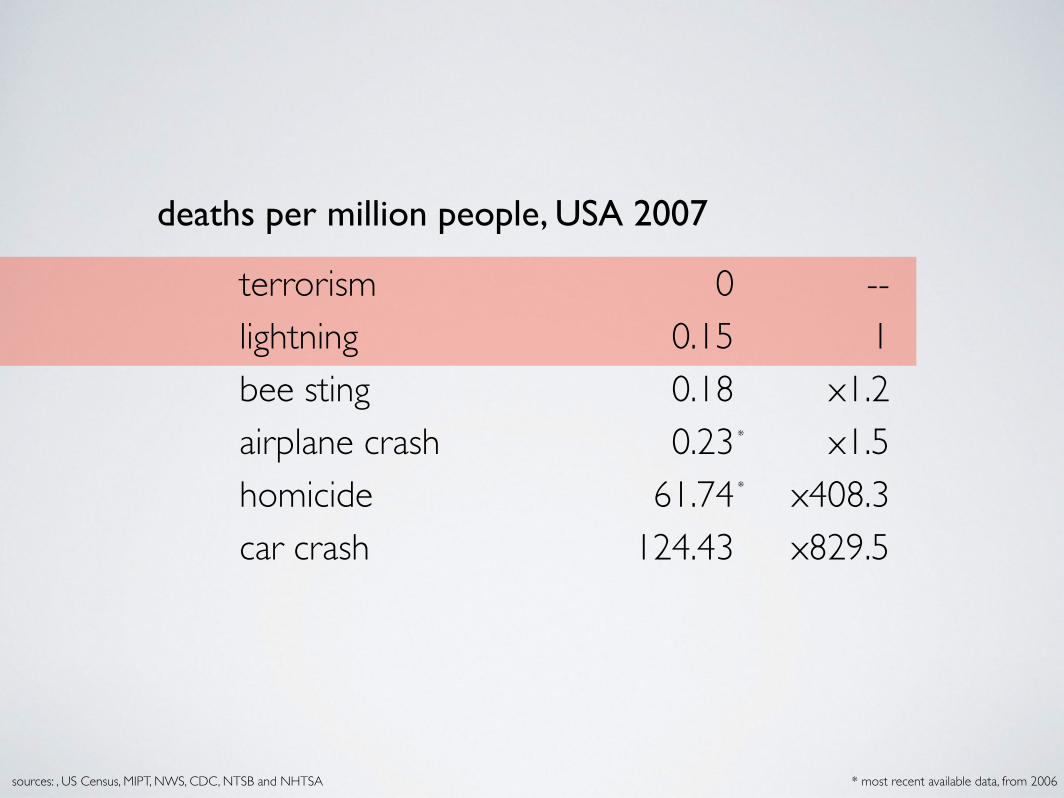
deaths per million people, USA 2007
terrorism 0lightning 0.15bee sting 0.18airplane crash 0.23homicide 61.74car crash 124.43
sources: , US Census, MIPT, NWS, CDC, NTSB and NHTSA
*
* most recent available data, from 2006
*
--1
x1.2x1.5
x408.3x829.5
terrorism
• how many people die in a terrorist event?
data analysis:
1. take all events
2. count # times 1 death, 2 deaths, etc.
3. visualize as distribution
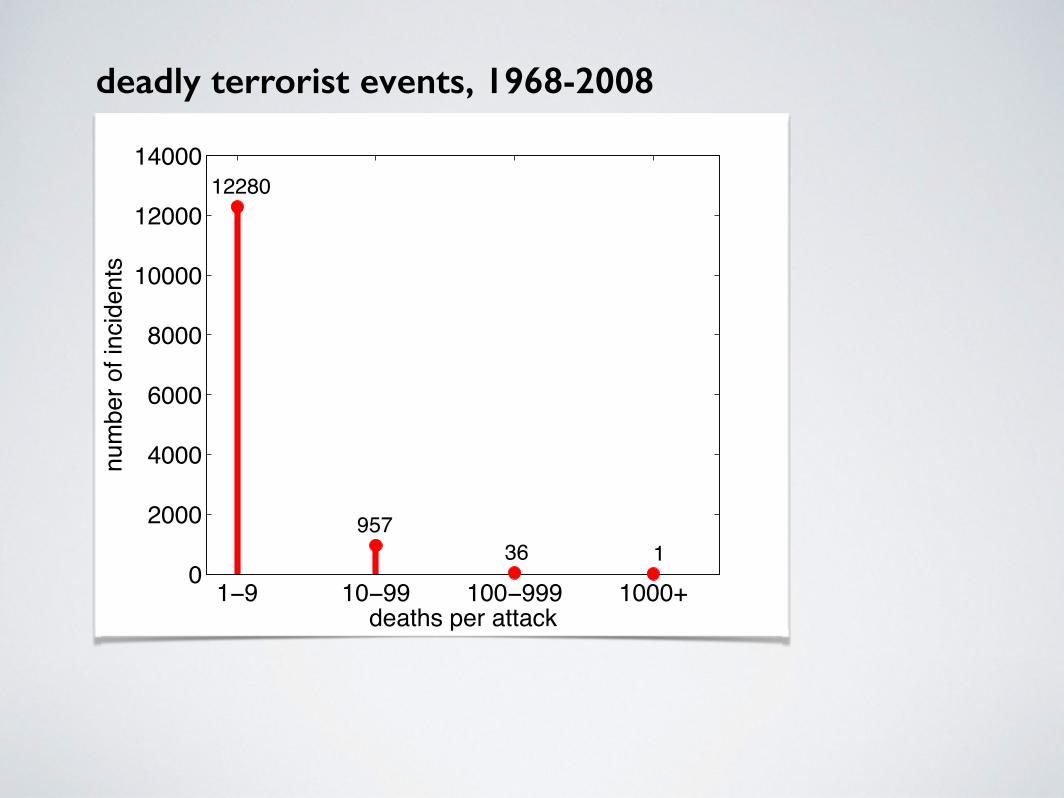
1−9 10−99 100−999 1000+0
2000
4000
6000
8000
10000
12000
1400012280
95736 1
deaths per attack
num
ber o
f inc
iden
tsdeadly terrorist events, 1968-2008

1−9 10−99 100−999 1000+0
2000
4000
6000
8000
10000
12000
1400012280
95736 1
deaths per attack
num
ber o
f inc
iden
ts
“normal,” 92%
large, 8%{{{ very large, 0.3%
deadly terrorist events, 1968-2008

1 10 100 1000 10000
0.01%
0.1%
1%
10%
100%
deaths per attack
perc
ent w
ith g
reat
er s
ever
ity large events 8%
deadly terrorist events, 1968-2008
9-11
{
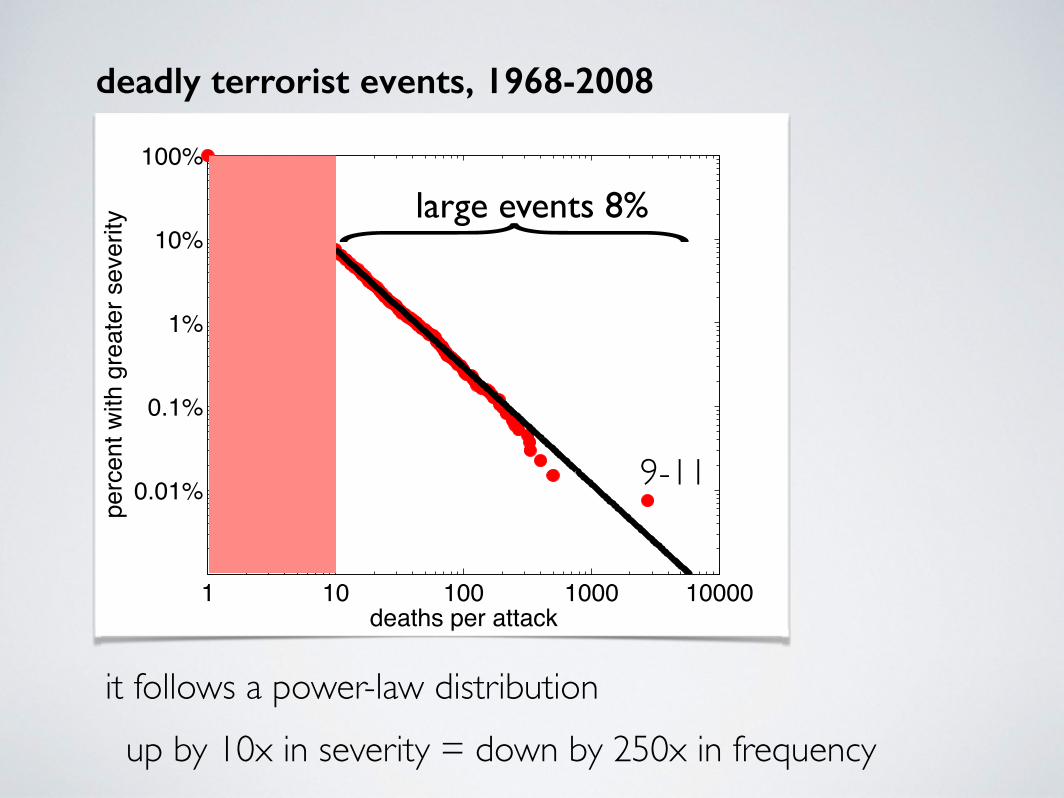
it follows a power-law distribution up by 10x in severity = down by 250x in frequency
1 10 100 1000 10000
0.01%
0.1%
1%
10%
100%
deaths per attack
perc
ent w
ith g
reat
er s
ever
ity
9-11
deadly terrorist events, 1968-2008
large events 8%{

terrorism
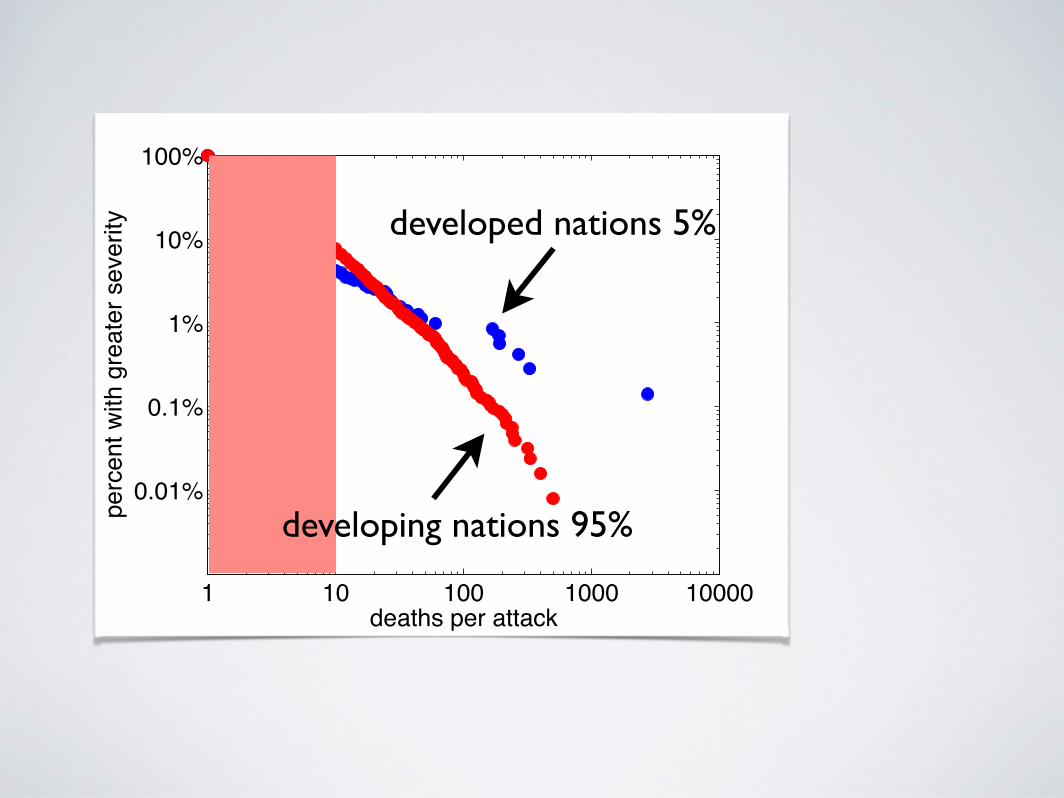
• do big events happen everywhere equally?
data analysis:
1. divide events by (i) developed nation or (ii) developing nation
2. for each type, count # times 1 death, 2 deaths, etc.
3. visualize the two distributions
1 10 100 1000 10000
0.01%
0.1%
1%
10%
100%
deaths per attack
perc
ent w
ith g
reat
er s
ever
ity developed nations 5%
developing nations 95%
terrorism
• how long do terrorist groups last?
data analysis:
1. for each unique terrorist group
2. count # years between oldest and newest event
3. then count # groups with 1 year, 2 years, etc. of activity
4. visualize the distribution
1. Revolutionary Armed Forces of Colombia (FARC) 2. Hamas 3. Taliban 4. Basque Fatherland and Freedom (ETA) 5. Communist Party of Nepal-Maoist (CPN-M) 6. National Liberation Army (Colombia) 7. Palestinian Islamic Jihad (PIJ) 8. Liberation Tigers of Tamil Eelam (LTTE) 9. al-Fatah 10. Communist Party of India-Maoist 11. al-Qaeda Organization in the Land of the Two Rivers 12. Anti-Castro Cubans 13. Hezbollah 14. Fronte di Liberazione Naziunale di a Corsica (FLNC) 15. Shining Path 16. Islamic State of Iraq 17. Popular Front for the Liberation of Palestine (PFLP) 18. United Liberation Front of Assam (ULFA) 19. al-Aqsa Martyrs Brigades 20. Kurdistan Workers' Party (PKK) 21. Tupac Amaru Revolutionary Movement 22. Ansar al-Sunnah Army 23. Black September 24. New People's Army (NPA) 25. Abu Nidal Organization (ANO) 26. Mujahideen Shura Council 27. Armenian Secret Army for the Liberation of Armenia 28. Irish Republican Army (IRA) 29. Revolutionary People’s Liberation Party/Front
(DHKP/C) 30. People's War Group (PWG) 31. United Self-Defense Forces of Colombia (AUC) 32. Jewish Defense League (JDL) 33. Amal 34. Armed Islamic Group 35. Palestine Liberation Organization (PLO) 36. Earth Liberation Front (ELF) 37. Abu Sayyaf Group (ASG) 38. Popular Resistance Committees 39. Manuel Rodriguez Patriotic Front 40. Revolutionary Organization 17 November (RO-N17) 41. al-Qaeda Organization in the Islamic Maghreb 42. Baloch Liberation Army (BLA) 43. Revolutionary People's Struggle 44. Red Army Faction 45. Islamic Army in Iraq
45. Democratic Front for the Liberation of Palestine (DFLP) 46. UNITA 47. Revolutionary Nuclei 48. al-Gama'a al-Islamiyya (GAI) 49. Free Aceh Movement (GAM) 50. Kurdistan Freedom Hawks 51. April 19 Movement 52. Lord's Resistance Army (LRA) 53. Moro Islamic Liberation Front (MILF) 54. Real Irish Republican Army (RIRA) 55. al-Qaeda 56. Tawhid and Jihad 57. Popular Liberation Army 58. Eritrean Liberation Front (ELF) 59. Montoneros 60. Turkish Communist Party Marxist-Leninist (TKP/ML-
TIKKO) 61. Mozambique National Resistance Movement 62. Ulster Defence Association/Ulster Freedom Fighters 63. Purbo Banglar Communist Party (PBCP) 64. National Liberation Front of Tripura (NLFT) 45. First of October Antifascist Resistance Group (GRAPO) 46. Red Hand Defenders (RHD) 47. Lashkar-e-Taiba (LeT) 48. Hizbul Mujahideen (HM) 49. Mujahideen Youth Movement 50. Bersatu 51. People's Revolutionary Army (Argentina) 52. Farabundo Marti National Liberation Front 53. Jaish-e-Mohammad (JeM) 54. Islamic Jihad Jerusalem 55. Peronist Armed Forces 56. Khmer Rouge 57. Justice Commandos for the Armenian Genocide 58. Continuity Irish Republican Army (CIRA) 59. PKK/KONGRA-GEL 60. National Democratic Front of Bodoland (NDFB) 61. Lautaro Youth Movement 62. Action Directe 63. Polisario Front 64. Mujahedin-e-Khalq (MeK) 65. Maoist Communist Center (MCC) 66. Popular Forces of April 25 67. Third of October Group 68. Baader-Meinhof Group 69. Breton Revolutionary Army (ARB)
1. Orly Organization 2. People's Liberation Forces (El Salvador) 3. Front for the Liberation of the Cabinda Enclave 4. Abu al-Rish Brigades 5. African National Congress (South Africa) 6. Moro National Liberation Front (MNLF) 7. Islamic Great Eastern Raiders Front 8. Palestinian Revolution Forces General Command 9. Chukakuha 10. Communist Combatant Cells 11. Popular Front for the Liberation of Palestine -- General
Command (PFLP-GC) 12. Red Brigades 13. Japanese Red Army (JRA) 14. Animal Liberation Front (ALF) 15. Committee of Solidarity with Arab and Middle East
Political Prisoners (CSPPA) 16. Front for the Liberation of Lebanon from Foreigners
(FLLF) 17. Jamatul Mujahedin Bangladesh 18. Informal Anarchist Federation 19. Sudan People's Liberation Army 20. Ninth of June Organization 21. Guerrilla Army of the Poor 22. Loyalist Volunteer Force (LVF) 23. Anti-Imperialist International Brigade 24. All Tripura Tiger Force (ATTF) 25. People's Revolutionary Army (Colombia) 26. Social Resistance 27. Arab Communist Organization (ACO) 28. Anti-Terrorist Liberation Group 29. Riyad us-Saliheyn Martyrs' Brigade 30. Kosovo Liberation Army (KLA) 31. Lashkar-e-Jhangvi (LeJ) 32. Revolutionary United Front (RUF) 33. Jamiat ul-Mujahedin (JuM) 34. Alex Boncayao Brigade (ABB) 35. Pattani United Liberation Organization (PULO) 36. Group Bakunin Gdansk Paris Guatemala Salvador 37. Irish National Liberation Army (INLA) 38. Revolutionary Struggle 39. Lebanese Armed Revolutionary Faction 40. Ananda Marga 41. Tupamaros 42. ....
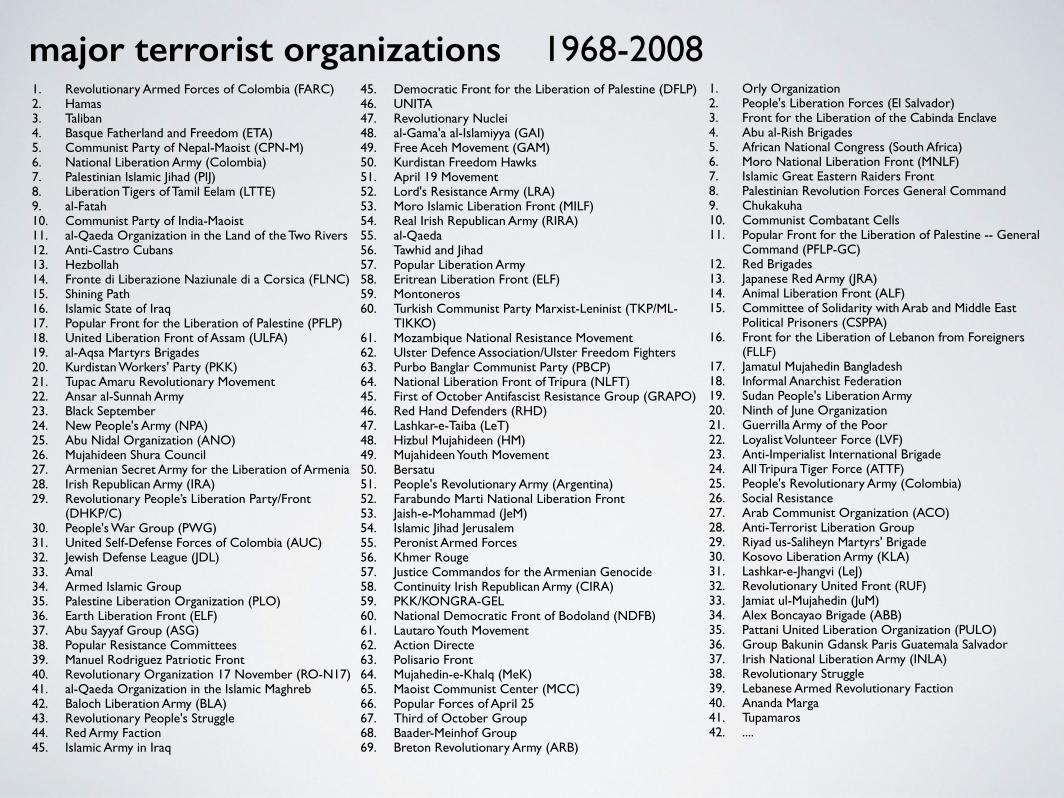
major terrorist organizations 1968-2008

1 2−4 5−9 10−19 20−39 40+0
50
100
150
200
250247
5234 27 22
1
years of activity
num
ber o
f gro
ups
“one-hit wonders” 65%
long-lived 35%{{

terrorism
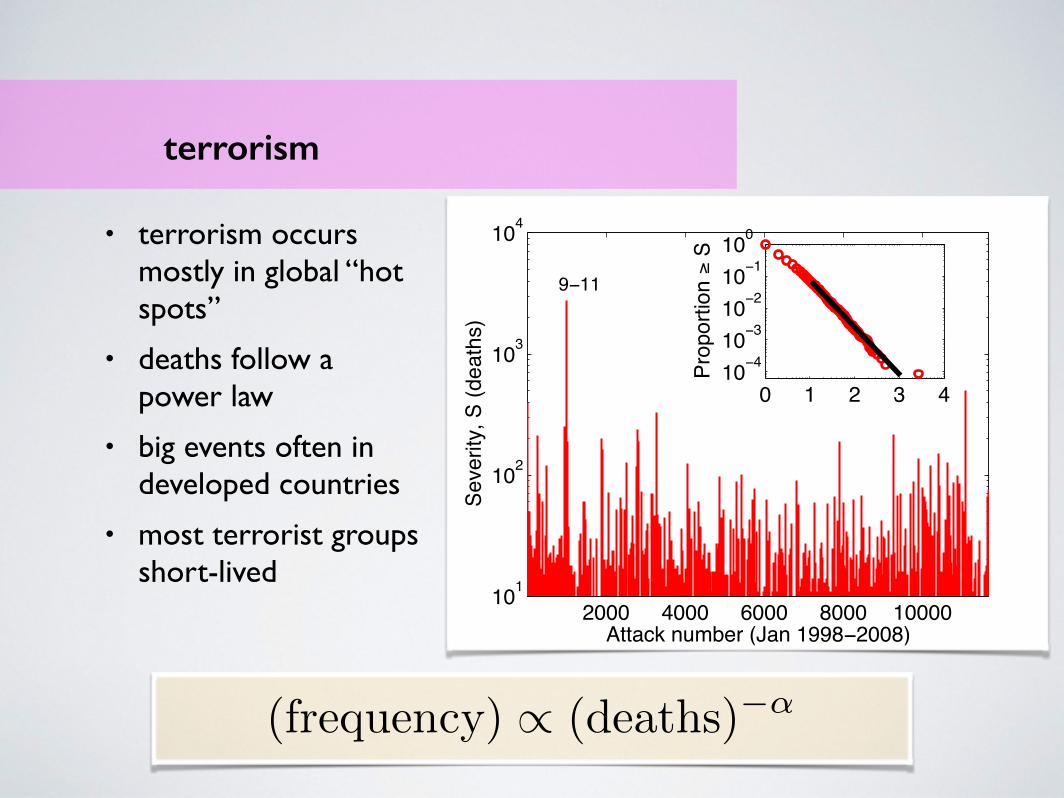
2000 4000 6000 8000 10000101
102
103
104
Seve
rity,
S (d
eath
s)
Attack number (Jan 1998−2008)
9−11
0 1 2 3 410−410−310−210−1100
Prop
ortio
n *
S
terrorism
(frequency) / (deaths)�↵
• terrorism occurs mostly in global “hot spots”
• deaths follow a power law
• big events often in developed countries
• most terrorist groups short-lived

what else follows power laws?
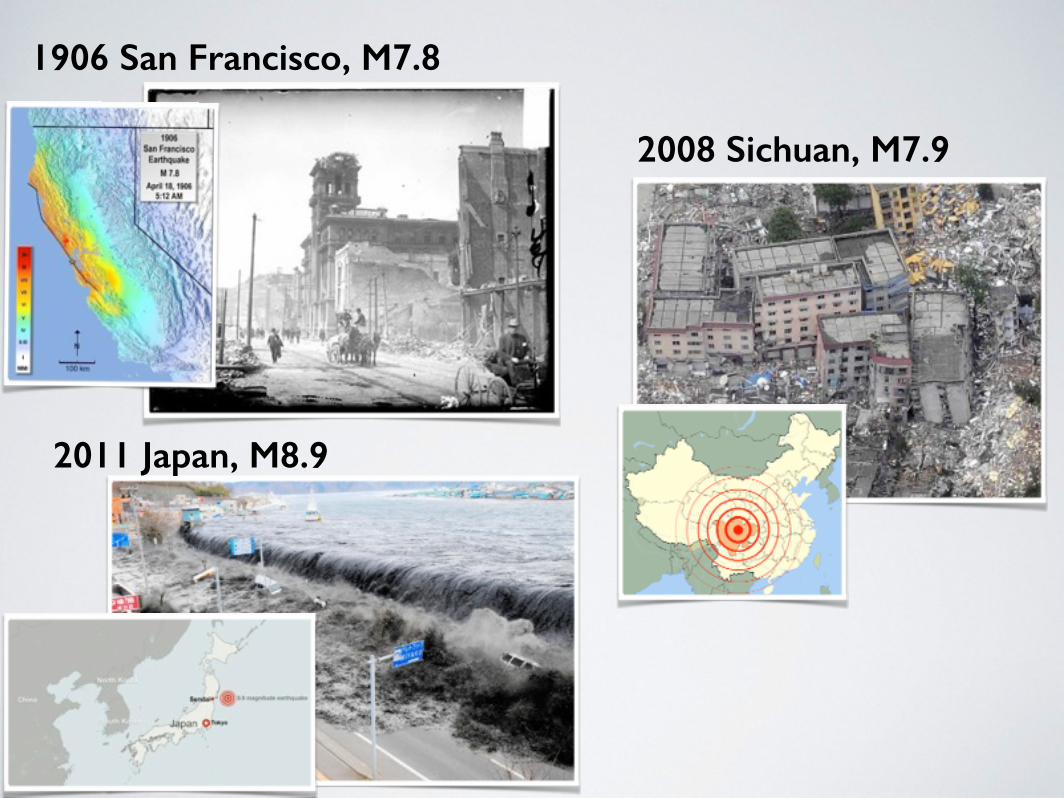
1906 San Francisco, M7.8
2008 Sichuan, M7.9
2011 Japan, M8.9

earthquakes
earthquake physics
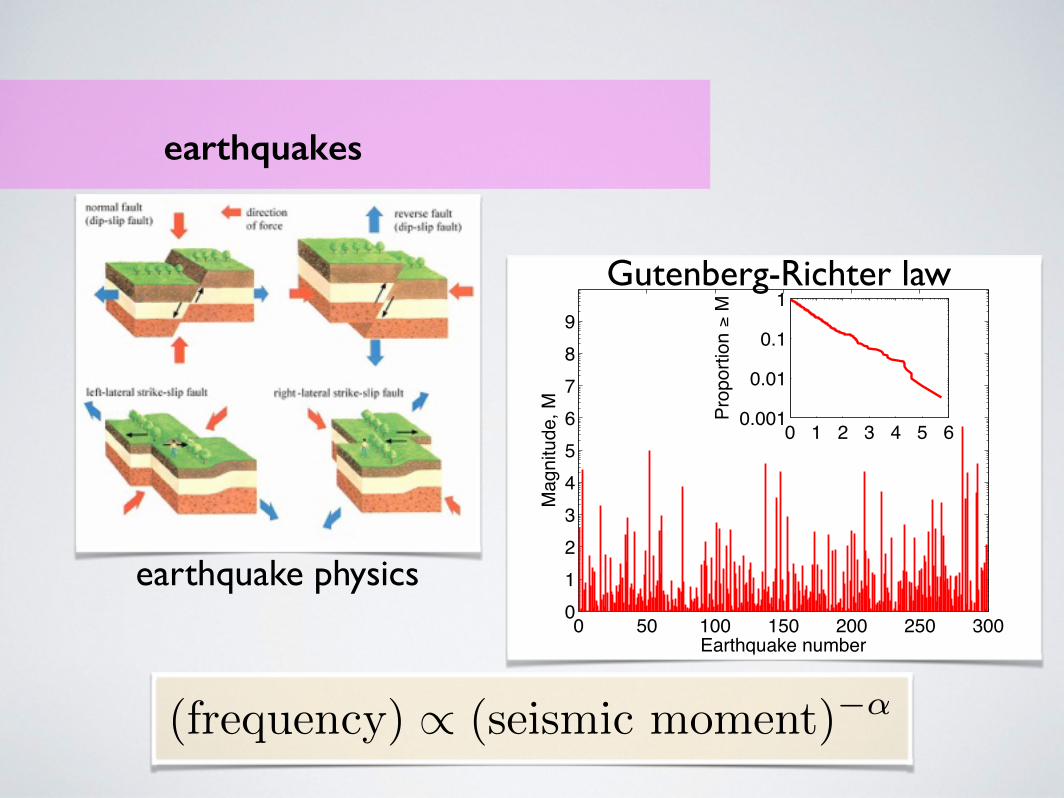
0 50 100 150 200 250 3000123456789
Mag
nitu
de, M
Earthquake number
0 1 2 3 4 5 60.001
0.01
0.1
1
Prop
ortio
n *
M(frequency) / (seismic moment)
�↵
earthquakes
Gutenberg-Richter law
earthquake physics
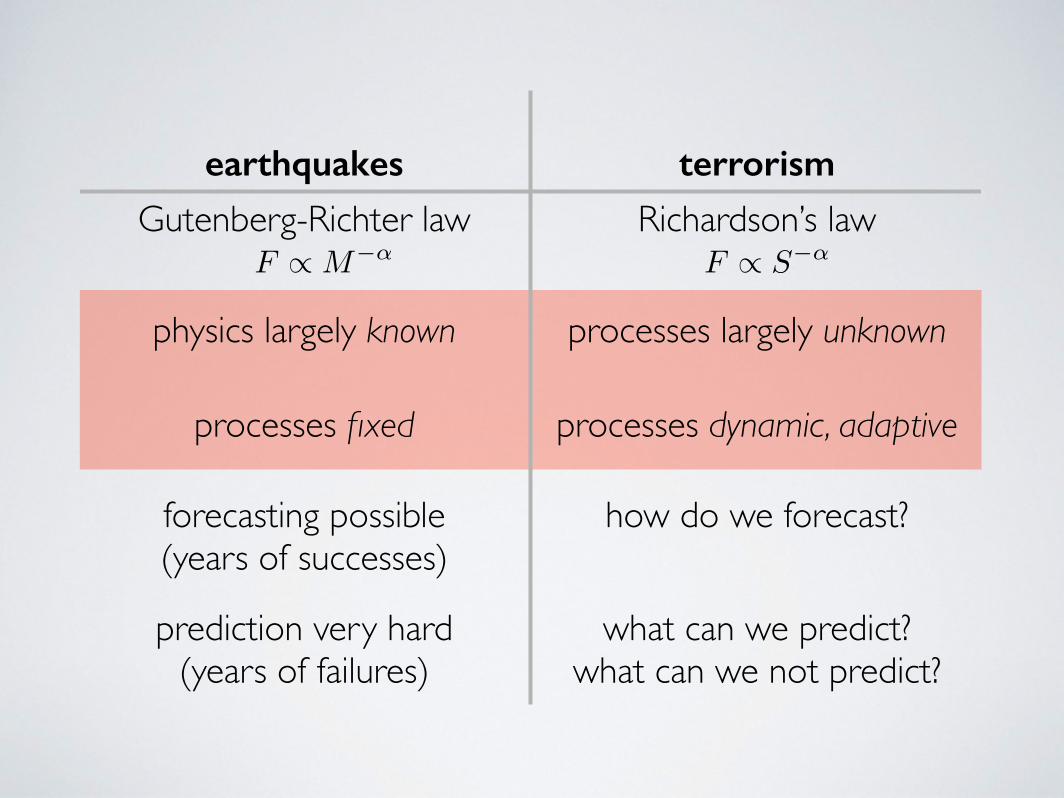
earthquakes terrorism
Gutenberg-Richter law Richardson’s law
physics largely known processes largely unknown
processes fixed processes dynamic, adaptive
forecasting possible (years of successes)
how do we forecast?
prediction very hard (years of failures)
what can we predict? what can we not predict?
F / M�↵ F / S�↵

data, data, data
data, data, data
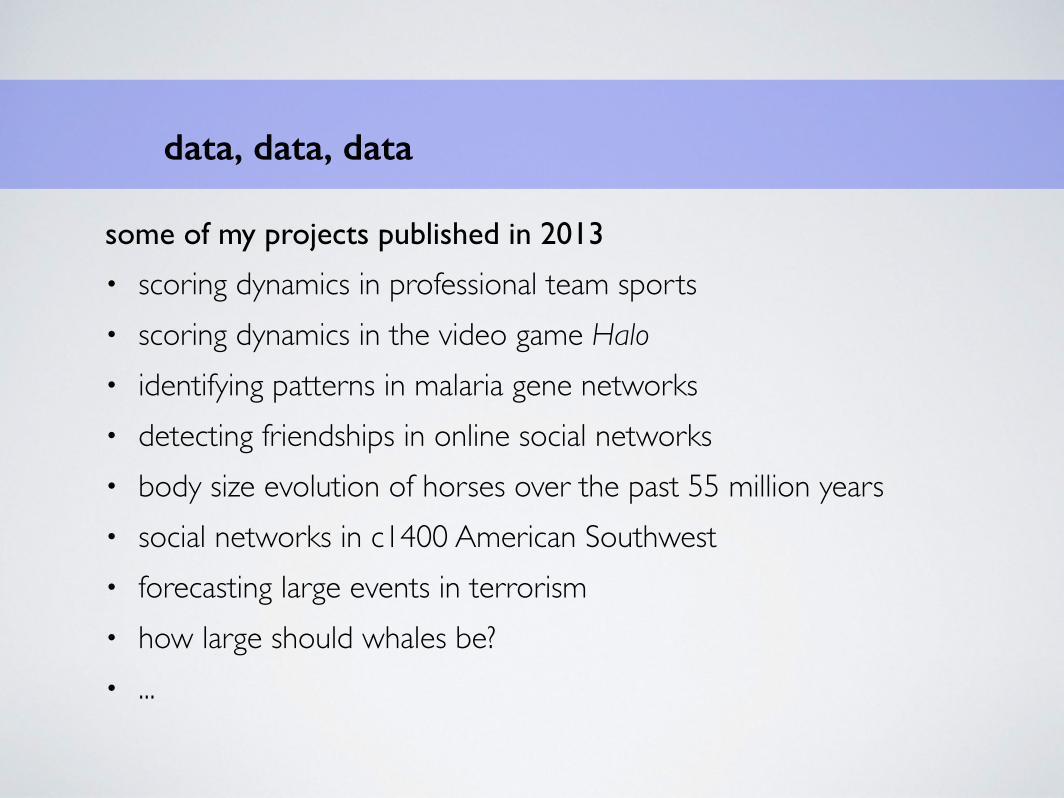
some of my projects published in 2013
• scoring dynamics in professional team sports • scoring dynamics in the video game Halo • identifying patterns in malaria gene networks • detecting friendships in online social networks • body size evolution of horses over the past 55 million years • social networks in c1400 American Southwest • forecasting large events in terrorism • how large should whales be? • ...
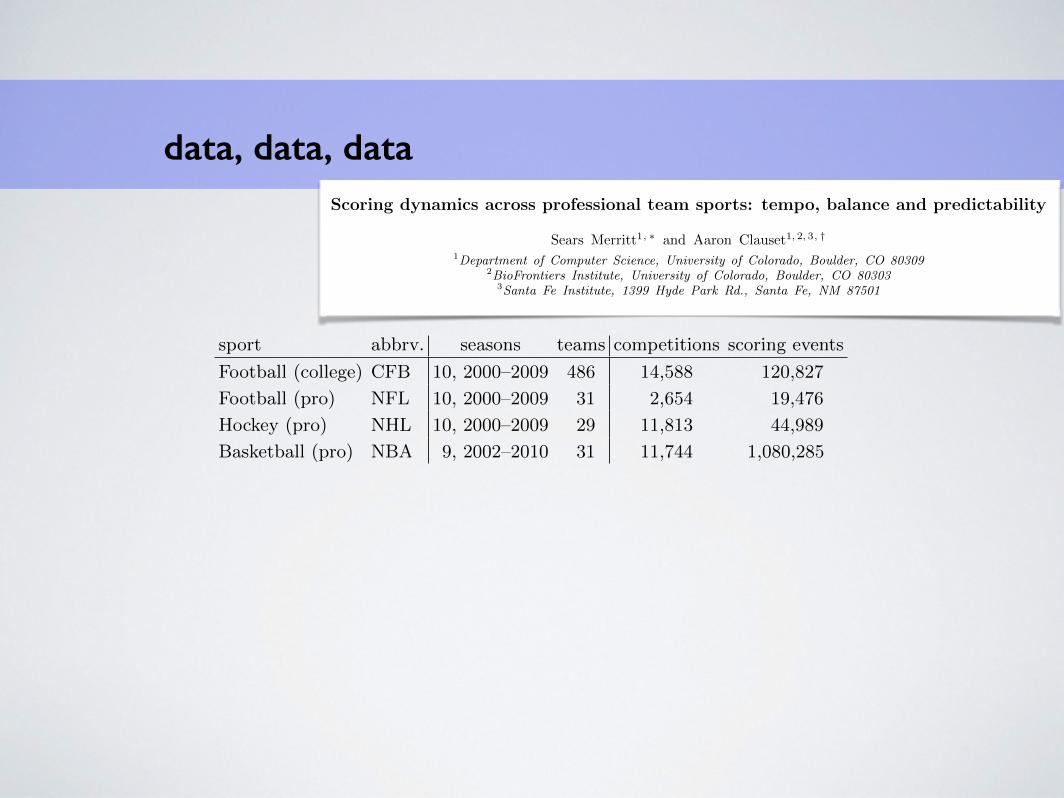
data, data, dataScoring dynamics across professional team sports: tempo, balance and predictability
Sears Merritt1, ⇤ and Aaron Clauset1, 2, 3, †
1Department of Computer Science, University of Colorado, Boulder, CO 803092BioFrontiers Institute, University of Colorado, Boulder, CO 80303
3Santa Fe Institute, 1399 Hyde Park Rd., Santa Fe, NM 87501
Despite growing interest in quantifying and modeling the scoring dynamics within professionalsports games, relative little is known about what patterns or principles, if any, cut across di↵erentsports. Using a comprehensive data set of scoring events in nearly a dozen consecutive seasons ofcollege and professional (American) football, professional hockey, and professional basketball, weidentify several common patterns in scoring dynamics. Across these sports, scoring tempo—whenscoring events occur—closely follows a common Poisson process, with a sport-specific rate. Simi-larly, scoring balance—how often a team wins an event—follows a common Bernoulli process, witha parameter that e↵ectively varies with the size of the lead. Combining these processes withina generative model of gameplay, we find they both reproduce the observed dynamics in all foursports and accurately predict game outcomes. These results demonstrate common dynamical pat-terns underlying within-game scoring dynamics across professional team sports, and suggest specificmechanisms for driving them. We close with a brief discussion of the implications of our results forseveral popular hypotheses about sports dynamics.
Professional team sports like American football, soc-cer, hockey, basketball, etc. provide a rich and relativelywell-controlled domain by which to study fundamentalquestions about the dynamics of competition. In thesesports, most environmental irregularities are eliminated,players are highly trained, and rules are enforced consis-tently. These features produce a level playing field onwhich competition outcomes are determined largely bya combination of skill and luck (ideally more the formerthan the latter).
Modern sports in particular produce large quantitiesof detailed data describing not only competition out-comes and team characteristics, but also the individualevents within a competition, e.g., scoring events, refereecalls, timeouts, ball possessions, court positions, etc. Theavailability of such data has enabled many quantitativeanalyses of individual sports [1–6]. Relatively little work,however, has asked what patterns or principles, if any, cutacross di↵erent sports, or whether there are fundamentalprocesses governing some dynamical aspects of all suchcompetitions. These questions are the focus of this study,and our results shed light on several other phenomena,including the roles of skill and luck in determining out-comes, and the extent to which events early in the gameinfluence events later in the game.
Game theory provides an attractive quantitativeframework for understanding the principles and dynam-ics of competition [7]. Given a set of payo↵s for di↵er-ent actions, formal game theory can identify the optimalstrategy or probability distribution over actions againstan intelligent adversary. In simple decision spaces, likepenalty shots in soccer [8] or serve-and-return play in ten-nis [9], professional athletes appear to behave as gametheory predicts (although some do not [10]). However,
most professional team sports exhibit large and complexdecision spaces, with many possible actions of uncertainpayo↵s, and execution is carried out by an imperfectlycoordinated team. Game theory provides less guidancewithin such complex games, and the resulting dynam-ics are often better described using tools from dynamicalsystems [11, 12].Using such an approach, we investigate the within-
game scoring dynamics of four team sports, college andprofessional (American) football, professional hockey,and professional basketball. Our primary goals are (i) toquantify and identify the common empirical patterns inscoring dynamics of these sports, and (ii) to understandthe competitive processes that produce these patterns.We do not consider non-stationary e↵ects across games,e.g., evolving team rosters or skill sets, playing field vari-ables, etc. Instead, we focus explicitly on the sequenceof scoring events within games. For each sport, we studythree measurable quantities: scoring event tempo, bal-ance, and predictability. We take an inferential approachto investigating their cross-sport patterns and present agenerative model of competition dynamics that can befitted directly to scoring event data within games. Weapply this model to a comprehensive data set of 1,279,901scoring events across 9 or 10 years of consecutive seasonsin our four team sports.There are many claims in both the academic litera-
ture and the popular press about scoring dynamics withinsports, and sports are often used as exemplars of decisionmaking and dynamics in complex competitive environ-ments [10, 13–15]. Our results on common patterns inscoring dynamics and the processes that generate themserve to clarify, and in several cases directly contradict,many of these claims, and provide a systematic perspec-tive on the general phenomenon.Summary of results. Here we provide a brief summary
of our results, and Table IV presents them in the form ofa series of specific questions and answers.
arX
iv:1
310.
4461
v1 [
stat.A
P] 1
6 O
ct 2
013
3
sport abbrv. seasons teams competitions scoring events
Football (college) CFB 10, 2000–2009 486 14,588 120,827
Football (pro) NFL 10, 2000–2009 31 2,654 19,476
Hockey (pro) NHL 10, 2000–2009 29 11,813 44,989
Basketball (pro) NBA 9, 2002–2010 31 11,744 1,080,285
TABLE I. Summary of data for each sport, including total number of seasons, teams, competitions, and scoring events.
independence, this probability is
Pr(�Sr(t)=k) =
Pr(event at t)⇥ Pr(r scores)⇥ Pr(points=k) . (1)
The evolution of the di↵erence in these scores thus followsan finite-length unbiased random walk on the integers,moving left or right with equal probability, starting at�S = 0 at t = 0.
Real competitions will deviate from this ideal becausethey possess various non-ideal features. The type andsize of such deviations are evidence for competitive mech-anisms that drive the scoring dynamics away from theideal.
II. SCORING EVENT DATA
Throughout our analyses, we utilize a comprehensivedata set of all points scored in league games of consecu-tive seasons of college-level American football (NCAA Di-visions 1–3, 10 seasons; 2000–2009), professional Ameri-can football (NFL, 10 seasons; 2000–2009), professionalhockey (NHL, 10 seasons; 2000–2009), and professionalbasketball (NBA, 9 seasons, 2002–2010).[19] Each scor-ing event includes the time at which the event occurred,the player and corresponding team that won the event,and the number of points it was worth. From these, weextract all scoring events that occurred during regulationtime (i.e., we exclude all overtime events), which accountfor 99% or more of scoring events in each sport, and wecombine events that occur at the same second of gametime. Table I summarizes these data, which encompassmore than 1.25 million scoring events across more than40,000 games.
A brief overview of each sport’s primary game mechan-ics is provided in Appendix A. In general, games in thesesports are competitions between two teams of fixed size,and points are accumulated each time one team placesthe ball or puck in the opposing team’s goal. Playingfields are flat, featureless surfaces. Gameplay is dividedinto three or four scoring periods within a maximum of48 or 60 minutes (not including potential overtime). Theteam with the greatest score at the end of this time isdeclared the winner.
III. GAME TEMPO
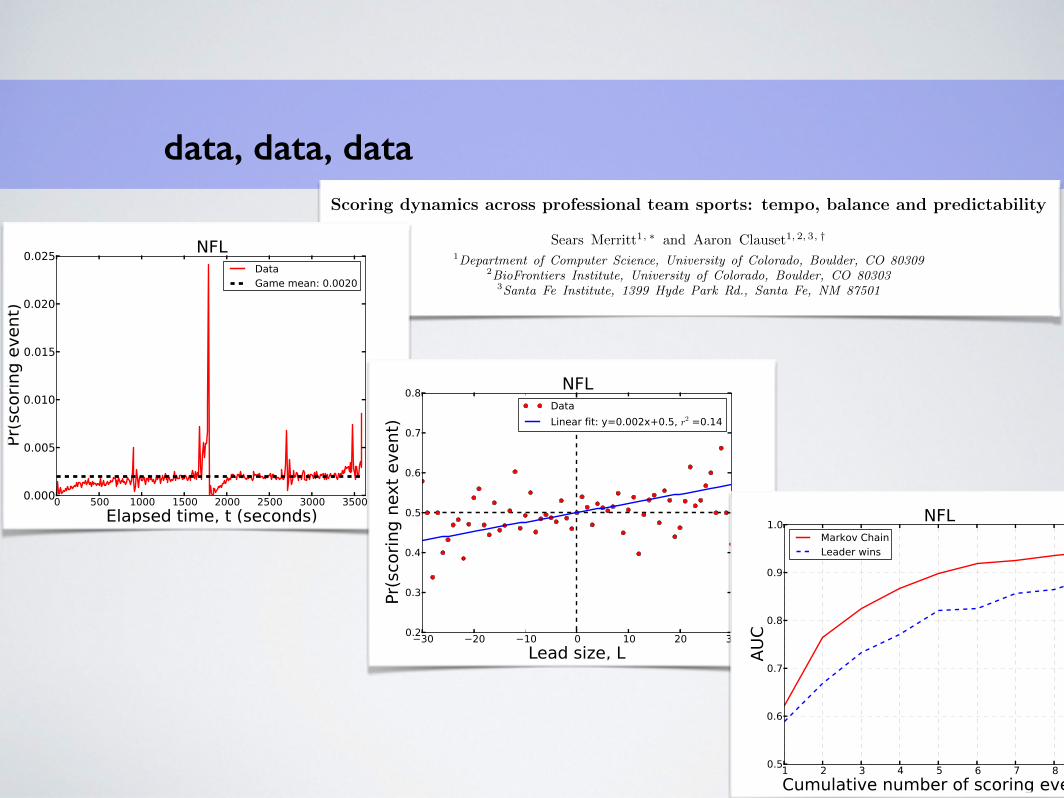
A game’s “tempo” is the speed at which scoring eventsoccur over the course of play. Past work on the timing ofscoring events has largely focused on hockey and basket-ball [3, 5], with little work examining football or in con-trasting patterns across sports. However, these studiesshow strong evidence that game tempo is well approxi-mated by a homogenous Poisson process, in which scoringevents occur at each moment in time independently withsome small and roughly constant probability.Analyzing the timing of scoring events across all four of
our sports, we find that the Poisson process is a remark-ably good model of game tempo, yielding predictions thatare in good or excellent agreement with a variety of sta-tistical measures of game play. Furthermore, these re-sults confirm and extend previous work [5, 13] showinglittle or no evidence for the popular belief in “momen-tum” or “hot hands,” in which scoring once increases theprobability of scoring again very soon. However, we dofind some evidence for modest non-Poissonian patternsin tempo, some of which are common to all four sports.
A. The Poisson model of tempo
A Poisson process is fully characterized by a single pa-rameter �, representing the probability that an event oc-curs, or the expected number of events, per unit time. Ineach sport, game time is divided into seconds and thereare T seconds per a game (see Table II). For each sport,we test this model in several ways: we compare the empir-ical and predicted distributions for the number of eventsper game and for the time between consecutive scoring
sport �̂ T �̂T 1/�̂
[events / s] [s] [events / game] [s / event]
NFL 0.00204(1) 3600 7.34 490.2
CFB 0.00230(1) 3600 8.28 434.8
NHL 0.00106(1) 3600 3.81 943.4
NBA 0.03194(5) 2880 91.99 31.3
TABLE II. Tempo summary statistics for each sport, alongwith simple derived values for the expected number of eventsper game and seconds between events. Parenthetical valuesindicate standard uncertainty in the final digit.
data, data, dataScoring dynamics across professional team sports: tempo, balance and predictability
Sears Merritt1, ⇤ and Aaron Clauset1, 2, 3, †
1Department of Computer Science, University of Colorado, Boulder, CO 803092BioFrontiers Institute, University of Colorado, Boulder, CO 80303
3Santa Fe Institute, 1399 Hyde Park Rd., Santa Fe, NM 87501
Despite growing interest in quantifying and modeling the scoring dynamics within professionalsports games, relative little is known about what patterns or principles, if any, cut across di↵erentsports. Using a comprehensive data set of scoring events in nearly a dozen consecutive seasons ofcollege and professional (American) football, professional hockey, and professional basketball, weidentify several common patterns in scoring dynamics. Across these sports, scoring tempo—whenscoring events occur—closely follows a common Poisson process, with a sport-specific rate. Simi-larly, scoring balance—how often a team wins an event—follows a common Bernoulli process, witha parameter that e↵ectively varies with the size of the lead. Combining these processes withina generative model of gameplay, we find they both reproduce the observed dynamics in all foursports and accurately predict game outcomes. These results demonstrate common dynamical pat-terns underlying within-game scoring dynamics across professional team sports, and suggest specificmechanisms for driving them. We close with a brief discussion of the implications of our results forseveral popular hypotheses about sports dynamics.
Professional team sports like American football, soc-cer, hockey, basketball, etc. provide a rich and relativelywell-controlled domain by which to study fundamentalquestions about the dynamics of competition. In thesesports, most environmental irregularities are eliminated,players are highly trained, and rules are enforced consis-tently. These features produce a level playing field onwhich competition outcomes are determined largely bya combination of skill and luck (ideally more the formerthan the latter).
Modern sports in particular produce large quantitiesof detailed data describing not only competition out-comes and team characteristics, but also the individualevents within a competition, e.g., scoring events, refereecalls, timeouts, ball possessions, court positions, etc. Theavailability of such data has enabled many quantitativeanalyses of individual sports [1–6]. Relatively little work,however, has asked what patterns or principles, if any, cutacross di↵erent sports, or whether there are fundamentalprocesses governing some dynamical aspects of all suchcompetitions. These questions are the focus of this study,and our results shed light on several other phenomena,including the roles of skill and luck in determining out-comes, and the extent to which events early in the gameinfluence events later in the game.
Game theory provides an attractive quantitativeframework for understanding the principles and dynam-ics of competition [7]. Given a set of payo↵s for di↵er-ent actions, formal game theory can identify the optimalstrategy or probability distribution over actions againstan intelligent adversary. In simple decision spaces, likepenalty shots in soccer [8] or serve-and-return play in ten-nis [9], professional athletes appear to behave as gametheory predicts (although some do not [10]). However,
most professional team sports exhibit large and complexdecision spaces, with many possible actions of uncertainpayo↵s, and execution is carried out by an imperfectlycoordinated team. Game theory provides less guidancewithin such complex games, and the resulting dynam-ics are often better described using tools from dynamicalsystems [11, 12].Using such an approach, we investigate the within-
game scoring dynamics of four team sports, college andprofessional (American) football, professional hockey,and professional basketball. Our primary goals are (i) toquantify and identify the common empirical patterns inscoring dynamics of these sports, and (ii) to understandthe competitive processes that produce these patterns.We do not consider non-stationary e↵ects across games,e.g., evolving team rosters or skill sets, playing field vari-ables, etc. Instead, we focus explicitly on the sequenceof scoring events within games. For each sport, we studythree measurable quantities: scoring event tempo, bal-ance, and predictability. We take an inferential approachto investigating their cross-sport patterns and present agenerative model of competition dynamics that can befitted directly to scoring event data within games. Weapply this model to a comprehensive data set of 1,279,901scoring events across 9 or 10 years of consecutive seasonsin our four team sports.There are many claims in both the academic litera-
ture and the popular press about scoring dynamics withinsports, and sports are often used as exemplars of decisionmaking and dynamics in complex competitive environ-ments [10, 13–15]. Our results on common patterns inscoring dynamics and the processes that generate themserve to clarify, and in several cases directly contradict,many of these claims, and provide a systematic perspec-tive on the general phenomenon.Summary of results. Here we provide a brief summary
of our results, and Table IV presents them in the form ofa series of specific questions and answers.
arX
iv:1
310.
4461
v1 [
stat.A
P] 1
6 O
ct 2
013

fin
more
follow me on twitter: @aaronclauset
read my blog : www.structureandstrangeness.com
read my papers : www.santafe.edu/~aaronc/