learning product - independent evaluation...
TRANSCRIPT

Financial Viability of
the Electricity Sector in
Developing Countries:
Recent Trends and Ef fectiveness of
Wor ld Bank Interventions
LEARNING PRODUCT

Financial Viability of the Electricity Sector in Developing Countries: Recent Trends and Effectiveness of World Bank Interventions
IEG Learning Product
June 30, 2016

ii
© 2016 International Bank for Reconstruction and Development / The World Bank 1818 H Street NW Washington DC 20433 Telephone: 202-473-1000 Internet: www.worldbank.org This work is a product of the staff of The World Bank with external contributions. The findings, interpretations, and conclusions expressed in this work do not necessarily reflect the views of The World Bank, its Board of Executive Directors, or the governments they represent.
The World Bank does not guarantee the accuracy of the data included in this work. The boundaries, colors, denominations, and other information shown on any map in this work do not imply any judgment on the part of The World Bank concerning the legal status of any territory or the endorsement or acceptance of such boundaries.
Rights and Permissions
The material in this work is subject to copyright. Because The World Bank encourages dissemination of its knowledge, this work may be reproduced, in whole or in part, for noncommercial purposes as long as full attribution to this work is given.
Any queries on rights and licenses, including subsidiary rights, should be addressed to World Bank Publications, The World Bank Group, 1818 H Street NW, Washington, DC 20433, USA; fax: 202-522-2625; e-mail: [email protected].

iii
Contents ACKNOWLEDGMENTS ....................................................................................................................... VII
OVERVIEW .......................................................................................................................................... VIII
Addressing the Political Economy of Sector Financial Viability ................................................................................... x Steering Clear of Complex Project Design .................................................................................................................. x Sustaining Improvements in Sector Financial Performance .......................................................................................xi
1. INTRODUCTION ........................................................................................................................ 1
Framework for Assessing the Impact of Poor Financial Performance on Electricity Sector Outcomes ...................... 1 Purpose of the Learning Product ................................................................................................................................ 3
2. RECENT TRENDS IN ELECTRICITY SECTOR FINANCIAL VIABILITY AND ACCESS OUTCOMES ........................................................................................................................................... 4
Overview of Electricity Sector Financial Performance................................................................................................. 4
Drivers of Financial Viability: Cost Recovery ........................................................................................................................... 5 Drivers of Financial Viability: Other Factors ............................................................................................................................ 7 Private Sector Participation and Electricity Sector Financial Performance ............................................................................. 8 Role of Regulation and Market Structure .............................................................................................................................. 10 The Link between Financial Performance and Sector Outcomes ......................................................................................... 10
Financial Performance and Sector Outcomes: Recent Country Experiences ........................................................... 12
3. WORLD BANK SUPPORT FOR THE FINANCIAL VIABILITY OF COUNTRY ELECTRICITY SECTORS THROUGH INVESTMENT LOANS .................................................................................... 13
Investment Loans with Financial Performance Components and Covenants ........................................................... 14
Performance of Financial Components and Covenants in Investment Loans ...................................................................... 16
4. WORLD BANK SUPPORT FOR THE FINANCIAL VIABILITY OF COUNTRY ELECTRICITY SECTORS THROUGH DEVELOPMENT POLICY OPERATIONS ....................................................... 18
DPOs with Financial Performance Components and Covenants .............................................................................. 18
Performance of Financial Components and Covenants in DPOs ......................................................................................... 20
5. LESSONS FROM ADDRESSING SECTOR FINANCIAL VIABILITY THROUGH INVESTMENT LOANS AND DPOS .............................................................................................................................. 22
Addressing the Political Economy of Sector Financial Viability ................................................................................. 22 Steering Clear of Complex Project and Operations Design ...................................................................................... 25 Sustaining Improvements in Sector Financial Performance ..................................................................................... 31
REFERENCES ...................................................................................................................................... 36
APPENDIX A: NET INCOME OF MAJOR NATIONAL ELECTRICITY UTILITIES: 2000-2013 ............. 1

iv
APPENDIX B: COST RECOVERY OF RESIDENTIAL TARIFFS, 2010 ................................................. 2
APPENDIX C. SUB-SAHARAN AFRICA: BREAKDOWN OF HIDDEN COSTS, 2014 (% OF CURRENT GDP) ....................................................................................................................................................... 3
APPENDIX D. ILLUSTRATING THE LINK BETWEEN FINANCIAL PERFORMANCE AND SECTOR OUTCOMES: FOUR RECENT COUNTRY EXPERIENCES ................................................................... 5
APPENDIX E: WORLD BANK ELECTRICITY SECTOR INVESTMENT LOANS (SIL) WITH FINANCIAL COMPONENTS/COVENANTS: FY2000-2015 ................................................................. 10
APPENDIX F: FINANCIAL KEY PERFORMANCE INDICATOR (KPI) RATINGS FOR WORLD BANK INVESTMENT PROJECTS ................................................................................................................... 13
APPENDIX G: WORLD BANK DPOS IN THE POWER SECTOR, 2000-2015 .................................... 14
APPENDIX H: FINANCIAL KEY PERFORMANCE INDICATOR (KPI) RATINGS FOR WORLD BANK DEVELOPMENT POLICY OPERATIONS ............................................................................................ 17
Boxes
Box 5.1. Turkey Programmatic Electricity Sector DPO: Lessons from a Successful Experience .......... 26
Tables
Table 2.1. Financial Performance of the Leading Electricity Utilities in Selected Developing Countries.. 5 Table 2.2. India: State-Level Cost Recovery of Residential Tariffs in 2010 ............................................. 7 Table 2.3. Sub-Saharan Africa: Breakdown of Hidden Costs for Selected Countries in 2014 (percent of current GDP) ........................................................................................................................................... 8 Table 3.1. Selected CASs and CPSs: Analysis and Proposed Policy Actions for Financial Viability and Affordability in Electricity Sectors .......................................................................................................... 14 Table 3.2. Investment Loans with Sector Financial Performance Components and Covenants by Region (FY2000–15) ......................................................................................................................................... 15 Table 3.3. Investment Loans with Sector Financial Performance Components and Covenants by Income Level (FY2000–15) ................................................................................................................................ 15 Table 3.4. Rating of Financial Key Performance Indicators for World Bank Investment Projects .......... 16 Table 3.5. Compliance with Financial Covenants under Investment Operations ................................... 17 Table 4.1. DPOs with Sector Financial Performance Objectives and Conditionalities by Region (FY2000–15) ......................................................................................................................................... 19 Table 4.2. DPOs with Sector Financial Performance Objectives and Conditionalities by Income Level (FY2000–15) ......................................................................................................................................... 19 Table 4.3. Financial Key Performance Indicator Ratings for Development Policy Operations ............... 20 Table 4.4. Rating of Financial Key Performance Indicators, Sector-Specific DPOs versus Broad-Spectrum DPOs .................................................................................................................................... 21
v
Figures
Figure 1.1. Electricity Access Results Framework Highlighting Financial Viability .................................. 2 Figure 2.1. Peru: Electricity Distribution Losses in Private versus Public Utilities ................................... 9 Figure 2.2. Tariff Cost Recovery and Quality of Electricity Supply in Sub-Saharan Africa .................... 11 Figure 2.3. Quasi-Fiscal Deficit and Reliability of Electricity Supply in Sub-Saharan Africa, 2014–15 .. 12
vi
Abbreviations
APL adaptable program loan CAS country assistance strategy CPS country partnership strategy DPO development policy operation EVN Vietnam Electricity (national utility) FY fiscal year GDP gross domestic product ICR Implementation Completion and Results Report ICRR Implementation Completion and Results Report Review IDA International Development Association IEG Independent Evaluation Group IFC International Finance Corporation KEGOC Kazakhstan Electricity Grid Operating Company KPI key performance indicator SENELEC Société National d'Éléctricité du Sénégal (national electricity company of Senegal) SSA Sub-Saharan Africa T&D transmission and distribution UBEDN Ulaanbaatar Electricity Distribution Company All dollar amounts are U.S. dollars unless otherwise indicated.
Evaluation Managers
Caroline Heider Director-General, Evaluation Marvin Taylor-Dormond Director, Financial, Private Sector and Sustainable Development Midori Makino Manager, Sustainable Development Ramachandra Jammi Task Manager
vii
Acknowledgments
This Independent Evaluation Group (IEG) learning product was written by Istvan Dobozi, consultant and former lead energy economist, and Ebru Karamete, evaluation specialist and extended term consultant, IEG Sustainable Development Division (IEGSD), with research assistance from Yun Sun Li, Thao Thi Phuong Nguyen, and Chiara Odetta Rogate, all consultants, IEGSD. Ramachandra Jammi, Senior Evaluation Officer, IEGSD, was the task team leader for this product, which was prepared under the direction of Marvin Taylor-Dormond (Director, IEGSP) and Midori Makino (Manager, IEGSD), and the guidance of Caroline Heider (Director General, Evaluation). The report was peer reviewed by Sheoli Pargal, Lead Energy Economist, and Sunil Mathrani, Senior Energy Specialist. Richard Kraus formatted the document.
viii
Overview
This Independent Evaluation Group (IEG) Learning Product addresses the effectiveness of World Bank interventions during fiscal years (FY) 2000–15 in supporting client countries for improving the financial performance and long-term viability of their electricity sectors. Like other IEG learning products, this study is a synthesis of evaluation findings, cross-cutting lessons, and good practices from existing IEG evaluations, supplemented with a targeted literature review.
The World Bank supports client countries in improving the financial performance and viability of their electricity sectors principally through financial or institutional development components and financial covenants in investment loans, and through conditionalities in development policy operations (DPOs). Technical assistance projects, policy advice, and economic and sector work complement these in some cases. A significant number of investment projects—especially in the 1990s and 2000s—used components and covenants covering financial recovery plans, utility debt restructuring, payment collection improvement, tariff methodology and adjustment, and operations performance improvement. In recent years, DPOs were used more often to support financial performance improvements in the electricity sector. Generally, DPOs provided untied, quick-disbursing direct budget financing to governments for policy and institutional reforms aimed at achieving a set of sector-specific development results. Overall, investment projects and DPOs adequately identify sector financial performance drivers.
This study compiled a comprehensive inventory of World Bank electricity sector investment projects approved during FY2000–15 that contain components and covenants for improving sector financial performance and viability. Of the 41 projects identified, ten were in the Sub-Saharan Africa Region (the region with the lowest electricity access), which accounted for about 25 percent of total investment lending. By income category, ten of the projects were in low-income countries. The study also produced an updated list of DPOs approved during FY2000–15 with electricity sector financial viability objectives. Of the 49 DPOs identified, 18 (37 percent) were in Sub-Saharan Africa, accounting for 12 percent of total DPO lending.
IEG conducted a targeted literature survey to compile the latest analysis on electricity sector financial viability in developing countries and compiled the leading electricity utilities’ profitability trends between 2003 and 2013 for a sample of 40 World Bank client countries. The study uses available data to characterize an empirical relationship between sector financial performance and sector outcomes.
ix
This study’s analysis shows that most investment loans with financial components and covenants for the electricity sector show a moderately satisfactory or better performance regarding their financial performance objectives. However, IEG rated most DPOs moderately unsatisfactory or lower for their electricity sector financial viability objectives. Several factors explain these findings. For investment loans, it is likely that the relatively long implementation periods allow more time for the gradual realization of politically sensitive financial reforms and measures while the World Bank’s phased loan disbursements provide some leverage. DPOs are more likely to be concerned with deep sector reforms, which often evolve along different time lines than DPOs. The mismatch between the time horizon of sector reform programs and the usually short period for effective government action in the DPO context may contribute to reducing the efficacy of these interventions.
The proportion of sector-specific DPOs in the study sample with moderately satisfactory or better financial outcomes is significantly higher than the corresponding proportion for broad-spectrum DPOs that cover several themes or sectors (75 percent versus 37 percent). IEG found no significant difference in financial performance outcomes between regions for either DPOs or investment loans, and found no statistically significant correlation between financial sustainability key performance indicator ratings and overall project outcome ratings for both the DPOs and investment loans. An analysis of the latest country assistance and country partnership strategies for the countries with DPOs, investment loans, or both analyzed in this report shows that issues of financial sustainability received significantly greater attention than affordability issues, and these two sets of issues were addressed together in less than half of all cases.
Sector outcomes from improved financial performance attributable to World Bank support were largely sustained in relatively few cases, such as Brazil, Turkey, and Kazakhstan. A broader examination of the profitability of major national electricity utilities in 40 countries (of which several received World Bank electricity sector support) from all regions for the past 15 years shows that the most are unprofitable and likely experienced a downturn in sector outcomes. This is particularly true in Sub-Saharan Africa, where most countries have been in a de facto permanent financial crisis for many years or even decades. Significant reversals in profitability recently occurred in several cases. The unacceptably low electricity access rates and inadequate, unreliable, and poor-quality electricity service in several of these countries is largely linked to the sector’s financial status. Continued inadequate cost recovery is the key driver of financial underperformance, but poor bill collection and operational inefficiencies, including excessive network losses, have a significant role.
x
Overall, this is a disappointing outcome considering the decades of sector reform efforts, technical assistance, and considerable financial support from the World Bank and other donors. The analysis of the experience of both investment loans and DPOs leads to several findings and lessons.
Addressing the Political Economy of Sector Financial Viability
The experience from both investment loans and DPOs shows that government commitment to serious financial stabilization and recovery objectives is often fragile, because of the political sensitivity of measures such as tariff adjustments towards cost-recovery levels, which are crucial to setting the electricity sector on the path to long-term financial viability.
Aligning the DPO program’s timeline with that of a government reform program. Most World Bank client countries require deep sector reforms that often operate on different timelines than DPOs, but the government, national utility, and the World Bank might focus excessively on short-term management of crises. The generic lesson learned is that the DPO-supported sector reform program’s time horizon and complementary investment projects should reasonably match the time required for effective government action.
Matching the scale of World Bank support to the scope of reforms and political risk. The quantum and scope of World Bank support should equal the scale of reforms and the accompanying political risks—for example, in complex reforms involving large tariff adjustments (among other things).
Balancing the window of opportunity with achievable targets. When the window of political economy opportunity is small, it is better to set realistic, modest targets that are achievable in a relatively short time.
Steering Clear of Complex Project Design
Complex design and unrealistic time frames are common pitfalls for both investment loans and DPOs.
Avoiding the pitfalls of overambitious agendas and excessive conditionalities. An over-ambitious angenda and too many loan conditionalities in DPOs is seen to impact the performance of sector financial objectives.
Retain focus on the underlying structural causes of sector financial viability. Several investment and multi-tranche DPO operations gave disproportionate

xi
attention to developing financial indicators and targets instead of focusing on the underlying structural causes of the sector’s or national utility’s poor financial performance.
Overall, programmatic DPOs showed better outcomes than multi-tranche and one-off DPOs. A programmatic series of single-tranche policy loans can be an effective way to support a well-specified, medium-term financial recovery program. One-off DPOs are prone to excessive complexity, overdesign, and trying to do too much in a short time, with few exceptions. Multi-tranche loans tend to be less flexible in their conditionalities.
Sustaining Improvements in Sector Financial Performance
The World Bank’s experience with country electricity sector engagement shows that complementary interventions and sustained support contribute positively to favorable and enduring results.
Deep-rooted structural problems have no quick fix. Electricity sector reforms that involve financially restructuring insolvent or bankrupt utilities require time and sustained financial and technical resources that several developing countries lack.
Leveraging investment operations and DPOs with technical assistance and analytical work will yield better and more sustainable results. Better results occur when DPOs and investment projects are complementary and accompanied by technical assistance and analytical work.

1
1. Introduction
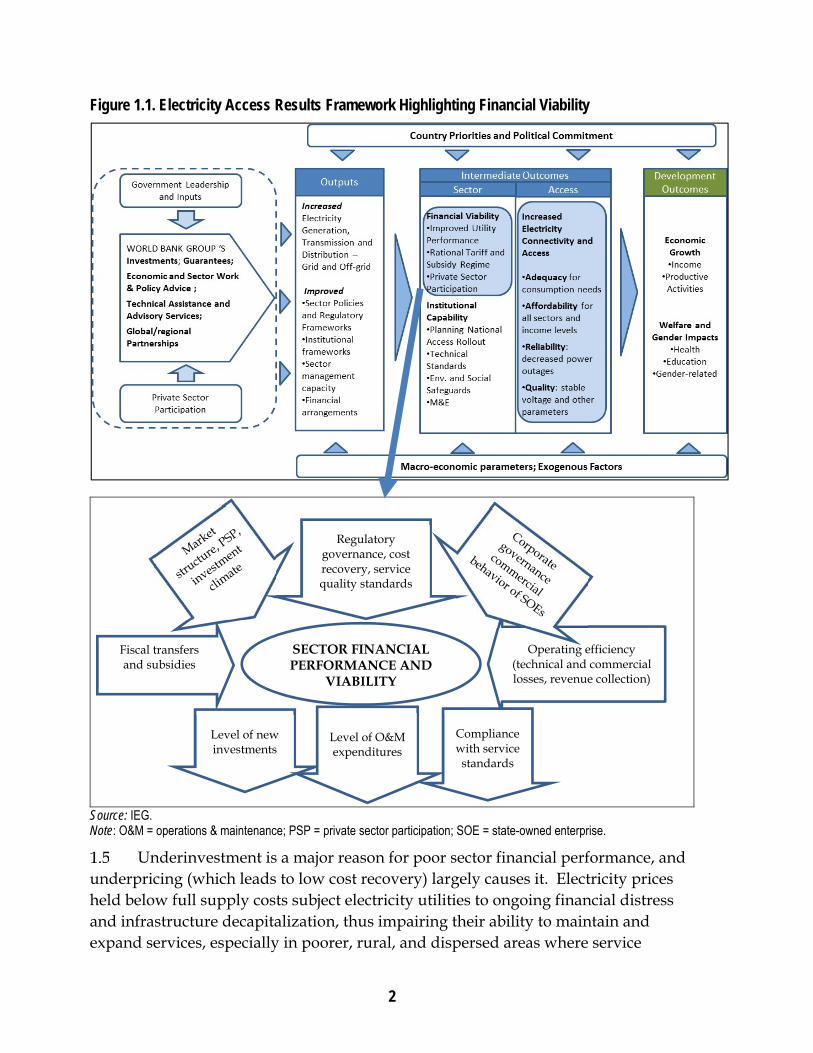
IEG’s Evaluation of World Bank Group's Support for Electricity Access 2000–2015 (IEG 2015d) identified financial viability of the electricity sector as one of the key drivers of performance toward universal electricity access. This implies that countries that transitioned from low-medium to high-universal access performed better in securing the financial viability of electricity companies by adopting rational electricity tariffs complemented by appropriate subsidy policies. In the results framework for IEG (2015d), financial viability is one of the main intermediate sector outcomes affecting access (figure 1.1).
Financial crises often have roots in the electricity distribution subsector, which is usually the most dysfunctional link in the electricity generation-transmission-distribution value chain. Poor quality of service, customer dissatisfaction, and relatively high prices compared with incomes induce electricity theft by businesses and households through illegal connections and nonpayment of electricity bills, sometimes with the involvement of corrupt utility staff. The financial deficits then cascade into other segments of the value chain (transmission and generation).
Framework for Assessing the Impact of Poor Financial Performance on Electricity Sector Outcomes
A vicious cycle of poor financial performance has long captured many national electricity sectors and utilities. The cycle continues from structural financial weakness to underinvestment and poor maintenance practices; to poor service quality; to blackouts; to weak payment discipline (nonpayment), theft, and insufficient government transfers; to low net revenues and internal cash generation, financial losses, low self-financing levels, and growing indebtedness to structural financial weakness.
Figure 1.1 shows a results framework for electricity access, which combines the main elements that determine sector financial performance, an intermediate outcome, and the relationships between financial performance and overall sector outcome (defined as the delivery of adequate, reliable, and affordable service that complies with certain quality standards). The framework highlights the main elements that affect electricity sector financial performance and viability within this overall context.
2
Figure 1.1. Electricity Access Results Framework Highlighting Financial Viability
Source: IEG. Note: O&M = operations & maintenance; PSP = private sector participation; SOE = state-owned enterprise.
Underinvestment is a major reason for poor sector financial performance, and underpricing (which leads to low cost recovery) largely causes it. Electricity prices held below full supply costs subject electricity utilities to ongoing financial distress and infrastructure decapitalization, thus impairing their ability to maintain and expand services, especially in poorer, rural, and dispersed areas where service
Operating efficiency (technical and commercial losses, revenue collection)
Regulatory governance, cost recovery, service quality standards
Level of new investments
Level of O&M expenditures
Compliance with service standards
Fiscal transfers and subsidies
SECTOR FINANCIAL PERFORMANCE AND
VIABILITY
3
provision is more expensive. Improving cost recovery requires an integrated approach involving tariff adjustments, improved payment collection, reduction of excessive technical and commercial network losses, control of both operational and capital expenditures, and sufficient and predictable subsidy transfers from the government when needed.
Purpose of the Learning Product
The purpose of this learning product is to inform World Bank strategy and operations in supporting client countries for improving electricity sector financial sustainability, particularly in Sub-Saharan Africa and South Asia, where the electricity sector’s underlying financial weakness hinders access growth.
This learning product’s findings and lessons relate to the following issues raised in IEG sector- and project-level evaluations:
To what extent do the World Bank’s lending operations—specific investment loans and development policy operations (DPOs)—adequately identify and address the drivers of poor sector finances, including political economy aspects?
To what extent have specific investment loans (through financial covenants such as standard financial ratios and other relevant components) been effective in improving financial sustainability?
To what extent have DPOs been effective in supporting client countries in improving their electricity sectors’ financial sustainability? How have the DPOs’ design features (programmatic, stand-alone, and the like) influenced the operations’ outcomes?
To what extent were financial viability improvements resulting from World Bank support sustained after project completion?
This learning product draws on IEG sector evaluations, Project Performance Assessment Reports, Implementation Completion Report Reviews, and other project documents of specific investment loans and DPOs (approved and completed during FY2000–16) with objectives or components and covenants aimed at supporting financial sustainability at the sector level. The learning product also draws on relevant country assistance strategies and country partnership strategies, and various sector evaluations. The study also conducted a targeted literature review that incorporated findings from recent World Bank Group research papers, publications, and other economic and sector work, including nonlending technical assistance reports, relevant literature from development partners, and academic journals on

4
electricity sector financial sustainability. IEG conducted a portfolio analysis to assess the development effectiveness of World Bank—International Development Association (IDA) and International Bank for Reconstruction and Development—specific investment loans and DPOs on financial sustainability. The learning product study team also compiled the salient features of financial performance of national electric utilities in 40 developing countries for the 2000–13 period to explore trends. The team consulted with staff and management of the Energy and Extractives Global Practice who are concerned with financial sustainability issues.
The rest of the study is organized into four sections:
Section 2: Recent trends in financial viability of electricity sectors and access outcomes in developing countries. This chapter is an overview of developing country electricity sector financial performance and financial viability drivers, and it characterizes the link between financial viability and sector outcomes.
Section 3: World Bank support for the financial viability of country electricity sectors through investment loans. This chapter covers the role of investment loans in improving sector financial viability and analyzes their performance.
Section 4: World Bank support for the financial viability of country electricity sectors through DPOs. This chapter covers the role of DPOs for improving sector financial viability and analyzes their performance.
Section 5: Lessons from addressing sector financial viability through specific investment loans and DPOs. This chapter summarizes the main findings and lessons from World Bank support for sector financial viability and illustrates them with relevant investment loan and DPO examples.
2. Recent Trends in Electricity Sector Financial Viability and Access Outcomes
Overview of Electricity Sector Financial Performance
The financial performance of electricity sectors has deteriorated in recent years in several developing countries, including countries that received significant World Bank financing and advisory support. Utility-led electricity access programs are important in the electrification strategies of most developing countries. Therefore, utility financial performance can determine electrification’s extent and pace and the adequacy, reliability, and quality of electricity services. However, many of the

5
electricity utilities, especially in Sub-Saharan Africa, have long been technically bankrupt, suffering from a structural operating deficit and dependent on annual government subsidies and loan guarantees to cover operating losses and investment expenditures.
Table 2.1 shows the trend in overall profitability of leading electricity utilities in a sample of 40 developing countries (appendix A includes data for the full list of countries). The overall share of profitable utilities in this set increased from 10 percent to 35 percent in 2010, but fell back to 25 percent in 2013. This trend is particularly stark in Sub-Saharan Africa, where the number of profitable utilities was only four out of the sample of 17 in 2013 (after increasing from 2 to 6 during 2000–10).1
Table 2.1. Financial Performance of the Leading Electricity Utilities in Selected Developing Countries
Region Sample size Profitable utilities
2000 2010 2013 Sub-Saharan Africa 17 2 6 4
East Asia and Pacific 6 0 3 3 Europe and Central Asia 5 0 2 1 South Asia 6 1 1 1 Latin America and the Caribbean 5 1 2 1 Middle East and North Africa 1 0 0 0 Total 40 4 14 10 Share of profitable utilities (%) n.a. 10 35 25
Source: Various sources, mostly annual reports of the national electricity utilities or proxies when available, project appraisal documents, country assistance strategies, country partnership strategies, and other sources. Note: When financial performance data were unavailable for the electricity sector as a whole, the national utility or equivalent was a proxy. In most cases, the indicator of financial performance used was the after-tax net income.
DRIVERS OF FINANCIAL VIABILITY: COST RECOVERY
The available literature suggests that inadequate cost recovery was a systemic and endemic feature of the electricity sector in most developing countries. Governments were often slow and reluctant (mostly for political reasons) to adjust tariffs to reflect higher costs from inflation, and fuel charges, and interest charges. Subsidizing electricity is politically attractive, but raising the price of electricity is seen as a lump-sum tax weighing heavily on poor and elderly people and large households (Kessides 2004; Komives et al. 2005; Besant-Jones 2006). The evidence
1 The reported financial statements are not always reliable and tend to bias actual performance upwards for a variety of reasons (Kojima and Trimble 2016).

6
suggests limited progress toward depoliticized electricity pricing and higher cost recovery in most developing countries in the past decade.
A 2016 study (Kojima and Trimble 2016) that compared estimated existing retail tariffs with benchmark operating expenditures and capital expenditure for 39 Sub-Saharan Africa countries showed that only 21 countries were able to cover operating expenditures. In some cases (Guinea and Botswana, for example), the cost recovery ratio was extremely low at about 50 percent. The picture is much bleaker for total cost recovery when only one country, the Republic of Congo, could attain full cost recovery. The Seychelles and Uganda were reasonably close with ratios of more than 90 percent. These findings are in line with two earlier studies (Briceno-Garmendia and Shkaratan 2011; Eberhard et al. 2008) that examined the electricity sectors of Sub-Saharan Africa countries during the mid-2000s using different samples sizes and slightly different methodologies.
The overall message from these studies is that Sub-Saharan Africa made little progress toward higher cost recovery in the past decade and, by implication, toward a financially viable electricity sector (Dobozi 2016). Further increases in tariffs are unlikely to be affordable because tariffs in Sub-Saharan Africa countries are already high when compared with relatively more developed regions of the world, and incomes are lower. Therefore, the only feasible solution would be to reduce costs due to pricing inefficiencies.
Cost recovery of residential tariffs at the national level in India in 2010 was only 68 percent, which is considerably less than the ratio of 74 percent registered in 2000 (Pargal and Banerjee 2014). Only two of 29 states had average effective tariffs slightly higher than the average cost supply (table 2.2, see appendix B for a list of all states). At the other end of spectrum, cost recovery was about 33 percent (and as low as 23 percent in the state of Himachal Pradesh). Consequently, an overwhelming 87 percent of all residential electricity consumption is subsidized, equivalent to more than one-fifth of all electricity consumed in the country in 2010, or 0. 4 percent of gross domestic product (GDP) (Mayer et al. 2015). The agricultural sector is even more heavily subsidized. Regarding cost recovery, the average billed tariff was higher than the average cost between 2003 and 2008, but has dropped below the cost recovery level since 2008 (Pargal and Banerjee 2014).
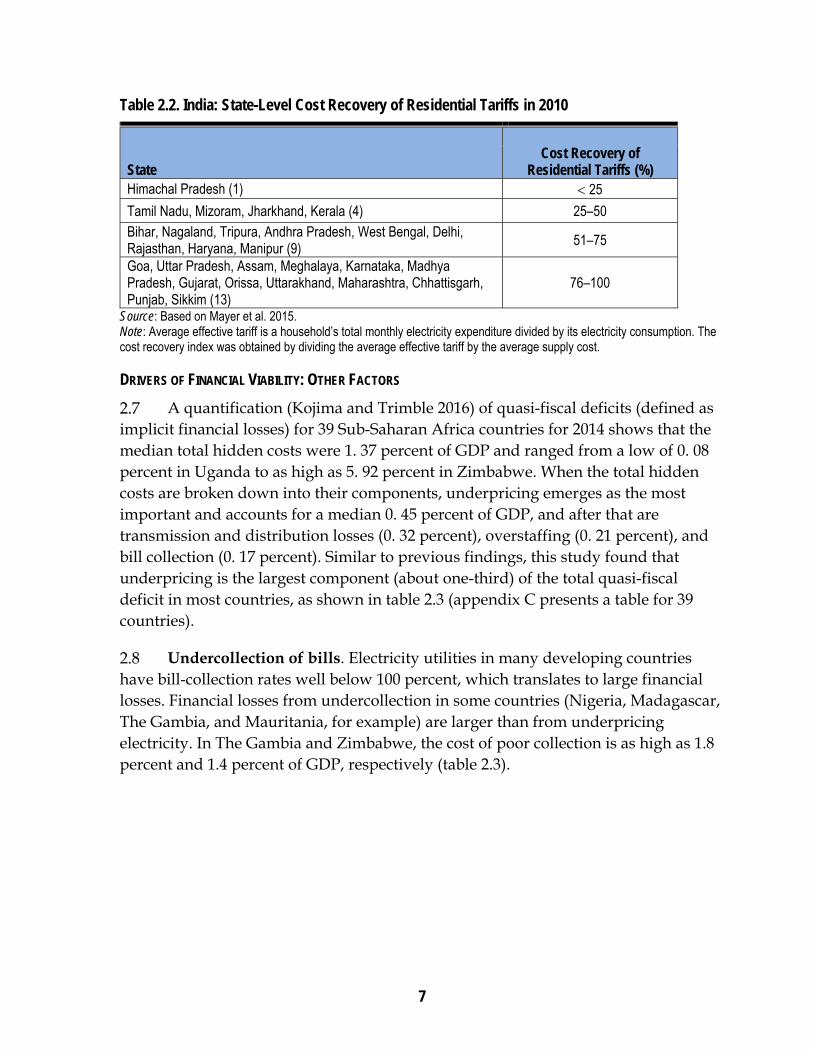
7
Table 2.2. India: State-Level Cost Recovery of Residential Tariffs in 2010
State
Cost Recovery of
Residential Tariffs (%) Himachal Pradesh (1) 25
Tamil Nadu, Mizoram, Jharkhand, Kerala (4) 25–50 Bihar, Nagaland, Tripura, Andhra Pradesh, West Bengal, Delhi, Rajasthan, Haryana, Manipur (9)
51–75
Goa, Uttar Pradesh, Assam, Meghalaya, Karnataka, Madhya Pradesh, Gujarat, Orissa, Uttarakhand, Maharashtra, Chhattisgarh, Punjab, Sikkim (13)
76–100
Source: Based on Mayer et al. 2015. Note: Average effective tariff is a household’s total monthly electricity expenditure divided by its electricity consumption. The cost recovery index was obtained by dividing the average effective tariff by the average supply cost.
DRIVERS OF FINANCIAL VIABILITY: OTHER FACTORS
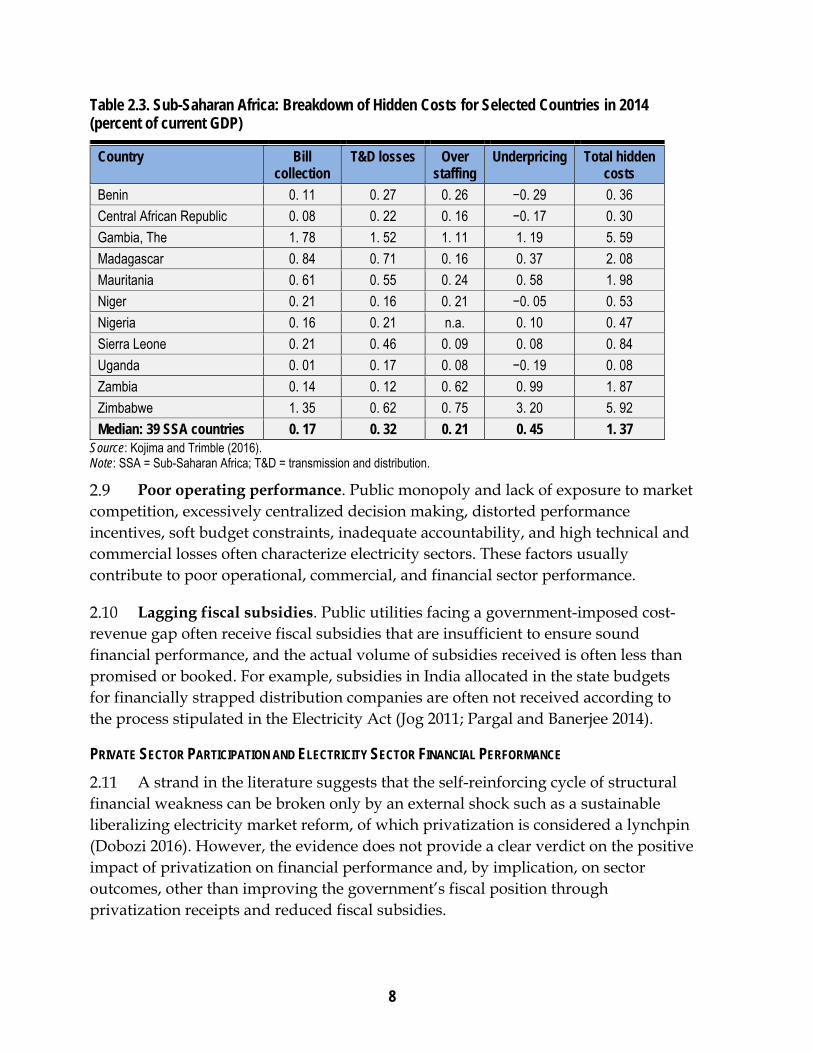
A quantification (Kojima and Trimble 2016) of quasi-fiscal deficits (defined as implicit financial losses) for 39 Sub-Saharan Africa countries for 2014 shows that the median total hidden costs were 1. 37 percent of GDP and ranged from a low of 0. 08 percent in Uganda to as high as 5. 92 percent in Zimbabwe. When the total hidden costs are broken down into their components, underpricing emerges as the most important and accounts for a median 0. 45 percent of GDP, and after that are transmission and distribution losses (0. 32 percent), overstaffing (0. 21 percent), and bill collection (0. 17 percent). Similar to previous findings, this study found that underpricing is the largest component (about one-third) of the total quasi-fiscal deficit in most countries, as shown in table 2.3 (appendix C presents a table for 39 countries).
Undercollection of bills. Electricity utilities in many developing countries have bill-collection rates well below 100 percent, which translates to large financial losses. Financial losses from undercollection in some countries (Nigeria, Madagascar, The Gambia, and Mauritania, for example) are larger than from underpricing electricity. In The Gambia and Zimbabwe, the cost of poor collection is as high as 1.8 percent and 1.4 percent of GDP, respectively (table 2.3).
8
Table 2.3. Sub-Saharan Africa: Breakdown of Hidden Costs for Selected Countries in 2014 (percent of current GDP)
Country Bill collection
T&D losses Over staffing
Underpricing Total hidden costs
Benin 0. 11 0. 27 0. 26 −0. 29 0. 36
Central African Republic 0. 08 0. 22 0. 16 −0. 17 0. 30
Gambia, The 1. 78 1. 52 1. 11 1. 19 5. 59
Madagascar 0. 84 0. 71 0. 16 0. 37 2. 08
Mauritania 0. 61 0. 55 0. 24 0. 58 1. 98
Niger 0. 21 0. 16 0. 21 −0. 05 0. 53
Nigeria 0. 16 0. 21 n.a. 0. 10 0. 47
Sierra Leone 0. 21 0. 46 0. 09 0. 08 0. 84
Uganda 0. 01 0. 17 0. 08 −0. 19 0. 08
Zambia 0. 14 0. 12 0. 62 0. 99 1. 87
Zimbabwe 1. 35 0. 62 0. 75 3. 20 5. 92
Median: 39 SSA countries 0. 17 0. 32 0. 21 0. 45 1. 37 Source: Kojima and Trimble (2016). Note: SSA = Sub-Saharan Africa; T&D = transmission and distribution.
Poor operating performance. Public monopoly and lack of exposure to market competition, excessively centralized decision making, distorted performance incentives, soft budget constraints, inadequate accountability, and high technical and commercial losses often characterize electricity sectors. These factors usually contribute to poor operational, commercial, and financial sector performance.
Lagging fiscal subsidies. Public utilities facing a government-imposed cost-revenue gap often receive fiscal subsidies that are insufficient to ensure sound financial performance, and the actual volume of subsidies received is often less than promised or booked. For example, subsidies in India allocated in the state budgets for financially strapped distribution companies are often not received according to the process stipulated in the Electricity Act (Jog 2011; Pargal and Banerjee 2014).
PRIVATE SECTOR PARTICIPATION AND ELECTRICITY SECTOR FINANCIAL PERFORMANCE
A strand in the literature suggests that the self-reinforcing cycle of structural financial weakness can be broken only by an external shock such as a sustainable liberalizing electricity market reform, of which privatization is considered a lynchpin (Dobozi 2016). However, the evidence does not provide a clear verdict on the positive impact of privatization on financial performance and, by implication, on sector outcomes, other than improving the government’s fiscal position through privatization receipts and reduced fiscal subsidies.
9
An empirical study covering the electricity sector in several Sub-Saharan Africa countries for the mid-2000s found no measurable improvement from privatization in cost recovery or transmission and distribution losses (Eberhard et al. 2008).
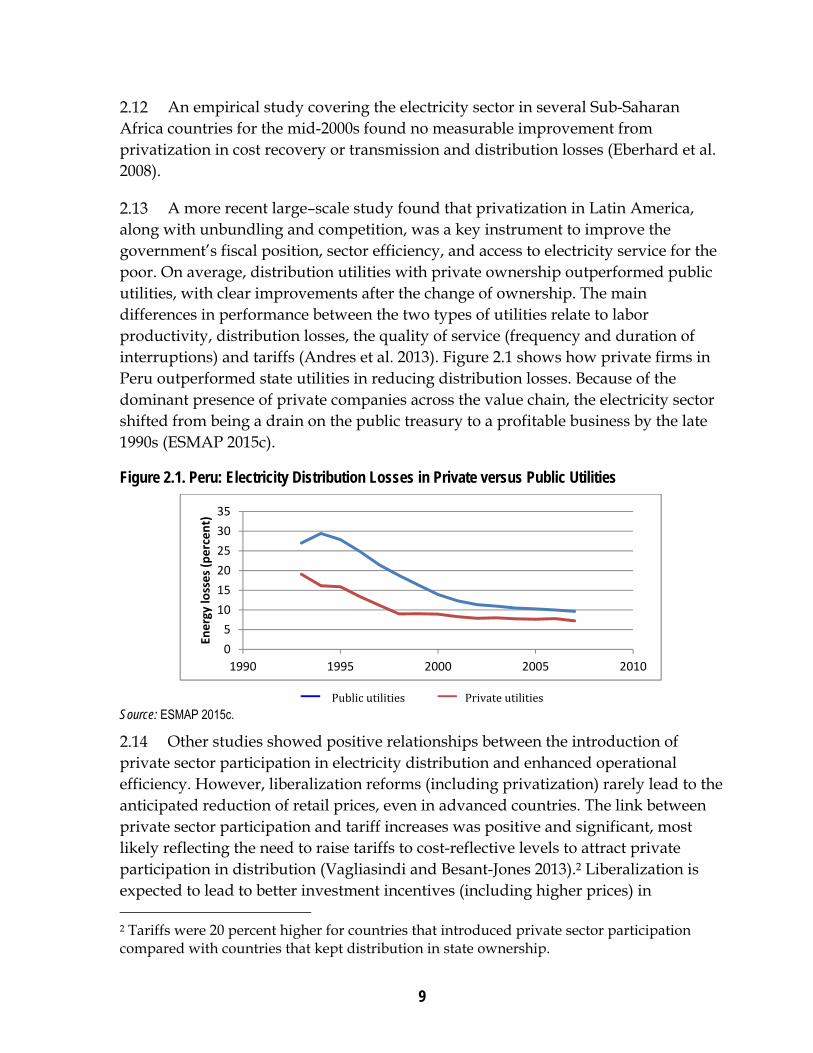
A more recent large–scale study found that privatization in Latin America, along with unbundling and competition, was a key instrument to improve the government’s fiscal position, sector efficiency, and access to electricity service for the poor. On average, distribution utilities with private ownership outperformed public utilities, with clear improvements after the change of ownership. The main differences in performance between the two types of utilities relate to labor productivity, distribution losses, the quality of service (frequency and duration of interruptions) and tariffs (Andres et al. 2013). Figure 2.1 shows how private firms in Peru outperformed state utilities in reducing distribution losses. Because of the dominant presence of private companies across the value chain, the electricity sector shifted from being a drain on the public treasury to a profitable business by the late 1990s (ESMAP 2015c).
Figure 2.1. Peru: Electricity Distribution Losses in Private versus Public Utilities
— Public utilities — Private utilities
Source: ESMAP 2015c.
Other studies showed positive relationships between the introduction of private sector participation in electricity distribution and enhanced operational efficiency. However, liberalization reforms (including privatization) rarely lead to the anticipated reduction of retail prices, even in advanced countries. The link between private sector participation and tariff increases was positive and significant, most likely reflecting the need to raise tariffs to cost-reflective levels to attract private participation in distribution (Vagliasindi and Besant-Jones 2013).2 Liberalization is expected to lead to better investment incentives (including higher prices) in 2 Tariffs were 20 percent higher for countries that introduced private sector participation compared with countries that kept distribution in state ownership.
0
5
10
15
20
25
30
35
1990 1995 2000 2005 2010
Energy losses (percent)
10
developing countries, where regulated electricity prices are inefficiently low and typically accompanied by insufficient capacity. The empirical literature partially supports this (Nagayama 2007; Sen and Jamasb 2010). Sector liberalization and privatization worked in some countries to reduce historic pricing distortions. Specifically, cross-subsidies from industrial customers to households were gradually reduced because prices for households are aligned with underlying costs (Kessides 2012). Since the mid-2000s in Brazil, the cost recovery index has closely tracked the steep increase in private ownership in distribution.
In most of the countries where private sector participation is minimal and tariffs are state-controlled below cost recovery levels (India, the Arab Republic of Egypt, and Indonesia, for example), distribution companies experienced sustained, severe financial stress, which occasionally required government bailouts to keep the utilities afloat (debt restructuring, increased fiscal transfers, and so on).
ROLE OF REGULATION AND MARKET STRUCTURE
An empirical study found that the introduction of an autonomous regulator is positively associated with better sector performance in financial efficiency, specified as tariff level in U.S. cents per kilowatt-hour (Vagliasindi and Besant-Jones 2013).3 Tariffs are considerably higher under an autonomous regulatory regime, indicating a stronger commitment to make tariffs more cost-reflective. Specifically, electricity tariffs in national electricity systems with an autonomous regulator were 64 percent higher than in countries with no autonomous regulator. The higher tariffs reflect insulating crucial electricity pricing decisions from political interference.
The same study tested the cost recovery index against a set of explanatory variables and found that the cost recovery index is higher under vertically unbundled systems, greater competition in the distribution sector, an autonomous regulator, and a higher share of private sector participation.4, 5
THE LINK BETWEEN FINANCIAL PERFORMANCE AND SECTOR OUTCOMES
This study tried to characterize two empirical relationships linking sector financial performance to sector outcomes by using a compilation of available data.6
3 The study covered a sample of 22 countries, which are mostly developing countries. In the study, the average tariff level is a crude proxy for regulatory quality. 4 Cost recovery index is defined as the ratio of average revenue yield divided by the average supply cost for all electricity distributors as a group. 5 In the sample of countries with an autonomous regulator, the cost recovery index is 115.6 compared with 76.3 for countries with no autonomous regulator. 6 An extensive literature review could not locate even one systematic, cross-country, empirical study to quantify this relationship.
11
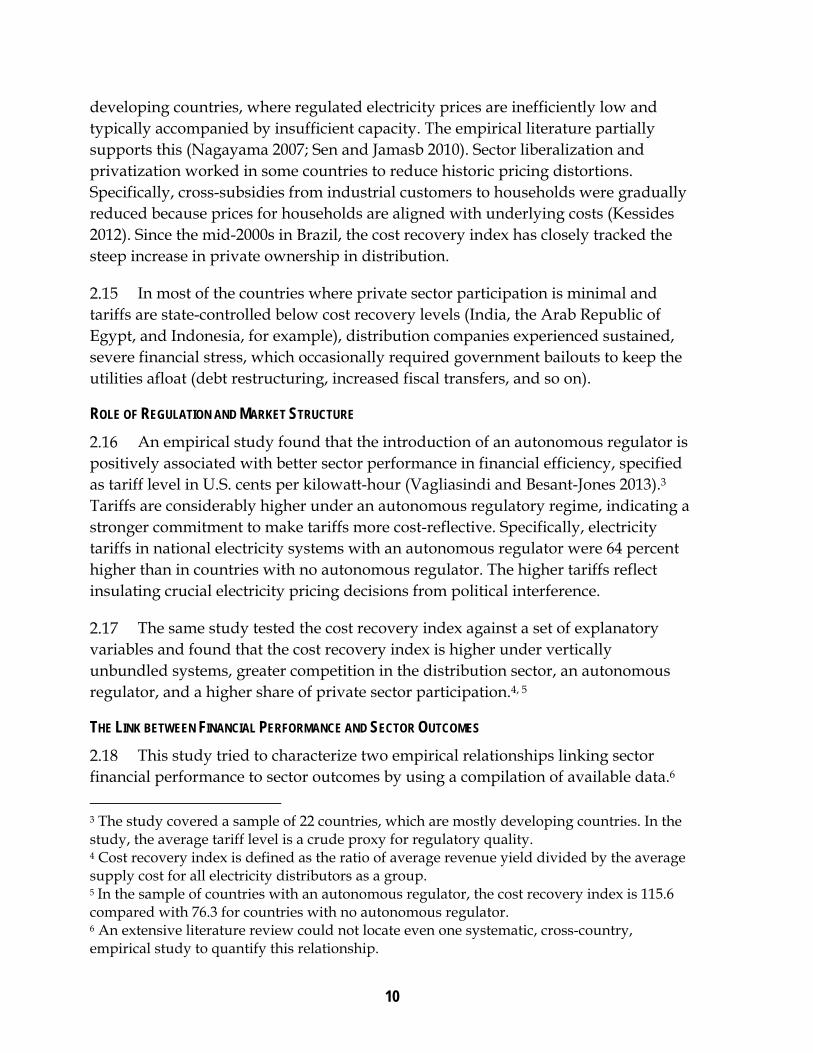
Data for a sample of Sub-Saharan Africa countries shows an overall positive relationship between the electricity tariff cost recovery ratio (a proxy for sector financial performance) and the quality of electricity supply, approximated by frequency of service interruptions and voltage fluctuations (figure 2.2).
Figure 2.2. Tariff Cost Recovery and Quality of Electricity Supply in Sub-Saharan Africa
Source: IEG; data are from World Economic Forum and Accenture 2013 and Briceno-Garmendia and Shkratan 2011. Note: Quality of electricity supply is a survey-based index that is part of the World Economic Forum’s Energy Architecture Performance composite index. The survey question used is “How would you assess the quality of the electricity in your country (lack of interruptions and lack of voltage fluctuations)?” The scale ranges from 1 = insufficient and suffers frequent interruptions to 7 = sufficient and reliable. Underlying data for the quality of electricity supply index are for 2012, and data for tariff cost recovery ratios are for the mid-2000s.
Although displaying a much weaker relationship statistically,7 the financial gap in the electricity sector (expressed as quasi-fiscal deficit) is negatively related to the electricity supply’s reliability (figure 2.3).8
7 The correlation coefficient between the quasi-fiscal deficit and the reliability of electricity supply is −0.21. 8 Quasi-fiscal deficit is defined as implicit financial losses due to underpricing, insufficient bill collection, transmission and distribution losses, and overstaffing.

12
Figure 2.3. Quasi-Fiscal Deficit and Reliability of Electricity Supply in Sub-Saharan Africa, 2014–15
Source: IEG; data are from World Bank 2016 and Kojima and Trimble 2016. Note: Reliability of Electricity and Transparency of Tariffs Index is a survey-based metric designed as part of the World Bank Doing Business Indicators 2016. It includes quantitative data on the duration and frequency of electricity outages as well as qualitative information on the mechanisms put in place by the utility for monitoring electricity outages and restoring electricity supply, the reporting relationship between the utility and the regulator for electricity outages, the transparency and accessibility of tariffs and whether the utility faces a financial deterrent aimed at limiting outages.
Financial Performance and Sector Outcomes: Recent Country Experiences
Several recent experiences in World Bank client countries illustrate the link between financial performance and sector outcomes. In Vietnam, the financial performance of the national utility Vietnam Electricity (EVN) was reasonably satisfactory until the mid-2000s. A sharp deteriorating trend started in 2008, raising serious concerns about the financial and operational sustainability of both EVN and the electricity sector going forward. In India, despite considerable progress in some reforms (including legislation, open access regulation, and market opening), electricity sector finances have deteriorated sharply in the past decade, which together with other factors brought the electricity sector to the brink of crisis. The financial performance of the electricity sector in Bangladesh deteriorated despite a series of World Bank development support credits, including a freestanding
13
Electricity Sector Development Credit in 2008–09 aimed at financial stabilization of the electricity sector, though the deterioration was largely because tariffs were significantly short of cost recovery levels. Senegal’s electricity sector has faced a deepening financial crisis since 2006 despite sizable World Bank policy lending (budgetary support). Recurrent blackouts that rose exponentially between 2006 and 2011 characterized the crisis.
Considerable country-based anecdotal evidence points to the detrimental impact of poor financial performance on sector outcomes. The Dominican Republic’s experience illustrates the close link between electricity blackouts and financial blackouts (that is, the generators’ inability to pay for fuel due to the distributors’ insufficient and lagging payments for electricity). South Africa’s electricity system came under considerable strain toward the end of the 2000s after several years of sustained economic growth supported by reliable and sufficient electricity supply. The electricity sector, though generally operationally efficient, ran into major capacity constraints.
Appendix D presents a detailed discussion of each of these country experiences.
3. World Bank Support for the Financial Viability of Country Electricity Sectors through Investment Loans
The World Bank supported client countries in improving the financial viability of their electricity sectors through investment loans and development policy operations (DPOs). The typical approach under many World Bank–funded investment projects in the past—particularly those implemented in the 1990s and early 2000s—was to combine investment loans with sector reform conditionality, including financial performance-enhancing measures (tariff adjustment, payment collections, commercialization, privatization, and so on). DPOs have recently been the most frequently used mode to support electricity sector financial performance. Generally, DPOs provided untied, quick-disbursing direct budget financing to governments for policy and institutional reforms aimed at achieving a set of sector-specific development results.
An analysis of the latest country assistance strategies (CASs) and country partnership strategies (CPSs) for the countries with DPOs, investment loans, or both

14
analyzed in this report shows that issues of financial sustainability received significantly greater attention than affordability issues (mainly subsidies to the poor for electricity connections or electricity consumption). Of the 48 CASs and CPSs examined, 43 documents (90 percent) analyzed financial sustainability issues and only 26 documents examined affordability for the poor. The number of documents that proposed specific strategies and actions was relatively lower in both cases, with only 33 documents (69 percent) for financial viability and 17 documents (35 percent) for proposed policy actions. The number of documents that considered both financial viability and affordability for the poor was quite low at 22 documents (46 percent), and only 14 documents (29 percent) proposed specific strategies and actions (table 3.1). For example, the Nicaragua CPS for FY08–12 noted the lack of an adequate legal and regulatory framework to address energy sector tariff and subsidy issues. The CPS proposed that the government prosecute large-scale electricity theft more proactively and facilitate the normalization of poor communities that connected illegally, with the aim of gradually increasing cost recovery in line with their ability to pay. Pakistan’s CPS for FY15-19 notes heavy dependence on non-pro-poor government subsidies and poor service management, and proposes the development, adoption, and implementation of policy guidelines on tariff management and subsidies with pro-poor targeting.
Table 3.1. Selected CASs and CPSs: Analysis and Proposed Policy Actions for Financial Viability and Affordability in Electricity Sectors
Sector issue CASs and CPSs in sample
CASs and CPSs
Analyzed issues Proposed strategies
and actions Financial viability
48 43 90 33 69
Affordability for the poor 26 54 17 35 Both financial viability and affordability for the poor 22 46 14 29
Source: World Bank Business Intelligence database Note: Data are from the most recent documents. CAS = country assistance strategy; CPS = country partnership strategy.
This section discusses investment loan performance, and section 4 covers DPO performance.
Investment Loans with Financial Performance Components and Covenants
Forty-one World Bank investment projects (approved or closed during FY2000–15) contained financial viability components in their results frameworks. These projects covered 25 countries and accounted for $5.2 billion of World Bank loan

15
commitments.9 Appendix E presents the list of projects. Three regions—East Asia and Pacific, Sub-Saharan Africa, and South Asia—accounted for 87 percent of the projects and 95 percent of commitments. Regarding country income category, 27 projects (about 66 percent) were in lower-middle-income countries, 10 projects (24 percent) were in low-income countries, and 4 projects (9 percent) were in upper-middle- and high-income countries (tables 3.2 and 3.3).
Table 3.2. Investment Loans with Sector Financial Performance Components and Covenants by Region (FY2000–15)
Region Specific investment loans Total loan commitment
No. % $, millions % Sub-Saharan Africa 10 24 1,266 24 East Asia and Pacific 16 39 2,252 43 Europe and Central Asia 2 5 150 3 South Asia 10 24 1,451 28 Latin America and the Caribbean 3 7 73 1 Middle East and North Africa 0 0 0 0 Total 41 100 5,193 100
Source: World Bank Business Intelligence.
Table 3.3. Investment Loans with Sector Financial Performance Components and Covenants by Income Level (FY2000–15)
Country income category Specific investment loans Total loan commitment
No. % $, millions % Low 10 24 1,262 24 Lower-middle 27 66 3,688 71 Upper-middle 3 7 213 4 High 1 2 30 1 Total 41 100 5,193 100
Source: World Bank Business Intelligence.
About two-thirds of the 41 projects had comprehensive financial performance improvement goals—usually a financial recovery plan, including debt restructuring for the national utility. Tariff methodology and adjustment was the next most frequently occurring financial component (31 percent), and after that are payment collection improvement (22 percent) and transmission and distribution loss reduction targets (19 percent). These investment projects were mainly in lower-middle-income
9 Overall, 545 electricity sector investment projects were approved and closed during FY2000-15, with loan commitments of $42.8 billion.

16
countries (64 percent), and after that are low-income countries (28 percent) and the remaining 8 percent in upper-middle- or high-income countries (table 3.4).
PERFORMANCE OF FINANCIAL COMPONENTS AND COVENANTS IN INVESTMENT LOANS
Table 3.4 presents a summary of the performance of key performance indicators (KPI) relating to financial viability for the 41 projects (appendix F presents detailed ratings). The study team could rate KPIs for only 36 projects because the outcomes for the remaining five projects were either not available or not evaluable. IEG rates 69 percent of the 36 projects as moderately satisfactory or higher on the achievement of financial objectives. The highest achievement was for operational performance improvement, with 100 percent of the projects performing marginally satisfactory or better. Payment collection improvement was the next highest (75 percent rated moderately satisfactory or better), and after that are transmission and distribution loss reduction (71 percent rated moderately satisfactory or better), comprehensive financial performance improvement indicator (67 percent of projects rated as moderately satisfactory or better), and tariff methodology/adjustment (55 percent of outcomes rated moderately satisfactory or better).10 The weakest achievement was on the subsidy reduction—no projects rated moderately satisfactory or better.
Table 3.4. Rating of Financial Key Performance Indicators for World Bank Investment Projects
Number of projects with financial KPIs and number rated moderately satisfactorya or better Projects with overall
financial performance MS or betterb
(%)
Country income category
Cost reduction
Operational performance improvement
Comprehensive financial
performance improvement
Payment collections
improvement
Subsidy reduction
T&D loss reduction
Tariff increase
Low 3 (2) 0 (0) 6 (4) 2 (2) 0 (0) 2 (1) 0 (0) 70
Lower-middle 2 (1) 1 (1) 16 (10) 6 (4) 1 (0) 5 (4) 10 (5) 65
Upper-middle 0 (0) 0 (0) 2 (2) 0 (0) 0 (0) 0 (0) 0 (0) 100
High 0 (0) 0 (0) 0 (0) 0 (0) 0 (0) 0 (0) 1 (1) 100
Total projects rated
5 1 24 8 1 7 11 36
Number of projects rated MS or higher
3 1 16 6 0 5 6 25
% of projects MS or higher
60 100 67 75 0 71 55 69
Source: IEG.
10 Regarding financial performance improvement of overall borrower (usually a national utility), this can be achieved through a financial recovery plan or a similar action plan aimed at financial sustainability, including debt restructuring.
17
Note: MS = moderately satisfactory; T&D = transmission and distribution. Figure in parentheses is the number of projects with KPI rated MS or better. a. A moderately satisfactory rating is 3 on a scale of 1–4. The 1–4 scale corresponds to the following scale: 1 = unsatisfactory or worse; 2 = moderately unsatisfactory; 3 = moderately satisfactory; and 4 = satisfactory or highly satisfactory. b. The same project may have multiple KPIs in the same category (see appendix F for details).
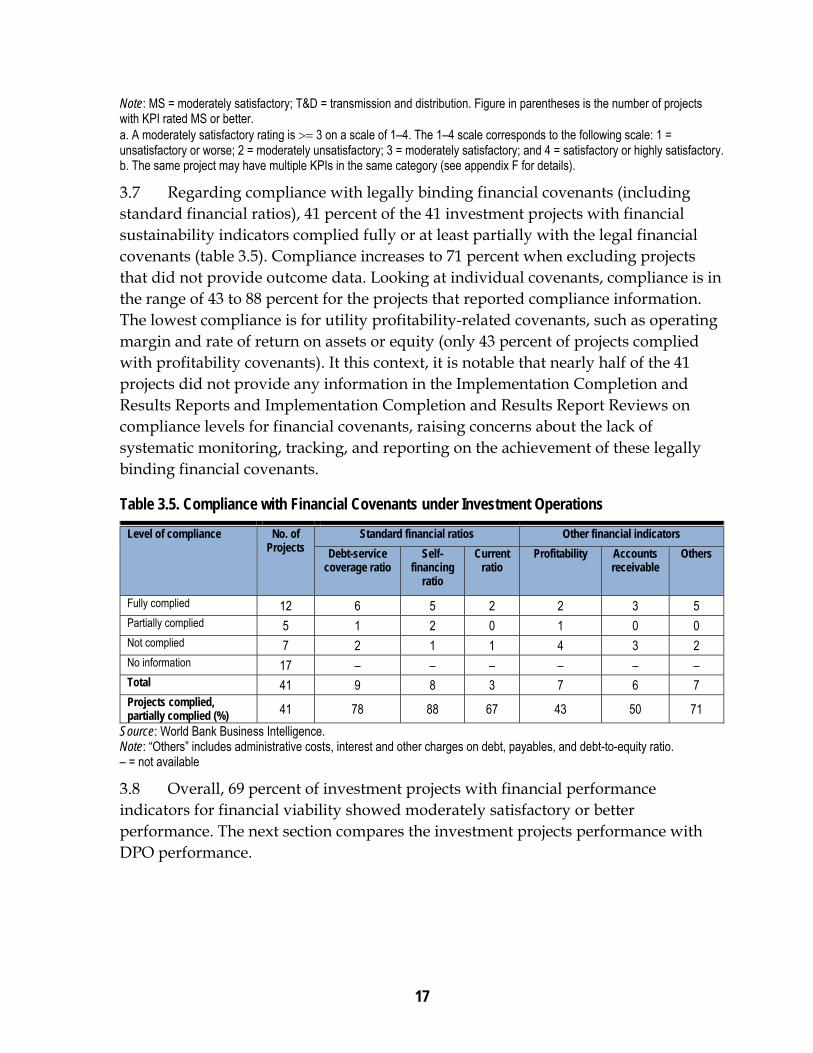
Regarding compliance with legally binding financial covenants (including standard financial ratios), 41 percent of the 41 investment projects with financial sustainability indicators complied fully or at least partially with the legal financial covenants (table 3.5). Compliance increases to 71 percent when excluding projects that did not provide outcome data. Looking at individual covenants, compliance is in the range of 43 to 88 percent for the projects that reported compliance information. The lowest compliance is for utility profitability-related covenants, such as operating margin and rate of return on assets or equity (only 43 percent of projects complied with profitability covenants). It this context, it is notable that nearly half of the 41 projects did not provide any information in the Implementation Completion and Results Reports and Implementation Completion and Results Report Reviews on compliance levels for financial covenants, raising concerns about the lack of systematic monitoring, tracking, and reporting on the achievement of these legally binding financial covenants.
Table 3.5. Compliance with Financial Covenants under Investment Operations
Level of compliance No. of Projects
Standard financial ratios Other financial indicators
Debt-service coverage ratio
Self-financing
ratio
Current ratio
Profitability Accounts receivable
Others
Fully complied 12 6 5 2 2 3 5 Partially complied 5 1 2 0 1 0 0 Not complied 7 2 1 1 4 3 2 No information 17 – – – – – – Total 41 9 8 3 7 6 7 Projects complied, partially complied (%) 41 78 88 67 43 50 71
Source: World Bank Business Intelligence. Note: “Others” includes administrative costs, interest and other charges on debt, payables, and debt-to-equity ratio. – = not available
Overall, 69 percent of investment projects with financial performance indicators for financial viability showed moderately satisfactory or better performance. The next section compares the investment projects performance with DPO performance.
18
4. World Bank Support for the Financial Viability of Country Electricity Sectors through Development Policy Operations
Development policy operations (DPOs) have recently been the World Bank’s most frequently used modality of supporting electricity sector financial performance improvements. Generally, DPOs provided untied, quick-disbursing direct budget financing to governments for policy and institutional reforms aimed at achieving a set of sector-specific development results. Sector-specific DPOs supported a more targeted program policy and institutional actions, often to strengthen or drastically turn around weak sector finances. All the sector-specific DPOs covered under this assessment included financial recovery, improvement, and sustainability as an important project development objective. The World Bank increasingly used programmatic DPOs in a series of single-tranche operations (typically annual) to support a more complex and generally well-specified, medium-term sector reform agenda. The World Bank’s operational policy guiding development policy lending includes, among other things, the principles of country ownership, strong analytic underpinnings for policy choices, and alignment of World Bank operations with a country’s own development strategy and focus on the most critical policy and institutional actions for program results (World Bank 2009a).
DPOs with Financial Performance Components and Covenants
During FY2000–15, IEG evaluated 49 DPOs that included a substantial component for electricity sector financial performance improvement. These operations represent total commitments of $10.7 billion, of which $6 billion directly related to the electricity sector (appendix G presents the list of DPOs). A high percentage of the DPOs that IEG evaluated (65 percent) were part of a programmatic series of operations, and 35 percent were one-off projects. Furthermore, only 31 percent of projects were sector-specific and 69 percent were broad-spectrum DPOs covering more than one sector or theme. By World Bank region, 37 percent of DPOs were in Sub-Saharan Africa, 22 percent were in South Asia, and 16 percent were in East Asia and Pacific (16 percent). Regions with the least DPOs were Latin America and the Caribbean (6 percent) and Middle East and North Africa (4 percent). Regarding country income category, 30 DPOs (about 61 percent of the total) were in lower-middle-income countries and only 7 DPOs (14 percent) were in low-income countries (tables 4.1 and 4.2).
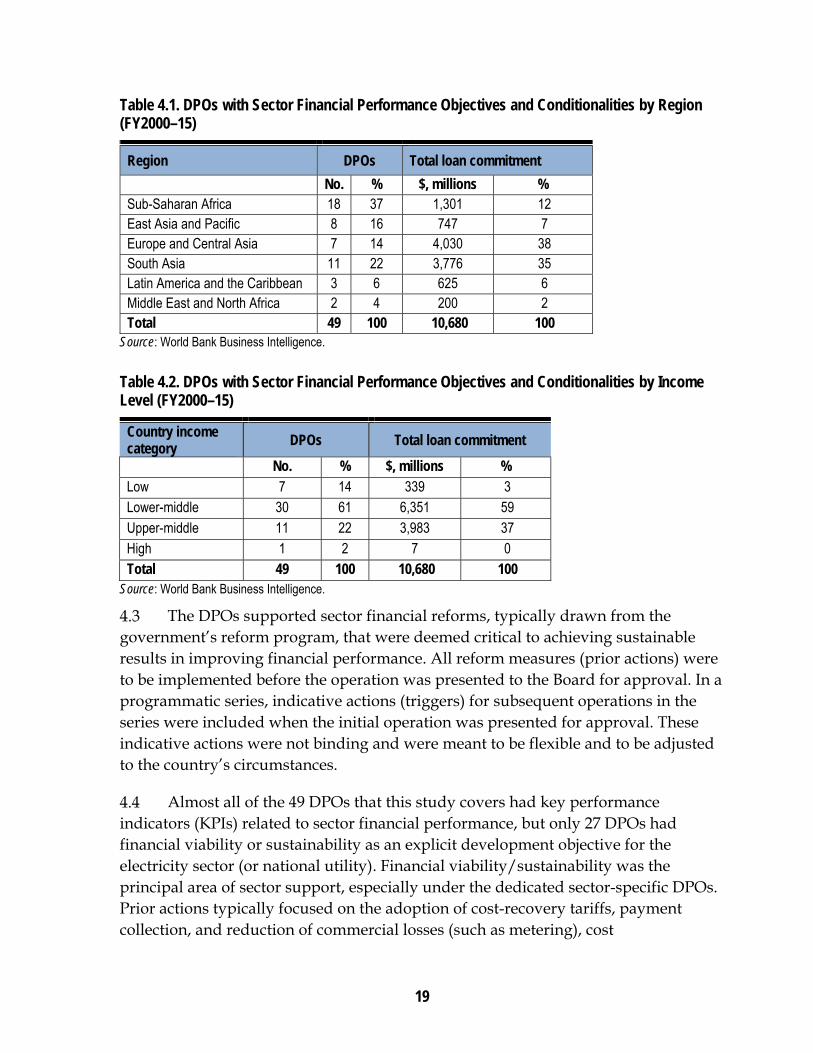
19
Table 4.1. DPOs with Sector Financial Performance Objectives and Conditionalities by Region (FY2000–15)
Region DPOs Total loan commitment
No. % $, millions % Sub-Saharan Africa 18 37 1,301 12 East Asia and Pacific 8 16 747 7 Europe and Central Asia 7 14 4,030 38 South Asia 11 22 3,776 35 Latin America and the Caribbean 3 6 625 6 Middle East and North Africa 2 4 200 2 Total 49 100 10,680 100
Source: World Bank Business Intelligence.
Table 4.2. DPOs with Sector Financial Performance Objectives and Conditionalities by Income Level (FY2000–15)
Country income category
DPOs Total loan commitment
No. % $, millions % Low 7 14 339 3 Lower-middle 30 61 6,351 59 Upper-middle 11 22 3,983 37 High 1 2 7 0 Total 49 100 10,680 100
Source: World Bank Business Intelligence.
The DPOs supported sector financial reforms, typically drawn from the government’s reform program, that were deemed critical to achieving sustainable results in improving financial performance. All reform measures (prior actions) were to be implemented before the operation was presented to the Board for approval. In a programmatic series, indicative actions (triggers) for subsequent operations in the series were included when the initial operation was presented for approval. These indicative actions were not binding and were meant to be flexible and to be adjusted to the country’s circumstances.
Almost all of the 49 DPOs that this study covers had key performance indicators (KPIs) related to sector financial performance, but only 27 DPOs had financial viability or sustainability as an explicit development objective for the electricity sector (or national utility). Financial viability/sustainability was the principal area of sector support, especially under the dedicated sector-specific DPOs. Prior actions typically focused on the adoption of cost-recovery tariffs, payment collection, and reduction of commercial losses (such as metering), cost
20
rationalization, and government subsidy transfers. Reforms related to transparency, governance, and accountability also became more common. For example, the Bangladesh Power Sector Development Credit supported enhanced governance and accountability along with more typical measures, such as tariff adjustment, payment collection, and budgetary transfers to the national utility.
PERFORMANCE OF FINANCIAL COMPONENTS AND COVENANTS IN DPOS
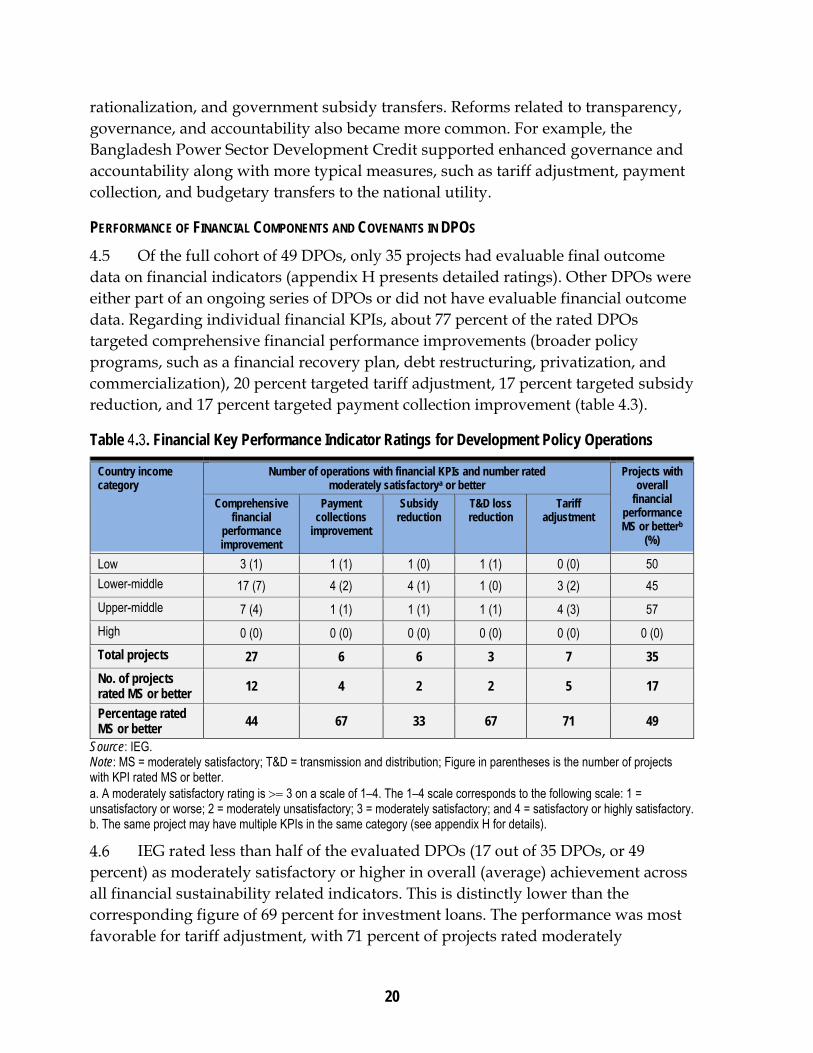
Of the full cohort of 49 DPOs, only 35 projects had evaluable final outcome data on financial indicators (appendix H presents detailed ratings). Other DPOs were either part of an ongoing series of DPOs or did not have evaluable financial outcome data. Regarding individual financial KPIs, about 77 percent of the rated DPOs targeted comprehensive financial performance improvements (broader policy programs, such as a financial recovery plan, debt restructuring, privatization, and commercialization), 20 percent targeted tariff adjustment, 17 percent targeted subsidy reduction, and 17 percent targeted payment collection improvement (table 4.3).
Table 4.3. Financial Key Performance Indicator Ratings for Development Policy Operations
Country income category
Number of operations with financial KPIs and number rated moderately satisfactorya or better
Projects with overall
financial performance MS or betterb
(%)
Comprehensive financial
performance improvement
Payment collections
improvement
Subsidy reduction
T&D loss reduction
Tariff adjustment
Low 3 (1) 1 (1) 1 (0) 1 (1) 0 (0) 50
Lower-middle 17 (7) 4 (2) 4 (1) 1 (0) 3 (2) 45
Upper-middle 7 (4) 1 (1) 1 (1) 1 (1) 4 (3) 57
High 0 (0) 0 (0) 0 (0) 0 (0) 0 (0) 0 (0)
Total projects 27 6 6 3 7 35
No. of projects rated MS or better 12 4 2 2 5 17
Percentage rated MS or better 44 67 33 67 71 49
Source: IEG. Note: MS = moderately satisfactory; T&D = transmission and distribution; Figure in parentheses is the number of projects with KPI rated MS or better. a. A moderately satisfactory rating is 3 on a scale of 1–4. The 1–4 scale corresponds to the following scale: 1 = unsatisfactory or worse; 2 = moderately unsatisfactory; 3 = moderately satisfactory; and 4 = satisfactory or highly satisfactory. b. The same project may have multiple KPIs in the same category (see appendix H for details).
IEG rated less than half of the evaluated DPOs (17 out of 35 DPOs, or 49 percent) as moderately satisfactory or higher in overall (average) achievement across all financial sustainability related indicators. This is distinctly lower than the corresponding figure of 69 percent for investment loans. The performance was most favorable for tariff adjustment, with 71 percent of projects rated moderately
21
satisfactory or higher, and after that are transmission and distribution loss reduction and payment collection improvement (67 percent each), and comprehensive financial improvement (44 percent moderately satisfactory or better). The lowest achievement was on the politically sensitive subsidy reduction (only 33 percent of projects had moderately satisfactory or higher performance).
Despite the World Bank interventions’ largely appropriate focus on financial performance improvement under the DPOs, sustainable improvements toward the structural soundness of sector finances was low, and deeper structural weaknesses persisted and even worsened in some cases, as illustrated in the discussion in section 5.
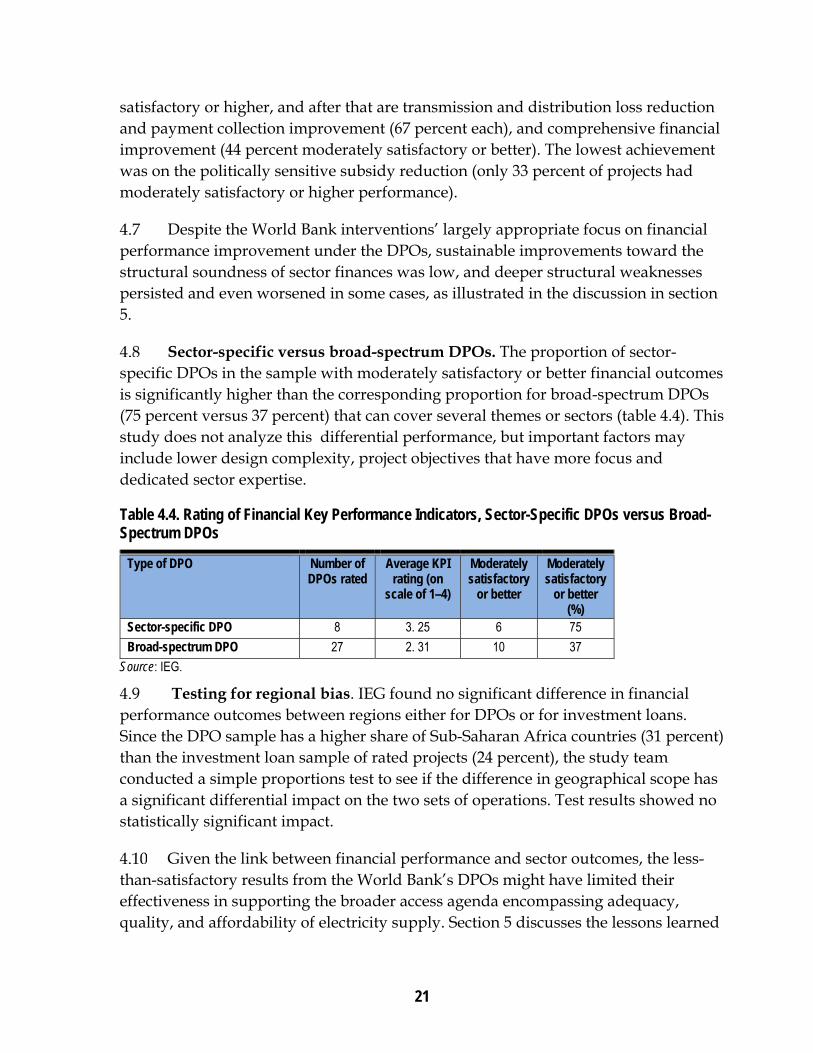
Sector-specific versus broad-spectrum DPOs. The proportion of sector-specific DPOs in the sample with moderately satisfactory or better financial outcomes is significantly higher than the corresponding proportion for broad-spectrum DPOs (75 percent versus 37 percent) that can cover several themes or sectors (table 4.4). This study does not analyze this differential performance, but important factors may include lower design complexity, project objectives that have more focus and dedicated sector expertise.
Table 4.4. Rating of Financial Key Performance Indicators, Sector-Specific DPOs versus Broad-Spectrum DPOs
Type of DPO Number of DPOs rated
Average KPI rating (on
scale of 1–4)
Moderately satisfactory
or better
Moderately satisfactory
or better (%)
Sector-specific DPO 8 3. 25 6 75
Broad-spectrum DPO 27 2. 31 10 37
Source: IEG.
Testing for regional bias. IEG found no significant difference in financial performance outcomes between regions either for DPOs or for investment loans. Since the DPO sample has a higher share of Sub-Saharan Africa countries (31 percent) than the investment loan sample of rated projects (24 percent), the study team conducted a simple proportions test to see if the difference in geographical scope has a significant differential impact on the two sets of operations. Test results showed no statistically significant impact.
Given the link between financial performance and sector outcomes, the less-than-satisfactory results from the World Bank’s DPOs might have limited their effectiveness in supporting the broader access agenda encompassing adequacy, quality, and affordability of electricity supply. Section 5 discusses the lessons learned
22
from the DPOs and investment loans targeting sector financial viability of client country electricity sectors.
5. Lessons from Addressing Sector Financial Viability through Investment Loans and DPOs
An analysis of the World Bank’s experience with investment loans and development policy operations (DPOs) for improving the financial viability of country electricity sectors provides lessons in many areas. The primary lesson is the importance of sustained government commitment and the political economy that can aid or detract from the long-term engagement required to address deep-rooted structural problems in the electricity sectors of many developing countries. Design features of both investment loans and DPOs can shape their performance, combined with government commitment and the occurrence of crises. In particular, the choice between programmatic, multi-tranche, and single-tranche loans, along with sector-specific versus broad-spectrum DPOs, has implications, and they all interact with other factors covered under other lessons. Combining DPOs and investment operations with technical assistance and analytical work affects their efficacy. This learning product discusses these findings in the context of specific investment loans and DPOs.
Addressing the Political Economy of Sector Financial Viability
Widespread evidence suggests that political commitment to serious financial stabilization and recovery objectives is often fragile. New elections, changes in government, macroeconomic crises, and external shocks (or an abating sense of urgency after weathering a severe crisis, often with sizable World Bank financial support) can erode political commitment. Because tariff adjustments toward cost recovery levels are highly sensitive and political, sustained government commitment is important to creating financial stability and getting the electricity sector on the path to long-term financial viability. Therefore, political economy and not just external financial support explains much of the outcome of the World Bank’s policy-based sector operations aimed at a sustainable turnaround in poor finances.
Development policy operations—particularly those well rooted in a medium- or long-term sector strategy and with strong government ownership (such as in Turkey and Brazil)—had multiple and recurring pressure points, translating into a higher probability of successful and sustainable reform. Strong country ownership of the sector development program (including financial viability goals) anchored the
23
DPO approach in Turkey (box 5.1). Full country ownership was fundamental for such a complex and ambitious program’s success. Another positive example is the Brazil Energy Sector Reform Loan that the World Bank built on the political will and consensus formed across party lines to prevent a repetition of the devastating 2000–01 electricity crisis.
Conversely, a long series of World Bank–supported investment projects in Vietnam failed to improve sector finances by applying specific, target-oriented and time-bound measures through tariff-level covenants, which carried excessive political implementation risks and were prone to government noncompliance. Further complicating the situation, during project implementation the World Bank often took too accommodating a stance on noncompliance with the commitments for improving financial performance. Consequently, a long series of World Bank investment operations were essentially ineffective in preventing a serious, recent deterioration of sector finances, much less placing the sector on the road to sustained financial recovery. The sector’s financial situation worsened to the extent that EVN and its subsidiaries (the state-owned national electric utility) were frequently in breach of the financial covenants applied under the World Bank’s investment loans (IEG 2014).
In the Senegal Electricity Sector Efficiency Project (an investment project), the government lacked an overall strategy to address the sector’s deep-seated structural problems (including tariffs and budget transfers) and long-term investment decisions, particularly on generation. Both the government and SENELEC (Société National d'Éléctricité du Sénégal), the national electricity company of Senegal, focused excessively on short-term management of a financial and operational crisis. In these circumstances, sector policy and strategy, along with the financial restructuring of SENELEC, could have been the foundation of World Bank intervention in the electricity sector before any investment commitment (IEG 2013). Separately, during Senegal’s two-tranche Energy Sector Recovery Development Credit approved in June 2008, the government implemented an 8 percent tariff decrease in 2009 when SENELEC was in its most dire financial straits, clearly displaying the impact of the political economy in the country.
Aligning the timeline for the DPO program with that of a government reform program. Deep sector reforms often operate on different time lines than DPOs. In several countries experiencing a persistent, deep, financial and operational crisis in the electricity sector (such as Senegal, Lebanon, Pakistan, and the Dominican Republic), the government, the national utility, and the World Bank can be tempted to focus excessively on short-term management of the crisis. In such circumstances, medium- or long-term sector policy and strategy, along with possible financial restructuring of the national utility, could be the basis of World Bank intervention in
24
the sector before any major investment commitment. A generic lesson learned through the implementation of several DPOs (in Pakistan, Bangladesh, and Lebanon, for example) is that better results can be expected when the DPO-supported sector reform program’s time horizon reasonably matches the time available for effective government action.
Matching the scale of World Bank support to the scope of reforms and political risk. When supporting complex reforms involving large retail tariff adjustments (among other things), it is important make the magnitude of World Bank support (that is, the volume of direct government budget support) commensurate with the political risks incurred by government in implementing the reforms. In Turkey and Brazil, the large lending volumes provided a strong incentive for the government to comply with all major policy conditionalities. However, in the Dominican Republic, the sector DPO’s support (because of its tranching and the resulting slow and lower-than-planned disbursement in four years) was too little to motivate the government or defray the costs of reform. In Senegal’s two-tranche Energy Sector Recovery Development Credit, the heavy frontloading of fund disbursement while backloading the restructuring conditions (reserving the most difficult ones for the second tranche) greatly reduced the government’s incentives in meeting the tough second tranche release conditions.
The Senegal Electricity Sector Efficiency Project, an IDA credit approved in April 2005, had policy objectives that were too ambitious for the credit’s relatively small size ($15.7 million equivalent). Furthermore, the project’s design barely addressed the critical issue of sector finances except for a weak requirement to establish new tariff system (with little details on its implications) and imposing financial covenants based on financial projections that were too optimistic.
Balancing the existing sector environment with achievable targets. If a DPO’s window of political economy opportunity is small, it is better to set modest targets that are achievable in a relatively short time. A government dealing with a severe crisis and encountering high political risks is generally not willing or able to focus on implementation of long-term reforms that not directly related to the ongoing crisis. In several other instances (such as Bangladesh, Senegal, Lebanon, and Pakistan), the World Bank overestimated the favorable environment, which was fleeting and small in reality and would have justified lower program targets. In such contexts, a careful World Bank assessment of the policy reversal risks is necessary, particularly amid highly volatile political circumstances.
25
Steering Clear of Complex Project and Operations Design
The pitfalls of overambitious agendas and excessive conditionalities. Loading too many loan conditionalities on to DPOs while seeking to accomplish an ambitious agenda in a short period occurred in several cases. The two-tranche Energy Sector Recovery Development Credit in Senegal (approved in June 2008) had the overarching objective of restoring the financial and institutional viability of the energy sector as a whole, but most urgently in the electricity subsector mired in deep financial and operational crisis. The project design included a large number of policy conditionalities, including recapitalization of SENELEC, upward adjustments to the electricity tariffs, reform of the tariff-setting mechanism, and elimination of budgetary transfers to SENELEC. The overarching project development objective was relevant, but IEG’s project performance assessment report found the design and implementation was deficient (IEG 2013b). The operation’s two-year timeline was too ambitious, particularly on sector finance improvement. Furthermore, the government’s commitment to implement the required actions, including tariff increases required to turn around sector finances, was considerably overestimated. This commitment weakened further during the 2008 energy crisis, when spiking oil prices hit SENELEC particularly hard, given its liquid fuel–dominated generation mix. SENELEC’s financial situation continued to deteriorate under these circumstances, requiring ever-larger budgetary transfers to stay financially afloat without sufficient tariff increases. The IEG Project Performance Assessment Report rated the operation’s outcome as unsatisfactory, with modest relevance of project design, poor project design, and negligible achievement of development objectives. IEG also rated the World Bank’s performance as unsatisfactory, partly because its stance on key project conditions was too accommodating, and its supervision ratings were too optimistic. The dependence of the electricity sector on the budget has worsened lately, reaching an unprecedented high level of 1. 8 percent of gross domestic product in 2012 (World Bank 2013). The ongoing World Bank–supported Electricity Sector Support Project, an investment operation approved in July 2012, is a fresh attempt at trying to restore reasonable financial health in Senegal’s electricity sector through SENELEC’s financial restructuring and long-overdue tariff adjustments, among other things.
Finally, Morocco is another instructive counterpoint to Turkey’s successful DPO experience. The project in Morocco could not adhere to the original ambitious timetable for the programmatic energy sector development DPO because of the lack of clear reform direction resulting from a change in government, weak client consensus, and the policy program’s complexity and eventually changed to a sequence of stand-alone DPOs. The first DPO suffered from several shortcomings,

26
and IEG rated the overall development outcome as moderately unsatisfactory in the Implementation Completion amd Results Report Review (IEG 2010c). Parallel World Bank investment operations (or operations by other development agencies) could have accompanied or preceded the DPO—such operations would have addressed the high risks from the electricity infrastructure’s poor technical condition and from too much dependence on high-priced imported oil for electricity generation. Without such parallel sector operations, the DPO’s development benefits would have been unsustainable, even under smooth DPO program implementation.
Box 5.1. Turkey Programmatic Electricity Sector DPO: Lessons from a Successful Experience
The Turkey Programmatic Electricity Sector Development Policy Operation (DPO), approved in June 2009 for $2.1 billion equivalent, addressed the then-looming electricity supply shortage in the country by introducing cost-reflective tariffs and improving payment performance for transactions in the electricity wholesale market. After the DPO, the main state-owned utilities have achieved profitability in recent years and paid their arrears in full to private sector generators. The improved sector finances helped attract a large volume of private capital, adding 31,000 megawatts of new generation capacity since 2008 without sovereign guarantees (figure B5.1.1), and an investment of about $12.7 billion for the electricity distribution privatization program. Turkey’s electricity supply security improved considerably, generation capacity more than doubled, and the severe supply imbalances projected for the early 2010s were avoided.
Figure B5.1.1 Turkey: Generation Capacity Additions and Capacity Margins
Note: BOO: Build own operate; BOT: Build own transfer; IPP: Independent Power Producer
Major lessons learned from this highly successful policy operation in Turkey include the following:
Country ownership. A strong country ownership of the sector development program, including the financial viability goals, anchored the DPO approach.
Operational and policy engagement. World Bank operational engagement in the electricity sector complemented the DPO through a series of investment projects, high-quality analytical work, and productive collaboration with the government’s own Restoring Equitable Growth and Employment Program and key sector stakeholders.
0%
20%
40%
60%
80%
0
2,000
4,000
6,000
8,000
2002 2003 2004 2005 2006 2007 2008 2009 2010 2011 2012 2013 2014 Cap
acity margin (%)
Cap
acity ad
ditions
(megawatts)
IPP + autoproducers BOT + BOO Public Capacity Margin (%) Critical Margin
27
Flexible DPO design. Programmatic lending in a series of single-tranche DPOs can be a powerful and flexible World Bank tool (under appropriate conditions) to support complex, challenging, medium-term sector reforms aimed at a drastic turnaround of poor sector finances.
Criticality. The operation’s financial components focused on the most critical aspects of sector financial performance, such as cost-based electricity pricing and full payment collection. Large-scale privatization of the sector has largely strengthened these improvements.
Implementation time. The four-year implementation period—longer than usual for programmatic DPOs—was appropriate for the nature and breadth of issues addressed.
Incentives matter. The large amount of direct budget support under the DPOs provided a strong incentive for the government to comply with the policy conditionalities and strong leverage for the World Bank.
Source: World Bank 2013; ESMAP 2015a.
Retaining focus on underlying structural causes of sector financial viability.
Several investment and multi-tranche sector operations focused excessively on monitoring financial indicators and targets instead of the underlying structural causes of the sector’s or national utility’s poor financial performance. Imposing financial loan covenants with little chance of achievement serves no useful purpose. Working on the conditions that will fulfill these covenants is best (such as in Senegal and Vietnam). Monitoring and reporting on the achievement of each legally binding financial covenant in the project design is also imperative.
Overall, programmatic DPOs showed better outcomes than multi-tranche and one-off DPOs. A well-conceived programmatic series of single-tranche policy loans can be a highly effective approach for supporting a well-specified, medium-term financial recovery program. This approach captures the medium- to long-term nature of most significant financial and related sector reforms, but it allows flexibility to adjust to new developments and changing circumstances during implementation and to adjust the operation’s scope over time. A programmatic approach is especially useful when the government’s reform direction is clear, but the timing and details of implementation need to stay flexible. Multi-tranche operations generally fared poorly compared with programmatic single-tranche DPOs, sometimes leading to noncompliance with agreed actions and loan cancellations. Multi-tranche operations are considered more rigid because the tranche release conditions are predetermined and require waivers from the World Bank’s Board if they are not fully met. Furthermore, the commitment fee for a multi-tranche operation is a higher financial cost to the borrower.
One-off DPOs are prone to excessive complexity, overdesign, and trying to do too much in a short time. The government or a national utility has difficulty focusing
28
on multiple targets in a distressed environment. Even the World Bank is often tempted to do many things as quickly as possible. Experience suggests that one-off operations cannot be expected to make progress on multiple policy fronts in a sector, especially if the policy issues have commonalities with other sectors. Furthermore, it is essential that reform areas to be supported link to other World Bank operations through either investment lending or technical assistance. Some DPOs have weak results frameworks, which often lack clear statements of objectives and outcomes and have low-impact prior actions, also contribute to the difficulties in monitoring and measuring their development impact (Mkrtchyan et al. 2015). This shortcoming is present in some newly approved DPOs that follow the modified Operations Policy and Country Services template. Their results frameworks lack explicitly stated outcomes, and result indicators fall short of meaningfully measuring a DPO’s impact in many cases. Regarding financial performance improvement, sector-specific DPOs tend to perform significantly better than the generally overloaded broad-spectrum DPOs in which financial sustainability is only one of the multiple project objectives.
A one-off DPO may work during a crisis. A stand-alone, single-tranche operation can be considered for a crisis or turnaround situation under appropriate conditions (such as in Brazil in the early 2000s). The Brazilian government was committed and able to implement wide-ranging reform measures because of impetus from the critical 2000–01 electricity crisis. However, a one-off policy operation may not be the best support structure under normal circumstances because most policy and institutional reform that affects financial performance are medium- to long-term processes of multiple, sequential actions. For example, the one-off sector DPO in Bangladesh with no follow-up investment or DPO was unsuitable for a sector with long-term structural problems. The prior actions under the DPO for addressing issues of financial stability and sustainability were clearly inadequate. The sector’s financial situation deteriorated considerably after project closure.
The Energy Sector Reform Loan in Brazil, a one-tranche DPO approved in 2002, successfully address critical financial aspects of the 2001 electricity supply crisis—the worst the country every experienced because of severe, prolonged drought. The DPO supported a series of regulatory reforms, including rebalancing retail tariffs to accurately reflect service cost, thus eliminating subsidies for large, industrial consumers; reviewing distributor tariffs to ensure they were cost-reflective; revising high-voltage transmission tariffs to fully reflect geographic cost variations, leading to more economic generation siting; and resolving financial disputes among electricity companies caused by the energy crisis. The disputed amounts were large, totaling $2.6 billion between generators and distributors (because generators could not meet their electricity delivery contracts with the distributors) and $2 billion between the distributors and the Brazilian electricity regulatory agency (because the

29
government-imposed rationing led to financial losses for the distributors). Overall, the project helped restore the financial health of the electricity companies (public and private). The World Bank originally preferred a two-tranche DPO, but a highly committed government, under the pressure of an acute crisis, implemented most of the reform measures promptly. The government also reasonably argued that it would be much more sensible to complete the operation during the outgoing administration instead of getting caught up in the transition or facing project delays later because of it, or possible cancellation by the new government (World Bank 2003).
The electricity sector DPO in the Dominican Republic, two electricity sector DPOs in Senegal , and the one-tranche DPO for Bangladesh (all rated unsatisfactory for development outcome) are examples of some of typical design shortcomings of development policy lending in a difficult sector environment that borders on financial chaos.
The Programmatic Power Sector Reform Loan in the Dominican Republic, approved in May 2005 as a three-tranche operation, supported the government’s strategy for electricity sector financial recovery, particularly to establish conditions that would improve both access to electricity and quality of service, especially by reducing widespread blackouts. Heavily underpriced electricity and widespread nonpayment of bills (including by government consumers) were at the heart of the sector’s deep financial and operational crisis marked by large government subsidy transfers to distribution companies, extremely poor service quality, rationing, frequent blackouts, and slow increases in access to electricity in unelectrified rural communities.
The loan to stabilize electricity supply and reduce blackouts supported a key short-term policy measure that included keeping current on payments to generation companies. Outcomes for the short-term stabilization of supply were satisfactory in 2006–07, but the oil price increase in 2008 pushed the sector’s deficit to more than $1.2 billion, and budget transfers were insufficient to pay generators in full. Large-scale blackouts returned in 2008 as a result. The loan’s contribution to laying the foundation for the medium-term stabilization of the electricity supply was weak on balance. The cash recovery improved somewhat, but tariffs remained frozen amid rising fuel prices, and both government transfers and payment arrears increased. The government did not implement the automatic tariff adjustment despite its commitment to do so under the loan. Further complicating the situation, the government did not sustain the large and growing levels of operational subsidy transfers required to keep current on the amounts owed to generators.

30
Under these circumstances, the original intent for as a rapid disbursement mechanism with a tranche of $50 million in loans every six months gradually became a halting effort to comply with the conditionality checklist for the first and second tranches for four years. Of the $150 million loan amount, only $100 million was disbursed, and the nonfulfillment of policy actions led to cancellation of the third tranche at loan closing in 2009. Overall, IEG’s Implementation Completion and Results Report rated the project outcomes as unsatisfactory because they fell far short of project development objectives—that is, the operation did not contribute to making the sector more financially sustainable (World Bank 2009).
The Dominican Republic’s experience suggests that the choice of a multi-tranche modality may not provide the flexibility needed to reassess a rapidly changing sector situation and adapt the World Bank’s approach accordingly. Even at project appraisal, a multi-tranche operation was considered more rigid than a programmatic series of single-tranche loans because the tranche release conditions for the multi-tranche operation were predetermined and would require waivers from the World Bank’s Board if they were not fully met, which was the case on two occasions regarding the critical tariff adjustment formula. Based on experience, a programmatic series of single-tranche loans might have been the better approach for supporting a well-specified, medium-term program for the crisis in the Dominican Republic’s electricity sector to allow flexibility to adjust to changing circumstances during implementation (World Bank 2011b).
The Senegal Electricity Sector Efficiency Project, an IDA credit approved in April 2005, carried significant financial performance-enhancing measures in addition to the physical components that supported the electricity sector’s 10-year investment program through a two-phase adaptable program loan (APL) combined with partial risk guarantees and International Finance Corporation (IFC) loans.11 The key project objectives included the adoption of a new electricity tariff mechanism and a series of financial covenants to promote steady improvement in SENELEC’s finances.12 However, the project did not explore these covenants in-depth during project preparation or establish measures to that effect during implementation. The tariff-setting mechanism was reformed twice during project implementation, but this was not sufficient to spare SENELEC from severe financial difficulties. Paragraph 5.31
11 None of the IDA-funded physical investments was carried out[[AQ: Are physical investments implemented? Is there another word besides “carried out?”]], but the IFC-supported power plant was satisfactorily completed in 2008, though with a two-year delay and serious technical problems in the first years of operation. 12 Financial covenants included debt service coverage, return on assets, and accounts receivable.
31
discusses this in more detail in the context of leveraging investment operations with technical assistance and analytical work.
The single-tranche Power Sector Development Policy Credit in Bangladesh, approved in June 2008 and considered the World Bank’s flagship operation, aimed to improve the electricity sector’s financial sustainability through several measures, including corporatization, enhanced governance and accountability, customer metering, and systematic transfer of government subsidy to the main national utility, the Bangladesh Power Development Board. IEG found this objective was highly relevant, but the 2014 Project Performance Assessment Report rated the development outcome as unsatisfactory, citing little progress toward sector financial solvency and a continuing, unsustainably high level of government subsidies (World Bank 2014). For example, the planned installation of automatic metering to monitor interutility flows and consumption by large electricity consumers in the South Zone Power Distribution Company was not pursued seriously, even six years after credit closure. The company corporatization was essentially reversed in the five years after credit closure, erasing earlier progress. Tariffs continue to be significantly short of cost recovery, and the sector’s financial deterioration persisted. The scale of subsidy grew sharply since credit closure. The credit operation’s only positive outcome was that the government created a system for transferring operational subsidies to the main utility. The project design was logical and comprehensive, but the single-tranche arrangement was a serious design shortcoming. Clearly, the World Bank acted opportunistically with a reform-minded (though short-lived) caretaker administration. However, the sector’s long-standing structural, financial, and governance shortcomings and the operation’s complexity in the context of the existing institutional capacity, readiness, and political instability would have called for a medium-term, multi-tranche project instead of a 10-month, one-off operation (IEG 2014).
Sustaining Improvements in Sector Financial Performance
Deep-rooted structural problems have no quick fix. Electricity sector reforms that involve financially restructuring insolvent or bankrupt utilities require time and sustained financial and technical resources that few developing countries can provide. Experience shows that fundamental financial restructuring of the electricity sector takes many years, and the turnaround process may take even longer than usual in countries with a long-running history of almost permanent financial crisis (such as India, Senegal, the Dominican Republic, and Lebanon). Considering that deep-seated problems of structural financial underperformance have no quick fix, some of the policy-based sector loans (particularly the single-tranche DPOs such as
32
those in Bangladesh, Senegal, and Lebanon) tried to achieve too much too soon. This circumstance may largely explain the prevalence of these operations’ relative poor development outcome ratings.
Given the long-standing, deep-rooted structural problems in the electricity sectors of many developing countries, a single-tranche sector DPO can at best contribute to short-term stabilization of a sector mired in financial crisis—for example, through budget support to enable the government to make budgetary transfers that compensate for electricity underpricing in a largely state-owned system. Experience shows that it is unrealistic to expect a quick-disbursing, single-tranche DPO to address long-standing structural weaknesses successfully, much less place the sector on the road to financial sustainability, even when the World Bank’s broad operational engagement in the sector accompanies the policy operation (as in Bangladesh).
As discussed in paragraphs 5.17–5.21, the Dominican Republic DPOs faced a project time frame that was unrealistic and too optimistic, which was completely out of sync with the sector’s long-standing, deeply rooted structural financial underperformance. In particular, the policy action on electricity tariffs was too ambitious in the country’s difficult political environment. Including measures to bring tariffs in line with market rates for oil in a short time was unrealistic. The government’s resulting lack of political commitment to implement the automatic tariff adjustment undermined all efforts to move the sector toward financial sustainability on a compressed time scale.
Turkey’s programmatic DPOs present a positive experience in this respect. The four-year implementation period—longer than usual for programmatic DPOs—was appropriate for the nature of the underlying key issues addressed, including the tariff reform, payment collections, and privatization of a large number of distribution companies.
Leveraging investment operations with technical assistance and analytical work yields better and more sustainable results. Kazakhstan’s experience in successfully turning around its national utility’s finances through a set of sustained World Bank–supported measures illustrates this point well. The Kazakhstan Electricity Grid Operating Company (KEGOC) was unprofitable since its establishment, with losses in the late 1990s of 7–10 percent of total revenues because of underpriced transmission and dispatch service, excessive use of government-imposed transmission tariff discounts granted to selected large, industrial customers, and losses from noncore businesses. Against this background, a major project development objective of the World Bank–funded Kazakhstan Electricity
33
Transmission Project was to help transform KEGOC (a corporate borrower) into a financially viable company, set a cost-reflective transmission tariff, and support full cost recovery for its services, including eliminating administratively imposed tariff discounts, improving payment collections, reducing accounts receivable, and divesting noncore businesses. KEGOC became profitable in 2002 because of the consistent implementation of these measures and remained profitable through 2015 with the support of a series of follow-on World Bank projects that allowed sustained monitoring of KEGOC’s financial performance reform of the transmission tariff methodology, and avoided recourse to administratively ordered tariffs discounts. KEGOC is one of Central Asia’s financially and technically strongest national electricity utilities, with the capacity to self-finance a considerable portion (more than half) of the company’s ambitious medium-term investment and modernization programs (World Bank 1999 and 2009e).13
A series of four World Bank loans to India’s national electricity transmission company, Power Grid Corporation of India (PowerGrid), in the past two decades is another good example of the value of long-term World Bank engagements through sequential specific investment loans to improve corporate financial performance. Four World Bank loans significantly and measurably contributed to improved corporate finances. When the first loan was approved in 1993, PowerGrid was financially weak and had low value assets and limited cash resources. However, PowerGrid’s financial capacity continued to improve at an impressive rate during the four operations. The company regularly complied with the financial loan covenants (including the standard ratio covenants) and frequently exceeded them. The company’s net profitability increased substantially over time through a series of measures such as tariff improvements, employee productivity gains, impressive growth in power exchange and transmission volumes, recovery of past debts, and effective receivables management. For example, during the life of the fourth loan (FY2008–14), PowerGrid complied with the following financial legal covenants in the loan agreement: the debt-equity ratio was lower than 80:20; the self-financing ratio was greater than 20 percent; and the accounts receivables stood at only 0. 34 months of average billing as of July 31, 2014 compared with the legally allowed less-than-three months of billing (IEG 2012c and 2015a).
Another example long-term World Bank engagement is the Mongolia Energy Sector Project (IEG 2015b), implemented during 2001–13, which supported the government’s strategy of improving the reliability, quality, cost-effectiveness, and
13 IEG’s sources also include the Kazakhstan Electricity Grid Operating Company Annual Reports for various years.
34
financial viability of the electricity sector. The project design combined physical components with commercialization measures and institutional and capacity-building arrangements. The operation significantly contributed to reducing electricity system losses, improving service reliability in distribution, and enhancing revenue collection by Ulaanbaatar Electricity Distribution Company (UBEDN). The project achieved UBEDN’s financial recovery by reducing the company’s cost of supply through loss reduction, and providing much-needed liquidity through increased revenue collection and reduction of accounts receivable. At project completion, the number of billing collection days at UBEDN decreased from 100 to 35 days.
The Rwanda Urgent Electricity Rehabilitation Project aimed to alleviate power shortages and enhance the capacity of energy sector institutions. The project was a fast-track operation to alleviate the power supply shortfall. Investments in transmission and distribution contributed to a reduction of technical system outages and a loss reduction from 25 percent to 16 percent. The application of a prepayment system also cut commercial losses. The government significantly raised the power tariffs in two stages, and payment collection increased from 72 percent to 84 percent.
Senegal’s experience contrasts with these examples. The Senegal Electricity Sector Efficiency Project, an IDA credit approved in April 2005, carried significant financial performance-enhancing measures in addition to the physical components that supported the electricity sector’s 10-year investment program through a two-phase APL combined with partial risk guarantees and IFC loans.14 The key project objectives included the adoption of a new electricity tariff mechanism and a series of financial covenants to promote steady improvement in SENELEC’s finances.15 However, the project did not explore these covenants in-depth during project preparation or establish measures to that effect during implementation. The tariff-setting mechanism was reformed twice during project implementation, but this was not sufficient to spare SENELEC from severe financial difficulties. Instead, the company’s financial situation worsened dramatically in 2006 when it lost $70 million (after a government operating subsidy of about the same amount), and continued to worsen in subsequent years because of higher oil prices and delayed investments, requiring budgetary transfers of about $220 million in 2011. SENELEC’s leverage rose to alarming levels, with a debt-equity ratio of 86:14 by the end of 2011. None of the financial covenants were met. IEG’s Project Performance Assessment Report (IEG
14 None of the IDA-funded physical investments was carried out, but the IFC-supported power plant was satisfactorily completed in 2008, though with a two-year delay and serious technical problems in the first years of operation. 15 Financial covenants included debt service coverage, return on assets, and accounts receivable.
35
2013b) rated the project outcome unsatisfactory, including World Bank performance. The report noted that SENELEC’s serious structural operating deficit in the absence of revenue-enhancing measures, including much-needed tariff increases.
In retrospect on both Senegal and the Dominican Republic (paragraphs 5.17–5.22), the World Bank could have considered sufficient operational and policy advisory engagement (such as in Turkey and Vietnam) on various sector fronts to work effectively with governments on sustainable implementation of financial performance. In the Dominican Republic, parallel World Bank investment operations (or operations by other development agencies) could have accompanied or preceded the stand-alone sector DPO—such operations would have addressed the high risks from the electricity infrastructure’s poor technical condition and from too much dependence on high-priced imported oil for electricity generation. Without such parallel sector operations, the DPO’s development benefits would have been unsustainable, even under smooth DPO program implementation.
36
References
AF-Mercados EMI. 2013. “Strategic Options for Enhanced Financial Performance of EVN [Vietnam Electricity].” Prepared for the World Bank and EVN, October 2013.
Andres, Luis A., Jordan Schwartz, and J. Luis Guasch. 2013. Uncovering the Drivers of Utility Performance: Lessons from Latin America and the Caribbean on the Role of the Private Sector, Regulation, and Governance in the Power, Water, and Telecommunication Sector. Washington, DC: World Bank.
Besant-Jones, John E. 2006. “Reforming Power Markets in Developing Countries: What Have We Learned?” Energy Study No. 38017, World Bank, Washington, DC.
Briceno-Garmendia, Cecilia, Karlis Smits, and Vivien Foster. 2008. “Fiscal Costs of Infrastructure in Sub-Saharan Africa.” African Infrastructure Country Diagnostic (AICD), World Bank, Washington, DC.
Briceno-Garmendia Cecilia, and Maria Shkaratan. 2011. “Power Tariffs: Caught between Cost Recovery and Affordability.” Policy Research Working Paper No. WPS5904, World Bank, Washington, DC.
Dilli, Budak, and Kari J. Nyman. 2015. “Turkey’s Energy Transition. Milestones and Challenges.” ESMAP Paper No. ACS14951, World Bank, Washington, DC.
Dobozi, Istvan. 2016. “Cost Recovery and Financial Performance in the Electricity Sector of Developing Countries: A Literature Review.” Draft report prepared under the research initiative “Rethinking Power Sector Reform,” World Bank, Washington, DC.
Eberhard Anton Adriaan, Vivien Foster, Cecilia Briceno-Garmendia, Fatimada Ouedraogo, Daniel Camos, and Maria Shkaratan. 2008. “Underpowered: The State of the Power Sector in Sub-Saharan Africa.” Africa Infrastructure Country Diagnostic (AICD), Background Paper No. 6 (Energy Study No. 48214), World Bank, Washington, DC.
IEG (Independent Evaluation Group). 2010a. “Bangladesh: Power Sector Development Policy Credit.” Implementation Completion Report Review No. ICRR13280, World Bank, Washington, DC.
――――. 2010b, “Dominican Republic: Programmatic Power Sector Reform Loan.” Implementation Completion Report Review No. ICRR13270, World Bank, Washington, DC.
――――. 2010c. “Morocco: Energy Sector Development Policy Loan.” Implementation Completion Report Review No. ICRR13302, World Bank, Washington, DC.
――――. 2012a. “Senegal: Energy Sector Recovery Development Policy Financing.” Implementation Completion Report Review No. ICRR13744, World Bank, Washington, DC.
――――. 2012b. “Rwanda: Urgent Electricity Rehabilitation.” Implementation Completion Report Review No. ICRR1362, World Bank, Washington, DC.
――――. 2012c. “India: Power System Development Project.” Implementation Completion Report Review No. ICRR13890, World Bank, Washington, DC.
――――. 2013a. “Approach Paper: Evaluation of the World Bank Group’s Support for Electricity Access.” Approach Paper No. 88414, World Bank, Washington, DC.
――――. 2013b. “Senegal: Electricity Sector Efficiency Enhancement Project and Energy Sector Recovery Development Policy Credit Project.” Project Performance Assessment Report No. 81243, World Bank, Washington, DC.
37
――――. 2014a. “Bangladesh: Rural Electrification and Renewable Energy Development; and Power Sector Development Technical Assistance Project.” Project Performance Assessment Report No. 88546, World Bank, Washington, DC.
――――. 2014b. “Vietnam: Transmission, Distribution, and Disaster Reconstruction Project; Rural Energy Project; and System Efficiency Improvement, Equitization, and Renewables Project.” Project Performance Assessment Report No. 88543, World Bank, Washington, DC.
――――. 2015a. “India: Fourth Power System Development Project.” Implementation Completion Report Review No. ICRR14748, World Bank, Washington, DC.
――――. 2015b. “Mongolia: Energy Sector Project.” Implementation Completion Report Review No. ICRR14796, World Bank, Washington, DC.
――――. 2015c. “Private Sector Participation in Electricity Transmission and Distribution: Experiences from Brazil, Peru, the Philippines, and Turkey.” ESMAP Paper No. 99009, World Bank, Washington, DC.
――――. 2015d. World Bank Group Support to Electricity Access, FY2000–2014: An Independent Evaluation. Washington, DC: World Bank.
Jog, Sanjay. 2011. “Power Regulators Concerned over Discoms’ Financial Viability.” Business Standard, February 14. http://www.business-standard.com/article/economy-policy/power-regulators-concerned-over-discoms-financial-viability-111021400050_1.html.
Kessides, Ioannis N. 2012. “The Impacts of Electricity Sector Reforms in Developing Countries.” The Electricity Journal 25 (6): 79–88.
Kojima, Masami, and Chris Trimble. 2016. “Power Sector Quasi-Fiscal Deficits in Sub-Saharan Africa.” Draft for review, World Bank, Washington, DC.
Komives Kristin, Vivien Foster, Jonathan Halpern, and Quentin Wodon, Roohi Abdullah. 2005. Water, Electricity, and the Poor: Who Benefits from Utility Subsidies? Washington, DC: World Bank.
Mayer, Kristy, Sudeshna Ghosh Banerjee, and Chris Trimble. 2015. Elite Capture: Residential Tariff Subsidies in India. Washington, DC: World Bank.
Mkrtchyan, Aghassi, Mark Sundberg, Nicholas David York, and Caroline Heider. 2015. “The Quality of Results Frameworks in Development Policy Operations.” Working Paper No. 97890, World Bank, Washington, DC.
Nagayama, Hiroaki. 2007. “Effects of Regulatory Reforms in the Electricity Supply Industry on Electricity Prices in Developing Countries.” Energy Policy 35 (6): 3,440–3,462.
Pargal Sheoli, and Sudeshna Ghosh Banerjee. 2014. “More Power to India: The Challenge of Distribution: India Power Sector Diagnostic Review.” Working Paper ACS9203, World Bank, Washington, DC.
Sen Anugama and Toorj Jamasb. 2010. “The Economic Effects of Electricity Deregulation: An Empirical Analysis of Indian States.” EPRG Working Paper No. 1001, University of Cambridge, Cambridge, U.K.
Vagliasindi Maria, and John Besant-Jones. 2013. Power Market Structure: Revisiting Policy Options. Washington, DC: World Bank.
The Economist. 2016. “African Energy: The Leapfrog Continent.” The Economist, June 6. http://www.economist.com/news/middle-east-and-africa/21653618-falling-cost-renewable-energy-may-allow-africa-bypass.
38
World Bank. 1999. “Kazakhstan: Electricity Transmission Rehabilitation Project.” Project Appraisal Document No. 19620, World Bank, Washington, DC.
――――. 2003. “Brazil: Energy Sector Reform Loan Project.” Implementation Completion and Results Report No. 26185, World Bank, Washington, DC.
――――. 2005. “The Dominican Republic: Proposed Programmatic Power Sector Reform Loan Project.” Program Document No. 31741, World Bank, Washington, DC.
――――. 2009a. “2009 Development Policy Lending Retrospective: Flexibility, Customization, and Results.” Board Report No. 52207, World Bank, Washington, DC.
――――. 2009b. “Dominican Republic: Programmatic Power Sector Reform Loan Project.” Implementation Completion and Results Report No. ICR1260, World Bank, Washington, DC.
――――. 2009c. “Bangladesh: Power Sector Development Policy Credit Project.” Implementation Completion and Results Report No. ICR1098, World Bank, Washington, DC.
――――. 2009d. “Morocco: Energy Sector Policy Loan Project.” Implementation Completion and Results Report No. ICR1223, World Bank, Washington, DC.
――――. 2009e. “Kazakhstan: Electricity Transmission Rehabilitation Project.” Implementation Completion and Results Report No. ICR1120, World Bank, Washington, DC.
――――. 2011a. “Best Practices for Market-Based Power Rationing: Implications for South Africa.” ESMAP Paper No. 69036, World Bank, Washington, DC.
――――. 2011b. “Good Practice Note for Development Policy Lending: Designing Development Operations.” World Bank Operations Policy and Country Services, World Bank, Washington, DC.
――――. 2011c. “Pakistan: Poverty Reduction and Economic Support Operation.” Implementation Completion and Results Report No. ICR1782, World Bank, Washington, DC.
――――. 2011d. “Senegal: Electricity Sector Efficiency Enhancement Project, Phase 1, APL-1.” Implementation Completion and Results Report No. ICR1832, World Bank, Washington, DC.
――――. 2012a. “Crisis in the Indian Power Sector.” South Asia Energy Brief.
――――. 2012b. “Senegal: Electricity Sector Support Project (ESSP).” Project Appraisal Document No. 65901, World Bank, Washington, DC.
――――. 2013. “Turkey: First Programmatic Electricity Sector Development Policy Loan and Second and Third Programmatic Environmental Sustainability and Energy Sector Development Policy Loans Programs.” Implementation Completion and Results Report No. ICR2926, World Bank, Washington, DC.
――――. 2015. “Rwanda: Electricity Sector Strengthening Project.” Project Appraisal Document No. PAD1301, World Bank, Washington, DC.
――――. 2016. Doing Business 2016: Measuring Regulatory Quality and Efficiency. Washington, DC: World Bank.
World Economic Forum and Accenture. 2013. The Global Energy Architecture Performance Index Report 2014. Zurich: World Economic Forum.
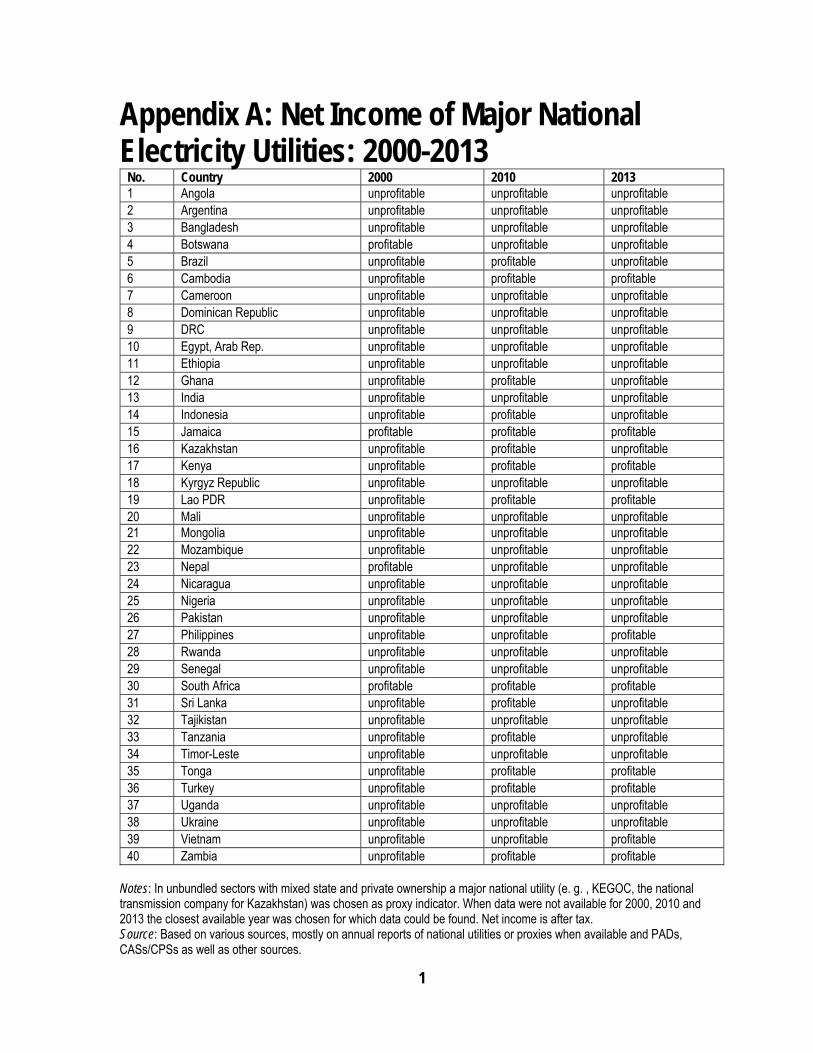
1
Appendix A: Net Income of Major National Electricity Utilities: 2000-2013
No. Country 2000 2010 2013 1 Angola unprofitable unprofitable unprofitable 2 Argentina unprofitable unprofitable unprofitable 3 Bangladesh unprofitable unprofitable unprofitable 4 Botswana profitable unprofitable unprofitable 5 Brazil unprofitable profitable unprofitable 6 Cambodia unprofitable profitable profitable 7 Cameroon unprofitable unprofitable unprofitable 8 Dominican Republic unprofitable unprofitable unprofitable 9 DRC unprofitable unprofitable unprofitable 10 Egypt, Arab Rep. unprofitable unprofitable unprofitable 11 Ethiopia unprofitable unprofitable unprofitable 12 Ghana unprofitable profitable unprofitable 13 India unprofitable unprofitable unprofitable 14 Indonesia unprofitable profitable unprofitable 15 Jamaica profitable profitable profitable 16 Kazakhstan unprofitable profitable unprofitable 17 Kenya unprofitable profitable profitable 18 Kyrgyz Republic unprofitable unprofitable unprofitable 19 Lao PDR unprofitable profitable profitable 20 Mali unprofitable unprofitable unprofitable 21 Mongolia unprofitable unprofitable unprofitable 22 Mozambique unprofitable unprofitable unprofitable 23 Nepal profitable unprofitable unprofitable 24 Nicaragua unprofitable unprofitable unprofitable 25 Nigeria unprofitable unprofitable unprofitable 26 Pakistan unprofitable unprofitable unprofitable 27 Philippines unprofitable unprofitable profitable 28 Rwanda unprofitable unprofitable unprofitable 29 Senegal unprofitable unprofitable unprofitable 30 South Africa profitable profitable profitable 31 Sri Lanka unprofitable profitable unprofitable 32 Tajikistan unprofitable unprofitable unprofitable 33 Tanzania unprofitable profitable unprofitable 34 Timor-Leste unprofitable unprofitable unprofitable 35 Tonga unprofitable profitable profitable 36 Turkey unprofitable profitable profitable 37 Uganda unprofitable unprofitable unprofitable 38 Ukraine unprofitable unprofitable unprofitable 39 Vietnam unprofitable unprofitable profitable 40 Zambia unprofitable profitable profitable
Notes: In unbundled sectors with mixed state and private ownership a major national utility (e. g. , KEGOC, the national transmission company for Kazakhstan) was chosen as proxy indicator. When data were not available for 2000, 2010 and 2013 the closest available year was chosen for which data could be found. Net income is after tax. Source: Based on various sources, mostly on annual reports of national utilities or proxies when available and PADs, CASs/CPSs as well as other sources.
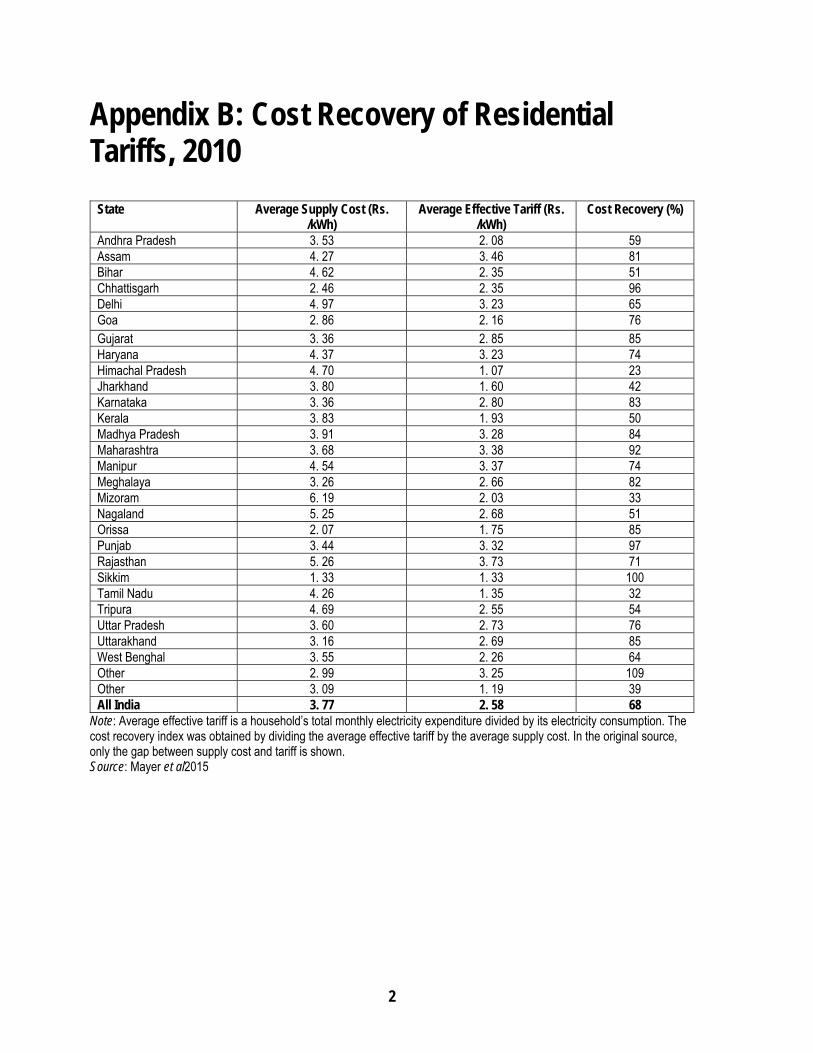
2
Appendix B: Cost Recovery of Residential Tariffs, 2010
State Average Supply Cost (Rs. /kWh)
Average Effective Tariff (Rs. /kWh)
Cost Recovery (%)
Andhra Pradesh 3. 53 2. 08 59 Assam 4. 27 3. 46 81 Bihar 4. 62 2. 35 51 Chhattisgarh 2. 46 2. 35 96 Delhi 4. 97 3. 23 65 Goa 2. 86 2. 16 76 Gujarat 3. 36 2. 85 85 Haryana 4. 37 3. 23 74 Himachal Pradesh 4. 70 1. 07 23 Jharkhand 3. 80 1. 60 42 Karnataka 3. 36 2. 80 83 Kerala 3. 83 1. 93 50 Madhya Pradesh 3. 91 3. 28 84 Maharashtra 3. 68 3. 38 92 Manipur 4. 54 3. 37 74 Meghalaya 3. 26 2. 66 82 Mizoram 6. 19 2. 03 33 Nagaland 5. 25 2. 68 51 Orissa 2. 07 1. 75 85 Punjab 3. 44 3. 32 97 Rajasthan 5. 26 3. 73 71 Sikkim 1. 33 1. 33 100 Tamil Nadu 4. 26 1. 35 32 Tripura 4. 69 2. 55 54 Uttar Pradesh 3. 60 2. 73 76 Uttarakhand 3. 16 2. 69 85 West Benghal 3. 55 2. 26 64 Other 2. 99 3. 25 109 Other 3. 09 1. 19 39 All India 3. 77 2. 58 68
Note: Average effective tariff is a household’s total monthly electricity expenditure divided by its electricity consumption. The cost recovery index was obtained by dividing the average effective tariff by the average supply cost. In the original source, only the gap between supply cost and tariff is shown. Source: Mayer et al2015

3
Appendix C. Sub-Saharan Africa: Breakdown of Hidden Costs, 2014 (% of current GDP)
Country Bill collection
T&D losses
Overstaffing Underpricing Total hidden costs
Benin 0. 11 0. 27 0. 26 -0. 29 0. 36
Botswana 0. 05 0. 00 0. 24 3. 09 3. 38
Burkina Faso 0. 06 0. 23 0. 23 0. 54 1. 06
Burundi 0. 37 0. 21 0. 06 0. 20 0. 85
Cameroon 0. 08 0. 43 0. 23 0. 11 0. 85
Cabo Verde 0. 52 1. 37 0. 00 -0. 37 1. 52
Central African Republic
0. 08 0. 22 0. 16 -0. 17 0. 30
Comoros 1. 21 1. 45 0. 30 0. 71 3. 67
Congo, Rep. 0. 12 0. 39 0. 14 -0. 10 0. 54
Côte d'Ivoire 0. 65 0. 48 0. 17 0. 89 2. 18
Ethiopia 0. 25 0. 36 0. 05 1. 16 1. 82
Gabon 0. 02 0. 32 0. 26 -0. 18 0. 42
Gambia, The 1. 78 1. 52 1. 11 1. 19 5. 59
Ghana 0. 10 0. 31 0. 19 -0. 05 0. 54
Guinea 0. 65 0. 39 0. 13 0. 92 2. 08
Kenya 0. 02 0. 20 0. 15 0. 49 0. 86
Lesotho 0. 39 0. 00 n/a 0. 41 0. 80
Liberia 0. 06 0. 21 0. 08 -0. 01 0. 34
Madagascar 0. 84 0. 71 0. 16 0. 37 2. 08
Malawi 0. 35 0. 95 0. 36 1. 54 3. 21
Mali 0. 04 0. 47 0. 19 0. 67 1. 37
Mauritania 0. 61 0. 55 0. 24 0. 58 1. 98
Mauritius 0. 04 0. 00 0. 41 0. 18 0. 63
Mozambique 0. 05 0. 27 0. 34 0. 26 0. 92
Niger 0. 21 0. 16 0. 21 -0. 05 0. 53
Nigeria 0. 16 0. 21 n/a 0. 10 0. 47
Rwanda 0. 09 0. 34 0. 16 0. 45 1. 04
São Tomé and Príncipe
1. 88 2. 68 0. 60 0. 68 5. 83
Senegal 0. 37 0. 53 0. 38 1. 30 2. 58
Seychelles 0. 07 0. 20 0. 29 -0. 04 0. 53
Sierra Leone 0. 21 0. 46 0. 09 0. 08 0. 84
South Africa 0. 17 0. 00 0. 47 4. 12 4. 76

4
Country Bill collection
T&D losses
Overstaffing Underpricing Total hidden costs
Sudan 0. 00 0. 10 n/a 1. 33 1. 43
Swaziland 0. 04 0. 04 0. 41 0. 93 1. 42
Tanzania 0. 08 0. 33 0. 08 1. 22 1. 71
Togo 0. 56 1. 19 0. 30 -0. 33 1. 72
Uganda 0. 01 0. 17 0. 08 -0. 19 0. 08
Zambia 0. 14 0. 12 0. 62 0. 99 1. 87
Zimbabwe 1. 35 0. 62 0. 75 3. 20 5. 92
Median $0 0. 32 0. 21 0. 45 1. 37
Source: Kojima and Trimble 2016

5
Appendix D. Illustrating the Link Between Financial Performance and Sector outcomes: Four Recent Country Experiences
Most recently, sector finances have further deteriorated—in some cases rather sharply—in a number of developing countries including those to which the World Bank has provided considerable advisory and financing support. A combination of factors accounts for this unforeseen trend, including continued underpricing, overly ambitious government-imposed investment programs and onerous debt-service burdens driven increasingly by costly short-term borrowing. Several illustrative cases are described below in some detail. In Vietnam, the financial performance of Vietnam Electricity (EVN), the national utility, was reasonably satisfactory till the mid-2000s. A sharp deteriorating trend started in 2008, raising serious concerns about EVN’s and the power sector’s financial and operational sustainability going forward. Between 1998 and 2011, the company posted large financial losses. 16 In 2011, the after-tax loss amounted to 13 percent of the company’s net sales revenue. Indebtedness has grown so much in the absence of capital injection from the government that EVN is now increasingly challenged to raise funds from the commercial market. Due to overall poor financial performance in recent years, EVN Holding and its subsidiary companies, unlike before, have often been in breach of the financial ratio covenants (including for self-financing and debt coverage) applied under ongoing World Bank and Asian Development Bank loans. Several drivers explain the deterioration of the financial situation, including insufficient tariffs, operational underperformance, lack of proper financial management and un-hedged positions in foreign exchange, interest rates and fuels, and unsustainable indebtedness driven largely by an overly ambitious investment program (AF-Mercados EMI 2013). The financial deterioration has coincided with a steady worsening of the reliability and quality of electricity supply in distribution. 17 The high voltage transmission system has also displayed a mixed reliability record lately. Although the number of interruptions has fallen, the duration of interruptions has increased considerably (IEG 2014b).
16 In 2012 and 2013, EVN recorded a net profit due to favorable hydrological conditions and the resulting large increase in low-cost hydropower in the generation mix.
17 For example, in 2012, under the Northern Power Corporation, one of the three large regional distribution companies, there were 53 interruptions per customer, totaling a cumulative 150 hours (or 6.3 days).
6
In India, despite considerable progress in some reforms (including legislation, open access regulation, market opening), power sector finances have deteriorated sharply in the past decade, which, in conjunction with other factors, have brought the electricity sector to the brink of crisis. The alarming state of the sector is highlighted by the massive grid failures in July 2012 that interrupted electricity supply in the northern half of the country for two consecutive days. Generally, consumers receive unreliable service with frequent supply interruptions. Sector-wide financial losses stood at US$25 billion in 2011 (1. 3 percent of GDP), more than twice (in real terms) than in 2003, i. e. , growing at 9 percent per year. The increase in sector losses has been largely plugged by state subsidies and heavy (and increasingly short term and costly) borrowing to meet operating expense by all segments of the value chain. Subsidies received by state utilities over 2003-2011 totaled US$28 billion (2 percent of GDP in 2011) and total debt stood at US$77 billion in 2011 (5 percent of GDP). The financial crisis is rooted overwhelmingly in the distribution sector from which it spills over to transmission and generation. Distribution utilities account for more 70 percent of total sector-wide accumulated losses. Three main factors have been driving the underlying cost-revenue gap and the resulting financial loss: (i) inadequate tariff increases to cover rising costs (including heavily subsidized electricity supply to agriculture); (ii) high technical and commercial losses (in the range of 30-40 percent in the major electricity consuming states); and (iii) inefficient revenue collection [94 percent in 2011] (Pargal and Banerjee 2014). In Bangladesh, despite a series of Development Support Credits, including a recent (2008-2009) freestanding Power Sector Development Credit aimed at financial stabilization of the electricity sector, the latter’s financial performance has deteriorated significantly lately due largely to tariffs significantly short of cost recovery levels. Net losses of the national electricity utility (Bangladesh Power Development Board/BPDB) increased from US$146 million (18 percent of operating revenue) in FY2008 to US$640 million (30 percent) by FY2013 – a 4. 5-fold jump in a half decade. During this period, there has been a roughly similar increase in government budgetary support to BPDB to enable the latter, a single buyer, to make timely payments to IPPs and rental electricity providers. To prevent a further large increase in electricity shortages, the government has contracted rapidly increasing capacities of very expensive rental power plants run on liquid fuel. The share of rental capacity in total installed generation capacity jumped from 1 percent in FY2008 to 26 percent in FY2013. These short-term plants have imposed a large additional financial burden on the electricity sector, which the government handles by subsidizing the gap between the bulk supply tariff that the distribution utilities pay to BPDB and the price the PBDB pays to generate and purchase electricity (IEG 2014a). In Senegal, in spite of sizable policy lending by the World Bank in the form of budgetary support, the electricity sector ended up facing a deepening financial crisis

7
from 2006 onwards, characterized by recurrent blackouts rising exponentially between 2006 and 2011, with unserved energy spiking to 250 MW (equivalent to 18 percent of consumption) and mounting needs for budgetary transfers to the sector (in 2008, about US$120 million, or 1 percent of GDP). In 2006, the national electricity company SENELEC’s financial loss deteriorated dramatically to US$70 million. Things got only worse in the subsequent years with the effect of higher oil prices and delayed investments, requiring significant amounts of budgetary transfers. In parallel, SENELEC’s leverage rose to alarming levels, with a debt-equity ratio of 86:14 by end-2011. By 2010, the company’s financial loss exceeded the US$100 million mark in spite of significant operating subsidies from the government. Essentially, the electricity sector has been caught in a steep downward spiral caused by the interaction of SENELEC’s increasingly poor finances and the sector’s underinvestment. It works like this: SENELEC’s undercapitalization and structural operating deficit (caused by insufficient tariffs and lagging budgetary transfers) perpetuates inefficiency by preventing the company from investing in required maintenance of aging assets and moving away from oil-based generation to improve cost structure in the long run. 18 And SENELEC’s difficult cash situation only makes matters worse by causing payment problems with suppliers, leading to delays in supplies of critical inputs, including fuel, and in payments to the private IPP thereby disrupting the functioning of the generating plants. The dire state of sector finances is also a disincentive to potential private partners in future IPP projects whose contribution is much needed to invest in more efficient, lower cost (e. g. , coal- or gas-based) generating plants without which the sector will continue to generate electricity at prohibitively high costs (IEG 2013b). In addition, considerable country-based anecdotal evidence points to the detrimental impact of poor financial performance on sector outcomes. The Dominican Republic exemplifies the close linkage between “financial blackouts” (i. e. , the generators’ inability to pay for fuel purchase due to the distributors’ insufficient and lagging payments for electricity) and power blackouts. In 2002-2004, the electricity sector fell into a financial chaos. Distribution was the most dysfunctional element of the electricity system. Poor quality of service, permanent customer dissatisfaction and relatively high tariffs induced large-scale theft through illegal connections and nonpayment of bills by businesses and households alike. The cash recovery index was down to 48 percent in 2004 - one of the lowest in the world.
18 In an attempt to limit load shedding but also due to insufficient scheduled maintenance of generation facilities, the planned investment program was grossly underachieved by SENELEC: for example, between 2009 and 2001, the execution rate fell from 58 percent to as low as 25 percent, which increased breakdown frequency and reduced the operating efficiency of the power plants. Transmission and distribution equipment suffered the same fate and now require disproportionately large rehabilitation investments (World Bank 2012).

8
The resulting generation shortfall led to blackouts of extreme proportions. From mid-2002, power cuts curtailed supplies by over 20 hours per day in vast areas of the country, particularly in poor neighborhoods. In 2004, unmet electricity demand rose to 25 percent. Short-term policy measures, supported by a World Bank programmatic loan, stabilized the electricity sector: no arrears were accumulated in the payment to generators in 2006-2007 as transfers from the government covered the losses of distributors, leading to better outcomes in service quality than in previous years. The blackouts were relatively flat during this period. However, arrears resurfaced in 2008 when exceptionally high oil prices pushed the sector’s financial deficit over the US$1. 2 billion mark and budget transfers became insufficient to pay generators in full. This resulted in the resumption of significant blackouts in mid-2008 and led to street violence (World Bank 2005; World Bank 2009). A similar case is presented by Senegal where recently a direct linkage could be observed between the electricity sector’s deepening financial crisis and rapidly growing electricity shortages in terms of undelivered energy. In tandem with the 14-fold increase in SENELEC’s financial losses between 2004 and 2010, the undelivered energy jumped 12. 5-fold during the same period (see Figure 1). The increasingly severe energy shortages can be traced to delays in needed generation investments, poor operational efficiency and fuel supply difficulties faced by generators primarily as a result of SENELEC’s downward financial spiral (IEG 2012a; IEG 2013b).
Figure 1. Senegal: Unserved Electricity Demand, 1999-2011
Source: World Bank 2012
In Bangladesh, amid worsening sector finances, the electricity deficit (peak demand minus maximum generation) widened from 1,439 MW in FY2008 to 1,949 MW in FY2013. In 2012, load shedding was equivalent to 12 percent of total installed generation capacity despite the extremely rapid growth in expensive short-term rental generation capacity (World Bank 2014). In India, the inefficient, financially loss-making distribution sector and inadequate, unreliable electricity supply have become major constraints to the country’s
0
50000
100000
150000
200000
250000
300000
1999 2000 2001 2002 2003 2004 2005 2006 2007 2008 2009 2010 2011
MWh
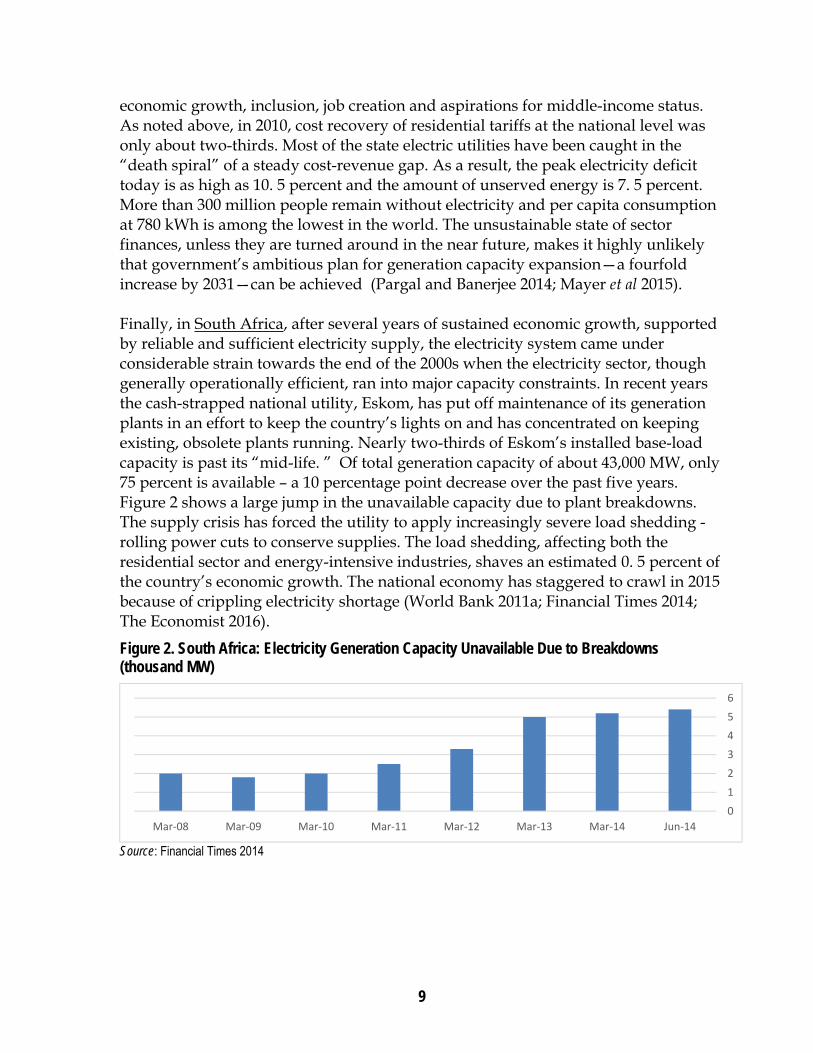
9
economic growth, inclusion, job creation and aspirations for middle-income status. As noted above, in 2010, cost recovery of residential tariffs at the national level was only about two-thirds. Most of the state electric utilities have been caught in the “death spiral” of a steady cost-revenue gap. As a result, the peak electricity deficit today is as high as 10. 5 percent and the amount of unserved energy is 7. 5 percent. More than 300 million people remain without electricity and per capita consumption at 780 kWh is among the lowest in the world. The unsustainable state of sector finances, unless they are turned around in the near future, makes it highly unlikely that government’s ambitious plan for generation capacity expansion—a fourfold increase by 2031—can be achieved (Pargal and Banerjee 2014; Mayer et al 2015). Finally, in South Africa, after several years of sustained economic growth, supported by reliable and sufficient electricity supply, the electricity system came under considerable strain towards the end of the 2000s when the electricity sector, though generally operationally efficient, ran into major capacity constraints. In recent years the cash-strapped national utility, Eskom, has put off maintenance of its generation plants in an effort to keep the country’s lights on and has concentrated on keeping existing, obsolete plants running. Nearly two-thirds of Eskom’s installed base-load capacity is past its “mid-life. ” Of total generation capacity of about 43,000 MW, only 75 percent is available – a 10 percentage point decrease over the past five years. Figure 2 shows a large jump in the unavailable capacity due to plant breakdowns. The supply crisis has forced the utility to apply increasingly severe load shedding - rolling power cuts to conserve supplies. The load shedding, affecting both the residential sector and energy-intensive industries, shaves an estimated 0. 5 percent of the country’s economic growth. The national economy has staggered to crawl in 2015 because of crippling electricity shortage (World Bank 2011a; Financial Times 2014; The Economist 2016).
Figure 2. South Africa: Electricity Generation Capacity Unavailable Due to Breakdowns (thousand MW)
Source: Financial Times 2014
0
1
2
3
4
5
6
Mar‐08 Mar‐09 Mar‐10 Mar‐11 Mar‐12 Mar‐13 Mar‐14 Jun‐14
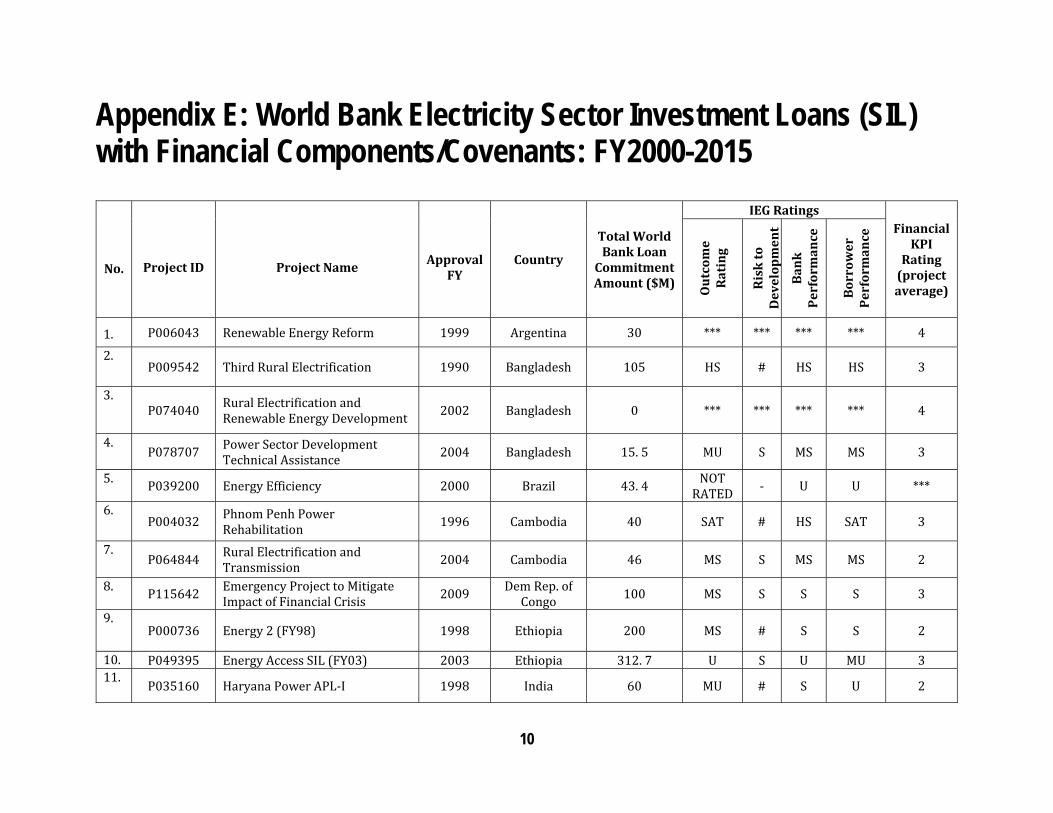
10
Appendix E: World Bank Electricity Sector Investment Loans (SIL) with Financial Components/Covenants: FY2000-2015
Project ID
Project Name
Approval
FY Country
Total World Bank Loan
Commitment Amount ($M)
IEG Ratings Financial
KPI Rating
(project average)
No.
Out
com
e Ra
ting
Risk
to
Dev
elo p
men
t
Bank
Pe
rfor
man
ce
Borr
ower
Pe
rfor
man
ce
1. P006043 Renewable Energy Reform 1999 Argentina 30 *** *** *** *** 4 2. P009542 Third Rural Electrification 1990 Bangladesh 105 HS # HS HS 3 3. P074040 Rural Electrification and Renewable Energy Development 2002 Bangladesh 0 *** *** *** *** 4 4. P078707 Power Sector Development Technical Assistance 2004 Bangladesh 15. 5 MU S MS MS 3 5. P039200 Energy Efficiency 2000 Brazil 43. 4 NOTRATED - U U *** 6. P004032 Phnom Penh Power Rehabilitation 1996 Cambodia 40 SAT # HS SAT 3 7. P064844 Rural Electrification and Transmission 2004 Cambodia 46 MS S MS MS 2 8. P115642 Emergency Project to Mitigate Impact of Financial Crisis 2009 Dem Rep. ofCongo 100 MS S S S 3 9. P000736 Energy 2 (FY98) 1998 Ethiopia 200 MS # S S 2 10. P049395 Energy Access SIL (FY03) 2003 Ethiopia 312. 7 U S U MU 3 11. P035160 Haryana Power APL-I 1998 India 60 MU # S U 2
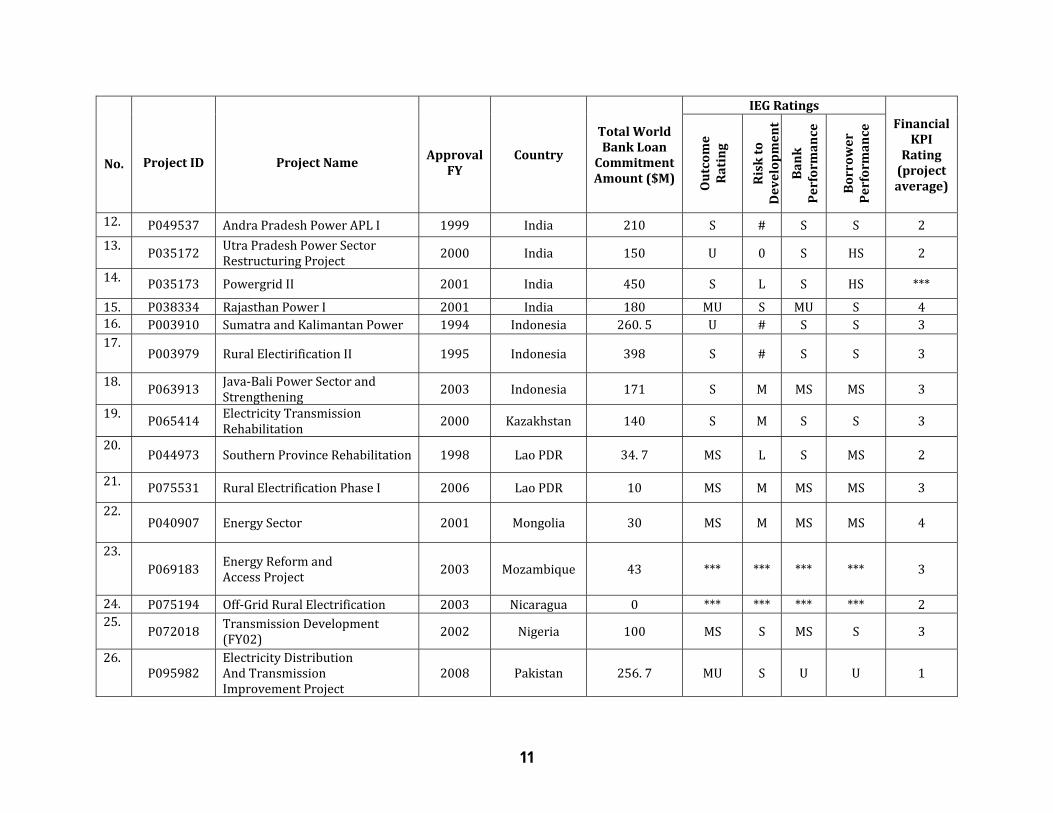
11
Project ID
Project Name
Approval
FY Country
Total World Bank Loan
Commitment Amount ($M)
IEG Ratings Financial
KPI Rating
(project average)
No.
Out
com
e Ra
ting
Risk
to
Dev
elo p
men
t
Bank
Pe
rfor
man
ce
Borr
ower
Pe
rfor
man
ce
12. P049537 Andra Pradesh Power APL I 1999 India 210 S # S S 2 13. P035172 Utra Pradesh Power SectorRestructuring Project 2000 India 150 U 0 S HS 2 14. P035173 Powergrid II 2001 India 450 S L S HS *** 15. P038334 Rajasthan Power I 2001 India 180 MU S MU S 416. P003910 Sumatra and Kalimantan Power 1994 Indonesia 260. 5 U # S S 3 17. P003979 Rural Electirification II 1995 Indonesia 398 S # S S 3 18. P063913 Java-Bali Power Sector andStrengthening 2003 Indonesia 171 S M MS MS 3 19. P065414 Electricity Transmission Rehabilitation 2000 Kazakhstan 140 S M S S 3 20. P044973 Southern Province Rehabilitation 1998 Lao PDR 34. 7 MS L S MS 2 21. P075531 Rural Electrification Phase I 2006 Lao PDR 10 MS M MS MS 3 22. P040907 Energy Sector 2001 Mongolia 30 MS M MS MS 4 23. P069183 Energy Reform and Access Project 2003 Mozambique 43 *** *** *** *** 3 24. P075194 Off-Grid Rural Electrification 2003 Nicaragua 0 *** *** *** *** 2 25. P072018 Transmission Development (FY02) 2002 Nigeria 100 MS S MS S 3 26. P095982 Electricity DistributionAnd Transmission Improvement Project 2008 Pakistan 256. 7 MU S U U 1
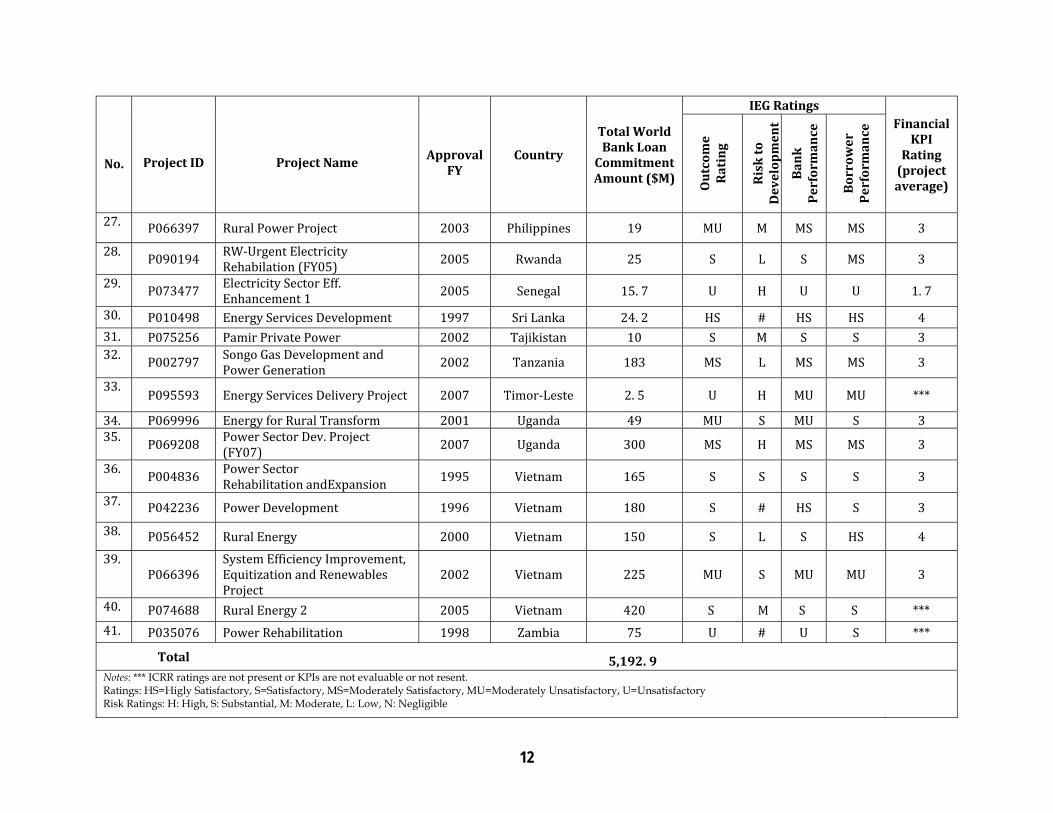
12
Project ID
Project Name
Approval
FY Country
Total World Bank Loan
Commitment Amount ($M)
IEG Ratings Financial
KPI Rating
(project average)
No.
Out
com
e Ra
ting
Risk
to
Dev
elo p
men
t
Bank
Pe
rfor
man
ce
Borr
ower
Pe
rfor
man
ce
27. P066397 Rural Power Project 2003 Philippines 19 MU M MS MS 3 28. P090194 RW-Urgent Electricity Rehabilation (FY05) 2005 Rwanda 25 S L S MS 3 29. P073477 Electricity Sector Eff. Enhancement 1 2005 Senegal 15. 7 U H U U 1. 7 30. P010498 Energy Services Development 1997 Sri Lanka 24. 2 HS # HS HS 4 31. P075256 Pamir Private Power 2002 Tajikistan 10 S M S S 3 32. P002797 Songo Gas Development andPower Generation 2002 Tanzania 183 MS L MS MS 3 33. P095593 Energy Services Delivery Project 2007 Timor-Leste 2. 5 U H MU MU *** 34. P069996 Energy for Rural Transform 2001 Uganda 49 MU S MU S 335. P069208 Power Sector Dev. Project (FY07) 2007 Uganda 300 MS H MS MS 3 36. P004836 Power Sector Rehabilitation andExpansion 1995 Vietnam 165 S S S S 3 37. P042236 Power Development 1996 Vietnam 180 S # HS S 3 38. P056452 Rural Energy 2000 Vietnam 150 S L S HS 4 39. P066396 System Efficiency Improvement, Equitization and Renewables Project 2002 Vietnam 225 MU S MU MU 3 40. P074688 Rural Energy 2 2005 Vietnam 420 S M S S *** 41. P035076 Power Rehabilitation 1998 Zambia 75 U # U S *** Total 5,192. 9 Notes: *** ICRR ratings are not present or KPIs are not evaluable or not resent. Ratings: HS=Higly Satisfactory, S=Satisfactory, MS=Moderately Satisfactory, MU=Moderately Unsatisfactory, U=Unsatisfactory Risk Ratings: H: High, S: Substantial, M: Moderate, L: Low, N: Negligible

13
Appendix F: Financial Key Performance Indicator (KPI) Ratings for World Bank Investment Projects
Country Income Category
Cost Reduction
Operational Performance Improvement
Overall Financial
Performance Improvement
Payment Collections Improveme
nt
Subsidy Reduction
T&D Loss Reduction
Tariff Increase
Overall Financial
Performance for All Projects
Projects Rated MS or Better
A B C A B C A B C A B C A B C A B C A B C A B C % Low 3 3 2 0 0 0 6 6 4 2 2 2 0 0 0 2 2 1 0 0 0 10 10 7 70% Lower Middle 2 2 1 1 1 1 19 16 10 8 6 4 1 1 0 6 5 4 10 10 5 27 23 15 65% Upper Middle 0 0 0 0 0 0 3 2 2 0 0 0 0 0 0 0 0 0 0 0 0 3 2 2 100% High 0 0 0 0 0 0 0 0 0 0 0 0 0 0 0 0 0 0 1 1 1 1 1 1 100%
Total No. Projects
5 5 3 1 1 1 28 24 16 10 8 6 1 1 0 8 7 5 11 11 6 41 36 25
% of Projects Rated MS or Better
60 % 100 % 67 % 75 % 0 % 55 % 69 %
A: No. of Projects with Financial Viability KPIs B: No. of Projects with KPIs rated C: No. of Projects with KPI rated Moderately Satisfactory or Better
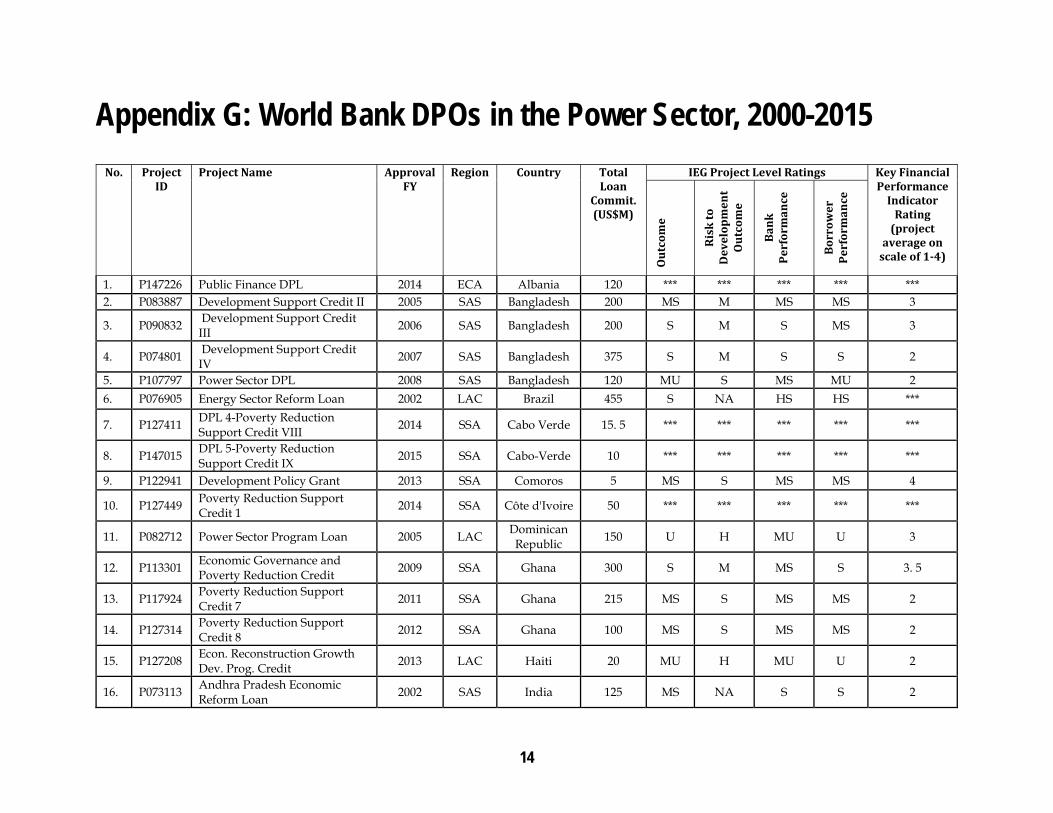
14
Appendix G: World Bank DPOs in the Power Sector, 2000-2015
No. Project ID
Project Name ApprovalFY
Region Country Total Loan
Commit. (US$M)
IEG Project Level Ratings Key Financial Performance
Indicator Rating
(project average on
scale of 1-4) Out
com
e
Risk
to
Dev
elop
men
t O
utco
me
Bank
Pe
rfor
man
ce
Borr
ower
Pe
rfor
man
ce
1. P147226 Public Finance DPL 2014 ECA Albania 120 *** *** *** *** *** 2. P083887 Development Support Credit II 2005 SAS Bangladesh 200 MS M MS MS 3 3. P090832
Development Support Credit III
2006 SAS Bangladesh 200 S M S MS 3
4. P074801 Development Support Credit IV
2007 SAS Bangladesh 375 S M S S 2 5. P107797 Power Sector DPL 2008 SAS Bangladesh 120 MU S MS MU 2 6. P076905 Energy Sector Reform Loan 2002 LAC Brazil 455 S NA HS HS ***
7. P127411 DPL 4-Poverty Reduction Support Credit VIII
2014 SSA Cabo Verde 15. 5 *** *** *** *** ***
8. P147015 DPL 5-Poverty Reduction Support Credit IX
2015 SSA Cabo-Verde 10 *** *** *** *** ***
9. P122941 Development Policy Grant 2013 SSA Comoros 5 MS S MS MS 4
10. P127449 Poverty Reduction Support Credit 1
2014 SSA Côte d'Ivoire 50 *** *** *** *** ***
11. P082712 Power Sector Program Loan 2005 LAC Dominican Republic
150 U H MU U 3
12. P113301 Economic Governance and Poverty Reduction Credit
2009 SSA Ghana 300 S M MS S 3. 5
13. P117924 Poverty Reduction Support Credit 7
2011 SSA Ghana 215 MS S MS MS 2
14. P127314 Poverty Reduction Support Credit 8
2012 SSA Ghana 100 MS S MS MS 2
15. P127208 Econ. Reconstruction Growth Dev. Prog. Credit
2013 LAC Haiti 20 MU H MU U 2
16. P073113 Andhra Pradesh Economic Reform Loan
2002 SAS India 125 MS NA S S 2
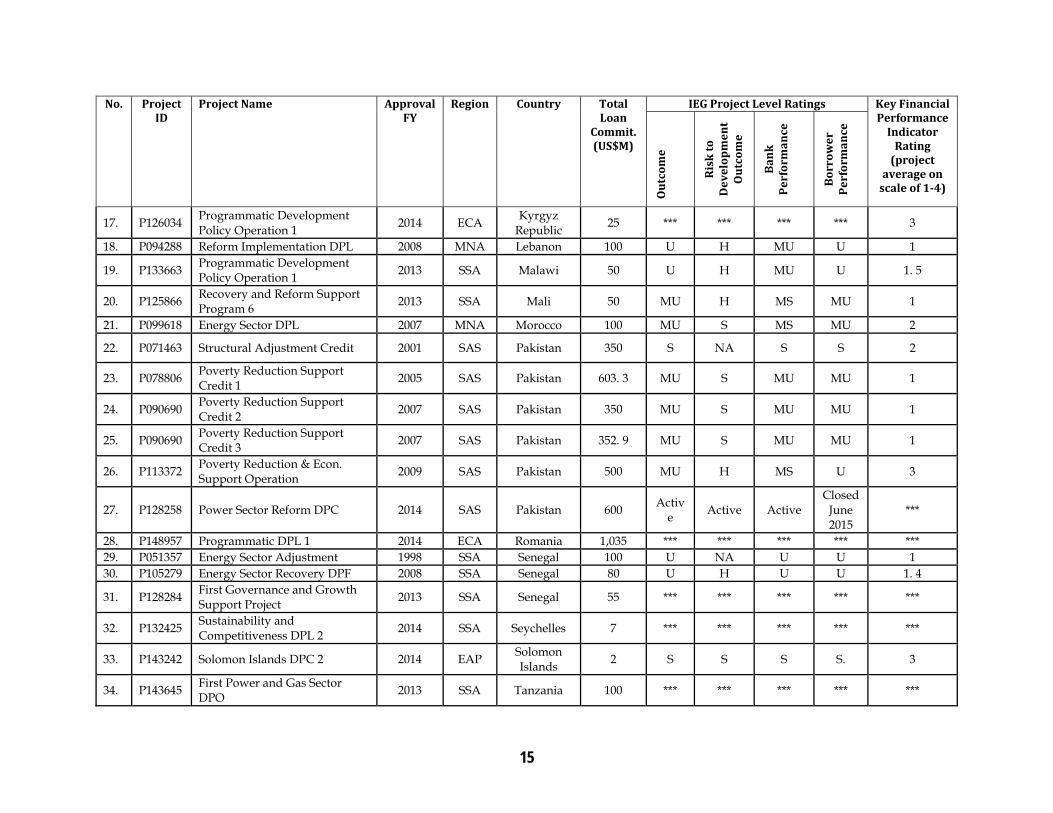
15
No. Project ID
Project Name ApprovalFY
Region Country Total Loan
Commit. (US$M)
IEG Project Level Ratings Key Financial Performance
Indicator Rating
(project average on
scale of 1-4) Out
com
e
Risk
to
Dev
elop
men
t O
utco
me
Bank
Pe
rfor
man
ce
Borr
ower
Pe
rfor
man
ce
17. P126034 Programmatic Development Policy Operation 1
2014 ECA Kyrgyz
Republic 25 *** *** *** *** 3
18. P094288 Reform Implementation DPL 2008 MNA Lebanon 100 U H MU U 1
19. P133663 Programmatic Development Policy Operation 1
2013 SSA Malawi 50 U H MU U 1. 5
20. P125866 Recovery and Reform Support Program 6
2013 SSA Mali 50 MU H MS MU 1
21. P099618 Energy Sector DPL 2007 MNA Morocco 100 MU S MS MU 2
22. P071463 Structural Adjustment Credit 2001 SAS Pakistan 350 S NA S S 2
23. P078806 Poverty Reduction Support Credit 1
2005 SAS Pakistan 603. 3 MU S MU MU 1
24. P090690 Poverty Reduction Support Credit 2
2007 SAS Pakistan 350 MU S MU MU 1
25. P090690 Poverty Reduction Support Credit 3
2007 SAS Pakistan 352. 9 MU S MU MU 1
26. P113372 Poverty Reduction & Econ. Support Operation
2009 SAS Pakistan 500 MU H MS U 3
27. P128258 Power Sector Reform DPC 2014 SAS Pakistan 600 Activ
e Active Active
Closed June 2015
***
28. P148957 Programmatic DPL 1 2014 ECA Romania 1,035 *** *** *** *** *** 29. P051357 Energy Sector Adjustment 1998 SSA Senegal 100 U NA U U 1 30. P105279 Energy Sector Recovery DPF 2008 SSA Senegal 80 U H U U 1. 4
31. P128284 First Governance and Growth Support Project
2013 SSA Senegal 55 *** *** *** *** ***
32. P132425 Sustainability and Competitiveness DPL 2
2014 SSA Seychelles 7 *** *** *** *** ***
33. P143242 Solomon Islands DPC 2 2014 EAP Solomon Islands
2 S S S S. 3
34. P143645 First Power and Gas Sector DPO
2013 SSA Tanzania 100 *** *** *** *** ***
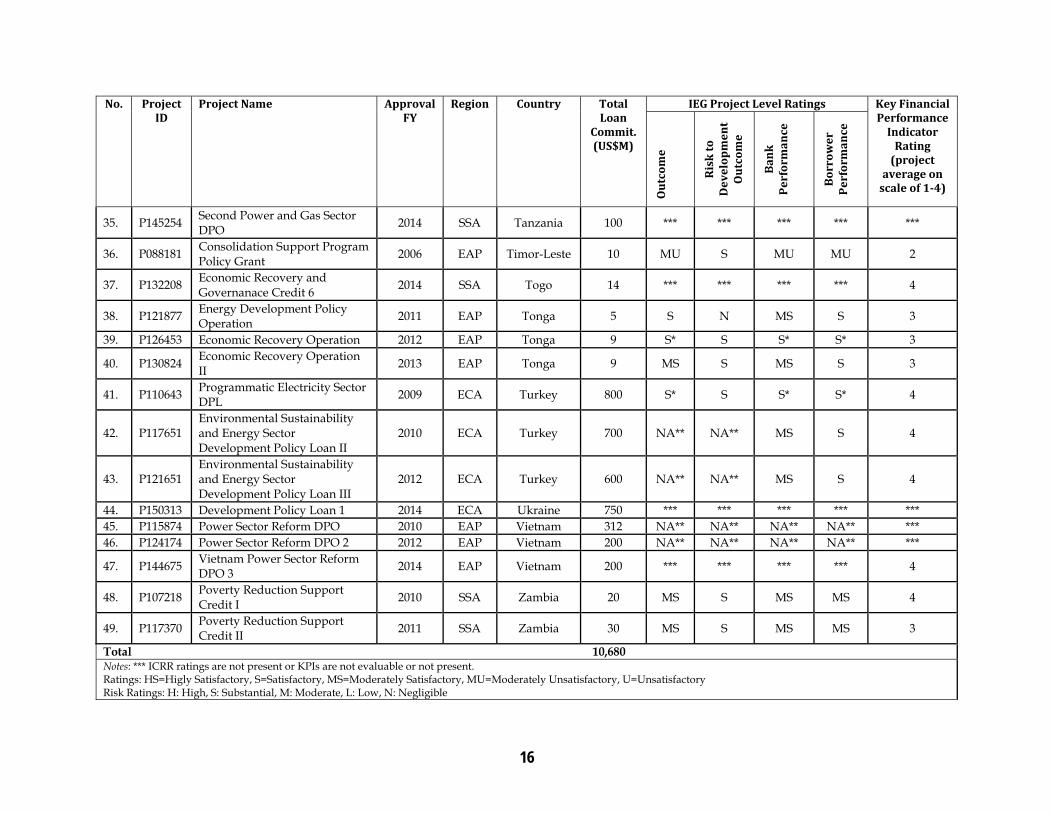
16
No. Project ID
Project Name ApprovalFY
Region Country Total Loan
Commit. (US$M)
IEG Project Level Ratings Key Financial Performance
Indicator Rating
(project average on
scale of 1-4) Out
com
e
Risk
to
Dev
elop
men
t O
utco
me
Bank
Pe
rfor
man
ce
Borr
ower
Pe
rfor
man
ce
35. P145254 Second Power and Gas Sector DPO
2014 SSA Tanzania 100 *** *** *** *** ***
36. P088181 Consolidation Support Program Policy Grant
2006 EAP Timor-Leste 10 MU S MU MU 2
37. P132208 Economic Recovery and Governanace Credit 6
2014 SSA Togo 14 *** *** *** *** 4
38. P121877 Energy Development Policy Operation
2011 EAP Tonga 5 S N MS S 3
39. P126453 Economic Recovery Operation 2012 EAP Tonga 9 S* S S* S* 3
40. P130824 Economic Recovery Operation II
2013 EAP Tonga 9 MS S MS S 3
41. P110643 Programmatic Electricity Sector DPL
2009 ECA Turkey 800 S* S S* S* 4
42. P117651 Environmental Sustainability and Energy Sector Development Policy Loan II
2010 ECA Turkey 700 NA** NA** MS S 4
43. P121651 Environmental Sustainability and Energy Sector Development Policy Loan III
2012 ECA Turkey 600 NA** NA** MS S 4
44. P150313 Development Policy Loan 1 2014 ECA Ukraine 750 *** *** *** *** *** 45. P115874 Power Sector Reform DPO 2010 EAP Vietnam 312 NA** NA** NA** NA** *** 46. P124174 Power Sector Reform DPO 2 2012 EAP Vietnam 200 NA** NA** NA** NA** *** 47. P144675
Vietnam Power Sector Reform DPO 3
2014 EAP Vietnam 200 *** *** *** *** 4
48. P107218 Poverty Reduction Support Credit I
2010 SSA Zambia 20 MS S MS MS 4
49. P117370 Poverty Reduction Support Credit II
2011 SSA Zambia 30 MS S MS MS 3 Total 10,680 Notes: *** ICRR ratings are not present or KPIs are not evaluable or not present. Ratings: HS=Higly Satisfactory, S=Satisfactory, MS=Moderately Satisfactory, MU=Moderately Unsatisfactory, U=Unsatisfactory Risk Ratings: H: High, S: Substantial, M: Moderate, L: Low, N: Negligible
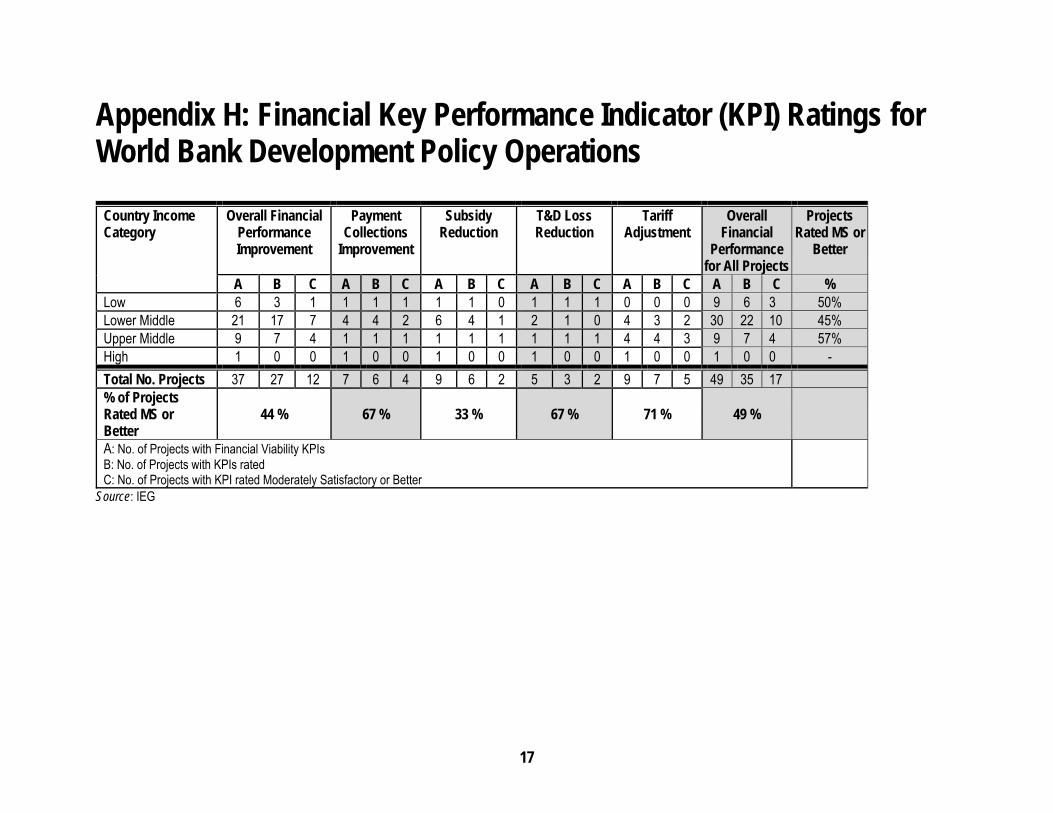
17
Appendix H: Financial Key Performance Indicator (KPI) Ratings for World Bank Development Policy Operations
Country Income Category
Overall Financial Performance Improvement
Payment Collections
Improvement
Subsidy Reduction
T&D Loss Reduction
Tariff Adjustment
Overall Financial
Performance for All Projects
Projects Rated MS or
Better
A B C A B C A B C A B C A B C A B C % Low 6 3 1 1 1 1 1 1 0 1 1 1 0 0 0 9 6 3 50% Lower Middle 21 17 7 4 4 2 6 4 1 2 1 0 4 3 2 30 22 10 45% Upper Middle 9 7 4 1 1 1 1 1 1 1 1 1 4 4 3 9 7 4 57% High 1 0 0 1 0 0 1 0 0 1 0 0 1 0 0 1 0 0 -
Total No. Projects 37 27 12 7 6 4 9 6 2 5 3 2 9 7 5 49 35 17 % of Projects Rated MS or Better
44 % 67 % 33 % 67 % 71 % 49 %
A: No. of Projects with Financial Viability KPIs B: No. of Projects with KPIs rated C: No. of Projects with KPI rated Moderately Satisfactory or Better
Source: IEG