learning to breathe and sing: development of respiratory ... · learning to breathe and sing:...
TRANSCRIPT

Learning to breathe and sing: development of respiratory-vocal coordinationin young songbirds
Lena Veit, Dmitriy Aronov, and Michale S. FeeMcGovern Institute for Brain Research, Department of Brain and Cognitive Sciences, Massachusetts Institute of Technology,Cambridge, Massachusetts
Submitted 24 March 2011; accepted in final form 19 June 2011
Veit L, Aronov D, Fee MS. Learning to breathe and sing: devel-opment of respiratory-vocal coordination in young songbirds. J Neu-rophysiol 106: 1747–1765, 2011. First published June 22, 2011;doi:10.1152/jn.00247.2011.—How do animals with learned vocaliza-tions coordinate vocal production with respiration? Songbirds such asthe zebra finch learn their songs, beginning with highly variablebabbling vocalizations known as subsong. After several weeks ofpractice, zebra finches are able to produce a precisely timed pattern ofsyllables and silences, precisely coordinated with expiratory andinspiratory pulses (Franz M, Goller F. J Neurobiol 51: 129–141,2002). While respiration in adult song is well described, relativelylittle is known about respiratory patterns in subsong or about theprocesses by which respiratory and vocal patterns become coordi-nated. To address these questions, we recorded thoracic air sacpressure in juvenile zebra finches prior to the appearance of anyconsistent temporal or acoustic structure in their songs. We found thatsubsong contains brief inspiratory pulses (50 ms) alternating withlonger pulses of sustained expiratory pressure (50–500 ms). In strik-ing contrast to adult song, expiratory pulses often contained multiple(0–8) variably timed syllables separated by expiratory gaps and wereonly partially vocalized. During development, expiratory pulses be-came shorter and more stereotyped in duration with shorter and fewernonvocalized parts. These developmental changes eventually resultedin the production of a single syllable per expiratory pulse and a singleinspiratory pulse filling each gap, forming a coordinated sequencesimilar to that of adult song. To examine the role of forebrainsong-control nuclei in the development of respiratory patterns, weperformed pressure recordings before and after lesions of nucleusHVC (proper name) and found that this manipulation reverses thedevelopmental trends in measures of the respiratory pattern.
HVC; motor development; respiration; zebra finch
IN HUMANS AND SONGBIRDS, successful vocalization requires theprecise coordination of respiratory and vocal motor systems(Levelt 1993; Riede and Goller 2010). How does this coordi-nation develop, and what is the involvement of the forebrain inthis process? The songbird is a unique model to study these andother aspects of vocal communication (Doupe and Kuhl 1999;Fee and Scharff 2010). The earliest babbling vocalizations ofjuvenile birds, called subsong, exhibit highly variable timingand acoustic fluctuations (Marler and Peters 1982; Marler1991). In a later stage called plastic song, vocalizations acquirestereotyped temporal and acoustic structure (Tchernichovski etal. 2001, 2004). With continued practice, songbirds ultimatelylearn a precisely timed, stereotyped song that can be a closecopy of the adult song (Immelmann 1969; Marler and Peters1977; Price 1979).
The neural systems that control the production and learningof song have been well described. A key brain area for songproduction is nucleus HVC (used as a proper name) (Notte-bohm et al. 1976; Vu et al. 1994), which is involved in thecontrol of stereotyped timing in adult song (Hahnloser et al.2002; Long and Fee 2008; Long et al. 2010; Schmidt 2003; Yuand Margoliash 1996). In contrast, lesion studies have shownthat HVC is not required for the normal production of subsongsyllables (Aronov et al. 2008). The anatomy of brain systemsinvolved in the control of respiration is also well described inbirds (Kubke et al. 2005; Reinke and Wild 1998; Wild 1993a,1993b; Wild et al. 1998) and shows parallels to similar nucleiin mammals (Hage and Stefan 2009; Wild 1997).
A great deal is now known about respiratory patterning inadult song (Riede and Goller 2010). Respiration during singingis highly dynamic and includes rapid alternation betweenperiods of strong expiratory and inspiratory pressure pulses(EPs and IPs, respectively) (Brackenbury 1980; Hartley andSuthers 1989; Hartley 1990; Wild et al. 1998). EPs are usuallycompletely filled by a single syllable, and the silent gapsbetween syllables are completely filled with an IP, or “mini-breath,” resulting in a precise one-to-one coordination of EPsand IPs with syllables and gaps (Franz and Goller 2002).However, less is known about respiratory patterns duringsubsong. Recordings in juvenile cardinals have revealed thatrespiratory pressure and syringeal airflow are poorly synchro-nized with phonation, including periods of nonvocalized expi-ratory flow and multiple syllables within a single EP (Suthersand Goller 1998; Suthers 1999, 2004). Here we set out toquantitatively describe the nature of respiratory patterns insubsong and early plastic song in the zebra finch. We addressthree main issues: 1) How well are respiratory and vocalpatterns coordinated? 2) How does this coordination develop asthe bird progresses from subsong into plastic song? 3) Is thesong motor pathway involved in these early developmentalchanges? To address these questions, we recorded thoracic airsac pressure in young juvenile zebra finches, quantified thedeveloping relation between vocal and respiratory patterning,and carried out lesions of HVC to determine which aspects ofthis behavior involve this key forebrain nucleus.
MATERIALS AND METHODS
Animal care and experiments were carried out in accordance withNational Institutes of Health guidelines and were reviewed andapproved by the Massachusetts Institute of Technology (MIT) Insti-tutional Animal Care and Use Committee. Subjects were juvenilemale zebra finches obtained from the MIT breeding facility. Birdswere raised by their parents in individual breeding cages, during
Address for reprint requests and other correspondence: M. S. Fee, MIT, 46-5133, 77 Massachusetts Ave., Cambridge, MA 02139.
J Neurophysiol 106: 1747–1765, 2011.First published June 22, 2011; doi:10.1152/jn.00247.2011.
17470022-3077/11 Copyright © 2011 the American Physiological Societywww.jn.org
by 10.220.33.6 on February 12, 2017
http://jn.physiology.org/D
ownloaded from

which time the birds were presumably tutored by their father. Malejuveniles were moved at age 31–33 dph to custom sound isolationchambers (maintained on a 12:12-h day-night schedule). After thebirds began to sing, typically within a few days, a pressure sensor wassurgically implanted. Birds typically began to sing again 1–2 daysafter surgery. Because our experiments were carried out in very youngbirds before any song imitation was learned, the song or the pressurepattern of the tutor was not recorded.
Pressure Recordings
To monitor the breathing pattern during subsong and early plasticsong, pressure sensors were implanted and chronically carried by thebirds, by a method similar to that previously described for adult birds(Franz and Goller 2002; Hartley and Suthers 1989). Before surgerythe animals were anesthetized with 1–2% isoflurane in oxygen. A thin,flexible cannula of nonbioreactive Silastic tubing (0.9-mm OD, Re-naSil, Braintree Scientific, Braintree, MA) was inserted through theabdominal wall into the posterior thoracic air sac on one side of thebody. This tube was passed between the most posterior two ribs(1.5-mm intercostal spacing) and was sutured to one rib. Beforesurgery, the end of this tubing to be placed in the air sac was insertedinto and attached to (with a nonbioreactive silicone elastomer, Kwik-Kast, WPI) a short length (5 mm) of a larger diameter tube (2-mmOD) that was fully inserted into the air sac and helped maintain a clearinternal opening of the tubing. The other end of the 0.9-mm tube wasfed to a miniature piezoresistive pressure transducer (Fujikura FPM-02PG). The transducer was placed externally on the bird’s back andheld in place by a loop of thin silicone tube under the skin on thebird’s back. The pressure signal was amplified directly on the deviceand transmitted to the recording computer by a custom-made cableand mercury commutator, which allowed free movement of the birdinside the cage. Before implantation, the pressure sensor’s outputvoltage was calibrated in units of centimeters of water (cmH2O) witha water column.
Sound Recordings
Vocalizations were recorded with a miniature microphone (KnowlesElectronics, Itasca, IL) that was mounted on the same cable used forpressure recordings, close to the bird’s head. The birds were constantlymonitored by custom-written software, which triggered simultaneoussound and pressure recordings at the onset of song. Recordings weredigitized at 40 kHz. For the analysis of high-frequency inspiratorysounds, we additionally used high-sensitivity microphones (model 40AE,G.R.A.S. Sound and Vibration, Holte, Denmark), positioned above thebird’s cage, recorded with Sound Analysis Pro software (Tchernichovskiet al. 2000).
HVC Lesions
In some animals (n � 7) HVC lesions were performed in a secondsurgery at ages 46–66 dph, after enough developmental data had beenrecorded. Before surgery, birds were anesthetized with 1–2% isoflu-rane in oxygen and placed in a stereotaxic apparatus. Craniotomieswere made bilaterally above HVC. Lesions were made with a plati-num-iridium electrode (Micro Probe; 100-�A current for 60 s). Atwo-dimensional lattice of 13 lesions spaced at 250 �m was made ineach hemisphere for complete bilateral lesions (Aronov et al. 2008).Birds were returned to isolation chambers, and vocalizations resumedtypically 1–2 days after the surgery. After the experiment, animalswere deeply anesthetized and perfused with phosphate-buffered saline(PBS) followed by 3–4% paraformaldehyde. The brain was extractedand sliced parasagittally for histological confirmation of the lesions.
Data Analysis
All analyses were performed with custom-written software inMatlab.
Sound segmentation, analysis of amplitudes and transition times.Sound recordings were inspected manually to remove calls and cagenoise. Song syllables were segmented and characterized based onsound between 1 and 4 kHz as follows: In each recorded sound file,the sound level was determined by band-pass filtering the microphonesignal between 1 and 4 kHz (order-80 linear-phase FIR filter createdwith Matlab function fir1), squaring, and smoothing with a 2.5-mssliding window. Sound level was converted to units of decibels bycomputing the logarithm (base 10), multiplying by 10, and normaliz-ing with reference to a calibrated source placed in the recording cage(with a Brüel & Kjaer model 2236 calibrated microphone). The resultwas expressed in units of decibels sound pressure level (dBSPL) and isreferred to in the text and figures as song or syllable “amplitude.”
Song amplitude in the 1–4 kHz band during singing was bimodallydistributed, corresponding to syllables and gaps (see Fig. 4). Meansand SDs of these two modes were estimated by fitting a mixture oftwo Gaussians to the amplitude distribution with expectation maxi-mization (EM). To segment sound into syllables and gaps, we thendefined an “upper threshold” as the Fisher discriminant of the twoidentified Gaussian modes and a “lower threshold” as 2 SDs above themean of all values below the upper threshold. Candidate syllableonsets were defined as upward crossings of the lower threshold thatwere followed by an upward crossing of the upper threshold. Simi-larly, candidate syllable offsets were defined as downward crossingsof the lower threshold that were preceded by a downward crossing ofthe upper threshold. Candidate syllables shorter than 7 ms wereeliminated, and the surrounding gaps were merged. Similarly, candi-date gaps shorter than 7 ms were eliminated and the surroundingsyllables merged.
To calculate the rate of change of amplitude at syllable onsets andoffsets (see Fig. 4), 100 syllables from each recording day wereselected randomly, and the average of the onset- and offset-alignedamplitude traces were calculated. Since we are particularly interestedin respiratory-vocal coordination, it was especially important to dem-onstrate the robustness of our identification of onsets and offsets ofthose syllables near the onsets and offsets of EPs. For this reason, theonset rate analysis (see Fig. 4C, left) was done by analyzing only firstsyllables in an EP, and the offset rate analysis (see Fig. 4C, right) wasdone by analyzing only last syllables in an EP. The slope of the onsettrace (in dB/ms) was then calculated in a 2-ms window after syllableonset, and the slope of the offset trace was calculated in a 2-mswindow before syllable offset. Similar results were obtained forsyllable offsets and onsets within the interior of EPs.
Song bouts were defined as sequences of consecutive syllables withno silences longer than 300 ms. All analyses were carried out on thesegments of time between the beginning of the first vocalized EP tothe end of the last vocalized EP in each song bout. Note that songbouts often begin or end with nonvocalized EPs. Thus the histogramin Fig. 5B represents an underestimate of the occurrence of entirelynonvocalized EPs because it does not include nonvocalized EPs thatoccur before the first syllable or after the last syllable of a bout.
High-frequency inspiratory sounds (HFIS) were detected withingaps by filtering the microphone signal between 5 and 19.5 kHz,squaring and smoothing with a 2.5-ms sliding window, and calculat-ing the sound level in decibels. HFIS onsets and offsets were detectedas threshold crossings of this signal �5 dB above baseline.
The position and width of the two peaks of the bimodal pressuredistributions were determined from the fit of a sum of two Gauss-ians to the pressure distribution. The central minimum was foundas the minimum of the distribution between the two peaks. Allprobability densities (e.g., Fig. 1, B–G, Fig. 2, B–D) have units thatare the inverse of the quantities expressed on the x-axis. Thedistributions are first calculated as probability per bin and then
1748 RESPIRATORY PATTERNING IN SUBSONG
J Neurophysiol • VOL 106 • OCTOBER 2011 • www.jn.org
by 10.220.33.6 on February 12, 2017
http://jn.physiology.org/D
ownloaded from

divided by bin size. Thus pressure distributions (e.g., Fig. 1B andC) have units of [cmH2O]�1.
The “peakiness” of the EP distribution was calculated by fitting theEP distribution to an asymmetric Gaussian distribution. A function ofthe form
P��� � ��e�� � � �
� �2
was found to fit the distribution of subsong EP durations well, whereP is the probability per unit time of finding an EP of duration �, and� and � are free parameters specifying the amplitude and width of thedistribution, respectively. As EP distributions develop narrow peaksduring early plastic song, this simple function fails to fit the distribu-tion. Thus the squared fitting error of this function is used as ameasure of the peakiness of the EP distribution. The fitting wascarried out with the Matlab curve fitting toolbox.
The protosyllable-containing EP (PSEP) distributions show theduration of all EPs that carry at least one syllable within a 10-mswindow around the protosyllable duration. The peaks of this distri-bution were determined by smoothing with a 50-ms full-width Gauss-ian window and fitting three Gaussians to the distribution.
Definition of subsong. Syllable durations were initially analyzed byfitting an exponential function to their duration distribution withmaximum-likelihood estimation (MLE). On a finite interval (a, b),maximum-likelihood analysis yields the equation
�Si�a�Si�b � � ' �a ��b � a�e��b�a�⁄�'
1 � e��b�a�⁄�'
Here the left side of the equation indicates the mean of all syllableswith durations si between a and b, and �= is a time constant of theexponential distribution that has the maximal probability of producingthe observed data. We used the Matlab zero-finding algorithm (fzerofunction) to solve the above equation for �=.
Because syllable duration distributions in subsong were consis-tently exponential above 25 ms, we used the MLE procedure to fitexponential distributions to syllable durations between a � 25 ms andb � 400 ms. This analysis was carried out on song data collectedduring 1 day of singing (1–10 thousand syllables). The goodness of fitof the exponential was estimated with the Lilliefors statistic (Lilliefors1969), a procedure similar to the Kolmogorov-Smirnov test (butsuitable for evaluating fits). This involves calculating the maximumdifference between the cumulative density functions of the datadistribution and the best exponential fit and then normalizing thisdifference by the square root of the number of syllables. Distributionsthat were well-fit by exponentials typically had a goodness-of-fitmetric �2, whereas distributions that were just beginning to exhibit aprotosyllable peak typically had values �2. We therefore used 2 as thethreshold for distinguishing subsong from plastic song.
It has been shown (Aronov et al., 2010) that the distribution ofsyllable durations is well-fit by an exponential distribution in youngbirds. With the transition to early plastic song and the development ofa consistently timed “protosyllable” (Liu et al. 2004; Tchernichovskiet al. 2004; Aronov et al., 2010) the syllable distribution develops apeak at the durations of the protosyllable, and the maximum deviationfrom the cumulative distribution function of the best-fit exponentialdistribution (Lilliefors goodness-of-fit statistic) shows a sudden in-crease. The precise age at which birds reach this point in theirdevelopment differs among birds, so we chose to align birds based ontheir relative song maturity to compare their developmental progres-sion in this study. The first day that crossed our limit for nonexpo-nentiality, and therefore showed development of a protosyllable, wasdesignated as relative age 0. All recording days were then alignedrelative to age 0 for developmental population analysis. We quantifiedthe features of early vocalizations in three groups of different devel-opmental stages: subsong (ages �7 to �2), early plastic song (ages 2to 4), and late plastic song (ages 8 to 25). We allowed a 3-day gap
between subsong and early plastic song (ages �1, 0, and 1) to moreclearly highlight the population differences between these age groups.The values of the parameters for these different developmental stageswere obtained by first calculating an average for each bird and thencalculating the mean and SE across all birds that were recorded inthe respective age bracket. The daily change was calculated fromage �8 to 2. If a bird was not recorded continuously in this period,we divided the change between the recorded data points by thenumber of days separating them to get an estimate of the dailychange. In two birds the pressure signal deteriorated after �1 day,presumably because of fluid that entered the tube. These birds wereexcluded from the analysis of daily change.
RESULTS
Characterization of Respiratory Patterns
We recorded thoracic air sac pressure in juvenile zebrafinches (n � 14) during subsong and plastic song stages (ages38–78 dph). To compare some aspects of the juvenile behaviorto adult song, thoracic air sac pressure was recorded in adultbirds as well (n � 5). During nonsinging periods, air sacpressure in subsong birds showed characteristic rhythmic eup-neic (quiet) breathing at roughly 3 Hz (range: 1.5–3.5 Hz; Fig. 1,A and B). During subsong production, respiratory patterns hada larger amplitude and exhibited a bimodal distribution ofpressures (Fig. 1C; the central minimum of the distribution was65.2 � 3.2% of the smaller negative peak), similar to thatobserved in adult song (Fig. 2, A and B). The positive peakduring subsong was at a pressure 9.5 � 2.0 times higher thanthat during quiet respiration. The negative peak during singingwas at a pressure 3.1 � 0.6 times higher in magnitude thanduring quiet respiration.
What are the timescales of the inspiratory and expiratorycomponents of early vocal behavior? While periods of pos-itive (expiratory) pressure alternated with periods of nega-tive (inspiratory) pressure in a highly irregular way duringsubsong, a number of regularities were noted. Inspiratorypulses (IPs) were usually characterized by a single negativedeflection of pressure (Fig. 1A), similar to those observed inthe minibreaths of adult song. IPs in subsong had an averageduration of 49.3 � 3.2 ms (n � 8 subsong birds), signifi-cantly longer than IPs in adult song (Fig. 2C, Table 1; P �0.01), and the distribution of IP durations within subsongbirds had an average width of 22.2 � 1.8 ms (SD) (Fig. 1,D and E; 10 –90% range of IP durations from 22.1 � 1.6 to77.8.0 � 5.7 ms).
In contrast to IPs, expiratory pulses (EPs) were longer (averageduration 188.7 � 8.2 ms) and had more complex pressurewaveforms, often exhibiting multiple peaks within a single EP,as observed in adult song. However, subsong EP waveformswere highly variable (Fig. 1A), with no evidence of the stereo-typed pressure patterns previously described for individualadult song syllables (e.g., Fig. 2A). Subsong EP durations werebroadly distributed (Fig. 1, F and G; 115.8 ms SD, 10–90%range of durations from 65.8 � 4.1 ms to 340.1 � 20.6 ms),without the narrow peaks characteristic of EP duration distri-butions in adult birds (Fig. 2D).
Vocal signals During Expiratory and Inspiratory Pressures
We were interested in how the respiratory pressure relates tothe sounds that are produced during subsong. Vocal signals were
1749RESPIRATORY PATTERNING IN SUBSONG
J Neurophysiol • VOL 106 • OCTOBER 2011 • www.jn.org
by 10.220.33.6 on February 12, 2017
http://jn.physiology.org/D
ownloaded from

observed over a wide range of respiratory pressures (Fig. 3A). Tocharacterize the relation between respiratory pressure and soundproduced, we first examined average acoustic power (in a 0.5–15kHz band) of the song signal at different air sac pressure levels
(Fig. 3B). The acoustic signal had high power primarily at positiveair sac pressure levels, a minimum of average sound powerproduced at ambient pressures, and a smaller peak of power atlarge negative pressures.
Fig. 1. Respiratory patterns in subsong. A: song spectrogram (top) showing a bout of singing in a young zebra finch (bird 1, 47 dph) and recording of thoracicair sac pressure during subsong (bottom). Note the shallow regular eupneic breathing before and after the song bout and the high-intensity inspiratory andexpiratory periods during singing. The pressure pattern during singing is divided into inspiratory pressure pulses (IPs, blue shading) and expiratory pressure pulses(EPs, pink shading). B: distribution of air sac pressure values during nonsinging. Expiratory and inspiratory peaks were, on average, located at �1.5 � 0.3 cmH2Oand �1.4 � 0.2 cmH2O, respectively. C: distribution of pressure values during singing. On average, expiratory and inspiratory peaks were located at 14.3 �1.1 cmH2O and �4.4 � 0.5 cmH2O, respectively, and the central minimum was located at 1.4 � 0.9 cmH2O (not significantly different from ambient pressure). Thebimodal pressure distributions during singing suggest the presence of distinct inspiratory and expiratory phases. D: distribution of IP durations from 1 bird, showing astereotyped duration around 50 ms. E: IP duration distributions from all subsong birds on a semilogarithmic plot. F: distribution of EP durations from 1 bird, showinga much broader distribution centered around 100 ms. G: EP duration distributions from all subsong birds (semilog plot). Data in A–D and F are from bird 1, 47 dph.
Fig. 2. Respiratory parameters in adult song. A: songspectrogram (top) showing 2 motifs of singing in an adultzebra finch and recording of thoracic air sac pressureduring singing (bottom). B: distribution of air sac pres-sure values during singing. As for subsong, the distribu-tion is bimodal for expiratory and inspiratory pressures,but the positive peak exhibits multiple small peaks pos-sibly associated with different syllables. C: distributionof IP durations during singing for the same bird. Notethat the time axis is different from Fig. 1D. D: distribu-tion of EP durations during singing for the same bird.There are distinct peaks corresponding to the differentsyllables. All examples in this figure are from adult 1.
1750 RESPIRATORY PATTERNING IN SUBSONG
J Neurophysiol • VOL 106 • OCTOBER 2011 • www.jn.org
by 10.220.33.6 on February 12, 2017
http://jn.physiology.org/D
ownloaded from

Tab
le1.
Ove
rvie
wof
all
quan
tifie
dpa
ram
eter
sat
diff
eren
tag
esan
daf
ter
HV
Cle
sion
HV
CL
esio
n(n
�7)
Subs
ong
(rel
ativ
eag
e�
7to
�2)
(n�
8)
Ear
lyPl
astic
(rel
ativ
eag
e2
to4)
(n�
8)
Lat
ePl
astic
(rel
ativ
eag
e8
to25
)(n
�6)
Adu
lt(n
�5)
%D
aily
Cha
nge
Subs
ong
vs.
Ear
lyPl
astic
Song
EP
dur,
ms
213.
9�
22.8
188.
7�
8.2
141.
8�
12.8
(*S)
125.
9�
4.8
134.
6�
19�
6.1
�1.
1(*
)P
<0.
01IP
dur,
ms
65.3
�7.
149
.3�
3.2
39.9
�2.
4(*
S)36
.3�
1.5
26.6
�1.
0(*
L)
�2.
3�
1.1
(*)
P<
0.05
IPra
te,
Hz
3.8
�0.
34.
1�
0.2
5.7
�0.
4(*
S)6.
2�
0.2
6.6
�0.
66.
8�
1.3
(*)
P<
0.01
Max
.pr
essu
re,
cmH
2O
25.4
�4.
027
.0�
3.4
32.1
�1.
733
.4�
3.2
37.8
�2.
76.
1�
1.5
(*)
P�
0.15
Min
.pr
essu
re,
cmH
2O
�12
.2�
2.6
�18
.3�
2.0
�16
.1�
1.4
�12
.7�
0.9
�14
.1�
0.9
�0.
8�
1.2
P�
0.39
Sylla
ble
amp,
dBS
PL
69.3
�1.
171
.1�
1.0
72.7
�1.
275
.1�
1.6
81.5
�0.
6(*
L)
�0.
8�
0.5
P�
0.30
Syll.
onse
tsp
eed,
dB/m
s6.
4�
0.6
6.2
�0.
36.
6�
0.4
6.3
�0.
37.
0�
0.8
2.1
�2.
5P
�0.
38Sy
ll.of
fset
spee
d,dB
/ms
3.0
�0.
3(*
P)4.
4�
0.2
3.9
�0.
24.
8�
0.4
6.0
�0.
2(*
L)
�0.
3�
2.1
P�
0.16
Sylla
bles
per
EP
1.5
�0.
11.
5�
0.1
1.3
�0.
0(*
S)1.
2�
0.1
1.0
�0.
0(*
L)
�2.
3�
0.8
(*)
P<
0.01
Exp
irat
ory
gaps
,%
39.2
�5.
841
.6�
2.5
25.9
�2.
4(*
S)20
.2�
4.6
0.8
�0.
6(*
L)
�8.
0�
2.0
(*)
P<
0.00
1V
ocal
ized
frac
tion
,%
66.8
�2.
367
.3�
2.9
74.5
�3.
780
.8�
3.2
96.1
�0.
6(*
L)
2.8
�0.
7(*
)P
�0.
15E
Pon
set
dur,
ms
24.7
�2.
619
.0�
1.5
13.2
�1.
2(*
S)12
.3�
2.3
4.4
�0.
5(*
L)
�6.
6�
1.6
(*)
P<
0.01
Exp
irat
ory
gap
dur,
ms
33.3
�3.
231
.0�
2.1
28.2
�2.
623
.6�
2.0
3.6
�2.
2(*
L)
�4.
8�
1.4
(*)
P�
0.40
EP
offs
etdu
r,m
s33
.6�
5.3
25.3
�3.
411
.8�
2.1
(*S)
6.1
�0.
7(*
E)
1.9
�0.
5(*
L)
�14
.9�
2.4
(*)
P<
0.01
EP
sfil
led
bysy
llabl
e,%
23.1
�8.
5(*
P)
44.1
�4.
572
.2�
3.8
(*S)
82.9
�3.
898
.6�
0.6
(*L
)18
.8�
4.3
(*)
P<
0.00
1G
aps
fille
dby
IP,
%27
.8�
5.7
(*P
)46
.0�
4.7
70.0
�4.
5(*
S)78
.2�
2.2
99.2
�0.
3(*
L)
12.0
�2.
4(*
)P
<0.
001
EP
fitti
nger
ror,
s�1
0.5
�0.
30.
1�
0.0
1.0
�0.
2(*
S)2.
2�
0.2
(*E
)6.
0�
1.7
(*L
)92
.1�
29.4
(*)
P<
0.00
1
Val
ues
are
mea
ns�
SE.E
Pdu
r,av
erag
edu
ratio
nof
expi
rato
rypr
essu
repu
lses
(EPs
);IP
dur,
aver
age
dura
tion
ofin
spir
ator
ypr
essu
repu
lses
(IPs
);IP
rate
,ave
rage
rate
ofIP
s;M
ax.p
ress
ure,
99th
perc
entil
eof
pres
sure
dist
ribu
tion;
Min
.pr
essu
re,
1st
perc
entil
eof
pres
sure
dist
ribu
tion;
sylla
ble
amp,
ampl
itude
ofth
esy
llabl
epe
akin
the
ampl
itude
dist
ribu
tion;
Syll.
onse
tsp
eed,
spee
dof
ampl
itude
chan
gefo
r2
ms
afte
rsy
llabl
eon
set;
Syll.
offs
etsp
eed,
spee
dof
ampl
itude
chan
gefo
r2
ms
befo
resy
llabl
eof
fset
;sy
llabl
espe
rE
P,m
ean
no.o
fsy
llabl
espe
rE
P;ex
pira
tory
gaps
,fra
ctio
n(%
)of
gaps
that
dono
tco
ntai
nIP
s;vo
caliz
edfr
actio
n,av
erag
efr
actio
nof
each
EP
that
isfil
led
with
sylla
bles
;E
Pon
set
dur,
time
betw
een
EP
onse
tan
dsy
llabl
eon
set;
expi
rato
ryga
pdu
r,av
erag
edu
ratio
nof
expi
rato
ryga
ps;
EP
offs
etdu
r,tim
ebe
twee
nsy
llabl
eof
fset
and
EP
offs
et;
EPs
fille
dby
sylla
ble,
frac
tion
(%)
ofE
Psth
atar
eco
mpl
etel
yfil
led
bya
sing
lesy
llabl
e(s
ylla
ble
dura
tion
with
in25
ms
ofE
Pdu
ratio
n);
gaps
fille
dby
IP,
frac
tion
ofga
psth
atar
efil
led
bya
sing
leIP
(IP
dura
tion
with
in25
ms
ofga
pdu
ratio
n);
EP
fittin
ger
ror,
erro
rof
fittin
gan
asym
met
ric
Gau
ssia
nto
the
EP
dist
ribu
tion
(mea
sure
s“p
eaki
ness
”of
EP
dura
tion
dist
ribu
tion)
;%
daily
chan
ge,
mea
nw
ithin
-bir
dda
ilych
ange
over
a10
-day
peri
odfr
omda
y�
8to
day
2(s
eeM
AT
ER
IAL
SA
ND
ME
TH
OD
S)in
%;
subs
ong
vs.
plas
tic:
t-te
stbe
twee
nsu
bson
g(n
�8)
and
earl
ypl
astic
song
(n�
8).
Sym
bols
(*S)
,(*
E),
and
(*L
)m
ean
that
the
indi
cate
dqu
antit
yis
sign
ifica
ntly
diff
eren
tfr
omth
esu
bson
g,ea
rly
plas
ticso
ng,
and
late
plas
ticso
ngva
lues
,re
spec
tivel
y.R
ows
indi
cate
din
bold
face
show
eda
sign
ifica
ntw
ithin
-bir
dda
ilych
ange
betw
een
subs
ong
and
earl
ypl
astic
song
(P�
0.05
,t-t
est)
.Ast
eris
ksw
ithou
ta
lette
rin
dica
teth
atth
em
ean
with
in-b
ird
daily
chan
geis
sign
ifica
ntly
diff
eren
tfr
omze
ro.
1751RESPIRATORY PATTERNING IN SUBSONG
J Neurophysiol • VOL 106 • OCTOBER 2011 • www.jn.org
by 10.220.33.6 on February 12, 2017
http://jn.physiology.org/D
ownloaded from
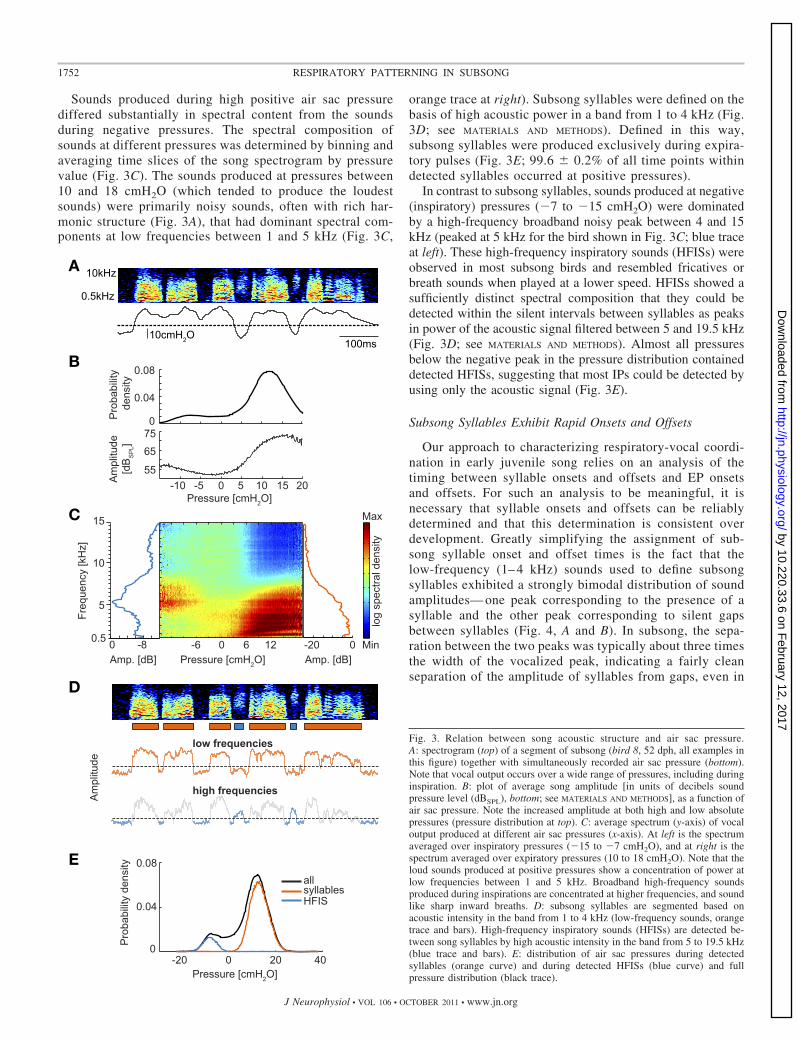
Sounds produced during high positive air sac pressurediffered substantially in spectral content from the soundsduring negative pressures. The spectral composition ofsounds at different pressures was determined by binning andaveraging time slices of the song spectrogram by pressurevalue (Fig. 3C). The sounds produced at pressures between10 and 18 cmH2O (which tended to produce the loudestsounds) were primarily noisy sounds, often with rich har-monic structure (Fig. 3A), that had dominant spectral com-ponents at low frequencies between 1 and 5 kHz (Fig. 3C,
orange trace at right). Subsong syllables were defined on thebasis of high acoustic power in a band from 1 to 4 kHz (Fig.3D; see MATERIALS AND METHODS). Defined in this way,subsong syllables were produced exclusively during expira-tory pulses (Fig. 3E; 99.6 � 0.2% of all time points withindetected syllables occurred at positive pressures).
In contrast to subsong syllables, sounds produced at negative(inspiratory) pressures (�7 to �15 cmH2O) were dominatedby a high-frequency broadband noisy peak between 4 and 15kHz (peaked at 5 kHz for the bird shown in Fig. 3C; blue traceat left). These high-frequency inspiratory sounds (HFISs) wereobserved in most subsong birds and resembled fricatives orbreath sounds when played at a lower speed. HFISs showed asufficiently distinct spectral composition that they could bedetected within the silent intervals between syllables as peaksin power of the acoustic signal filtered between 5 and 19.5 kHz(Fig. 3D; see MATERIALS AND METHODS). Almost all pressuresbelow the negative peak in the pressure distribution containeddetected HFISs, suggesting that most IPs could be detected byusing only the acoustic signal (Fig. 3E).
Subsong Syllables Exhibit Rapid Onsets and Offsets
Our approach to characterizing respiratory-vocal coordi-nation in early juvenile song relies on an analysis of thetiming between syllable onsets and offsets and EP onsetsand offsets. For such an analysis to be meaningful, it isnecessary that syllable onsets and offsets can be reliablydetermined and that this determination is consistent overdevelopment. Greatly simplifying the assignment of sub-song syllable onset and offset times is the fact that thelow-frequency (1– 4 kHz) sounds used to define subsongsyllables exhibited a strongly bimodal distribution of soundamplitudes— one peak corresponding to the presence of asyllable and the other peak corresponding to silent gapsbetween syllables (Fig. 4, A and B). In subsong, the sepa-ration between the two peaks was typically about three timesthe width of the vocalized peak, indicating a fairly cleanseparation of the amplitude of syllables from gaps, even in
Fig. 3. Relation between song acoustic structure and air sac pressure.A: spectrogram (top) of a segment of subsong (bird 8, 52 dph, all examples inthis figure) together with simultaneously recorded air sac pressure (bottom).Note that vocal output occurs over a wide range of pressures, including duringinspiration. B: plot of average song amplitude [in units of decibels soundpressure level (dBSPL), bottom; see MATERIALS AND METHODS], as a function ofair sac pressure. Note the increased amplitude at both high and low absolutepressures (pressure distribution at top). C: average spectrum (y-axis) of vocaloutput produced at different air sac pressures (x-axis). At left is the spectrumaveraged over inspiratory pressures (�15 to �7 cmH2O), and at right is thespectrum averaged over expiratory pressures (10 to 18 cmH2O). Note that theloud sounds produced at positive pressures show a concentration of power atlow frequencies between 1 and 5 kHz. Broadband high-frequency soundsproduced during inspirations are concentrated at higher frequencies, and soundlike sharp inward breaths. D: subsong syllables are segmented based onacoustic intensity in the band from 1 to 4 kHz (low-frequency sounds, orangetrace and bars). High-frequency inspiratory sounds (HFISs) are detected be-tween song syllables by high acoustic intensity in the band from 5 to 19.5 kHz(blue trace and bars). E: distribution of air sac pressures during detectedsyllables (orange curve) and during detected HFISs (blue curve) and fullpressure distribution (black trace).
1752 RESPIRATORY PATTERNING IN SUBSONG
J Neurophysiol • VOL 106 • OCTOBER 2011 • www.jn.org
by 10.220.33.6 on February 12, 2017
http://jn.physiology.org/D
ownloaded from

the earliest song [see Table 1; average separation betweenpeaks in subsong, 24.4 � 1.0 dB; average (SD) of vocalizedpeak, 7.6 � 0.2 dB].
Although the width of the distribution of syllable ampli-tudes showed no significant developmental trend (P � 0.5,t-test, subsong compared with adult song), there was a trendtoward higher average syllable amplitude, which increasedby 1.6 � 1.5 dB between subsong and early plastic song (seeMATERIALS AND METHODS for definition of song stages) and by10.4 � 1.6 dB between subsong and adult song (P � 0.05,subsong compared with adult song). In adult song, theseparation between the vocalized and nonvocalized peaks inthe amplitude distribution was roughly 4.5 times the SD ofthe vocalized peak.
Further simplifying the identification of subsong syllableonsets and offsets is that the transition times were extremelyfast, typically within 2– 4 ms (Fig. 4C). In particular, therate of amplitude change was 6.2 � 0.3 dB/ms at syllableonsets and 4.4 � 0.2 dB/ms at syllable offsets. The meanrate did not change significantly between subsong and laterplastic song stages (P � 0.05, t-test) and was only slightlyfaster in adults (see Table 1). Because of the fast transitions,the determination of syllable onset and offset times is highlyrobust to overall changes in song amplitude during devel-opment, or to small differences in the choice of threshold.For example, assuming a fixed syllable-detection threshold,the 1.6-dB change in song amplitude between subsong and
plastic song could produce at most a 0.3-ms change in theestimate of syllable onset times or a 0.4-ms change insyllable offset times.
Expiratory Pressure Pulses Contain Nonvocalized Regions
Similar to what has been reported in juvenile cardinals(Suthers 2004), we found that in young zebra finches someexpiratory pulses did not contain any syllables, while otherscontained more than one syllable (range 0 – 8 syllables, Fig.5, A and B). To further quantify the relation between thevocal and respiratory events during subsong, we examinedfour timescales of interest (Fig. 5A): 1) the duration of thenonvocalized period between the onset of the EP and thebeginning of the first syllable (EP onset period, average19 � 1.5 ms); 2) the duration of the syllables (average 72.8 � 4.5ms); 3) the duration of silent gaps between syllables within anEP (expiratory gaps, average 31.0 � 2.1 ms); and 4) thenonvocalized period between the last syllable in the EP andthe offset of the EP (EP offset period, average 25.3 � 3.4ms). The durations of these events were highly variableduring singing, and all exhibited a broad distribution from�10 ms to hundreds of milliseconds (Fig. 5, C–F). Thedistributions decreased monotonically over this range, indi-cating that long durations were less common than shorterdurations. For syllable and expiratory gap durations, the de-crease was approximately linear on a semilog plot, indicating
Fig. 4. Characterization of subsong syllables. A: traces ofsong amplitude (log units, dBSPL) during a bout ofsubsong (top), plastic song (middle), and adult song(bottom). Note the strongly bimodal nature of songamplitude at all developmental stages (distributions atright). B: distribution of sound amplitude for 3 subsongbirds (top: bird 7, 49 dph; middle: bird 13, 46 dph;bottom: bird 3, 43 dph). For each bird, the distribution isshown (overlaid traces) for 3 different files recorded onthe same day. C: average temporal profile (thick line) ofsong amplitude at syllable onset (left) and offset (right).Also shown are amplitude profiles (gray traces) from 25individual examples. Amplitude is shown relative toaverage amplitude of background noise (0 dB) for alltraces. Also shown is the lower threshold used to deter-mine syllable onset time (dashed line, see MATERIALS
AND METHODS).
1753RESPIRATORY PATTERNING IN SUBSONG
J Neurophysiol • VOL 106 • OCTOBER 2011 • www.jn.org
by 10.220.33.6 on February 12, 2017
http://jn.physiology.org/D
ownloaded from

an exponential distribution of durations (Fig. 5, D and E). Theshape of these distributions appeared generally consistentacross all subsong birds examined (Fig. 5, C–F).
In adult song, the silent gaps between syllables are tightlyand uniquely linked to inspiratory pulses (Wild et al. 1998).Consistent with this, in the adult zebra finches we recorded,the vast majority of gaps contained an inspiration (99.3%)and the inspirations nearly completely filled the gaps. Incontrast, in subsong only 58.4% of gaps within bouts ofsinging contained an inspiration (Fig. 5, A and G), theremainder being the expiratory gaps described above (alsosee MATERIALS AND METHODS). While some inspiratory gaps insubsong were completely filled with IPs, many inspiratorygaps included long periods of nonvocalized expiratory pres-sures before or after the IP (Fig. 5G). As a result, thedistributions of gap durations were complex, containing ashort component due to brief expiratory gaps and a longerbroad component due to inspiratory gaps (Fig. 5H).
Developmental Changes in Respiratory-Vocal Patternsin Subsong and Early Plastic Song
We now turn to the developmental changes leading to thecoordination of respiratory and vocal patterns. One of theearliest identifiable components of early song vocalizations issyllables with fairly consistent timing, visible by the appear-ance of a peak in the syllable duration distribution (Fig. 6A)(Tchernichovski et al. 2004). We refer to all syllables withinthis peak as “protosyllables” (Aronov et al., 2010). The devel-opment of protosyllables occurs well before any acousticstereotypy is apparent in the song; thus protosyllables aredefined here only on the basis of their duration. The protosyl-lable peak appears at roughly age 45 dph (range: 35–50 dph;Aronov et al., 2010) and serves as an easily detectable devel-opmental milestone signaling the transition to early plasticsong (see MATERIALS AND METHODS). Typically, several daysprior to the appearance of the protosyllable peak, a peak in the
Fig. 5. Relation between subsong respiratory and vocal events. A: example of an EP that contains multiple syllables (bird 9, 39 dph). The EP can be dividedinto 4 distinct components: EP onset period, prior to the onset of the first syllable (blue); syllables (orange bars); expiratory gaps between syllables within anEP (red); and EP offset period after the last syllable (purple). B: distribution of the number of syllables per EP for all subsong birds. C–F: distribution of EPonset durations, syllable durations, expiratory gap durations, and EP offset durations in 12 subsong birds. G: examples of 2 gaps that contain inspirations(inspiratory gaps) (bird 3, 43 dph). The first gap is much longer than the IP because it contains a long EP offset period. The second gap has very short EP onsetand offset periods, and its duration is close to the duration of the IP. H: duration distribution of all gaps (black trace), expiratory gaps (red), and inspiratory gaps(green) for the same bird. Note that the peak in the overall gap distribution is from inspiratory gaps that have a duration close to the IP duration (IP durationdistribution, blue dashed trace).
1754 RESPIRATORY PATTERNING IN SUBSONG
J Neurophysiol • VOL 106 • OCTOBER 2011 • www.jn.org
by 10.220.33.6 on February 12, 2017
http://jn.physiology.org/D
ownloaded from
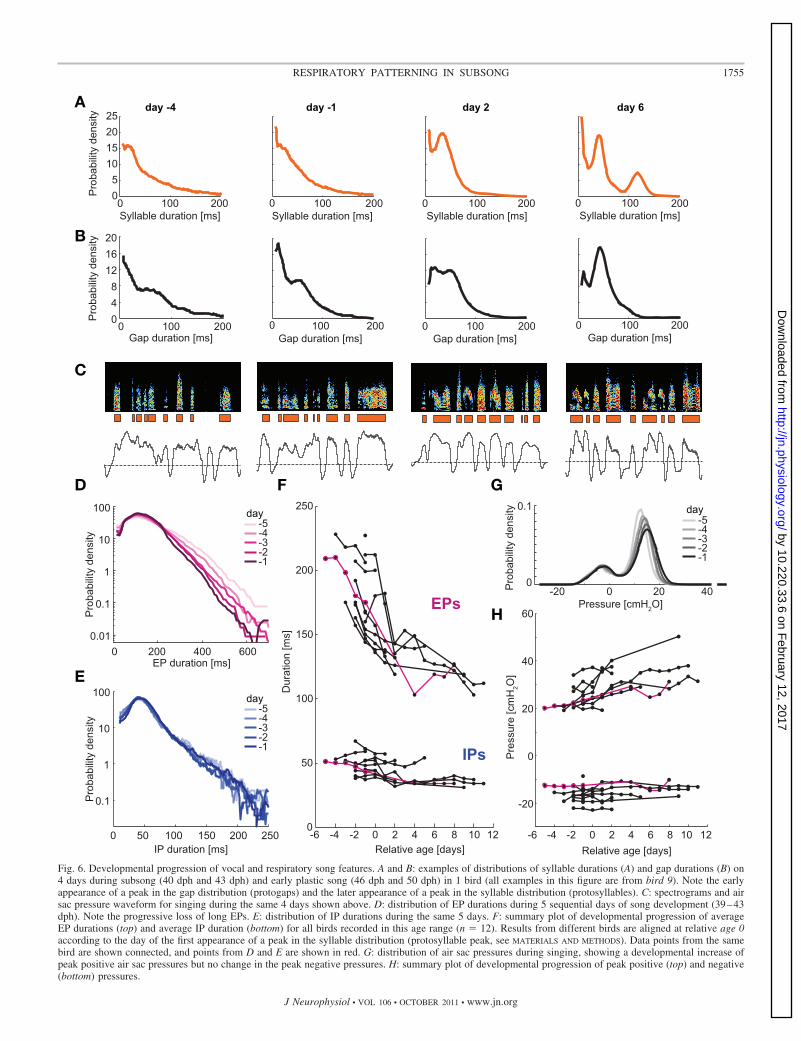
Fig. 6. Developmental progression of vocal and respiratory song features. A and B: examples of distributions of syllable durations (A) and gap durations (B) on4 days during subsong (40 dph and 43 dph) and early plastic song (46 dph and 50 dph) in 1 bird (all examples in this figure are from bird 9). Note the earlyappearance of a peak in the gap distribution (protogaps) and the later appearance of a peak in the syllable distribution (protosyllables). C: spectrograms and airsac pressure waveform for singing during the same 4 days shown above. D: distribution of EP durations during 5 sequential days of song development (39–43dph). Note the progressive loss of long EPs. E: distribution of IP durations during the same 5 days. F: summary plot of developmental progression of averageEP durations (top) and average IP duration (bottom) for all birds recorded in this age range (n � 12). Results from different birds are aligned at relative age 0according to the day of the first appearance of a peak in the syllable distribution (protosyllable peak, see MATERIALS AND METHODS). Data points from the samebird are shown connected, and points from D and E are shown in red. G: distribution of air sac pressures during singing, showing a developmental increase ofpeak positive air sac pressures but no change in the peak negative pressures. H: summary plot of developmental progression of peak positive (top) and negative(bottom) pressures.
1755RESPIRATORY PATTERNING IN SUBSONG
J Neurophysiol • VOL 106 • OCTOBER 2011 • www.jn.org
by 10.220.33.6 on February 12, 2017
http://jn.physiology.org/D
ownloaded from

gap duration distribution appears at roughly 60 ms, corre-sponding to the duration of inspiratory pressure pulses (Aronovet al., 2010). As with protosyllables, the peak in the gapduration distribution grows rapidly, becoming more pro-nounced and narrower on a day-to-day basis (Fig. 6B). We notethat the terms “protosyllable” and “protogap” refer only to thevocal pattern, not to the underlying EPs and IPs.
What changes in the respiratory pattern are associated withthe dramatic changes that occur in the syllable and gap pat-terning during the transition from subsong to plastic song? Toaddress this question, in a subset of birds (n � 12) we recordedthoracic air sac pressure continuously through the progressionfrom subsong into plastic song (Fig. 6C). Here we carry out adetailed quantitative analysis of the developmental changes tothe pressure waveform and its relation to syllables and gaps.All of the developmental analyses we present here are alignedto the day on which the protosyllable peak appears (day 0, seeMATERIALS AND METHODS).
Developmental Changes in EPs and IPs
One developmental change visually apparent in the respira-tory pattern is an increase in the rate of minibreaths (IPs; Fig.6C). The rate of IPs during subsong was only �4.1 s�1, whichincreased by 40 � 8.5% by early plastic song (P � 0.01, t-test)and further increased into adulthood (Table 1). This change inIP rate was a consequence of changes in the duration of bothEPs and IPs (Fig. 6, D–F). Overall, expiratory pulses becamesignificantly shorter between subsong and early plastic song(Fig. 6D; decrease of 25 � 10%, P � 0.01, t-test). The durationof inspiratory pulses also decreased significantly during thesame period (Fig. 6E; decrease of 19 � 9%; P � 0.05, t-test).Both EPs and IPs continued to shorten into adulthood, asdetermined from air sac pressure measurements made in fiveseparate adult birds (average EP duration, Table 1).
Interestingly, the EPs not only shortened but also increasedin amplitude during development (Fig. 6, G and H). The peakpressure during EPs (defined as the 99th percentile of thedistribution of positive pressures) showed a significant dailyincrease between subsong and early plastic song and continuedto increase into adulthood (37% higher in adult than duringsubsong; see Table 1). In contrast to EPs, the peak inspiratorypressures (the minima of the IPs) did not show a significantdevelopmental change.
EPs also became more completely vocalized with develop-ment. On average, the total duration of all subsong syllableswithin an EP, as a fraction of the EP duration (vocalizedfraction), was only 67.3 � 2.9%. Between subsong and earlyplastic song, the vocalized fraction showed a significant dailyfractional increase (Fig. 7A; P � 0.01, t-test). The vocalizedfraction continued to increase throughout song learning, reach-ing a value of 96.1 � 0.6% in the adult birds (P � 0.01compared with late plastic song). Consistent with this, wefound that expiratory gaps became less frequent throughoutdevelopment (Fig. 7B; 41.6 � 2.5% of gaps in subsong andonly 0.8 � 0.6% of gaps in adult song, see Table 1). Despitethe increased fraction of each EP vocalized, across birds theaverage duration of syllables did not show a consistent orsignificant developmental change through subsong into earlyplastic song (P � 0.76; Fig. 7, D and H).
What is the developmental progression of the relation be-tween syllable onsets and offsets and respiratory transitions?The average EP onset period became significantly shorterbetween subsong and early plastic song (Fig. 7, C and G;decrease of 31 � 12%; P � 0.01, t-test). The largest develop-mental change was seen in the EP offset periods, whichdecreased significantly by 53 � 22% during this period (Fig. 7,F and K; P � 0.001, t-test). The rapid reduction in EP onsetand offset intervals during subsong indicates an increasingrelative coordination between the onsets and offsets of EPs andsyllables.
Changes to Coordination of Syllables and Expiratory Pulses
The developing coordination between respiratory and vocalpatterns can also be seen in the joint distribution of syllabledurations and EP durations (Fig. 8, A and B). In subsong, therewas only a very weak relation between syllable duration andthe duration of the EP on which it is produced. Over the courseof a few days, syllables became more closely associated withEPs of similar length, evident from the accumulation of sylla-bles at the diagonal of the joint distribution, indicating EPs thatwere almost completely filled by a single syllable (Fig. 8A). Toquantify this, we calculated the fraction of EPs that containeda single syllable with a duration within 25 ms of the EPduration. In subsong, this fraction of “filled EPs” was onaverage 44.1 � 4.5%. This fraction increased significantly byearly plastic song (Fig. 8B; P � 0.001) and ultimately reachedan average of 98.6 � 0.6% in adult birds. Similar to thedevelopmental “filling” of EPs with syllables, IPs graduallyfilled inspiratory gaps more completely (Fig. 8, C and D). Thefraction of IPs that had a duration within 25 ms of theassociated gap was only 44.3 � 4.1% in subsong and increasedsignificantly during plastic song, reaching a value of 99.2 �0.3% in adult song.
We wondered whether there is a developmental change inthe duration distribution of EPs that parallels the appearance ofprotosyllables in early plastic song. In all birds, the appearanceof a protosyllable peak was consistently associated with theappearance of a peak in the EP duration distribution at a similarduration (Fig. 9A). To quantify the presence of narrow peaks inthe EP duration distribution, we fit EP distributions to a broadasymmetric Gaussian function that fit extremely well to the EPdistribution in subsong birds (Fig. 9B; see MATERIALS AND
METHODS). In subsong, the residual square error of this fit waslow, and as the EP distribution developed peaks the asymmet-ric Gaussian produced larger squared errors, which we used asa metric of “peakiness” (Fig. 9C; P � 0.001, t-test; Table 1).The location of peaks in the EP duration distribution corre-sponded to the duration of protosyllables, resulting in distinctclusters along the diagonal in the joint syllable-EP durationdistribution (Fig. 9D; n � 8 of 8 birds), similar to thoseobserved in adult song (Fig. 9E).
The presence of these distinct clusters along the diagonalof the EP-syllable joint duration distribution might suggestthat each protosyllable is uniquely associated with an EP ofthe same duration, even at the earliest stages of protosyl-lable development. However, in contradiction to this hy-pothesis, we observed that EPs containing protosyllables(PSEPs) exhibited a characteristic and surprising distribution ofdurations—in all birds recorded at the transition to plastic song
1756 RESPIRATORY PATTERNING IN SUBSONG
J Neurophysiol • VOL 106 • OCTOBER 2011 • www.jn.org
by 10.220.33.6 on February 12, 2017
http://jn.physiology.org/D
ownloaded from

(relative age 1–4, n � 8), the duration distribution of PSEPsexhibited one or more peaks at longer durations than the primaryprotosyllable-related peak [Fig. 10, A–C; average height ofsecondary peak relative to primary peak, 30.2 � 18.1%(�SD)]. In all birds, the spacing between these multiplePSEP peaks appeared to occur at roughly integer multiplesof the primary EP peak duration [Fig. 10D; correlation ofspacing between the multiple peaks and the duration of theprimary EP peak, r2 � 0.88, slope � 0.95 � 0.18 (SE), notsignificantly different from 1, P � 0.2]. Consistent withthese measures, an examination of the song spectrogramsand pressure waveforms revealed that the longer peaks inthe PSEP distribution appeared to be cases in which two ormore protosyllables were produced sequentially but an in-tervening IP failed to occur (Fig. 10C).
HVC Lesions Reverse Developmental Changes
It has previously been shown that birds revert to theproduction of subsong-like vocalizations after bilateral le-sions of nucleus HVC (Aronov et al. 2008). In addition,HVC lesions in young plastic birds eliminate both the peakin syllable duration distribution (Aronov et al. 2008) and thepeak in the gap duration distribution (Aronov et al., 2010).Because protogaps appear to be associated with IPs and, asshown above, protosyllables appear to be associated withstereotyped EP durations, we wondered what role HVCplays in the development of respiratory patterns in earlysong.
To address this question, we recorded air sac pressure afterbilateral HVC lesions in early plastic song birds that we had
Fig. 7. Developmental progression of respiratory-vocal coordination. A: summary plot of developmental progression of the average fraction of each EPthat is filled with syllables for all birds. B: schematic diagram showing the definition of EP onset, expiratory gap, and EP offset period, for reference topanels below. C–F: developmental changes in the distributions of EP onset duration (C), syllable duration (D), expiratory gap duration (E), and EP offsetperiod (F) for bird 9, 39 – 43 and 48 dph. The distributions are plotted over 5 sequential days and another 4 days later. Note the developmental shorteningof all durations except syllable durations. G–K: summary plots of developmental progression of the 4 quantities shown above. G: average duration of EPonset during each recorded day, shown for all birds. Points for the bird shown in C are highlighted in red. H: average syllable duration shows no consistenttrend. J: average duration of expiratory gaps. K: average duration of EP offset period shows the most dramatic developmental change during subsong.
1757RESPIRATORY PATTERNING IN SUBSONG
J Neurophysiol • VOL 106 • OCTOBER 2011 • www.jn.org
by 10.220.33.6 on February 12, 2017
http://jn.physiology.org/D
ownloaded from

tracked developmentally before the lesion (n � 7). Surpris-ingly, strong inspiratory and expiratory pulses persisted afterHVC lesions (Fig. 11A). Although the extremes of the pressureintensities were reduced (Fig. 11, B and G), the pressuredistribution remained strongly bimodal after lesion (Fig. 11B)and even exhibited a significantly more pronounced bimodalitythan in subsong birds (height of central minimum was 47.0 �6.4% of smaller peak, smaller than in subsong birds; P � 0.05).This finding suggests that HVC is not necessary for the distinctinspiratory and expiratory phases of respiration during singing.
To further examine the effect of HVC lesions, we quantifiedEP and IP durations, as well as several measures of respiratory-vocal coordination described above. After HVC lesions, theaverage length of EPs and IPs was significantly increased,opposite to the observed developmental changes (Fig. 11, C, D,and G; Table 1). Furthermore, the shape of the EP and IPduration distributions also showed an apparent reversal ofdevelopmental trends, acquiring distributions more character-istic of early subsong (Fig. 11, C and D). A similar effect wasalso seen in the durations of EP onset and offset periods (Fig.11, E and F) and of expiratory gaps. For each of thesemeasures, we quantified the developmental changes in the daysprior to HVC lesion and then quantified the change between pre-and postlesion song (Fig. 11, G and H). In all cases, the changebetween pre- and postlesion song was in the opposite direction to
the developmental changes prior to the lesion. Examination of thejoint syllable duration and EP duration distribution shows thatHVC lesions also abolish the coordination between syllable du-ration and EP duration, returning the fraction of “filled” EPs to alevel consistent with early subsong (Fig. 11, J and K). HVClesions also eliminated the peaks in the EP duration distributions(Fig. 11L). This, together with the increased duration of IPs andEPs following HVC lesion, suggests that HVC does not just playa developmental role in the coordination of syllables and respira-tion but also increasingly controls the timing and duration ofrespiratory events. The effects of HVC lesion and developmentalchanges from subsong, through early and late plastic song, and inadult song are summarized in Fig. 12.
DISCUSSION
We set out to describe the respiratory patterns in youngzebra finches singing early “babbling” (subsong) vocalizationsand to examine the developmental time course by whichrespiratory and vocal patterns become coordinated. We foundthat respiratory patterns in zebra finches exhibited distinct brief(50 ms) inspiratory pulses, similar to minibreaths (Hartley andSuthers 1989), alternating with longer, more variable pulses ofsustained expiratory pressure (50–500 ms). Consistent withearlier descriptions of air sac pressure in juvenile cardinals
Fig. 8. Development of association between syllables and EPs. A: joint distribution of syllable and EP durations in a bird singing subsong (left) and 1 day later(right) (bird 10, 48 and 49 dph). Note the higher density of syllable-EP points along the diagonal, indicating an increased incidence of EPs that are completelyfilled with a syllable. EP-syllable coordination is quantified as the fraction of EPs that contain a single syllable with a duration within 25 ms of the EP duration.This example shows a change from 69.6% (left) to 85.1% (right) over 1 day. B: summary plot of developmental changes in the fraction of EPs filled with a singlesyllable for all birds. C: joint distribution of gap and IP durations in a bird singing subsong (left) and 3 days later (right) (bird 8, 52 and 55 dph, respectively).Note the accumulation of gaps and IPs near the diagonal, indicating short gaps that are completely filled by an IP. D: summary plot for the whole data set ofthe proportion of gaps that were filled by a single IP with a duration within 25 ms of the gap duration.
1758 RESPIRATORY PATTERNING IN SUBSONG
J Neurophysiol • VOL 106 • OCTOBER 2011 • www.jn.org
by 10.220.33.6 on February 12, 2017
http://jn.physiology.org/D
ownloaded from

(Suthers and Goller 1998; Suthers 1999, 2004), we found thatthe respiratory and vocal gestures in zebra finch subsong werepoorly coordinated. We also found that this coordination ex-hibited striking developmental changes during the transitionfrom subsong to plastic song.
We have characterized the spectra of vocalizations pro-duced at different respiratory pressures during subsong.Subsong syllables in the zebra finch, characterized by highsound level between 1 and 5 kHz and rich harmonic struc-ture, were produced exclusively during expiratory pulses.The mechanisms underlying these sounds is unclear but mayinvolve the pulse-tone mechanism of the syrinx thought to
underlie low-frequency harmonic syllables in the adult ze-bra finch (Fee 2002; Jensen et al. 2007) or other nonlinearoscillatory processes (Fee et al. 1998; Wilden et al. 1998;Suthers et al. 2011). In contrast, broadband high-frequencyinspiratory sounds, with peak spectral intensity between 5and 15 kHz, were produced during most inspiratory pulsesand may be due to turbulent airflow through the trachea andsyrinx during inspiration. In some cases, these sounds be-came more like high-frequency whistles as the bird pro-gressed into plastic song, a process that could underlie thedevelopment of inspiratory whistled notes observed in adultzebra finches (Goller and Daley 2001).
Fig. 9. Development of stereotyped EP durations. A: distributions of EP durations (top) and syllable durations (bottom) in 1 bird on 3 different days (bird 10,dph 48, 49, and 57). Note the appearance of 1 and then 2 narrow peaks in the syllable duration distribution and the concurrent appearance of peaks in the EPdurations. B: the subsong EP duration distributions are well fit by a single broad asymmetric Gaussian function (see MATERIALS AND METHODS), but the narrowpeaks in the plastic song EP distribution are not well fit. Thus the “peakiness” of the distribution was quantified as the fitting error of this function to the EPdistribution. C: summary plot of the developmental progression of peaks in the EP duration distribution, shown for all birds (pink points indicate bird in A). Onthe y-axis is plotted the total squared error of the best-fit asymmetric Gaussian function to the EP distribution. Note the sudden deviation from a good fit afterthe appearance of a protosyllable peak (relative age 0). D: joint distribution of EP duration and syllable duration for day 9 of the bird shown in A (same birdshown in Fig. 8A). Note the appearance of distinct clusters of EP/syllable durations along the diagonal, indicating that the peaks in the EP distribution correspondto the duration of protosyllables, as is typical for an adult bird (E, adult 1).
1759RESPIRATORY PATTERNING IN SUBSONG
J Neurophysiol • VOL 106 • OCTOBER 2011 • www.jn.org
by 10.220.33.6 on February 12, 2017
http://jn.physiology.org/D
ownloaded from

Fig. 10. Duration distribution of EPs containing protosyllables. A: joint distribution of EP durations (y-axis) and syllable durations (x-axis) for 2 birds (bird 2,relative age 2, left; bird 10, relative age 2, right). The protosyllable peak in the syllable duration distribution was identified (vertical blue bar). B: durationdistribution of EPs containing syllables within 10 ms of the protosyllable peak. These EPs are identified as protosyllable-containing EPs (PSEPs). All birdsrecorded in early plastic song exhibited 1 or more peaks above the primary protosyllable-duration peak. C: spectrograms and air sac pressure traces for the 2example birds. Most EPs contain 1 protosyllable. However, note the presence of long EPs that contain 2 protosyllables (marked with 2 dots). These EPs havea duration corresponding to the second peak in B (also marked with 2 dots). D: the spacing between multiple EP peaks (y-axis) is strongly correlated with theduration of the principal peak (x-axis) (r2 � 0.88). Also shown is a linear fit to the points (red line, slope � 0.95).
1760 RESPIRATORY PATTERNING IN SUBSONG
J Neurophysiol • VOL 106 • OCTOBER 2011 • www.jn.org
by 10.220.33.6 on February 12, 2017
http://jn.physiology.org/D
ownloaded from

Fig. 11. Effect of HVC lesion on respiratory patterns in subsong. A: example of subsong-like vocalizations (top) and air sac pressure (bottom) in a bird 4 daysafter HVC lesion (bird 6, 55 dph). Note the continued presence of distinct IPs and EPs. B: distribution of air sac pressure before (dashed line) and after (greentrace) HVC lesion for the bird in A. C–F: distributions of EP duration (C), IP duration (D), EP onset duration (E), and EP offset duration (F) before and afterHVC lesion for 1 bird (bird 7). Shown are the distributions on 2 different days prior to lesion (gray and black dashed traces, 49 and 60 dph, respectively) andafter HVC lesion (green trace). G and H: population summary of the effect of HVC lesions on respiratory-vocal features. For each feature, the average within-birddevelopmental trend during subsong is shown (Dev), as is the effect of the lesion (Les, postlesion minus prelesion, normalized by the prelesion value). J: jointdistribution of EP duration and syllable duration before (left) and after (right) HVC lesion for the same bird (bird 7). Note the loss of EP-syllable durations alongthe diagonal and the loss of clustering, indicating the loss of EP-syllable coordination and loss of structure in the EP distribution following HVC lesion. K: populationsummary of the fraction of EPs filled by a single syllable during development and after HVC lesion. L: population summary of the total squared error (peakinessmetric) of EP durations during development and after HVC lesion. All changes shown are statistically significant (*P � 0.05, **P � 0.01, t-test).
1761RESPIRATORY PATTERNING IN SUBSONG
J Neurophysiol • VOL 106 • OCTOBER 2011 • www.jn.org
by 10.220.33.6 on February 12, 2017
http://jn.physiology.org/D
ownloaded from

In adult song, nearly every gap contains an IP and every EPis completely filled with a syllable, such that respiratorypatterns are tightly coordinated with the acoustic signal (Franzand Goller 2002; Hartley and Suthers 1989). In contrast, inzebra finch subsong, EPs contain multiple syllables and longnonvocalized periods at the onsets and offsets of the EP; thusrespiratory patterns are distinct from, and largely uncorrelatedwith, the acoustic signal, reminiscent of the nonvocalizedexpiratory periods seen in cardinal subsong (Suthers 2004).This affords a unique opportunity to study the neural origins of
IPs and EPs as behavioral events distinct from the onsets andoffsets of syllables. For example, modulations in neural activ-ity in the premotor areas LMAN and RA could be separatelyanalyzed with respect to respiratory and syllable patterns toclarify the possible involvement of forebrain circuits in thegeneration or initiation of subsong respiratory patterns.
We have previously identified the transition from subsong toearly plastic song with the appearance of a distinct peak at�100 ms in the distribution of syllable durations (protosyl-lables) and the appearance of a peak at �60 ms in the
Fig. 12. Summary of developmental trends and effect of HVC lesion. For each respiratory-vocal feature measured, the population average value is shown in 5conditions: after HVC lesion (I), subsong (II), early plastic song (III), late plastic song (IV), and adult (V). Note that all features show a consistent developmentaltrend from subsong through plastic song to adult. Note that after HVC lesion most features revert to a value developmentally “earlier” than the relatively latesubsong recorded in our experiments. Error bars indicate SE. (See Table 1 for a summary of statistically significant differences.)
1762 RESPIRATORY PATTERNING IN SUBSONG
J Neurophysiol • VOL 106 • OCTOBER 2011 • www.jn.org
by 10.220.33.6 on February 12, 2017
http://jn.physiology.org/D
ownloaded from

distribution of gap durations (protogaps) (Aronov et al., 2010).What is the basis of the appearance and rapid development ofthese early precisely timed song features? Protogaps mayappear when the relatively stereotyped IP becomes closelyflanked by syllables. As EP offset and EP onset periods shortenwith development, each IP will be associated with a gap ofsimilar duration, producing a peak in the gap distribution thatclosely matches the IP durations. Thus the dramatic shorteningof EP onset and EP offset periods, combined with the relativelystereotyped duration of IPs, are likely key factors in theappearance of stereotyped gap durations.
The shortening of EP onset and EP offset periods is partof a general “filling in” of EPs with vocalization duringsubsong development, which is apparent in the increasingfraction of each EP that is vocalized (Fig. 7) and the gradualdisappearance of expiratory gaps (Fig. 12 and Table 1). Thecombined effect of these changes during the transition fromsubsong to plastic song is a dramatic increase in the fractionof EPs that are completely filled by a single syllable (Fig. 8).In fact, the one-to-one relation between syllables and EPs,so characteristic of adult song, is largely accomplishedwithin a few days of the transition from subsong to earlyplastic song.
What mechanisms underlie the development of protosyl-lables? The appearance of distinct clusters along the diagonalin the joint distribution of syllable duration and EP durationsuggest that two factors may primarily contribute: 1) the“filling in” of EPs described above, which implies that theduration of each syllable will be similar to that of its EP (i.e.,along the diagonal of the joint distribution), and 2) the appear-ance of one (or more) peaks in the EP duration distribution,which implies stereotypy in the duration of expiratory pulses.The combination of these two factors will naturally cause theappearance of syllables of stereotyped durations (protosyl-lables).
In a separate study, we examined the role of HVC in thegeneration of stereotyped (peaked) structure in syllable andgap distributions (Aronov et al., 2010) and found that HVClesions completely eliminate protosyllable and protogappeaks. Here we found that HVC lesions cause a substantialreversion of developmental changes in all measures ofrespiratory-vocal coordination examined. For example, theduration of EP onset and offset periods is greatly increasedafter HVC lesion, as are the duration and number of expi-ratory gaps, which could contribute to the loss of theprotogap peak after lesion. We also found that the fractionof EPs that are filled by a single syllable is dramaticallyreduced by HVC lesion, and the sharp peaks in the EPdistribution are completely eliminated. Both of these couldcontribute to the loss of the protosyllable peak after HVClesion.
Together these findings suggest a critical role for HVC in thedevelopment of these earliest consistently timed features inzebra finch song. What specific functions could HVC imple-ment that might explain the developmental changes describedabove? First, the decreased number and duration of expiratorygaps, as well as the general “filling in” of EPs with vocaliza-tion, could be explained if HVC begins to drive patterns ofactivity in RA that increase the overall expiratory pressureduring EPs, thus increasing the fraction of time that the EPremains above the phonation threshold pressure (Riede and
Goller 2010; Titze 1992). This hypothesis is consistent with thedevelopmental increase of peak EP pressures (Fig. 6, G and H)and the loss of peak pressure after HVC lesion (Fig. 11G).HVC could also begin to maintain the syrinx in a configurationthat has a low phonation threshold pressure, which would tendto eliminate those expiratory gaps that occur at fairly highpositive pressures (Fig. 5A).
In addition, HVC also appears to be necessary for thedevelopmental shortening (Fig. 11G) and increased stereotypy(Fig. 11L) of EP durations. The mechanism by which HVCdrives or permits these developmental changes in respiration isunknown, but based on our understanding of the function ofHVC in adult song, one might speculate that during subsong,circuit dynamics in HVC may generate a burst, or sequence ofbursts, that has the duration of one protosyllable (�100 ms)(Long et al. 2010; Solis and Perkel 2005). In the later stages ofsubsong, this activity in HVC could begin to produce a coor-dinated activation of stereotyped-duration EPs (100 ms), an IP,and then another EP, enabling the rhythmic repetition ofprotosyllables and protogaps observed in early plastic song(Saar and Mitra 2008; Tchernichovski et al. 2001; Aronov etal., 2010). We might imagine that these events are probabilis-tic, i.e., that HVC occasionally fails to initiate either anothersyllable or an IP. In cases where HVC succeeds to activateanother protosyllable but fails to initiate an IP, we wouldexpect to see EPs that contain multiple protosyllables, pre-cisely like those shown in Fig. 10. Of course, these ideas arespeculative, and further experiments will be required to deter-mine the precise role of HVC and other brain regions in thedevelopment of respiratory-vocal coordination. We note herethat while the appearance of a “protosyllable peak” in thesyllable duration distribution can be quite sudden, often occur-ring over the course of 1 day, it is likely that the underlyingHVC-driven processes occur much more gradually, throughoutsubsong and early plastic song.
One important question not addressed in this study is therole of learning and auditory feedback in the development ofearly respiratory-vocal coordination. Does the appearance ofprotosyllables and protogaps require the neural circuitsimportant for other aspects of song learning? It is interestingto note that peaks in the syllable duration distribution(protosyllables) can appear in socially isolated birds beforethe exposure of a bird to a tutor song (Tchernichovski et al.2004), suggesting that the development of early temporalstructure may not require auditory experience of conspecificsong. On the other hand, the fact that these features aredependent on HVC, which is principally involved in thegeneration of learned vocalizations, suggests that auditoryfeedback may play a crucial role, but this hypothesis couldbe more directly tested by a combination of experiments,including deafening or lesions of area X, a key learning-related nucleus (Bottjer et al. 1984; Konishi 1965; Scharffand Nottebohm 1991).
Our findings may shed light on some aspects of earlyvocalizations in humans. Just as in songbirds, the breathingpattern during human speech is fundamentally differentfrom nonspeech respiration, even for earliest babbling ininfants (Connaghan et al. 2004), and continues to be refinedthroughout childhood (Boliek et al. 1996, 1997). Interest-ingly, respiratory-vocal coordination in children appears toexhibit a pattern different from that in young zebra finches.
1763RESPIRATORY PATTERNING IN SUBSONG
J Neurophysiol • VOL 106 • OCTOBER 2011 • www.jn.org
by 10.220.33.6 on February 12, 2017
http://jn.physiology.org/D
ownloaded from

In young children, vocalized expiratory pulses (calledbreath groups) tend to be filled with a single phonation.While zebra finches appear to produce fewer syllables perEP through development, children learn to produce moresyllables per breath group (Boliek et al. 2009). This differ-ence between speech development and song development inbirds makes sense because adult speech involves the pro-duction of many words and silences within a single breath(Levelt 1993), whereas adult birdsong is produced with atight one-to-one correspondence between breaths and sylla-bles (Franz and Goller 2002). Despite these differencesbetween human speech and birdsong, understanding theneural mechanisms underlying developmental changes insongbirds could shed light on the development of coordina-tion between respiratory and vocal patterns in humans and,more generally, on the interaction of forebrain motor-learn-ing circuits with brain stem motor systems.
ACKNOWLEDGMENTS
We thank Jesse Goldberg and Franz Goller for helpful discussions and forcomments on earlier versions of the manuscript.
GRANTS
This study was supported by National Institute on Deafness and OtherCommunication Disorders Grant R01-DC-009183 to M. S. Fee and by a HertzFoundation Silvio Micali Fellowship to D. Aronov.
DISCLOSURES
No conflicts of interest, financial or otherwise, are declared by the author(s).
REFERENCES
Aronov D, Andalman AS, Fee MS. A specialized forebrain circuit for vocalbabbling in the juvenile songbird. Science 320: 630–634, 2008.
Aronov D, Veit L, Goldberg JH, Fee MS. Two distinct forms of forebraindynamics underlie the production of an early motor behavior. Soc NeurosciAbstr 411.2, 2010.
Boliek CA, Hixon TJ, Watson PJ, Jones PB. Refinement of speech breathingin healthy 4- to 6-year-old children. J Speech Lang Hear Res 52: 990–1007,2009.
Boliek CA, Hixon TJ, Watson PJ, Morgan WJ. Vocalization and breathingduring the first year of life. J Voice 10: 1–22, 1996.
Boliek CA, Hixon TJ, Watson PJ, Morgan WJ. Vocalization and breathingduring the second and third years of life. J Voice 11: 373–390, 1997.
Bottjer SW, Miesner EA, Arnold AP. Forebrain lesions disrupt developmentbut not maintenance of song in passerine birds. Science 224: 901–903, 1984.
Brackenbury J. Respiration and production of sounds by birds. Biol Rev 55:363–378, 1980.
Connaghan KP, Moore CA, Higashakawa M. Respiratory kinematics duringvocalization and nonspeech respiration in children from 9 to 48 months. JSpeech Lang Hear Res 47: 70–84, 2004.
Doupe AJ, Kuhl PK. Birdsong and human speech: common themes andmechanisms. Annu Rev Neurosci 22: 567–631, 1999.
Fee MS. Measurement of the linear and nonlinear mechanical properties of theoscine syrinx: implications for function. J Comp Physiol A 188: 829–839,2002.
Fee MS, Scharff C. The songbird as a model for the generation and learningof complex sequential behaviors. ILAR J 51: 362–377, 2010.
Fee MS, Shraiman B, Pesaran B, Mitra PP. The role of nonlinear dynamicsof the syrinx in the vocalizations of a songbird. Nature 395: 67–71, 1998.
Franz M, Goller F. Respiratory units of motor production and song imitationin the zebra finch. J Neurobiol 51: 129–141, 2002.
Goller F, Daley MA. Novel motor gestures for phonation during inspirationenhance the acoustic complexity of birdsong. Proc Biol Sci 268: 2301–2305,2001.
Hage SR, Stefan MB. Neuronal networks involved in the generation ofvocalization. In: Handbook of Mammalian Vocalization—An Integrative
Neuroscience Approach, edited by Brudzynski SM. Oxford: Academic,2009, p. 339–349.
Hahnloser RHR, Kozhevnikov AA, Fee MS. An ultra-sparse code underliesthe generation of neural sequences in a songbird. Nature 419: 65–70, 2002.
Hartley RS. Expiratory muscle activity during song production in the canary.Respir Physiol 81: 177–187, 1990.
Hartley RS, Suthers RA. Airflow and pressure during canary song: directevidence for mini-breaths. J Comp Physiol A 165: 15–26, 1989.
Immelmann K. Song development in the zebra finch and other estrildidfinches. In: Bird Vocalizations, edited by Hinde RA. New York: CambridgeUniv. Press, 1969, p. 61–74.
Jensen KK, Cooper BG, Larsen ON, Goller F. Songbirds use pulse toneregister in two voices to generate low-frequency sound. Proc Biol Sci 274:2703–2710, 2007.
Konishi M. The role of auditory feedback in the control of vocalization in thewhite-crowned sparrow. Z Tierpsychol 22: 770–783, 1965.
Kubke MF, Yazaki-Sugiyama Y, Mooney R, Wild JM. Physiology ofneuronal subtypes in the respiratory-vocal integration nucleus retroam-bigualis of the male zebra finch. J Neurophysiol 94: 2379 –2390,2005.
Levelt WJM. Speaking: from Intention to Articulation. Cambridge, MA: MITPress, 1993.
Lilliefors HW. On the Kolmogorov-Smirnov Test for the exponential distri-bution with mean unknown. J Am Stat Assoc. 64: 387–389, 1969.
Liu W, Gardner TJ, Nottebohm F. Juvenile zebra finches can use multiplestrategies to learn the same song. Proc Natl Acad Sci USA 101: 18177–18182, 2004.
Long MA, Fee MS. Using temperature to analyse temporal dynamics in thesongbird motor pathway. Nature 456: 189–194, 2008.
Long MA, Jin DZ, Fee MS. Support for a synaptic chain model of neuronalsequence generation. Nature 468: 394–399, 2010.
Marler P. Song-learning behavior: the interface with neuroethology. TrendsNeurosci 14: 199–206, 1991.
Marler P, Peters S. Selective vocal learning in a sparrow. Science 198:519–521, 1977.
Marler P, Peters S. Structural changes in song ontogeny in the swampsparrow Melospiza georgiana. Auk 99: 446–458, 1982.
Nottebohm F, Stokes TM, Leonard CM. Central control of song in thecanary, Serinus canarius. J Comp Neurol 165: 457–486, 1976.
Price PH. Developmental determinants of structure in zebra finch song. JComp Physiol Psychol 93: 260–277, 1979.
Reinke H, Wild JM. Identification and connections of inspiratory premotorneurons in songbirds and budgerigar. J Comp Neurol 391: 147–163, 1998.
Riede T, Goller F. Peripheral mechanisms for vocal production in birds—differences and similarities to human speech and singing. Brain Lang 115:69–80, 2010.
Saar S, Mitra PP. A technique for characterizing the development of rhythmsin bird song. PLoS One 3: e1461, 2008.
Scharff C, Nottebohm F. A comparative study of the behavioral deficitsfollowing lesions of various parts of the zebra finch song system: implica-tions for vocal learning. J Neurosci 11: 2896–2913, 1991.
Schmidt MF. Pattern of interhemispheric synchronization in HVc duringsinging correlates with key transitions in the song pattern. J Neurophysiol90: 3931–3949, 2003.
Solis MM, Perkel DJ. Rhythmic activity in a forebrain vocal control nucleusin vitro. J Neurosci 25: 2811–2822, 2005.
Suthers RA. Peripheral mechanisms for singing: motor strategies for vocaldiversity. In: Proceedings of the 22nd International Ornithological Con-gress, Durban, edited by Adams NJ, Slotow RH. Johannesburg: Bird LifeSouth Africa, 1999, p. 491–508.
Suthers RA. How birds sing and why it matters. In: Nature’s Music—TheScience of Birdsong, edited by Marler P, Slabbekoorn H. San Diego, CA:Academic, 2004, p. 272–295.
Suthers RA, Goller F. Respiratory-syringeal motor coordination during songlearning in Northern cardinals. Fifth Intl Cong Neuroethol Abstract No. 298,1998.
Suthers RA, Wild JM, Kaplan G. Mechanisms of song production in theAustralian magpie. J Comp Physiol A 197: 45–59, 2011.
Tchernichovski O, Lints T, Deregnaucourt S, Cimenser A, Mitra PP.Studying the song development process: rationale and methods. Ann NYAcad Sci 1016: 348–363, 2004.
Tchernichovski O, Mitra PP, Lints T, Nottebohm F. Dynamics of the vocalimitation process: how a zebra finch learns its song. Science 291: 2564–2569, 2001.
1764 RESPIRATORY PATTERNING IN SUBSONG
J Neurophysiol • VOL 106 • OCTOBER 2011 • www.jn.org
by 10.220.33.6 on February 12, 2017
http://jn.physiology.org/D
ownloaded from

Titze IR. Phonation threshold pressure, a missing link in glottal aerodynamics.J Acoust Soc Am 91: 2926–2935, 1992.
Vu ET, Mazurek ME, Kuo YC. Identification of a forebrain motor program-ming network for the learned song of zebra finches. J Neurosci 14:6924–6934, 1994.
Wild JM. The avian nucleus retroambigualis: a nucleus for breathing, singingand calling. Brain Res 606: 319–324, 1993a.
Wild JM. Descending projections of the songbird nucleus robustus archistria-talis. J Comp Neurol 338: 225–241, 1993b.
Wild JM. Neural pathways for the control of birdsong production. J Neurobiol33: 653–670, 1997.
Wild JM, Goller F, Suthers RA. Inspiratory muscle activity during bird song.J Neurobiol 36: 441–453, 1998.
Wilden I, Herzel H, Peters G, Tembrock G. Subharmonics, biphonation,and deterministic chaos in mammal vocalization. Bioacoustics 8: 1–30,1998.
Yu AC, Margoliash D. Temporal hierarchical control of singing in birds.Science 273: 1871–1875, 1996.
1765RESPIRATORY PATTERNING IN SUBSONG
J Neurophysiol • VOL 106 • OCTOBER 2011 • www.jn.org
by 10.220.33.6 on February 12, 2017
http://jn.physiology.org/D
ownloaded from