learning to read scientific text - university of alberta
TRANSCRIPT

Learning to Read Scientific Text:Do Elementary SchoolCommercial Reading ProgramsHelp?
STEPHEN P. NORRIS, LINDA M. PHILLIPS, MARTHA L. SMITH, SANDRA M.GUILBERT, DONITA M. STANGE, JEFF J. BAKER, ANDREA C. WEBERCentre for Research in Youth, Science Teaching and Learning, and Canadian Centre forResearch on Literacy, University of Alberta, Edmonton, Alberta, Canada, T6G 2G5
Received 20 June 2007; revised 10 December 2007, 17 December 2007;accepted 20 December 2007
DOI 10.1002/sce.20266Published online 25 February 2008 in Wiley InterScience (www.interscience.wiley.com).
ABSTRACT: This paper describes a comprehensive set of studies designed to assess thepotential for commercial reading programs to teach reading in science. Specific questionsfocus on the proportion of selections in the programs that contain science and the amountof science that is in those selections, on the genres in which the science is portrayed,on the areas and topics of science covered, on the accuracy of the scientific content, onthe text features used to communicate the science, and on the instructional strategies andassessment techniques recommended. The findings show that commercial reading programshave changed substantially from the days when they were dominated by literary texts andcontained hardly any science. Now, there is a variety of genres and scientific contentin about one fifth of the selections. The content is also generally accurate. So, there isconsiderable potential offered by these programs for teaching children to read science.Unfortunately, the findings also show that the recommended instructional strategies andassessment techniques do little to capitalize upon this potential. In particular, the findingsdemonstrate that, although most of the science is cast in the expository genre, most ofthe recommended instruction and assessment is more appropriate to the literary genres.C© 2008 Wiley Periodicals, Inc. Sci Ed 92:765–798, 2008
INTRODUCTION
Scientists read a great deal. Reading is central to their professional lives, and the amountthey read is a decent predictor of their success. In a monumental work on communicationpatterns of scientists and engineers, Tenopir and King (2004) report one set of data that showscientists “spend almost two thirds of their informational input time performing readingactivities” (p. 159). The time amounts to 553 hours per year or 23.2% of total work time.When speaking and writing are included in addition to reading, the scientists surveyed
Correspondence to: Stephen P. Norris; e-mail: [email protected]© 2008 Wiley Periodicals, Inc.

766 NORRIS ET AL.
spent 58.1% of their time performing communication activities. It is not much of a leap toconclude, as Tenopir and King did, that because “time is a scarce resource, this amount oftime spent was an indicator of the value of the information gained from reading” (p. 130).They cite considerable additional evidence to show that the amount of reading by scientistshas changed little over the past six decades for which data are available. They continueto report further evidence that scientists rate reading as essential to their research and asthe primary source of creative stimulation. Indeed, the award-winning and high-achievingscientists read more than others (p. 119). It is, therefore, important to science education toknow how well the reading of science is taught in schools.
This paper addresses one aspect of the concern by describing a comprehensive set ofstudies assessing the potential for commercial reading programs to teach reading in science.More specifically, the studies explored the support for teaching and learning how to readscientific text provided by the three Grade 1–Grade 6 commercial reading programs usedin Canada wholly or in part by more than 90% of teachers, a figure based upon writtencorrespondence we conducted with the 13 provinces and territories. The three programsare (a) Cornerstones Canadian Language Arts by Gage Educational Publishing Company(1998–2001), (b) Collections by Prentice Hall Ginn Canada (1996–2000), and (c) NelsonLanguage Arts by Nelson Thomson Learning (1998–2001). These remain the most currentversions provided by the publishers.
We provide a background that looks first at the changes that commercial reading programshave undergone over the past three decades or so, and why those changes support the needfor this study. Second, we review what we know about critical reading ability among adultsin the area of science, and then assess this ability in terms of broadly accepted goals ofscience education in democratic and industrialized societies. Third, we outline our view ofreading and of scientific literacy, and of how both are related through inquiry. The secondand third sections show why instruction in science reading is important. Fourth, we provideand discuss the results of a detailed analysis of the commercial reading programs directedtoward the following questions:
1. How many and what percentage of selections contain scientific content?2. What proportion of each selection containing scientific content is science?3. In what genres of writing does the scientific content appear?4. What areas and topics of scientific content are contained in the programs?5. How scientifically accurate is the content?6. What use is made of various text features for communicating science?7. What types of instructional guidance are offered for teaching reading when the
content is science?8. What types of assessment techniques are suggested and what might be their useful-
ness in fostering scientific literacy?
The first six of these questions deal with aspects of the scientific texts that occur in commer-cial reading programs, and the latter two questions deal with curricular and instructionalissues pertaining to their use. Finally, we draw some conclusions and implications foreducational policy. Our attempt here is to provide a report that integrates all aspects of amultiyear series of studies.
BACKGROUND
Commercial Reading Programs
Language arts instruction (including reading, writing, speaking, and listening) occupiesthe highest proportion of instructional time in Canadian Grade 1–6 classrooms, anywhere
Science Education

LEARNING TO READ SCIENTIFIC TEXT 767
from 25% to 35% depending upon province or territory according to their Web sites currentat the time of writing. This proportion compares to about 10% for science. Therefore,language arts instruction and teachers can be very important resources for fostering readingin science. Commercial reading programs provided the dominant materials used for readinginstruction in North American elementary classrooms throughout most of the 20th and intothe 21st century (Dole & Osborn, 2003; Phillips, Smith, & Norris, 2005; Smith, Phillips,Leithead, & Norris, 2004; Smith, Phillips, Norris, Guilbert, & Stange, 2006), and manyteachers still rely heavily on commercial programs for much of their reading instruction(Morrow & Gambrell, 2000; Moss & Newton, 2002). These programs are pervasive, theirinfluence extends in one form or another to almost all reading instruction across thecurriculum, and, therefore, the examination and analysis of them is crucially importantto science education policy with regard to reading in science.
The literature-based movement had a significant effect on basal reading programs inthe United States over the past three decades (Cullinan, 1987; McCarthey et al., 1995).The movement toward literature-based instruction called for the use of authentic textsin classrooms, including informational texts such as magazine and newspaper selections(McCarthey et al., 1995). Some state education departments called for literature-basedreading programs, and publishers responded by producing anthologies that included largequantities of children’s literature (Hoffman et al., 1994; McCarthey et al., 1995; Reutzel &Larsen, 1995).
As a response to what eventually came to be seen as an overemphasis on literature,there have been repeated calls for inclusion of more informational text in children’s readinginstruction (e.g., Christie, 1987; Duke, 2000; Pappas, 1991, 2006). The range of litera-ture frequently provided has consisted mainly of fictional narrative texts (Moss, Leone,& Dipillo, 1997), and this predominance of narrative in the early elementary grades hasbeen challenged by calls for varied experiences with other text types, particularly expos-itory or informational (Duke & Bennett-Armistead, 2003; Duthie, 1994; Yopp & Yopp,2000). The foremost argument in this challenge points to the ubiquity of informationaltext in society, necessitating early exposure to build background knowledge, vocabulary,awareness of different text structures and features, and other types of knowledge essentialfor full access to literacy. Affective and motivational reasons also have been advancedfor a greater emphasis on nonliterary texts (Doiron, 1994) as well as reasons relating toincreased reading achievement (Guthrie et al., 1998). Gender concerns reinforce the needfor more informational text, because evidence that boys are less enthusiastic about reading(particularly fiction) presents yet another serious challenge to the extensive use of fiction(Millard, 1997). Thus, there is a heightened awareness of the need for increased exposure toinformational texts in the early grades. Each of the changes in perspective and attitude thathave marked the history of commercial reading programs in the United States is mirrored inCanadian history (Phillips et al., 2005) and in the history of other countries (e.g., Littlefair,1991). Therefore, the analysis we present has significance and relevance much beyondCanada.
In current reading program guides, the inclusion of informational text is justified on thegrounds that it affords students the opportunity to read a variety of genres and languageforms. For example, the program overview for a Grade 6 unit of study found in the teacher’sguide Choosing Peace says: “An important part of the unit is to teach students to ‘read’graphics such as diagrams, charts, photos, and graphs—often an important component oftechnical information in other curriculum areas” (Nelson Language Arts, 1998, p. 63). Inmany teacher’s guides, reference also is made to the goal of developing cross-curricularlearning links. The Cornerstones program advances this principle as follows in its teacher’sguide for Grade 6:
Science Education

768 NORRIS ET AL.
Learning as an integrated whole has become a major philosophical understanding in thedevelopment of curriculum.... Each anthology contains science and social studies focusunits. These units create learning opportunities which introduce, reinforce, or revisit con-cepts evident in these curricula. The significant inclusion of non-fiction selections promoteslearning opportunities that allow educators to foster various cross-curricular connections.(Cornerstones Canadian Language Arts, 1999, pp. VI–VII)
In a preview of cross-curricular links in Level G of the Grade 2 teacher’s guide, wefind stated, “Activities develop scientific skills in observation, reading information text,researching, and record-keeping (e.g., charts, cycle diagrams)” (Nelson, 1999, p. 131). TheTeacher’s Resource Module for the Grade 5 unit Weather, wings, and kite strings claimedto “help students develop concepts pertaining to the understanding of
• weather with its changes in the seasons and conditions in the sky• birds and their habits in the wild and in relationship with people• flight and how people have made use of its principles with kites, planes, and hot air
balloons. (Collections, 1999, p. 2)
Are such claims warranted? Investigation into the types of text included in commercialreaders is limited. Most existing research predates the contemporary push for inclusion ofmore nonfiction and informational texts in literacy instruction (e.g., Flood & Lapp, 1987;Flood, Lapp, & Flood, 1984; Moss & Newton, 2002; Murphy, 1991; Schmidt, Caul, Byers,& Buchmann, 1984; Smith, 1991). Results of these studies point to a literary emphasison the materials contained in reading programs, but do not reveal whether publishers haveresponded to the more recent calls for greater diversity in genre choice. In particular, arestudents being exposed to text with a scientific context, and if so, how much exposure arethey receiving? Are they being taught to read scientific text? Except for findings reportedfrom our own research (Phillips et al., 2005; Smith et al., 2006), we know of no researchaddressing these questions.
Young Adults’ Reading of Science
High school and junior high school teachers generally assume that their students can readscientific and other nonfiction texts, although many students have great difficulty doing so(Peacock & Weedon, 2002). Moreover, when students graduate from high school, it isdesirable that they be able to read the sorts of science materials useful for lifelong learningof science and democratic participation. For example, it would be beneficial if they couldread media reports of science, notices of counterindications to drug therapies, proposalsfor environmental protection associated with a neighborhood development, and the like.There is also an assumption on the part of many teachers that learning to read takes placein primary and elementary school (Abell & Roth, 1992; Brickhouse, 1990; Heselden &Staples, 2002; Pappas, 2006). Such a belief lies at the root of a legendary, and perhapsfictional, high school teacher’s statement: “I assign reading; I don’t teach it.” Junior highschool and high school content area teachers, science teachers among them, simply do notsee the teaching of reading as part of their jobs (Wellington & Osborne, 2001).
However, several surveys of senior high school students and young adults belie theassumptions that the students can read scientific text. Research (e.g., Norris & Phillips,1994b; Phillips & Norris, 1999; Penney, Norris, Phillips, & Clark, 2003) has shown that,although senior high school and undergraduate university students tend to interpret correctlyobservation statements, statements of method, and predictions when they read science,
Science Education

LEARNING TO READ SCIENTIFIC TEXT 769
they show weakness in a number of other critical reading skills. Specifically, they tendto demonstrate a certainty bias, which leads to attributing a greater level of certainty tostatements than was actually reported, to confuse causal and correlational statements, toconfuse descriptions of phenomena with explanations of them, and to fail to distinguishevidence from conclusions based on the evidence. There is a pattern to these strengths andweaknesses. When the reading involves material that can be interpreted in isolation—factsabout what was observed or done, statements about the future (tense is a give away)—thenthey perform fairly well. When the reading requires integrating information from differentparts of the text and seeing the connections between them, they perform significantly lesswell.
Scientific Literacy
National science education goals in many countries presume a citizenry that can readbetter than is indicated in the studies cited in the previous section. To achieve these goals,it makes sense to start teaching in the early school years the skills necessary to read sciencecritically. We see some support for such teaching in national standards, both in the UnitedStates (National Research Council [NRC], 1996) and elsewhere (Council of Ministers ofEducation, Canada [CMEC], 1997; Millar & Osborne, 1998). For example, the NationalScience Education Standards (NSES; NRC, 1996) call for more than “science as process,” inwhich students learn such skills as observing, inferring, and experimenting. These standardsemphasize that inquiry is central to science learning. In addition, the standards documentclaims that scientific literacy has become a necessity for everyone because everyone needsto use scientific information to make life choices, everyone needs to engage intelligentlyin public discourse and debate about important issues that involve science and technology,and everyone deserves to share in the excitement and personal fulfillment that can comefrom understanding and learning about the natural world.
We endorse all of these goals. However, we have a nagging feeling that somethingis missing: nowhere in the NSES (NRC, 1996) is there a sense that reading (we shallconcentrate on reading, but much of what we say applies also to writing) is itself part ofscientific inquiry. This observation motivates a number of questions: When and how arepeople taught to use scientific information to make life choices? When and how are peopletaught to engage in public discourse? When educators use the term “scientific literacy,”do they consider that reading is somehow centrally involved? This is not just a questionrelevant to science education standards in the United States: it is also relevant in Canada(CMEC, 1997) and in the United Kingdom (Millar & Osborne, 1998).
Science educators and teachers accept that reading is involved at least as a tool forlearning and doing science. To demonstrate that reading is more centrally involved inscientific literacy than this, we need to look into the meaning of reading. Consider thefollowing simple view of reading as an opening hypothesis: Reading is being able to rec-ognize words correctly and to locate information in the text. There is strong reason tobelieve that teachers unwittingly foster this simple view of reading, despite over 5 decadesof research showing that skilled word recognition is not reading. “Although . . . skilleddecoding is necessary for skilled comprehension . . . decoding is not sufficient . . . Despitethe plethora of research establishing the efficacy of comprehension strategies instruction,very little comprehension strategies instruction occurs in elementary schools” (CollinsBlock & Pressley, 2002, pp. 384–385). Indeed, Pressley and Wharton-McDonald found itnecessary to challenge “the myth that children will be able to comprehend a text simplybecause they can decode words in it” (1997, p. 448). In children’s minds, the simple viewengenders a belief that “reading is being able to say the words correctly, a passage of
Science Education

770 NORRIS ET AL.
unrelated words [seems] just as readable as an intact passage” (Baker & Brown, 1984,p. 359). Teaching according to the simple view of reading leads students both to an in-flated view of their ability to read and to the impression that science does not have tomake sense. It does not attend to understanding, cannot distinguish cases of understandingfrom failure to understand, and does not resemble the reading that scientists do in theirwork.
Scientists read and write a great deal of the time. When reading, they puzzle over themeanings of what other scientists have written; question their own and other scientists’interpretations of text, sometimes challenging and other times endorsing what is written;and they make choices about what to read, how closely and critically to read, and aboutwhat to seek in their selections. When writing, they ponder phrasing that will capture whatthey mean, often constructing what they mean while they write; search for expressions thatwill carry the level of exactness they intend; choose words carefully to distinguish betweendegrees of certainty they wish to express; and select genres to describe what they did tocollect their data and to provide justifications for their methods (see Tenopir & King, 2004,for a thorough account of scientists’ reading and writing activities and preferences). Theseactivities of constructing, interpreting, selecting, and critiquing texts are as much a part ofwhat scientists do as are collecting, interpreting, and challenging data. These activities withtext are as much a part of scientific inquiry as are observation, measurement, and calculation.All the activities rely on interpretation and understanding, not just on recognizing words andlocating information. Yet much of the reading in science instruction deals with texts in waysthat do not foster the sort of critical reading that we are contemplating (Ford, Brickhouse,Lottero-Perdue, & Kittleson, 2006; Kesidou & Roseman, 2002; Rowell & Ebbers, 2004).
Given the complexity of these literacy activities, we propose an alternative definition ofreading that fits well with traditional goals of science education. Returning to what scientistsdo when they read, we can see that interpreting a text is a complex task: taking into accountall the relevant information; applying criteria for judging the adequacy of interpretations;and judging whether a proposed interpretation explains the text and is consistent with knownfacts, whether alternative interpretations are inconsistent with known facts, and whether theproposed interpretation is plausible. This is inquiry. So, we conclude, reading is inquiry—analyzing, critiquing, and interpreting text involves the principled interpretation of textby a reader who infers meaning by integrating text information with relevant backgroundknowledge.
Reading is best understood as a constructive process. However, we reject the relativismassociated with some versions of constructivism. Readers should adopt a critical stancetoward text by engaging in interactive negotiation between the text and their backgroundbeliefs in an attempt to reach an interpretation that, as consistently and completely aspossible, takes into account the text information and their background beliefs (Phillips &Norris, 1999). It is in the fashioning of interpretations that our position is constructivist,and in the fashioning under constraints of consistency and completeness that our positionis not relativistic. We, thus. see reading as the principled interpretation of text.
According to a simple view, reading is knowing all the words and locating informationin the text. By contrast, we maintain that reading is not a simple concatenation of wordmeanings; is not characterized by a linear progression or accumulation of meaning as thetext is traversed from beginning to end; and is not just the mere location of information.Rather, reading depends upon background knowledge of the reader, that is, on meaningsfrom outside the text; it is dependent upon relevance decisions all the way down to the levelof the individual word (Norris & Phillips, 1994a); and it requires the active construction ofnew meanings, contextualization, and the inferring of authorial intentions (Craig & Yore,1996). In short, reading shares the features of all inquiry (Norris & Phillips, 1987).
Science Education

LEARNING TO READ SCIENTIFIC TEXT 771
If reading is as expansive as we describe, then reading involves many of the same mentalactivities that are central to science (Gaskins et al., 1994). Moreover, when the reading isof science text, it encompasses a very large part of what is considered doing science. It isnot all of science, because it does not include the manipulative activities and working withthe natural world that are so emblematic of science. However, the relationship betweenreading and science is intimate. If science teachers continue to show little concern for text,see reading as merely a tool to get to science, or see reading as unimportant, then they arelikely unwittingly to underestimate the complexity of reading in science.
We can now answer more clearly the question of whether reading is centrally involved inscientific literacy. We find it useful to distinguish between scientific literacy in its derivedsense, referring to scientific knowledgeability and being learned and educated in science,and scientific literacy in its fundamental sense, referring to the ability to read and writewhen the content is science (Norris & Phillips, 2003). Usually, it is the derived sensethat is meant: the fundamental sense is overlooked. However, it is scientific literacy in thefundamental sense that makes it possible to have scientific knowledge in the first place. Thatis why it is fundamental. The upshot is that, if scientific literacy is a goal, then an importantplace to start achieving it is to teach reading and writing in the context of science. Beingable to read (i.e., analyze, critique, and interpret text) when the content is science is whatis required “to use scientific information to make life choices,” and “to engage intelligentlyin public discourse and debate about important issues that involve science and technology,”which the NSES claims are primary reasons for teaching science. Therefore, thinking ofreading as inquiry helps to clarify what some National Science Education Standards meanand to thereby think more concretely about how they might be achieved. It is this sense ofreading that we had in mind when we analyzed the commercial reading programs.
GENERAL METHOD
Data Sources
The ministries of education in all 10 Canadian provinces and 3 territories were askedto identify the current and most extensively used commercial reading programs in Grades1–6. Each jurisdiction identified at least one of the following programs: (a) CornerstonesCanadian Language Arts by Gage Educational Publishing Company (1998–2001), (b)Collections by Prentice Hall Ginn Canada (1996–2000), and (c) Nelson Language Arts byNelson Thomson Learning (1998–2001). At the time of writing, these programs were thosesupplied by each publisher. Complete program sets were obtained for this research. Each setcontained teacher’s guides and student books. The content contained in the student booksand teacher’s guides was the focus of this investigation. Neuendorf’s Content AnalysisGuidebook (2002) was used as a source for procedures.
Development of Classification and Coding Frameworks
For each of the eight research questions, a classification or coding scheme was developed.These schemes were used to classify selections and parts of selections in each of the studentbooks as follows:
1. containing or not containing scientific content,2. proportion of scientific content,3. genres of text,4. areas and topics of scientific content,5. scientific accuracy of the content,
Science Education

772 NORRIS ET AL.
6. text features,7. types of instructional guidance, and8. types of assessment techniques.
The detailed procedures and reliability of classification are described for each questionunder the following Specific Procedures, Results, and Discussion sections.1
SPECIFIC PROCEDURES, RESULTS, AND DISCUSSION(TEXTUAL QUESTIONS 1–6)
Unit of Analysis
In addition to teacher’s guides and a variety of ancillary materials, each reading programcontained a set of student books (anthologies). There were at least two student books pergrade for each publisher and a total of 72 books across the six grades and three programs.Each student book comprised several selections, each identified by its own title, much aschapters in an edited book. The selections ranged in length from a page or two to ten pagesor so, with the longer selections tending to fall into the higher grades.
All selections in each publisher’s anthology were inventoried by grade. Each selection inthe student books was associated with instructional materials in the teacher’s guides. Thesematerials included directions and suggestions related to all aspects of literacy, includ-ing reading instruction, writing instruction, assessment, text extensions through additionalinformation, project work, instructional modifications to address various student and con-textual needs, links to the home, and integration with other curricular areas. Sometimesmore than one selection was associated with the same instructional material. However,each selection was considered separately as a unit for analysis. There were 1,106 selectionscoded for this investigation.
Presence of Scientific Content
We reviewed Benchmarks for Scientific Literacy (American Association for the Advance-ment of Science [AAAS], 1993), the Common Framework of Science Learning Outcomes(CMEC, 1997), the National Science Education Standards (NRC, 1996), and Science forAll Americans (AAAS, 1994) to determine the potential usefulness of each as a sourceof criteria by which to judge whether selections contained or did not contain scientific ortechnological content. We decided to include technology as well as science in our search be-cause it is so frequent nowadays to find the two associated in curricula and national scienceeducation documents. The NSES was selected as the primary resource document, because itincludes the clearest and most concise set of science content statements for the elementarygrades as well as a classification of these statements into categories and subcategories thatare easily distinguishable from one another. For example, the category, Physical Science,contains the subcategories, Properties of Objects and Materials; Position and Motion ofObjects; and Light, Heat, Electricity, and Magnetism. The NSES was supplemented using
1 Different combinations of the authors worked on each question under the oversight of Norris andPhillips. Guilbert and Stange worked most closely with the programs to identify the presence and proportionof scientific content in the selections, the areas and topics of science, and the use of text features. Their codingsystems and judgments were corroborated in discussions with Norris and Smith. Smith, in collaborationwith Norris and Phillips, took primary responsibility for the genre categorization and identification ofinstructional guidance and assessment techniques and the work of four student coders. Finally, Bakerand Weber, under Norris’ oversight, took primary responsibility for coding the scientific accuracy of theselections, including the development of needed classification schemes.
Science Education

LEARNING TO READ SCIENTIFIC TEXT 773
TABLE 1Categories, Subcategories, and Keywords for Classifying Science Content
1. Life sciencea. Characteristics of organisms (basic needs, structures and functions, senses)b. Life cycles of organismsc. Organisms and their environments (ecosystems and survival, patterns of behaviorrelated to environment, changes in environments)d. Diversity and adaptation of organisms (adaptation and extinction)
2. Physical sciencea. Properties of objects and materials (observable properties, interactions of materials,states of matter)b. Position and motion of objects (forces [pushing or pulling], sound and vibration)c. Light, heat, electricity, and magnetism
3. Earth and space sciencea. Properties of earth materials (rocks and minerals, soils, fossils, surface changesof the earth)b. Objects in the sky (properties of planets and stars, patterns of movement)c. Weather (characteristics, changes and systems, water cycle)
4. Understanding technologya. Engaging in technological design (students as technologists)b. Understanding technology (technology as problem solving, effects of technology)c. Confirmation activity
5. Understanding sciencea. Engaging in scientific inquiry (students as scientists)b. Nature of science (types of investigations, interpreting and explaining data,evaluating results)c. History of scienced. Science as a human endeavor (scientists have various backgrounds)e. Confirmation activity
6. Science in personal and social perspectivesa. Health (nutrition, disease, personal responsibility)b. Characteristics and changes in populations (population density, effect on resourcesand the environment)c. Types of resources (material and nonmaterial, renewable and nonrenewable,personal actions to conserve resources)d. Changes in environments (natural or influenced by humans, pollution, caring forliving things and their habitats)
the Common Framework of Science Learning Outcomes and further modified as describedbelow to yield the category system displayed in Table 1.
To make distinctions as sharply as possible, we based classifications on whether theselection developed the concepts contained in the NSES statements. For example, whereasa selection about butterflies sitting in a tree was initially judged as falling into the LifeScience subcategory Organisms and their Environments (1c), the selection did not developto any extent the following concepts listed in this subcategory:
An organism’s patterns of behavior are related to the nature of that organism’s environment,including the kinds and numbers of other organisms present, the availability of food andresources, and the physical characteristics of the environment. When the environmentchanges, some plants and animals survive and reproduce and others die or move to newlocations. (NRC, 1996, p. 129)
In this and similar cases, the selection was classified as not containing scientific content.
Science Education

774 NORRIS ET AL.
We read all the Grade 4 selections and discussed why each should be judged to contain,not contain, or maybe contain science content. These judgments led to modifications inthe framework. A subcategory, Weather (3c), was added to the Earth and Space Sciencecategory to capture subject matter appearing in the selections that otherwise would bedifficult to categorize. All statements related to geology were placed in the Properties ofEarth Materials subcategory (3a), and those related to Objects in the Sky (3b) were subsumedunder that heading. Changes were made to categories and subcategories related to doingscience and understanding science and technology to consolidate like statements and makethe categories roughly parallel. The single Science and Technology category was dividedinto two: Understanding Science (5) and Understanding Technology (4). The categories,History (5c) and Nature of Science (5b), were incorporated into the new UnderstandingScience category. Two subsections were renamed to better indicate their emphasis onstudents engaged in doing: Solving Technological Problems was renamed Engaging inTechnological Design, and placed under Understanding Technology (4a), and the Scienceas Inquiry subcategory was renamed Engaging in Scientific Inquiry and placed under thenew Understanding Science category (5a). The subcategory, Confirmation Activity, wasadded to both the Understanding Science (5e) and the Understanding Technology (4c)categories. Confirmation activities are those in which a scientific idea is presented andstudents are asked to confirm this idea. Finally, because no selections were found to containcontent related to the category, Unifying Concepts and Processes, it was deleted. The finalcategories, subcategories, and keywords used for classifying science content can be foundin Table 1.
The framework in Table 1 was used to categorize the entire set of 1,106 selectionsacross the six grades. There were 98 challenging cases where categorization demandedextra discussion for resolution. An effort was made to reduce to a minimum the numberof “maybe” categorizations. This reduction was facilitated by having discussions on theprecise wording of the NSES statements, and by deciding to categorize as containingscientific content any selections that contained even a marginal amount of science. Wesubsequently coded each selection containing scientific content for the proportion that wasscience (as described in the following section). In the end, only six selections remained inthe “maybe” category, defying our efforts to decide definitively on their status as containingscientific content or not. They were not included in our analysis. We also were faced withselections that have an underlying scientific idea, but which did not directly state or explainany scientific content. We coded such selections “no.” For the final coding, agreement wasfound on all cases.
The complete data on this analysis have been reported previously (Smith et al., 2006).Across both grade and publisher, slightly more than one fifth (21.5%) of the selectionscontained science. The Grade 1 and 2 programs tended to contain the smallest proportionof science selections (at 17%, excluding Cornerstones Grade 1), the anomaly being Cor-nerstones Grade 1 at 33%. Grades 3–6 had a larger and almost the same proportion ofscience selections, ranging from 20% to 24%. These results suggest that there is oppor-tunity provided by these commercial reading programs for teaching reading in science, atleast judging by the number and proportion of selections containing scientific content. Onepossible concern, with the exception of the anomalous Cornerstones Grade 1 program, isthat the proportion of scientific content in Grades 1 and 2 is considerably lower than Grades3–6. We do not know whether the delayed emphasis on science has any bearing upon thedocumented decline in interest in science beginning at about the age of 10 years (Bordt,de Broucker, Read, Harris, & Zhang, 2001), and whether it leads to reading difficulties inthe area, but we, like others (e.g., Ford et al., 2006; Kesidou & Roseman, 2002), expect itcould.
Science Education

LEARNING TO READ SCIENTIFIC TEXT 775
Proportion of Scientific Content
Ranges for characterizing the proportion of scientific content were defined. Using thesefive ranges (1%–12%, 13%–37%, 38%–62%, 63%–87%, and 88%–100%) allowed everyselection containing any amount of science content to be categorized as “yes,” whileindicating the prevalence of science content therein.
Regarding the percentage of science in narrative selections, we decided that if the non-scientific elements in the narrative were necessary to justify or make sense of the sciencecontent in the selection, then the entire narrative could be considered science. For example,a Grade 3 narrative about a mother and daughter experiencing a solar eclipse (Collections,1998, pp. 23–27) contains statements, some made by the mother and some made by thenarrator, describing and explaining an eclipse: “A solar eclipse happens when the moonpasses between the sun and the Earth” (p. 23); “It takes about two hours” (p. 24); “Littleby little the cloudy sky darkened” (p. 26); “darkness lasted only a few moments” (p. 27).The science was so deeply embedded in the story that it could not be understood withoutthe surrounding narrative to draw attention to the focus of the statements.
However, if parts of the narrative could be removed without affecting the sense one couldmake of the science, then the selection would be placed in one of the lower proportions ofscience content. For example, a Grade 4 selection about two boys caught in a severe thun-derstorm (Collections, 1996, pp. 63–69) contained only one piece of scientific information,namely, that the light from the lightning reaches the observer before the sound. This factcould be grasped without the entire surrounding story, by simply extracting the section inwhich one of the boys counts off the seconds between the flash and the thunder.
The interrater reliability we established for initial coding of proportion of science contentwas 82%. All differences were resolved for the data reported here. Table 2 shows thepercentage of science selections falling into each of the content ranges. The data show thatin two thirds of the selections in which science content was contained, the selections werepredominantly science (≥88%). In only a minority of the selections containing sciencewas a small proportion of the space devoted to science. We take this trend to be favorableto the teaching of reading in science, because extended scientific text allows for a moreconcentrated focus on science-reading instruction. Had the results shown, for example, thatmost of the selections contained only 1%–12% science, then students would have facedsnippets of science text and a much reduced opportunity for learning to read science.
Genres
The genre of each selection was analyzed and coded. In developing a genre classificationframework, we first examined other studies (e.g., Flood & Lapp, 1987; Flood et al., 1984;Moss & Newton, 2002; Murphy, 1991; Schmidt et al., 1984; Smith, 1991). To optimize
TABLE 2Percentage of Science Selections Falling Into Each Content Range
Content Range (%) Percent Selections
1–12 713–37 1038–62 863–87 888–100 67
Science Education

776 NORRIS ET AL.
comparisons across time and to build on previous research, we utilized a methodologysimilar to that devised by Flood and his colleagues (1984, 1987).
Five genres are relatively uncontroversial and can be found in most previous studies oftext types in basals: narrative, poetry (including song), play (including readers’ theater),biography or autobiography, and expository. In light of the problems we encountered inattempting to classify text using only these designations, we added five major categories toour text-coding scheme. A multiple text category was added to accommodate those selec-tions that included more than one major genre with neither dominant, such as a text thatincluded a narration, followed by an exposition, followed by another narration. A hybridcategory covered selections in which there was a form–function disjuncture, most often anarrative or poem with an informational function, such that the form (say, a poem) wouldlead the reader to expect a literary purpose (e.g., providing entertainment or describing amoral) but the purpose is also to impart information (e.g., about the function of variousanimals’ tails). Pictorial texts were defined as wordless pieces such as photo-essays andrepresentations of artwork that were not part of a larger text. Patterned texts are repeatedstrings of text with some word/phrase substitutions; these repetitions of text patterns gener-ally show little meaning development. Finally, like Murphy (1991), we included an “other”category to deal with a wide variety of low-frequency text forms such as interviews, diaryexcerpts, letters, reproduced advertisements, and resumes.
The categorization scheme was developed using an iterative procedure. The final codingscheme was adopted only after we reached agreement on the interpretation of the categories,and high levels of interrater reliability were demonstrated. All selections were dividedbetween two trained student coders in a stratified random manner that ensured that selectionsfrom each grade and publisher were equally represented with each coder. After all theselections had been coded, a random sample of 10% of the selections from each grade andpublisher was chosen. Using a match–mismatch interrater reliability procedure, agreementon major genre categories was determined to be 84%.
The range and variety of genres for both science and nonscience selections are foundin Table 3. A majority of the science selections were expository, 10% were narrative, 6%poetry, and 12% hybrid. There were clear differences between the science and nonscienceselections. About one third of the nonscience selections were narrative, and about anotherone third poetry, placing nearly two thirds of the nonscience selections into a literarycategory. Only 9% of the nonscience selections were expository. There was a broader rangeof genre types represented in the nonscience selections, given that the science selectionscontained no plays or pictorial texts.
TABLE 3Percentage of Science and Nonscience Selections by Genre
Genre Science Selections Nonscience Selections
Narrative 10 33Poetry 6 32Play 0 2Auto/biography 2 3Pictorial text 0 2Patterned text 1 3Expository 55 9Multiple genres 7 5Hybrid 12 4Others 6 8
Science Education

LEARNING TO READ SCIENTIFIC TEXT 777
Some implications for instruction are clear. Given the dominance of expository text inthe science selections, and the comparative absence of narrative and poetry, instruction forreading success in the science selections needs to focus on different strategies than neededin the nonscience selections. The phenomenon here is very interesting: Change of topic(nonscience to science) is correlated with change of genre (literary to expository). If thechange of topic is not also accompanied by a change in instructional focus, then the chanceof reading success in the science selections will be diminished. Many studies have shownthat young readers find it harder to read expository text than other genres (Graesser, 1981;Graesser, Hauft-Smith, Cohen, & Pyles, 1980; Voss, Wiley, & Sandak, 1999; Zabrucky &Moore, 1999), although in a recent analysis we concluded that the evidence was not clear-cut(Norris, Guilbert, Smith, Hakimelahi, & Phillips, 2005). Nevertheless, we believe there is arisk that comparative reading difficulty and lack of reading success might become associatedin children’s minds with science, which is so commonly paired with expository text that asshown by at least some evidence they find more difficult to read. We acknowledge, as well,that the expository category covers a variety of text forms and purposes, such as description,argumentation, and cause–effect reasoning, that would need to be analyzed separately foreffective instruction to be devised.
Scientific Areas and Topics
We classified the content in each of the 238 science selections according to the frame-work in Table 1. Many of the selections contained content found in two or more of thesubcategories. We decided to classify the primary focus, and up to and including the ter-tiary focus, if such were present. The best ordering of primary, secondary, and tertiary focisometimes was not apparent. In these cases, a final decision depended on the overarchingtheme of the selection. We proceeded through this coding process grade by grade, makingfurther refinements to the classification framework to improve interrater reliability. Whennecessary, the student coders would return to their earlier work and recode selections toreflect changes made while they engaged in this iterative process. Most of the disagreementsover the primary focus were over the subcategory classifications of Table 1 and not over themain categories. After completing the classification of the science content in all 238 scienceselections, total agreement (agreement on primary, secondary, and tertiary foci, includingorder) was found for 60% of the selections. There was 77% agreement on the primaryfocus, and agreement on two of the three foci (disregarding order) 95% of the time. Alldisagreements were resolved through discussion for the final coding reported in Table 4.
Life science concepts clearly predominate, being the primary focus in two fifths of theselections, and either a secondary or a tertiary focus in another one fourth. Understandingtechnology was the primary focus in about one fourth of the cases. Physical scienceconcepts were found much less frequently, even as secondary or tertiary foci. Only 50% ofthe selections had more than a primary focus, and only 17% had three or more foci.
The reasons for the very unequal distribution across science categories are unknown.Certainly, there are enough topics in the physical, earth, and space sciences for the dis-tribution to have been uniform or more nearly uniform. A more equal distribution wouldbe our preference for reasons of representing accurately the range of science and also forexposing students to a greater range of scientific vocabulary and concepts.
Scientific Accuracy
We developed two analytic tools: a typology of inaccuracies and a severity of inaccuracyindex. We began developing the typology of inaccuracies by examining a small number of
Science Education

778 NORRIS ET AL.
TABLE 4Percentage of the 238 Science Selections in Each Science Category byLevel of Focus
Level of Focus
Science Category Primary Secondary Tertiary
Life science 41 20 5Physical science 4 7 1Earth and space science 12 5 1Understanding technology 23 4 3Understanding science 7 9 4Science in personal and social perspectives 12 5 3Total 99a 50 17
aRounding produced a percentage less than 100%. All selections had a primary sciencefocus.
selections from the Grade 4 program and gradually moved outward toward higher and lowergrades, again by examining a small number of selections from each. The aim was to identifyall inaccuracies and to classify them according to type. An initial draft was developed onthe basis of 12 selections. This draft was then applied to a new set of selections and revisedas necessary. Several iterations of this sort were conducted until the version of the toolfound in Table 5 was developed. This version was then applied to the analysis of all thescience selections.
The severity of inaccuracy index consisted of a three-point scale: minor inaccuracies(comprehension likely unaffected), moderate inaccuracies (comprehension moderately af-fected), and major inaccuracies (comprehension severely affected). Each inaccuracy wasassigned to a point on this scale. Note that the application of the severity index requiredjudgments of how the comprehension of children at the grade level targeted by the readingselections under analysis likely would be influenced by the accuracy of the selection, butwe conducted no independent, objective tests of children’s comprehension.
To make the severity of inaccuracy judgments as credible as possible in the context, wetook two steps. The first step was to limit the scale to three points so that fine distinctionswould not be required. The second was to rely upon the two reading experts among theauthors whose combined years of experience in clinical reading settings provided thebackground to make these educated and informed judgments. Nevertheless, the judgmentsare predictions that call for confirmation with direct empirical studies of children.
Table 6 provides the frequencies of inaccuracies by order of their occurrence in theselections. We report only up to the first five errors in any selection (only two selections hadmore than five inaccuracies). Across the 238 selections, there were 277 inaccuracies. Wehave not attempted in this paper to interpret the significance of the order of occurrence of theinaccuracies. Such significance could exist, for example, in the compounding of possiblestudent misconceptions through the repetitions of the same inaccuracy in a selection.Significance of order could also exist in one inaccuracy being contradicted by a subsequentinaccuracy. For our purposes here, we interpret the data as follows: 145 of the 238 selectionscontained at least one inaccuracy, 71 at least two inaccuracies, and so on. Only six selectionshad at least five inaccuracies. We categorized the inaccuracies into nine types, with a tenth“other” category for inaccuracies we did not know quite how to categorize. The mostfrequent inaccuracy was oversimplification, when the attempt to simplify resulted in error(interpreted at the grade level of the selection). The next most frequent inaccuracy was
Science Education

LEARNING TO READ SCIENTIFIC TEXT 779
TABLE 5Typology of Inaccuracies
Omission of definitions/labels/etc.a. Unfamiliar words, scientific instruments, careers, concepts are not defined
(e.g., “technologist”)b. Labels omitted from diagrams, etc.
Misuse/inappropriate use of terminology/concepts• Term(s) are used incorrectly (e.g., “force” to mean “velocity”)
Oversimplification of concepts• Simplifying concepts resulted in making them incorrect (e.g., sun described as
exploding ball of gas)Incorrect facts
• Established scientific facts are misrepresented (e.g., bacteria called plants)Cannot confirm information
• Authenticity of information could not be verified (e.g., could not verify thatlizards use tongues to clean)
Personification• Human characteristics are given to nonhuman subjects (e.g., personified feelings
of a wounded wolf)Visual inaccuracy
• Pictures, illustrations, and diagrams contain misrepresentations (e.g., geesepictured flying in a heart-shaped pattern)
STSE inaccuracy• STSE issues/concerns are falsely represented or not included
Omission of NOS/inquiry or missed NOS/inquiry opportunitya. Laboratory experiences/activities had the opportunity to meet NOS/inquiry
standards but failed to do sob. Misrepresentation of NOS (e.g., science must be true)
Others• Any inaccuracy that does not fit the above categories
NOS, nature of science; STSE, science–technology–society–environment.
TABLE 6Frequency of Inaccuracies by Order of Occurrence
Order of Occurrence
Inaccuracy First Second Third Fourth Fifth Total Proportion
Omission of definitions 22 16 8 4 1 51 0.18Misuse of terminology 12 7 2 2 0 23 0.08Oversimplification 31 16 6 5 2 60 0.22Incorrect facts 30 7 8 2 1 48 0.17Cannot confirm information 15 9 5 3 1 33 0.12Personification 5 4 1 0 0 10 0.04Visual inaccuracy 17 6 1 0 0 24 0.09STSE inaccuracy 4 2 1 0 1 8 0.03Omission of NOS 4 1 0 2 0 7 0.03Others 5 3 4 1 0 13 0.05Total 145 71 36 19 6 277 1.00
NOS, nature of science; STSE, science–technology–society–environment.
Science Education

780 NORRIS ET AL.
TABLE 7Frequency of Inaccuracies by Severity
Order of Occurrence of Inaccuracy
Severity First Second Third Fourth Fifth Total Proportion
Minor 99 47 24 13 5 188 0.68Moderate 36 18 10 4 0 68 0.25Major 10 6 2 2 1 21 0.08Total 145 71 36 19 6 277 1.00
omission of definitions—the failure to define unfamiliar concepts and to label diagrams.Next in frequency were incorrect facts, the contradiction of established scientific facts.The least frequently occurring inaccuracies were omission of nature of science (NOS) andscience–technology-society–environment (STSE). Some inaccuracy types were repeated:for example, in one selection there were five omissions of definitions, in two selectionsthere were five instances of oversimplification. All types of inaccuracy occurred at leasttwice in at least one selection.
Table 7 provides the frequency of inaccuracies by their severity. The majority, 68%, ofinaccuracies were minor, and only 8% were major, that is, 21 of the 277 inaccuracies weremajor.
Table 8 gives the frequency and proportion of inaccuracies by primary science focus.Recall that we reported up to three levels of science focus for selections, primary, secondary,and tertiary (for details, see Table 4). Data of Table 8 are based upon only the primaryfocus. The greatest number of inaccuracies occurred in the selections with life science asthe primary focus, and the least number in physical science selections. The proportion ofinaccuracies within science foci varied considerably. For example, the greatest proportionof inaccuracies for most foci was oversimplification. However, misuse of terminology wasmuch more prominent in the physical science selections, visual inaccuracy much moreprevalent in life science and understanding technology selections, and so forth.
Table 8 does not control for differences between the total number of pages containedin selections under each science focus. The total number of pages across all selectionswas 1205.5. Of these, the life science selections contained 43%, physical science 3%,earth and space science 13%, understanding technology 23%, understanding science 7%,and science in social and personal perspectives 11%. Table 9 projects the frequency ofinaccuracies under each science focus on the basis of two assumptions: (i) each of the sixfoci contains the same proportion of the total number of pages, that is 0.167, and (ii) thefrequency of inaccuracies within each science focus is directly proportional to the numberof pages contained by the focus. Given that the focal areas with the least number of pages(physical, earth, and space sciences) tended to have the highest rate of inaccuracies, andthe focal area with the most pages (life sciences) had the lowest rate of inaccuracies, animmediate effect of devoting the same number of pages to each focal area would be anincrease in the total number of inaccuracies from 277 to 323. Note, also, that it is physicalscience and not life science that now has the greatest number of inaccuracies at double thatfor life science. Indeed, under these normalized figures, the life science selections containthe fewest inaccuracies of all focus areas. Earth and space science is second in number ofinaccuracies, and the remaining three focus areas are roughly equivalent.
In sum, there was just over a single (1.2) inaccuracy per selection on average, which wejudge to be minimal, although of course we would prefer none at all. Of the inaccuraciesthat were identified, more than two thirds were of a minor nature, and fewer than 10% major.
Science Education

LEARNING TO READ SCIENTIFIC TEXT 781
TAB
LE
8F
req
uen
cyan
dP
rop
ort
ion
of
Inac
cura
cies
byP
rim
ary
Sci
ence
Fo
cus
Prim
ary
Sci
ence
Foc
us
Ear
th/S
pace
Und
erst
andi
ngU
nder
stan
ding
Per
sona
l/Soc
ial
Life
Sci
ence
Phy
sica
lSci
ence
Sci
ence
Tech
nolo
gyS
cien
ceP
ersp
ectiv
es
Inac
cura
cies
Freq
uenc
yP
ropo
rtio
nFr
eque
ncy
Pro
port
ion
Freq
uenc
yP
ropo
rtio
nFr
eque
ncy
Pro
port
ion
Freq
uenc
yP
ropo
rtio
nFr
eque
ncy
Pro
port
ion
Tota
l
Om
issi
onof
defin
ition
s17
0.18
20.
157
0.14
120.
188
0.40
50.
1451
Mis
use
ofte
rmin
olog
y7
0.08
40.
316
0.12
20.
032
0.10
20.
0523
Ove
rsim
plifi
catio
n22
0.24
50.
3812
0.24
150.
233
0.15
30.
0860
Inco
rrec
tfac
ts18
0.20
10.
0810
0.20
110.
171
0.05
70.
1948
Can
notc
onfir
min
form
atio
n7
0.08
00.
005
0.10
40.
063
0.15
140.
3833
Per
soni
ficat
ion
30.
030
0.00
30.
063
0.05
00.
001
0.03
10V
isua
lina
ccur
acy
120.
130
0.00
00.
009
0.14
10.
052
0.05
24S
TS
Ein
accu
racy
10.
011
0.08
10.
022
0.03
10.
052
0.05
8O
mis
sion
ofN
OS
10.
010
0.00
20.
043
0.05
10.
050
0.00
7O
ther
s4
0.04
00.
003
0.06
50.
080
0.00
10.
0313
Tota
l92
1.00
131.
0049
1.00
661.
0020
1.00
371.
0027
7
NO
S,n
atur
eof
scie
nce;
ST
SE
,sci
ence
–te
chno
logy
–so
ciet
y–
envi
ronm
ent.
Science Education

782 NORRIS ET AL.
TAB
LE
9F
req
uen
cyo
fIn
accu
raci
esby
Pri
mar
yS
cien
ceF
ocu
sN
orm
aliz
edby
Eq
ual
izin
gTo
talN
um
ber
of
Pag
esin
Eac
hF
ocu
s
Prim
ary
Sci
ence
Foc
us
Life
Phy
sica
lE
arth
/Spa
ceU
nder
stan
ding
Und
erst
andi
ngP
erso
nal/S
ocia
lIn
accu
raci
esS
cien
ceS
cien
ceS
cien
ceTe
chno
logy
Sci
ence
Per
spec
tives
Tota
l
Om
issi
onof
defin
ition
s7
119
919
862
Mis
use
ofte
rmin
olog
y3
228
15
342
Ove
rsim
plifi
catio
n9
2815
117
574
Inco
rrec
tfac
ts7
613
82
1146
Can
notc
onfir
min
form
atio
n3
06
37
2140
Per
soni
ficat
ion
10
42
02
9V
isua
lina
ccur
acy
50
07
23
17S
TS
Ein
accu
racy
06
11
23
14O
mis
sion
ofN
OS
00
32
20
8O
ther
20
44
02
11To
tala
3672
6348
4856
323
NO
S,n
atur
eof
scie
nce;
ST
SE
,sci
ence
–te
chno
logy
–so
ciet
y–
envi
ronm
ent.
a Rou
ndin
gto
zero
deci
mal
plac
esha
sre
sulte
din
som
eto
tals
appe
arin
gin
corr
ect.
Science Education

LEARNING TO READ SCIENTIFIC TEXT 783
Although the life science selections had the greatest number of inaccuracies and the physicalscience selection the least, the order was reversed when total length of the selections ineach focus was taken into account, because the life science selections contained 43% ofthe total number of pages compared to 3% for the physical science selections. The mostfrequent inaccuracies had to do with omitting definitions of new concepts, oversimplifyingmaterial to the point of error, and making outright errors of fact.
Text Features
Text features refer to aspects of the selections, not including the ordinary (nonscientific)meanings of words and sentences, that required students’ interpretations. We began ourexamination of the selections looking for four text features and with an openness to identifyothers: scientific vocabulary, diagrams, charts, and illustrations. We sampled the selectionsand searched the literature (e.g., Hoyt, 2002; Hoyt, Mooney, & Parkes, 2003; Mallett, 2003;Penney et al., 2003) to develop a more extended list of features that was comprehensive andupon which we could reach settled interpretations and high agreement between the coders.The final set of text features is contained in Table 10.
TABLE 10Text Features and Their Meanings
Feature Meaning
Photos Obvious meaning and applicationIllustrations
Exact Highly detailed or lifelike: the illustrator has portrayedobjects as closely as possible to how they appear inthe world
Realistic Approach lifelikeness but do not reach itStylized Reflect the illustrator’s style through exaggerated
features, use of whimsical or imaginative depictionsDiagrams Depict structures, processes, or relationships
(cross-sectional drawings, maps, flowcharts)Charts, graphs, and tables Contain numerical content and depict numerical
relationshipsCaptions Titles or short annotations accompanying photographs,
diagrams, illustrationsLabels Shorter than a caption; names rather than describesScientific vocabulary Terms that refer specifically to scientific concepts,
processes, or methodsScientific metalanguage Terms for speaking about science (law, hypothesis,
prediction, inference, observe, method, etc.)Highlighted scientificvocabulary
Bold, italics, color change, enlarged font
Highlighted scientificmetalanguage
Bold, italics, color change, enlarged font
Glossary Explains the author’s understanding of terms;pronunciation guide
Headings and subheadings Obvious meaning and applicationLists Bulleted; numberedSeparated text Information standing on its own, but related to the main
part of the selection (side bars, text boxes, fact boxes,bubbles)
Science Education

784 NORRIS ET AL.
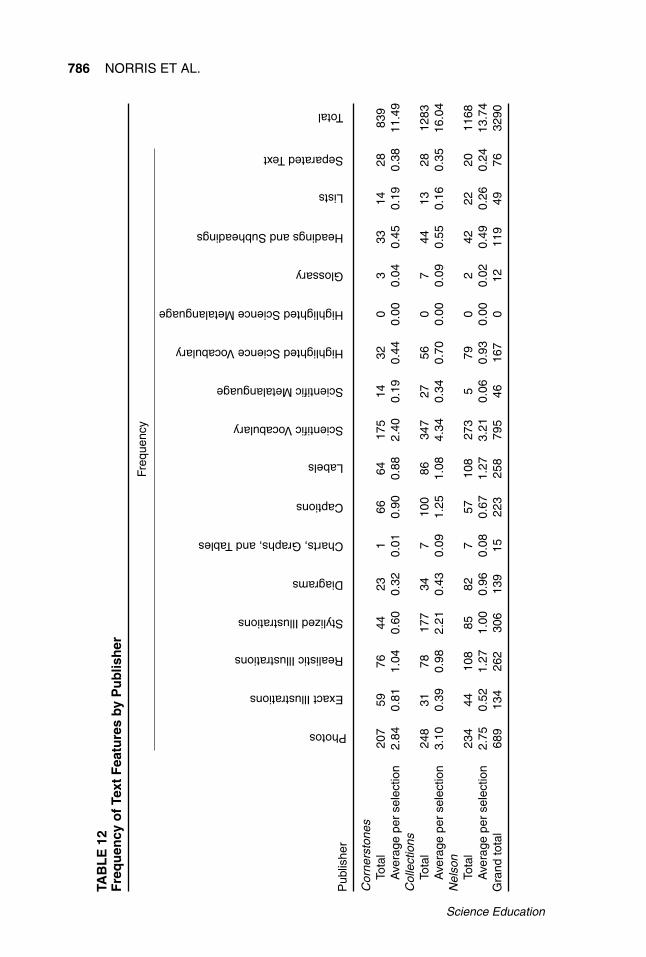
Table 11 presents data on the frequency and occurrence of the text features describedin Table 10 by grade level. Table 12 presents the same data organized by publisher. FromTable 11, we see from the extreme right-hand column that the total number of text featuresincreased dramatically from Grades 1 and 2 to Grade 3 and remained at a higher, thoughsomewhat diminished, level for the remaining three grades. This increase was not entirelydue to the increase in number of selections in the higher grades. Although Grade 2 hadby far the fewest selections and Grade 6 the most, all other grades had approximatelythe same number of selections. The increasing length of selections with grade does notentirely explain the increase in text features either. Although the occurrence of text featuresapproximately double from Grades 1 and 2 to Grades 3–6, the total number of selectionpages increased by only approximately 40%. Also, the correlation between number of textfeatures and number of selection pages across the six grades is about .70, which is less thana 50% overlap in variance. Neither is the increase in text features related to differences ingenre distribution across the grades, as we have shown elsewhere (Phillips et al., 2005):the percentage of narrative text found in these programs is almost identical for Grades 1,4, 5, and 6, with about a 30% increase in Grades 2 and 3; the percentage of expository textis lowest in Grade 1 and almost equal for the other five grades. In either case, there is noradical genre transition between Grades 2 and 3 at the point of the dramatic increase in textfeatures. A possibly better explanation for the increase in text features is that publishersand authors assumed that older children were more able than younger ones to deal withthe added interpretive demands of multiple text features. Such an assumption, if made,would not be obviously justified by the evidence. Increased competence with age might beexpected if instruction in interpreting text features were given, but without instruction it isquite possible for children to grow older without any increased sophistication of readingtext features.
By far the two most frequent text features were scientific vocabulary and photos. Il-lustrations taken as a group were approximately as frequent as photos. Use of scientificvocabulary increased about threefold or fourfold after Grade 2. The occurrence of pho-tos and illustrations did not show a pattern according to increasing grade. Charts, graphs,and tables appeared infrequently, as did glossaries. Scientific metalanguage was the nextleast frequent feature. Photos are perhaps the easiest type of text feature to include afterhighlighting, which might account in part for their high rate of occurrence. It is gratifyingthat scientific vocabulary occurred relatively frequently, although, as the data show, therewere never more than about five terms per selection on average (that number for Grade4). Also, the presence of scientific vocabulary can be a double-edged sword, if it leads tounacceptable high-concept density. It is disappointing that charts, graphs, and tables ap-peared so infrequently, because they are such important tools for communicating scientificresults and ideas and because students ought to learn how to interpret them. Of even greatersignificance is the infrequent use of scientific metalanguage. This is the language usedto indicate how the propositions in scientific discourse are to be taken: as statements ofmethod or results; as justifications for procedures or conclusions; as facts, conjectures, orerrors. Across the entire 238 selections, we found only 11 terms used to speak metalinguis-tically about science: analyze, confirm, discover, experiment, justify, observation, principle,research, results, study, and test. We found seven other terms and expressions that are usedprimarily in everyday discourse and do not have clear meanings in science, but seemed to beserving as scientific metalanguage: compare, examine, figure out, find out, identify, realize,and watch. We believe that it is critically important that children be taught from an early agethe vocabulary for talking about scientific processes and products. There is considerableroom for improvement in this regard. In addition, although the scientific vocabulary wasoften highlighted (approximately one fourth of the time), the scientific metalanguage was
Science Education

LEARNING TO READ SCIENTIFIC TEXT 785
TAB
LE
11F
req
uen
cyo
fTe
xtF
eatu
res
byG
rad
e
Freq
uenc
y
Gra
de
Photos
ExactIllustrations
RealisticIllustrations
StylizedIllustrations
Diagrams
Charts,Graphs,andTables
Captions
Labels
ScientificVocabulary
ScientificMetalanguage
HighlightedScienceVocabulary
HighlightedScienceMetalanguage
Glossary
HeadingsandSubheadings
Lists
SeparatedText
Total
1.To
tal
117
1632
266
712
3859
06
00
75
233
3A
vera
gepe
rse
lect
ion
3.16
0.43
0.86
0.70
0.16
0.19
0.32
1.03
1.59
0.00
0.16
00.
000.
190.
140.
059.
002.
Tota
l71
2176
913
04
2352
113
01
115
830
8A
vera
gepe
rse
lect
ion
2.73
0.81
2.92
0.35
0.50
0.00
0.15
0.88
2.00
0.04
0.50
00.
040.
420.
190.
3111
.85
3.To
tal
143
3339
8239
252
113
174
454
02
2714
1879
6A
vera
gepe
rse
lect
ion
3.49
0.80
0.95
2.00
0.95
0.05
1.27
2.76
4.24
0.10
1.32
00.
050.
660.
340.
4419
.41
4.To
tal
137
1951
3130
250
2920
617
180
323
715
638
Ave
rage
per
sele
ctio
n3.
340.
461.
240.
760.
730.
051.
220.
715.
020.
410.
440
0.07
0.56
0.17
0.37
15.5
65.
Tota
l87
3836
7222
260
4814
710
460
322
913
615
Ave
rage
per
sele
ctio
n2.
070.
900.
861.
710.
520.
051.
431.
143.
500.
241.
100
0.07
0.52
0.21
0.31
14.6
46.
Tota
l13
47
2886
292
457
157
1430
03
299
2060
0A
vera
gepe
rse
lect
ion
2.63
0.14
0.55
1.69
0.57
0.04
0.88
0.14
3.08
0.27
0.59
00.
060.
570.
180.
3911
.76
Gra
ndto
tal
689
134
262
306
139
1522
325
879
546
167
012
119
4976
3290
Science Education
786 NORRIS ET AL.
TAB
LE
12F
req
uen
cyo
fTe
xtF
eatu
res
byP
ub
lish
er
Freq
uenc
y
Pub
lishe
r
Photos
ExactIllustrations
RealisticIllustrations
StylizedIllustrations
Diagrams
Charts,Graphs,andTables
Captions
Labels
ScientificVocabulary
ScientificMetalanguage
HighlightedScienceVocabulary
HighlightedScienceMetalanguage
Glossary
HeadingsandSubheadings
Lists
SeparatedText
Total
Cor
ners
tone
sTo
tal
207
5976
4423
166
6417
514
320
333
1428
839
Ave
rage
per
sele
ctio
n2.
840.
811.
040.
600.
320.
010.
900.
882.
400.
190.
440.
000.
040.
450.
190.
3811
.49
Col
lect
ions
Tota
l24
831
7817
734
710
086
347
2756
07
4413
2812
83A
vera
gepe
rse
lect
ion
3.10
0.39
0.98
2.21
0.43
0.09
1.25
1.08
4.34
0.34
0.70
0.00
0.09
0.55
0.16
0.35
16.0
4N
elso
nTo
tal
234
4410
885
827
5710
827
35
790
242
2220
1168
Ave
rage
per
sele
ctio
n2.
750.
521.
271.
000.
960.
080.
671.
273.
210.
060.
930.
000.
020.
490.
260.
2413
.74
Gra
ndto
tal
689
134
262
306
139
1522
325
879
546
167
012
119
4976
3290
Science Education

LEARNING TO READ SCIENTIFIC TEXT 787
never highlighted, implying perhaps a lesser importance, which we dispute. The meaningof highlighting frequently is fraught with ambiguity—what quotes and italics mean in agiven context is not always easy to say.
The right-hand column of Table 12 permits an overall comparison of the three publishers.We see that the total number of text features found in the Cornerstones selections was muchlower than in the other two publishers’ materials. These differences cannot completely beexplained by differences in the average number of text features per selection, even thoughthe total number of text features and the average number per selection have the same rankorder across publishers. The total number of pages that each publisher dedicated to scienceselections varied from Cornerstones at 299.5, Collections at 419.3, to Nelson at 486.8.Taking numbers of pages into account, Collections showed the greatest density per page oftext features, and Gage the second greatest. Within particular text features, there are not toomany stark differences. Collections contained far more stylized illustrations than the otherpublishers; Collections also had the highest density (per selection) of scientific vocabularyand of scientific metalanguage. All publishers used many photos and hardly any charts,graphs, and tables. It is difficult to see making any choice among these publishers on thebasis of these patterns of text feature use. The main differences between publishers werenumber of science selections (Cornerstones 73, Collections 80, Nelson 85) and their totallength (Cornerstones 299.5 pages, Collections 419.3 pages, Nelson 486.8 pages). It seemsat least on the basis of page counts that Nelson paid the most attention to science.
SPECIFIC PROCEDURES, RESULTS, AND DISCUSSION (CURRICULARAND INSTRUCTIONAL QUESTIONS 7 AND 8)
Unit of Analysis
Recall that for Questions 1–6, the unit of analysis was the selection in the studentbooks. For Questions 7 and 8, focused, respectively, on types of instructional guidance andassessment techniques, instructional units contained in the teacher’s guides formed the unitof analysis. Although most instructional units were associated with one student selection,not all were. Across the three programs, there were 980 instructional units covering 1,106selections. The subset of 238 science selections was associated with 233 instructional units,which became the units of analysis for Questions 7 and 8.
Instructional Guidance
The teacher’s guides were considered the appropriate materials for analysis of instruc-tional guidance because they contained all the instructional directions found in the studentbooks and additional instruction. The instructional units in the teacher’s guides containeddiverse suggestions, sometimes associated with more than one selection. We began bysampling units from each publisher at each grade level, first from the entire set (980 units)and then focusing on those corresponding to the science selections. We worked togetherprogressively to develop lists of instructional types and exemplars of each type. When wewere in agreement on the coding schemes and high levels of interrater reliability weredemonstrated, the 233 units covering the 238 science selections were assigned to twotrained coders on an even-numbered and odd-numbered basis.
After all the units had been coded, a random sample of 10% of units from each gradeby publisher was selected. Each case was assigned to the coder who had not previouslycoded the unit, and the two codings were compared. Percentage agreement was calculatedfor each instructional type across all cases. In all, 96 instructional types were coded twice,
Science Education

788 NORRIS ET AL.
yielding a range of agreements from 67% to 100% with an overall average of 92%. Thelowest agreement was on “phonics instruction.” Investigation revealed that coders weresometimes unclear about whether sound–letter instruction was phonics, spelling, or both.
We identified the instructional suggestions most clearly associated with the readingprocess in the 238 selections that contained scientific content. There were 50 types ofinstruction in nine categories, the description and prevalence of which we have previouslyreported (Smith et al., 2006).
Although many different types of instructional suggestions were enumerated, the majorityof tabulated frequencies are considerably less than 50%. Most of the frequently occurringinstructional directions (frequencies greater than 50%) are those that involve personalreflection or response. In our data, these are often cross-classified with the most frequent orallanguage activity, which is discussion. Examples of questions eliciting personal reflection,response, or discussion include the following: Why do you think astronomers study thestars? Have you ever wished. . . ? Will this report change the way you use water? Thesequestions differ in a number of respects. Some are intended for prereading, others for mid-or after-reading. Some can be answered without reading the selections at all. They differ infocus or intent: included are probes for personal experiences, personal preferences, personallearning, and personal ideas or thought processes.
Discussion was by far the most frequently suggested activity, with from 64% to 96% ofthe units having multiple calls for discussion, depending upon grade and publisher. At allgrades, the majority of instructional units contained multiple suggestions for discussion.Discussion is suggested for a variety of purposes in these units, often as a means of gettingchildren to consider questions that involve some sort of personal reflection/response as inthe following prereading instruction found in a Grade 3 teacher’s guide:
In small groups, discuss your experiences with magnets or compasses. What can magnetsbe used for? What tricks can you do with magnets? Have you ever used a compass to findyour direction in an unfamiliar place? (Cornerstones, 1999, p. 182)
The fact that personal response/reflection and discussion are so prevalent in the instructionalguidance associated with science selections looks, at least superficially, to be quite promis-ing for fostering scientific literacy. The importance of making connections to students’personal knowledge and making subject matter personally relevant to students is widelyacknowledged in the literacy field (Dillon & Hoffman, 2002). However, the discussion thatis recommended would not draw on the fundamental scientific concepts that are in thetexts and support reading as inquiry. Indeed, there was very little connection to scientificconcepts and reasoning promoted in the programs.
Frequencies were high at all grade levels in three areas: (1) activating prior knowledgeby asking students to make personal connections, (2) identification of new vocabularywords to be taught, and (3) suggestions for student discussion. Approximately one thirdof the reading-related instructional types showed frequencies that were higher in the lowergrades, including choral reading, listening and reading along, phonics, and reading textfeatures. Very few instructional types showed a tendency to be more frequent at the highergrades, although two activities that showed such a tendency were asking children to explainconcepts from the selection in their own words and asking them to infer information notexplicitly stated in the selection. The clearest grade trends of increasing frequency werefound for the personal response questions that call for thinking/inferring and reflecting.
Assessment Techniques
Assessment plays a crucial role in both literacy learning (Johnston & Costello, 2005)and science education (National Science Teachers Association [NSTA], 2001). The what
Science Education

LEARNING TO READ SCIENTIFIC TEXT 789
and how of assessment have implications for what is taught and learned and, consequently,the importance of assessment for learning is well recognized in both the field of scienceeducation (NSTA, 2001) and the field of literacy (International Reading Association [IRA]& National Council of Teachers of English [NCTE], 1994). While commercial readingprograms may be expected to include general literacy assessments, such assessment mustalso implicate science content and scientific reasoning, if it is to contribute in any significantway to the development of scientific literacy.
We sampled teaching units at all grade levels from the entire inventory, progressivelydeveloping lists of assessment types encountered. As identified instances began to fitprevious descriptions, we focused more specifically on the 233 teaching units correspondingto the 238 science selections and devised a preliminary code form and codebook containingexplanations and exemplars. Regular meetings were held to compare notes, raise issues,and refine the protocol. The final measurement protocol was developed through an iterativeprocess, involving several rounds of pilot reliability testing as well as examination anddiscussion of disagreements leading to modification of the coding scheme. When agreementon the protocol and high levels of interrater reliability had been achieved and all teammembers expressed agreement on the protocol, two trained coders were assigned to alternatecases such that approximately the same number of units for each grade and each publisherfell to the coders.
Instances of assessment were identified in three ways. Some were clearly labeled invarious side notes accompanying suggested student tasks in the teacher’s guides. Otherinstances were not labeled explicitly but, from explicit directions to the teacher, it couldbe inferred that assessment is intended. A third method of identification involved locatingimplicit mentions of assessment such as, “Can the students support their theories withfacts?” (Cornerstones 3a, p. 66), in which case it can be inferred that a teacher would useobservation to discern the students’ ability during discussions. Since any instructional unitcould contain multiple instances of assessment, instances were coded in the order in whichthey were encountered within each unit.
Each instance of assessment was coded along six major dimensions as shown in Table 13.For each of these dimensions we developed coding categories supplemented with explana-tions and exemplars. A 10% random sample stratified by grade and publisher was selectedfrom the 233 coded units. Each chosen instructional unit was assigned to the coder who hadnot already coded the case and the cases were then compared. Percentage agreement wascalculated for judgments on the number of assessments per unit, the identification of theseassessments, and each major dimension of the investigation per assessment. The overallaverage for all variables was 87%.
We have reported the detailed findings of this procedure elsewhere (Phillips, Norris,Smith, Buker, & Kasper, 2007). Several aspects of the findings can be viewed positivelyin terms of scientific literacy goals. The findings on both forms and tools show that varietyis present along these dimensions, which should be viewed positively given that positionstatements for both literacy (IRA & NCTE, 1994) and science education (NSTA, 2001)advocate multiple forms of assessment. There are some clear patterns of dominance, in thatobservations and self- and peer assessments dominate forms and guiding questions/promptsdominate tools. This may be viewed positively as well in that it suggests promotion ofobservation skills and a spirit of inquiry, elements essential to the scientific enterprise.In many instances, teachers are given guidance on becoming good observers, includingdirection on when and what to observe as well as on focusing questions or points toguide their informal assessments. In addition, students are being involved in the assessmentprocess, a feature advocated by both literacy (e.g., Cohen & Wiener, 2003) and scienceeducators (e.g., Coffey, 2003).
Science Education

790 NORRIS ET AL.
TABLE 13Dimensions of Assessments Found in Commercial Reading Programs
Dimension Coding Categories
Forms Observation, student self-assessment, peerassessment, conference, product/skill evaluation,unknown
Tools Checklist, rating scale, anecdotal notes, running record,answer key/marking guide, journal/learning log entry,criteria, guiding questions/prompts, other,combination, not specified
Tasks Tests, writing samples, interactive reading viewing,research reports/skills, visual representations,reading/viewing, organizers, science skills, oral work,dramatic presentations, student-planned interviews,worksheets, discussions, artwork, listening,multimedia presentations, personal skills, other tasks,combinations
Purposes Summative, formative, diagnostic, combination, cannotdiscern
Correspondence to learningobjectives
Corresponds, does not correspond, unrelated
Content Language arts, science, social studies, mathematics,technology, music, drama, art, health, cross-curricularskills, interpersonal skills, combinations, cannotdiscern
The findings on the purpose of the assessments can also be construed positively. Sincethere are virtually no assessments that are clearly intended to be summative or diagnostic,and the majority is either formative or dependent on teacher use, there appears to beconsiderable leeway—even encouragement—for the teacher to use these assessments togather information that would help students in their learning processes. The programstherefore emphasize assessment for learning versus assessment of learning (Chappuis &Stiggins, 2002; Stiggins, 2002, 2005), and the value of this approach is well recognized inscience education (Atkin, Black, & Coffey, 2001; Roscoe & Mrazek, 2005).
Other findings fall more into the realm of negatives. Assessment was associated with avariety of student tasks, many in combination, but the tasks most directly associated withscience were quite infrequently associated with assessment. Only 3% of all assessmentsfocused on tasks that involve students utilizing skills or processes that are specific to thescience domain (e.g., writing a scientific report, observing phenomena, and performingexperiments). Other tasks do have aspects of relevance to the development of scientificliteracy, but their relationship to science is far less direct. For example, a group task ofresearching a creature to write a story (Nelson 2, Reach Out, p. 161) may involve thegathering of information or resources and learning some life science content, but the taskfocus (writing a story) is of marginal relevance to the scientific enterprise. Had the task beento prepare a report, there would have been a closer tie to scientific literacy. Combined witha self-assessment that focuses not on research processes or content but on the interpersonalskills needed to work in groups, the potential of the task for our purposes is further diluted.Again, had the group work been related to scientific activities such as reading, writing, andinterpreting scientific texts, then the potential for scientific literacy enhancement wouldhave been increased greatly.
Science Education

LEARNING TO READ SCIENTIFIC TEXT 791
The findings on the correspondence to learning objectives also are not encouraging.Only about 45% of all assessments were clearly aligned with learning objectives, andthese did not necessarily involve science content. Thus, the relationships among objectives,instruction, and assessment are unlikely to be optimal for promoting scientific literacy inthese programs.
Finally, the content results raise doubts about the value of these assessments for fosteringscientific literacy. The majority of assessments were concerned with language arts contentonly. While this may be expected in language arts programs, the assessments studied hereare those in the subset of units with science content, and these programs include the scienceas one of their selling features. If we look at the percentage of assessments that have mostrelevance to science within these units, we find the following: cross-curricular skills (24%),science (5%), and combinations including science (14%). Therefore, fewer than half (43%)of the assessments associated with units containing scientific material have any connectionto science content, and well over half of these are cross-curricular in nature and only1 in 20 is directly focused on science. Whatever use these assessments may be for literacylearning, their relationship to the scientific realm is less than robust.
CONCLUSIONS AND IMPLICATIONS
This section is organized around the eight questions that guided the study and a finalcommentary. Our aim is to provide a judgment of the extent to which the commercialreading programs we have surveyed can promote scientific literacy. Recall that earlierin this paper we described a theoretical framework for how reading could be centrallyinvolved in scientific literacy. We distinguished between scientific literacy in its derivedsense, referring to scientific knowledgeability and being learned and educated in science,and scientific literacy in its fundamental sense, referring to the ability to read and writewhen the content is science (Norris & Phillips, 2003). According to this conception, animportant element in achieving scientific literacy is to teach reading and writing in thecontext of science, by which we mean being able to analyze, critique, and interpret sciencetext. It is this element that we will address in this section.
Presence and Proportion of Scientific Content
This investigation established that these widely used commercial reading programs docontain science content. Approximately one fifth of all selections contained science content,and most of these dedicate a sizable proportion of their space to the science. We concludedthat there is at least reasonable opportunity for instruction on how to read science materials.There is a trend in two of the three programs surveyed for the proportion of science contentto be greater in Grades 3–6 than in the earlier grades. We do not know what the reasonis for this distribution, but we fear that by not introducing students to expository andargumentative text (of which science is a special sort) at the outset of learning to read, thenwe shall perpetuate what we consider to be mythical: namely, that the narrative form isinherently easier and more appealing to read. There is good reason to think that whateverrelative ease is experienced in reading narrative compared to expository and argumentativeprose has as much or more to do with exposure and instrumental history than with anyfeatures of the genres themselves.
Genre
Calls for increased experience with informational text in the elementary grades haveintensified in the past several decades. Most previous studies have shown that basal reading
Science Education

792 NORRIS ET AL.
series consist primarily of narrative text selections. Our previous studies of these programs(Phillips et al., 2005) found that, although narrative was the most prevalent text type,the amount was considerably less than previously reported, and the amount of scienceconsiderably more. Within the selections with a science focus we actually found that themajority were expository. At one level, this marks an advance over the past dominationby narrative, including addressing in part the concern raised by Ford and her colleaguesthat girls’ lack of interest in science might be due to lack of exposure early enough inschool (Ford et al., 2006). However, a different type of concern now arises, because poorinstructional guidance has become confounded with content. Although the majority of thenonscience selections were literary forms (narrative and poetry), for which instructionalguidance tends to be appropriate, the majority of the science selections were expository, forwhich the instructional guidance was not appropriate much of the time. There is thus a riskthat children will experience difficulty and frustration reading the science text not becauseof any limitations in their abilites or interests with regard to science, but because of poor in-struction in reading the genre. There is, in addition, the attendant risk that any difficulty andfrustration will become associated in students’ minds not with the inappropriate instructionbut with the science content itself. There is, thus, an imperative for explicit instruction onreading exposition and argumentation. Our study also highlighted the glaring absence ofattention to an immensely important genre, namely argumentative texts. This absence cutsacross all content areas, but is especially noticeable in science, which relies heavily on argu-mentation in the justification of questions to pursue, methods to adopt, and conclusions todraw.
Areas and Topics
As an introduction to scientific ideas, which we group under the derived sense of literacy,the programs were skewed heavily toward the life sciences. No doubt children are interestedin many life science topics, and there appears to be a gender difference in preference forscience topics. For example, Dawson (2000) in a study of Australian primary school childrenfound little systematic difference between the interests of children in 1980 and in 1997.In both years, boys rated physical and earth sciences more highly than human and generalbiology. Girls’ preferences showed a different pattern: in 1980, their preferences were forthe biological topics over physical and earth sciences; however, in 1997, their greatestpreference of all was for earth science. Baram-Tsabari and Yarden (2005) rated the scienceinterests of Israeli children based on the questions they submitted to a children’s televisionshow. They found that almost one half of the questions were biological in focus, about onefourth technological, and one fourth physical science (which included astrophysics, whichranked third at 12% of the questions).
It may also be the case that primary and elementary teachers are more comfortablewith life science content. For example, Ford (2004) found that life science books werefavored by the highest percentage of student teachers (45%) for use in their classrooms,and physical science books were favored by only 7%. However, earth science books werefavored by 31% of the student teachers and physical science books were least favored byonly 24%. Given data like these, we can see no justification based upon student or teacherpreferences to have only 4% of the selections with a primary focus on physical scienceand only another 12% on earth and space science. We can only conclude that the selec-tions are biased and could be improved substantially with the inclusion of more physical,earth, and space science. We fear that the almost complete exclusion of these sciencesmight exacerbate the trepidation with which older students seem to approach them and thewidespread avoidance of these fields by middle school, high school, and university students
Science Education

LEARNING TO READ SCIENTIFIC TEXT 793
(Bordt et al., 2001; Gott & Johnson, 1999; Osborne, Driver, & Simon, 1998; StatisticsCanada, 2003).
Accuracy
Our typology of inaccuracies documents the range of errors that we discovered in theseprograms. We found only slightly more than one inaccuracy per selection, on average, andabout two thirds of these were minor. Although no inaccuracies can be excused, we donot see these programs posing a serious risk of creating multiple and serious scientificmisconceptions in students. This is a happy result. We do not have similar data on scienceprograms at this level, but it would be interesting to be able to compare them to thesereading programs in terms of inaccuracies.
Of concern, however, is where the inaccuracies concentrate, once the total number ofpages devoted to science focus is equalized. We found that the physical, earth, and spacesciences displayed a rate of inaccuracy almost double that of the life sciences. Coupledwith what many perceive as a generalized reluctance to delve into these fields, especiallyinto the physical sciences, and with the overall sparse treatment of these science fociwithin the programs, we believe there is reason to be concerned. The physical sciencesare underrepresented on the one hand, and overly misrepresented on the other hand. Thisis a dreadful combination of program characteristics. We recognize the trend away fromthe physical sciences and toward the life sciences, especially among girls (at least in somecountries) (Organisation for Economic Co-operation and Development, 2006). Yet, thephysical sciences cannot be abandoned. Any sophisticated grasp of modern life sciencesdepends upon understanding the fundamental physical and chemical properties that supportlife and the basic properties of the universe that make life possible in the first place. Weencourage publishers to pay close attention both to the weighting of science selections byfocus and to the accuracy of all their materials. If the physical, earth, and space sciencespose a greater challenge for curriculum writers, then help can be found among scientistsand science educators.
Text Features
Photos and scientific vocabulary were the dominant text features. For the most part, thispattern existed across grades and publishers. Photos are an easy feature to add to texts,so we do not find their numbers surprising. It was excellent to witness so much scientificvocabulary, although there were only about three terms per selection on average. Clearly,if a selection has a science focus, it should be possible to include more terms than three.On the other hand, it is important not to create an unmanageable conceptual density byincluding too many technical terms per selection. Of more concern to us, however, wasthe nearly complete absence of charts, graphs, and tables, which are so important to thecommunication of scientific ideas. It is crucial to the development of scientific literacy inthe fundamental sense that young students be exposed to and taught to interpret such textfeatures. At least of equal importance was the very sparse use of scientific metalanguage(about one such term for every five selections). Scientific metalanguage makes it possibleto talk about science, to discuss methods planned or employed, to compare and evaluateresults, and to consider applications. These intellectual skills are core to what it means to bea scientifically literate citizen. There is little point to greater representation of nonliteraryforms, if the programs do not as well introduce students to the concepts and thoughtsrequired for interpreting these forms. There is much room for improvement on this aspectof program design.
Science Education

794 NORRIS ET AL.
Instructional Guidance
The reading instruction that accompanied the science selections consisted of a widevariety of strategies and activities, although there is a preponderance of personal responseand discussion suggestions frequently with no specific relation to the science content. Thereare numerous suggestions to engage in discussions but few that engage the text in a criticalmanner—a finding also identified by Palinscar and Magnusson (2001).
In general, there is little clear guidance on using the selections for teaching scientificliteracy. Teachers are not provided reliable information on which selections are science.The scientific concepts and any associated metalanguage are not typically the object ofinstruction. Usually, there are so many instructional suggestions associated with eachselection that it is unlikely that a teacher would use all of them. Multiple purposes arereflected in the suggestions, and the probability that a teacher would focus on the mostuseful suggestions for scientific literacy is not great. Thus, perhaps not surprisingly, theteacher is key to making use of the limited potential of the programs for teaching readingin science. Optimizing the potential would take a teacher who is knowledgeable about bothscience and reading and who further has a conscious intent to use these texts for the specificpurpose of teaching reading and writing in science.
Assessment
The results suggest that there are serious limitations to what can be expected from useof the assessments in the commercial reading programs as far as the fostering of scientificliteracy is concerned. Although some aspects of the assessments included in science contentunits have relevance for the enterprise, most do not. The biggest downfall of the assessmentsis their insubstantial relationship to the subject matter of science and to learning specificskills and strategies useful for reading science text.
Final Commentary
There definitely are science selections in these reading series that could be used to helpstudents learn to read science. To illustrate how much more could be done than theseprograms contemplate, we will describe the science-teaching possibilities offered by twoselections containing science content.
Dancing Bees (Collections, 1997, pp. 18–21), a Grade 4 selection, is a wonderfulaccount of how bees communicate about food sources and the research done by two sets ofscientists to define and interpret this activity. Reading this selection involves interpretingdescriptions of research methods and scientific questions that seek explanations, interpretingexperimental tests, distinguishing evidence from conclusions, interpreting correlationalstatements, and interpreting the logic of a controlled experiment.
Fundamental concepts developed in Our Solar System: News and Views (Collections,1998, pp. 41–46), a Grade 6 selection, include the concepts that our knowledge is constantlyevolving, and that it is important to separate fact from fiction. This information is presentedby means of a series of excerpts from newspaper articles. Scientific literacy can be enhancedthrough interpreting the evidence presented in the media reports, interpreting statementsof justification, recognizing tentativeness, analyzing and critiquing science–technology–society issues, and analyzing scientific concepts.
Both Dancing Bees and Our Solar System: News and Views incorporate metalanguage.In Dancing Bees, the words “test,” “experiments,” “watched,” “figured out,” and “realized”
Science Education

LEARNING TO READ SCIENTIFIC TEXT 795
are used to explain the scientists’ activities. “Study,” “observe,” “evidence,” “justify,” and“analyze” are used to this end in Our Solar System.
The teacher is key to fully developing the potential offered by these selections. First,the teacher must decide the fundamental concepts to be learned using a selection. Thenthe teacher must choose what is relevant in the teacher’s guide. For example, for DancingBees, the teacher’s guide is not very helpful. It focuses upon children sharing personalinterpretations of dance, general uses of robots, and imitating the bees waggle dance aswell as developing their own dances. The only link to science is a suggestion to gatherinformation about bees from a wide range of external sources. For Our Solar System:News and Views, the teacher’s guide adopts a general focus on media coverage. The linkto science is “optional,” general, and fails to direct specific attention to the selections.Thus, teachers themselves often must develop the lessons that will help their studentsacquire scientific literacy by providing a focus on reading a selection consistent with itsfundamental concepts and must arbitrate between the concepts in the selections and theactivities recommended in the teacher’s guides. There is a risk that none of this will takeplace, because of the widely recognized reluctance of elementary school teachers to teachscience.
For assessing student learning, teachers can recognize student understanding throughattention to students’ clarity of thought revealed in their choice of vocabulary, sequencingof ideas, examples provided, inferences made, relevance of questions asked, and the intel-lectual quality of their interactions with the teacher and classmates—in their coherence,consistency, and completeness of thought.
The well-intentioned integration of scientific material in these commercial reading pro-grams may have little usefulness for developing scientific literacy. The difficulty is not onlythat this is the case, but that it may be perceived as otherwise either by reading teachersor science teachers, or both. Resistance to literacy instruction in the science domain iswidespread (Shanahan, 2004), and the inclusion of science content in literacy programsmay fortify science teachers’ notion that teaching the reading and writing of science textis solely or primarily the job of the literacy teacher. Language arts teachers, for their part,may believe they are fruitfully developing the relationship between science and literacybecause the programs they use contain science material. Ongoing collaboration betweenthe literacy community and science educators is needed to clarify the value of various typesof integration and to identify and develop instructional approaches and materials that willmore effectively foster scientific literacy. Furthermore, science educators ought not to beseduced into thinking that because science is an integral part of reading programs that thefundamental sense of scientific literacy (reading and writing when the content is science)will be taught better than in a stand-alone science program.
REFERENCES
Abell, S., & Roth, M. (1992). Constraints to teaching science: A case study of a science teacher enthusiast. ScienceEducation, 76, 581–595.
American Association for the Advancement of Science. (1993). Benchmarks for scientific literacy. New York:Oxford University Press.
American Association for the Advancement of Science. (1994). Science for all Americans. New York: OxfordUniversity Press.
Atkin, J. M., Black, P., & Coffey, J. (Eds.). (2001). Classroom assessment and the National Science EducationStandards. Washington, DC: National Academy Press.
Baker, L., & Brown, A. L. (1984). Metacognitive skills and reading. In P. D. Pearson, R. Barr, M. L. Kamil, &P. Mosenthal (Eds.), Handbook of reading research (pp. 353–394). New York: Longman.
Baram-Tsabari, A., & Yarden, A. (2005). Characterizing children’s spontaneous interests in science and technol-ogy. International Journal of Science Education, 27, 803–826.
Science Education

796 NORRIS ET AL.
Bordt, M., de Broucker, P., Read, C., Harris, S., & Zhang, Y. (2001). Determinants of science and technologyskills: Overview of the study. Education Quarterly Review, 8(1), 8–12.
Brickhouse, N. (1990). Teachers’ beliefs about the nature of science and their relationship to classroom practice.Journal of Research and Development in Education, 15(4), 13–18.
Chappuis, S., & Stiggins, R. (2002). Classroom assessment for learning. Educational Leadership, 60(1), 40–43.Christie, F. (1987). Genres as choice. In I. Reid (Ed.), The place of genre in learning: Current debates (pp. 22–34).
Victoria, Australia: Deakin University (Centre for Studies in Literacy Education).Coffey, J. E. (2003). Involving students in assessment. In J. M. Atkin & J. Coffey (Eds.), Everyday assessment in
the science classroom (pp. 75–87). Arlington, VA: National Science Teachers Association.Cohen, J. H., & Wiener, R. B. (2003). Literacy portfolios: Improving assessment, teaching, and learning (2nd
ed.). Upper Saddle River, NJ: Merrill Prentice-Hall.Collections. (1996, 1997, 1998, 1999, 2000). Scarborough, Ontario, Canada: Prentice-Hall Ginn.Collins Block, C., & Pressley, M. (2002). Comprehension instruction: Research-based best practices. New York:
Guilford.Cornerstones Canadian Language Arts. (1998, 1999, 2000, 2001). Toronto, Ontario, Canada: Gage Educational
Publishing Company.Council of Ministers of Education, Canada. (1997). Common framework of science learning outcomes K to 12.
Toronto, Ontario: Author.Craig, M. T., & Yore, L. D. (1996). Middle school students’ awareness of strategies for resolving reading
comprehension difficulties in science reading. Journal of Research in Development in Education, 29, 226–238.Cullinan, B. E. (1987). Inviting readers to literature. In B. E. Cullinan (Ed.), Children’s literature in the reading
program (pp. 2–13). Newark, DE: International Reading Association.Dawson, C. (2000). Upper primary boys’ and girls’ interests in science: Have they changed since 1980? Interna-
tional Journal of Science Education, 22, 557–570.Dillon, D. R., & Hoffman, K. A. (2002). Discussion. In B. J. Guzzetti (Ed.), Literacy in America (pp. 143–146).
Santa Barbara, CA: ABC-CLIO.Doiron, R. (1994). Using nonfiction in a read-aloud program: Letting the facts speak for themselves. The Reading
Teacher, 47, 616–624.Dole, J. A., & Osborn, J. (2003). Elementary language arts textbooks: A decade of change. In J. Flood, D. Lapp,
J. R. Squire, & J. M. Jensen (Eds.), Handbook of research on teaching the English language arts (2nd ed.,pp. 631–639). Mahwah, NJ: Erlbaum.
Duke, N. K. (2000). 3.6 minutes per day: The scarcity of informational texts in first grade. Reading ResearchQuarterly, 35, 202–224.
Duke, N. K., & Bennett-Armistead, S. (2003). Reading and writing informational text in the primary grades:Research-based practices. New York: Scholastic.
Duthie, C. (1994). Nonfiction: A genre study for the primary classroom. Language Arts, 71, 588–595.Flood, J., & Lapp, D. (1987). Forms of discourse in basal readers. The Elementary School Journal, 87, 299–306.Flood, J., Lapp, D., & Flood, S. (1984). Types of writing found in the early levels of basal reading programs:
Preprimers through second-grade readers. Annals of Dyslexia, 34, 241–255.Ford, D. J. (2004). Scaffolding preservice teachers’ evaluation of children’s science literature: Attention to
science-focused genres and use. Journal of Science Teacher Education, 15, 133–153.Ford, D. J., Brickhouse, N. W., Lottero-Perdue, P., & Kittleson, J. (2006). Elementary girls’ science reading at
home and school. Science Education, 90, 270–288.Gaskins, I. W., Guthrie, J. T., Satlow, E., Ostertag, J., Six, L., Byrne, J., et al. (1994). Integrating instruction of
science, reading, and writing: Goals, teacher development, and assessment. Journal of Research in ScienceTeaching, 31, 1039–1056.
Gott, R., & Johnson, P. (1999). Science in schools: Time to pause for thought? School Science Review, 81(295),21–28.
Graesser, A. C. (1981). Prose comprehension beyond the word. New York: Springer-Verlag.Graesser, A. C., Hauft-Smith, K., Cohen, A. D., & Pyles, L. D. (1980). Advanced outlines, familiarity, and text
genre on retention of prose. Journal of Experimental Education, 48, 281–290.Guthrie, J. T., Van Meter, P., Hancock, G. R., Alao, S., Anderson, E., & McCann, A. (1998). Does concept-oriented
reading instruction increase strategy use and conceptual learning from text? Journal of Educational Psychology,90, 261–278.
Heselden, R., & Staples, R. (2002). Science teaching and literacy, part 2: Reading. School Science Review, 83,51–62.
Hoffman, J. V., McCarthey, S. J., Abbott, J., Christian, C., Corman, L., Curry, C., et al. (1994). So what’s new inthe new basals? A focus on first grade. Journal of Reading Behavior, 26, 47–73.
Hoyt, L. (2002). Make it real: Strategies for success with informational texts. Portsmouth, NH: Heinemann.
Science Education

LEARNING TO READ SCIENTIFIC TEXT 797
Hoyt, L., Mooney, M., & Parkes, B. (Eds.) (2003). Exploring informational texts: From theory to practice.Portsmouth, NH: Heinemann.
International Reading Association & National Council of Teachers of English. (1994). Standards for the assessmentof reading and writing. Newark, DE: International Reading Association and National Council of Teachers ofEnglish Joint Task Force on Assessment.
Johnston, P., & Costello, P. (2005). Principles for literacy assessment. Reading Research Quarterly, 40, 256–267.Kesidou, S., & Roseman, J. E. (2002). How well do middle school science programs measure up? Findings from
Project 2061’s curriculum review. Journal of Research in Science Teaching, 39, 522–549.Littlefair, A. B. (1991). Reading all types of writing: The importance of genre and register for reading development.
Bristol, PA: Open University Press.Mallett, M. (2003). Early years non-fiction: A guide to helping young researchers use information texts. London:
Routledge.McCarthey, S. J., Hoffman, J. V., Abbott, J., Elliott, B., Stahle, D., Price, D., et al. (1995). Learning to read with
the “new” literature-based basal reading programs: Some initial findings. In K. A. Hinchman, D. J. Leu, & C.K. Kinzer (Eds.), Perspectives on literacy research and practice (pp. 295–304). Chicago: National ReadingConference.
Millar, R., & Osborne, J. (Eds.). (1998). Beyond 2000: Science education for the future. London: King’s CollegeLondon, School of Education.
Millard, E. (1997). Differently literate. London: Falmer Press.Morrow, L. M., & Gambrell, L. B. (2000). Literature-based reading instruction. In M. L. Kamil, P. B. Mosenthal,
P. D. Pearson, & R. Barr (Eds.), Handbook of reading research (Vol. 3, pp. 563–586). Mahwah, NJ: Erlbaum.Moss, B., & Newton, E. (2002). An examination of the informational text genre in basal readers. Reading
Psychology, 23, 1–13.Moss, B., Leone, S., & Dipillo, M. (1997). Exploring the literature of fact: Linking reading and writing through
information trade books. Language Arts, 74, 418–429.Murphy, S. (1991). Authorship and discourse types in Canadian basal reading programs. Reflections on Canadian
literacy, 9, 133–138.National Research Council. (1996). National Science Education Standards. Washington, DC: National Academy
Press.National Science Teachers Association. (2001). Position statement: Assessment. Retrieved January 11, 2008, from
http://www.nsta.org/about/positions/assessment.aspx/.Nelson Language Arts. (1998, 1999, 2000, 2001). Scarborough, Ontario, Canada: Nelson Thomson Learning.Neuendorf, K. A. (2002). The content analysis guidebook. Thousand Oaks, CA: Sage.Norris, S. P., Guilbert, S. M., Smith, M. L., Hakimelahi, S., & Phillips, L. M. (2005). A theoretical framework for
narrative explanation in science. Science Education, 89, 535–563.Norris, S. P., & Phillips, L. M. (1987). Explanations of reading comprehension: Schema theory and critical
thinking theory. Teachers College Record, 89, 281–306.Norris, S. P., & Phillips, L. M. (1994a). The relevance of a reader’s knowledge within a perspectival view of
reading. Journal of Reading Behavior, 26, 391–412.Norris, S. P., & Phillips, L. M. (1994b). Interpreting pragmatic meaning when reading popular reports of science.
Journal of Research in Science Teaching, 31, 947–967.Norris, S. P., & Phillips. L. M. (2003). How literacy in its fundamental sense is central to scientific literacy. Science
Education, 87, 224–240.Organisation for Economic Co-operation and Development. (2006). Global science forum: Evolving student
interest in science and technology studies policy report. Paris: OECD Publishing.Osborne, J., Driver, R., & Simon, S. (1998). Attitudes to science: Issues and concerns. School Science Review,
79(288), 27–33.Palinscar, A. S., & Magnusson, S. J. (2001). The interplay of first-hand and second-hand investigations to model
and support the development of scientific knowledge and reasoning. In S. M. Carver & D. Klahr (Eds.),Cognition and instruction: Twenty-five years of progress (pp. 151–187). Mahwah, NJ: Erlbaum.
Pappas, C. C. (1991). Fostering full access to literacy by including information books. Language Arts, 68,449–462.
Pappas, C. C. (2006). The informational book genre: Its role in integrated science literacy research and practice.Reading Research Quarterly, 41, 226–250.
Peacock, A., & Weedon, H. (2002). Children working with text in science: Disparities with ‘literacy hour’ practice.Research in Science & Technological Education, 20, 185–197.
Penney, K., Norris, S. P., Phillips, L. M., & Clark, G. (2003). The anatomy of junior high school science textbooks:An analysis of textual characteristics and a comparison to media reports of science. Canadian Journal of Science,Mathematics and Technology Education, 3, 415–436.
Science Education

798 NORRIS ET AL.
Phillips, L. M., & Norris, S. P. (1999). Interpreting popular reports of science: What happens when the reader’sworld meets the world on paper? International Journal of Science Education, 21, 317–327.
Phillips, L. M., Norris. S. P., Smith, M. L., Buker, J., & Kasper, C. (2007). Assessment techniques correspondingto scientific texts in commercial reading programs: Do they promote scientific literacy? Manuscript submittedfor publication.
Phillips, L. M., Smith, M. L., & Norris, S. P. (2005). Commercial reading programs: What’s replacing narrative?In B. Maloch, J. V. Hoffman, D. L. Schallert, C. M. Fairbanks, & J. Worthy, (Eds.), 54th Yearbook of theNational Reading Conference (pp. 286–300).Oak Creek, WI: National Reading Conference.
Pressley, M., & Wharton-McDonald, R. (1997). Skilled comprehension and its development through instruction.School Psychology Review, 26, 448–467.
Reutzel, D. R., & Larsen, N. S. (1995). Look what they’ve done to real children’s books in the new basal readers!Language Arts, 72, 495–507.
Roscoe, K., & Mrazek, R. (2005). Scientific literacy for Canadian students: Curriculum, instruction and assessment.Calgary, Alberta, Canada: Detselig.
Rowell, P. M., & Ebbers, M. (2004). School science constrained: Print experiences in two elementary classrooms.Teaching and Teacher Education, 20, 217–230.
Schmidt, W. H., Caul, J., Byers, J. L., & Buchmann, M. (1984). Content of basal text selections: Implicationsfor comprehension instruction. In G. G. Duffy, L. R. Roehler, & J. Mason (Eds.), Comprehension instruction:Perspectives and suggestions (pp. 144–162). New York: Longman.
Shanahan, C. (2004). Better textbooks, better readers and writers. In E. W. Saul (Ed.), Crossing borders in literacyand science instruction: Perspectives on theory and practice (pp. 370–382). Arlington, VA: InternationalReading Association and the National Science Teachers Association.
Smith, B. D. (1991). A descriptive analysis of the content in three basal readers. Ann Arbor, MI: UniversityMicrofilms.
Smith, M. L., Phillips, L. M., Leithead, M. R., & Norris, S. P. (2004). Story and illustration reconstituted:Children’s literature in Canadian reading programs. Alberta Journal of Educational Research, 50, 391–410.
Smith, M. L., Phillips, L. M., Norris, S. P., Guilbert, S. L., & Stange, D. L. (2006). Scientific literacy andcommercial reading programs: An analysis of text and instructional guidance. In J. V. Hoffman, D. L. Schallert,C. M. Fairbanks, J. Worthy, & B. Maloch (Eds.), 55th Yearbook of the National Reading Conference (pp.
293–308). Oak Creek, WI: National Reading Conference.Statistics Canada. (2003). Measuring up: Canadian results of the OECD PISA study (pp. 36–41). Ottawa, Ontario,
Canada: Author.Stiggins, R. J. (2002). Assessment crisis: The absence of assessment FOR learning. Phi Delta Kappan, 83,
758–765.Stiggins, R. J. (2005). From formative assessment to assessment FOR learning: A path to success in standards-
based schools. Phi Delta Kappan, 87, 324–328.Tenopir, C., & King, D. W. (2004). Communication patterns of engineers. Hoboken, NJ: Wiley.Voss, J., Wiley, J., & Sandak, R. (1999). On the use of narrative as argument. In S. Goldman, A. Graesser, &
P. van den Broek (Eds.), Narrative comprehension, causality, and coherence: Essays in honor of Tom Trabasso(pp. 235–253). Mahwah, NJ: Erlbaum.
Wellington, J., & Osborne, J. (2001). Language and literacy in science education. Philadelphia, PA: Open Uni-versity Press.
Yopp, R. H., & Yopp, H. K. (2000). Sharing informational text with young children. The Reading Teacher, 53,410–423.
Zabrucky, K. & Moore, D. (1999). Influence of text genre on adults’ monitoring of understanding and recall.Educational Gerontology, 25, 691–710.
Science Education