lecture -- 1-- start - university of pittsburghsuper7/51011-52001/51331.pdf · quantitative...
TRANSCRIPT
Lecture -- 1-- Start
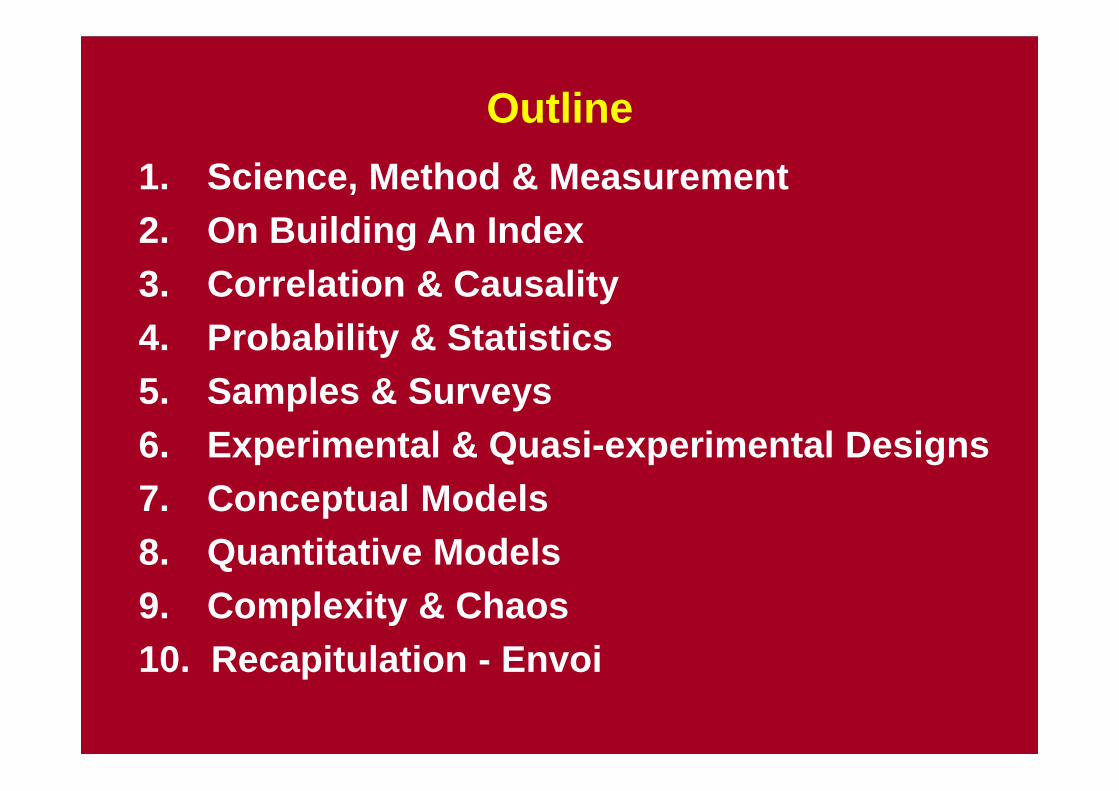
Outline
1. Science, Method & Measurement2. On Building An Index3. Correlation & Causality4. Probability & Statistics5. Samples & Surveys6. Experimental & Quasi-experimental Designs7. Conceptual Models8. Quantitative Models9. Complexity & Chaos10. Recapitulation - Envoi
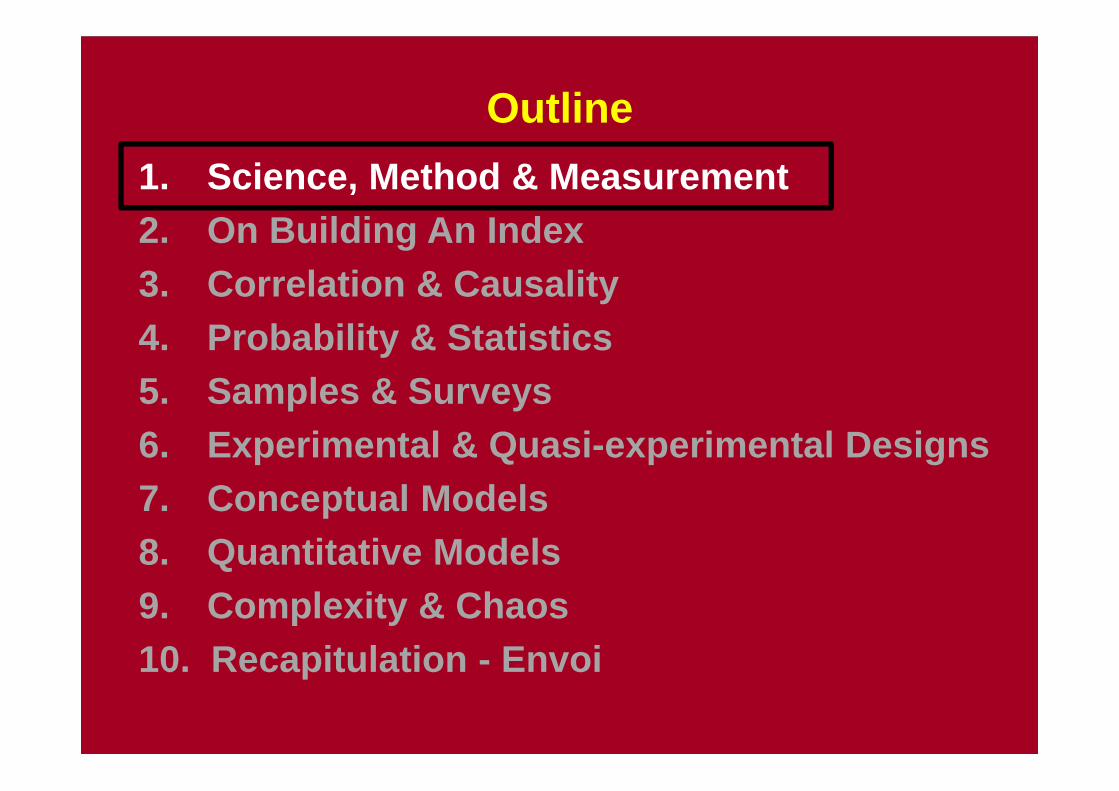
Outline
1. Science, Method & Measurement2. On Building An Index3. Correlation & Causality4. Probability & Statistics5. Samples & Surveys6. Experimental & Quasi-experimental Designs7. Conceptual Models8. Quantitative Models9. Complexity & Chaos10. Recapitulation - Envoi
Quantitative Techniques for Social Science Research
Ismail SerageldinAlexandria
2012
Lecture # 1:Science, Method, and
Measurement

On Science
On Science
Science Is Driven by Curiosity About the Natural World
WHAT IF?
WHAT IF?
WHAT IF?
??
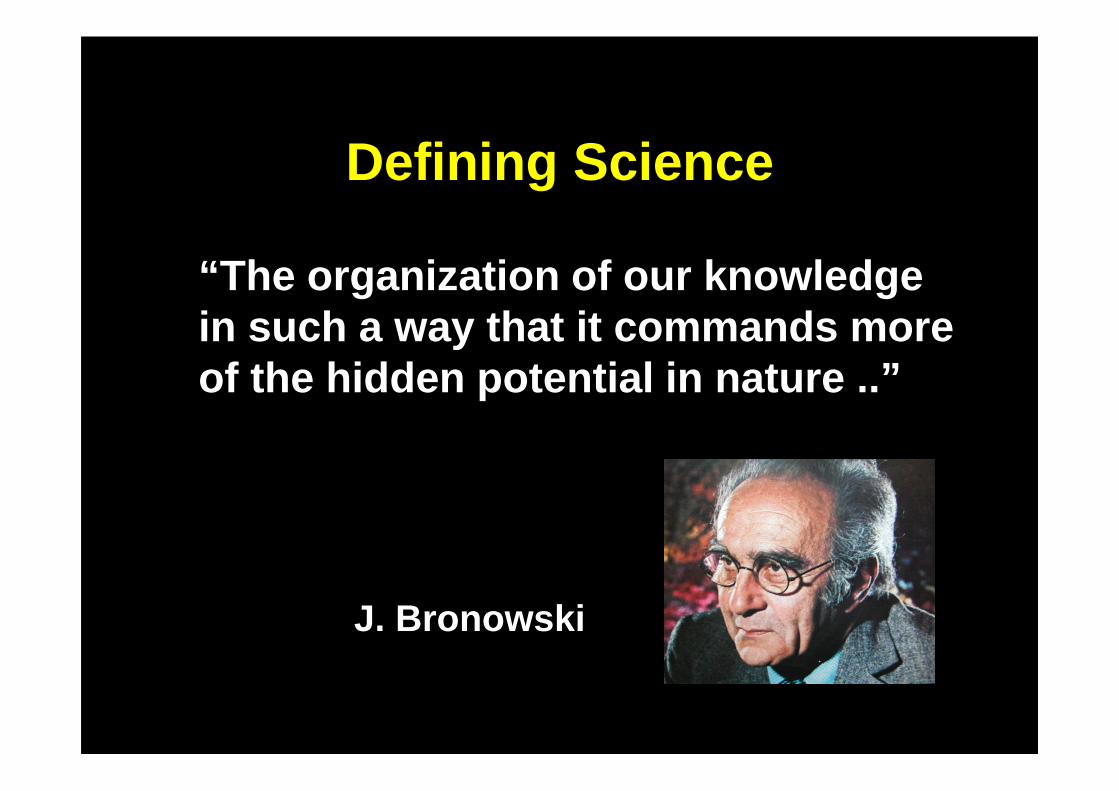
Defining Science
“The organization of our knowledge in such a way that it commands more of the hidden potential in nature ..”
J. Bronowski
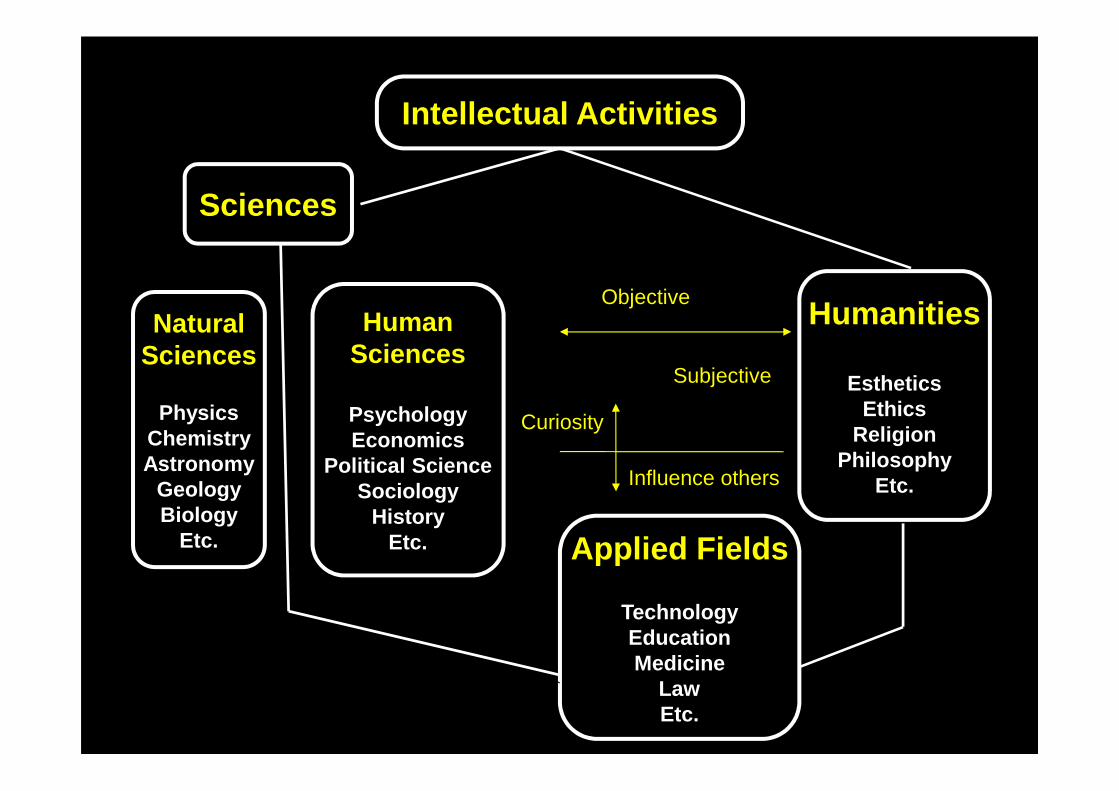
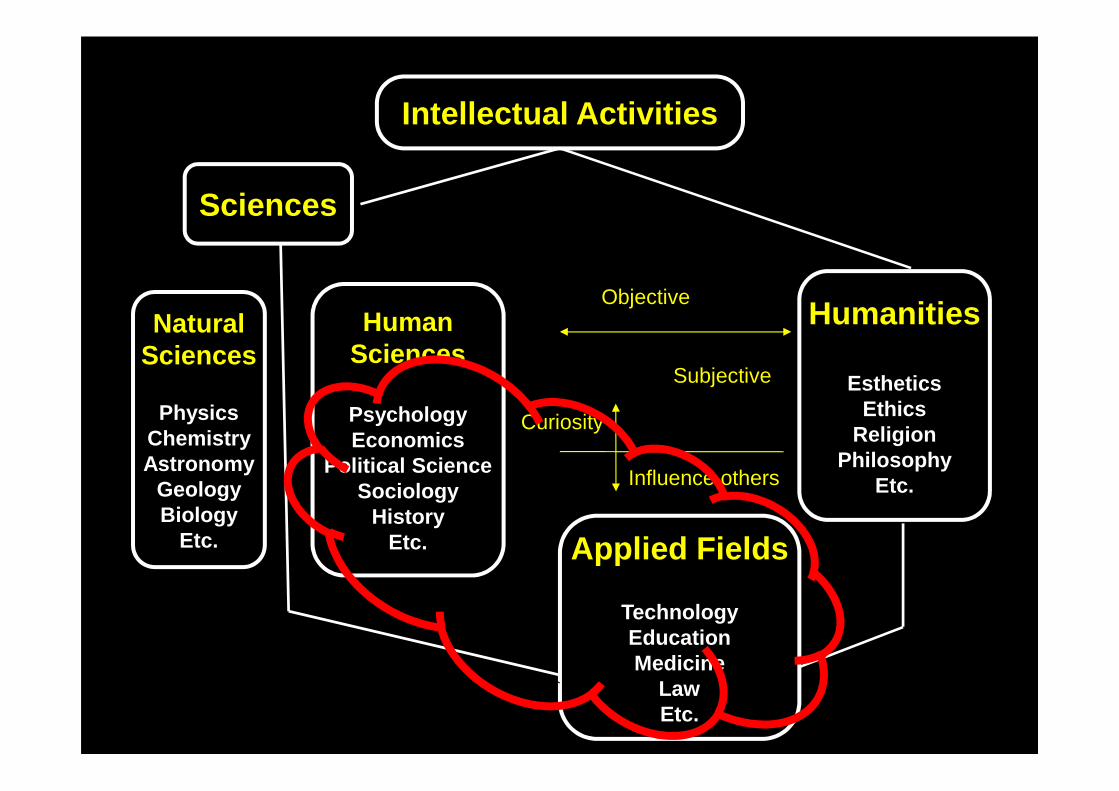
Intellectual Activities
NaturalSciences
PhysicsChemistryAstronomy
GeologyBiology
Etc.
HumanSciences
PsychologyEconomics
Political ScienceSociology
HistoryEtc. Applied Fields
TechnologyEducationMedicine
LawEtc.
Humanities
EstheticsEthics
ReligionPhilosophy
Etc.
Sciences
Curiosity
Influence others
Objective
Subjective
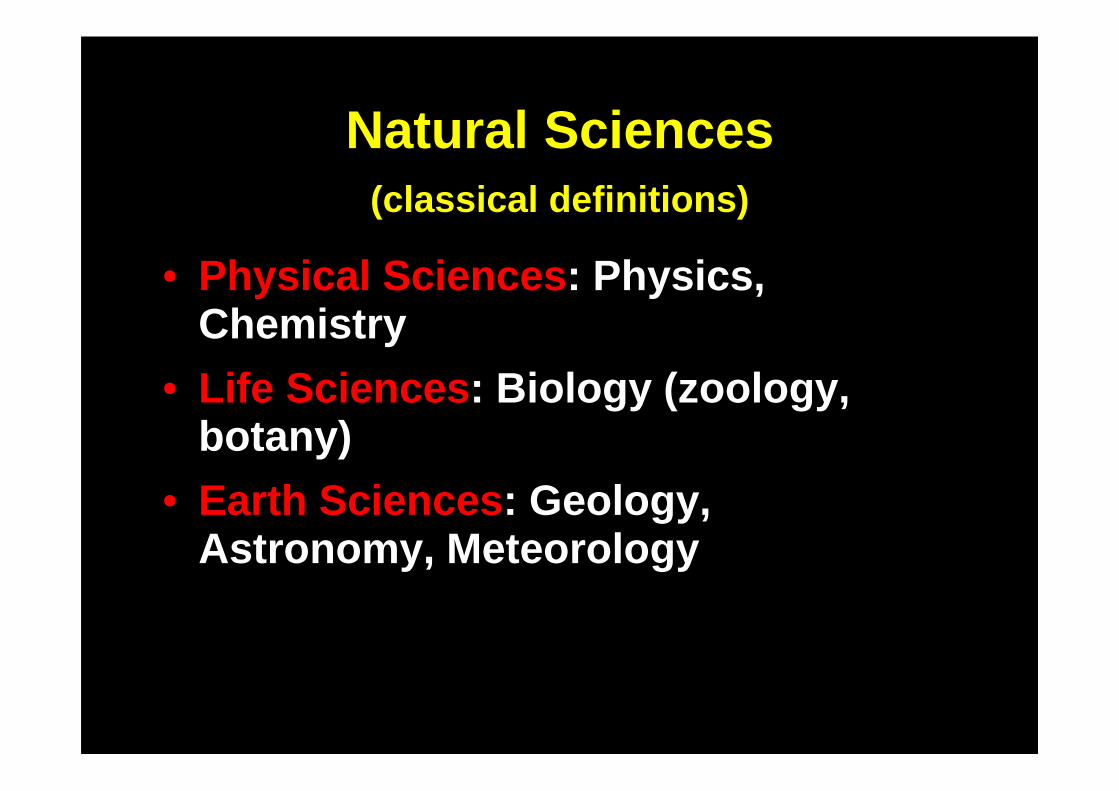
Natural Sciences (classical definitions)
• Physical Sciences : Physics, Chemistry
• Life Sciences : Biology (zoology, botany)
• Earth Sciences : Geology, Astronomy, Meteorology
Overlapping Domains in Science
Biochemistry, Paleontology, Molecular Genetics…

Changed Outlook: Process and System Views
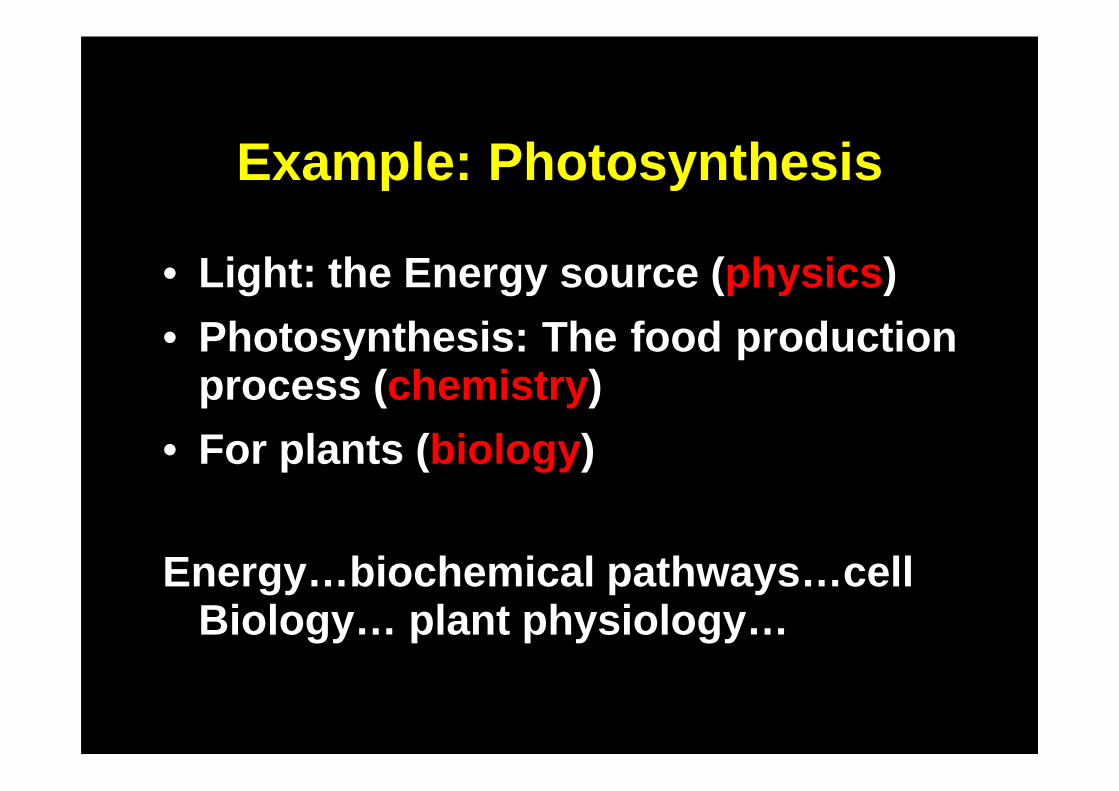
Example: Photosynthesis
• Light: the Energy source (physics )
• Photosynthesis : The food productionprocess (chemistry )
• For plants (biology )
Energy…biochemical pathways…cell Biology… plant physiology…
The Nature of Scientific Knowledge
• Falsifiable (Popper)• Approximative• Empirical• Replicable
• And so much more…
Karl Popper(1902-1994)
Before scientific thinking can proceed, certain philosophical presuppositions must be made about the nature of the universe:
• Objective reality exists – there really arethings out there, everything is not simply afigment of the imagination .
• The universe is knowable – no aspects of theuniverse are beyond human understanding .
• The universe’s operation is regular andpredictable – if events occur at random,without any warning or pattern, no amount ofanalysis will uncover any regularity to them .
Philosophical Presuppositions
On The Scientific Method
The Scientific Method
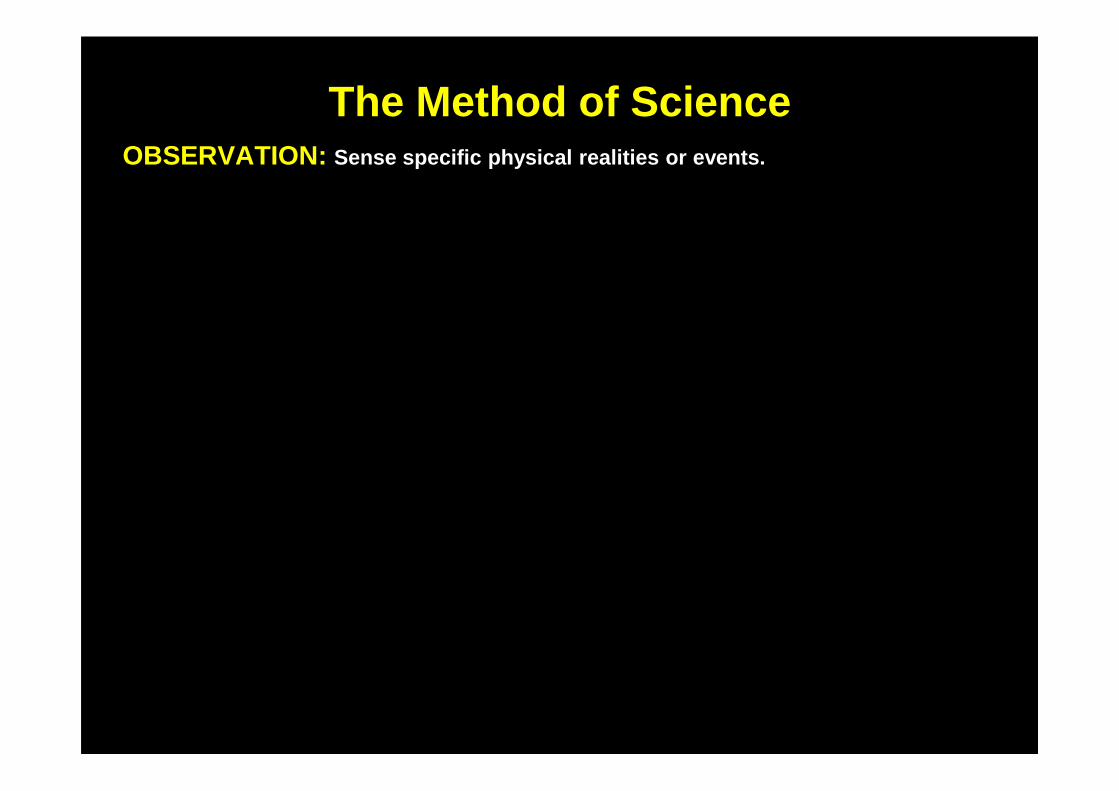
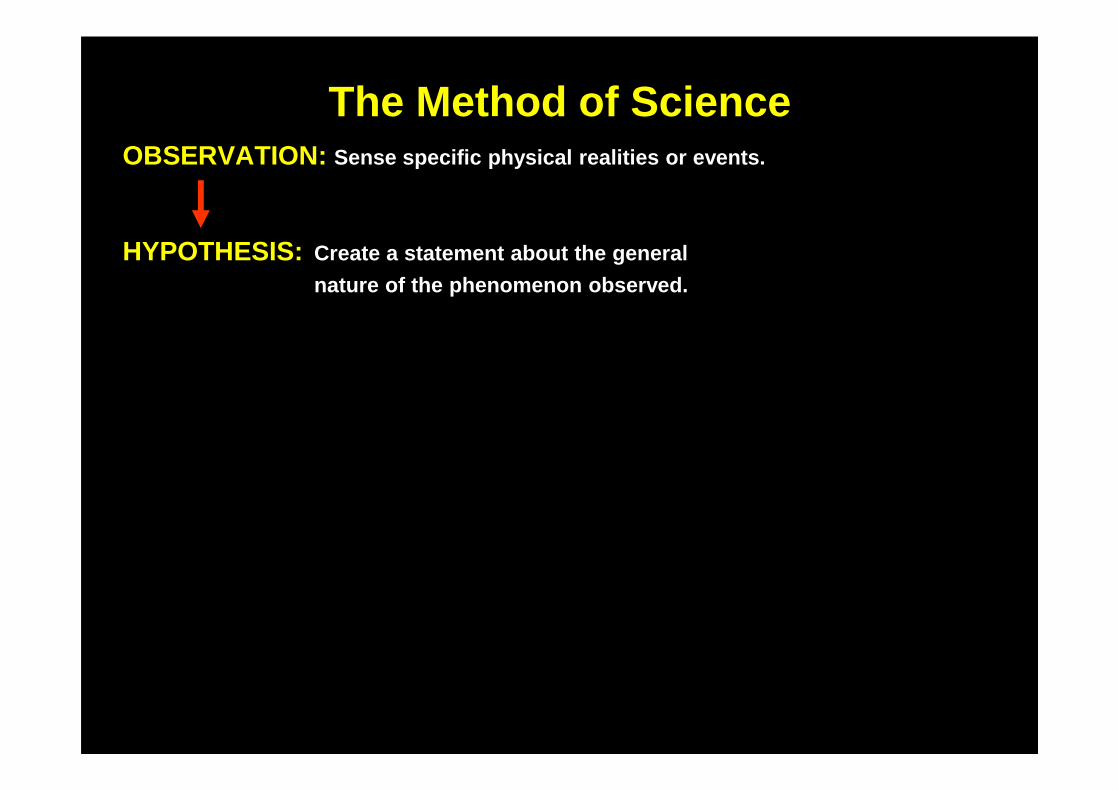
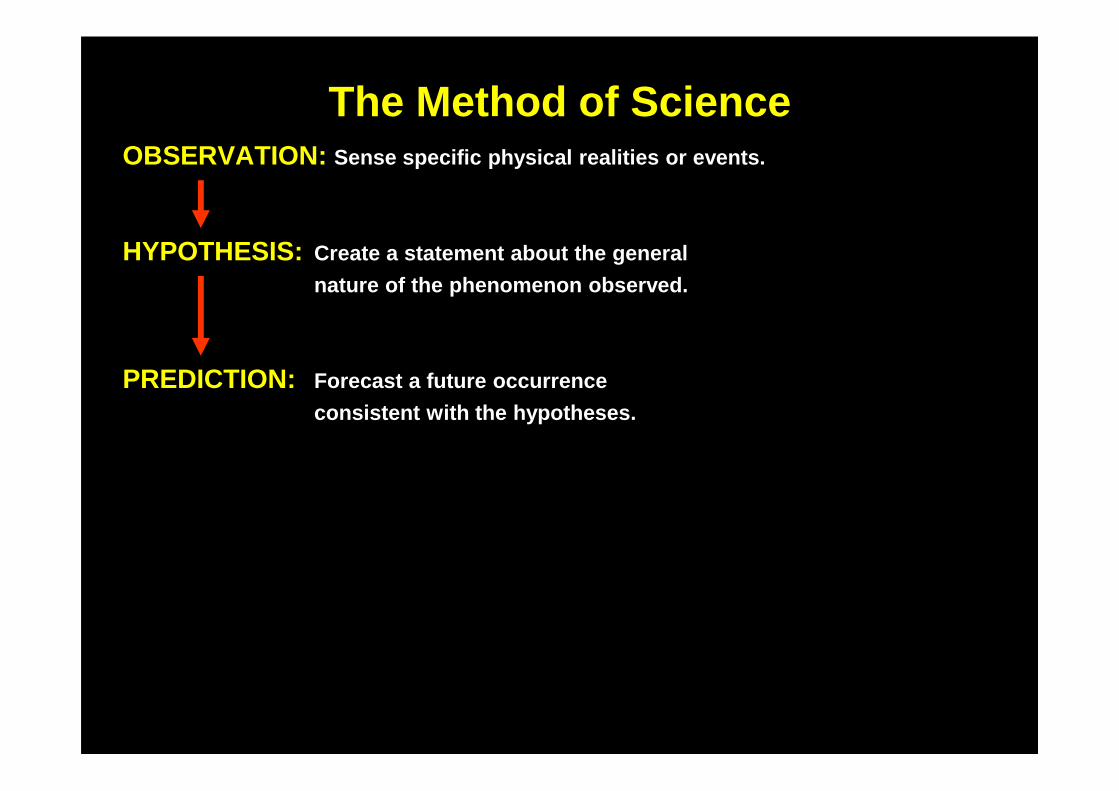
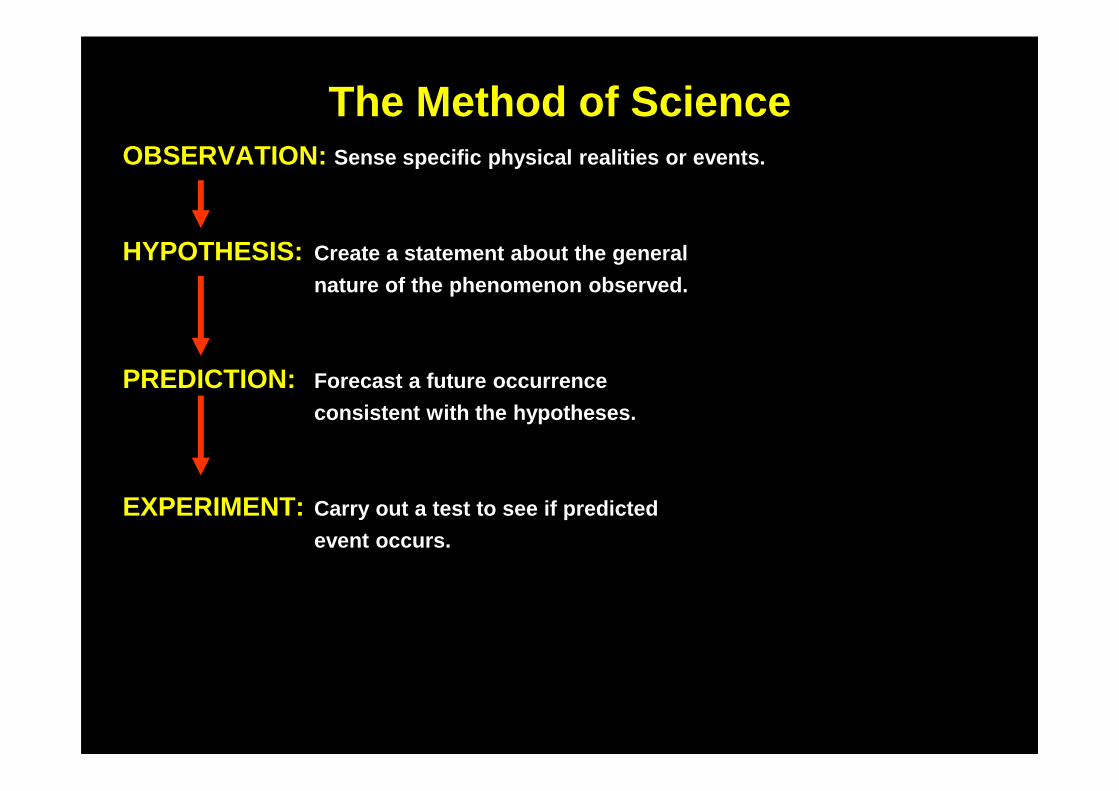
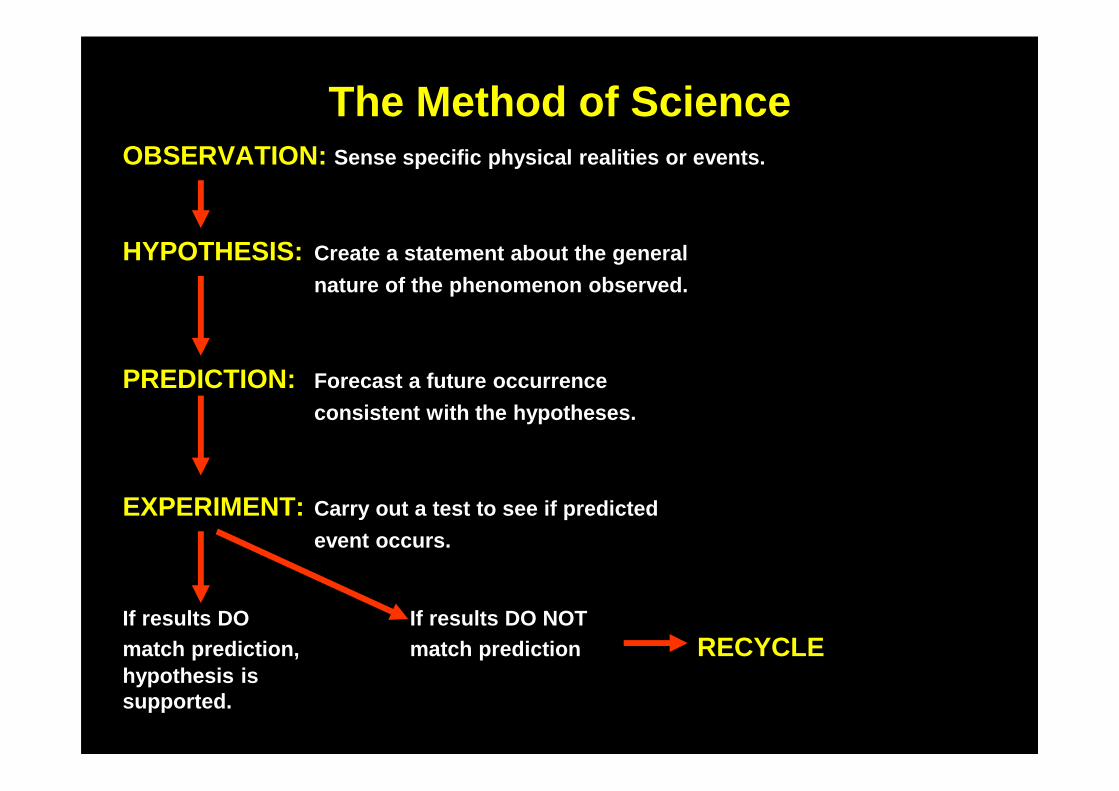
The Method of ScienceOBSERVATION: Sense specific physical realities or events.
HYPOTHESIS: Create a statement about the general REVISEDnature of the phenomenon observed. HYPOTHESIS
PREDICTION: Forecast a future occurrence PREDICTIONconsistent with the hypotheses.
EXPERIMENT: Carry out a test to see if predicted EXPERIMENTevent occurs.
If results DO If results DO NOTmatch prediction, match prediction RECYCLEhypothesis issupported.
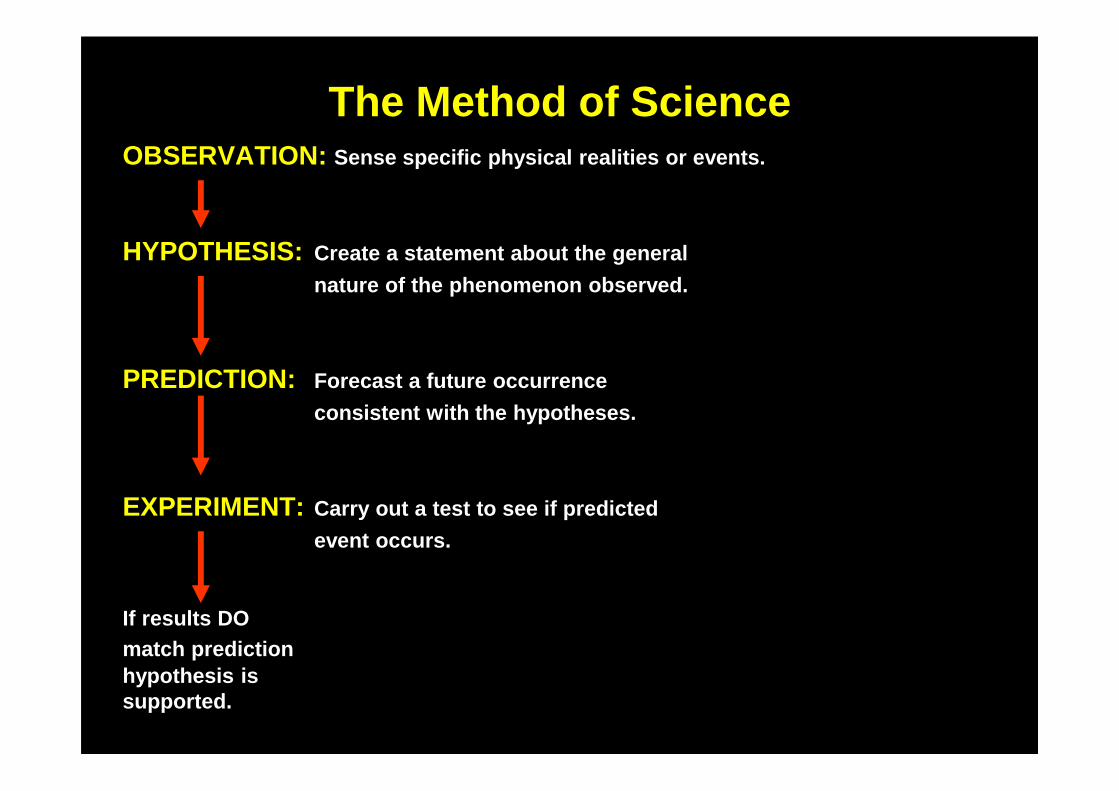
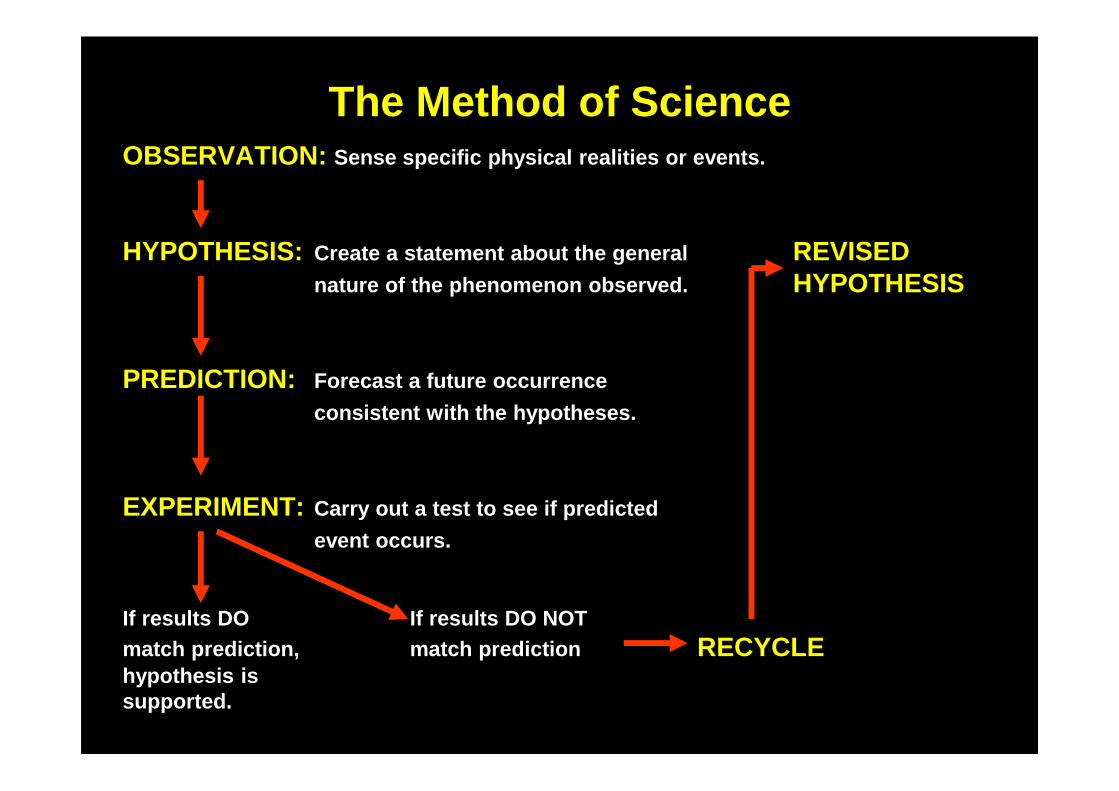
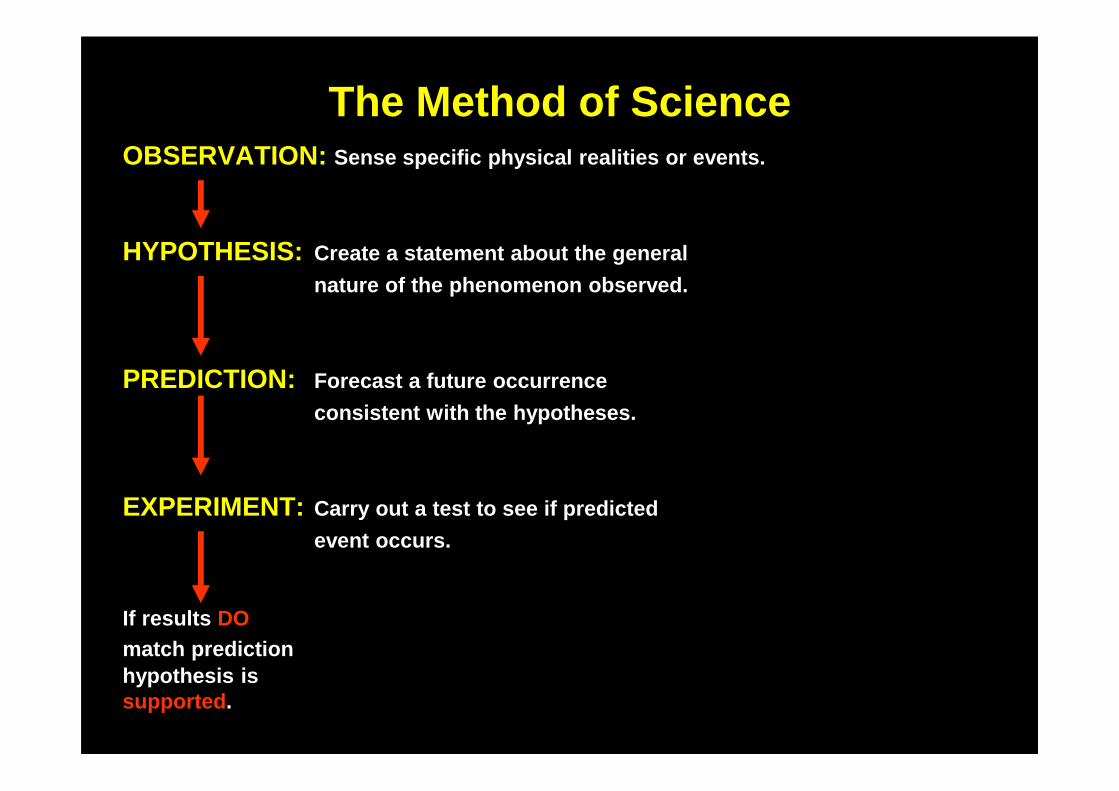
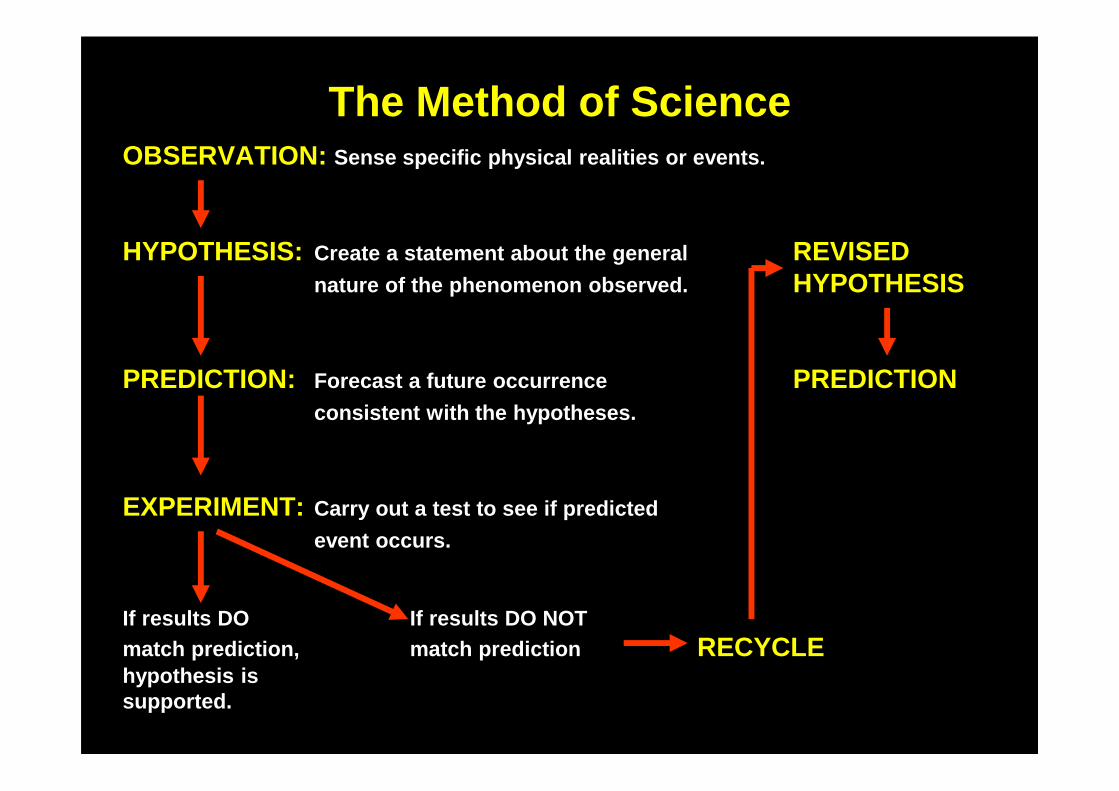
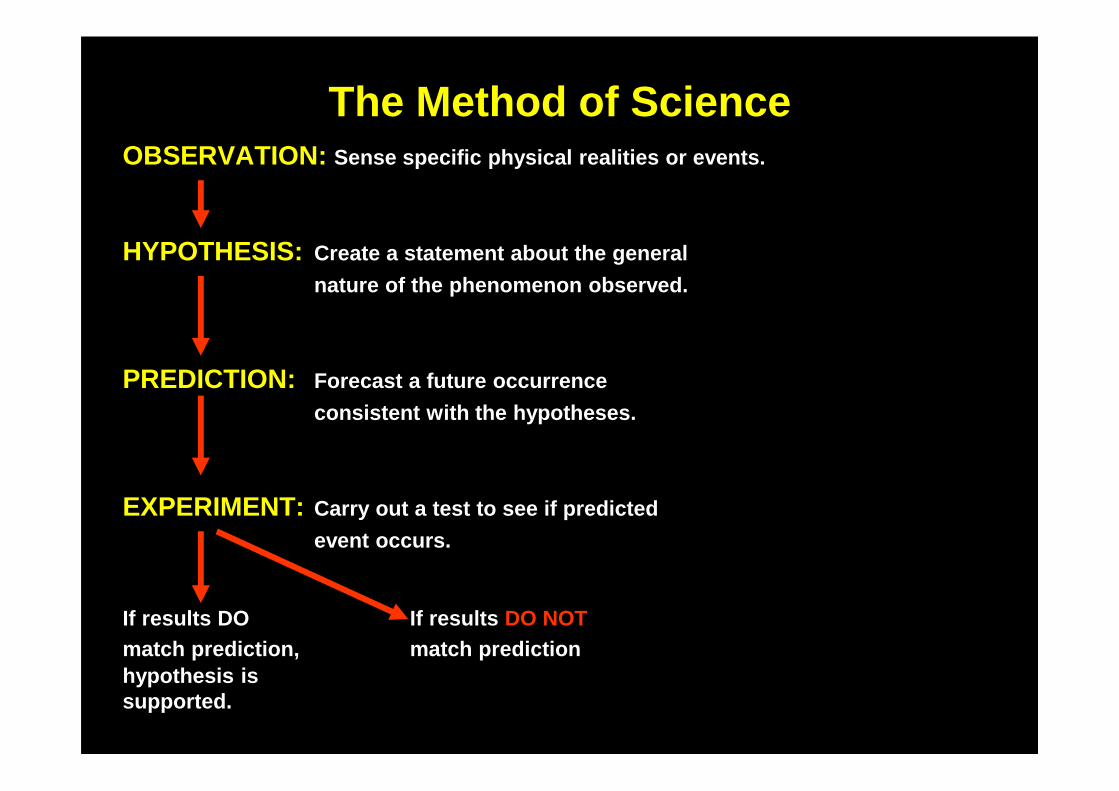
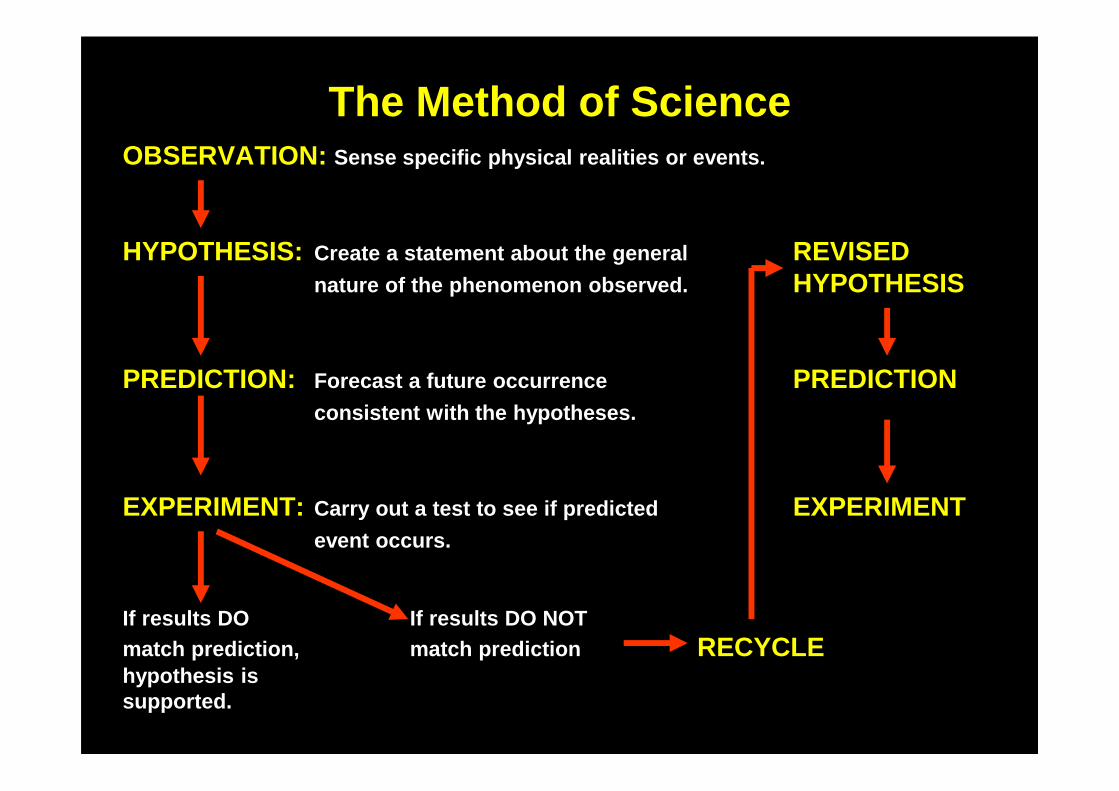
The Method of ScienceOBSERVATION: Sense specific physical realities or events.
HYPOTHESIS: Create a statement about the general REVISEDnature of the phenomenon observed. HYPOTHESIS
PREDICTION: Forecast a future occurrence PREDICTIONconsistent with the hypotheses.
EXPERIMENT: Carry out a test to see if predicted EXPERIMENTevent occurs.
If results DO If results DO NOTmatch prediction , match prediction RECYCLEhypothesis issupported.
The Method of ScienceOBSERVATION: Sense specific physical realities or events.
HYPOTHESIS: Create a statement about the general REVISEDnature of the phenomenon observed. HYPOTHESIS
PREDICTION: Forecast a future occurrence PREDICTIONconsistent with the hypotheses.
EXPERIMENT: Carry out a test to see if predicted EXPERIMENTevent occurs.
If results DO If results DO NOTmatch prediction , match prediction RECYCLEhypothesis issupported .
The Method of ScienceOBSERVATION: Sense specific physical realities or events.
HYPOTHESIS: Create a statement about the general REVISEDnature of the phenomenon observed. HYPOTHESIS
PREDICTION: Forecast a future occurrence PREDICTIONconsistent with the hypotheses.
EXPERIMENT: Carry out a test to see if predicted EXPERIMENTevent occurs.
If results DO If results DO NOTmatch prediction, match prediction RECYCLEhypothesis issupported.
The Method of ScienceOBSERVATION: Sense specific physical realities or events.
HYPOTHESIS: Create a statement about the general REVISEDnature of the phenomenon observed. HYPOTHESIS
PREDICTION: Forecast a future occurrence PREDICTIONconsistent with the hypotheses.
EXPERIMENT: Carry out a test to see if predicted EXPERIMENTevent occurs.
If results DO If results DO NOTmatch prediction, match prediction RECYCLEhypothesis issupported.
No amount of experimentation can ever prove me right; A single experiment can prove me wrong.
Albert Einstein
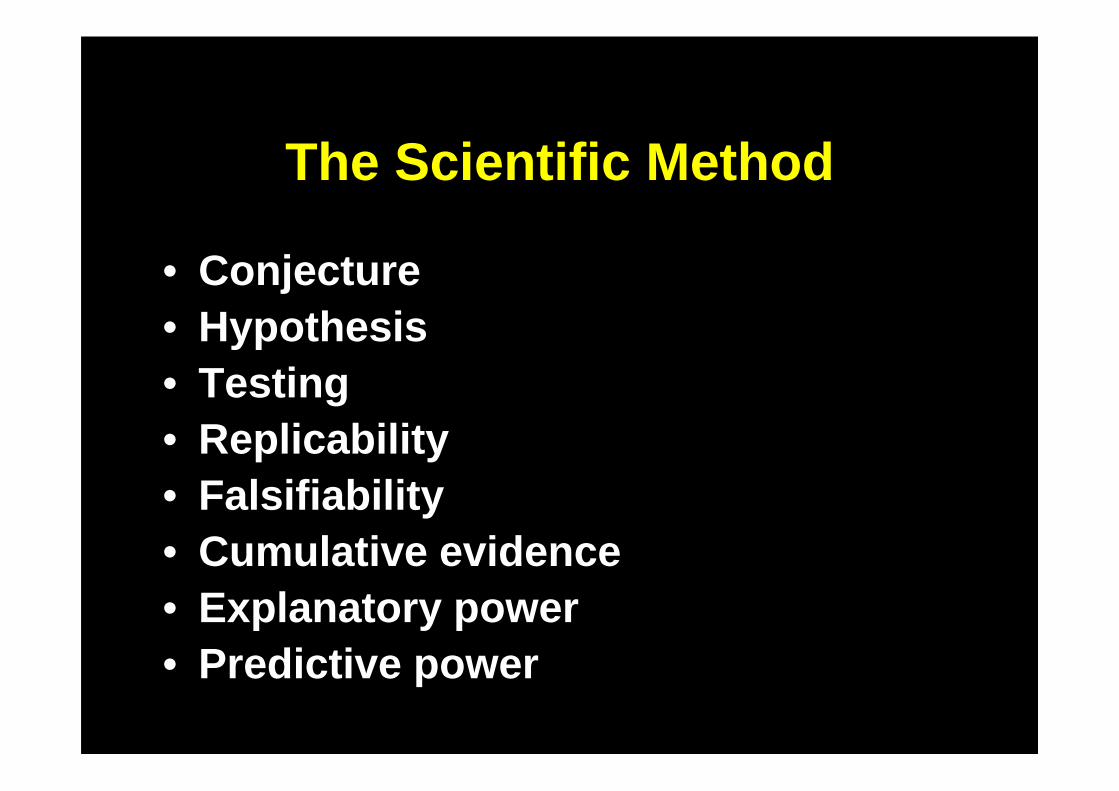
The Scientific Method
• Conjecture• Hypothesis• Testing• Replicability• Falsifiability• Cumulative evidence• Explanatory power• Predictive power
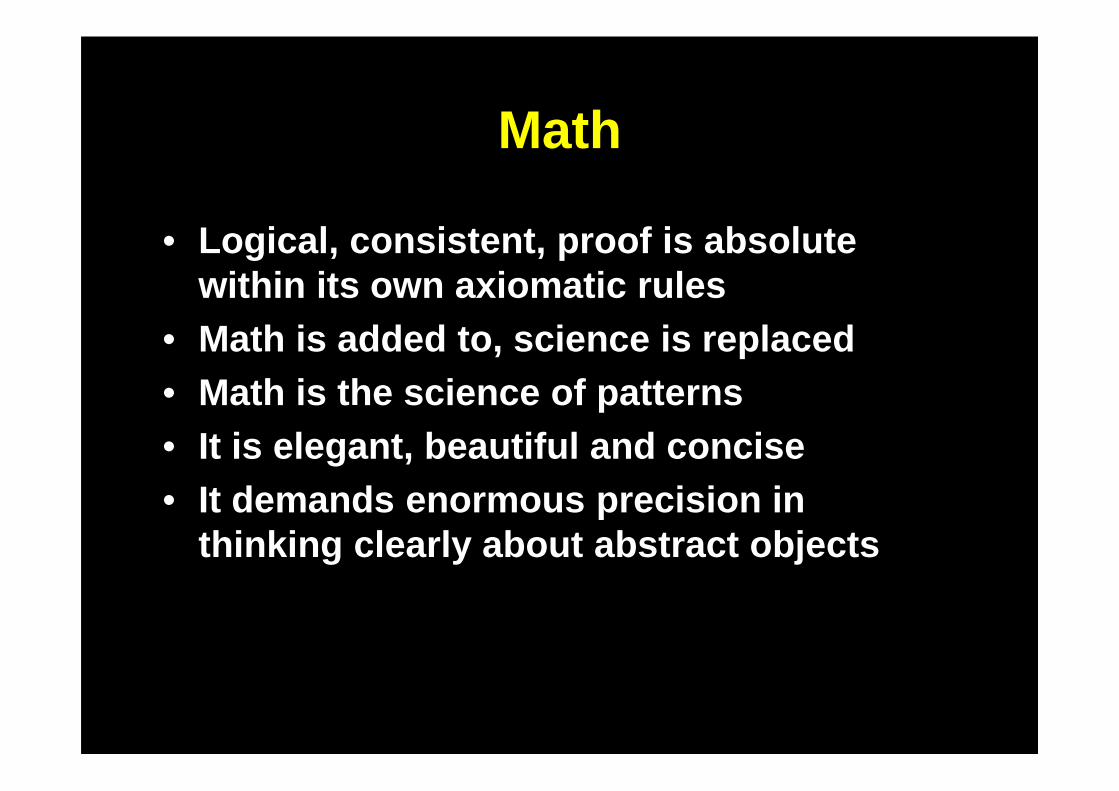
Math
• Logical, consistent, proof is absolute within its own axiomatic rules
• Math is added to, science is replaced• Math is the science of patterns• It is elegant, beautiful and concise• It demands enormous precision in
thinking clearly about abstract objects
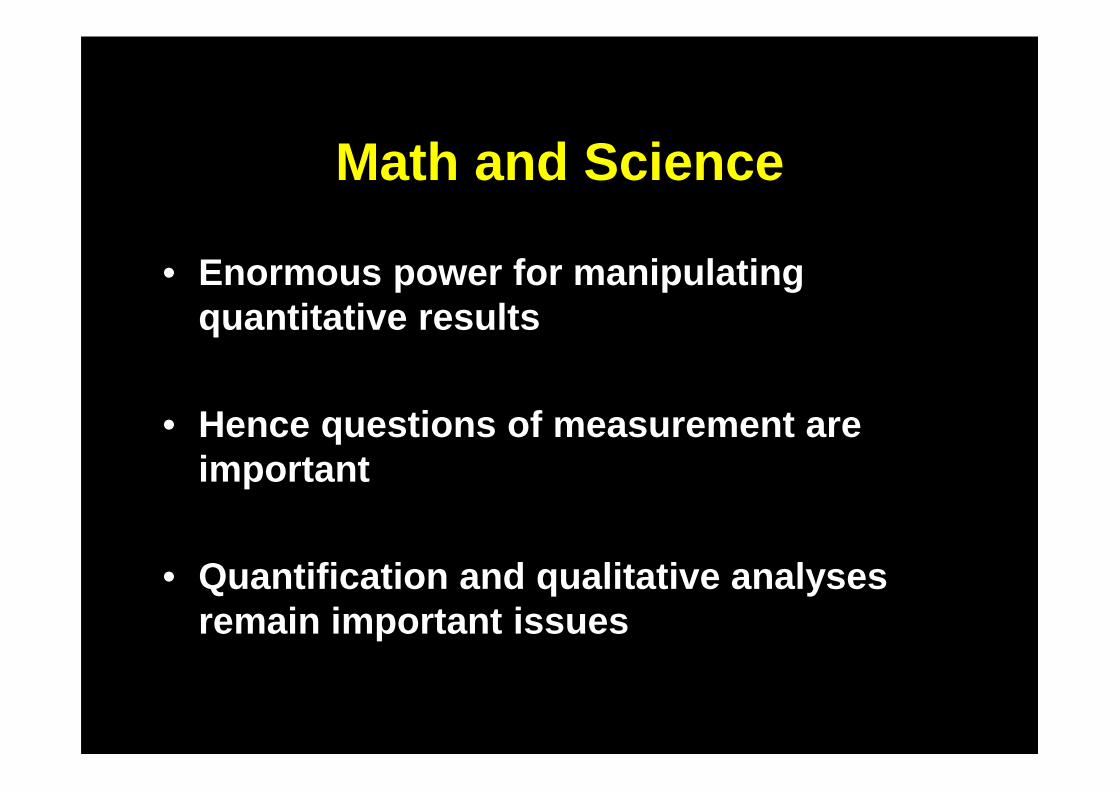
Math and Science
• Enormous power for manipulating quantitative results
• Hence questions of measurement are important
• Quantification and qualitative analyses remain important issues

Back To The Social Sciences

Intellectual Activities
NaturalSciences
PhysicsChemistryAstronomy
GeologyBiology
Etc.
HumanSciences
PsychologyEconomics
Political ScienceSociology
HistoryEtc. Applied Fields
TechnologyEducationMedicine
LawEtc.
Humanities
EstheticsEthics
ReligionPhilosophy
Etc.
Sciences
Curiosity
Influence others
Objective
Subjective
Back To The Scientific Method

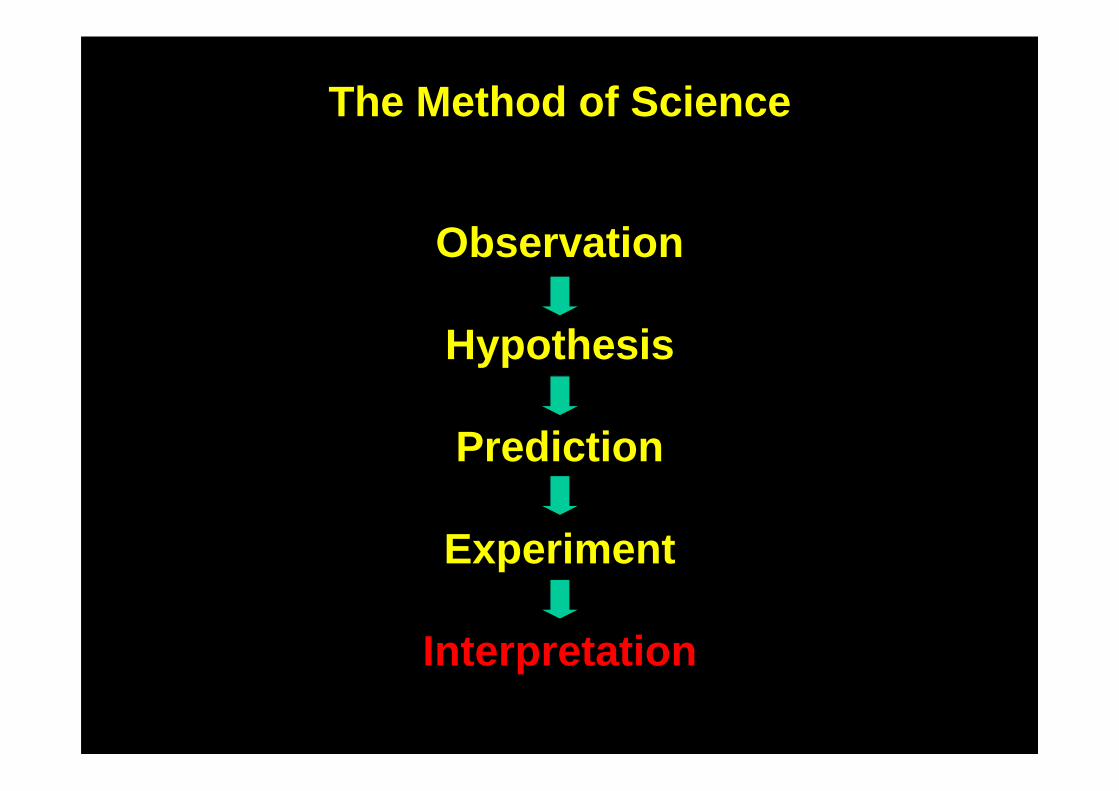
The Method of Science
Observation
Hypothesis
Prediction
Experiment
The Method of Science
Observation
Hypothesis
Prediction
Experiment
Interpretation
But can we apply that empirical method in the social sciences?

Understanding Society To Design
Social Policies
Policy Counts
Economic Growth and Poverty Reduction
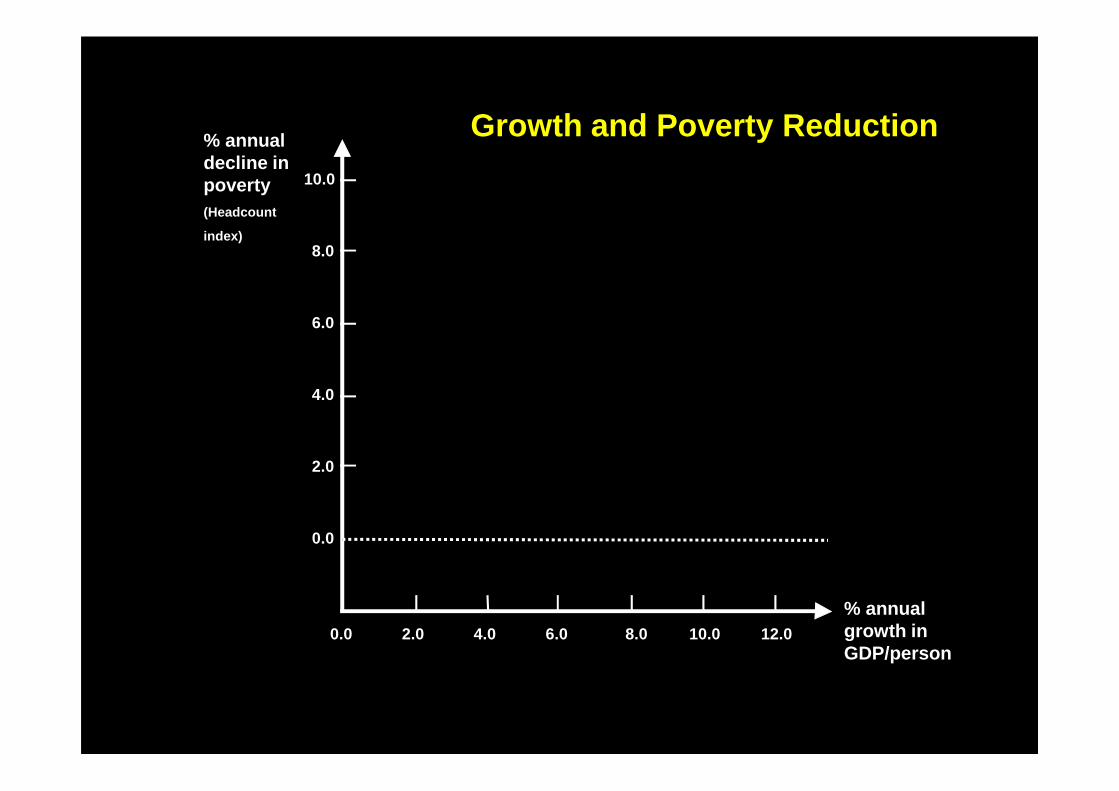
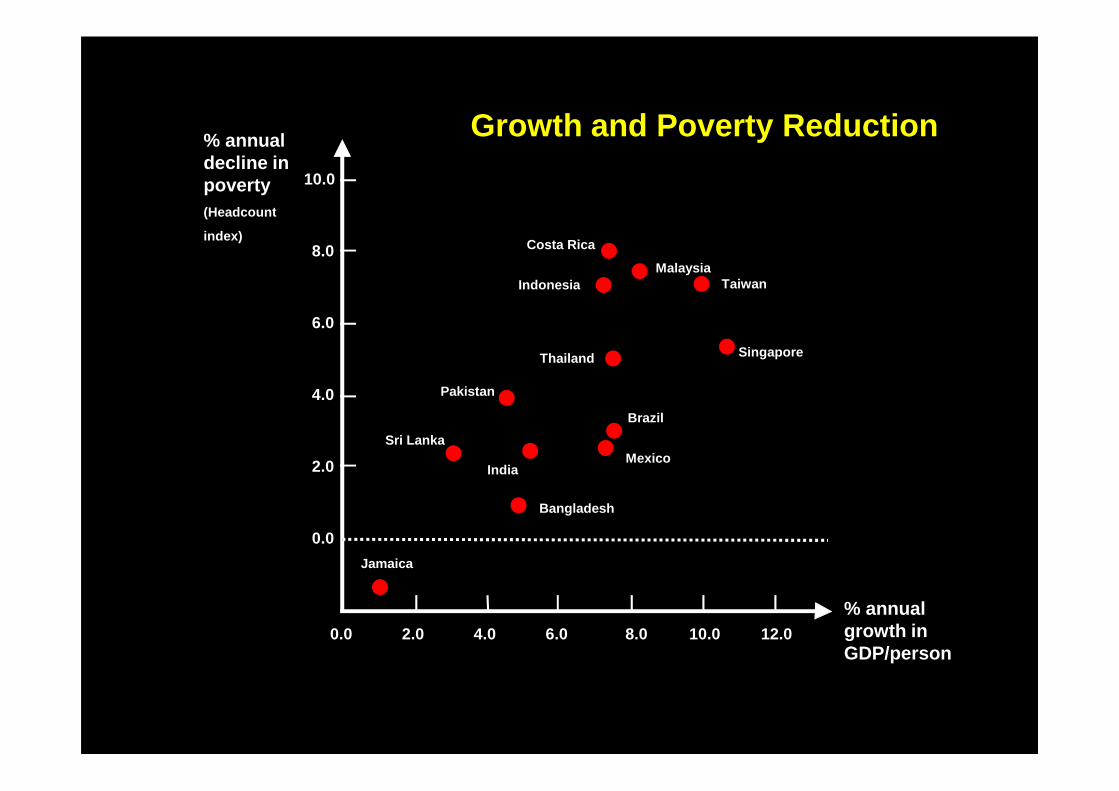
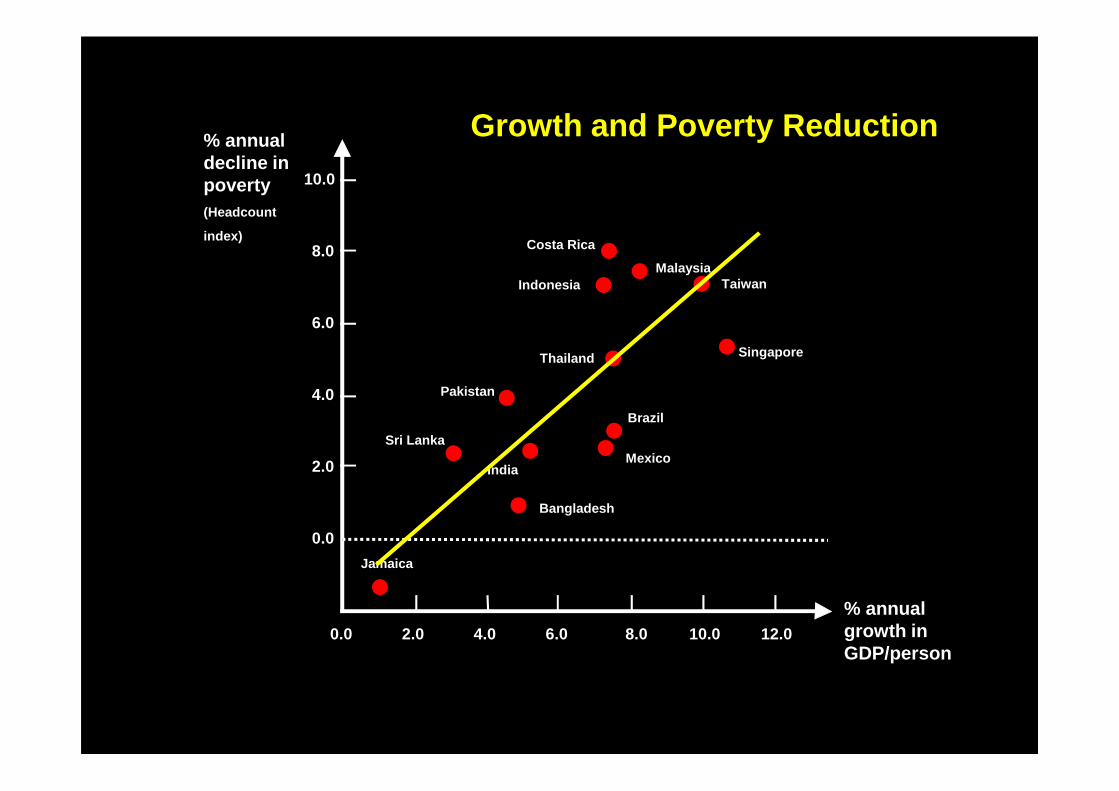
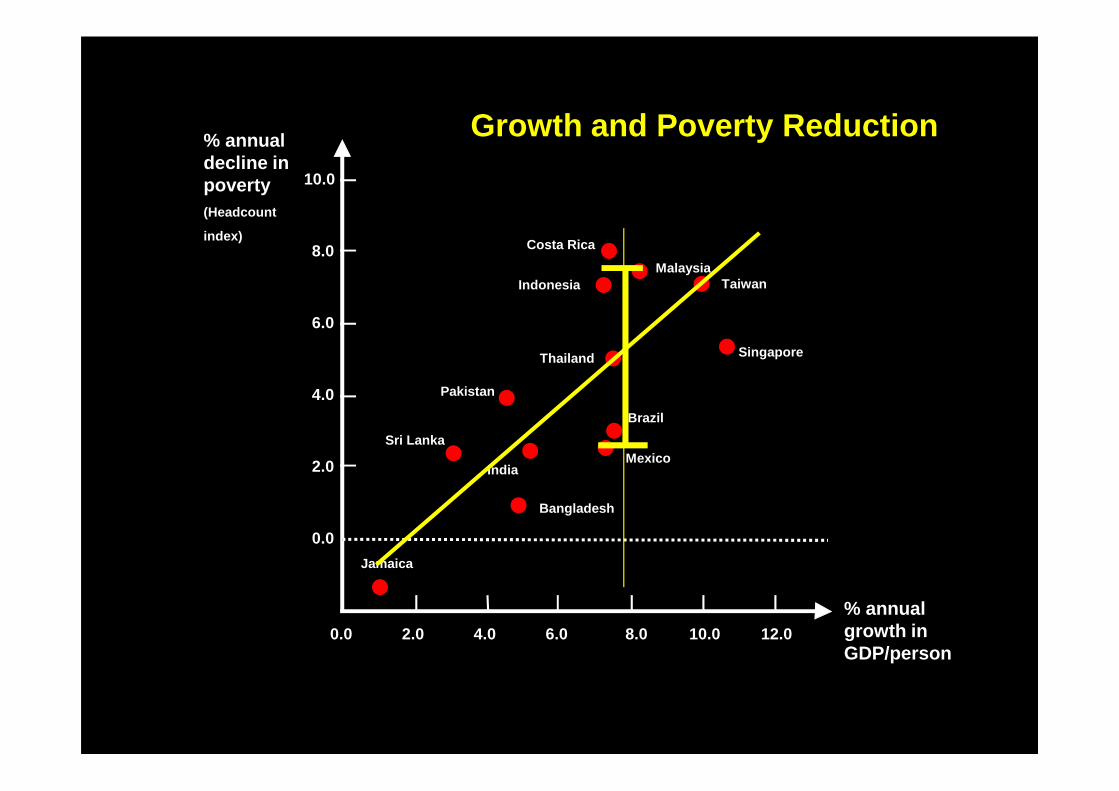
Growth and Poverty Reduction
• Growth is a necessary but not sufficient condition for poverty reduction
• The quality of growth and the nature of the policies matters enormously
0.0
2.0
4.0
6.0
8.0
10.0
10.08.06.04.02.00.0 12.0
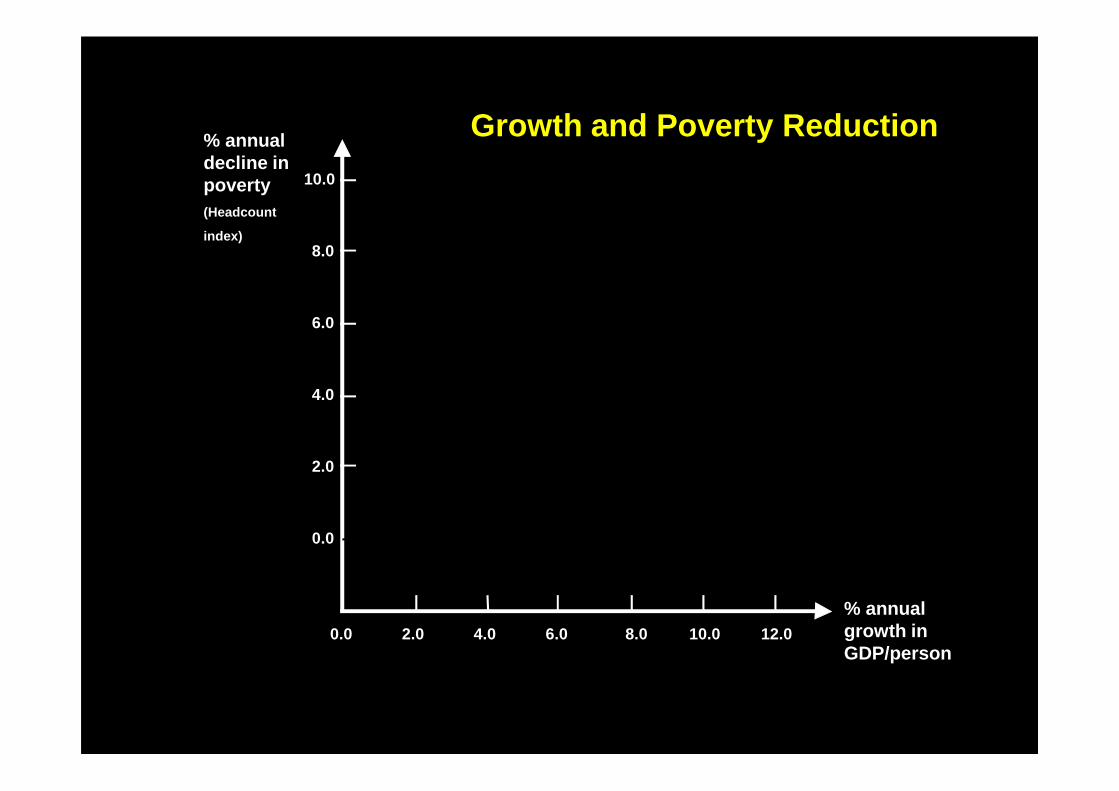
% annual growth in GDP/person
% annual decline in poverty(Headcount
index)
Growth and Poverty Reduction
0.0
2.0
4.0
6.0
8.0
10.0
10.08.06.04.02.00.0 12.0
% annual growth in GDP/person
% annual decline in poverty(Headcount
index)
Growth and Poverty Reduction
0.0
2.0
4.0
6.0
8.0
10.0
10.08.06.04.02.00.0 12.0
% annual growth in GDP/person
% annual decline in poverty(Headcount
index)
Jamaica
Costa Rica
India
MalaysiaIndonesia
SingaporeThailand
Taiwan
Sri LankaMexico
Brazil
Bangladesh
Pakistan
Growth and Poverty Reduction
0.0
2.0
4.0
6.0
8.0
10.0
10.08.06.04.02.00.0 12.0
% annual growth in GDP/person
% annual decline in poverty(Headcount
index)
Jamaica
Costa Rica
India
MalaysiaIndonesia
SingaporeThailand
Taiwan
Sri LankaMexico
Brazil
Bangladesh
Pakistan
Growth and Poverty Reduction

0.0
2.0
4.0
6.0
8.0
10.0
10.08.06.04.02.00.0 12.0
% annual growth in GDP/person
% annual decline in poverty(Headcount
index)
Jamaica
Costa Rica
India
MalaysiaIndonesia
SingaporeThailand
Taiwan
Sri LankaMexico
Brazil
Bangladesh
Pakistan
Growth and Poverty Reduction
0.0
2.0
4.0
6.0
8.0
10.0
10.08.06.04.02.00.0 12.0
% annual growth in GDP/person
% annual decline in poverty(Headcount
index)
Jamaica
Costa Rica
India
MalaysiaIndonesia
SingaporeThailand
Taiwan
Sri LankaMexico
Brazil
Bangladesh
Pakistan
Growth and Poverty Reduction
Policies, Inequality and Welfare
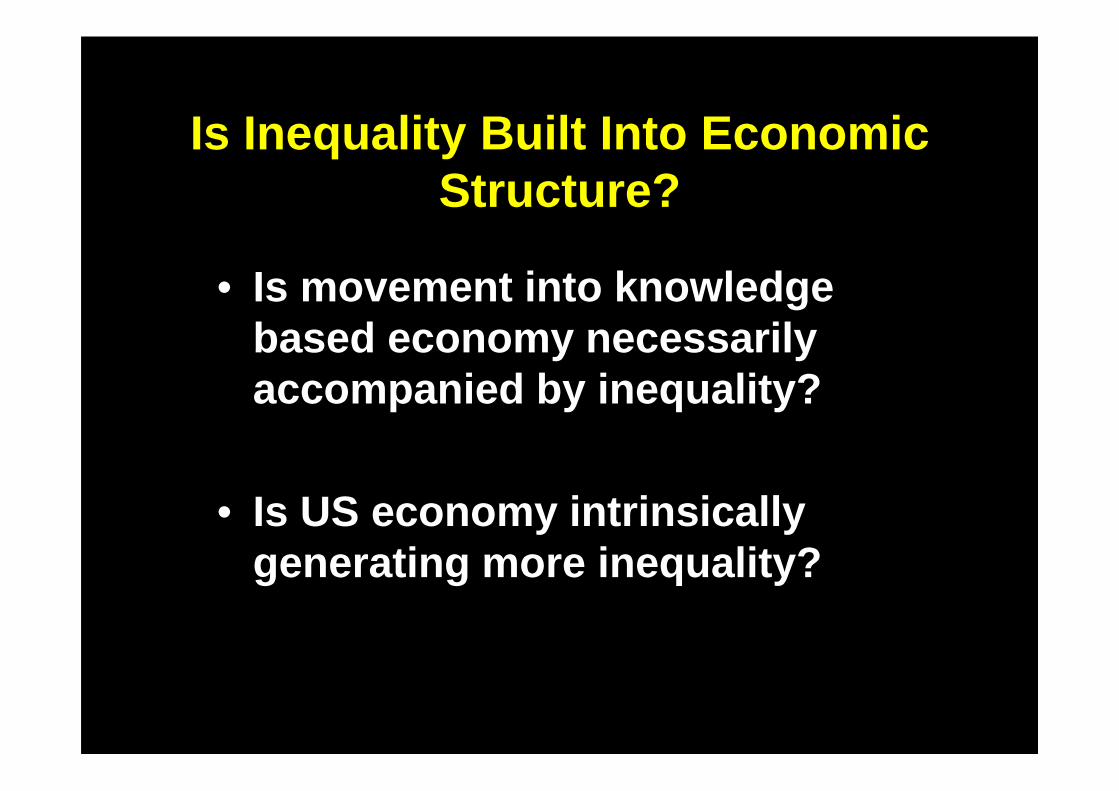
Is Inequality Built Into Economic Structure?
• Is movement into knowledge based economy necessarily accompanied by inequality?
• Is US economy intrinsically generating more inequality?
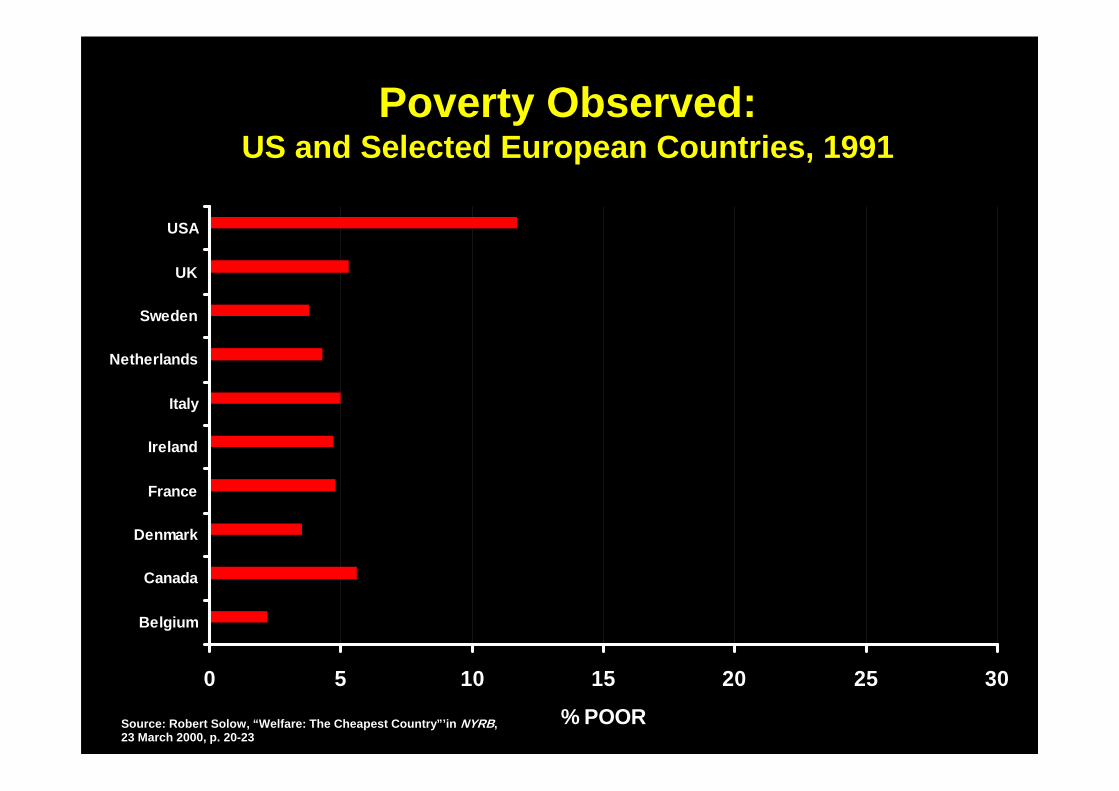
Poverty Observed: US and Selected European Countries, 1991
0 5 10 15 20 25 30
Belgium
Canada
Denmark
France
Ireland
Italy
Netherlands
Sweden
UK
USA
% POORSource: Robert Solow, “Welfare: The Cheapest Countr y”’in NYRB, 23 March 2000, p. 20-23
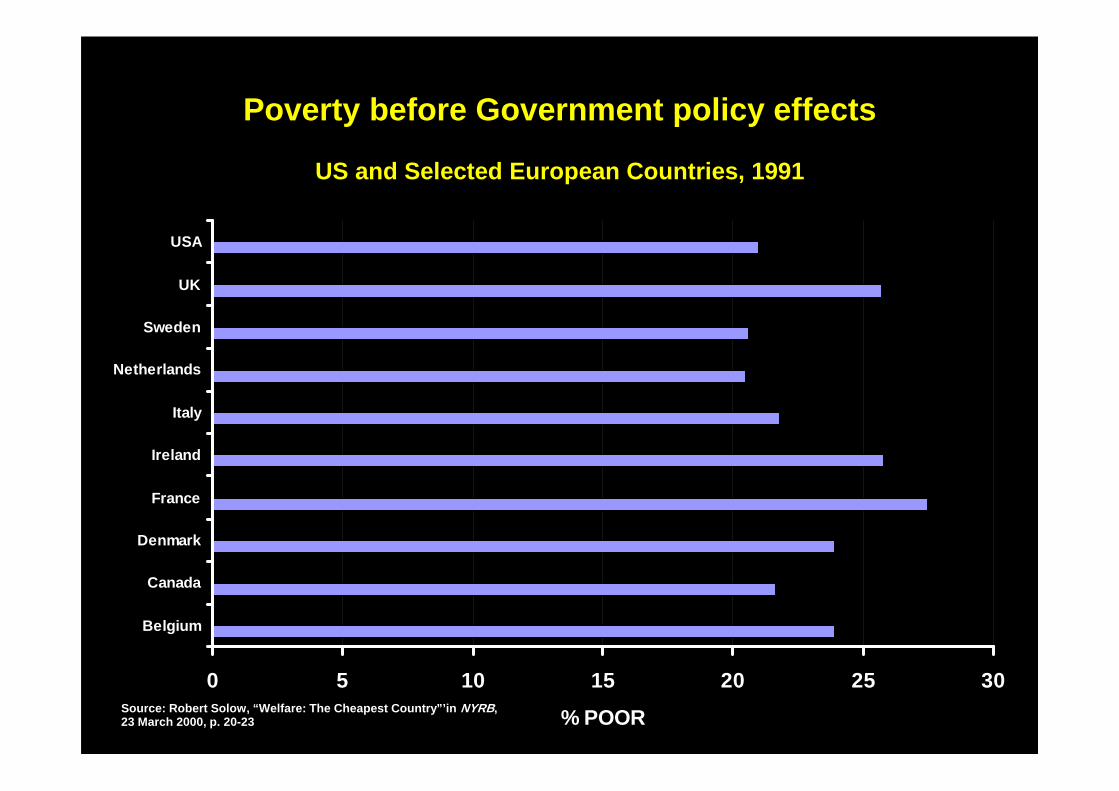
Poverty before Government policy effects
US and Selected European Countries, 1991
0 5 10 15 20 25 30
Belgium
Canada
Denmark
France
Ireland
Italy
Netherlands
Sweden
UK
USA
% POORSource: Robert Solow, “Welfare: The Cheapest Countr y”’in NYRB, 23 March 2000, p. 20-23
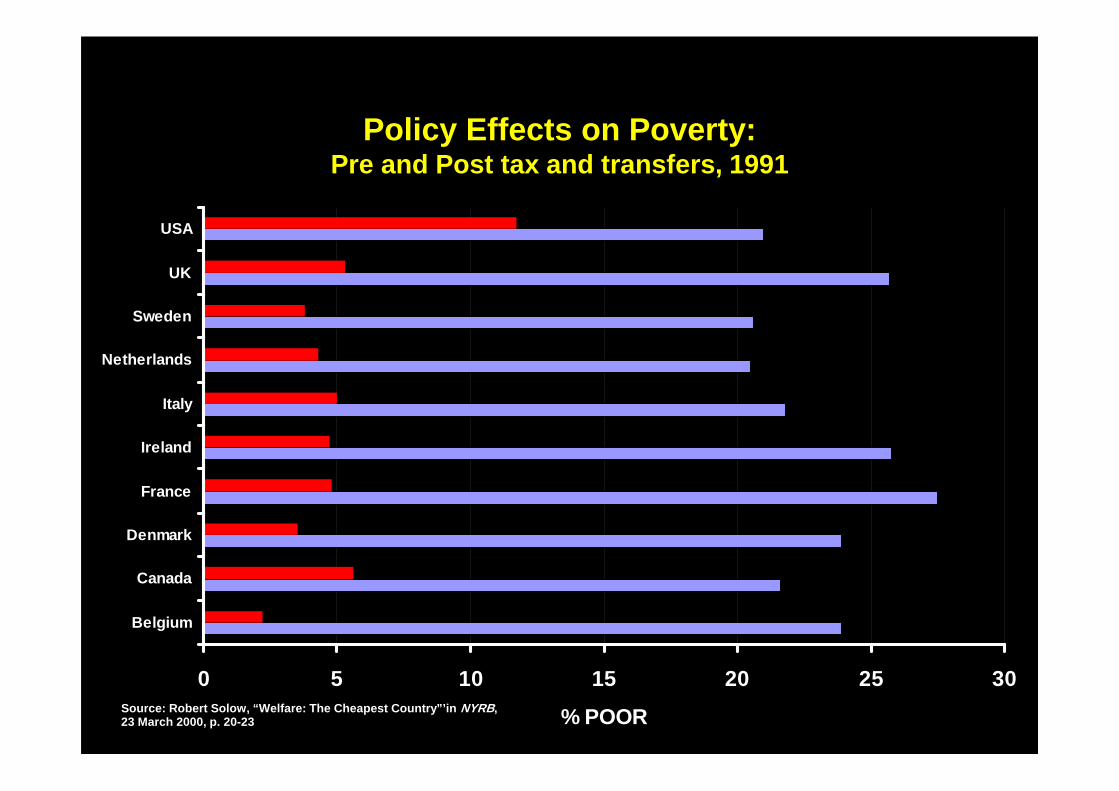
Policy Effects on Poverty:Pre and Post tax and transfers, 1991
0 5 10 15 20 25 30
Belgium
Canada
Denmark
France
Ireland
Italy
Netherlands
Sweden
UK
USA
% POORSource: Robert Solow, “Welfare: The Cheapest Countr y”’in NYRB, 23 March 2000, p. 20-23
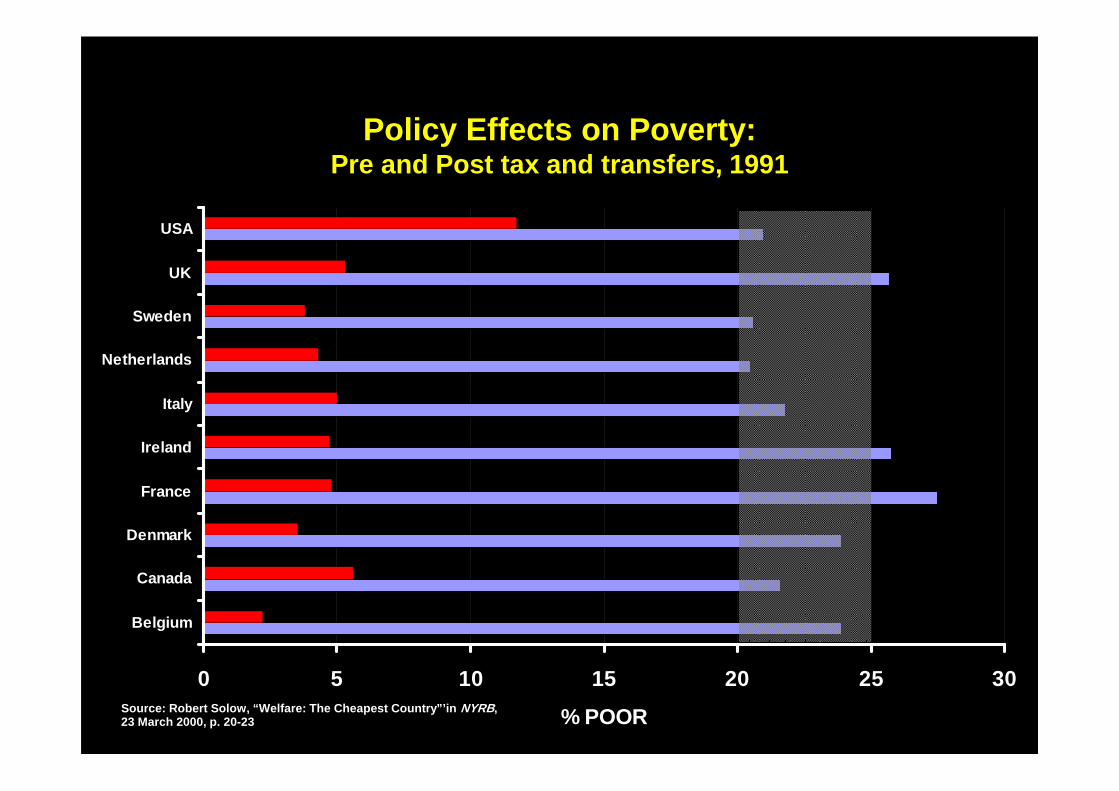
Policy Effects on Poverty:Pre and Post tax and transfers, 1991
0 5 10 15 20 25 30
Belgium
Canada
Denmark
France
Ireland
Italy
Netherlands
Sweden
UK
USA
% POORSource: Robert Solow, “Welfare: The Cheapest Countr y”’in NYRB, 23 March 2000, p. 20-23
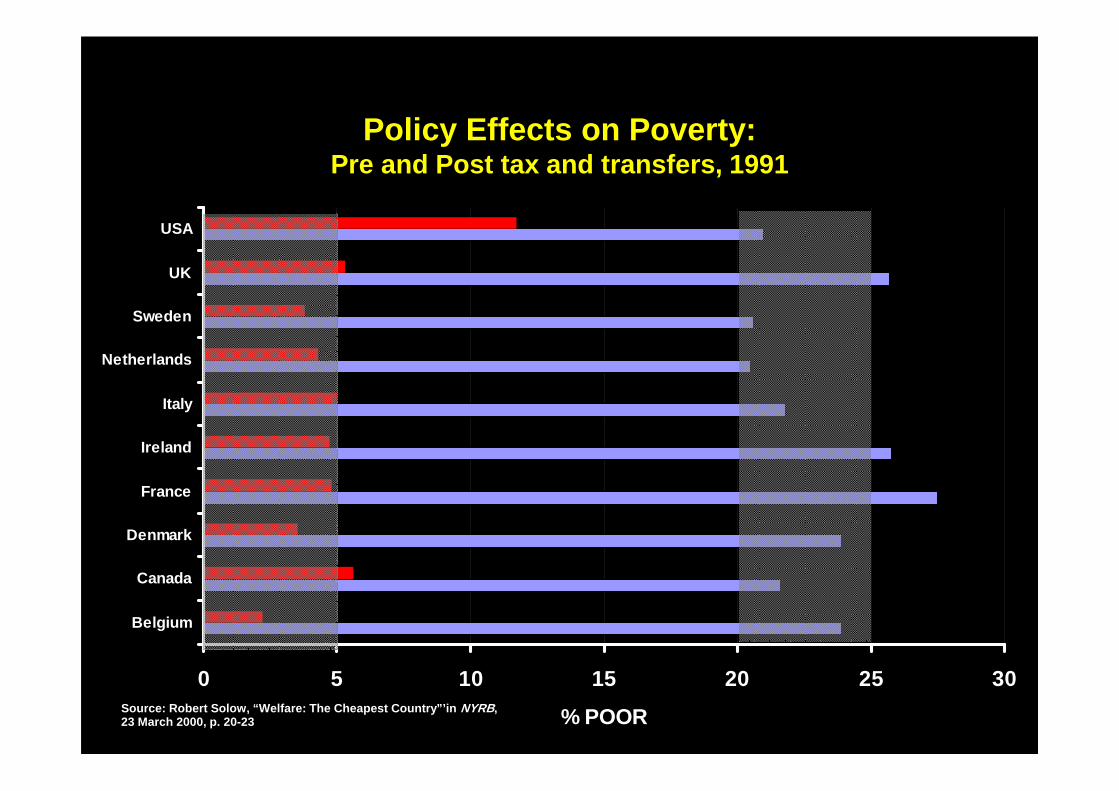
Policy Effects on Poverty:Pre and Post tax and transfers, 1991
0 5 10 15 20 25 30
Belgium
Canada
Denmark
France
Ireland
Italy
Netherlands
Sweden
UK
USA
% POORSource: Robert Solow, “Welfare: The Cheapest Countr y”’in NYRB, 23 March 2000, p. 20-23
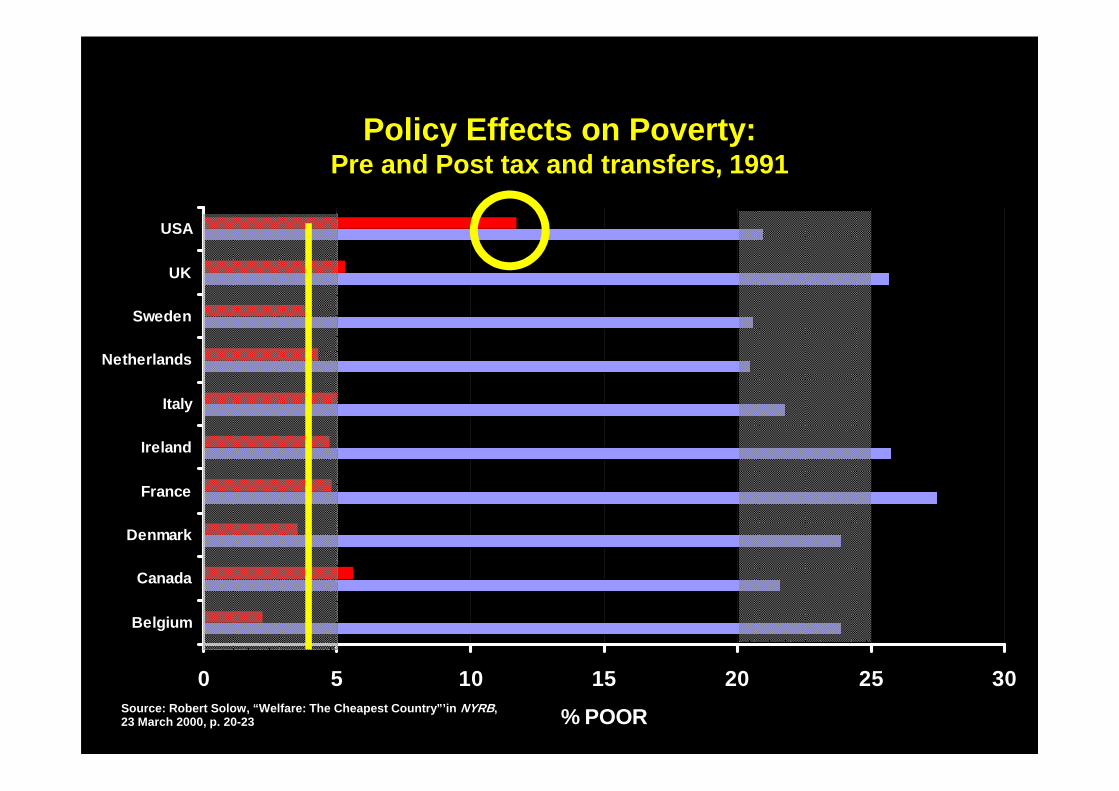
Policy Effects on Poverty:Pre and Post tax and transfers, 1991
0 5 10 15 20 25 30
Belgium
Canada
Denmark
France
Ireland
Italy
Netherlands
Sweden
UK
USA
% POORSource: Robert Solow, “Welfare: The Cheapest Countr y”’in NYRB, 23 March 2000, p. 20-23
Why Quantitative Analysis ?
The Importance of Social Research
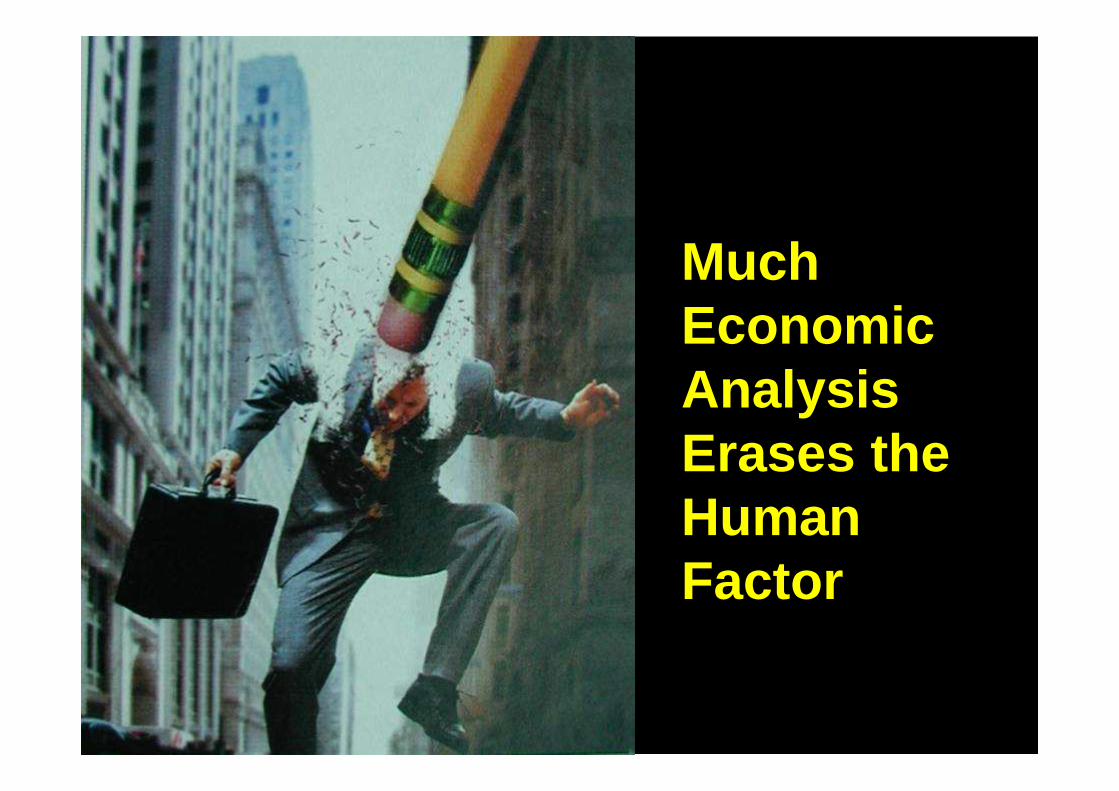
Much Economic Analysis Erases the Human Factor

The Need for Social Inputs Into Development Decisions
• Social policy is more than the social consequences of economic policies
• Social goals and policies complement economic ones
• Economic Analysis by itself is insufficient: Social, cultural, political and ethical dimensions must be introduced
Elements Of A Social Policy - I
• To maintain social cohesion• To foster equity
• To reach the ultra poor and other marginalized groups
• To uphold cultural identity (shared universal values and solidarity, not divisive micro -identities)
Elements Of A Social Policy - II
• To promote participation (voice, choice and empowerment through access to knowledge and resources)
• To facilitate social mobility (inter-generational, geographic and occupational)
• To support institutional development• To enable participatory social
research
Participatory Social Research
• Promotes more effective understanding
• Leads to sounder policy and program designs
• Empowers the people participating in the research
Social Research and Decision Making
• Coherent Framework
• Predictive
• Prescriptive
Social Research and Decision Making
• Coherent Framework
• Predictive
• Prescriptive
Social Research and Decision Making
• Coherent Framework
• Predictive
• Prescriptive
Crisis in the Non -economic Social Sciences
• Absence of theoretical framework for the dynamics of social change
• The negative impact of the post-modern currents
• Confusion about quantitative and qualitative aspects pf research
• The misunderstood role of models
Crisis in the Non -economic Social Sciences
• Absence of theoretical framework for the dynamics of social change
• The negative impact of the post-modern currents
• Confusion about quantitative and qualitative aspects pf research
• The misunderstood role of models
Crisis in the Non -economic Social Sciences
• Absence of theoretical framework for the dynamics of social change
• The negative impact of the post-modern currents
• Confusion about quantitative and qualitative aspects of research
• The misunderstood role of models
Crisis in the Non -economic Social Sciences
• Absence of theoretical framework for the dynamics of social change
• The negative impact of the post-modern currents
• Confusion about quantitative and qualitative aspects of research
• The misunderstood role of models

Crisis in the Non -economic Social Sciences
• Absence of a theoretical framework for the dynamics of social change
• The negative impact of the post-modern currents
• Confusion about quantitative and qualitative aspects of research
• The misunderstood role of models
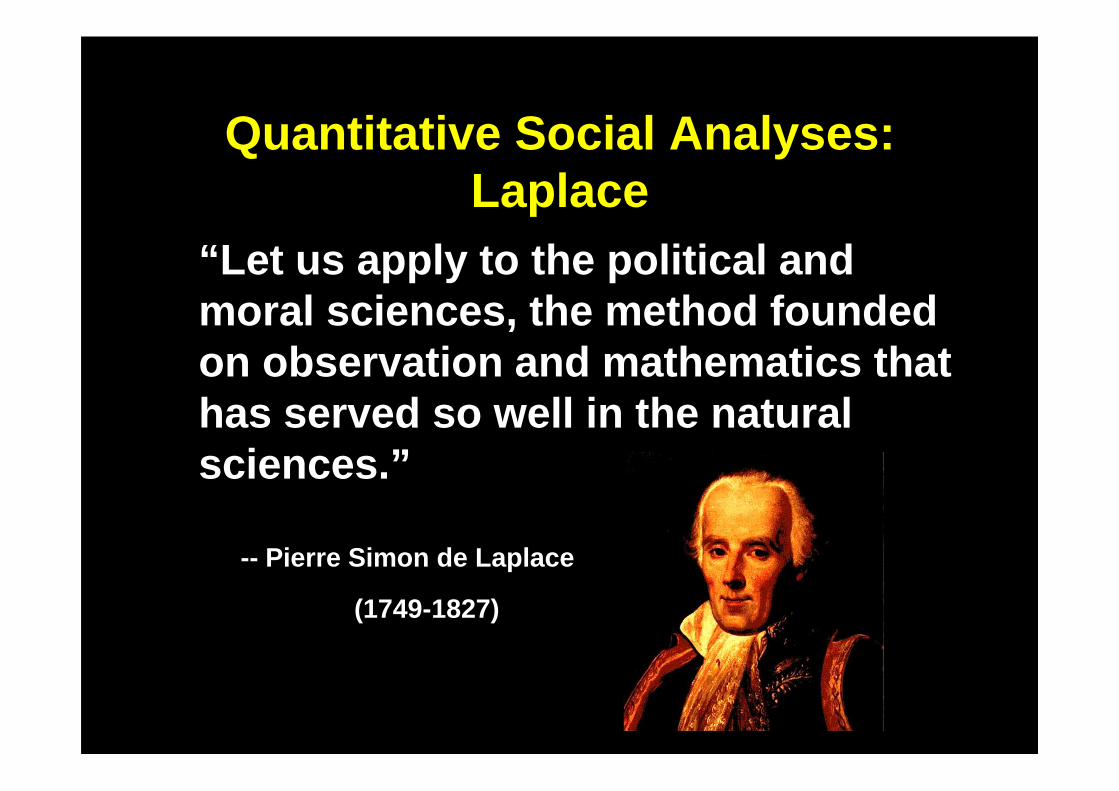
Quantitative Social Analyses:Laplace
“Let us apply to the political and moral sciences, the method founded on observation and mathematics that has served so well in the natural sciences.”
-- Pierre Simon de Laplace
(1749-1827)

Quantitative Social Analyses:Quetelet
“The more advanced the sciences have become, the more they have tended to enter the domain of mathematics, which is a sort of center toward which they converge. We can judge of the perfection toward which a science has come by the facility, more or less great, with which it may be approached by calculation.”
-- Quetelet (1796-1874)
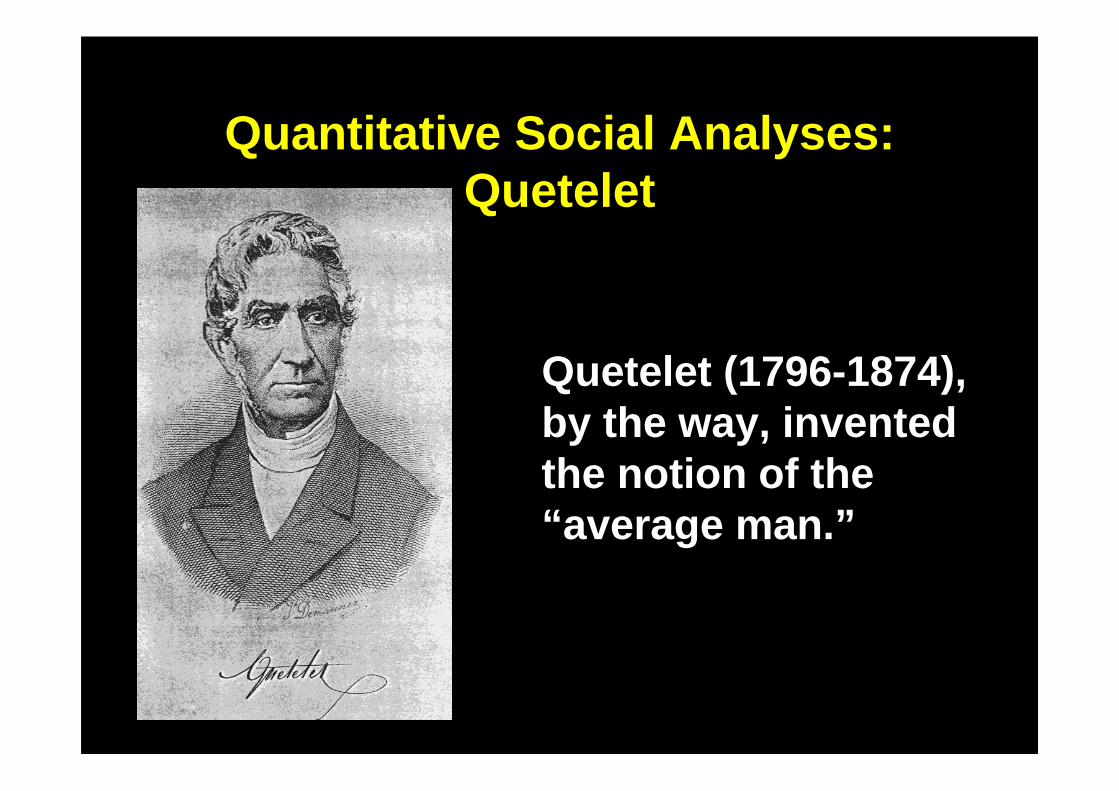
Quantitative Social Analyses:Quetelet
Quetelet (1796 -1874), by the way, invented the notion of the “average man.”
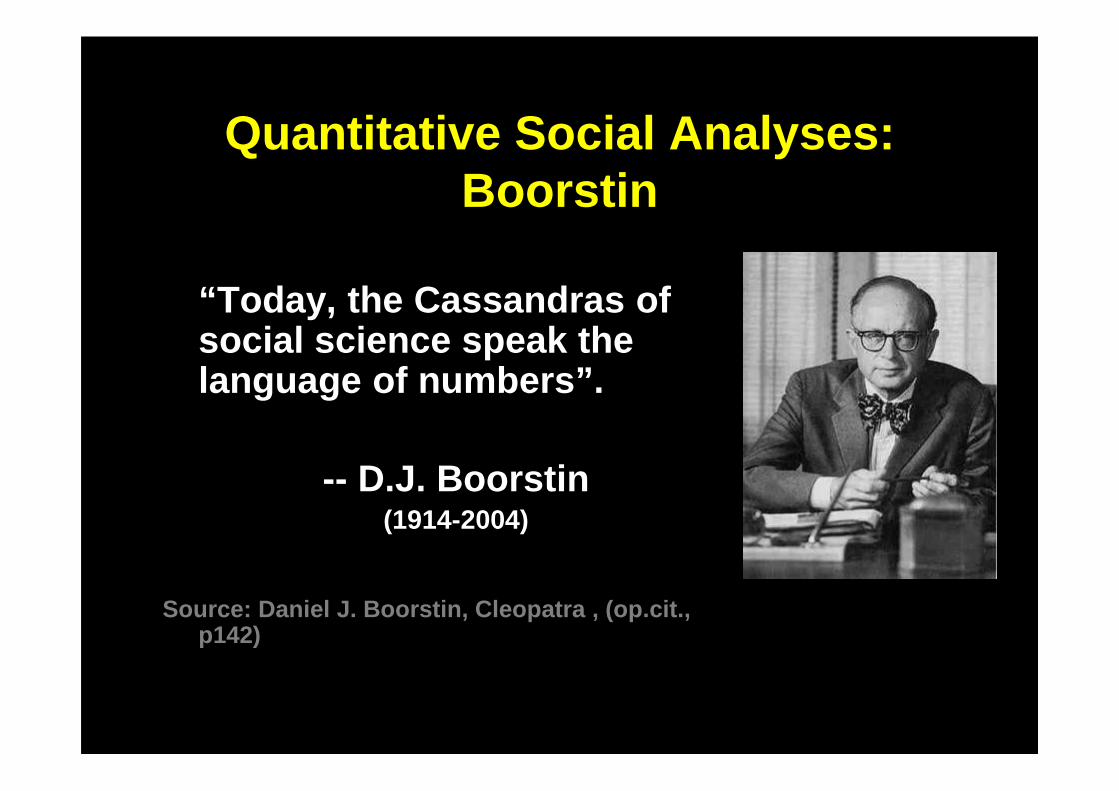
Quantitative Social Analyses:Boorstin
“Today, the Cassandras of social science speak the language of numbers”.
-- D.J. Boorstin (1914-2004)
Source: Daniel J. Boorstin, Cleopatra , (op.cit., p142)
Vehement Reactions
• Dehumanizing the humanities• Denies individualism• Treats people like products or
machines• Economics is not the whole story• Etc. etc.
Serageldin On Reductionist Views
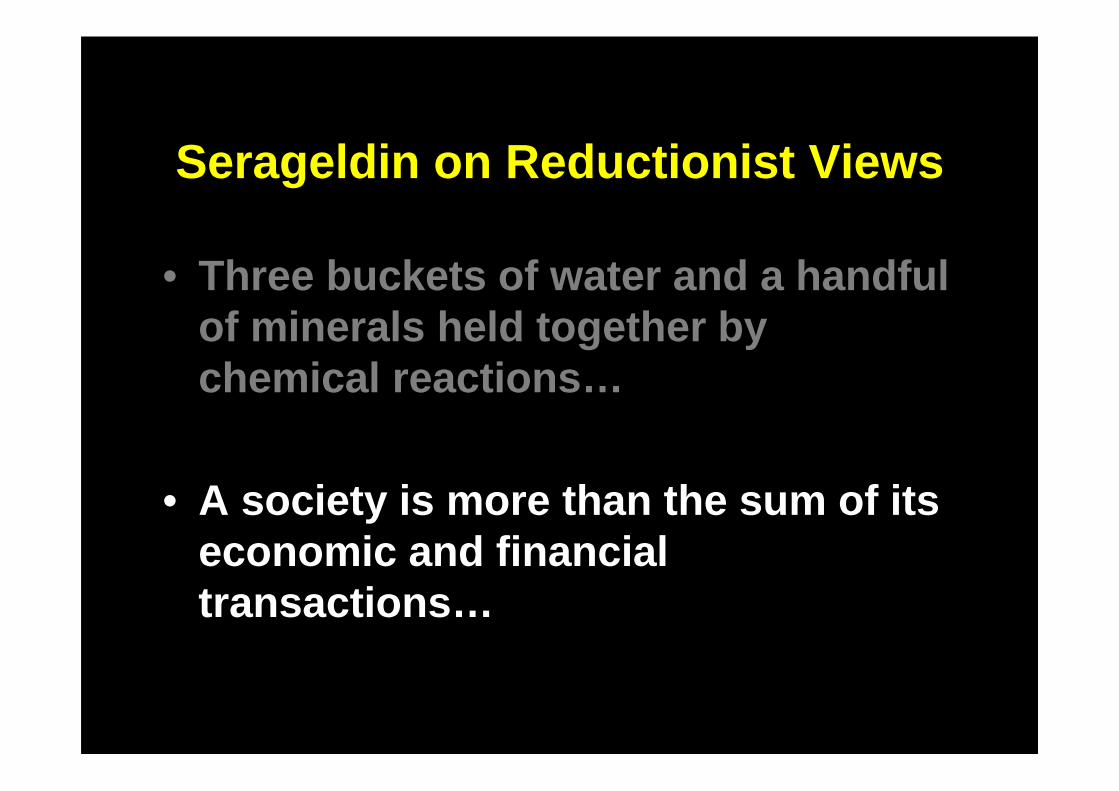
Serageldin on Reductionist Views
• Three buckets of water and a handful of minerals held together by chemical reactions…
• A society is more than the sum of its economic and financial transactions…
+

≠
Serageldin on Reductionist Views
• Three buckets of water and a handful of minerals held together by chemical reactions…
• A society is more than the sum of its economic and financial transactions…

≠
Conclusions
• We need more, not less, sophisticated approaches…
• Clever word games are not helpful to either explain social realities or to help formulate polices and interventions that improve the well-being of people
But we need quantitative analysis to understand, and to
measure and to devise appropriate Social policies
Quantitative Analysis complements Qualitative
analysis and frequently under-girds it.
On Measurement
Measurement counts
Measurement Is Important
• We treasure what we measure• Prescription and dosage depend
upon accurate estimation of magnitudes
• Establishing trends is as – or more --important than snapshots of magnitudes
• Monitoring of progress over time

Measurement Is Important
• We treasure what we measure• Prescription and dosage depend
upon accurate estimation of magnitudes
• Establishing trends is as – or more --important than snapshots of magnitudes
• Monitoring of progress over time
Measurement Is Important
• We treasure what we measure• Prescription and dosage depend
upon accurate estimation of magnitudes
• Establishing trends is as – or more --important than snapshots of magnitudes
• Monitoring of progress over time
Measurement Is Important
• We treasure what we measure• Prescription and dosage depend
upon accurate estimation of magnitudes
• Establishing trends is as – or more --important than snapshots of magnitudes
• Monitoring of progress over time
Measurement Is Important
• We treasure what we measure• Prescription and dosage depend
upon accurate estimation of magnitudes
• Establishing trends is as – or more --important than snapshots of magnitudes
• Monitoring of progress over time
143/xxx
On Measurement
• Accuracy & Precision
• Resolution & Randomness
• Types of Scales
144/xxx
On Measurement
• Accuracy & Precision
• Resolution & Randomness
• Types of Scales
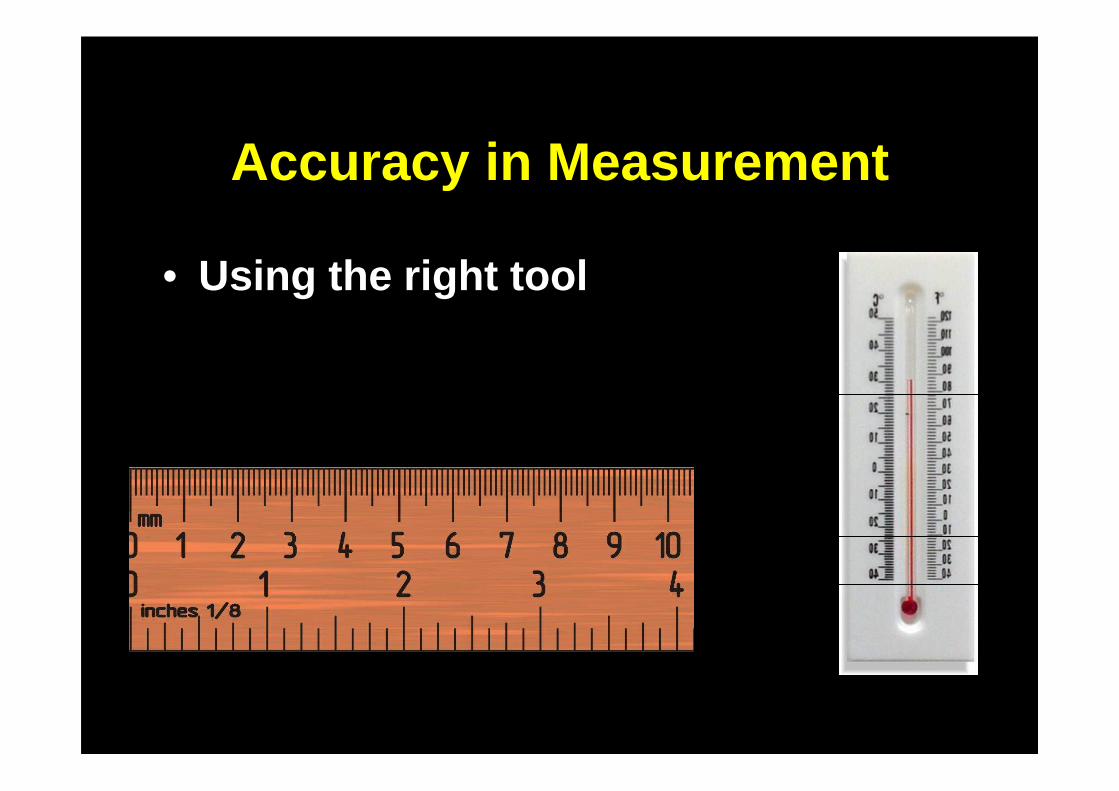
Accuracy in Measurement
• Using the right tool• The quality of the tool is important• How carefully we measure with it is
also important• Let’s use a ruler to measure the
length of a piece of wood…
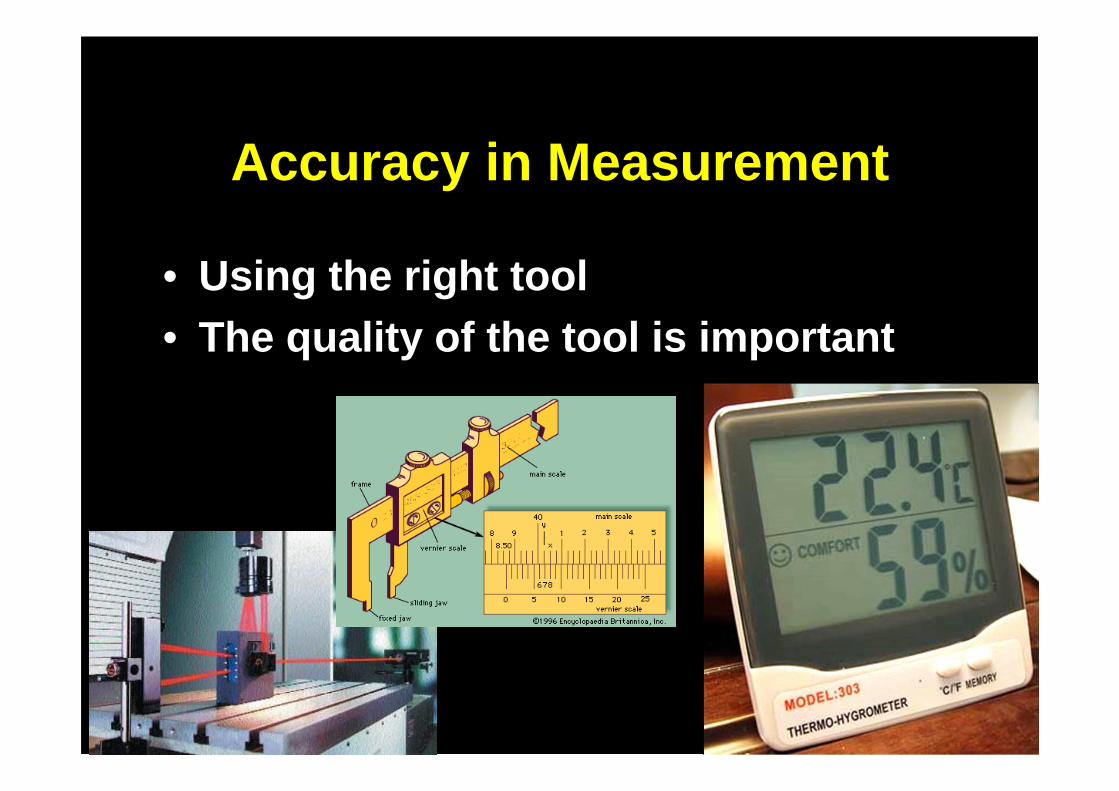
Accuracy in Measurement
• Using the right tool• The quality of the tool is important
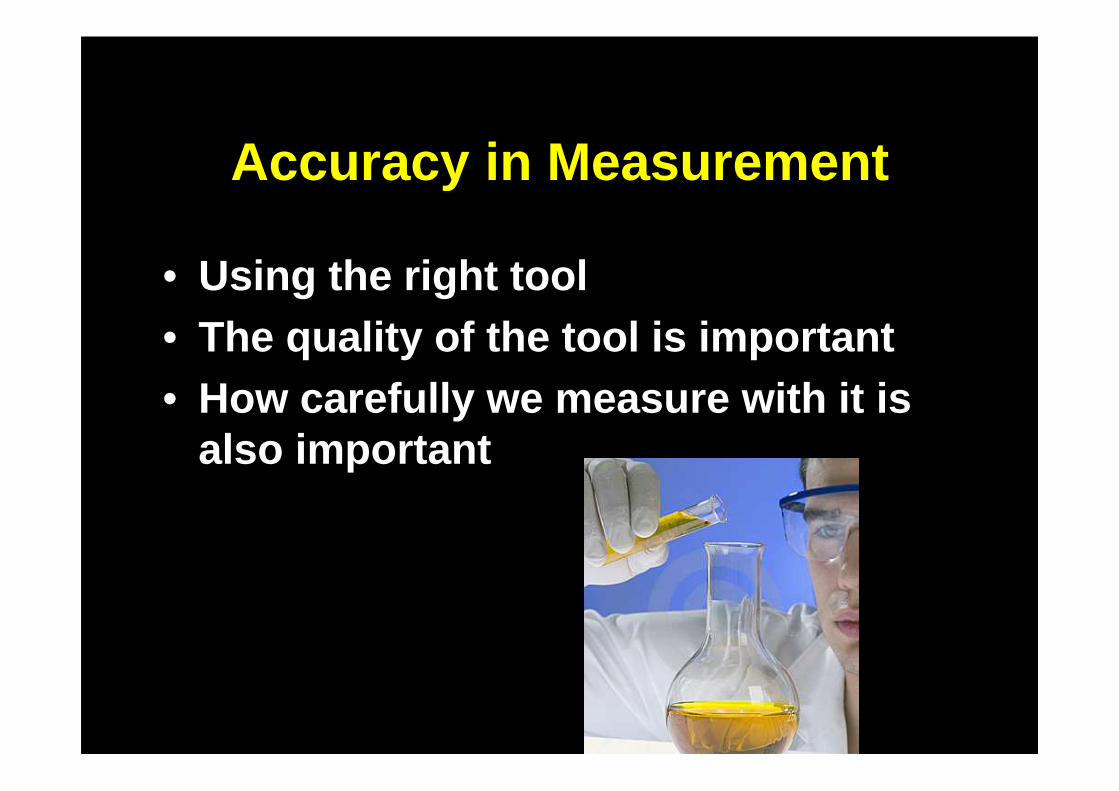
Accuracy in Measurement
• Using the right tool• The quality of the tool is important• How carefully we measure with it is
also important

Accuracy in Measurement
• Using the right tool• The quality of the tool is important• How carefully we measure with it is
also important• Let’s use a ruler to measure the
length of a piece of wood…
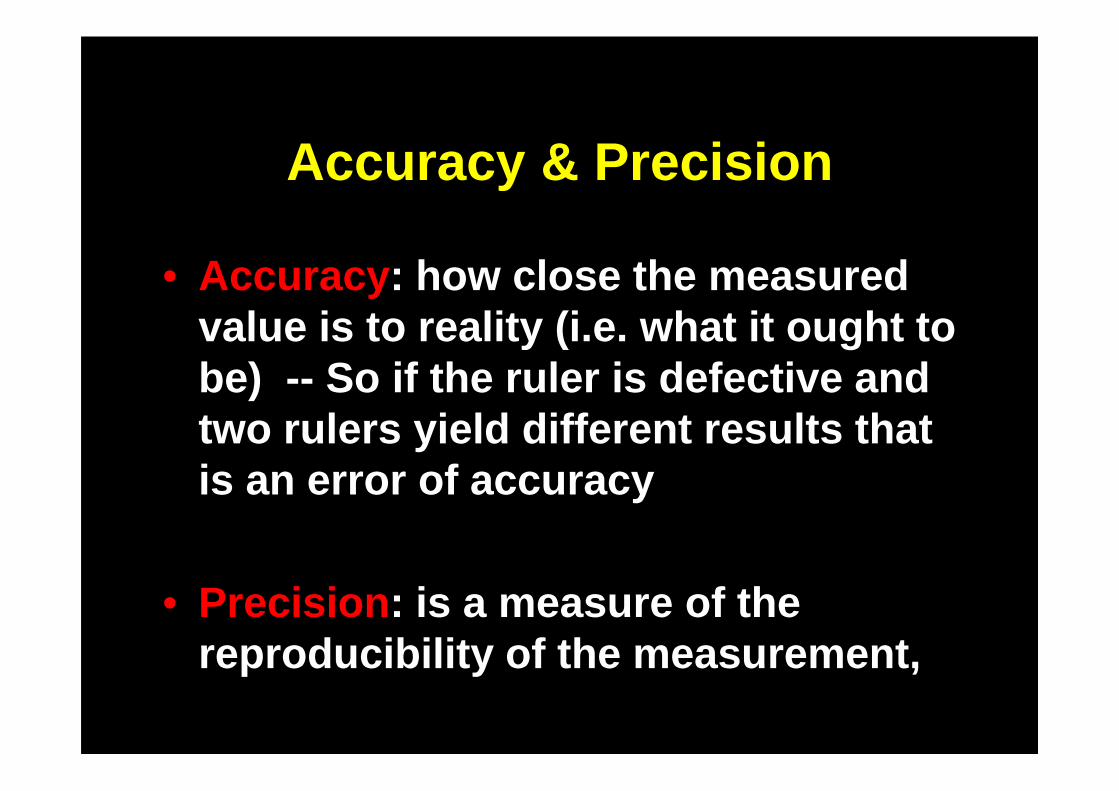
Accuracy & Precision
• Accuracy : how close the measured value is to reality (i.e. what it ought to be) -- So if the ruler is defective and two rulers yield different results that is an error of accuracy
• Precision : is a measure of the reproducibility of the measurement,
Accuracy & Precision
• Precision : is a measure of the reproducibility of the measurement, our confidence that uncertainty of measurement has been reduced to a minimum.
• Sometimes the problem is instrumental precision (level of resolution) or the randomness of the event being measured.
On Measurement
• Accuracy & Precision
• Resolution & Randomness
• Types of Scales
Resolution vs. Randomness
• We do not re -measure the piece of wood 100 times and take the average.
• Assuming the wood was measured carefully, the error here is due to the resolution of the ruler, not the randomness of the event being measured.
Resolution of the tool
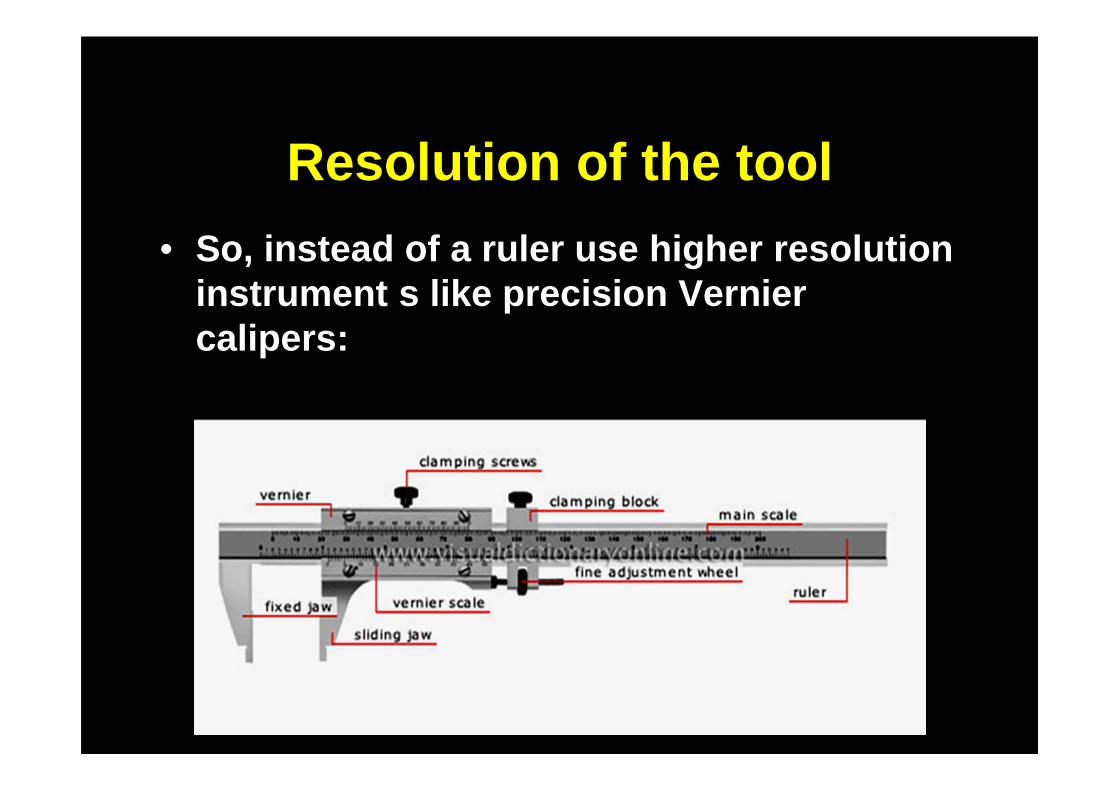
• So, instead of a ruler use higher resolution instrument s like precision Verniercalipers:
But that is very different from dealing with random events
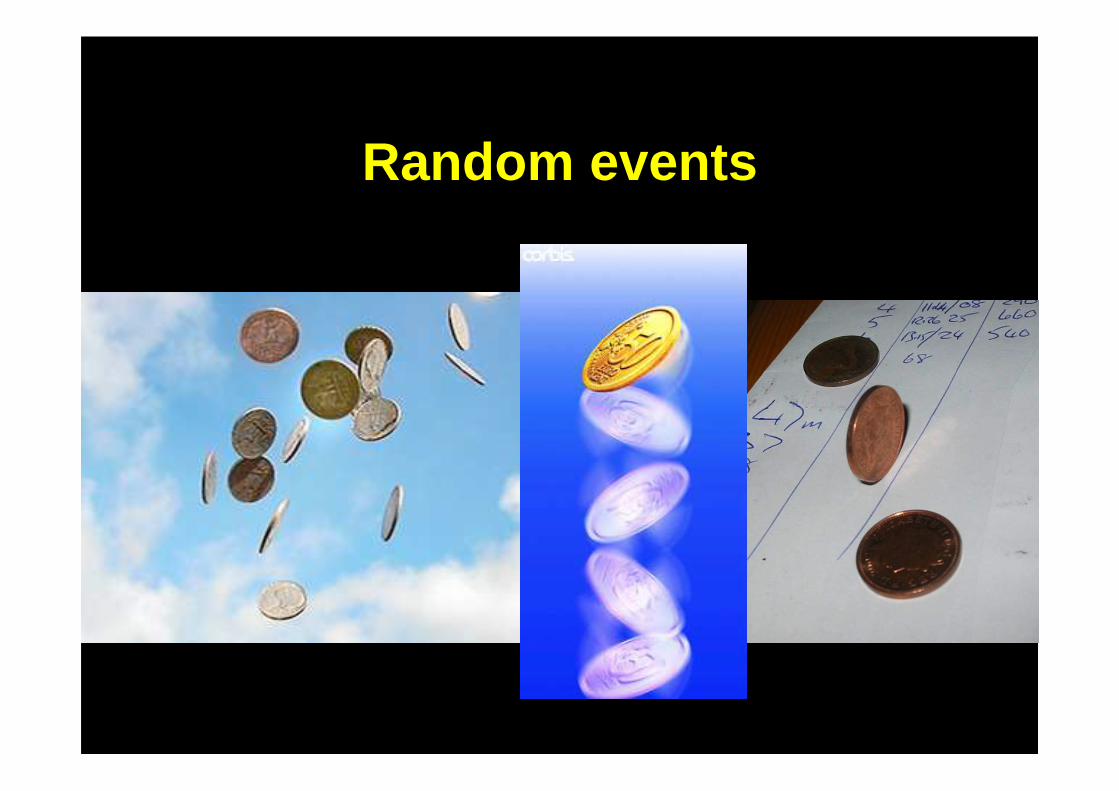
Random events
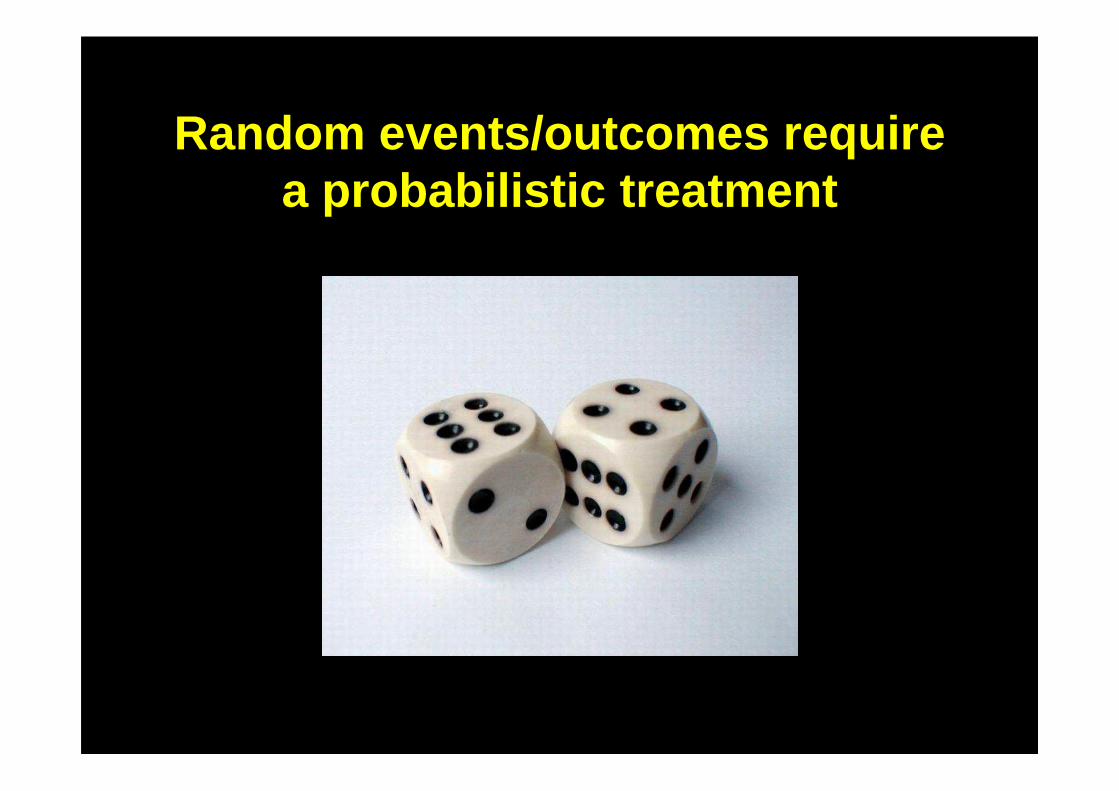
Random events/outcomes require a probabilistic treatment

Social Science studies of events/outcomes usually require a statistical probabilistic treatment
Here multiple measurements and probabilistic techniques are used
We will get back to Probabilities Later

On Measurement
• Accuracy & Precision
• Resolution & Randomness
• Types of Scales
What kind of scale do we use in Measurement?
Four Kinds (Types) of Scales
• Nominal
• Ordinal
• Interval
• Ratio
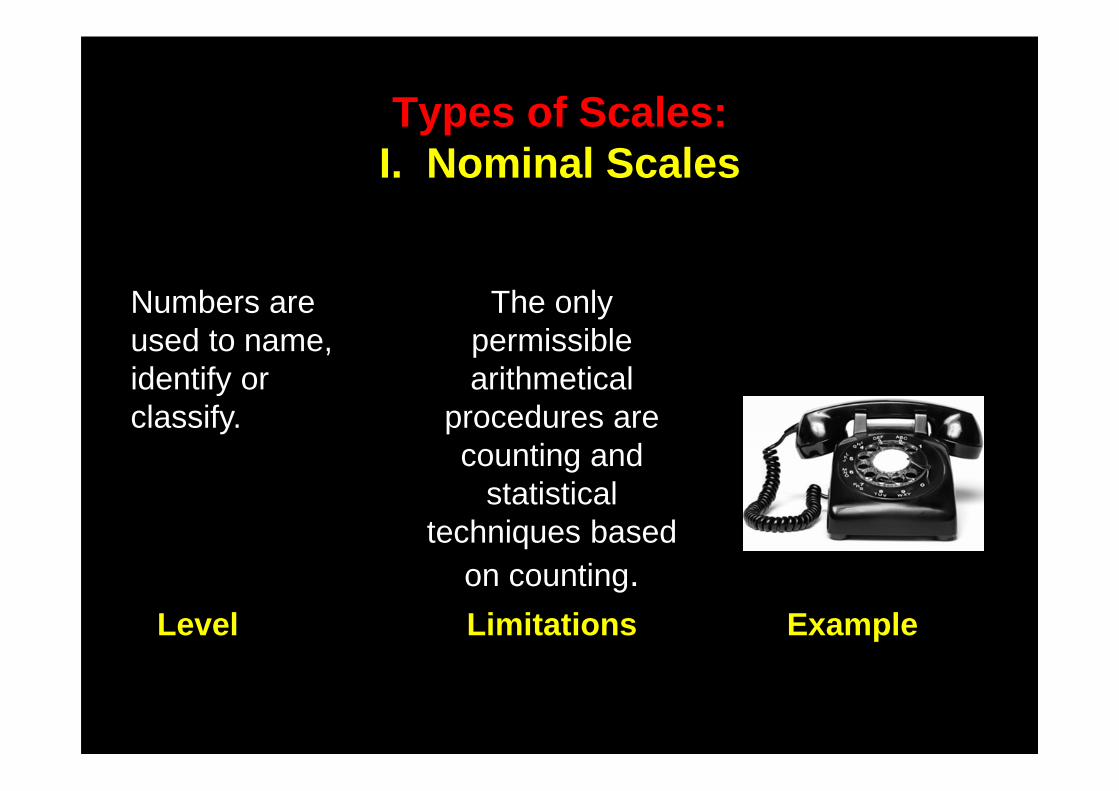
Types of Scales:I. Nominal Scales
Numbers are used to name, identify or classify.
The onlypermissible arithmetical
procedures are counting and
statistical techniques based
on counting. Level Limitations Example
163
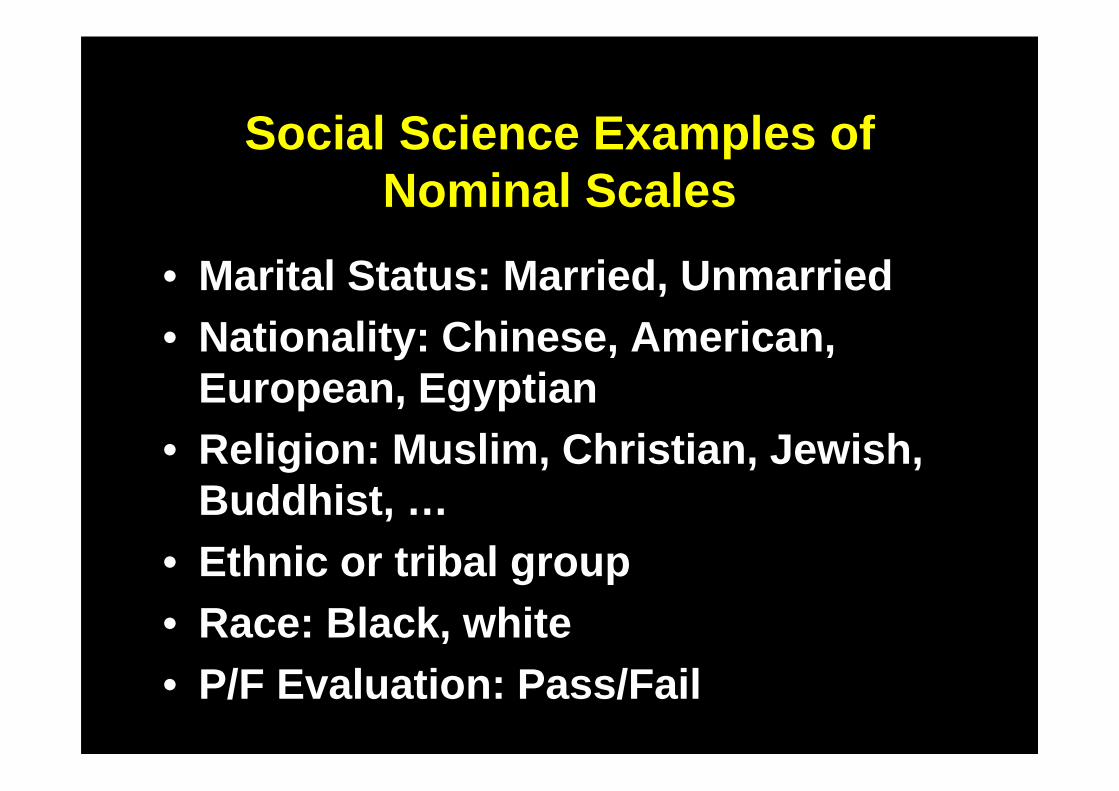
Social Science Examples of Nominal Scales
• Marital Status: Married, Unmarried• Nationality: Chinese, American,
European, Egyptian• Religion: Muslim, Christian, Jewish,
Buddhist, …• Ethnic or tribal group • Race: Black, white• P/F Evaluation: Pass/Fail
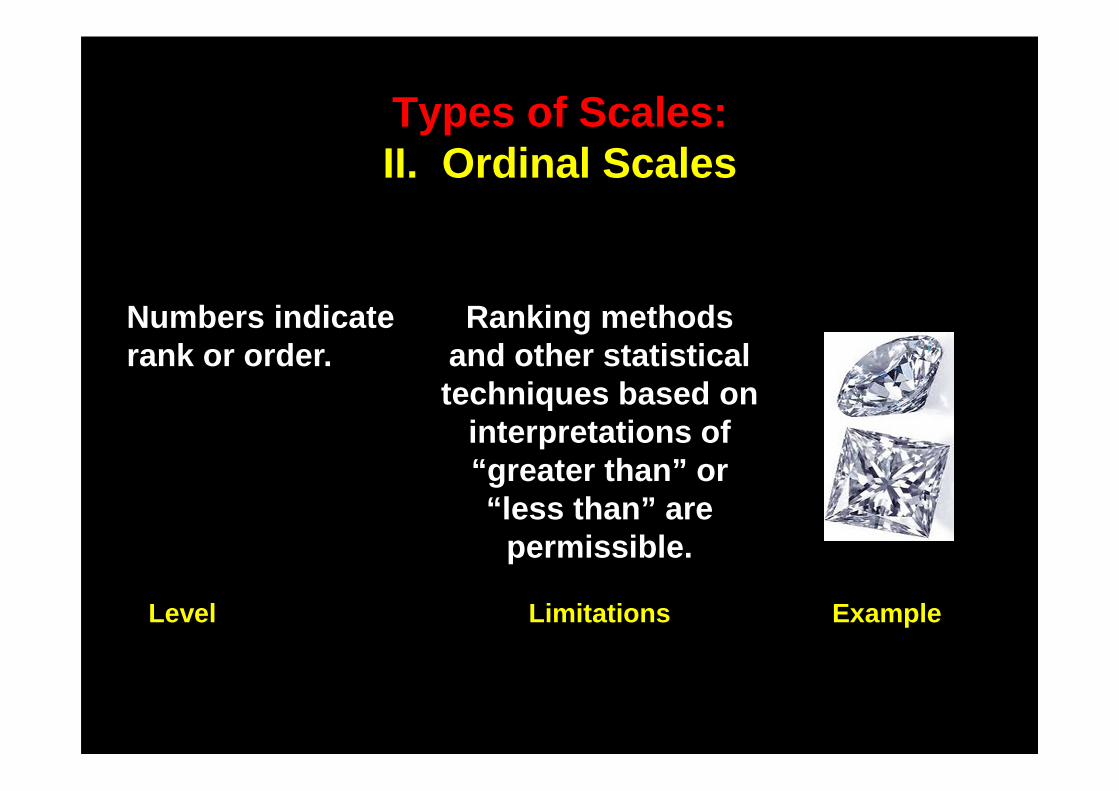
Types of Scales:II. Ordinal Scales
Numbers indicate rank or order.
Ranking methods and other statistical techniques based on
interpretations of “greater than” or “less than” are
permissible.
Level Limitations Example
165
Social Science Examples of Ordinal Scales
• Grading of interpersonal skills
• Evaluating managerial skills
• You can say greater than, but you cannot really quantify the amount or degree objectively.
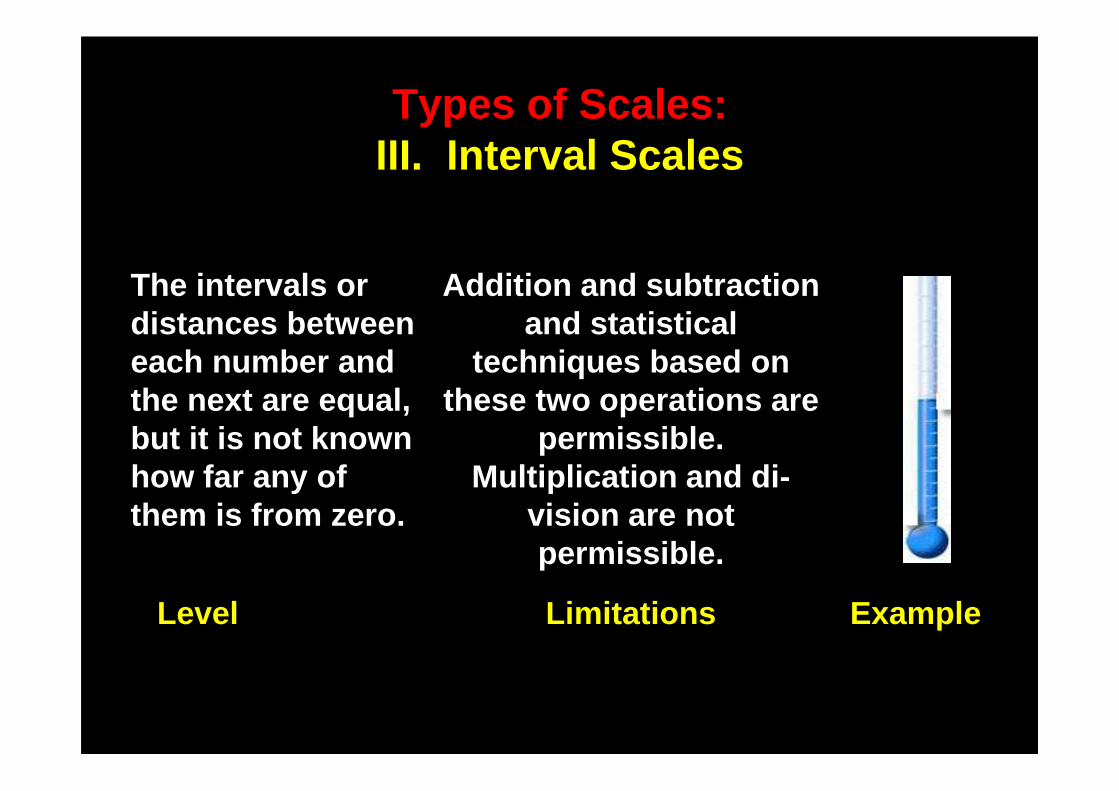
Types of Scales:III. Interval Scales
The intervals or distances between each number and the next are equal, but it is not known how far any of them is from zero.
Addition and subtraction and statistical
techniques based on these two operations are
permissible. Multiplication and di-
vision are not permissible.
Level Limitations Example
167

Natural Science Examples of Interval Scales
• Temperature:– Two days: 20 and 40 degrees Celsius– Difference between them is 20
• Cannot say twice as hot because zero could be:– Celsius scale– Fahrenheit scale– Kelvin scale
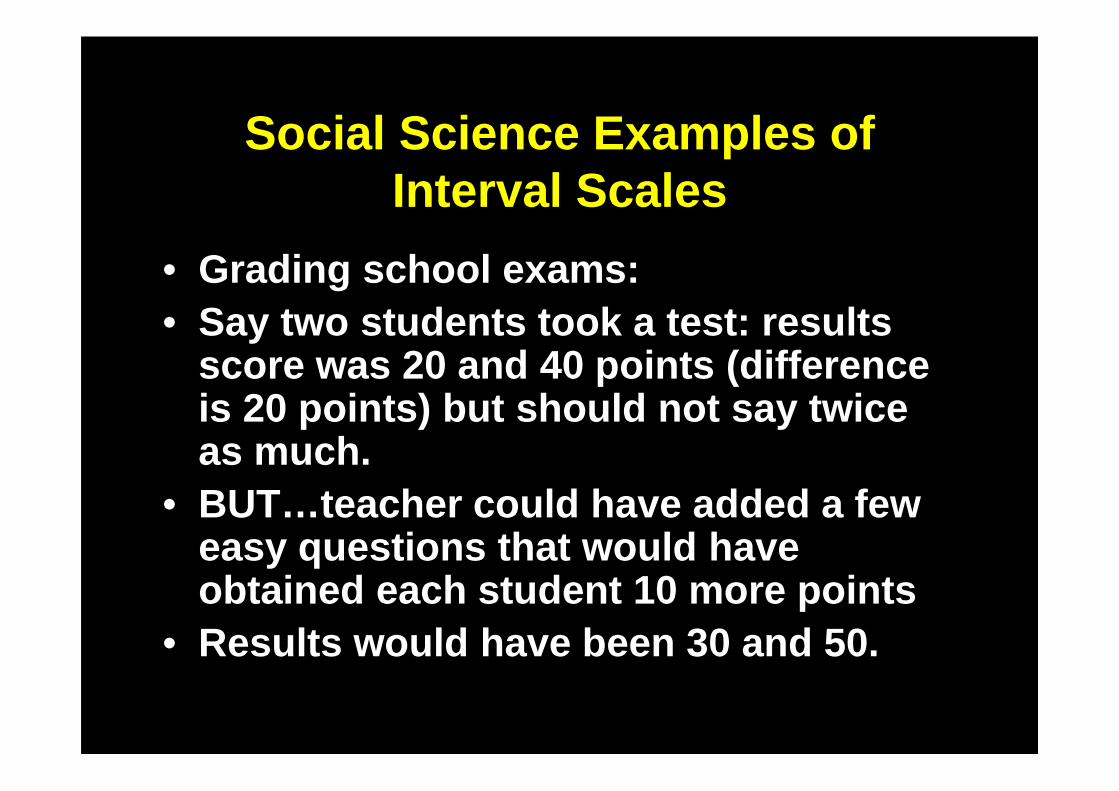
Social Science Examples of Interval Scales
• Grading school exams: • Say two students took a test: results
score was 20 and 40 points (difference is 20 points) but should not say twice as much.
• BUT…teacher could have added a few easy questions that would have obtained each student 10 more points
• Results would have been 30 and 50 .
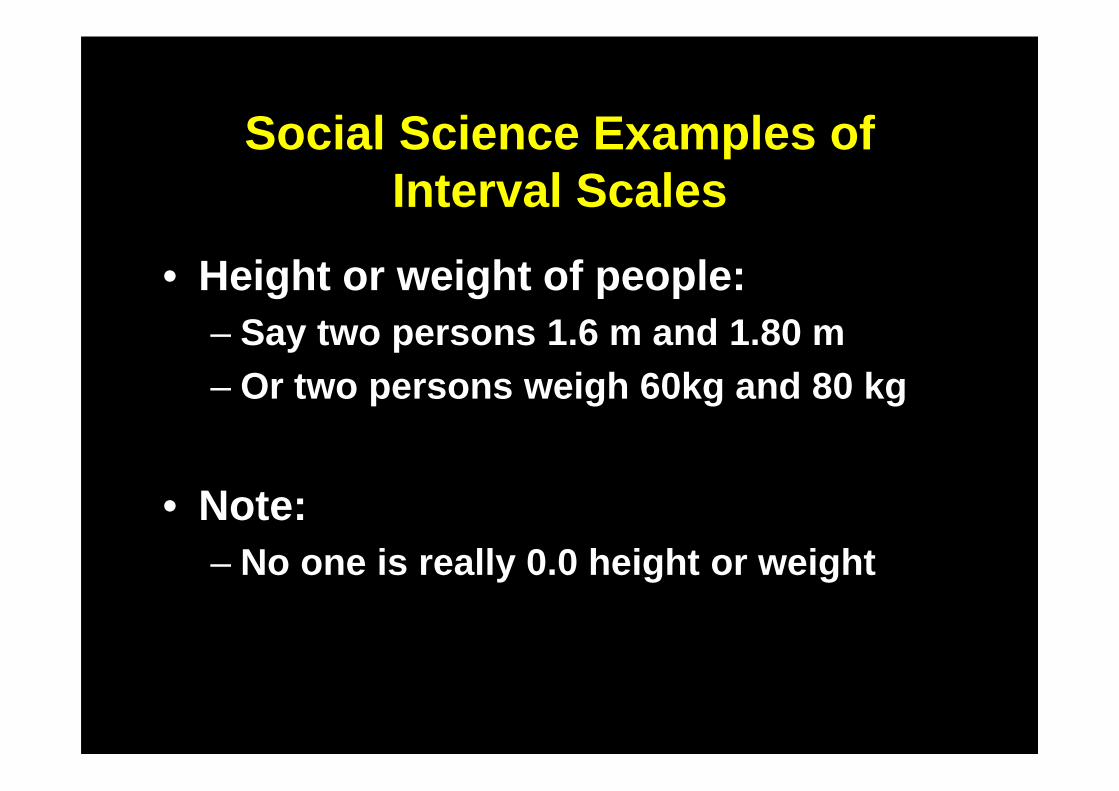
Social Science Examples of Interval Scales
• Height or weight of people:– Say two persons 1.6 m and 1.80 m– Or two persons weigh 60kg and 80 kg
• Note:– No one is really 0.0 height or weight
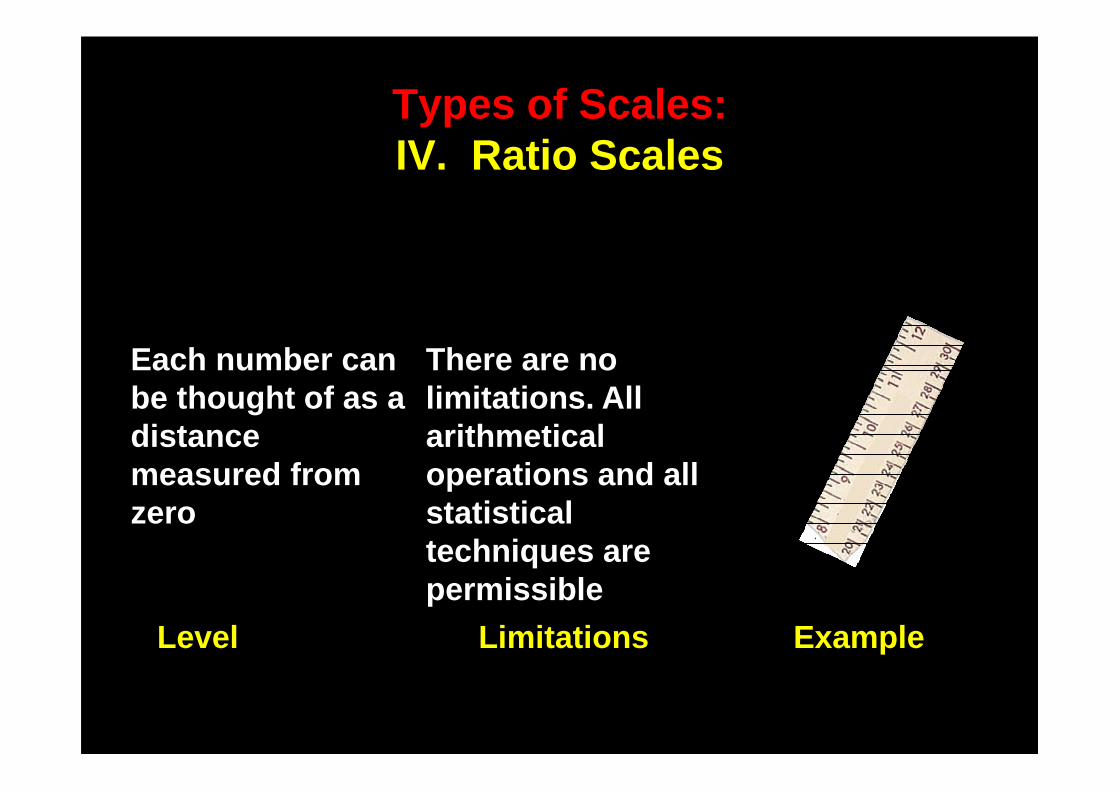
Types of Scales:IV. Ratio Scales
Each number can be thought of as a distance measured from zero
There are no limitations. All arithmetical operations and all statistical techniques are permissible
Level Limitations Example
171
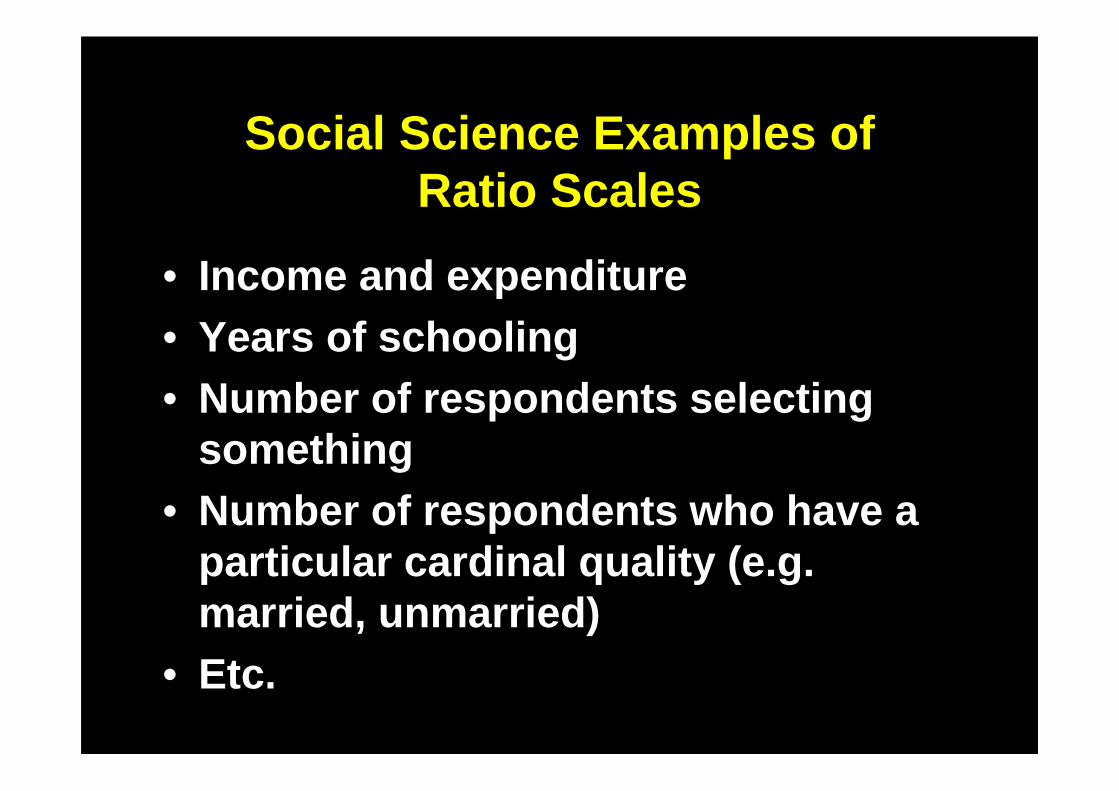
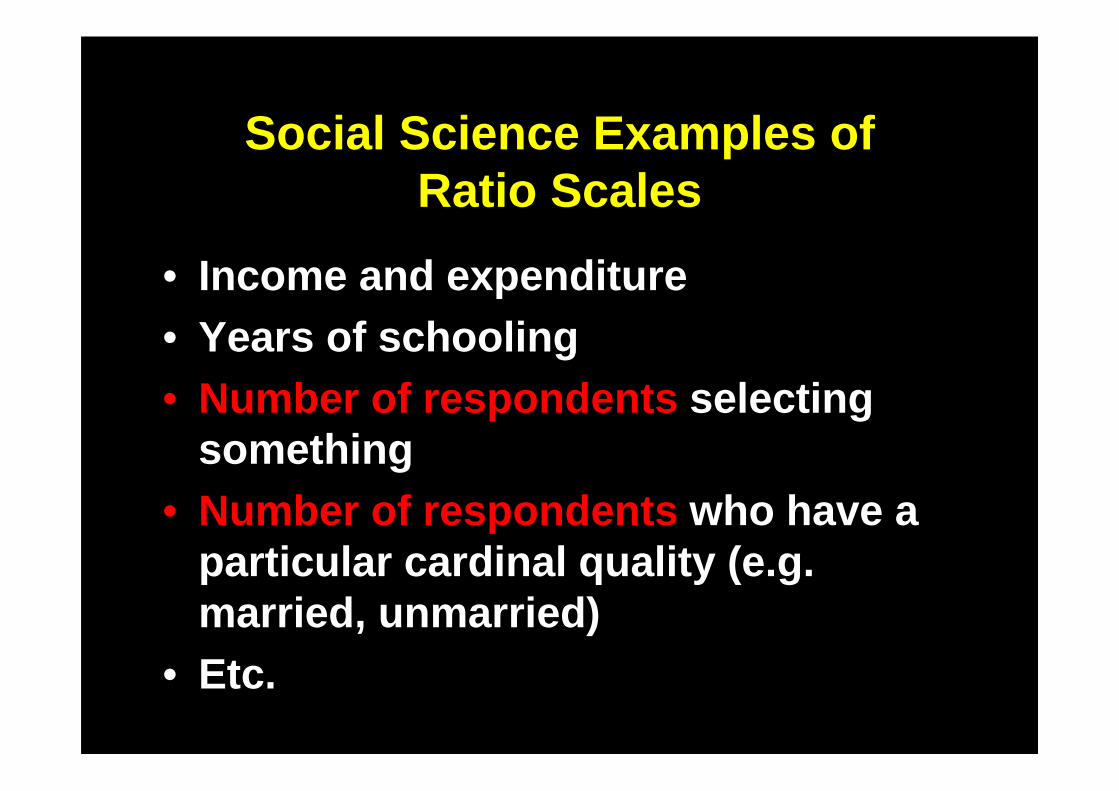
Social Science Examples of Ratio Scales
• Income and expenditure • Years of schooling• Number of respondents selecting
something• Number of respondents who have a
particular cardinal quality (e.g. married, unmarried)
• Etc.
Social Science Examples of Ratio Scales
• Income and expenditure • Years of schooling• Number of respondents selecting
something• Number of respondents who have a
particular cardinal quality (e.g. married, unmarried)
• Etc.
It is important that not all relationships or all mathematical operations can be applied to all
scales.

Now let’s move on to some descriptors of groups
What Is An Average?
We say: I examined 20 students and the average score was x
What is the meaning of the word “average”?
Average?
• Mean: usually add up the values for all the observations and divide them by the number of observations
• Median: the number at which half the observations are smaller and the other half are bigger
• Mode: the number that appears most frequently in the distribution of observations.
Average?
• Mean: usually add up the values for all the observations and divide them by the number of observations
• Median: the number at which half the observations are smaller and the other half are bigger
• Mode: the number that appears most frequently in the distribution of observations.
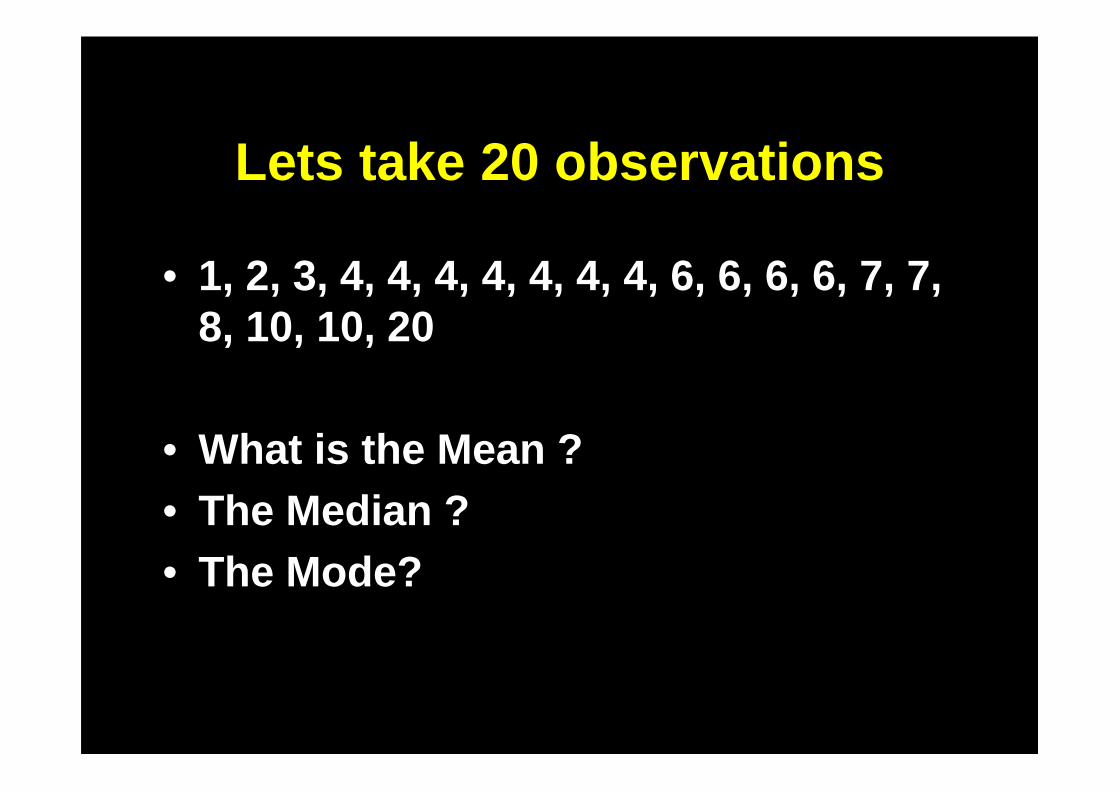
Lets take 20 observations
• 1, 2, 3, 4, 4, 4, 4, 4, 4, 4, 6, 6, 6, 6, 7, 7, 8, 10, 10, 20
• What is the Mean ? • The Median ? • The Mode?
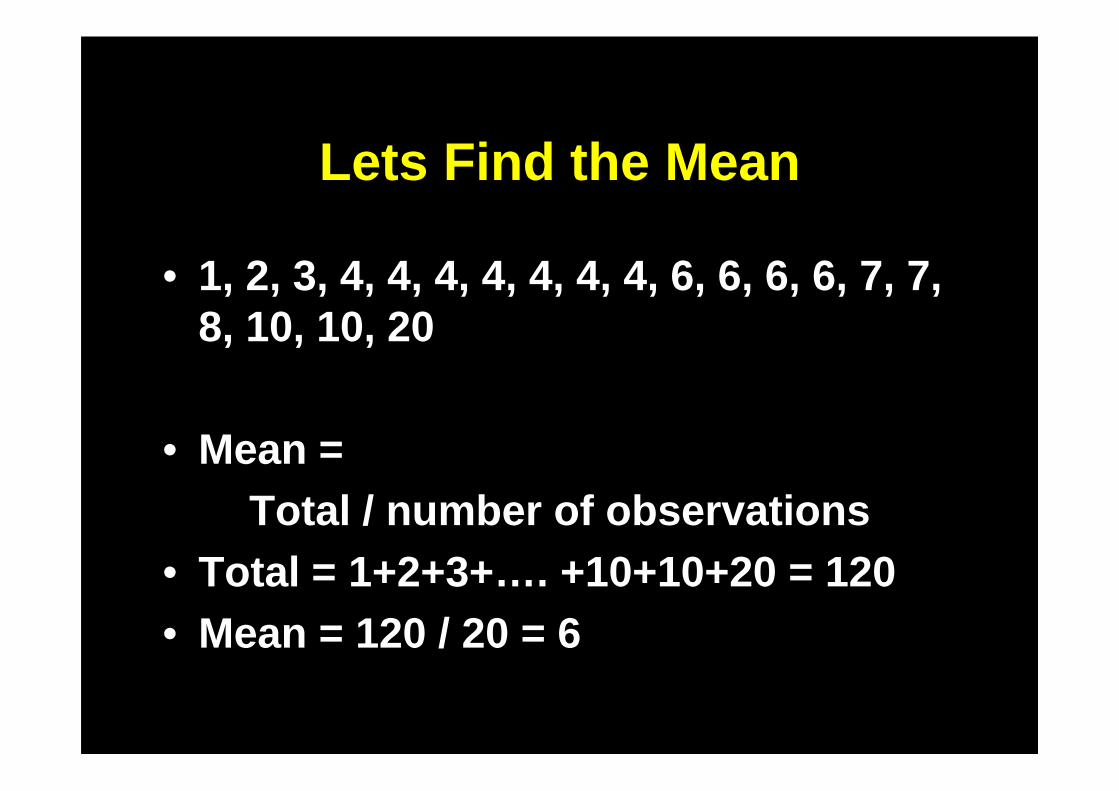
Lets Find the Mean
• 1, 2, 3, 4, 4, 4, 4, 4, 4, 4, 6, 6, 6, 6, 7, 7, 8, 10, 10, 20
• Mean =Total / number of observations
• Total = 1+2+3+…. + 10+10+20 = 120• Mean = 120 / 20 = 6
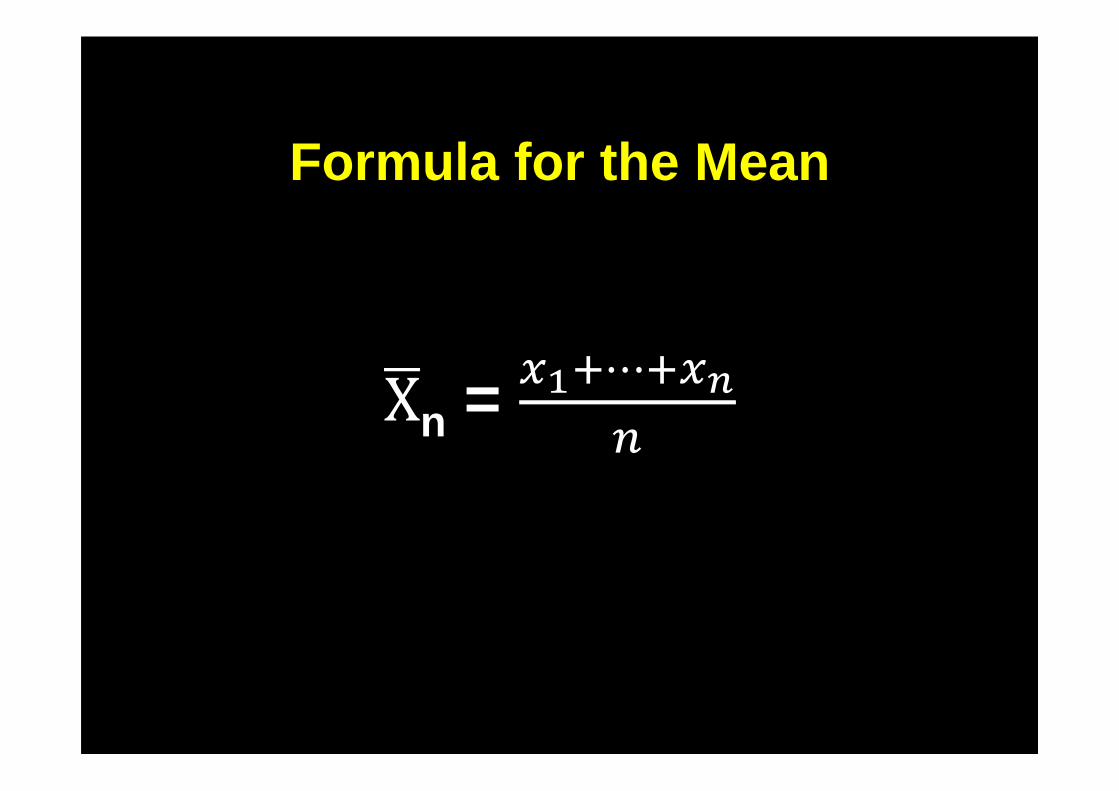
Formula for the Mean
n = ���⋯���
�
183
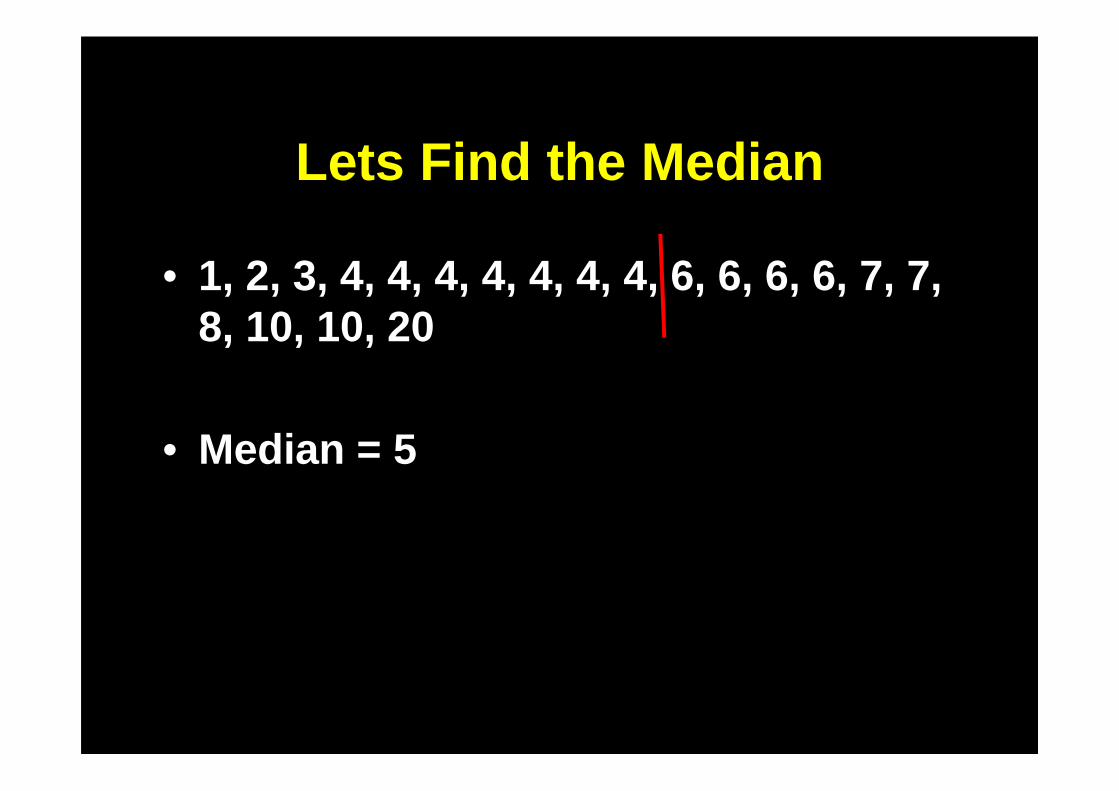
Lets Find the Median
• 1, 2, 3, 4, 4, 4, 4, 4, 4, 4, 6, 6, 6, 6, 7, 7, 8, 10, 10, 20
• Median = 5
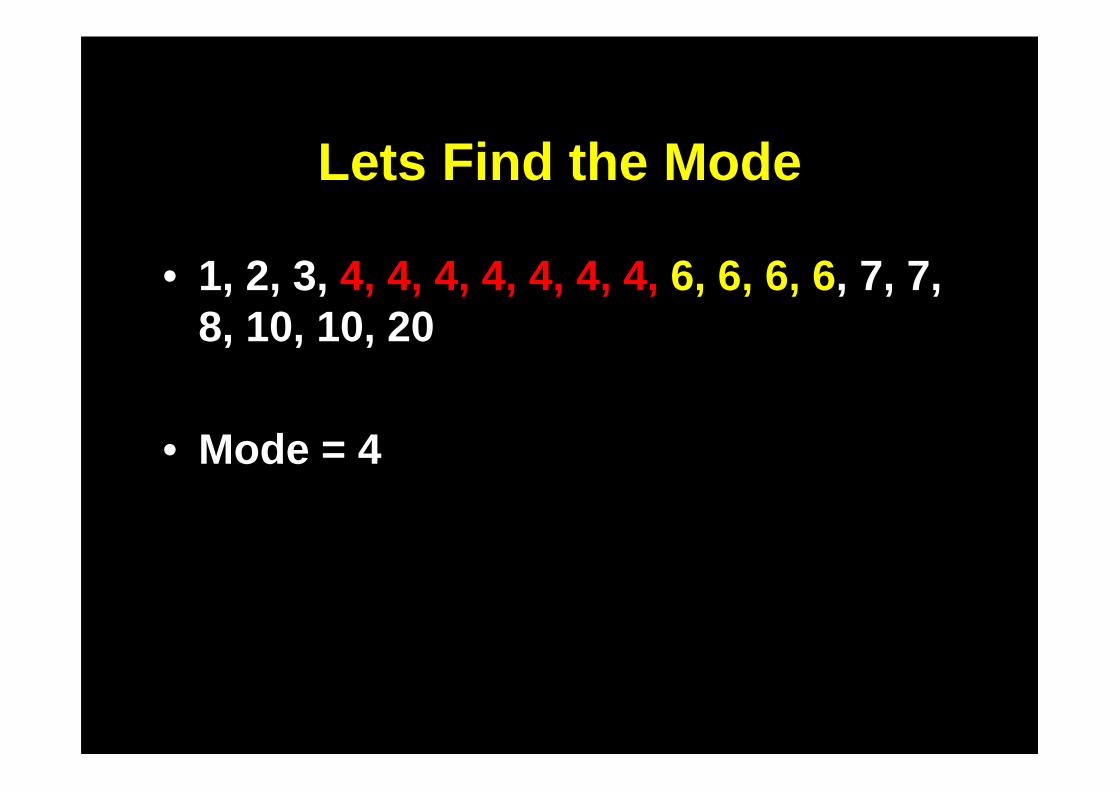
Lets Find the Mode
• 1, 2, 3, 4, 4, 4, 4, 4, 4, 4, 6, 6, 6, 6, 7, 7, 8, 10, 10, 20
• Mode = 4
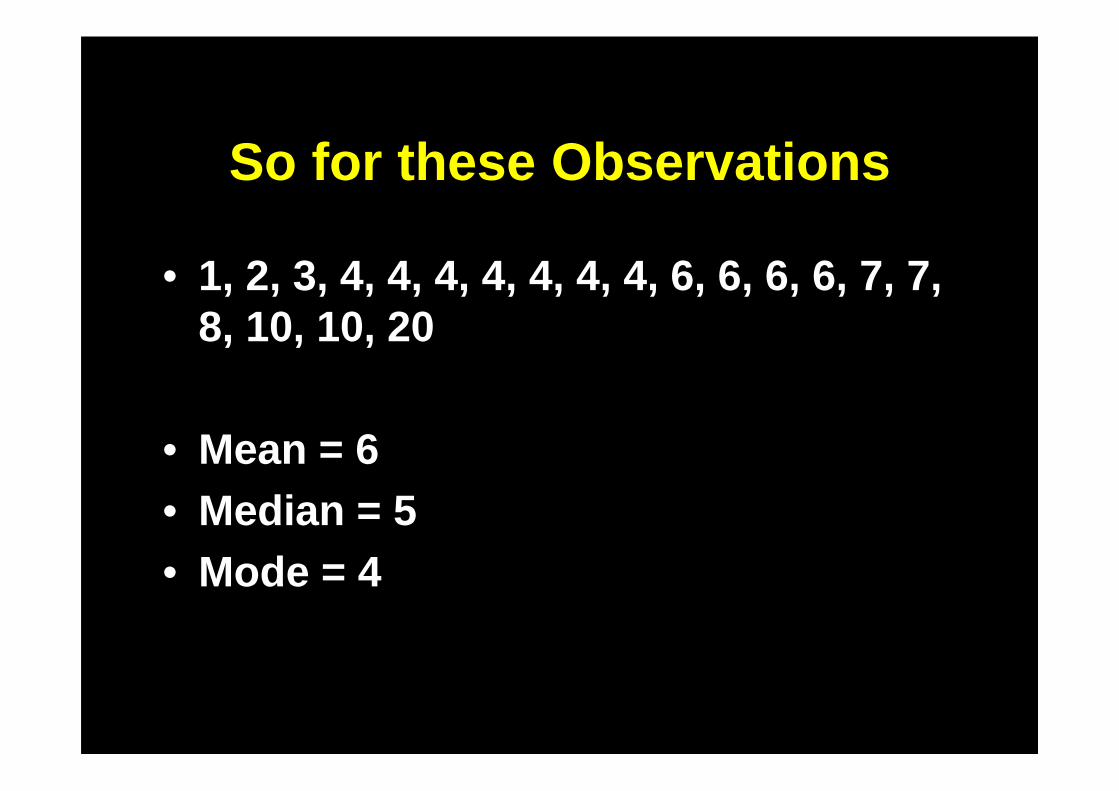
So for these Observations
• 1, 2, 3, 4, 4, 4, 4, 4, 4, 4, 6, 6, 6, 6, 7, 7, 8, 10, 10, 20
• Mean = 6• Median = 5• Mode = 4
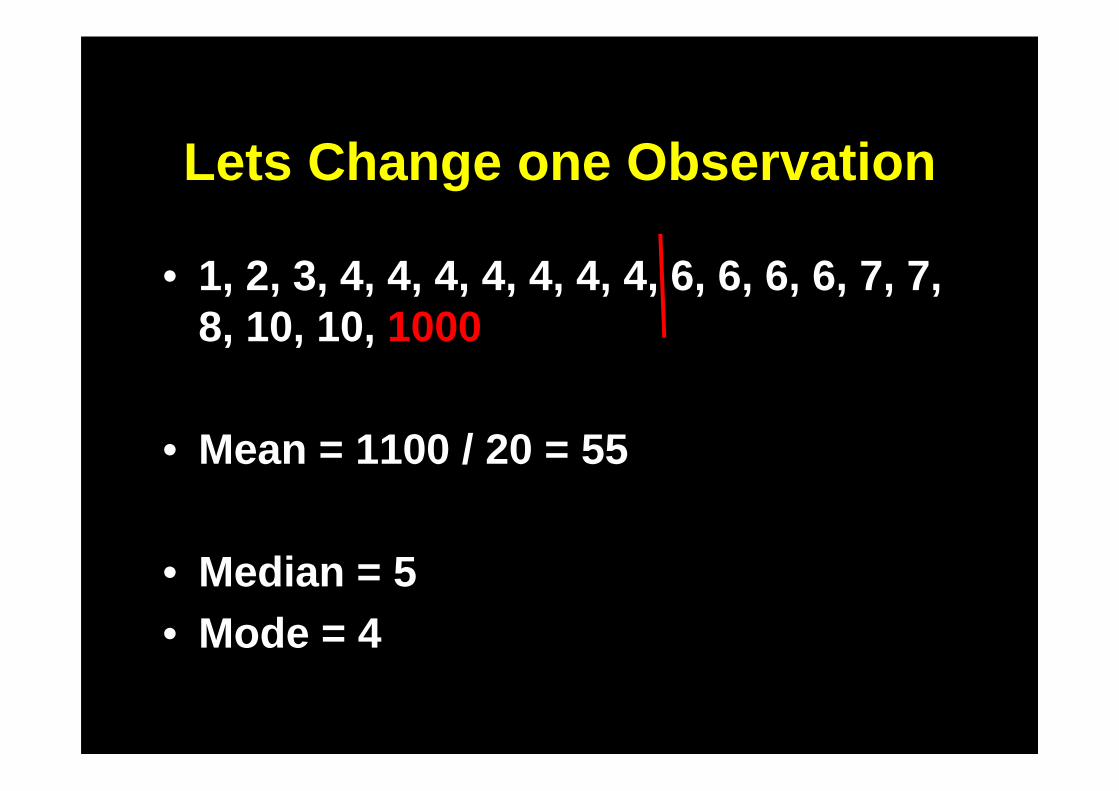
Lets Change one Observation
• 1, 2, 3, 4, 4, 4, 4, 4, 4, 4, 6, 6, 6, 6, 7, 7, 8, 10, 10, 1000
• Mean = 1100 / 20 = 55
• Median = 5• Mode = 4

Introducing: The Normal Curve(The Bell Curve, The Gaussian Distribution)
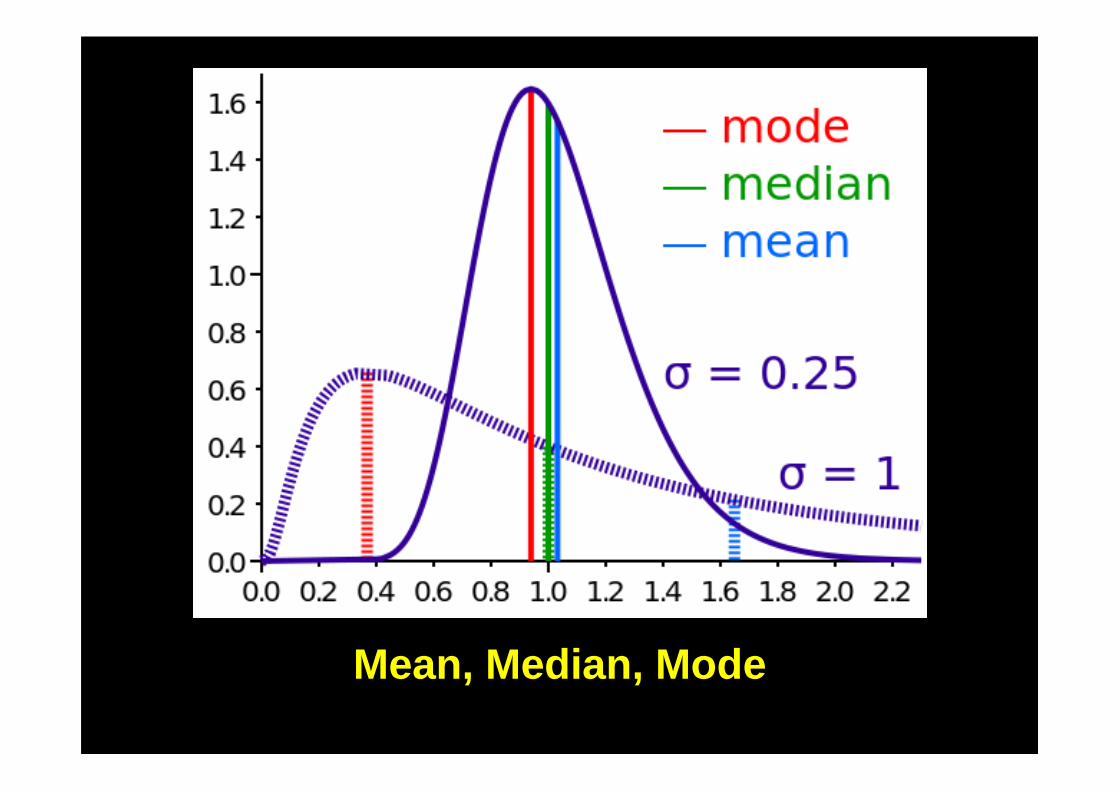
Mean, Median, Mode

Average?
• Mean: usually add up the values for all the observations and divide them by the number of observations
• Median: the number at which half the observations are smaller and the other half are bigger
• Mode: the number that appears most frequently in the distribution of observations.
Mixing between these is one of the most common fallacies in
reporting social statistics

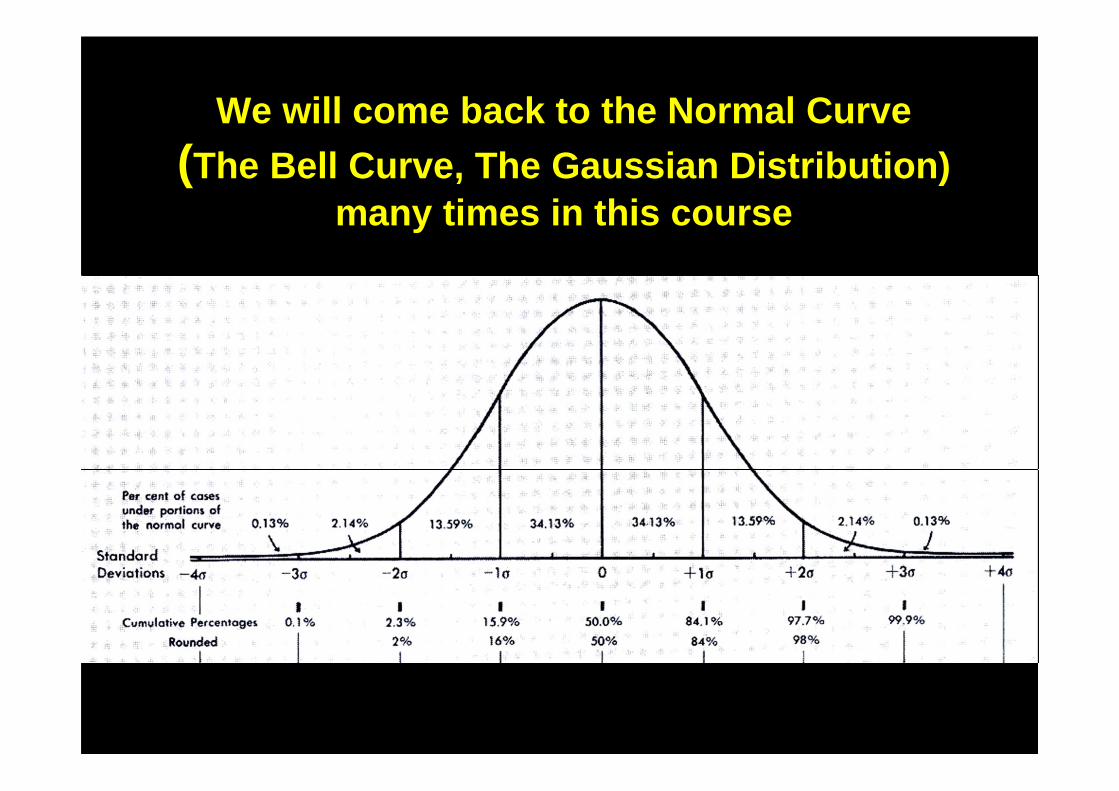
We will come back to the Normal Curve(The Bell Curve, The Gaussian Distribution)
many times in this course
But that will be for later…

SO…
Let’s make sure that we keep our heads above water!
I want you all to be swimming, not drowning!

Then we will all learn to fly…

Thank You