lecture 10: past financial crises: failures in country economic management past... · lecture 10:...
TRANSCRIPT

W H E R E O P P O R T U N I T I E S E M E R G E
EMERGING CAPITAL MARKETS
Lecture 10: Past Financial Crises: Failures in
Country Economic Management
Dr. Edilberto Segura
Partner & Chief Economist, SigmaBleyzer
Chairman, Advisory Board, The Bleyzer Foundation
January 2013 V1
Lecture 10: Recent Financial Crises: Failures
in Country Economic Management
Outline
I. The 1994 Mexico Crisis
II. The 1997 East Asia Crisis
III. The 1998 Russian Crisis

RMSM+X Model
I. The 1994 Mexico Crisis1. Origins of the Mexico Crisis.• During the 5 years before 1994, Mexico had made major progress in
economic reforms: – the fiscal budget was balanced (+0.3% in ‘93 and -0.7% in ‘94),– inflation was reduced to 10% pa in 1993 and 7% pa in 1994,– public sector debt in terms of GDP was reduced over one-half,– a large number of state enterprises and banks were privatized,– the domestic economy was de-regulated and liberalized,– international trade and capital were liberalized.
• A key factor to bring down inflation was fixing the dollar exchange rate, followed by a crawling peg lower than inflation differentials, which led to a 50% “real” peso appreciation in 7 years and competitiveness loss.
• The privatization of banks and liberalization of the financial sector also encourage a sharp 25% pa expansion of domestic credit in the five years preceding the 1994 crisis (consumer credit: credit cards and mortgages).
• Total bank credit to the private sector (mainly mortgages, consumer credit and credit cards) rose from 11% of GDP in 1989 to 40% in 1994.
• This created a problem in that Mexicans spent more and saved less to invest in the economy: domestic savings declined from 22% of GDP to 9% in these five years.
• The banks financed these credits using short-term foreign borrowings, which foreign banks were happy to provide .

• Since: (X – J↑) = (S↓ - I) + (T – G) , the 13% points decline in private savings was reflected as an increase in imports. Even though
exports were increasing, in 1991-1993 the country showed current account deficits of about US$25 billion per year or 6% of GDP --
unsustainable levels (despite balanced fiscal budgets).• These current account deficits were financed by foreign capital
inflows: the strength of the economic program, low interest rates in the US, and capital account liberalization encouraged capital inflows:
US$25 billion in 1992, and US$30 billion in 1993 (about 6-7% of
GDP, & 20% of all EM inflows).
• These capital inflows were in the form of portfolio investments to take advantage of higher returns in Mexico.
• These inflows permitted a large increase in international reserves, which reached US$30 billion by February 1994.
• The capital inflows also led to the appreciation in the FX rate, which encouraged further imports, a lot of it for consumption.
• In order to sterilize capital inflows (to reduce M3 & control inflation), the government issued large amounts of short-term peso T-bills
(Cetes) and some dollar-indexed T-bills (Tesobonos).

• In early 1994, these external imbalances started to worry the international community, both official and private.
• World Bank studies showed that:
–Mexico could not afford to wait for the current account to return to
equilibrium by itself.
–In fact, the economy was not growing and productivity gains were not materializing, despite the inflows of foreign capital, which were
being used principally for domestic consumption.
–Domestic savings had been reduced sharply by the cheap availability of credit and imported consumer goods (from 22% of GDP in 1989 to
9% of GDP in 1993), generating a large (I – S) gap.
–Foreign debt was largely short term and was therefore vulnerable to any change in investors’ sentiments creating a crisis.
–The banks were weak with a high level of non-performing assets
(reporting underestimated them) and would be hard hit by a crisis.
–The World Bank recommended that more flexibility in exchange rates and a one-shot, 10% to 20% devaluation of the peso was needed
to reduce the current account deficit to sustainable levels.

• This massage was conveyed at the highest levels, including visit to
Mexico by Mr. Lewis Preston, then President of the World Bank
and by various visits of the Regional Vice President and Country
Director.
• Many international experts had also recommended a 15%
devaluation, including well-known international economists such
as Rudy Dornbusch, Paul Krugman, and Sebastian Edwards.
• The Government did act on some of the recommendations:
– To make the commercial banks less vulnerable, the Government
established tight limits on foreign exchange exposure and in the
total amount of foreign exchange liabilities.
– The exchange rate was made more flexible, with a crawling peg
band that allowed the exchange rate to fluctuate; but with the
ceiling of the band increasing by only 5% per annum (compared
to an inflation of 10% in 1993).

• But the Government disagreed about the need of a one-shot 20%
devaluation.
• The Government felt that the peso was not overvalued, because:
– (i) Mexico’s exports of non-traditional goods were increasing
rapidly at a rate of 10% pa.; and
– (ii) there was not under-utilization of industrial capacity.
• There were also political reasons: President Salinas did not want
a devaluation during a critical 1994 Presidential election year.
• The Government felt that it would be possible to “soft-land”:
that is, to get a gradual reduction of the current account deficit
over a longer period of time.
• It felt that, with the approval of the NAFTA agreement with the
US and Canada in early 1994, exports would improve,
productivity would be enhanced, inflation would be reduced, and
the exchange rate would be gradually depreciated.

• Unfortunately, during 1994, many non-economic political events
further eroded private sector confidence:
– The Chiapas up-rising by local indigenous peoples.
– The assassinations of political leaders, Messrs. Colossio and
Ruiz Massieu.
– The uncertainties in the results of the presidential elections of
1994, given the assassination of the main PRI candidate Mr.
Colossio, and the appointment by President Salinas of an
unknown person as PRI candidate, Mr. Ernesto Zedillo .
• The size of the current account deficit and political uncertainties
reduced the level of confidence in the Mexican economy, with
major declines in reserves in April 1994 and a widening of the
spread Cetes-Tesobonos to 10%.
• As a result, during 1994, the level of capital inflows dropped from
US$30 billion in 1993 to US$15 billion; still a significant amount,
but not enough to cover imports.
• Many local firms moved their cash positions away form the peso,
purchasing large amounts of dollars.
• Therefore, with imports still at high levels, the level of International Reserves declined from US$30 billion in February 1994 to US$17 billion by April 1994 and to US$10 billion by November 1994.
• During 1994, the Government increased somewhat interest rates to defend the peso exchange rate, to maintain the level of international reserves and avoid imposing restrictions to imports.
2. Policy Options
• During 1994, the Government could have taken more fundamental economic measures to reduce absorption (expenditures) and deal with the large current account deficit and insufficient foreign financing of it.
• These measures could have included fiscal contraction (moving to a fiscal surplus), and/or tight money supply and higher interest rates to control Net Domestic Credit, particularly to the private sector.
– But these contractionary measures were not attractive during the 1994 election year.
– In fact, the government did the opposite and took measures to limit increases in interest rates, hoping for a “soft landing”.

– New York mutual fund managers, including the members of
the Weston Forum, threatened to reduce their Mexican
exposure if peso interest rates were to increase (reducing the
price of their holdings). They, instead, urged the
Government to issue medium term notes at higher interest
rates, an unlikely option given low confidence levels.
• To avoid larger interest rate increases, the Government
followed a two-track approach during 1994:
– They targeted interest rates on auctions of T-bills to a maximum pre-set limit -- “tirar la rayita”.
– The Central Bank sterilized the reductions in international reserves, injecting equal amounts of peso liquidity.
• In fact, it is possible that the Government’s strategy of a “soft
landing” after joining NAFTA could have worked.
• But it required time and the preservation of a high level of
confidence by domestic and foreign investors.
• But with declining confidence and reserves, around March 1994,
the Government opted for financing the current account deficit
by issuing short term notes that could be bought by foreigners.
• Since foreigners were no longer prepared to buy substantial
amounts of peso-denominated T-bills (Cetes) even at high 18%
interest rates, the Government issued short-term notes
denominated in Pesos, but indexes to the US dollars (Tesobonos)
with 8%-10% interest rates.
• This proved to be a fundamental mistake.
• During 1994, the level of Tesobonos increased from US$4 billion
in February 1994 to US$30 billion in December 1994 (while the
level of international reserves declined in opposite terms from
US$30 billion n February to US$10 billion in November).
• This rapid increase in Tesobonos was not fully known.
A key question is who were taking the risk on Tesobonos.
• The intention of the Government was for New York banks to buy
the Tesobonos and Cetes and absorb their entire risk.
• But NY banks had no confidence and entered into collateralized
currency-interest rate swap agreements with Mexican banks.
• Under these swaps, the NY banks purchased the Tesobonos/Cetes,
but remitted the indexed-peso/peso payments to Mexican Banks
and received payments in US dollars at Libor plus a spread.
• On the Tesobonos, Mexican banks deposited in the NY banks a
20% cash as collateral to secure its obligations under the swap.
• The New York banks were taking a lower interest rate, but had reduced by 20% their exposure on the Tesobonos. All obligations had been converted to pure dollar denominated obligations.
• Domestic banks took the risk for higher profits, given their own poor economic situation and high level of non-performing loans.
• Without the swaps, it is unlikely that the NY banks had been prepared to finance the Government.

2. The Unfolding of the Mexico Crisis.
• President Ernesto Zedillo took office on December 5th, 1994 and
appointed Mr. Jaime Serra Puche as Minister of Finance.
• Some of the new Government officials had "privately" stated,
during the previous administration, their concerns with the size of
the current account deficit.
• “Insiders” detected the eminence of a devaluation and, during the
first half of December, massively sold pesos for US dollars, thus
reducing the level of reserves from US$10 billion in early
December to about US$5 billion by December 20, 1994.
• These purchases of dollars were also induced by the Central Bank's
requirement to banks to cover their dollar exposure due to the
Tesobonos swaps, when they were discovered in September 1994.
• The Government concluded that it could no longer maintain the
exchange rate for the peso and announced a 15% devaluation on
December 20.

• But at this time, the level of international reserves was not enough
to cover the Tesobono debt and support the new exchange rate.
• Furthermore, confidence was also eroded because the Government
did not announced any major economic program to demonstrate
that it could serve its large Tesobonos debt, given low reserve
levels.
• The lack of a credible adjustment and credit program to deal with
this fundamental debt service issue is regarded as a key mistake of
the December 20 announcement by Serra Puche.
• On December 22, the peso could not be supported and was left to
float freely.
• International financiers and mutual fund managers reacted with
disbelief and anger.
• Two days later, after a visit to New York, Serra Puche resigned.
Mr. Guillermo Ortiz, the Transport Minister and a former Deputy
Minister of Finance, was appointed Minister of Finance.

• In a few days, the stock market index collapsed from about 1,600 to 600, as shown in the graph.

• In the next few weeks, capital outflows continued and the exchange
rate moved from 3.3 pesos/dollar in December 1994 to 7.0
pesos/dollar in early March 1995.
• It was only on March 9, 1995 that the markets started to calm
down, when the Government announced a strict fiscal and
adjustment program supported by a US$50 billion credit.
• The Government announced a major reduction in Government
expenditures with a significant budget surplus, measures to contain
domestic credit and wages, and major reforms in privatization, the
banking sector, decentralization of Government functions, reform
of the legal/judicial systems, and improvements in social programs.
• This economic program was linked to a US$50 billion credit
support program provided by:
– the US Treasury’s Exchange Stabilization Fund (US$20 billion),
– the IMF (US$17 billion),
– the Bank of International Settlements (US$10 billion),
– the World Bank (US$3 billion).
• Problems of non-performing assets in the banking sector,
however, remained and were only resolved with the purchase of
the largest banks by foreign banks.
• Many of the reform programs were implemented with major
technical and financial support from the IMF, the World Bank
and the IDB.
• The overshooting of the peso devaluation in early 1995 clearly
demonstrates that in at world with significant capital mobility,
the exchange rate is affected by the need to clear the financial
markets, and not only by the goods markets (with its current
account and purchasing power parity consideration.)
• This is a major lesson from the crisis.
• This last point was ignored. The announced 15% devaluation -
- with a less-than-one ratio of reserves to short-term foreign
debt and without a supporting macroeconomic program --- was
inadequate to clear the financial markets.

• It is possible that a 15% devaluation in early 1994, with large international reserves, and lower foreign debt, would have been successful and sufficient to deal with the issue.
3. The Outcome of the Program
• In 1995, the Government produced a “primary” fiscal surplus of 5% of GDP, to enable it to serve its debt. In spite of large interest payments, in 1995 the overall fiscal deficit was only 0.8% of GDP, compared to a deficit of 0.7% of GDP in 1994 and to a fiscal surpluses of 0.3% of GDP in 1993.
• Gross domestic savings/GDP recovered and in 2006 amounted to 21% of GDP, similar to gross domestic investments/GDP.
• For the last few years, the government has maintained the three gaps {(S-I), (T-G) and CAB} close to zero.
• Some other useful numbers on the results of the program are presented in the following table.
• The stock exchange had also a reasonable recovery, as shown in the graph, until the effect of the Asian Crisis was felt in 1998.

1993 1994 1995 1996 1997 1998 1999 2000 2006
Exchange Rate (Ps/$, eop) 3.1 5.3 7.6 7.8 8.1 9.9 9.5 9.2 11.0
Intern’l Reserves ($bn) 25 6 17 19 28 32 32 34 78
Consumer Prices (%pa) 10 7 35 33 20 16 17 4.7 3.5
Fiscal Deficit (%GDP) +0.3 -0.7 -0.8 -0.4 -0.7 -1.2 -1.2 -0.8 0.0
Real GDP Growth 1.9 4.4 -6.2 5.1 6.9 4.8 3.7 -0.3 4.0
Exports ($bn) 50 60 79 96 110 117 136 166 250
Imports ($bn) 72 79 72 89 110 125 142 174 256
Current Account ($bn) -24 -21 -1 -2 -7 -15 -14 -17 -6 (%GDP) -5.6 -5.9 -0.4 -0.6 -2 -4 -3 -3.1 -0.7
Financial Account ($bn) 34 15 -10 6 19 17 14 18 27
Direct Foreign Invt 4 11 10 9 12 11 12 13 13
Portfolio 29 8 -10 13 5 -0.5 11 -2 2
Bank Loans -3 -5 -7 -7 7 6 5 -5 12
Ext. Pub. Debt($bn) 78 85 100 98 97 101 97 87 104(%GDP) 18 30 36 27 22 24 20 15 13
Ext. Priv. Debt 46 51 47 45 51 61 63 75 64(%GDP) 11 18 17 12 13 15 13 13 8
Dom. Pub Debt (%GDP) 12 12* 7 8 9 10 11 11 28(* 70% Tesobonos)

W H E R E O P P O R T U N I T I E S E M E R G E
Mexico – 1994 Crisis
Forex reserves
Exchange rate
Current Account, % of GDP peso/$ %
GDP growth
Industry growth
% %$
InflationGDP per capita, $
$ billion months
Months of imports
External debt, % of GDP
Public debt, % of GDP
Unemployment rate
%
-8
-6
-4
-2
0
1991 1992 1993 1994 1995 1996 1997
3.0
4.3
5.5
6.8
8.0
-8
-4
0
4
8
12
1991 1992 1993 1994 1995 1996 1997
0
1000
2000
3000
4000
5000
1991 1992 1993 1994 1995 1996 1997
0
8
16
24
32
40
0
1
2
3
4
5
6
1991 1992 1993 1994 1995 1996 1997
0
6
12
18
24
30
1991 1992 1993 1994 1995 1996 1997
0.0
0.8
1.6
2.4
3.2
4.0
0%
10%
20%
30%
40%
50%
60%
1991 1992 1993 1994 1995 1996 1997
Source: World Bank, World Development Indicators Database


4. Lessons from the Mexico Crises.
1. The Current Account Deficit is a key variable that should not get
out of line, even if this deficit is due to overspending by the
private sector and the Government has a balanced fiscal budget.
2. The composition of large capital inflows into a country -- short-
term versus direct investments or long term -- is very important
for the vulnerability of the country in a crisis.
3. The use of proceeds of foreign investments is important for its
sustainability: consumption (as in Mexico) versus investments
(which could generate growth/exports).
4. There is an inherent danger in using fixed or pegged exchange
rates as a stabilization device. It is hard to have a “soft-landing”.
5. The exchange rate must be adequate to bring equilibrium both in
the goods markets as well as in the financial markets.

6. Weaknesses in the domestic banking sector can increase the risk
of poor lending that can precipitate the crises.
7. The possibility of a financial crisis can be foreseen based on
major imbalances in economic fundamentals. But it is difficult
to predict the timing of the crises, the dept of it, and its
spillover effects (the so called Tequila Effect) in other EMs.
8. If a country enters in a financial crisis, the only way to bring
back confidence is with a very strong fiscal and economic
adjustment program, backed up by significant financial
resources from abroad.
9. Contagion can be strong into countries with weak fundamentals.
During early 1995, Argentina lost 30% of its international
reserves, which led to a similar contraction in money supply.
Interest rates increased from about 10% to 23% during the
period. This led the economy into recession and bank failures.
The Argentinean stock exchange also collapsed.

II. The East Asia Crisis
• In spite of the success of East Asian economies in many areas of
economic reform, the 1997 Asian Crisis was caused by an
unsustainable deterioration in key economic fundamentals --
resulting from poor economic policies, poor banking practices
that led to poor investments, and contagion effects.
• Supported by economic reforms, in a number of areas, East
Asian countries were doing well:
– Their Fiscal Budgets were balanced (if fact, most countries
had small fiscal budget surpluses of 1% of GDP).
– Inflation was also under control. For all countries inflation
rates ranged form 5% to 10% pa.
– Domestic savings rates were quite high, over 30% of GDP, except for Philippines (18% of GDP).
– GDP growth was high for all countries in the region.

• On the strength of these economic results, and low interest rates in
Japan, significant capital inflows came into the region, growing from
US$10 billion per year in 1984-89, to US$108 billion in 1996
• Of these inflows, US$30 billion were in the form of bank loans.
• These capital inflows led to accumulation of large foreign exchange
liabilities. From 1993 to 1996, foreign debt-to-GDP ratios rose from
100% to 167% in the four larger economies.
• For the five most affected countries, short-term bank foreign debt
increased from US$93 billion in 1993 to US$152 billion in 1996.
• By mid-1997, the ratios of short-term external debt to international
reserves were above 1.0 in Thailand (1.5), Indonesia (1.7) and Korea
(2.1).
• These foreign capital inflows also led to appreciation of local
currencies during the 1990’s.
• Many countries (Thailand, Malaysia, Philippines) tacitly pegged
their currencies to the US dollar, to facilitate borrowings and
reduce borrowing costs.
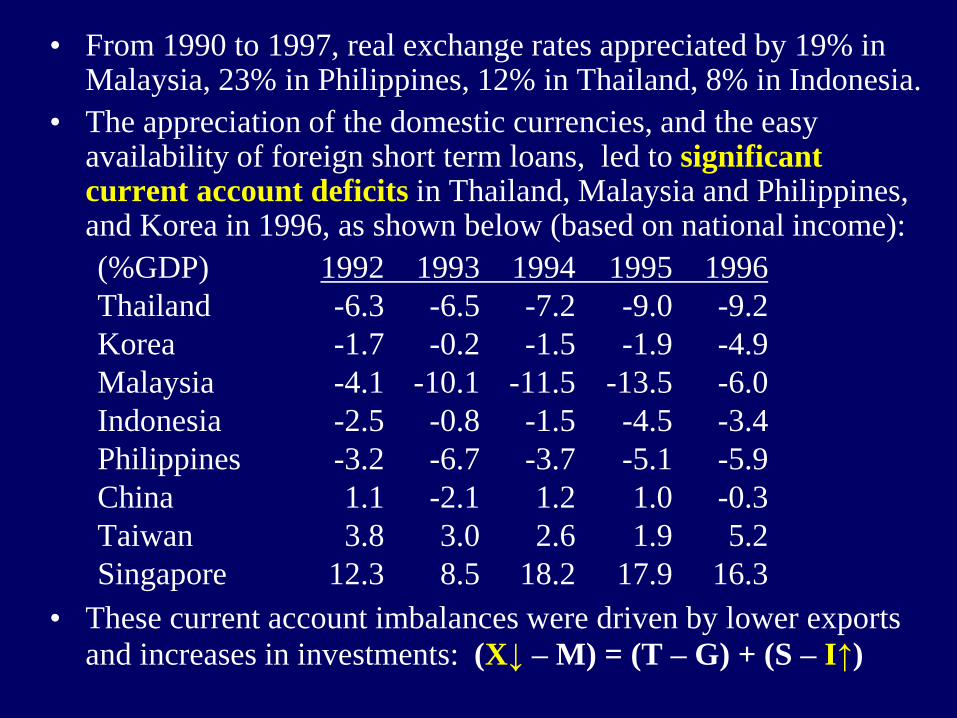
• From 1990 to 1997, real exchange rates appreciated by 19% in Malaysia, 23% in Philippines, 12% in Thailand, 8% in Indonesia.
• The appreciation of the domestic currencies, and the easy availability of foreign short term loans, led to significant current account deficits in Thailand, Malaysia and Philippines, and Korea in 1996, as shown below (based on national income):
(%GDP) 1992 1993 1994 1995 1996
Thailand -6.3 -6.5 -7.2 -9.0 -9.2
Korea -1.7 -0.2 -1.5 -1.9 -4.9
Malaysia -4.1 -10.1 -11.5 -13.5 -6.0
Indonesia -2.5 -0.8 -1.5 -4.5 -3.4
Philippines -3.2 -6.7 -3.7 -5.1 -5.9
China 1.1 -2.1 1.2 1.0 -0.3
Taiwan 3.8 3.0 2.6 1.9 5.2
Singapore 12.3 8.5 18.2 17.9 16.3
• These current account imbalances were driven by lower exports
and increases in investments: (X↓ – M) = (T – G) + (S – I↑)

• Several factors contributed to lower exports & CA deficits:
(1) Growth of exports of East Asian economies slowed down due to the long stagnation in Japan and the emergence of China as a competing export power.
(2) The sharp appreciation of the US dollar relative to the yen in 1995 led to a worsening of cost-competitiveness of those Asian countries that had pegged to the dollar.
(3) In 1996, there were sector specific shocks, such as a major reduction in demand for semiconductors and adverse terms of trade for many countries in the region.
• For a number of years, foreign financial institutions were aware of the large current account deficits in the region and of the increases in external debt.
• But the rationale for continuing lending was that these capital inflows were used for additional investment purposes, which is consistent with high growth and increased capacity to sustain
exports and debt service: (X↓ – M) = (T – G) + (S – I↑).

• However, there were other factors that affected the sustainability of
capital inflows and their financing of high current account deficits:– Easy availability of foreign credits led to rapid increases in
commercial bank loans to questionable clients, which led to a rapid increase in non-performing loans in most banks in the region,
reaching over 15% in Thailand, Indonesia, Malaysia and Korea.– A substantial portion of new investments (30% to 40% of bank
loans in Thailand and Malaysia) went to real estate, whose prices increased rapidly. These projects do not contribute directly to
improve future exports and debt service capacity.– Commercial banks were becoming insolvent and incapable of
servicing their own foreign borrowings.– The profitability of new investments was low. The incremental
capital output ratios increased sharply during 1993-1996.– Paul Krugman also showed that Total Factor Productivity – the
main driver for long-term growth -- was not growing in the region.– During 1993-96, most Asian public companies in the crises
countries were value-destroyers, not value-creators (returns on
investment capital were lower that interest rates).

• The main reason for over-investment in poor projects was political
pressure, favoritism, and patronage coupled to poor banking
practices.
• Poor banking practices were widespread and induced by moral
hazards: the understanding that their investments were “insured”
by the Government which was encouraging them.
• Bad banking practices were also facilitated by lack of transparency,
poor banking regulations and supervision, inadequate bank capital
requirements, and inadequate bankruptcy procedures.
• Through the 1990’s excessive bank lending is shown by the ratios
of bank lending to GDP of more than 50% in Thailand, and
Philippines, 27% in Malaysia, and about 15% in Korea, Indonesia,
Hong Kong and Singapore.
• As a result of excessive bank borrowings, many enterprises had
very large debt to equity ratios.

• Thailand, for two years, in 1995-1996, had a Current Account Deficit of over 9% of GDP.
• The foreign exchange for these imports was made available by short-term foreign bank loans.
• A significant portion of the local currency counterpart of the foreign bank loans was invested in longer term real estate assets, stimulated by high real estate prices. This led to large over-investments and excessive capacity.
• But since 1996, due to large vacancies, these real estate investments suffered losses. This led to a deflation in real estate prices in late 1996.
• The level of non-performing loans increased rapidly.
• Merchandise exports slowed down sharply ins 1996 and early 1997 reflecting the real appreciation and loss of competitiveness.
• Since mid-1996, equity investors already perceived difficulties in sustaining the external CA deficits and maintaining the fixed currency, which led to a decline in stock market prices.
• However, many foreign banks disregarded these signals, perhaps because the experience of Mexico also suggested that large countries will not be allowed to fail: the multilaterals will bail them out eventually.
• But in early 1997, the asset bubble started to bust with the emergence of wide losses & outright defaults in the financial and corporate sector, starting in Thailand (with Somprasong Land’sdefault of an Eurodollar and the collapse of Finance One, one of the largest finance companies).
• The widespread perception of a real misalignment and unsustainable external imbalances undermined the credibility of the commitment to fixed exchange rates in Thailand and also in many countries in the region.
• In May 1997, the Thai Baht was hit by major speculative attacks.
• In June 1997, the PM gave assurances that the Baht would not be devalued.
• But without much credibility, the country experienced massive layoffs in real estate, construction and financial sectors.

• All this led to further changes in lending sentiments. Without the possibility of roll-over, many firms with large short-term foreign debt could not easily repay them. More defaults followed.
• The Thai Central Bank had promised to bail out these companies.• But this promise could not be met when the new Minister of Finance
discovered that the level of international reserves were not the official US$30 billion; but only US$1 billion
• This was because reserves had been committed in early 1997 to defend the Baht through forward contracts and swaps.
• A few days later, on July 2, 1997, Thailand was forced to float the Baht, which depreciated by 35% in a few weeks.
• By July 1997, the stock exchange index had already collapsed from about 600 in mid-1995 to 200.
• The total devaluation from mid-1996 to mid-1998 was 65%, worsening the real burden of external debt by firms that had borrowed heavily in foreign currency.
• In a new months, by December 1997, it went down to 50. • Given external over-borrowings, the recovery was indeed slow.
• The main causes of the crisis were fixed FX rates, large external deficits and a weak and unsupervised banking sector.


W H E R E O P P O R T U N I T I E S E M E R G E
Thailand – 1997 Crisis
Forex reserves
Exchange rate
Current Account, % of GDP
baht/$ %
GDP growth
Industry growth
% %$
Inflation
GDP per capita, $
$ billion months
Months of imports
Public debt, % of GDP
Unemployment rate
%
External debt, % of GDP
-9
-4
0
4
9
13
1994 1995 1996 1997 1998 1999 2000
20
25
30
35
40
45
-14
-7
0
7
14
1994 1995 1996 1997 1998 1999 20000
800
1600
2400
3200
1994 1995 1996 1997 1998 1999 20000
2
5
7
9
0
1
2
3
4
1994 1995 1996 1997 1998 1999 20000
5
10
15
20
25
1994 1995 1996 1997 1998 1999 20001
2
3
4
5
6
0%
20%
40%
60%
80%
100%
1994 1995 1996 1997 1998 1999 2000
Source: World Bank, World Development Indicators Database

• In Indonesia, the crises was also originated by fundamental economic weaknesses, with many firms in difficulties due to excessive private
external borrowings for poor investments. –But with sound macro conditions, investors did not perceive these
difficulties, with the stock exchange stable up to mid-1997 (WB
comment: “Indonesia is too big and important to collapse”).
–But following the Thai devaluation in July 1997, Indonesia widen the Rupiah’s trading band from 8% to 12%. Suddenly, the currency
was attacked and free-floated/devalued in August 1997. –This led to a quick collapse of the stock exchange from an index of
680 in mid-1997 to 70 by December 1997. –The crisis in Indonesia became even deeper and more prolonged with
the announcement in December 1997 that the level of foreign debt had been underestimated/misreported.
–Foreign debt was close to US$200 billion, rather that the official figure of the Government of US$117 billion.
–The exchange rate depreciated by 300% in two years.
–In May 1998 thousands of demonstrators ended the 32 years in
power of President Suharto.

W H E R E O P P O R T U N I T I E S E M E R G E
Indonesia – 1997 Crisis
Forex reserves
Exchange rate
Current Account, % of GDP
thousand rupiah/$
GDP growth
Industry growth
% %$
Inflation
GDP per capita, $
$ billion months
Months of importsExternal debt, % of GDP
Public debt, % of GDP
-4
-2
0
2
4
6
1994 1995 1996 1997 1998 1999 2000
2.0
3.8
5.6
7.4
9.2
11.0%
-15
-10
-5
0
5
10
15
1994 1995 1996 1997 1998 1999 2000
0
200
400
600
800
1000
1200
1994 1995 1996 1997 1998 1999 2000
0
10
20
30
40
50
60
0
5
10
15
20
25
30
1994 1995 1996 1997 1998 1999 2000
2.5
3.2
3.8
4.5
5.2
5.8
6.5
0%
20%
40%
60%
80%
100%
120%
140%
160%
1994 1995 1996 1997 1998 1999 2000
%
Source: World Bank, World Development Indicators Database

• In South Korea, the attack on the Won and its devaluation in October 1997 may have been triggered by the Thai devaluation.
• But it was caused by fundamentals: (i) excessive bank borrowings that led to a large number of non-performing loans and corporate bankruptcies, and (ii) large current account deficits of 5% of GDP.
• Again , the counterpart of the CA deficits were uneconomic private sector investments: (X↓ – M) = (T – G) + (S – I↑).
• The debt to equity ratio for the 30 top conglomerates (Chaebols) in Korea was 333% in mid-1996 (compared to 100% for the US).
• Corporate bankruptcies started in mid-1996, when investors realized that Korea was already in clear trouble.
• This sentiment led to a rapid decline in stock prices, as seen in the chart, from an index of 180 in mid-1996 to 110 in December 1996.
• The crisis deepened in 1997, with the collapses of Hanbo Steel and Sammi Steel and the defaults of the Jingo and Kia Groups.
• By mid-1997, investors were in panic, and the devaluation in Thailand triggered the Korea devaluation of 80% by mid-1998.
• By December 1997, the stock exchange index had declined to 30.
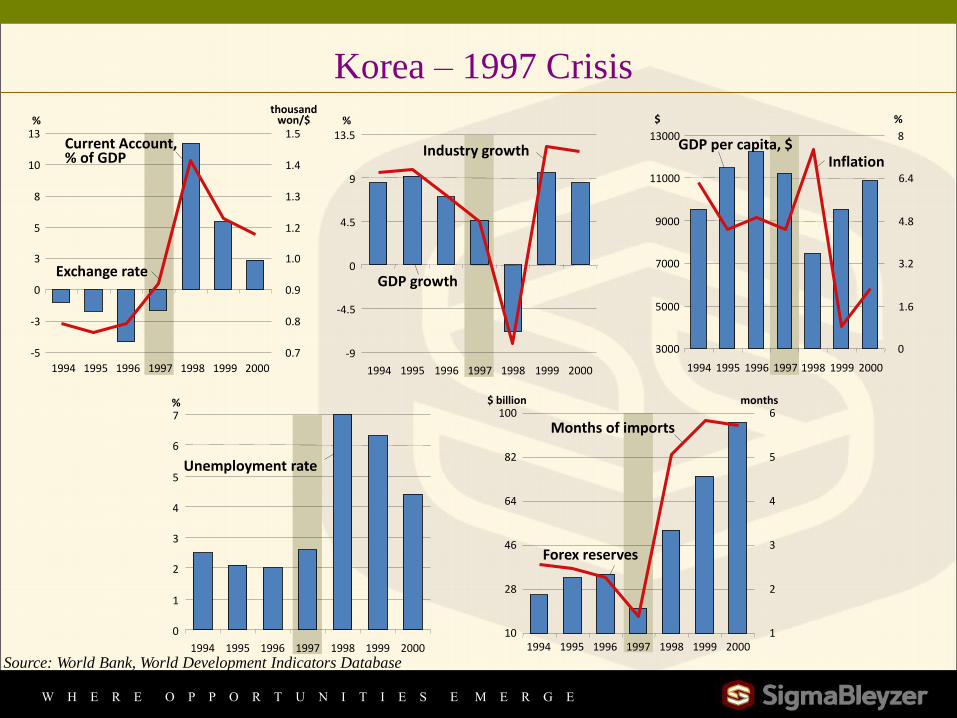
W H E R E O P P O R T U N I T I E S E M E R G E
Korea – 1997 Crisis
1994 1995 1996 1997 1998 1999 2000 1994 1995 1996 1997 1998 1999 2000
Forex reserves
Exchange rate
Current Account, % of GDP
%
Industry growth
% %$
InflationGDP per capita, $
$ billion months
Months of imports
GDP growth
Unemployment rate
%
thousand won/$
-5
-3
0
3
5
8
10
13
1994 1995 1996 1997 1998 1999 2000
0.7
0.8
0.9
1.0
1.2
1.3
1.4
1.5
-9
-4.5
0
4.5
9
13.5
1994 1995 1996 1997 1998 1999 2000
3000
5000
7000
9000
11000
13000
1994 1995 1996 1997 1998 1999 2000
0
1.6
3.2
4.8
6.4
8
0
1
2
3
4
5
6
7
10
28
46
64
82
100
1
2
3
4
5
6
Source: World Bank, World Development Indicators Database

• In Malaysia, the deterioration of fundamentals had also occurred before the Thai devaluation of July 1997.
– From 1993 to 1995, with large capital inflows, it had current account deficits in excess of 10% of GDP.
– Capital inflows were driving real estate and equity prices to unsustainable levels: (X↓ – M) = (T – G) + (S – I↑).
– Concerned about real estate price increases in the capital, in March 1997, the Central Bank announced ceilings in lending for real estate and also for purchase of stocks.
– The impact on the stock exchange was immediate, with foreign investors liquidating their holdings and moving capital out.
– Stock prices collapsed from March 1997 on, with the stock index dropping from 450 in March 1997 to 100 in December 1997.
– Following the Thai devaluation in July, the Ringgit was attacked and by August 1997, the currency floated and devalued 60%.
– In September 1997, the Government fixed the FX rate and introduced capital flow controls.
– In 1998, with a deep recession, GDP declined by 6.2%

W H E R E O P P O R T U N I T I E S E M E R G E
Malaysia – 1997 Crisis
Forex reserves
Exchange rate
Current Account, % of GDP
ringgit/$
GDP growth
Industry growth% %$
Inflation
GDP per capita, $
$ billion months
Months of imports External debt, % of GDP
Public debt, % of GDP
%
%
-11
-6
0
6
11
17
1994 1995 1996 1997 1998 1999 2000
2.0
2.4
2.8
3.2
3.6
4.0
-12
-8
-4
0
4
8
12
16
1994 1995 1996 1997 1998 1999 2000
0
1000
2000
3000
4000
5000
1994 1995 1996 1997 1998 1999 2000
0
1
2
4
5
6
0
6
13
19
26
32
1994 1995 1996 1997 1998 1999 2000
1
2
3
4
5
0%
10%
20%
30%
40%
50%
60%
1994 1995 1996 1997 1998 1999 2000
Source: World Bank, World Development Indicators Database

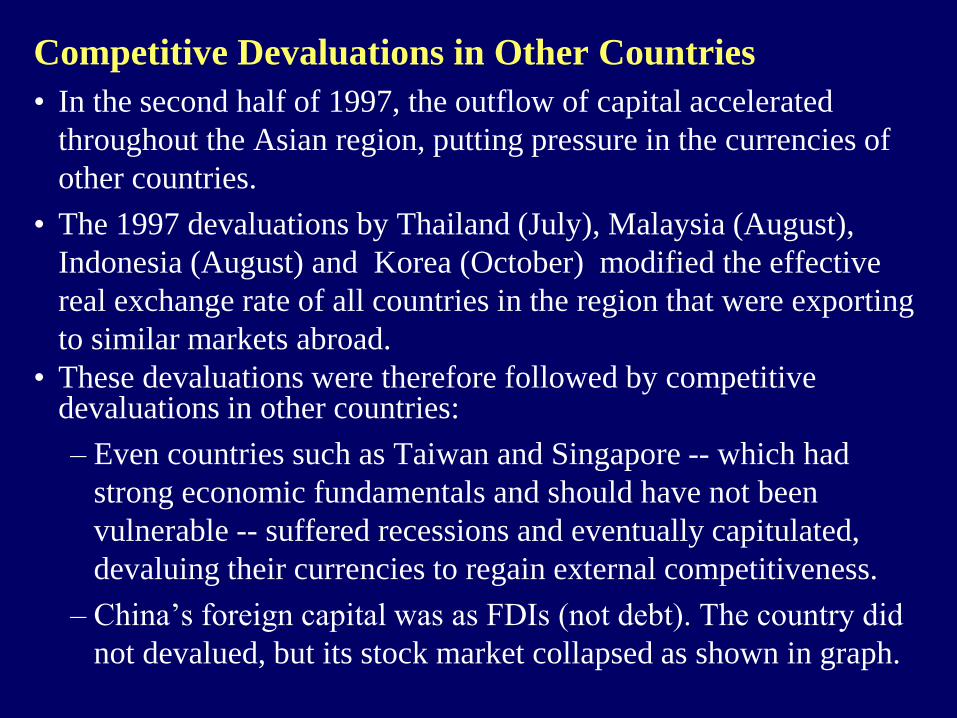
Competitive Devaluations in Other Countries
• In the second half of 1997, the outflow of capital accelerated
throughout the Asian region, putting pressure in the currencies of
other countries.
• The 1997 devaluations by Thailand (July), Malaysia (August),
Indonesia (August) and Korea (October) modified the effective
real exchange rate of all countries in the region that were exporting
to similar markets abroad.
• These devaluations were therefore followed by competitive devaluations in other countries:
– Even countries such as Taiwan and Singapore -- which had
strong economic fundamentals and should have not been
vulnerable -- suffered recessions and eventually capitulated,
devaluing their currencies to regain external competitiveness.
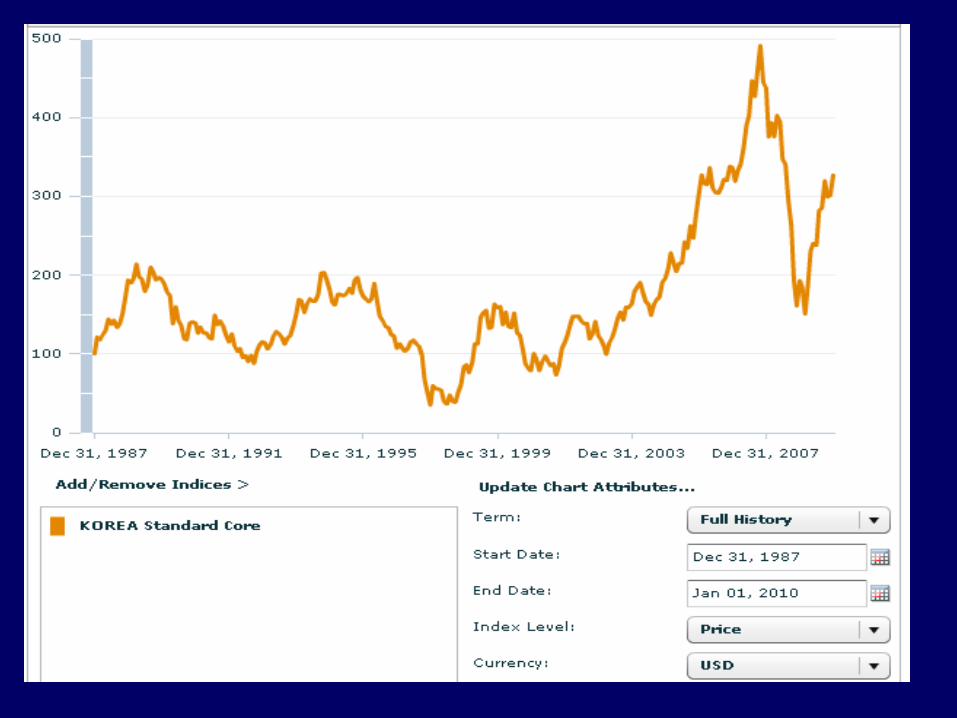
– China’s foreign capital was as FDIs (not debt). The country did
not devalued, but its stock market collapsed as shown in graph.


Role of the International Community in addressing the Asia
Crises.
• For two years before the crises, the IMF/World Bank had
highlighted the issues and risks, particularly to Thailand.
• After the crisis, they worked with the three countries most
affected -- Thailand, Korea and Indonesia -- in arranging
programs of economic reforms that could restore confidence.
• A financial support package of $112 billion was arranged, with
financing provided as follows (US$billion):
Country IMF World Bank Bilateral Totaland ADB --------- -------- ------------ ----------- ------
Korea 21 14 23 58Thailand 4 3 10 17Indonesia 10 8 19 37
--- --- --- ---
Total 35 25 52 112

• In 1998, key economic disequilibria in the Asian region before the crisis -- large Current Account deficits -- were eliminated and became large surpluses, as follows:
Current Account to GDP (%) . Fiscal Deficit
1996 1997 1998 1999 2000 2001 2001(%GDP)
Korea -4.9 -1.8 12.3 5.9 2.4 0.9 0
Indonesia -3.4 -2.4 4.2 3.4 5.1 3.4 -4.0
Malaysia -6.0 -5.7 13.6 16.2 9.2 6.4 -6.7
Philippines -5.9 -5.4 2.0 9.4 11.9 6.1 -4.3
Thailand -9.2 -2.1 12.7 9.1 7.1 4.0 -3.0
Hong Kong 0.6 -3.6 1.4 5.2 5.4 8.1 na
China -0.3 3.3 3.0 1.0 1.2 0.4 -2.2
• However, large public expenditures to bail out banks and carry out corporate restructuring put fiscal pressures, with several countries showing large fiscal deficits in year 2001.
• Furthermore, most countries also made little progress in corporate and banking restructuring.

The Asian crises can be summarized as caused by:
– Large external imbalances caused by poor economic policies,
particularly pegged exchange rates and excessive bank foreign
borrowings due to implicit government guarantees.
– Bad banking practices and undue political patronage led to
excessive and low-profitability investments that defaulted.
– A contagion effect made more pronounced by a series of
competitive devaluations.
• The crisis was made deeper and more widespread by bad banking
practices throughout the region that led to poor investments (the
main cause of the crisis, according to Paul Krugman).
• A Paper by St. Antony’s Jenny Corbett and David Vines says:
– Vulnerability was created both by capital liberalisation in the
presence of a bank-based financial regime (which contained
implicit promises of bail-out), and by capital liberalisation under
pegged exchange rates (which led to excessive un-hedged
borrowings and the subsequent boom and bust).

Lessons from the Asia Crisis.
• The lessons from the Mexico 1994 crisis are also very relevant lessons
from the crisis in Asia:
– The risks of fixed exchange rates and foreign borrowings to sustain
excessive credit expansion (for consumption in Mexico and for poor
investments in Asia).
– To address the crisis, there is a need to gain credibility by (i)
implementing major growth-oriented economic reforms to address
imbalances, and (ii) by securing large amounts of foreign financing.
• In addition, the Asia crises has highlighted the need for:
– Improved Bank Regulation and Supervision.
– Development of capital markets to improve financial intermediation.
– Improved Governance to deal with political favoritism.
– Avoiding moral hazards from implied Government guarantees.
– Improved bankruptcy procedures.

• The Asia Crisis has also highlighted the need to review the role of Multilateral and other international agencies in the international financial system. In particular:
1. The IMF and World Bank should develop different policy responses for different situations. “Blueprints” do not work well in all circumstances.
2. Under the current international financial system, the leverage of multilateral institutions, such as the IMF and the World Bank, is substantial only when the country is in crisis, in its knees. But it is not important when the country is doing “reasonably well”.
3. The 1999 approval of an IMF’s Contingent Credit Line (CCL) gave leverage to the IMF to seek strong macro policies in anticipation of crises; rather than just provide bail-out interventions after the crisis. But it was abandoned without used in 2003 and is expected to be succeeded by a similar facility under review, the Rapid Access Line (RAL) but with less stringent qualification standards and easier conditionality.

• On the adequacy of the economic program imposed by the IMF,
some analysts believe that the application of tight monetary policies to
Asia (with high interest rates) exaggerated the financial collapse as
they reduced the creditworthiness of indebted firms and their capacity
to serve debt.
• They also believe that fiscal contraction exacerbated the downturn,
caused firm’s revenues to fall, and also worsened their collapse.
• And they believe that different policies were needed:
– Interest rates should not have been increased, given the size of
foreign debt (monetary policy was too tight) of companies.
– Currency depreciation should have been controlled by inflation
anchors and not by fiscal contraction.
– The IMF delayed assistance since the fiscal deficits that
Governments were prepared to accept were higher than the IMF
demand. This delays/uncertainty deepened the crises.
– Growth oriented reforms should have been given more priority.

Main Criticisms of the IFIs by Joseph Stiglitz
1/ Premature Capital liberalization forced by the IMF just led to massive inflows of capital followed by massive outflows (from poorly regulated banks.) Then, the IMF just asked for high interest rates to get the money bank to the country; but this just led to the bankruptcy of local enterprises with high debt.
2/ Controlling fiscal deficits and forcing market-based pricing, principally for utilities and gas, have just led to elimination of subsidies to the poor, creating massive suffering.
3/ Under a "poverty reduction strategy", the IFIs ask for Free Trade. But this is free trade by the rules of the Europeans and Americans, which are lowering EMs barriers to their sales of industrial products and services to EMs, while barricading their own markets against Third World agriculture.
4/ The WTO's intellectual property rights treaty has "condemned poor people to death" by imposing impossible fees to pay to pharmaceutical companies for branded medicines.
5/ Corrupt Privatizations (such as in Russia) just led to bribes and sell off of state enterprises at cheap prices.

III. The Russian Crisis of 1998
• Since the early 1990s, the Russian Government had implemented a number of economic reform measures, but with mixed results.
• In particular, very limited real restructuring took place in industry and banking; grand scale looting of state owned and recently privatized enterprises continued unabated; and enormous capital outflows took place.
• Furthermore, the fiscal deficit was never under sustainable control, reaching 8% of GDP in 1996, 7% in 1997, and 5% in the first half of 1998.
• These high fiscal deficits were due to:
– inability to raise fiscal revenues (due to widespread exemptions for vested interests, excessive transfers to states, and poor tax collection from state enterprises), and
– inability to control expenditures (excessive subsidies and inability to impose hard budgets to public enterprises and agencies which refused to pay their wages and utilities).

• In spite of the large fiscal deficits, the re-election of President Yeltsin in July 1996 brought the expectation of future progress.
• This led to huge increases in foreign loans and portfolio investments into the domestic equity and T-bill markets.
• These capital inflows led to a large asset price bubble, with the stock market rising in real terms by 150% in 1996 and a further 180% in the first 8 months of 1997, as shown in the chart.

• In the new environment, regional governments, commercial banks, and exporters were able to borrow heavily in dollars.
• The Federal Government was also able to finance much of its fiscal deficits by issuing short-term T-bills.
• The stock of T-bills increased from US$35 billion equivalent in July 1996 to US$70 billion equivalent, in June 1998.
• One-third of this T-Bill stock was held by foreigners.
• In November 1996, the Government issued its first US$1 billion Eurobond, and over the next two years, it borrowed a further US$15 billion in international markets.
• As the level of debt increased, foreign investors hedged themselves against the risk of devaluation by buying forward contracts with Russian banks.
• These contracts apparently assured them a fixed rate of return in dollars by guaranteeing a predetermined exchange rate.
• But this increased the exposure and vulnerability of local banks to declines in the Rouble.

• In the second half of 1997, foreign banks became unwilling to
roll-over maturing loans to Russian banks, due to:
– the advent of the East Asia crisis,
– The decline in the international price of oil (a main Russian
export) by 44% in real terms from 1996-97 to 1998,
– the political difficulties of the Government with the Duma,
– the realization of economic disequilibrium in the country,
– the realization that very little real restructuring was taking
place in industry and banking,
– the realization that grand scale looting was taking place on
state-owned and recently privatized companies,
– capital flight out of the country was accelerating.
• Some large Russian banks were forced to make margin calls and
had to liquidate shares to make payments, depressing stock prices
from October 1997 on.
• Stock prices collapsed from 500 in October 1997 to 30 in
September 1998, as shown in the chart.


• Initially, the Government provided banks with liquidity support.
• But the Government itself had financing problems.
• Throughout the summer of 1998, the Government could not place the US$1 billion of T-bills maturing every week.
• During the summer, capital flight accelerated: international reserves dropped from US$11 billion to US$8 billion in July 1998.
• In July 1998, the IMF agreed to provide emergency financing, which would bring US$22 billion of resources, of which US$4.8 billion was disbursed immediately in the first tranche.
• But this IMF financing “were stolen and disappeared”. In any case, it was not sufficient to calm down the financial markets.
• By early August 1998, several banks were at the verge of collapse, and started to default on their international obligations.
• On August 17, 1998, Russia simultaneously: (i) gave up its defense of the Rouble, (ii) defaulted on much of its domestic government debt, and (iii) declared a moratorium on debt principal payments to foreigners by Russian companies and banks.
• But Government’s Eurobond debt service was not affected.

• These moves prompted a run on the banks, a sharper fall in the exchange rate (from 6 Rouble/$ in mid-1998 to 22 Rouble/$ in March 1999) and an acceleration of inflation.
• Within a week, the Government fell.• The Russian banks suffered significantly: out of the 1,473 banks
in Russia on the eve of the crisis, 440 are no longer functioning.
• In 1999, the Government implemented a number of reforms:
– Land reform was launched, banking sector reform progressed, deregulation was implemented, taxes were cut off to lower levels, a new customs code was introduced.
– The fiscal deficit over GDP was reduced from -4.5% in 1998, to -1.1% in 1999 and to surpluses of +2.5% in 2000 and later years, reaching a 7.5% surplus in 2006.
– The Current Account had a surplus of 11% of GDP in 2006
– External debt over exports was reduced from 193% of GDP in 1998 to 128% in 2001 and to 40% in 2006.
• All these measures and a rapid recovery of international oil prices led to recovery of GDP and stock prices, as shown in the chart.

W H E R E O P P O R T U N I T I E S E M E R G E
Russia – 1998 Crisis
Forex reserves
Exchange rate
Current Account, % of GDP
ruble/$ %
GDP growth
Industry growth
% %$
Inflation
GDP per capita, $
$ billion months
Months of imports
Public debt, % of GDP
Unemployment rate%
0
5
10
15
20
1995 1996 1997 1998 1999 2000 2001
4
11
18
25
32
-7
-4
0
4
7
11
14
1995 1996 1997 1998 1999 2000 20010
600
1200
1800
2400
3000
1995 1996 1997 1998 1999 2000 2001
10
48
86
124
162
200
1
4
6
9
11
14
1995 1996 1997 1998 1999 2000 20010
8
16
24
32
40
1995 1996 1997 1998 1999 2000 2001
1
2
3
4
5
6External debt, % of GDP
20%
30%
40%
50%
60%
70%
80%
90%
1995 1996 1997 1998 1999 2000 2001
Source: World Bank, World Development Indicators Database


Lessons from the Russian Crises of 1998.• The 1998 Russian Crisis had its main origin in lack of economic
reforms and unsustainable fiscal budget deficits, as was the case in the crises of Latin America in the 1980s.
• This crisis reminds us that Fiscal Budget Deficits can not be out of line: Under “normal” conditions, a sustainable fiscal budget deficit should not exceed 3% of GDP for a long period of time, based on “normal” real interest rates and “normal” productivity and growth rates.
• The Russian crisis brought into focus an additional lesson to those listed in the Mexico and East Asian crises: Bad economic policies can not provoke a financial crisis unless they are first financed by imprudent lending.
• Spillover effects of a financial crises can be significant. Several countries we affected: Estonia, Latvia and Lithuania sank into recession; Belarus GDP declined from 8% to 3%; Ukraine suffered a financial crises, and Kazakhstan’s foreign exchange reserves were halved as exports dropped.