lecture 12: factor pricing · 2009-12-16 · factor pricing slide 12-17 …unobservable factors…...
TRANSCRIPT

Slide 12-1Factor Pricing
Lecture 12: Factor Pricing
Prof. Markus K. Brunnermeier

Slide 12-2Factor Pricing
Overview
1. ICAPM – multiperiod economic model (last lecture)
2. Asset Pricing Theory (APT) – static statistical model
Merits of Factor Pricing
Exact Factor Pricing and Factor Pricing Errors
Factor Structure and Pricing Error Bounds
Single Factor and Beta Pricing (and CAPM)
(Factor) Mimicking Portfolios
Unobserved Factor Models
Multi-period outlook
3. Empirical Factor Pricing Models
Arbitrage Pricing Theory (APT) Factors
The Fama-French Factor Model + Momentum

Slide 12-3Factor Pricing
The Merits of Factor Models• Without any structure one has to estimate J expected returns E[Rj] (for each asset j)
J standard deviations
J(J-1)/2 co-variances
• Assume that the correlation between any two assets is explained by systematic components/factors, one can restrict attention to only K (non-diversifiable) factors
Advantages: Drastically reduces number of input variablesModels expected returns (priced risk)Allows to estimate systematic risk
(even if it is not priced, i.e. uncorrelated with SDF)
Analysts can specialize along factors
Drawbacks: Purely statistical model (no theory)(does not explain why factor deserves compensation: risk vs. mispricing)
relies on past data and assumes stationarity

Slide 12-4Factor Pricing
Factor Pricing Setup …• K factors f1, f2, …, fK
E[fk]=0
K is small relative to dimension of M
fk are not necessarily in M
• F space spanned by f1,…,fK,e
• in payoffs
bj,k factor loading of payoff xj

Slide 12-5Factor Pricing
…Factor Pricing Setup
• in returns
• Remarks:
One can always choose orthogonal factors Cov[fk, fk‟]=0
Factors can be observable or unobservable

Slide 12-6Factor Pricing
Factor Structure
• Definition of “factor structure:”
• ) risk can be split in systematic risk andidiosyncratic (diversifiable) risk

Slide 12-7Factor Pricing
Exact vs. Approximate Factor Pricing
• Multiplying (1) by kq and taking expectations
• Rearranging
• Exact factor pricing:
error: j = 0 (i.e. j s orthogonal to kq )
e.g. if kq 2 F

Slide 12-8Factor Pricing
• Recall error
Note, if 9 risk-free asset and all fk 2 M, then …
• If kq 2 F, then factor pricing is exact
• If kq F, thenLet‟s make use of the Cauchy-Schwarz inequality
(which holds for any two random variables z1 and z )
Error-bound
Bound on Factor Pricing Error…

Slide 12-9Factor Pricing
Error-Bound if Factor Structure Holds• Factor structure ) split idiosyncratic from systematic risk
• ) all idiosyncratic risk j are linearly independent and
span space orthogonal to F. Hence,
• Note
• Error
• Pythagorean Thm: If {z1, …, zn} is orthogonal system in
Hilbert space, then
Follows from def. of inner product and orthogonality

Slide 12-10Factor Pricing
Applying Pythagorean Thm to implies
Multiply by …… and makinguse of
RHS is constant for constant max[ 2( j)].
) For large J, most securities must have small pricing error
• Intuition for Approximate Factor Pricing: Idiosyncratic risk can be diversified away
Error-Bound if Factor Structure Holds

Slide 12-11Factor Pricing
One Factor Beta Model…
• Let r be a risky frontier return and set
f = r – E[r] (i.e. f has zero mean)
q(f) = q(r) – q(E[r])
• Risk free asset exists with gross return of r
q(f) = 1 – E[r]/r
• f and r span E and hence kq 2 F
) Exact Factor Pricing
_
_
_

Slide 12-12Factor Pricing
…One Factor Beta Model
• Recall
E[rj] = r - j r q(f)
E[rj] = r - j {E[r] - r}
• Recall
j = Cov[rj, f] / Var[f] = Cov[rj, r] / Var[r]
• If rm 2 E then CAPM
__
_ _

Slide 12-13Factor Pricing
Mimicking Portfolios…
• Regress on factor directly or on portfolio that mimics factor
Theoretical justification: project factor on M
Advantage: portfolios have smaller measurement error
• Suppose portfolio contains shares 1, …, J with jJ
j = 1.
• Sensitivity of portfolio w.r.t. to factor fk is k = j j jk
• Idiosyncratic risk of portfolio is = j j
2 ( ) = j
2 ( j)
diversification

Slide 12-14Factor Pricing
…Mimicking Portfolios
• Portfolio is only sensitive to factor k0 (and
idiosyncratic risks) if for each k k0 k= j
jk=0, and k0= j jk0 0.
• The dimension of the space of portfolios
sensitive to a particular factor is J-(K-1).
• A portfolio mimics factor k0 if it is the portfolio
with smallest idiosyncratic risk among portfolios
that are sensitive only to k0.

Slide 12-15Factor Pricing
Observable vs. Unobservable Factors…
• Observable factors: GDP, inflation etc.
• Unobservable factors:
Let data determine “abstract” factors
Mimic these factors with “mimicking portfolios”
Can always choose factors such that
• factors are orthogonal, Cov[fk, fk‟]=0 for all k k‟
• Factors satisfy “factor structure” (systemic & idiosyncratic risk)
• Normalize variance of each factor to ONE
) pins down factor sensitivity (but not sign, - one can always change sign of factor)

Slide 12-16Factor Pricing
…Unobservable Factors…• Empirical content of factors
Cov[ri,rj] = k ik jk2(fk)
2(rj) = k jk jk
2(fk)+2( j)
(fk)=1 for k=1,L,K. (normalization)
In matrix notation
• Cov[r,r„] = k k‟ k2(fk) + D,
– where k = ( 1k,…, Jk).
• = B B‟ + D,
– where Bjk= jk, and D diagonal.
– For PRINCIPAL COMPONENT ANALYSIS assume D=0(if D contains the same value along the diagonal it does affect eigenvalues but not eigenvectors – which we are after)
Slide 12-17Factor Pricing
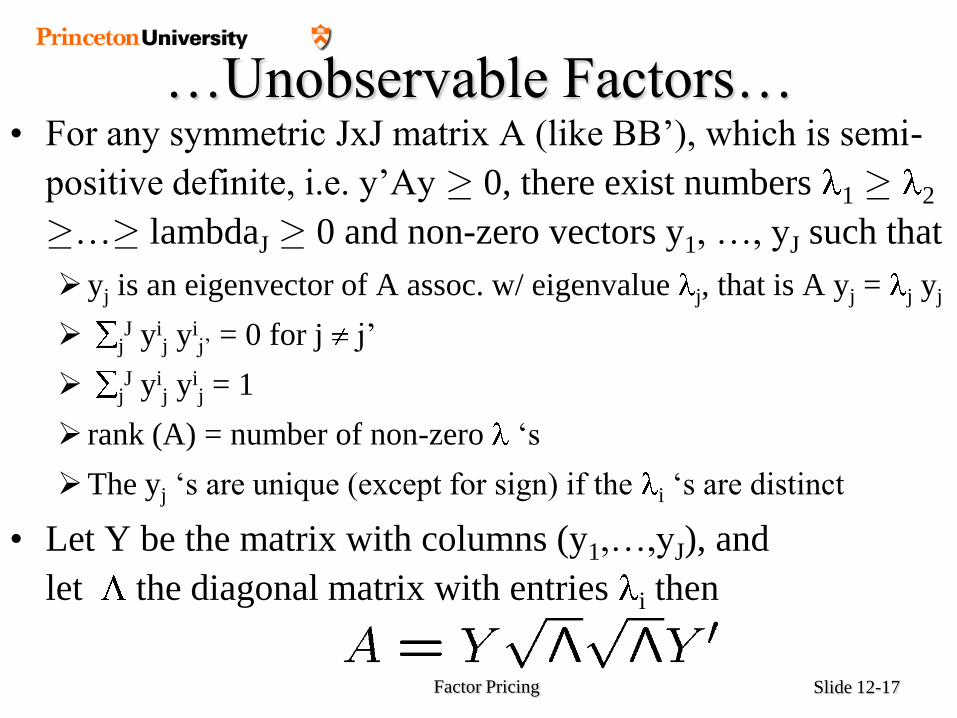
…Unobservable Factors…• For any symmetric JxJ matrix A (like BB‟), which is semi-
positive definite, i.e. y‟Ay ¸ 0, there exist numbers 1 ¸ 2
¸…¸ lambdaJ ¸ 0 and non-zero vectors y1, …, yJ such that
yj is an eigenvector of A assoc. w/ eigenvalue j, that is A yj = j yj
jJ yi
j yij‟ = 0 for j j‟
jJ yi
j yij = 1
rank (A) = number of non-zero „s
The yj „s are unique (except for sign) if the i „s are distinct
• Let Y be the matrix with columns (y1,…,yJ), and
let the diagonal matrix with entries i then

Slide 12-18Factor Pricing
…Unobservable Factors
• If K-factor model is true, BB' is a symmetric positive semi-definite matrix of rank $K.$
Exactly K non-zero eigenvalues 1,…, k and associated eigenvectors y1,…,yK
YK the matrix with columns given by y1,…,yK K the diagonal matrix with entries j, j=1,…, K.
BB'= K
Hence,
• Factors are not identified but sensitivities are (except for sign.)
• In practice choose K so that k is small for k>K.

Slide 12-19Factor Pricing
Why more than ONE mimicking
portfolio?
• Mimic (un)observable factors with portfolios [Projection of factor on asset span]
• Isn‟t a single portfolio which mimics pricing kernel
sufficient ) ONE factor
• So why multiple factors?
Not all assets are included (real estate, human capital …)
Other factors capture dynamic effects
[since e.g. conditional unconditional. CAPM]
(more later to this topic)

Slide 12-20Factor Pricing
Overview
1. ICAPM – multiperiod economic model
2. Asset Pricing Theory (APT) – statistical model
Merits of Factor Pricing
Exact Factor Pricing and Factor Pricing Errors
Factor Structure and Pricing Error Bounds
Single Factor and Beta Pricing (and CAPM)
(Factor) Mimicking Portfolios
Unobserved Factor Models
Multi-period outlook
3. Empirical Factor Pricing Models
Arbitrage Pricing Theory (APT) Factors
The Fama-French Factor Model + Momentum

Slide 12-21Factor Pricing
APT Factors of Chen, Roll and Ross (1986)
1. Industrial production (reflects changes in cash flow expectations)
2. Yield spread btw high risk and low risk corporate bonds (reflects changes in risk preferences)
3. Difference between short- and long-term interest rate (reflects shifts in time preferences)
4. Unanticipated inflation
5. Expected inflation (less important)
Note: The factors replicate market portfolio.

Slide 12-22Factor Pricing
Fama-MacBeth 2 Stage Method
• Stage 1: Use time series data to obtain estimates for
each individual stock‟s j
(e.g. use monthly data for last 5 years)
Note: is just an estimate [around true j ]
• Stage 2: Use cross sectional data and estimated js to
estimate SML
b=market risk premium

Slide 12-23Factor Pricing
CAPM esting Fama French (1992)
• Using newer data slope of SML b is not significant (adding size and B/M)
• Dealing with econometrics problem:
s are only noisy estimates, hence estimate of b is biased
Solution:
• Standard Answer: Find instrumental variable
• Answer in Finance: Derive estimates for portfolios
– Group stocks in 10 x 10 groupssorted to size and estimated j
– Conduct Stage 1 of Fama-MacBeth for portfolios
– Assign all stocks in same portfolio same
– Problem: Does not resolve insignificance
• CAPM predictions: b is significant, all other variables insignificant
• Regressions: size and B/M are significant, b becomes insignificant
Rejects CAPM
Portfolio

Slide 12-24Factor Pricing
Book to Market and Size

Slide 12-25Factor Pricing
Fama French Three Factor Model• Form 2x3 portfolios
Size factor (SMB)
• Return of small minus big
Book/Market factor (HML)
• Return of high minus low
• For … s are big and s do not vary much
• For … (for each portfolio p using time series data)
s are zero, coefficients significant, high R2.
book/market

Slide 12-26Factor Pricing
Fama French Three Factor Model• Form 2x3 portfolios
Size factor (SMB)
• Return of small minus big
Book/Market factor (HML)
• Return of high minus low
• For … s are big and s do not vary much
• For … (for each portfolio p using time series data)
ps are zero, coefficients significant, high R2.
book/market

Book to Market as a Predictor of Return
Value
0%
5%
10%
15%
20%
25%
Annu
aliz
ed R
ate
of
Retu
rn
10987654321
High Book/Market Low Book/Market

Book to Market Equity of Portfolios Ranked by Beta
0.6 0.8 1 1.2 1.4 1.6 1.8
Beta
0.5
0.6
0.7
0.8
0.9
1
Book to
M
ark
et
Equity

Slide 12-29Factor Pricing
Adding Momentum Factor
• 5x5x5 portfolios
• Jegadeesh & Titman 1993 JF rank stocks
according to performance to past 6 months
Momentum Factor
Top Winner minus Bottom Losers Portfolios

Monthly Difference Between Winner and
Loser Portfolios at Announcement Dates
1 3 5 7 9 11 13 15 17 19 21 23 25 27 29 31 33 35
Months Following 6 Month Performance Period
Month
ly D
iffe
rence
Betw
een W
inner
and
-1.5%
-1.0%
-0.5%
0.0%
0.5%
1.0%
Loser
Port
folio
s

-5%
-4%
-3%
-2%
-1%
0%
1%
2%
3%
4%
5%
Months Following 6 Month Performance Period
Cum
ula
tive D
iffe
rence B
etw
een
Win
ner
and L
oser
Port
folio
s
Cumulative Difference Between Winner and
Loser Portfolios at Announcement Dates
1 3 5 7 9 11 13 15 17 19 21 23 25 27 29 31 33 35

Slide 12-32Factor Pricing
Morgan Stanley‟s Macro Proxy Model
• Factors
GDP growth
Long-term interest rates
Foreign exchange (Yen, Euro, Pound basket)
Market Factor
Commodities or oil price index
• Factor-mimicking portfolios (“Macro Proxy”)
Stage 1: Regress individual stocks on macro factors
Stage 2: Create long-short portfolios of most and least sensitive stocks [5 quintiles]
• Macro Proxy return predicts macro factor

Slide 12-33Factor Pricing
1930’s 40’s 50’s 60’s 70’s 80’s 90’s beyond
The Old Finance
Modern Finance
Modern FinanceTheme: Valuation Based on Rational Economic Behavior Paradigms: Optimization Irrelevance CAPM EMH
(Markowitz) (Modigliani & Miller) (Sharpe, Lintner & Mossen) (Fama)
Foundation: Financial Economics
Haugen’s view: The Evolution of Academic Finance

Slide 12-34Factor Pricing
1930’s 40’s 50’s 60’s 70’s 80’s 90’s beyond
The Old Finance
Modern Finance
The New Finance
The New FinanceTheme: Inefficient Markets Paradigms: Inductive ad hoc Factor Models Behavioral Models
Expected Return Risk
Foundation: Statistics, Econometrics, and Psychology
Haugen’s view: The Evolution of Academic Finance