lecture 13: rue (radiation use efficiency) solar radiation 2. to explain and to quantify the...
TRANSCRIPT

5/16/2016
1
LECTURE 13:RUE (Radiation Use Efficiency)
Success is a lousy teacher. It seduces smart people intothinking they can't lose. Bill Gates
LECTURE OUTCOMESAfter the completion of this lecture and masteringthe lecture materials, students should be able1. to explain the growth rate of crops as a function of
intercepted solar radiation2. to explain and to quantify the quantity of
extraterresrial radiation that is the solar radiationincident on the outer surface of earth’s atmosphere.
3. to explain photosynthetically active radiation (PAR)used by plants to produce biomass
4. to quantify PAR interception and radiation useefficiency (RUE)

5/16/2016
2
LECTURE FLOW
1. INTRODUCTION1. Initial Development2. RUE Model
2. SOLAR RADIATION3. PAR INTERCEPTION
1. PAR2. Interception
4. RUE ESTIMATION1. Experimental Evidence2. Estimation Procedure
1. INTRODUCTION1. Crop Growth and Radiation
1. Monteith (1972, 1977) observed that net primaryproductivity (NPP) or crop growth rate is propor-tional to intercepted solar radiation, whichrepresents the ultimate limit to productivity.
where W/t is the rate of biomass production perunit time (day, week etc.) (g m-2 t-1; t, time), ε is thelight (radiation) use efficiency (g.MJ-1), and Q is thetotal intercepted radiation during the period underconsideration (MJ m-2 t-1).

5/16/2016
3
2. Yoshida (1983) used a different approach tocalculate CGR.
where = solar energy use efficiency (fraction or %), K= heat of biomass combustion (cal.g-1), and S = totalamount of incident solar energy during the time underconsideration
3. From trials at 8 experimental stations in JIBP(Japanese International Biological Program), thehighest recorded values ranged from 2.83% to3.32% with a mean of 3.00% (Kanda, 1975)Yoshida, S., 1983. Rice. In “Potential Productivity of Field Crops Under DifferentEnvironment. IRRI, Los Banos, Laguna, Philippines
4. Using the = 3.00% value and K = 3,750 cal.g-1,the maximum growth rate of plants in Malang, witha mean solar radiation of about 400 cal.cm-2
(400.104 cal.m-2), is
CGR = 32.0 g.m-2.day-1
2. RUE Definition1. Using the Monteith’s approach, biomass produc-
tion can be modelled as a linear function of inter-cepted photosynthetically active radiation (PAR).

5/16/2016
4
2. The slope of this relationship is the radiation useefficiency (RUE or ϵ), which is approximatelyconstant for forests and natural ecosystems, andparticularly for crops when growth is not limitedby environmental conditions.
3. Radiation-use efficiency (RUE), light useefficiency (LUE), is defined as the ratio of drymatter produced per unit of radiant energyused in its production.
4. Because efficiency should be dimensionless, theterm of “dry matter:radiation quotient” wassuggested (Russell et al. (1989), however, RUEis used widely and considered a useful tool forsimulating crop growth.
5. Linearity between biomass and accumulatedintercepted radiation has been demonstrated forseveral crops (e.g. beans, soybean, maize,lettuce) and for a few tree species (e.g., willow,mesquite and juniper).
6. Linder (1985) reported a mean RUE of 0.9 g (MJshortwave)−1 (approximately 1.8 g (MJ PAR)−1)for a set of evergreen canopies.
7. Values of RUE for tree species are generallysmaller than those for C3 herbaceous species(Kiniry et al. 1989), because of the high energycost of woody biomass and the respiration ofsupporting organs.

5/16/2016
5
8. RUE is influenced by plant development andmany environmental factors. For example, RUEincreases with increasing rate of leaf photosyn-thesis. RUE should decrease with increasing leafage, respiration, and with the higher energy costsof some plant constituents.
9. The environmental conditions that may decreasethe efficiency of metabolic and other processesdetermining RUE include water, nutrient shortageand adverse climatic conditions.
10. Using biomass to study RUE implies long‐termexperiments since, on a short time‐scale (e.g. 1 dor less), biomass increases are difficult tomeasure.
SOLAR RADIATION1. Crop yield is determined by biomass accumulation
and its partitioning into the economical plant organ(Van der Werf, 1996).
2. Crop biomass production as a function of solarradiation is determined by;(i) The quantity of the incoming photosynthetically
active radiation (PAR)(ii) The interception of PAR which is a function of leaf
area index (LAI) and canopy architecture, and(iii) The conversion of intercepted PAR into new
biomass, i.e. radiation use efficiency (RUE) which isa function of genetic and environmental factors.

5/16/2016
6
3. The quantity of the incoming photosyntheticallyactive radiation (PAR) incident on the top of cropcanopy is determined by many factors as shown bythe following equation.
WhereRa, extraterrestrial radiation [MJ m-2 day-1],S0, solar constant = 0.0820 MJ m-2 min-1, 1367 J.m-2.s-1
dr, inverse relative distance Earth-Sun,s, sunset hour angle [rad],, latitude [rad], solar declination [rad]
4. Solar constant (S0) is defined as the quantity ofsolar energy (W m-2) at normal incidence outsidethe atmosphere (extraterrestrial) at the mean sun-earth that can be calculated as follows.
where = 1 for the sun is emissivity or the ability of an object
to emit radiation compared to the black body (01)σ = 5.67⋅10-8 W.m-2.K4 is the Stefan-Boltzmann
constant.T = the temperature of photosphere (sun), 57850Krs= 696.106 m is the Sun radiusrD=150.109 m is the average distance between the Sun
and the earth

5/16/2016
7
5. The inverse relative distance Earth-Sun (dr) varieswith time and is calculated with the followingequation.
where J is the numberof the day in the yearbetween 1 (1 January)and 365 or 366 (31December).
6. The sunset hour angle (s) is calculated as follows.
7. The solar declination () is calculated with thefollowing equation.
Declination is the anglemade between the plane ofthe equator and the linejoining the two centers ofthe earth and the sun

5/16/2016
8
Distance of Earthfrom the sun, andsolar declinationthat vary with time
Determine the extraterrestrial radiation (Ra) for 3 September at20°S.
S0 S0 = T4((4rs2)/(4rD
2)) 0.0820 MJ m-2 min-1
Lati-tude
20°S or j = (p /180) (-20) = (the valueis negative (-) for the southernhemisphere)
-0.35 rad
Days The number of day in the year, J = 246 daysdr dr = 1 + 0.033 cos(2 246/365) = 0.985 rad = 0.409 sin(2246/365 - 1.39) = 0.120 rads s = arccos[-tan(-0.35)tan(0.120)] = 1.527 rad
sin()sin() = -0.041 -
cos()cos() = 0.933 -Ra Ra = 24(60)/ (0.0820)(0.985)[1.527(-
0.041) + 0.933 sin(1.527)] =32.2 MJ m-2 d-1
The extraterrestrial radiation is 32.2 MJ m-2 day-1.
0.0820 MJ m-2 min-1

5/16/2016
9
PAR INTERCEPTION1. PAR
1. The 400–700 nm waveband is usuallydesignated ‘photosynthetically active radiation’(PAR) (McCree, 1981).
2. The intercepted PAR was the main factordetermining crop growth. However, only c. 39%of extraterrestrial solar energy is in the 400–700nm waveband (Gueymard, 2004).
3. The fraction of PAR increases as solar radiationapproaches Earth’s surface because theatmosphere more strongly absorbs and reflectsradiation outside this waveband.

5/16/2016
10
4. Substantialamounts of infraredenergy (betweenabout 850 and 1300nm) are absorbedby CO2, ozone andespecially by watervapour, while ozoneis principallyresponsible for acut-off in ultravioletradiation belowabout 300 nm.
5. The fraction at Earth’s surface varies withlocation, season, solar elevation and skycondition.
6. Based on summer data in a comprehensivestudy at 36.6N latitude (Texas, USA), 48% istaken as a representative fraction of total solarenergy that is in the 400–700 nm waveband(Britton & Dodd, 1976).
7. On clear days, PAR represents about half (50%)of the total shortwave (solar) radiation or radiantenergy flux (expressed as J m–2 s–1) incident on acanopy, and is totally responsible forphotosynthesis.

5/16/2016
11
2. Interception1. The proportion of incident solar radiation that is
absorbed by a crop canopy is also a function ofthe spectral distribution of the irradiance.
2. Green leaves absorb most irradiance in the PARregion of the solar spectrum and reflect andtransmit most of the irradiance in the near IRregion.
3. Consequently, interception of solar irradiance bya crop canopy results in both quantitative andqualitative changes in the photon flux, which mayhave impact on intra and interspecificcompetition.
4. The arrangement and orientation of the leaveswithin the canopy influences the proportion ofPAR that is absorbed by the canopy and theamount of PAR per unit sunlit leaf area.
5. Monsi and Saeki (1953) developed a mathema-tical model of light attenuation within a cropcanopy based on Beer–Lambert Law. The rateof decrease in PAR or radiation (R) with anincrease in leaf area (L) within the canopy fromthe top to the bottom is dependent upon theincoming PAR as shown below.
where k is the extinction or foliarabsorption coefficient.

5/16/2016
12
6. The integration of above equation results in thefollowing equation.
Where R is PARincident at anylayer within thecanopy and at theground surfacebelow the canopy(RZ) and R0 isPAR at the top ofthe canopy.
Clovery sward –N and +N (Stern & Donald 1962)
7. Therefore, the quantity of PAR intercepted by thecanopy after a particular canopy layer is asfollows
8. When the reflection of PAR by leaves (canopy) istaken into account, then
9. The canopy reflection coefficient (C) is lowerthan the reflectance of individual leaves due tointerception of reflected flux by other leaves inthe canopy; C is about 5% for a maize canopywith a LAI 4.
Where C is thecanopy reflectioncoefficient
5/16/2016
13
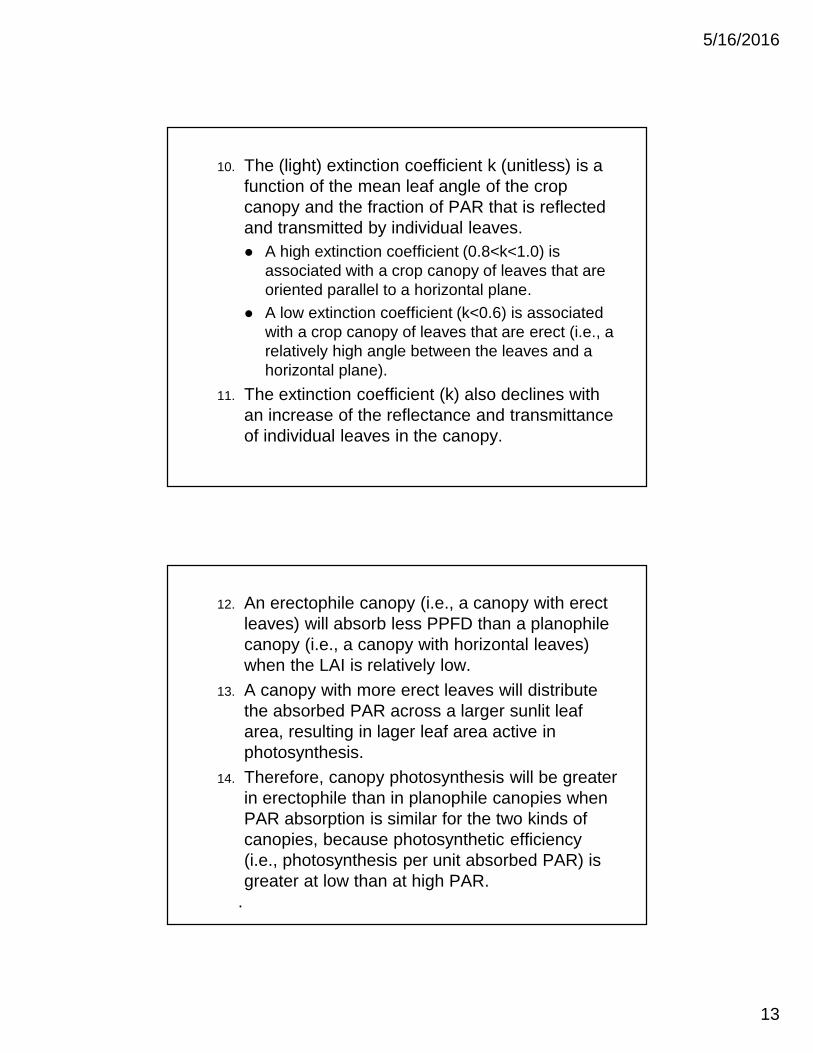
10. The (light) extinction coefficient k (unitless) is afunction of the mean leaf angle of the cropcanopy and the fraction of PAR that is reflectedand transmitted by individual leaves. A high extinction coefficient (0.8<k<1.0) is
associated with a crop canopy of leaves that areoriented parallel to a horizontal plane.
A low extinction coefficient (k<0.6) is associatedwith a crop canopy of leaves that are erect (i.e., arelatively high angle between the leaves and ahorizontal plane).
11. The extinction coefficient (k) also declines withan increase of the reflectance and transmittanceof individual leaves in the canopy.
12. An erectophile canopy (i.e., a canopy with erectleaves) will absorb less PPFD than a planophilecanopy (i.e., a canopy with horizontal leaves)when the LAI is relatively low.
13. A canopy with more erect leaves will distributethe absorbed PAR across a larger sunlit leafarea, resulting in lager leaf area active inphotosynthesis.
14. Therefore, canopy photosynthesis will be greaterin erectophile than in planophile canopies whenPAR absorption is similar for the two kinds ofcanopies, because photosynthetic efficiency(i.e., photosynthesis per unit absorbed PAR) isgreater at low than at high PAR.
.
5/16/2016
14
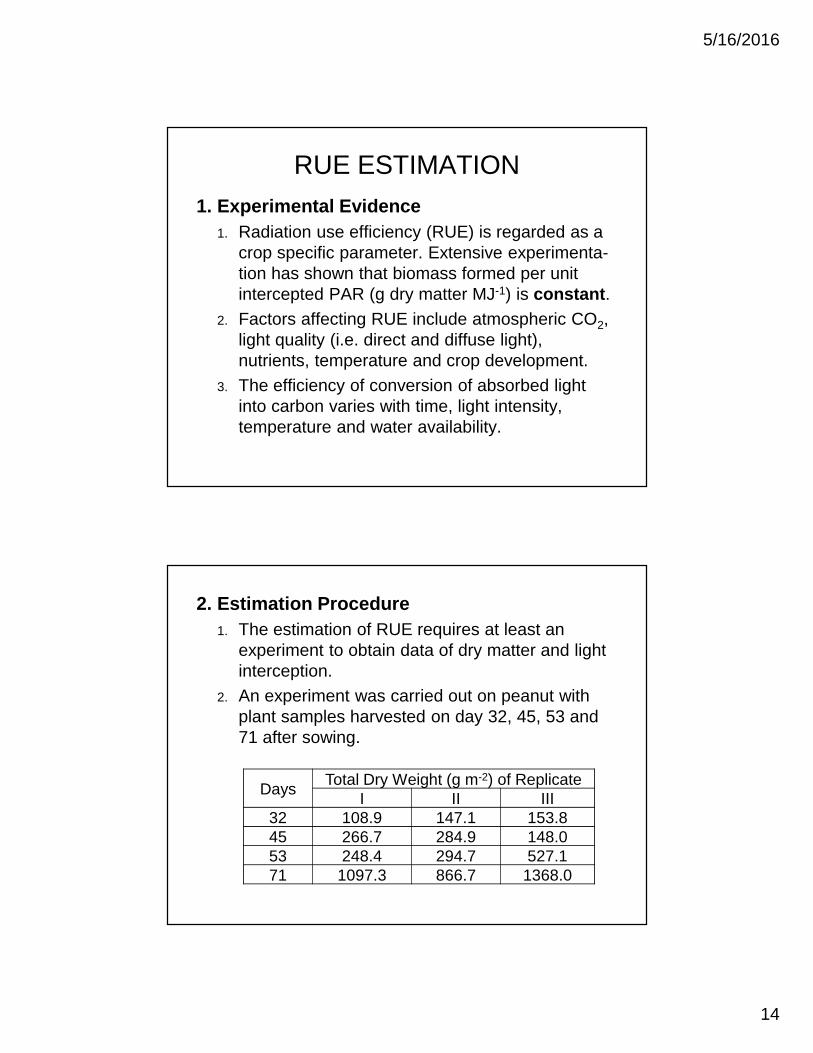
RUE ESTIMATION1. Experimental Evidence
1. Radiation use efficiency (RUE) is regarded as acrop specific parameter. Extensive experimenta-tion has shown that biomass formed per unitintercepted PAR (g dry matter MJ-1) is constant.
2. Factors affecting RUE include atmospheric CO2,light quality (i.e. direct and diffuse light),nutrients, temperature and crop development.
3. The efficiency of conversion of absorbed lightinto carbon varies with time, light intensity,temperature and water availability.
2. Estimation Procedure1. The estimation of RUE requires at least an
experiment to obtain data of dry matter and lightinterception.
2. An experiment was carried out on peanut withplant samples harvested on day 32, 45, 53 and71 after sowing.
Days Total Dry Weight (g m-2) of ReplicateI II III
32 108.9 147.1 153.845 266.7 284.9 148.053 248.4 294.7 527.171 1097.3 866.7 1368.0

5/16/2016
15
3. On day 27, 32, 45, 53, 71, and 83 after sowing,light at the top of the canopy and at the groundsurface below of the canopy for each replicatewere observed
DayLight (lux) of replicate
I II IIIR0 RZ R0 RZ R0 RZ
27 996 797 974 836 1040 76432 1022 764 1029 754 992 89245 899 143 918 191 946 30353 1054 35 1024 16 1033 5871 979 9 1055 20 1085 1283 1117 17 1254 19 1220 16
R0 and RZ is the light at the top of the canopy and at theground surface below the conopy
4. The fraction of light intercepted (FIR) is simplycalculated as FIR = (R0-RZ)/R0.
5. The relationship between FIR and time isanalyzed to obtain estimated FIR on daily basis.
6. The trend ofobserved FIR withtime follows apattern close to alogistic model. Theuse of the logisticmodel to analyzethe data results in

5/16/2016
16
7. Data of total solar radiation (R0) on daily basiswere obtained from a climate station close to thelocation of experiment, and PAR = 0.5*R0
PAR (MJ.m-2.d-1)Day PAR Day PAR Day PAR Day PAR Day PAR
1 7.895 21 7.255 41 8.962 61 9.303 81 10.2262 6.657 22 7.895 42 7.682 62 9.048 82 9.5293 9.004 23 8.706 43 8.236 63 8.109 83 8.4854 8.236 24 9.133 44 10.157 64 8.663 84 8.1815 8.450 25 8.877 45 8.749 65 7.255 85 8.7036 8.237 26 7.853 46 7.255 66 9.355 86 6.7887 6.999 27 9.218 47 7.682 67 7.745 87 9.1388 5.121 28 9.346 48 8.109 68 5.744 88 10.8359 6.103 29 9.176 49 8.150 69 8.268 89 9.268
10 8.663 30 9.090 50 7.427 70 9.312 90 9.57311 9.602 31 9.645 51 6.443 71 9.747 91 9.96512 8.535 32 8.535 52 8.322 72 8.920 92 6.52713 8.109 33 7.767 53 8.109 73 9.617 93 9.79114 8.578 34 9.602 54 7.468 74 6.440 94 7.04915 8.919 35 8.023 55 9.048 75 7.745 95 8.18116 7.767 36 6.485 56 9.004 76 8.050 96 7.65817 8.109 37 8.109 57 8.663 77 10.356 97 6.82818 8.919 38 9.644 58 8.280 78 9.704 98 7.12719 9.005 39 9.431 59 11.864 79 9.704 99 6.27320 8.194 40 9.090 60 11.437 80 9.355 100 5.932

5/16/2016
17
8. The quantity of PAR intercepted on daily basis isobtained from PAR*FIR. This is summed up forthe duration of growth under consideration.
9. Total dry weight (g m-2) is then divided by thetotal intercepted PAR (MJ m-2) to obtain RUE foreach stage of observation and replicate.
Days Total intercepted PAR (MJ m-2)I II III
32 12.5 12.7 10.845 70.9 71.6 65.653 132.0 133.4 126.371 284.7 287.6 280.2
6. The results of analysis shows RUE to vary withthe stage of growth and replicate. There is atendency of RUE high at the initial stage ofgrowth and declining with time.
7. Other approach often used is the data of total drymatter are plotted against the data of interceptedPAR.
Day RUE (g MJ-1)I II III
32 8.7 11.6 14.245 3.8 4.0 2.353 1.9 2.2 4.271 3.9 3.0 4.9
5/16/2016
18
MESSAGESYou have to1. learn (study) what you want to know2. understand what you have learnt (read the lecture notes and other sources, and
listen carefully to the explanation in the lectures)3. be able to explain what you have understood4. be able to apply what you have been able to
explain5. be able to make further development
(improvement) what you have been able toapply

5/16/2016
19
37
http://leavingbio.net/TheStructureandFunctionsofFlowers%5B1%5D.htm