lecture 16 technological change and economic growth · the key determinants of potential output c....
TRANSCRIPT

Economics 2 Professor Christina Romer Spring 2018 Professor David Romer
LECTURE 16 TECHNOLOGICAL CHANGE AND ECONOMIC GROWTH
March 13, 2018
I. OVERVIEW A. Two central topics of macroeconomics B. The key determinants of potential output C. The enormous variation in potential output per person across countries and
over time D. Discussion of the paper by William Nordhaus
II. AGGREGATE PRODUCTION FUNCTION A. Decomposition of Y*/POP into normal average labor productivity (Y*/N*) and
the normal employment-to-population ratio (N*/POP) B. N*/POP is largely determined by non-economic factors (such as demographics) C. Determinants of average labor productivity: capital per worker and technology
III. EXPLAINING THE VARIATION IN THE LEVEL OF Y*/POP ACROSS COUNTRIES A. Limited contribution of N*/POP B. Crucial role of normal capital per worker (K*/N*) C. Crucial role of technology—especially institutions
IV. DETERMINANTS OF ECONOMIC GROWTH A. Limited contribution of N*/POP B. Important, but limited contribution of K*/N* C. Crucial role of technological change
V. HISTORICAL EVIDENCE OF TECHNOLOGICAL CHANGE A. New production techniques B. New goods C. Better institutions
VI. SOURCES OF TECHNOLOGICAL PROGRESS A. Supply and demand diagram for invention B. Factors that could shift the supply and demand curves C. Does the market produce the efficient amount of invention?
D. Policies to encourage technological progress

LECTURE 16 Technological Change and Economic Growth
March 13, 2018
Economics 2 Christina Romer Spring 2018 David Romer

Announcement
• Problem Set 4 is being handed out. • It is due at the beginning of lecture next
Tuesday (March 20). • The ground rules are the same as on previous
problem sets. • Optional problem set work session:
Thursday, 4:00–6:00, in 648 Evans.

I. OVERVIEW

Real GDP in the United States, 1950–2017
Source: FRED (Federal Reserve Economic Data); data from Bureau of Economic Analysis.

Two Key Topics of Macroeconomics
• The long-run trend in output.
• Short-run fluctuations (booms and recessions).
• In the short run, the economy’s use of its available resources can be above or below normal; this is central to short-run fluctuations.
• In the long run, output is determined by the economy’s available resources
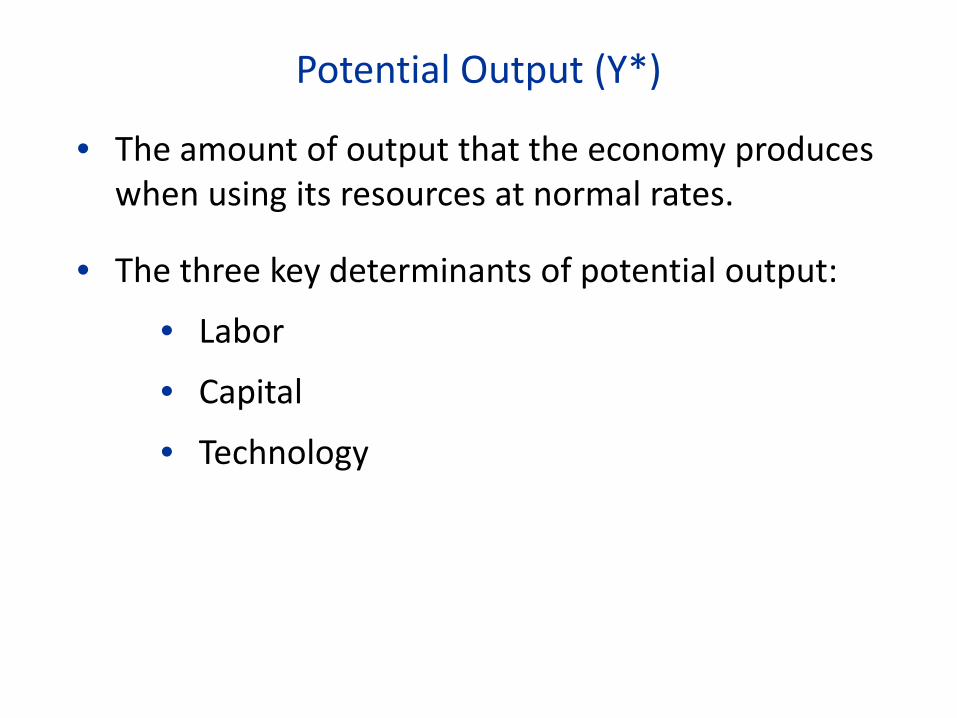
Potential Output (Y*)
• The amount of output that the economy produces when using its resources at normal rates.
• The three key determinants of potential output:
• Labor
• Capital
• Technology

Variation in Potential Output per Person
• Differs enormously across countries.
• In many (but not all) countries, it has grown enormously over time.

GDP per Capita in 8 Countries since 1870
Source: Frank, Bernanke, Antonovics, and Heffetz, Principles of Economics.

Paper by William Nordhaus

Consumer Price Index
• A measure of the overall or aggregate level of prices.
Price of market basket in year t CPIt = Price of market basket in base year

Paper by William Nordhaus
• What problems does Nordhaus see with typical price measures?
• What example does he use to illustrate the likely importance of these problems?

Source: Nordhaus, “Do Real-Output and Real-Wage Measures Capture Reality?”
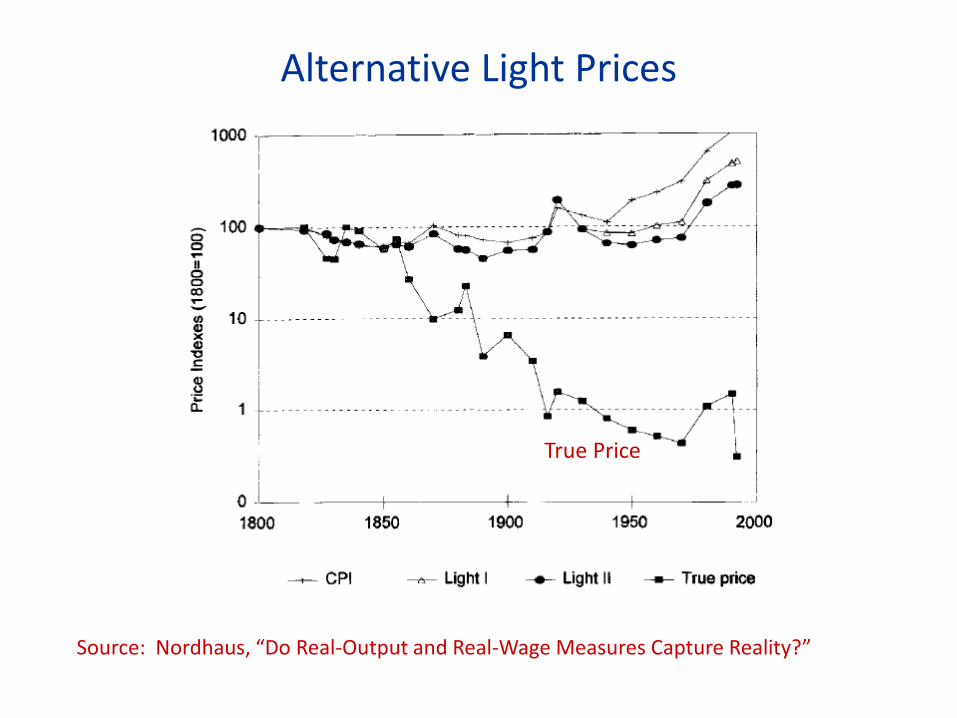
Alternative Light Prices
Source: Nordhaus, “Do Real-Output and Real-Wage Measures Capture Reality?”
True Price
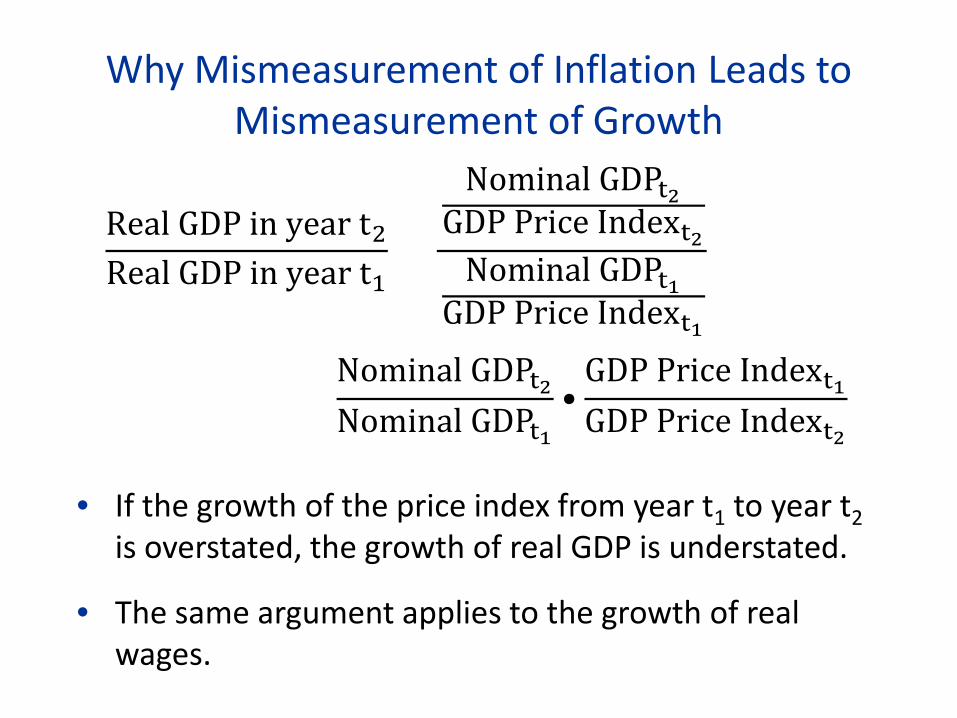
Why Mismeasurement of Inflation Leads to Mismeasurement of Growth
Real GDP in year t2Real GDP in year t1
=
Nominal GDPt2GDP Price Indext2
Nominal GDPt1GDP Price Indext1
=Nominal GDPt2Nominal GDPt1
•GDP Price Indext1GDP Price Indext2
• If the growth of the price index from year t1 to year t2 is overstated, the growth of real GDP is understated.
• The same argument applies to the growth of real wages.

Were You Persuaded by Nordhaus?

II. THE AGGREGATE PRODUCTION FUNCTION

Decomposition of Potential Output per Person
where:
• Y* is potential output;
• POP is population;
• N* is normal employment.
• is the normal employment-to-population ratio.
• is normal average labor productivity.

Many of the Most Important Determinants of the Normal Employment-to-Population Ratio
Are Not Economic
• It depends on things like the age composition of the population, tastes, etc.
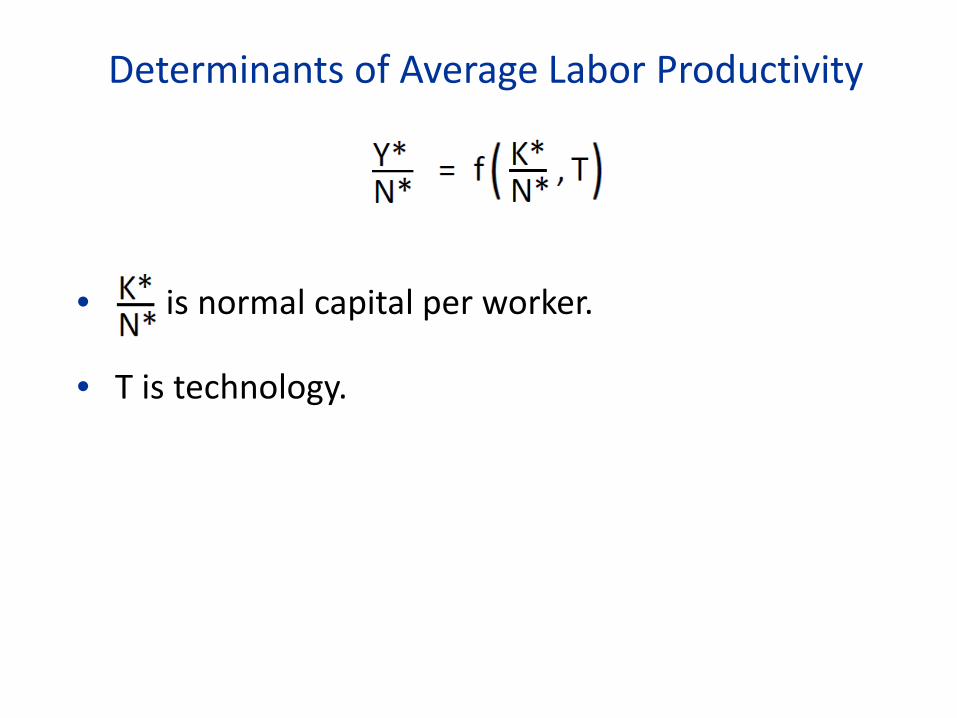
Determinants of Average Labor Productivity
• is normal capital per worker.
• T is technology.

Capital
• Aids to the production process that were created in the past.
• Components of Capital:
• Physical capital (machines, buildings, computers).
• Infrastructure (roads, telecommunications systems, dams).
• Human capital (education, job training).

Technology
• The methods for producing things.
• Components of Technology:
• Production techniques
• Management techniques
• Economic institutions
• Local culture
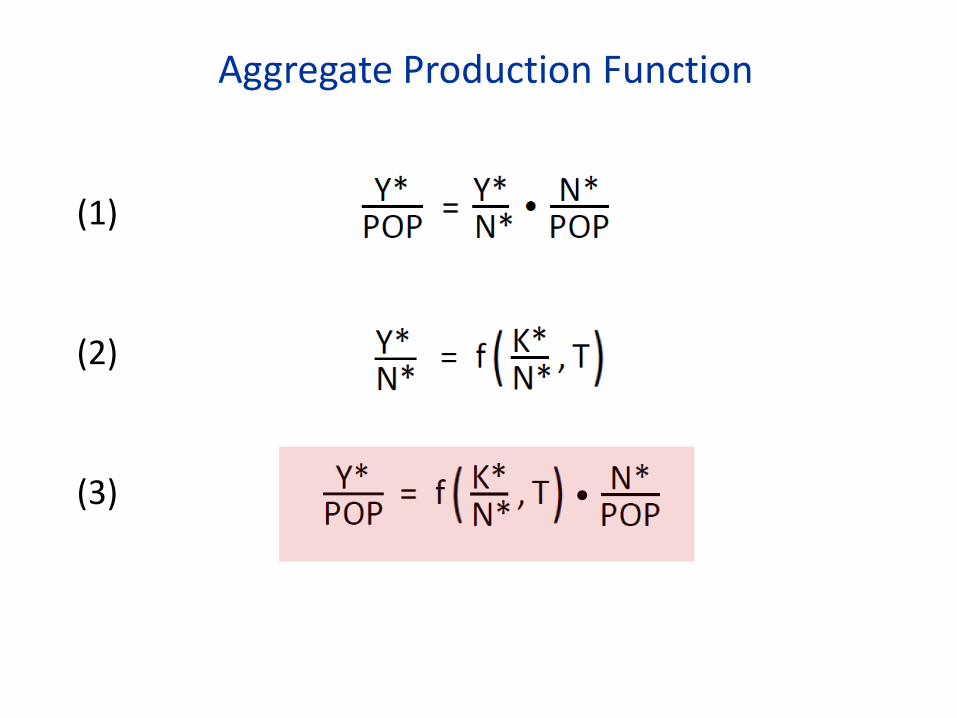
Aggregate Production Function
(1)
(2)
(3) •
III. EXPLAINING THE VARIATION IN THE LEVEL OF
POTENTIAL OUTPUT PER PERSON ACROSS COUNTRIES

Contribution of the Employment-to-Population Ratio
• It can certainly matter, but its effects are limited.
• It doesn’t vary that much across countries.
•

Source: Charles Jones and Dietrich Vollrath, Economic Growth.
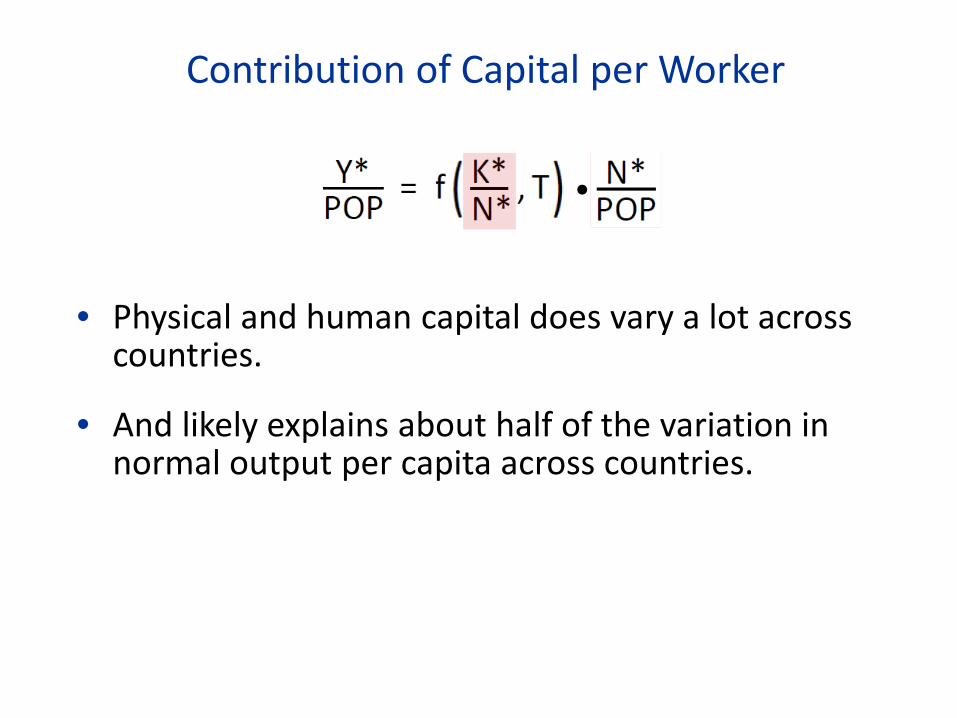
Contribution of Capital per Worker
• Physical and human capital does vary a lot across countries.
• And likely explains about half of the variation in normal output per capita across countries.
•
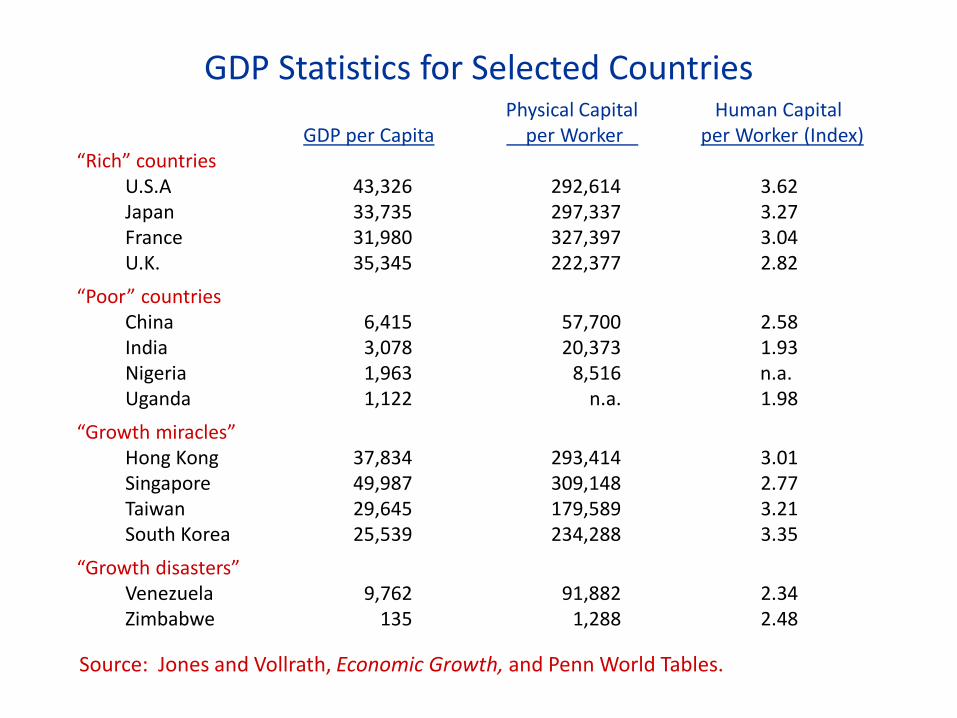
GDP Statistics for Selected Countries
Source: Jones and Vollrath, Economic Growth, and Penn World Tables.
Physical Capital Human Capital GDP per Capita per Worker per Worker (Index) “Rich” countries U.S.A 43,326 292,614 3.62 Japan 33,735 297,337 3.27 France 31,980 327,397 3.04 U.K. 35,345 222,377 2.82 “Poor” countries China 6,415 57,700 2.58 India 3,078 20,373 1.93 Nigeria 1,963 8,516 n.a. Uganda 1,122 n.a. 1.98 “Growth miracles” Hong Kong 37,834 293,414 3.01 Singapore 49,987 309,148 2.77 Taiwan 29,645 179,589 3.21 South Korea 25,539 234,288 3.35 “Growth disasters” Venezuela 9,762 91,882 2.34 Zimbabwe 135 1,288 2.48

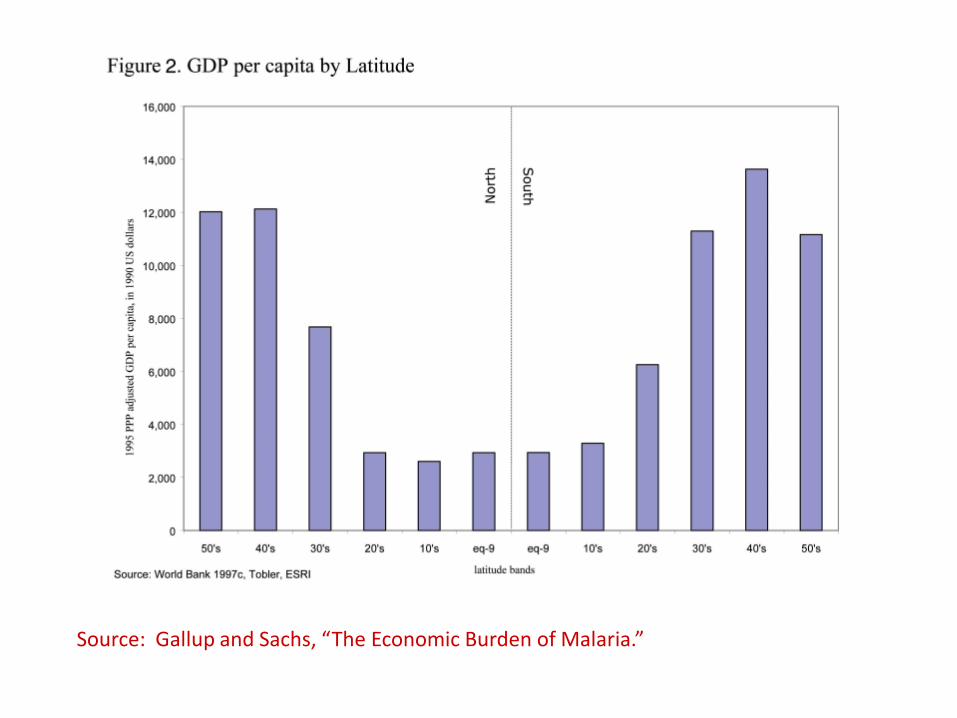
Contribution of Technology
• The types of technology that vary across countries are probably not knowledge, but institutions and culture
• And this variation is an important source of the variation in normal output per capita.
•
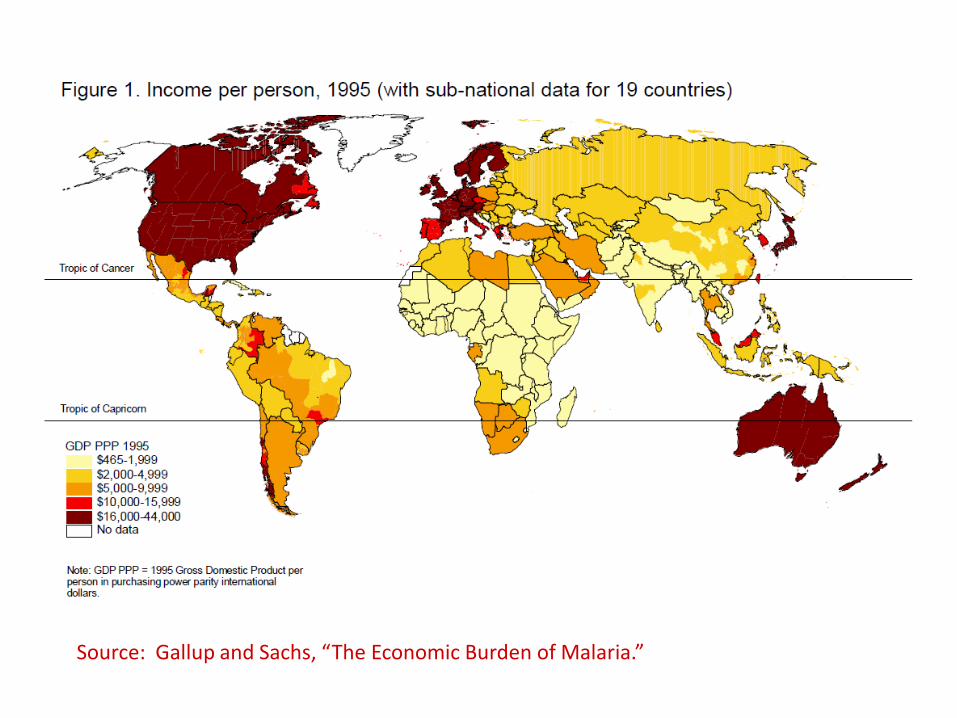
Source: Gallup and Sachs, “The Economic Burden of Malaria.”
Source: Gallup and Sachs, “The Economic Burden of Malaria.”
Three Key Features of Institutions that Contribute to High Normal Output per Person

Average Labor Productivity and Social Infrastructure
Source: Hall and Jones, “Why Do Some Countries Produce So Much More Output per Worker than Others?”
IV. DETERMINANTS OF ECONOMIC GROWTH

Aggregate Production Function
(1)
(2)
(3) •
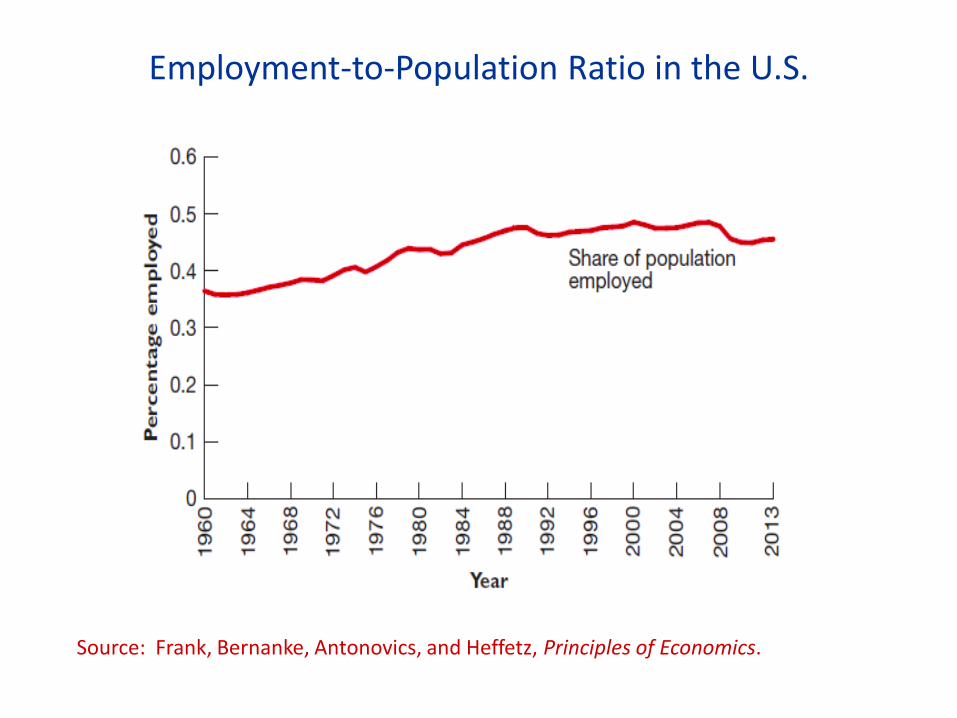
Employment-to-Population Ratio in the U.S.
Source: Frank, Bernanke, Antonovics, and Heffetz, Principles of Economics.

Labor Force Participation Rate for Women in the U.S.
Source: Bureau of Labor Statistics
50
55
60
65
70
75
1971
1975
1979
1983
1987
1991
1995
1999
2003
2007
2011
Per
cent

Can Increases in N*/POP Explain Growth?

Aggregate Production Function
(1)
(2)
(3) •

Can Increases in K*/N* Explain Growth? The Case of Physical Capital
Can Increases in K*/N* Explain Growth? The Case of Human Capital
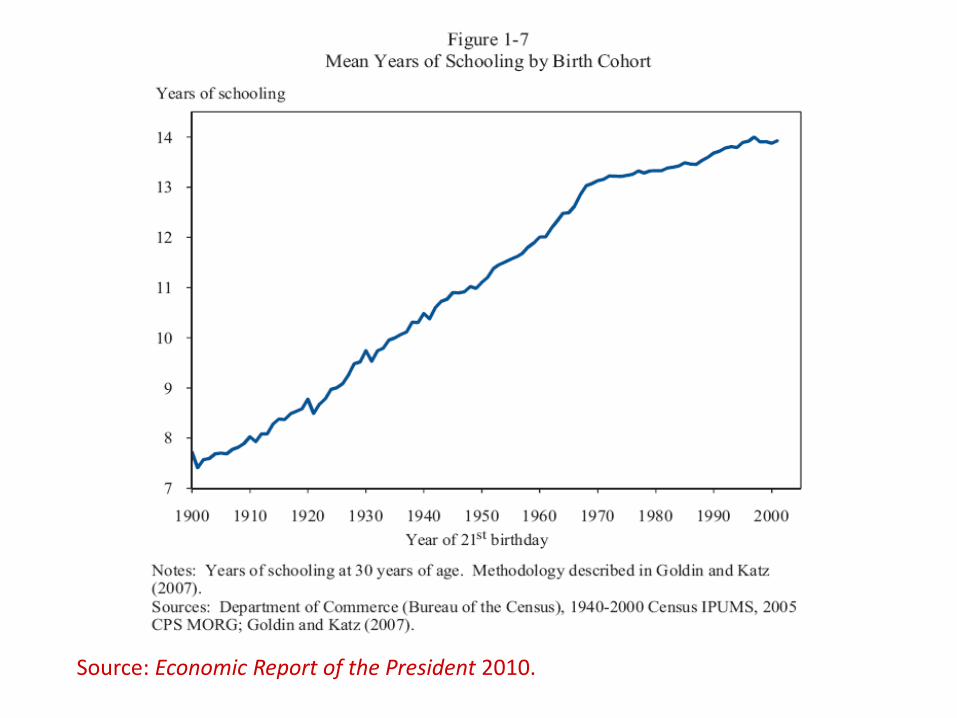
Source: Economic Report of the President 2010.

Technological change is a key determinant of economic growth
• Argument by elimination: If it is not N*/POP or K*/N*, it must be T.
•

V. HISTORICAL EVIDENCE OF TECHNOLOGICAL CHANGE

New Production Techniques
• New machines (electric motor, tractor).
• New methods of organization and management (assembly line, accounting).

Early Textile Mill
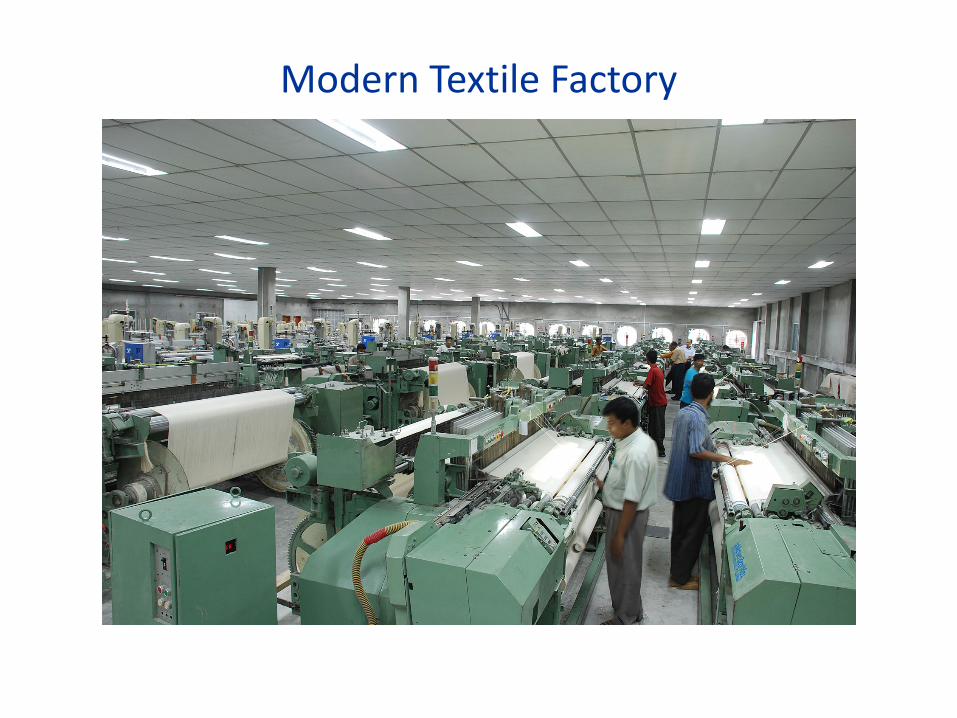
Modern Textile Factory
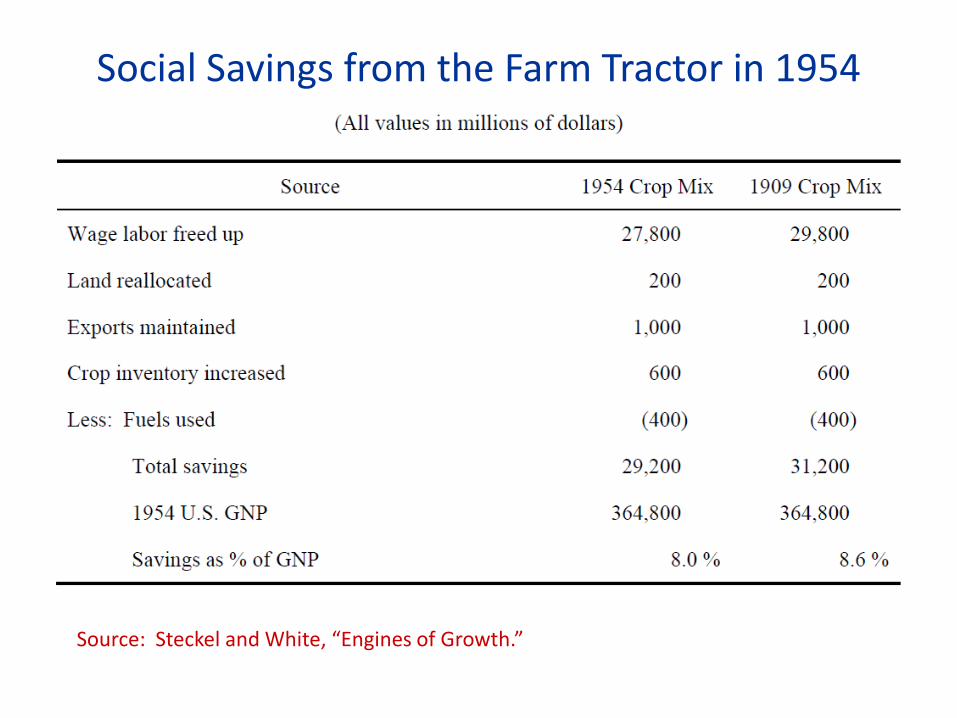
Social Savings from the Farm Tractor in 1954
Source: Steckel and White, “Engines of Growth.”

New Products
• Another way to create improvements in the standard of living.

Better Institutions
• Example: Opening up to trade.
• Example: More reliance on market forces.

VI. SOURCES OF TECHNOLOGICAL PROGRESS

Q
P
Market for Inventions
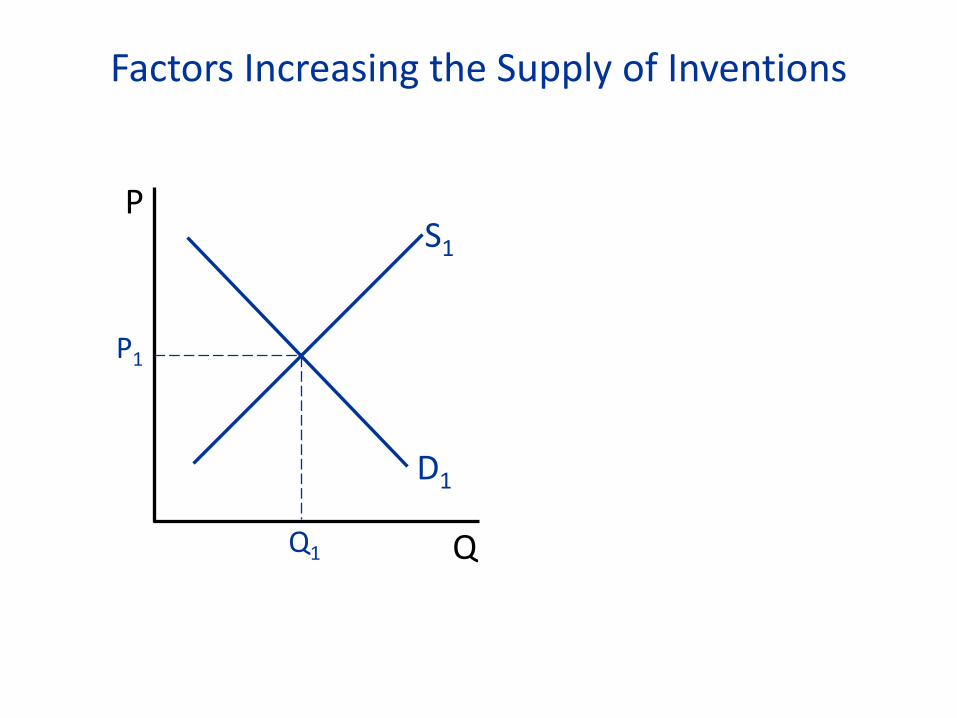
Factors Increasing the Supply of Inventions
Q
P
D1
P1
Q1
S1

Factors Increasing the Demand for Inventions
Q
P
D1
P1
Q1
S1

Does the Free Market Produce the Efficient Amount of Inventive Activity?

Q
P
Market for Inventions

Policies to Encourage Technological Progress