lecture 3: visualization design - cs.ubc.catmm/courses/533-11/slides/chap1.pdf · lecture 3:...
TRANSCRIPT

Lecture 3: Visualization DesignInformation VisualizationCPSC 533C, Fall 2011
Tamara Munzner
UBC Computer Science
Wed, 14 September 2011
1 / 49
Material Covered
Chapter 1: Visualization Design
LiveRAC - Interactive Visual Exploration of System ManagementTime-Series Data. Peter McLachlan, Tamara Munzner, EleftheriosKoutsofios, and Stephen North. Proc CHI 2008, pp 1483-1492.
Sizing the Horizon: The Effects of Chart Size and Layering on theGraphical Perception of Time Series Visualizations. Jeffrey Heer, NicholasKong, and Maneesh Agrawala. ACM CHI 2009, pages 1303 - 1312.
2 / 49

Nested Model
separating design into four levels
validate against the right threat based on level
problem: you misunderstood their needs
abstraction: you’re showing them the wrong thing
encoding: the way you show it doesn’t work
algorithm: your code is too slow
you = visualization designer
they = target user
3 / 49

Characterizing Domain Problem
problem
data/op abstraction
encoding/interaction
algorithm
identify a problem amenable to vis
provide novel capabilitiesspeed up existing workflow
validation
immediate: interview and observe target usersdownstream: notice adoption rates
4 / 49

Abstracting Data/Tasks
problem
data/op abstraction
encoding/interaction
algorithm
abstract from domain-specific to genericoperations/tasks
sorting, filtering, browsing, comparing, findingtrend/outlier, characterizing distributions, findingcorrelation
data typestables of numbers, relational networks, spatial datatransform into useful configuration: derived datanmore next time
validationdeploy in the field and observe usage
5 / 49

Designing Encoding and Interaction
problem
data/op abstraction
encoding/interaction
algorithm
visual encoding: drawings they are shown
interaction: how they manipulate drawings
validation
immediate: careful justification wrt known principlesdownstream: qualitative or quantitative analysis ofresultsdownstream: lab study measuring time/error on giventask
6 / 49

Creating Algorithms
problem
data/op abstraction
encoding/interaction
algorithm
carry out specification efficiently
validation
immediate: complexity analysisdownstream: benchmarks for system time, memory
7 / 49

Upstream and Downstream Validation
humans in the loop for outer three levels
threat: wrong problem
validate: observe and interview target users
threat: bad data/operation abstraction
threat: ineffective encoding/interaction technique
validate: justify encoding/interaction design
threat: slow algorithm
validate: analyze computational complexity
implement system
validate: measure system time/memory
validate: qualitative/quantitative result image analysis
[informal usability study]
validate: lab study, measure human time/errors for operation
validate: field study, document human usage of deployed system
validate: collect anecdotes about tool utility from target users
validate: observe adoption rates
8 / 49

Validation Mismatch Danger
cannot show encoding good with system timings
cannot show abstraction good with lab study
problem validate: observe target users
encoding validate: justify design wrt alternatives
algorithm validate: measure system time
encoding validate: lab study, qualitative analysis
abstraction validate: observe real usage in field
9 / 49

Genealogical Graphs
[Fig 13. McGuffin and Balakrishnan. Interactive Visualization of Genealogical Graphs.Proc. InfoVis 2005, p. 17-24.] 10 / 49

Genealogical Graphs: Validation
justify encoding/interaction design
qualitative result image analysis
test on target users, collect anecdotal evidence of utility
mcguffin
11 / 49

MatrixExplorer
domain: social network analysis
early: participatory design to generate requirementslater: qualitative observations of tool use by target users
techniquesinteractively map attributes to visual variables
user can change visual encoding on the fly (like Polaris)
filteringselectionsorting by attribute
[MatrixExplorer: a Dual-Representation System to Explore Social Networks. Henryand Fekete. IEEE TVCG 12(5):677-684 (Proc InfoVis 2006)]
12 / 49

Requirements
use multiple representations
handle multiple connected components
provide overviews
display general dataset info
use attributes to create multiple views
display basic and derived attributes
minimize parameter tuning
allow manual finetuning of automatic layout
provide visible reminders of filtered-out data
support multiple clusterings, including manual
support outlier discovery
find where consensus between different clusterings
aggregate, but provide full detail on demand13 / 49

Techniques: Dual Views
show both matrix and node-link representations
[Fig 3. Henry and Fekete. MatrixExplorer: a Dual-Representation System to ExploreSocial Networks. IEEE TVCG 12(5):677-684 (Proc InfoVis 2006)www.aviz.fr/ nhenry/docs/Henry-InfoVis2006.pdf]
14 / 49

MatrixExplorer Views
overviews: matrix, node-link, connected components
details: matrix, node-link
controls
[Fig 1. Henry and Fekete. MatrixExplorer: a Dual-Representation System to ExploreSocial Networks. IEEE TVCG 12(5):677-684 (Proc InfoVis 2006)www.aviz.fr/ nhenry/docs/Henry-InfoVis2006.pdf]
15 / 49

Automatic Clustering/Reordering
automatic clustering as good starting point
then manually refine
[Fig 6. Henry and Fekete. MatrixExplorer: a Dual-Representation System to ExploreSocial Networks. IEEE TVCG 12(5):677-684 (Proc InfoVis 2006)]
16 / 49
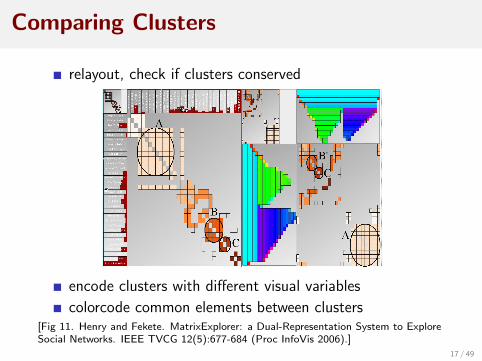
Comparing Clusters
relayout, check if clusters conserved
encode clusters with different visual variables
colorcode common elements between clusters[Fig 11. Henry and Fekete. MatrixExplorer: a Dual-Representation System to ExploreSocial Networks. IEEE TVCG 12(5):677-684 (Proc InfoVis 2006).]
17 / 49

MatrixExplorer: Validation
justify encoding/interaction design
measure system time/memory
qualitative result image analysis
observe and interview target users
matrixexplorer
18 / 49

Flow Maps
algorithm goals
move nodes to make room, but maintain relativepositionsminimize edge crossings
[Fig 1c, 10. Phan, Yeh, Hanrahan, Winograd. Flow Map Layout. Proc InfoVis 2005, p219-224.]
19 / 49

Flow Maps: Validation
justify encoding/interaction design
measure system time/memory
qualitative result image analysis
computational complexity analysis
flow maps
20 / 49

LiveRAC
domain: large-scale sysadmin
data: time series of system status from devices( 10 Aug 2007 9:52:47, CPU, 95% )
tasks
interpret network environment statuscapacity planningevent investigation (forensics)coordinate: customers, engineering, operations
[ McLachlan et al. LiveRAC - Interactive Visual Exploration of System ManagementTime-Series Data. Proc CHI 2008, pp 1483-1492. ]
21 / 49

LiveRAC
techniques
semantic zoomingstretch and squish navigation
22 / 49

Time-Series Challenges
23 / 49

Time-Series Challenges
24 / 49

Time-Series Challenges
25 / 49
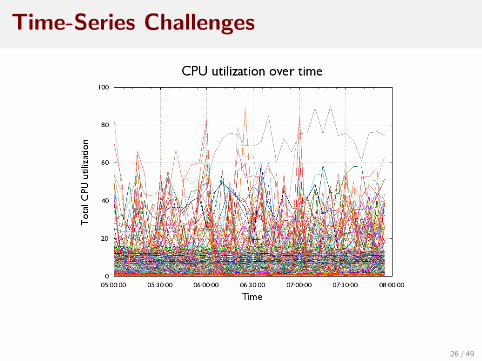
Time-Series Challenges
26 / 49

Time-Series Challenges
27 / 49
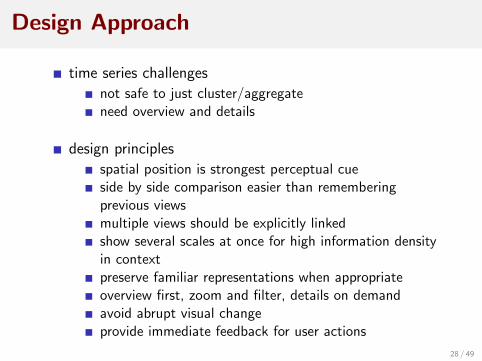
Design Approach
time series challengesnot safe to just cluster/aggregateneed overview and details
design principlesspatial position is strongest perceptual cueside by side comparison easier than rememberingprevious viewsmultiple views should be explicitly linkedshow several scales at once for high information densityin contextpreserve familiar representations when appropriateoverview first, zoom and filter, details on demandavoid abrupt visual changeprovide immediate feedback for user actions
28 / 49

Phased Design
target users hard to access: high-level corporate approvalphase 1
external expertssimulated dataresult: visenc/interaction proof of concept
phase 2internal engineers, managersreal dataresult: hi-fi prototype
phase 34 internal technical directorsresult: deployment-ready robust prototype
phase 4field test: 4 directors, 7 network engineersprototype deployed for 4 months
29 / 49

LiveRAC: Validation
justify encoding/interaction design
field study, document usage of deployed system
qualitative result image analysis
observe and interview target users
liverac
30 / 49

LinLog
energy model to show cluster structurereject metric of uniform edge lengthrefine: two sets for length, within vs between clusters
validation: proofs of optimalitylevel is visual encoding not algorithm
energy model vs. algorithm using model forforce-directed placement
[Fig 1. Noack. An Energy Model for Visual Graph Clustering. Proc. Graph Drawing
2003, Springer LNCS 2912, 2004, p 425-436.] 31 / 49

LinLog: Validation
qualitative/quantitative result image analysis
linlog
32 / 49

Sizing the Horizon
high data density displays
horizon charts, offset graphs
[Fig 2. Heer, Kong, and Agrawala. Sizing the Horizon: The Effects of Chart Size andLayering on the Graphical Perception of Time Series Visualizations. CHI 2009, p1303-1312.]
33 / 49

Experiment 1
how many bands? mirrored or offset?
design: within-subjects
2 chart types: mirrored, offset3 band counts: 2, 3, 416 trials per condition96 trials per subject
results
surprise: offset no better than mirroredmore bands is harder (time, errors)
stick with just 2 bands
34 / 49

Experiment 2
mirror/layer vs line charts? effect of size?
design: within-subjects
3 charts: line charts, mirror no banding, mirror 2 bands4 sizes10 trials per condition120 trials per subject
[Fig 7. Heer, Kong, and Agrawala. Sizing the Horizon: The Effects of Chart Size andLayering on the Graphical Perception of Time Series Visualizations. CHI 2009, p1303-1312.]
35 / 49

Results
found crossover point where 2-band better: 24 pixels
virtual resolution: unmirrored unlayered heightline: 1x, 1band: 2x, 2band: 4x
guidelines
mirroring is safelayering (position) better than color alone24 pixels good for line charts, 1band mirrors12 or 16 pixels good for 2band
36 / 49

Sizing the Horizon: Characterization
lab study, measure human time/errors for operation
user studies
37 / 49

Key Ideas
characterize methods using lab studies
more useful than A/B system comparison lab studiesfinding thresholdsuncovering hidden variables
controlled experiments
experimental design and statistical power
38 / 49

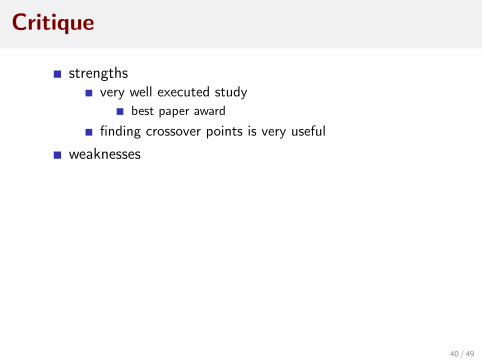
Critique
strengthsvery well executed study
best paper award
finding crossover points is very useful
weaknesses
39 / 49
Critique
strengthsvery well executed study
best paper award
finding crossover points is very useful
weaknesses
40 / 49

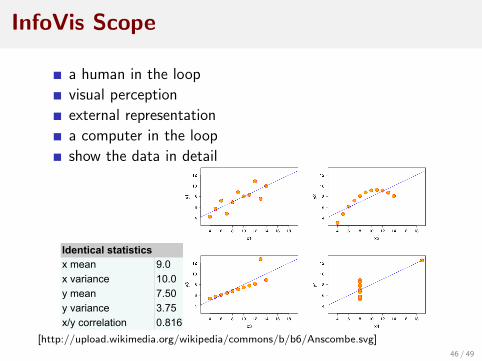
InfoVis Scope
a human in the loop
visual perception
external representation
a computer in the loop
show the data in detail
Identical statisticsIdentical statistics
x mean 9.0
x variance 10.0
y mean 7.50
y variance 3.75
x/y correlation 0.816
[http://upload.wikimedia.org/wikipedia/commons/b/b6/Anscombe.svg]
41 / 49

InfoVis Scope
a human in the loop
visual perception
external representation
a computer in the loop
show the data in detail
Identical statisticsIdentical statistics
x mean 9.0
x variance 10.0
y mean 7.50
y variance 3.75
x/y correlation 0.816
[http://upload.wikimedia.org/wikipedia/commons/b/b6/Anscombe.svg]
42 / 49

InfoVis Scope
a human in the loop
visual perception
external representation
a computer in the loop
show the data in detail
Identical statisticsIdentical statistics
x mean 9.0
x variance 10.0
y mean 7.50
y variance 3.75
x/y correlation 0.816
[http://upload.wikimedia.org/wikipedia/commons/b/b6/Anscombe.svg]
43 / 49

InfoVis Scope
a human in the loop
visual perception
external representation
a computer in the loop
show the data in detail
Identical statisticsIdentical statistics
x mean 9.0
x variance 10.0
y mean 7.50
y variance 3.75
x/y correlation 0.816
[http://upload.wikimedia.org/wikipedia/commons/b/b6/Anscombe.svg]
44 / 49

InfoVis Scope
a human in the loop
visual perception
external representation
a computer in the loop
show the data in detail
Identical statisticsIdentical statistics
x mean 9.0
x variance 10.0
y mean 7.50
y variance 3.75
x/y correlation 0.816
[http://upload.wikimedia.org/wikipedia/commons/b/b6/Anscombe.svg]
45 / 49
InfoVis Scope
a human in the loop
visual perception
external representation
a computer in the loop
show the data in detail
Identical statisticsIdentical statistics
x mean 9.0
x variance 10.0
y mean 7.50
y variance 3.75
x/y correlation 0.816
[http://upload.wikimedia.org/wikipedia/commons/b/b6/Anscombe.svg]
46 / 49
InfoVis Scope
a human in the loop
visual perception
external representation
a computer in the loop
show the data in detail
driving task
the meaning of better
47 / 49

InfoVis Scope
a human in the loop
visual perception
external representation
a computer in the loop
show the data in detail
driving task
the meaning of better
48 / 49

Resource Limitations
computational capacity
CPU timecomputer memory: size, cache hierarchy
human capacity
human memory: working, longterm recallhuman attention: search, vigilance
display capacityinformation density
information encoded / total space usedshow lots: minimize navigation/explorationshow less: minimize visual clutter
49 / 49