lecture 32: protein (part-i) - nptelnptel.ac.in/courses/122103039/pdf/mod5.pdf · lecture 32:...
TRANSCRIPT

NPTEL – Basic Courses – Basic Biology
Joint initiative of IITs and IISc – Funded by MHRD Page 1 of 44
Lecture 32: Protein (Part-I)
Introduction: Proteins perform multiple functions in a cell and they are the factors to
control several events.They are the building blocks and work as enzyme to participate in
metabolic reactions of the organism.
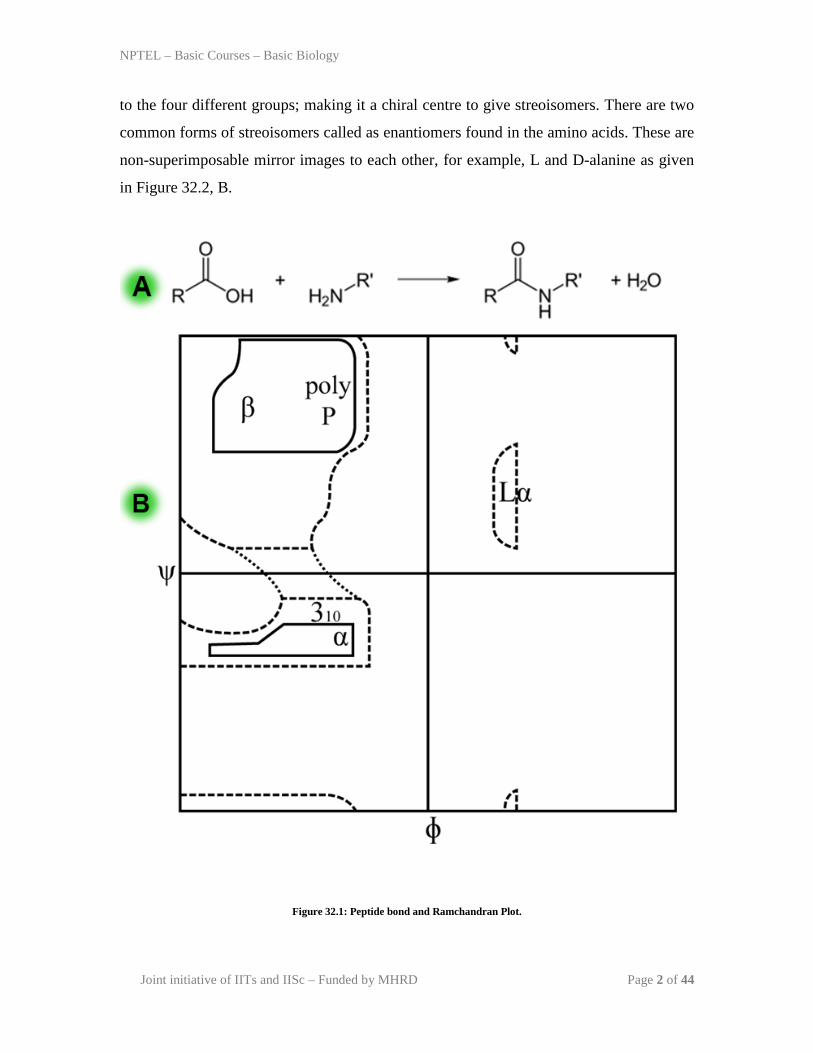
Peptide Bonds: Proteins are polymers of amino acids, joined by the covalent bonds,
known as pepide bond. A peptide bond is formed between carboxyl group of first and
amino group of second amino acid with release of water (Figure 32.1, A,B). it is a
dehydration synthesis or condensation reaction. The peptide bond has partial double bond
character due to resonance and C-N bond is not free to rotate. But the bond between N-
Cα and C-Cα can be able to rotate through dihedral angles designated by φ (phi) and ψ
(psi). These angles can be able to rotate from -180 to +180 with few restriction. The
Indian scientist G.N. ranchandran has determined the possible φ (phi) and ψ (psi) for a
particular amino acid by synthesizing tripeptide with the amino of interest in the the
middle. Based on these calculations, he has constructed Ramchandran plot to define the
region of allowed rotation for amino acids present in a protein structure and proposed to
use this to validate the 3-D structure of a protein model (Figure 32.1, C).
Amino Acids: As discussed earlier, proteins are madeup of amino acids joined by
peptide bonds. Each protein can be broken into the constituents amino acids by a variety
of methods to study the free amino acids. Twenty different amino acids are found in
protein. The first amino acid discovered was asparagines in 1806. The name of amino
acids were trivial or classical or in few cases derived from the food source from which
they were isolated first. For examples; Asparagine was isolated from asparagus,
glutamate from wheat gluten, tyrosine from cheese (greek tyros, cheese) and glycine has
derived its name due to sweet taste (greek Glycos; sweet).
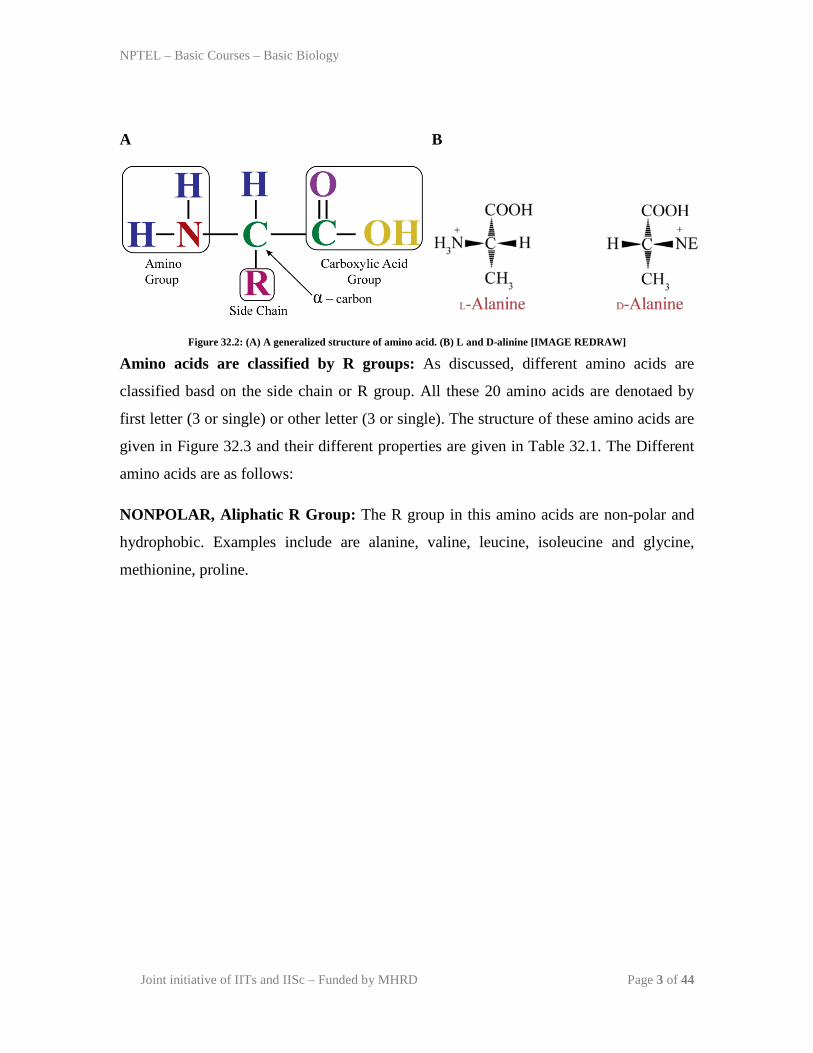
Amino acids share common structure: All 20 amino acids are α-amino acids with a
common structure. Each amino acid has a carboxyl group and amine group attached to
the primary carbon (the α-carbon). They differ from each other in terms of side chain or
R group (Figure 32.2, A). The side chain varies in structure, chemical nature and that has
influence on the over all property of amino acid. Except Glycine, each carbon is attached
NPTEL – Basic Courses – Basic Biology
Joint initiative of IITs and IISc – Funded by MHRD Page 2 of 44
to the four different groups; making it a chiral centre to give streoisomers. There are two
common forms of streoisomers called as enantiomers found in the amino acids. These are
non-superimposable mirror images to each other, for example, L and D-alanine as given
in Figure 32.2, B.
Figure 32.1: Peptide bond and Ramchandran Plot.
NPTEL – Basic Courses – Basic Biology
Joint initiative of IITs and IISc – Funded by MHRD Page 3 of 44
A
B
Figure 32.2: (A) A generalized structure of amino acid. (B) L and D-alinine [IMAGE REDRAW]
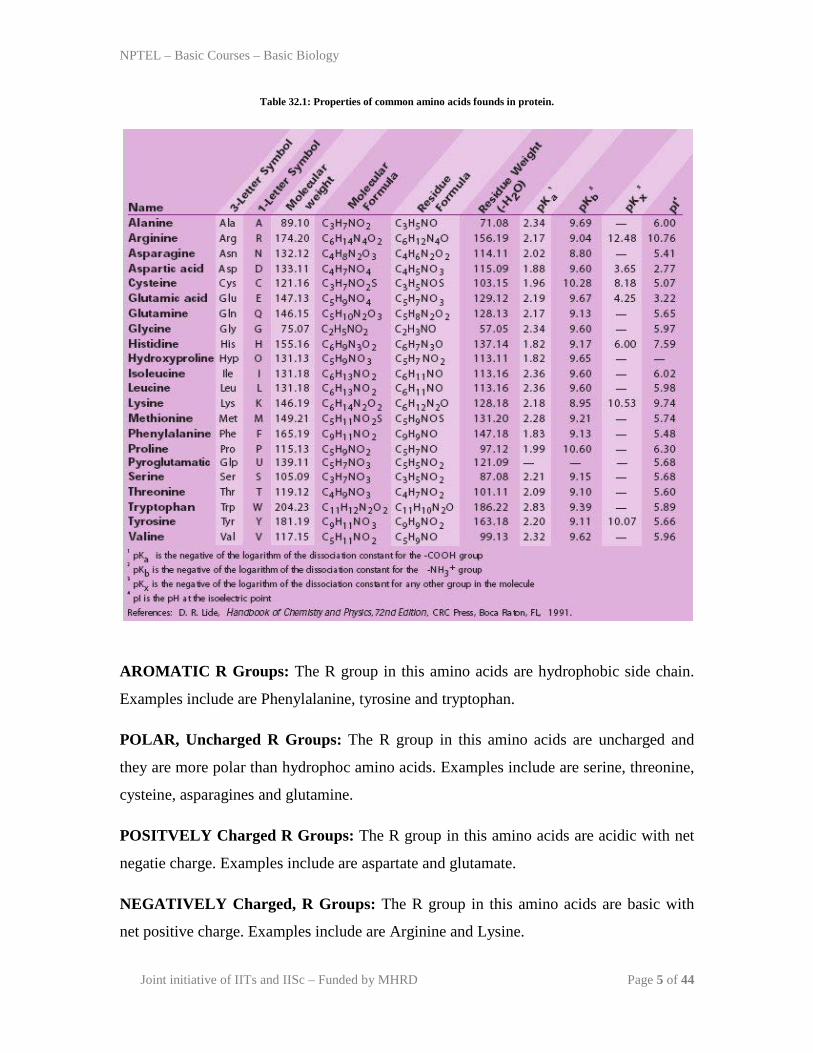
Amino acids are classified by R groups: As discussed, different amino acids are
classified basd on the side chain or R group. All these 20 amino acids are denotaed by
first letter (3 or single) or other letter (3 or single). The structure of these amino acids are
given in Figure 32.3 and their different properties are given in Table 32.1. The Different
amino acids are as follows:
NONPOLAR, Aliphatic R Group: The R group in this amino acids are non-polar and
hydrophobic. Examples include are alanine, valine, leucine, isoleucine and glycine,
methionine, proline.

NPTEL – Basic Courses – Basic Biology
Joint initiative of IITs and IISc – Funded by MHRD Page 4 of 44
Figure 32.2: Structure of different amino acids.
NPTEL – Basic Courses – Basic Biology
Joint initiative of IITs and IISc – Funded by MHRD Page 5 of 44
Table 32.1: Properties of common amino acids founds in protein.
AROMATIC R Groups: The R group in this amino acids are hydrophobic side chain.
Examples include are Phenylalanine, tyrosine and tryptophan.
POLAR, Uncharged R Groups: The R group in this amino acids are uncharged and
they are more polar than hydrophoc amino acids. Examples include are serine, threonine,
cysteine, asparagines and glutamine.
POSITVELY Charged R Groups: The R group in this amino acids are acidic with net
negatie charge. Examples include are aspartate and glutamate.
NEGATIVELY Charged, R Groups: The R group in this amino acids are basic with
net positive charge. Examples include are Arginine and Lysine.

NPTEL – Basic Courses – Basic Biology
Joint initiative of IITs and IISc – Funded by MHRD Page 6 of 44
Analysis of amino acids: The thin layer chromatography technique is an analytical
chromatography to separate and analyze free amino acids from proteins. In this method,
the silica or alumina as a stationery phase is coated on to a glass or aluminium foil as thin
layer and then a sample is allowed to run in the presence of a mobile phase (solvent). In
comparison to other chromatography techniques, the mobile phase runs from bottom to
top by diffusion (in most of the chromatography techniques, mobile phase runs from top
to bottom by gravity or pump). As sample runs along with the mobile phase, it get
distributed into the solvent phase and stationery phase. The interaction of sample with the
stationery phase retard the movement of the molecule where as mobile phase implies an
effective force onto the sample. Supose the force caused by mobile phase is Fm and the
retardation force by stationery phase is Fs, then effective force on the molecule will be
(Fm-Fs) through which it will move (Figure 32.3). The molecule immobilizes on the silica
gel (where, Fm=Fs) and the position will be controlled by multiple factors.
1. Nature or functional group present on the molecule or analyte.
2. Nature or composition of the mobile phase
3. Thickness of the stationery phase.
4. Functional group present on stationery phase.

NPTEL – Basic Courses – Basic Biology
Joint initiative of IITs and IISc – Funded by MHRD Page 7 of 44
If the distance travelled by a molecule on TLC plate is Dm where as the distance travelled
by the solvent is Ds, then the retardation factor (Rf) of molecule is given by:
𝐑𝐟 =𝐃𝐢𝐬𝐭𝐚𝐧𝐜𝐞 𝐭𝐫𝐚𝐯𝐞𝐥𝐥𝐞𝐝 𝐛𝐲 𝐬𝐮𝐛𝐬𝐭𝐚𝐧𝐜𝐞 (𝐃𝐦)𝐃𝐢𝐬𝐭𝐚𝐧𝐜𝐞 𝐭𝐫𝐚𝐯𝐞𝐥𝐥𝐞𝐝 𝐛𝐲 𝐬𝐨𝐥𝐯𝐞𝐧𝐭 (𝐃𝐬)
Rf value is characterstic to the molecule as long as the solvent system and TLC plate
remains unchanged. It can be used to identify the substance in a crude mixture.
Figure 32.3: Principle of thin layer chromatography.

NPTEL – Basic Courses – Basic Biology
Joint initiative of IITs and IISc – Funded by MHRD Page 8 of 44
Operation of the technique-Several steps are required to perform a thin layer
chromatography to analyze a complex samples. These preparatory and operational steps
are as follows:
Spoting: The events involved in spotting is given in Figure 37.3. A line is draw with a
pencil little away from the bottom. Sample is taken into the capillary tube or in a pipette.
Capillary is touched onto the silica plate and sample is allowed to dispense. It is
important that depending on the thickness of the layer, a suitable volume should be taken
to apply. Spot is allowed to dry in air or a hair dryer can be used instead.
Figure 32.4: Events in spotting during thin layer chromatography.
Running of the TLC: Once the spot is dried, it is placed in the TLC chamber in such a
way that spot should not be below the solvent level. Solvent front is allowed to move
until the end of the plate.
Analysis of the chromatography plate- The plate is taken out from the chamber and air
dried. If the compound is colored, it forms spot and for these substances there is no
additional staining required. There are two methods of developing a chromatogram-
Staining procedure- In the staining procedure, TLC plate is sprayed with the staining
reagent to stain the functional group present in the compound. Forx. Ninhydrin is used to
stain amino acids.

NPTEL – Basic Courses – Basic Biology
Joint initiative of IITs and IISc – Funded by MHRD Page 9 of 44
Non-staining procedure- In non-staining procedure spot can be identify by following
methods-
1. Autoradiography- A TLC plate can be placed along with the X-ray film for 48-72 hrs
(exposure time depends on type and concentration of radioactivity) and then X-ray film is
processed.
2. Fluorescence- Several heterocyclic compounds give fluorescence in UV due to
presence of conjugate double bond system. TLC plate can be visualized in an UV-
chamber (Figure 37.4) to identify the spots on TLC plate.
Figure 32.5: UV-Chamber and UV illuminated TLC plate.
NPTEL – Basic Courses – Basic Biology
Joint initiative of IITs and IISc – Funded by MHRD Page 10 of 44
Lecture 33: Protein (Part-II)
Summary of Previous Lecture: In the previous we discussed several aspect of amino
acids, the building block of proteins. Now in the current lecture, we will discuss more
about the protein structure and its function.
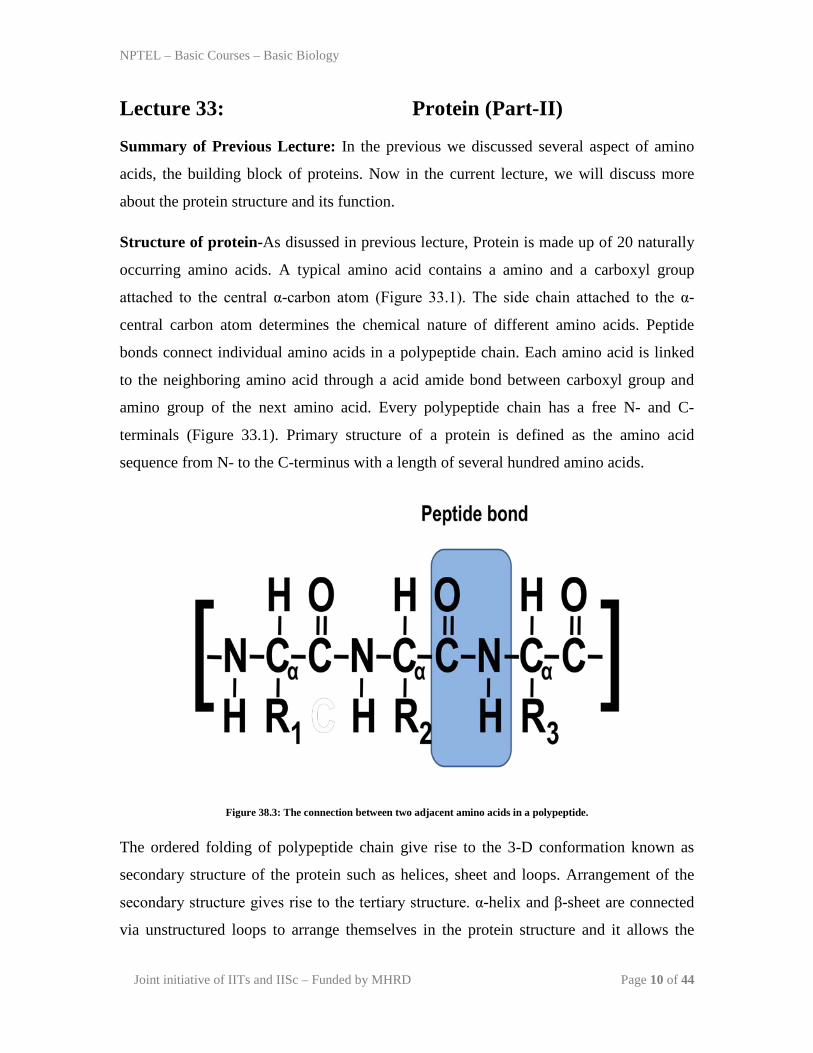
Structure of protein-As disussed in previous lecture, Protein is made up of 20 naturally
occurring amino acids. A typical amino acid contains a amino and a carboxyl group
attached to the central α-carbon atom (Figure 33.1). The side chain attached to the α-
central carbon atom determines the chemical nature of different amino acids. Peptide
bonds connect individual amino acids in a polypeptide chain. Each amino acid is linked
to the neighboring amino acid through a acid amide bond between carboxyl group and
amino group of the next amino acid. Every polypeptide chain has a free N- and C-
terminals (Figure 33.1). Primary structure of a protein is defined as the amino acid
sequence from N- to the C-terminus with a length of several hundred amino acids.
Figure 38.3: The connection between two adjacent amino acids in a polypeptide.
The ordered folding of polypeptide chain give rise to the 3-D conformation known as
secondary structure of the protein such as helices, sheet and loops. Arrangement of the
secondary structure gives rise to the tertiary structure. α-helix and β-sheet are connected
via unstructured loops to arrange themselves in the protein structure and it allows the
NPTEL – Basic Courses – Basic Biology
Joint initiative of IITs and IISc – Funded by MHRD Page 11 of 44
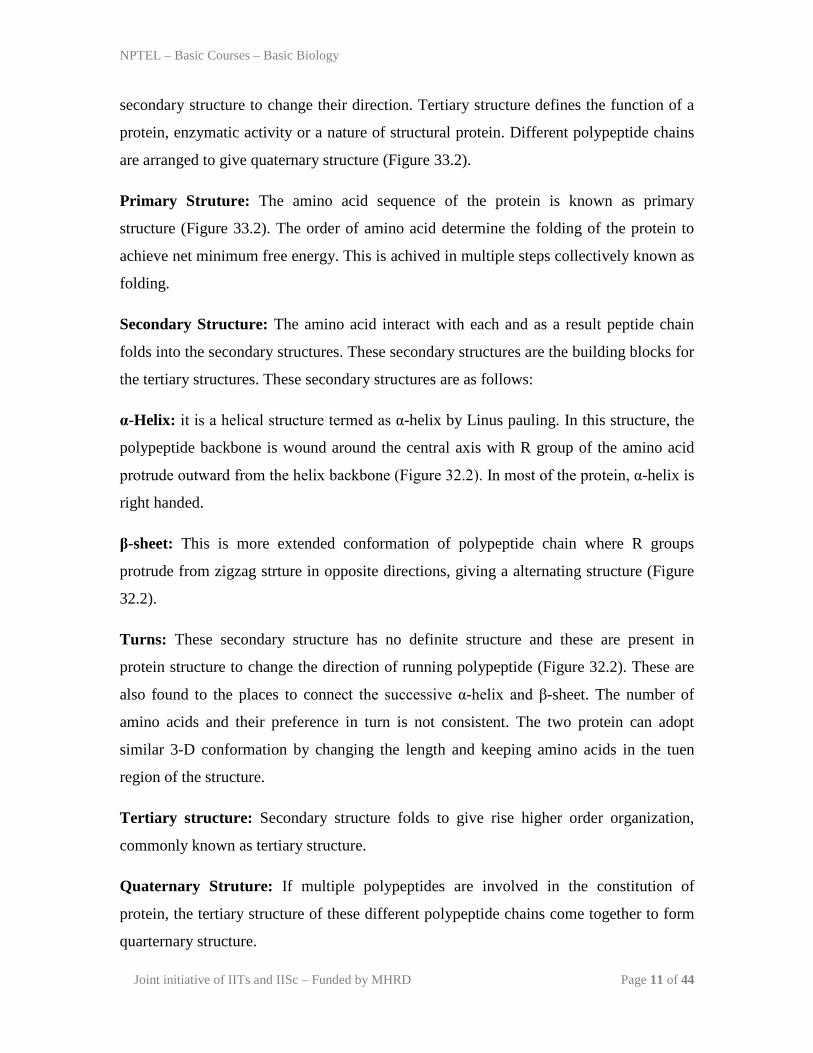
secondary structure to change their direction. Tertiary structure defines the function of a
protein, enzymatic activity or a nature of structural protein. Different polypeptide chains
are arranged to give quaternary structure (Figure 33.2).
Primary Struture: The amino acid sequence of the protein is known as primary
structure (Figure 33.2). The order of amino acid determine the folding of the protein to
achieve net minimum free energy. This is achived in multiple steps collectively known as
folding.
Secondary Structure: The amino acid interact with each and as a result peptide chain
folds into the secondary structures. These secondary structures are the building blocks for
the tertiary structures. These secondary structures are as follows:
α-Helix: it is a helical structure termed as α-helix by Linus pauling. In this structure, the
polypeptide backbone is wound around the central axis with R group of the amino acid
protrude outward from the helix backbone (Figure 32.2). In most of the protein, α-helix is
right handed.
β-sheet: This is more extended conformation of polypeptide chain where R groups
protrude from zigzag strture in opposite directions, giving a alternating structure (Figure
32.2).
Turns: These secondary structure has no definite structure and these are present in
protein structure to change the direction of running polypeptide (Figure 32.2). These are
also found to the places to connect the successive α-helix and β-sheet. The number of
amino acids and their preference in turn is not consistent. The two protein can adopt
similar 3-D conformation by changing the length and keeping amino acids in the tuen
region of the structure.
Tertiary structure: Secondary structure folds to give rise higher order organization,
commonly known as tertiary structure.
Quaternary Struture: If multiple polypeptides are involved in the constitution of
protein, the tertiary structure of these different polypeptide chains come together to form
quarternary structure.
NPTEL – Basic Courses – Basic Biology
Joint initiative of IITs and IISc – Funded by MHRD Page 12 of 44
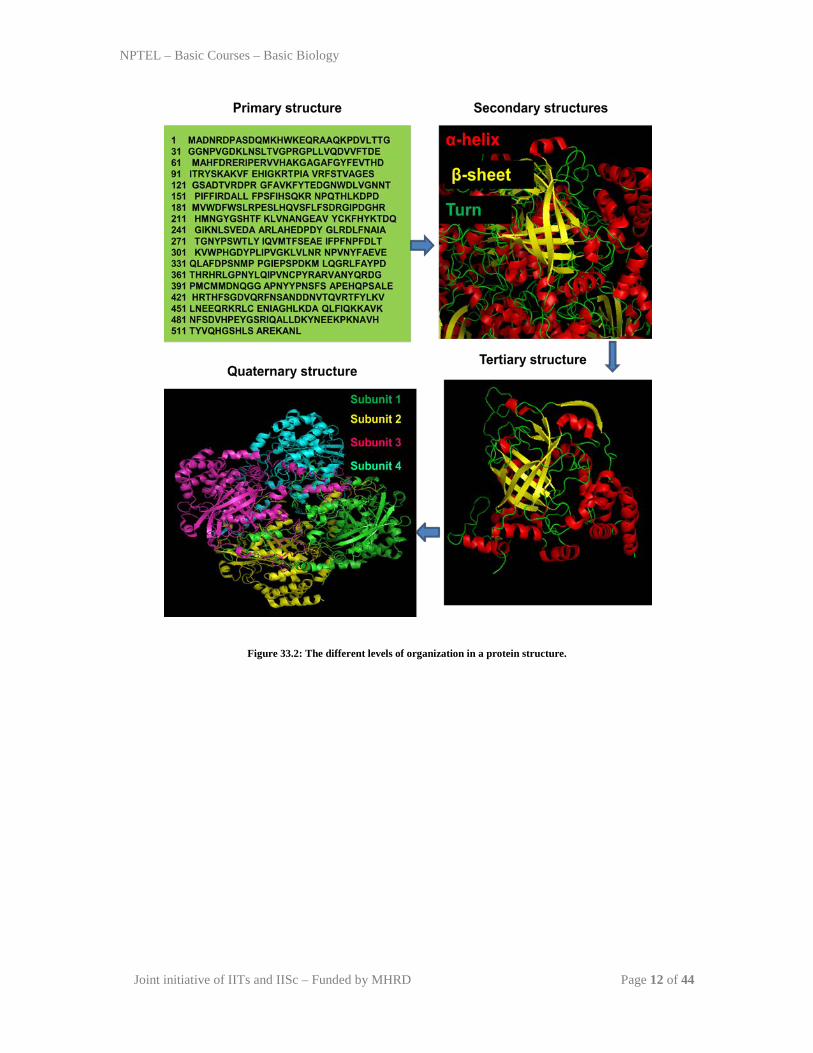
Figure 33.2: The different levels of organization in a protein structure.
NPTEL – Basic Courses – Basic Biology
Joint initiative of IITs and IISc – Funded by MHRD Page 13 of 44
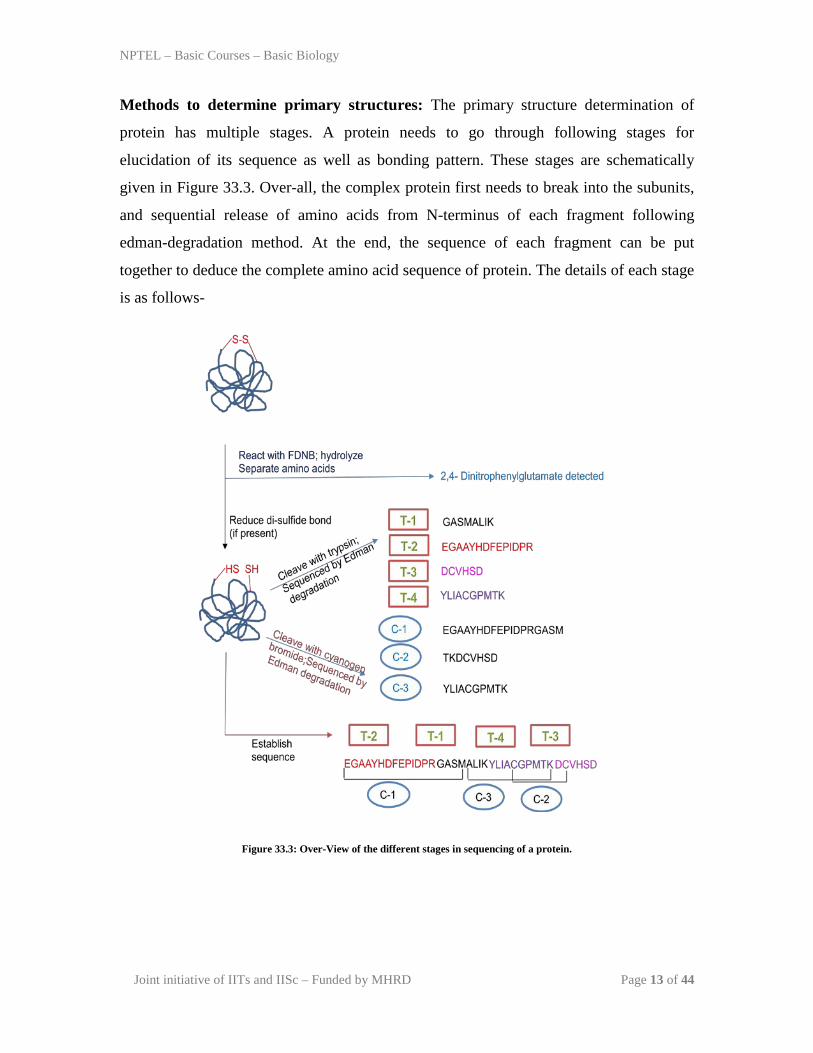
Methods to determine primary structures: The primary structure determination of
protein has multiple stages. A protein needs to go through following stages for
elucidation of its sequence as well as bonding pattern. These stages are schematically
given in Figure 33.3. Over-all, the complex protein first needs to break into the subunits,
and sequential release of amino acids from N-terminus of each fragment following
edman-degradation method. At the end, the sequence of each fragment can be put
together to deduce the complete amino acid sequence of protein. The details of each stage
is as follows-
Figure 33.3: Over-View of the different stages in sequencing of a protein.

NPTEL – Basic Courses – Basic Biology
Joint initiative of IITs and IISc – Funded by MHRD Page 14 of 44
Stage 1. Breaking Disulphide Bonds: In protein two cysteine amino acids are linked by
a disulphide linkage. The disulphide linkage interfere with the complete sequencing
procedure as it doesn’t allow the release of cleaved amino acid from the peptide chain.
There are two approaches two disrupt the disulphide linkage in a protein sequence
(Figure 33.4). In first approach, protein is oxidized with a performic acid to produce two
cysteic acid residues. In another approach, protein is reduced by dithiothreitol (DTT) or
β-mercaptoethanol (β-me) to form two cysteine followed by treatment with iodoacetate to
form carboxymethyl-cysteine. Formation of carboxymethyl-cysteine stops the re-
formation of disulphide bond.
Figure 33.4: Disruption of disulphide bond by different approaches.

NPTEL – Basic Courses – Basic Biology
Joint initiative of IITs and IISc – Funded by MHRD Page 15 of 44
Stage 2. Cleavage of the polypeptide chain: Proteases and the chemical agents targeting
proteins have a specific recognition sequence and they cleave after a particular amino
acid. A list of protease and chemicals commonly used to digest the polypeptides into the
small peptide fragment is given in Table 38.1.
Table 33.1: Some Common reagents for fragmenting polypeptide chain.
S.No Reagent Cleavage Point 1 Trypsin After Lys, Arg 2 Chymotrypsin After Phe, Trp, Tyr 3 Pepsin After Leu, Phe, Trp, Tyr 4 Cynogen Bromide After Met
Stage 3. Sequencing the peptides-Once the peptide fragments are generated, we can
start the sequencing of each polypeptide chain. It has following steps:
A. Identifying the N-terminal residue: The N-terminal amino acid analysis is a 3 steps
process.
1. Derivatization of terminal amino acid-The chemical reaction is performed to labeled
terminal amino group with compounds such as sanger reagent 1-fluoro-2,4-
dinitrobenzene (DFNB) and dansyl chloride. In most of the case these reagents also label
free amino group present on basic amino acids such as lysine and arginine. In a reaction
mechanism given in Figure 38.3, dinitrofluorobenzene reacts with the free amine group to
form dinitrophenyl-amino acid complex.
2. hydrolyse the protein-Acid hydrolysis of dinitrophenyl-amino acid complex leads to
the breaking of peptide bond to release dinitrophenyl-amino acid complex in solution.
3. Separation and analysis of derivatized amino acids-A HPLC or TLC separation of
complex and comparing with the standard amino acids.

NPTEL – Basic Courses – Basic Biology
Joint initiative of IITs and IISc – Funded by MHRD Page 16 of 44
Figure 33.5: Derivatization of N-terminal amino acid with sanger reagent
C. C-terminal residues: Not many methods are developed for c-terminal amino acid
analysis. The most common method is to treat the protein with a carboxypeptidase to
release the c-terminal amino acid and test the solution in a time dependent manner.
Stage 4. Ordering the peptide fragments: The usage of different protein cleavage
reagent produces over-lapping amino acid stretches and these stretches can be used to put
the whole sequence.
Stage 5. Locating disulfide bonds: The protein cleavage by typsin is performed with or
without breaking di-sulphide linkage. Amino acid sequence analysis of the fragments will
provide the site of disulphide bond. The presence of one disulphide will reduce two
peptide fragment and will appear as one large peptide fragment.
Mass Spectrometry Method: In recent pass, mass spectroscopy in conjugation with
proteomics information is also been popular tool to chacracterize each peptide fragment
to deduce its amino acid sequence. The minor detail of this approach can be explored by
following the article

NPTEL – Basic Courses – Basic Biology
Joint initiative of IITs and IISc – Funded by MHRD Page 17 of 44
[Collisions or Electrons? Protein Sequence Analysis in the 21st Century". Anal.
Chem. 81 (9): 3208–3215.]
Methods to determine secondary, tertiary structures:
A. Experimental Methods: X-ray crystallography and NMR spectroscopy are the two
methods can be used to determine the 3-dimensional structure of the target enzyme.
I suggests to go through the following articles to get full detail of these structure solution processes.
1. RRM-RNA recognition: NMR or crystallography…and new findings. Daubner GM, Cléry A, Allain FH. Curr Opin Struct Biol. 2013 Feb;23(1):100-8. PMID: 23253355.
2. Protein structure determination by magic-angle spinning solid-state NMR, and insights into the formation, structure, and stability of amyloid fibrils. Comellas G, Rienstra CM. Annu Rev Biophys. 2013;42:515-36. PMID: 235277.
B. Homology modeling- This is a useful and fast structural solution method where the
sequence similarities between the template and the target enzyme is used to model the 3-
dimensional structure of the target enzyme. The homology modeling exploits the idea
that the amino acid sequence of a protein directs the folding of the molecule to adopt a
suitable 3-dimensional conformation with minimum free energy.
NPTEL – Basic Courses – Basic Biology
Joint initiative of IITs and IISc – Funded by MHRD Page 18 of 44
Lecture 34: Protein (Part-III)
FUNCTIONS OF PROTEINS: Determination of 3-D structure of protein is important
for understanding its functions. In prokaryotic and eukaryotic cells, protein is the main
molecule to perform many functions; such as enzymes to catalyze to various chemical
reactions, adaptor molecule for different ligands, messenger molecule to relay the signal
within the cell to produce factors to generate defense response against pathogens. The
selected protein functions are as follows:
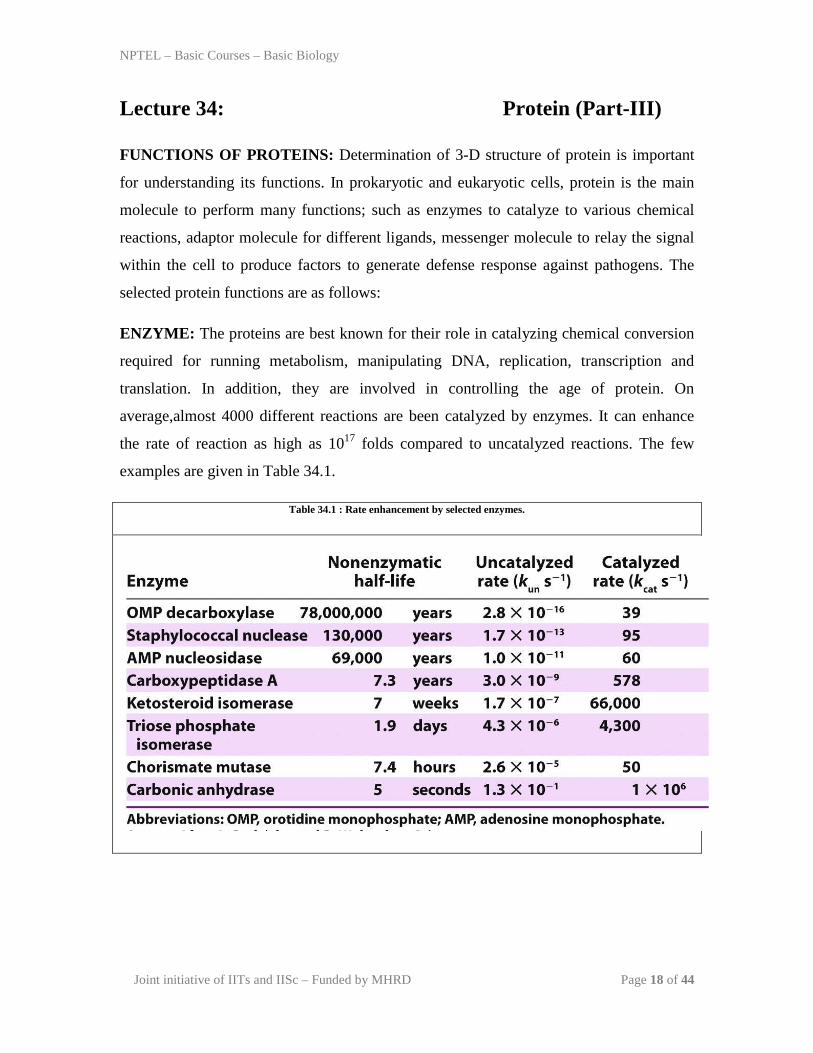
ENZYME: The proteins are best known for their role in catalyzing chemical conversion
required for running metabolism, manipulating DNA, replication, transcription and
translation. In addition, they are involved in controlling the age of protein. On
average,almost 4000 different reactions are been catalyzed by enzymes. It can enhance
the rate of reaction as high as 1017 folds compared to uncatalyzed reactions. The few
examples are given in Table 34.1.
Table 34.1 : Rate enhancement by selected enzymes.

NPTEL – Basic Courses – Basic Biology
Joint initiative of IITs and IISc – Funded by MHRD Page 19 of 44
REVERSIBLE BINDING OF PROTEIN TO A LIGAND: Protein is made up of
hundred of amino acids but they have defined 3-D region within the protein structure to
interact with cellular molecules to perform various functions. Few examples where
protein binds to the different ligands:
(A) Oxygen/Carbon di-oxide: Gasous oxygen is required to transport from atomsphere
to inside the body. Iron containing hemoprotein such as hemoglobin/myoglobin has
active site to bind oxygen. Hemoglobin is present inside the RBC and at the lung surface,
it binds oxygen and then inside the body, it release the oxygen in a controlled manner to
provide oxygen for running cellular metabolism (Figure 34.1). At the tissue site, it binds
CO2 and release it to atmosphere at the lung surface.
Figure 34.1: Gaseous Exchange in animal body.
NPTEL – Basic Courses – Basic Biology
Joint initiative of IITs and IISc – Funded by MHRD Page 20 of 44
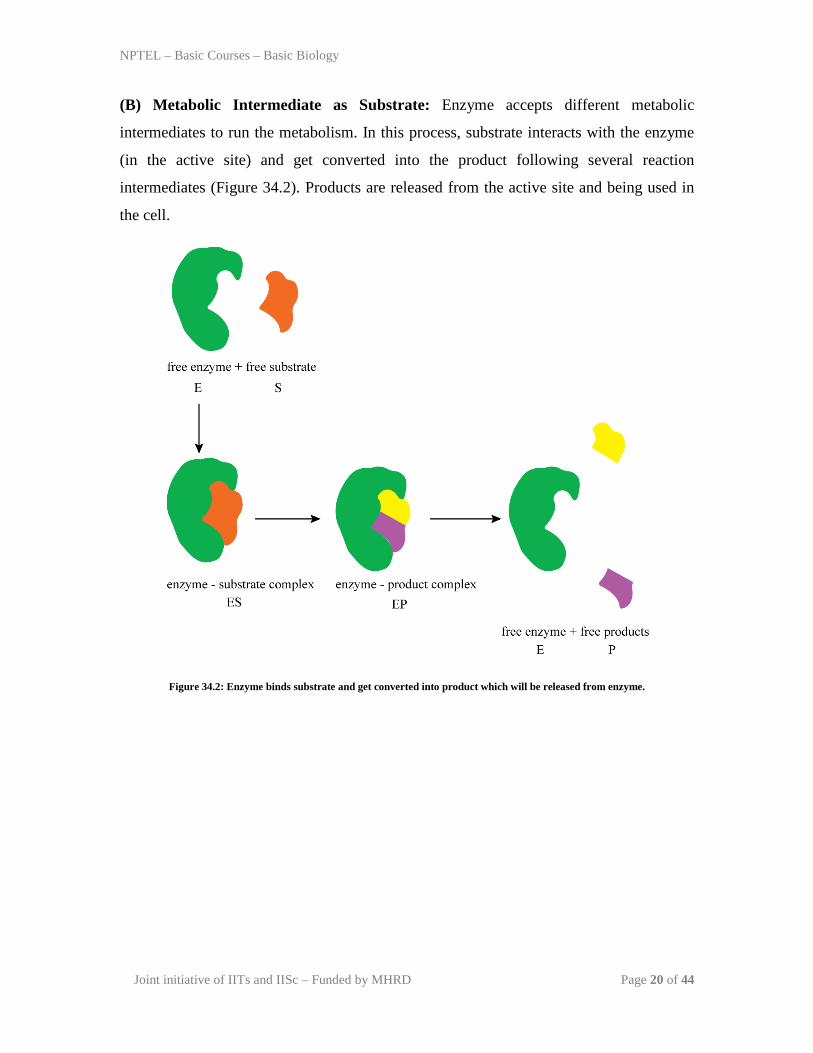
(B) Metabolic Intermediate as Substrate: Enzyme accepts different metabolic
intermediates to run the metabolism. In this process, substrate interacts with the enzyme
(in the active site) and get converted into the product following several reaction
intermediates (Figure 34.2). Products are released from the active site and being used in
the cell.
Figure 34.2: Enzyme binds substrate and get converted into product which will be released from enzyme.

NPTEL – Basic Courses – Basic Biology
Joint initiative of IITs and IISc – Funded by MHRD Page 21 of 44
(C) Cell Surface Receptor: Proteins are present on the cell surface in the form of
receptor and it interact with molecules present in the external milieu for many purposes.
For example, LDL receptor present on cells is used to bind oxidized LDL and remove the
lipid lipid from the circulation (Figure 34.3). In several cases, the cell surface receptors
are recycled back to surface after delivering the ligand into the intracellular vesicular
storage system.
Figure 34.3: Cell surface receptor and its use to absorb the lipid from circulation.
(D) Phagocytosis, antigen presentation and killing of micro-organisms- Phagocytosis
is a dynamic process by which pathogens and unwanted tissue debris are scavenged from
the host body. Phagocytosis starts when macrophage extend its pseudopodia around the
foreign particle (such as microorganism) and entrap it into vesicular structure called as
“phagosome”. The phagosomal compartment subsequently fuses with lysosomes to form
phago-lysosome, facilitating the destruction of ingested material into smaller peptides
(Figure 34.4). In addition, micro-organisms are killed by ROS, such as superoxide, H2O2
and hydroxyradicals released after respiratory burst. Oxidized halogens (HOCl) is known
to destroy many bacterial components including nucleotides and redox enzymes at a

NPTEL – Basic Courses – Basic Biology
Joint initiative of IITs and IISc – Funded by MHRD Page 22 of 44
rapid rate. Besides foreign particles, dead and damaged cells are cleared by the
macrophages through phagocytosis. Aged normal RBCsbind nonspecifically large
quantities of Ig recognized by the macrophage Fc receptors and phagocytized. Once
ingested, the RBCsare degraded to liberate iron from hemin and stored in the form of
protein complexes to support erythropoiesis.The peptide fragments activate other immune
cells (T-lymphocytes) to produce immunological response to further clears foreign
pathogens.
A B
C D
Figure 34.4: Protein mediates different functions performed by macrophages to maintain homeostasis.

NPTEL – Basic Courses – Basic Biology
Joint initiative of IITs and IISc – Funded by MHRD Page 23 of 44
(A) Different receptors present on macrophages surfaces for sensing foreign particles. (B) Phagocytosis of
microbes followed by formation of phagolysosomeand discharge of waste material. (C)The peptide fragment
of degraded microbes are presented along with the help of class-II MHC on the macrophages cell surface to
perform antigen presentation to lymphocytes. (D) Release of inflammatory molecules which destroy microbes
present in microenvironment.
(E) Inflammation- Macrophages exposed to bacterial components or interferon-γ (IFN-
γ) activateto produce wide array of inflammatory molecules to inhibit or kill pathogens
(Figure 34.4). They produces reactive oxygen species (ROS) such as superoxide radical
(O2-), hydrogen peroxide and reactive nitrogen intermediate (RNS) tooxidize pathogenic
organism. The inflammatory molecules reduce the microbial burden in host but excess
prodution leadto host tissue damage and disturb homeostasis.
(F) Tissue repair and remodeling- Macrophages play an important role in wound
healing, tissue repair and remodeling.At wound site, injury results in accumulation of
dead and apoptotic cells and cellular debries which will be phagocytized by
macrophages. Additionally, at wound bed macrophages secrete transforming growth
factor‑β (TGF-β), platelet-derived growth factor (PDGF), fibroblast growth factor-2
(FGF-2) and insulin like growth factor-1 (IGF-1) to stimulatescollagen production from
fibroblast cells. Later, macrophages secrete MMPs to degrade collagen which helps
fibroblast and endothelial cells to migrate at wound site for new blood vessels formation.
NPTEL – Basic Courses – Basic Biology
Joint initiative of IITs and IISc – Funded by MHRD Page 24 of 44
Lecture 35: Protein (Part-IV)
DETECTION OF PROTEIN IN BIOLOGICAL FLUIDS:
(A) Detection of antibody:
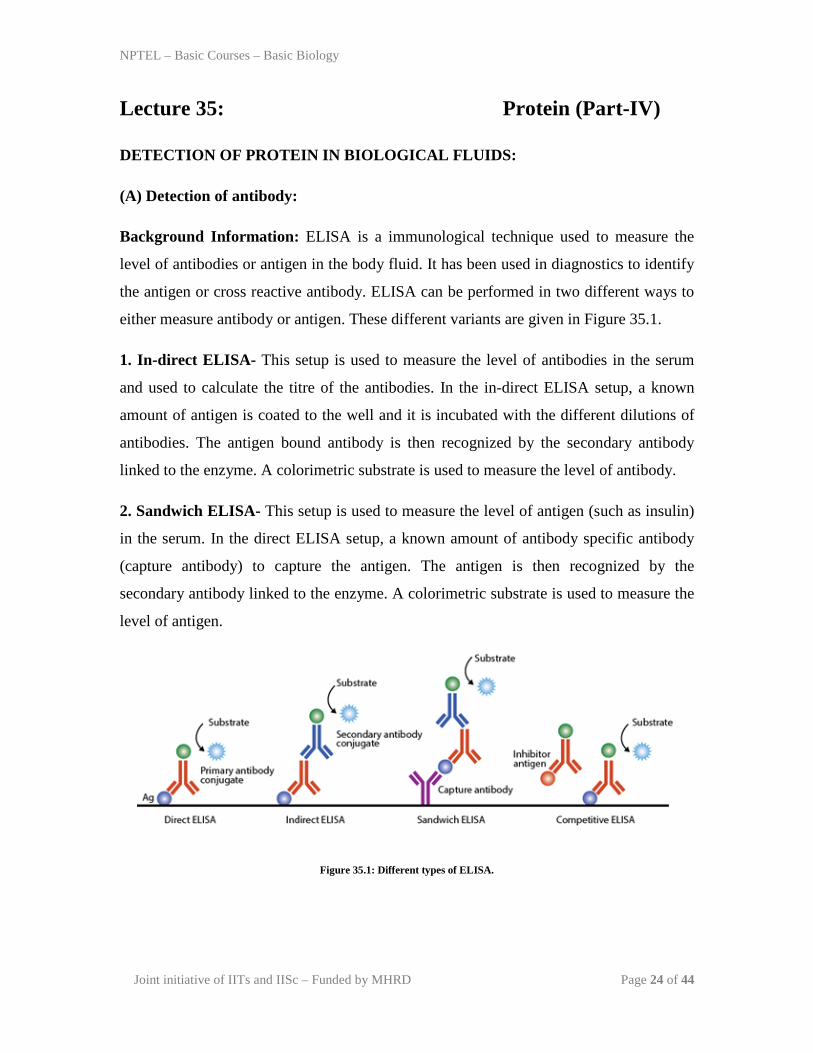
Background Information: ELISA is a immunological technique used to measure the
level of antibodies or antigen in the body fluid. It has been used in diagnostics to identify
the antigen or cross reactive antibody. ELISA can be performed in two different ways to
either measure antibody or antigen. These different variants are given in Figure 35.1.
1. In-direct ELISA- This setup is used to measure the level of antibodies in the serum
and used to calculate the titre of the antibodies. In the in-direct ELISA setup, a known
amount of antigen is coated to the well and it is incubated with the different dilutions of
antibodies. The antigen bound antibody is then recognized by the secondary antibody
linked to the enzyme. A colorimetric substrate is used to measure the level of antibody.
2. Sandwich ELISA- This setup is used to measure the level of antigen (such as insulin)
in the serum. In the direct ELISA setup, a known amount of antibody specific antibody
(capture antibody) to capture the antigen. The antigen is then recognized by the
secondary antibody linked to the enzyme. A colorimetric substrate is used to measure the
level of antigen.
Figure 35.1: Different types of ELISA.

NPTEL – Basic Courses – Basic Biology
Joint initiative of IITs and IISc – Funded by MHRD Page 25 of 44
Reagents and Materials: Biocarbonate buffer- Prepare the 50mM Biocarbonate buffer pH 9.2 in distilled water and filter sterile with 0.2µm filter. ELISA plate: Flat Bottom 96 well is more suitable for performing ELISA. Antigen solution: Prepare 5µg/ml antigen solution in biocarbonate buffer pH 9.2. BSA: Prepare 10mg/ml BSA solution in distilled water and filter sterile with 0.2µm filter. Primary antibody and secondary antibody PBS containing Tween 20 Procedures: Different steps in performing in-direct ELISA is given in the Figure 35.2. These steps are as follows:
Figure 35.2: Different Steps in performing in-direct ELISA to measure antibody level in the serum.
Coating: Prepare 5 µg/ml of antigen solutions in Biocarbonate buffer (50mM, pH 9.2). Dispense 50 µl per well of microtiter plate. Put it overnight inside fridge (8 – 10 hrs is sufficient).
Blocking: Block each well with 1% BSA in Biocarbonate buffer for overnight.
NPTEL – Basic Courses – Basic Biology
Joint initiative of IITs and IISc – Funded by MHRD Page 26 of 44
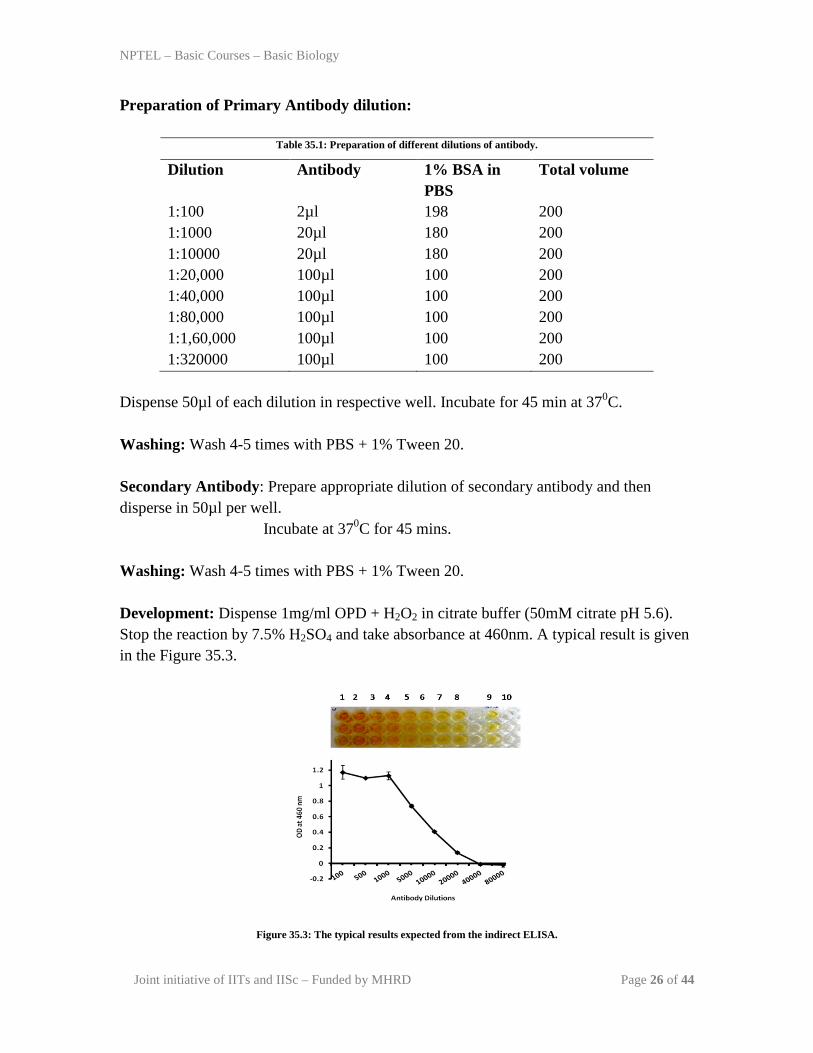
Preparation of Primary Antibody dilution:
Table 35.1: Preparation of different dilutions of antibody.
Dilution Antibody 1% BSA in PBS
Total volume
1:100 2µl 198 200 1:1000 20µl 180 200 1:10000 20µl 180 200 1:20,000 100µl 100 200 1:40,000 100µl 100 200 1:80,000 100µl 100 200 1:1,60,000 100µl 100 200 1:320000 100µl 100 200
Dispense 50µl of each dilution in respective well. Incubate for 45 min at 370C. Washing: Wash 4-5 times with PBS + 1% Tween 20.
Secondary Antibody: Prepare appropriate dilution of secondary antibody and then disperse in 50µl per well.
Incubate at 370C for 45 mins.
Washing: Wash 4-5 times with PBS + 1% Tween 20. Development: Dispense 1mg/ml OPD + H2O2 in citrate buffer (50mM citrate pH 5.6). Stop the reaction by 7.5% H2SO4 and take absorbance at 460nm. A typical result is given in the Figure 35.3.
Figure 35.3: The typical results expected from the indirect ELISA.

NPTEL – Basic Courses – Basic Biology
Joint initiative of IITs and IISc – Funded by MHRD Page 27 of 44
(B) Detection of antigen in ELISA:
Background Information: The typical setup for detection of antigen from the sample is
given in the Figure 35.4. In this method, a capture antibody is used to collect the antigen
from the sample. Afterwards, second antibody is used to detect antigen bound to the
capture antibody. Second antibody is directed against the antigen using a unique distinct
epitope. The antibody is linked to the biotin and that can be recognized by the
avidin/streptavidin-HRP complex. In the last step, peroxidase substrate is used to get a
readout.
Figure 35.4: Sandwich ELISA and use of different components.
Materials and Instrument:
1. Capture Antibody : anti-Mouse TNF monoclonal antibody. It is supplied as 1 vial
(1ml) and a recommended 1:250 dilution in coating buffer is used for coating ELISA
plate.
2. Detection Antibody : Biotinylated anti-Mouse TNF monoclonal antibody. It is
supplied as 1 vial (0.5ml) and a recommended 1:500 dilution in reaction buffer is used for
detecting TNF-α in the sample.
3. Enzyme Reagent : Streptavidin-horseradish peroxidase conjugate (SAv-HRP)
NPTEL – Basic Courses – Basic Biology
Joint initiative of IITs and IISc – Funded by MHRD Page 28 of 44
4. Standards : Recombinant mouse TNF, It is supplied as lyophilized powder (30ng) and
serial dilution of the stock (30ng/ml) in reaction buffer is used for drawing calibration
curve.
5. Enzyme reagent Streptavidin –HRP conjugate: It is supplied as 1 vial (1ml) and a
recommended 1:250 dilution in reaction buffer is used for detecting TNF-α in the sample.
6. Coating Buffer - 0.2 M Sodium Phosphate, pH 6.5 : Weight 12.49 g Na2HPO4, 15.47
g NaH2PO4 and make up the volume to 1.0 L. Adjust the pH to 6.5. Prepare freshly and
use within 7 days of preparation, stored at 2-8°C.
7. Assay Diluent-PBS with 10% FBS, pH 7.0. Freshly prepare and use within 3 days of preparation, store at 2-8°C.
8. Wash Buffer – PBS with 0.05% Tween-20. Freshly prepare and use within 3 days of preparation, stored at 2-8°C.
9. Substrate Solution - Tetramethylbenzidine (TMB) and Hydrogen Peroxide.
10. Stop Solution -1 M H3PO4 or 2 N H2SO4
11. 96-well ELISA flat bottom plates are recommended
12. Microplate reader capable of measuring absorbance at 450 nm
13. micropipettes
14. Tubes to prepare standard dilutions
15. Plate sealers or parafilm.
PROCEDURE
1. Specimen Collection and Handling: Specimens should be clear, non-hemolyzed and
non-lipemic. In the case of cell-culture, remove any particulate material by centrifugation
and assay immediately or store samples at ≤ -20°C. Avoid repeated freeze-thaw cycles.
Where as in the case of patient blood, use a serum separator tube and allow samples to
clot for 30 minutes, then centrifuge for 10 minutes at 1000 x g. Remove serum and assay
immediately or store samples at ≤ -20° C. Avoid repeated freeze-thaw cycles.

NPTEL – Basic Courses – Basic Biology
Joint initiative of IITs and IISc – Funded by MHRD Page 29 of 44
2. Preparation of TNF-α Standard dilution: Dissolve the vial content into 1ml
deionized water to yield a stock standard 30ng/ml. Allow the standard to equilibrate for at
least 15 minutes before making dilutions. For preparing different concentration of TNF-α
solution, initially prepare a 1000 pg/mL standard from the stock standard. Vortex to mix.
Dilute this stock into different dilutions as per the calculation given in the Table 29.2. and
follow as given in the Figure 35. 5.
Table 35.2: Preparation of the TNF-α dilutions
TNF-α concentration
(pg/ml)
TNF-α (µl) Assay Dilution Buffer (ml)
Total volume
1000 300 300 600 500 300 300 600 250 300 300 600 125 300 300 600 62.5 300 300 600 31.25 300 300 600 15.62 300 300 600
Figure 35.5: Procedure to prepare the serial dilution of TNF-α.
3. ELISA plate coating: Add 100 µL diluted Capture Aantibody to each well. Incubate overnight at 4°C. Aspirate and wash 3 times with wash buffer. 4. Blocking : Add 200 µL Assay Diluent to each well. Incubate 1 hr RT. Aspirate and wash 3 times with wash buffer.

NPTEL – Basic Courses – Basic Biology
Joint initiative of IITs and IISc – Funded by MHRD Page 30 of 44
5. Add 100 µL standard TNF-α or sample to each well. Incubate it for 2 hr at RT. Aspirate the sample and wash the plate 5 times with wash buffer. 6. Detection: Add 100 µL Working Detector (Detection Ab + SAv-HRP) to each well.
Incubate for 1hr at RT. Aspirate the detector solution and wash 7 times with wsh buffer.
Add 100 µL Substrate Solution to each well and incubate 30 min RT in dark. Stop the
reaction by adding 50 µL Stop Solution to each well. Read the ELISA plate at 450 nm
and the at 570 nm (it is required to substract background absorbance).
Determination of the TNF-α level:- The mean mean absorbance of each set of sample
and subtract the background absorbance from each mean. Draw a calibration by Plotting
the standard TNF-α concentration against the absorbance. A typical standard TNF-α is
given in the Figure 35.6. Use a regression analysis and draw the equation. Use this
equation to determine the TNF concentration of the unknown sample.
Figure 35.6: TNF-α standard Curve
NPTEL – Basic Courses – Basic Biology
Joint initiative of IITs and IISc – Funded by MHRD Page 31 of 44
Lecture 36: Carbohydrate (Part-I)
Introduction: In contrast to protein and lipid, carbohydrates are mainly been utilized to
provide as a source of energy to run life activities. Plants are the primary producers of
carbohydrate by utililyzing atmospheric CO2, H2O and sunlight. Carbohydrate are present
in very simple as monosaccharides to complex form as polysaccharides and
glycoconjugates. In the present chapter, we will discuss salient features of carbohydrates,
its structure and metabolism in animal system.
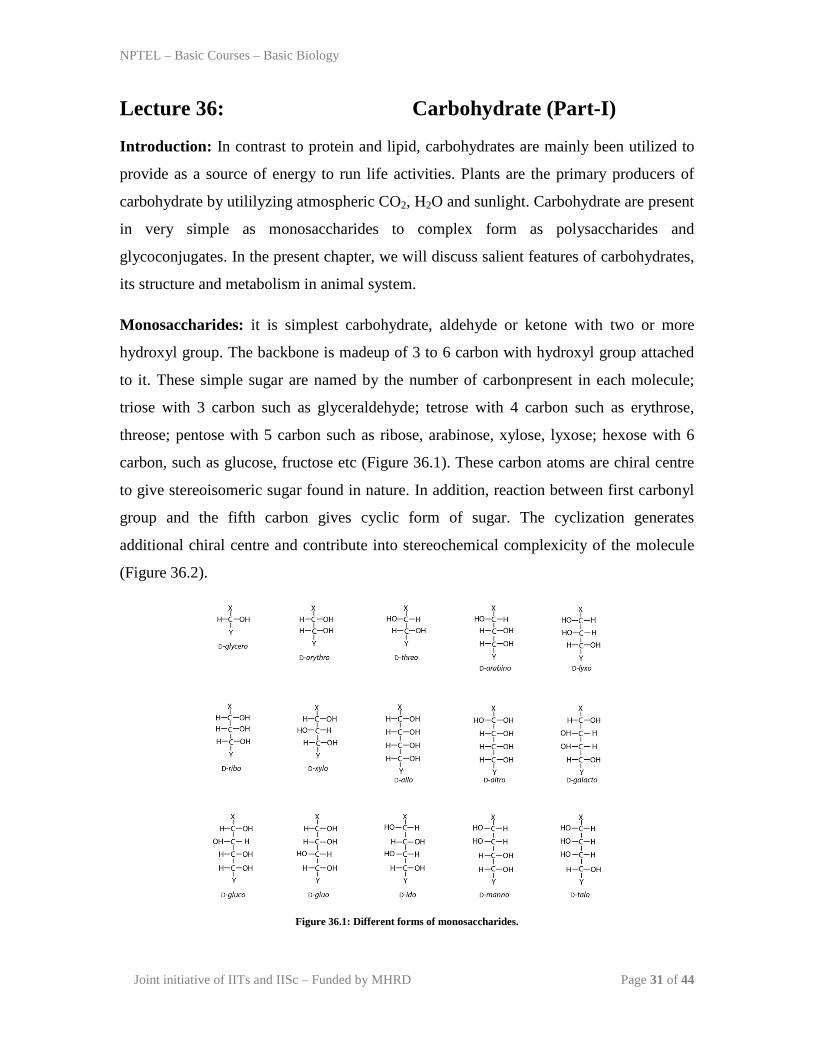
Monosaccharides: it is simplest carbohydrate, aldehyde or ketone with two or more
hydroxyl group. The backbone is madeup of 3 to 6 carbon with hydroxyl group attached
to it. These simple sugar are named by the number of carbonpresent in each molecule;
triose with 3 carbon such as glyceraldehyde; tetrose with 4 carbon such as erythrose,
threose; pentose with 5 carbon such as ribose, arabinose, xylose, lyxose; hexose with 6
carbon, such as glucose, fructose etc (Figure 36.1). These carbon atoms are chiral centre
to give stereoisomeric sugar found in nature. In addition, reaction between first carbonyl
group and the fifth carbon gives cyclic form of sugar. The cyclization generates
additional chiral centre and contribute into stereochemical complexicity of the molecule
(Figure 36.2).
Figure 36.1: Different forms of monosaccharides.

NPTEL – Basic Courses – Basic Biology
Joint initiative of IITs and IISc – Funded by MHRD Page 32 of 44
Figure 36.2: Formation of cyclic forms of Glucose.
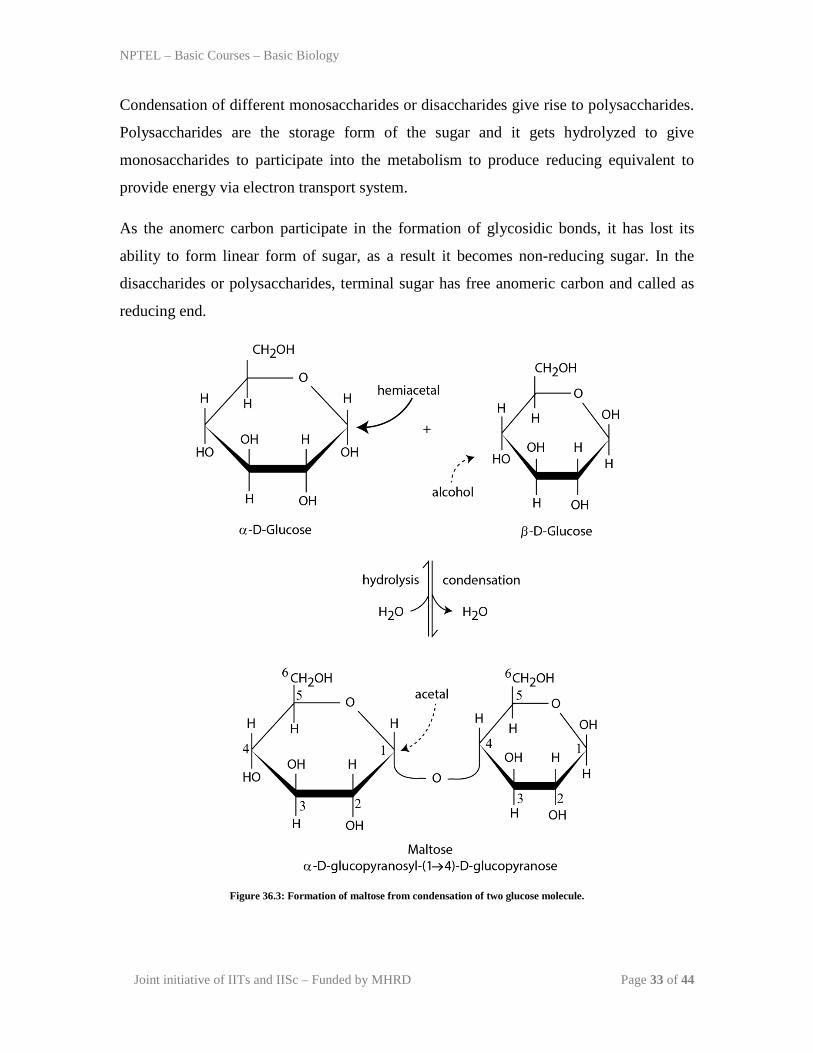
The individual mono saccharides utilized their terminal hydroxyl group to form a O-
glycosidic linkage to form di-saccharides with the loss of water (Figure 36.3). With the
addition of water, it can be hydrolyzed to form individual monosaccharides. Different
monomer can participate to give different disaccharide sugar.
NPTEL – Basic Courses – Basic Biology
Joint initiative of IITs and IISc – Funded by MHRD Page 33 of 44
Condensation of different monosaccharides or disaccharides give rise to polysaccharides.
Polysaccharides are the storage form of the sugar and it gets hydrolyzed to give
monosaccharides to participate into the metabolism to produce reducing equivalent to
provide energy via electron transport system.
As the anomerc carbon participate in the formation of glycosidic bonds, it has lost its
ability to form linear form of sugar, as a result it becomes non-reducing sugar. In the
disaccharides or polysaccharides, terminal sugar has free anomeric carbon and called as
reducing end.
Figure 36.3: Formation of maltose from condensation of two glucose molecule.

NPTEL – Basic Courses – Basic Biology
Joint initiative of IITs and IISc – Funded by MHRD Page 34 of 44
Carbohydrate Metabolism- Post digestion, food material is digested into the amino
acid, fatty acid and glucose. All these final digestion products absorbed by intestine and
enter into the blood stream. Glucose enters into blood and distribute to the different
organs for storage purpose but liver is the prime site for storage. Glucose is converted
into the glycogen with the help of an enzyme glycogen synthase. Glucose is oxidized
into the glycolysis and kreb cycle to produce ATP and other reducing equivalent to
produce energy.
Glycolysis- Glycolysis is central to carbohydrate metabolism and it is the universal
pathway found in prokaryotic or eukaryotic cells. It is a breakdown of 6 membered
glucose into two 3 membered carbon suger to feed kreb cycle (in the presence of oxygen)
or to send for anaerobic oxidation (in the absence of oxygen). Hence, it plays a crucial
role for adopation of a living organism under differet types of stress conditions. The
glycolysis is a 10 step chemical reaction to enable glucose for its optimal oxidation. All
these reactions are given in Figure 36.4.
STEP-1: Phosphorylation of glucose-Glucose produced after glycogen breakdown is
phosphorylated by glucokinase (in liver) or hexokinase in all other tissues especially in
muscles. In the phosphorylation reaction, phosphate (γ-phosphate) group of ATP is
transferred to glucose to form glucose-6-phosphate. The phosphorylation reaction of
glucose to produce glucose-6-phosphate marks the molecule for glycolysis. One molecule
of ATP is utilized in this step.
STEP 2: Conversion of glucose-6-phosphate to fructose-6-phosphate-Phosphorylated
sugar produced in step-1 is converted into the fructose-6-phosphate by the action of
phospho-hexose isomerase.
STEP 3: Phosphorylation of fructose-6-phosphate- In this step, sugar is further
phsophorylated at carbon 1 to produce fructose-1,6 bis phosphate by the action of
Phosphofructokinase. In the phosphorylation reaction, phosphate (γ-phosphate) group
of ATP is transferred to phosphorylated sugar to form fructose-1,6 bis phosphate. One
molecule of ATP is utilized in this step.

NPTEL – Basic Courses – Basic Biology
Joint initiative of IITs and IISc – Funded by MHRD Page 35 of 44
STEP 4: Clevage of fructose 1,6-bis phosphate-This step is catalyzed by enzyme aldolase or fructose 1,6 bis aldolase to generate glyceraldehyde-3 phosphate (aldose) and dihydroxy acetone phosphate (ketose).
STEP 1-4: First 4 reactions of enzymatic conversion of glucose (6 carbon sugar) to glyceraldehydes-3 phosphate (aldose) and dihydroxy acetone phosphate (ketose) are considered as preparative phase of glycolysis and during this phase, two major event happened:
1. Commitment of Sugar for glycolysis- Phosphorylated products are negatively
charged and impermeable to the cell membrane through passive diffusion. Glycolysis
operates in cytosol and as a result first step of phosphorylation inhibits the passive
movement of the particular glucose moiety and drive it to participate in further steps of
glycolysis.
2. Activation of sugar- In the 1st and 3rd step of glycolysis, two phosphorylation reactions add potential energy into the molecule and hence activate the sugar to participate into the cleavage reaction to form two 3 carbon sugar moiety.
STEP 5: Interconversion of the triose phosphates-Three carbon sugar formed in step 4
undergoes internal conversion and as glyceraldehyde-3 phosphate can readily be able
to enter into the next step, the ketose generated in step 4 is reversibly convereted into the
glyceraldehydes-3 phosphate by triose-3-phosphate isomerase.
Figure 36.4: Different Reactions of Glycolysis.
NPTEL – Basic Courses – Basic Biology
Joint initiative of IITs and IISc – Funded by MHRD Page 36 of 44
STEP 6: Glyceraldehyde-3-phosphate to 1,3 bis-phospho-glycerate-In this step, one
molecule of NADH is produced after oxidation of aldehyde group of glyceraldehyde-3-
phosphate with the help of enzyme glyceraldehyde-3-phosphate dehydrogenase.
STEP 7: In this step, phosphate group from 1,3 bis-phosphoglycerate is removed by
phosphoglycerate kinase with an acyl phosphate group transfer to ADP to generate ATP
molecule.
STEP 8: Conversion of 3-phosphoglycerate to 2-phosphoglycerate- In a two step
mechanism, phosphoglycerate mutase catalyzes a reversible shift of phosphoryl group to
form 2-phosphoglycerate.
STEP 9: Dehydration of 2-phosphoglycerate to phosphoenol pyruvate- The enzyme
enolase catalyzes the dehydration reaction to produce phosphoenol pyruvate, a
compound with high phosphoryl group transfer potential.
STEP 10: In the last step of glycolysis, phosphate group from phosphoenol pyruvate is
transferred by pyruvate kinase with an acyl phosphate group transfer to ADP to generate
ATP molecule.
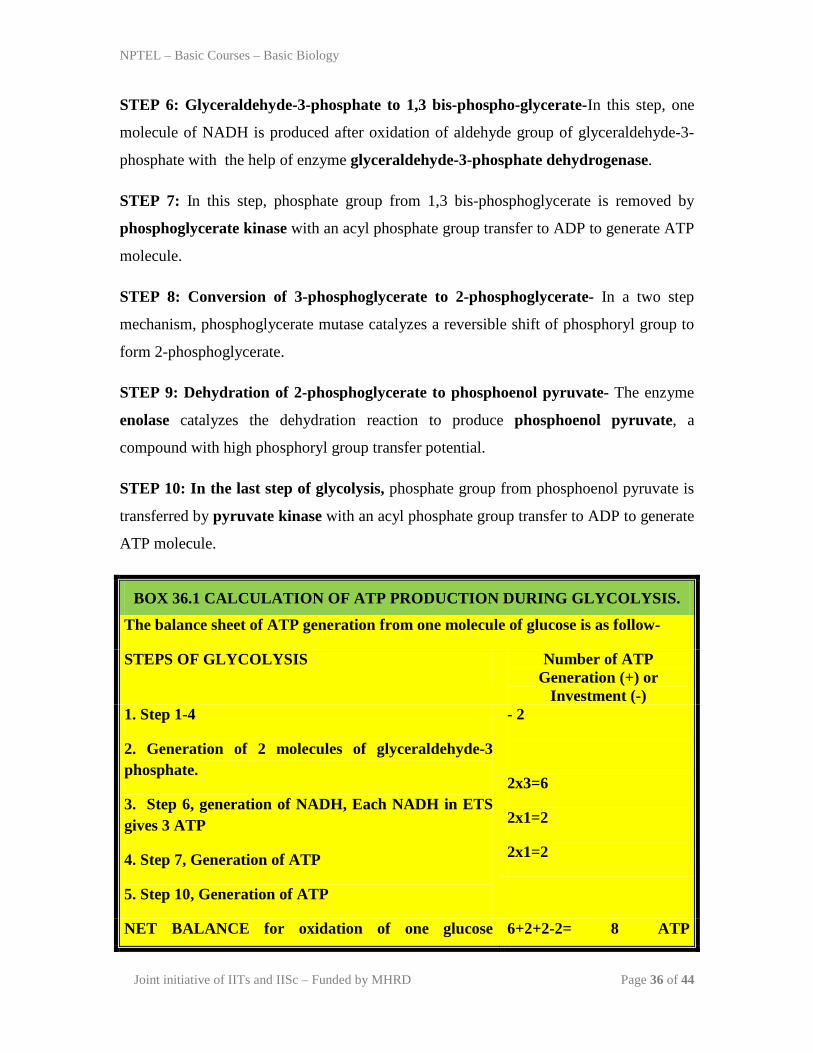
BOX 36.1 CALCULATION OF ATP PRODUCTION DURING GLYCOLYSIS.
The balance sheet of ATP generation from one molecule of glucose is as follow-
STEPS OF GLYCOLYSIS Number of ATP Generation (+) or
Investment (-) 1. Step 1-4
2. Generation of 2 molecules of glyceraldehyde-3 phosphate.
3. Step 6, generation of NADH, Each NADH in ETS gives 3 ATP
4. Step 7, Generation of ATP
5. Step 10, Generation of ATP
- 2
2x3=6
2x1=2
2x1=2
NET BALANCE for oxidation of one glucose 6+2+2-2= 8 ATP

NPTEL – Basic Courses – Basic Biology
Joint initiative of IITs and IISc – Funded by MHRD Page 37 of 44
molecule. molecules
Regulation of Glycolysis- 1. Uptake of glucose from blood-The level of glucose present in a cell determines the
availability of sugar for oxidation via glycolysis. Glucose transport in cell is regulated by
several cell surface receptor which are under the control of insulin (Figure 36.5). Insulin
upregulates the level of glucose transporters Glut-3 or Glut-4 and increase the uptake of
glucose from blood stream. In addition, insulin also regulates breakdown of glycogen to
increase the amount of available glucose.
Figure 36.5: Regulation of uptake of glucose in the cell through action of insulin and cell surface receptors.

NPTEL – Basic Courses – Basic Biology
Joint initiative of IITs and IISc – Funded by MHRD Page 38 of 44
2. Covalent Modification of Enzyme- Hexokinase, phosphofructokinase and pyruvate
kinase are key enzymes responsible for controlling glycolysis. Most of the typical protein
kinases are regulated by a reversible phosphorylation and dephosphorylation. In the
presence of low glucose in blood, pyruvate kinase is getting phosphorylated by cytosolic
enzymes and phosphoryated pyruvate kinase is less active. Similarly in the presence of
high blood glucose level, it remains as unphosphorylated and that relive the inhibition
caused by phosphorylation (Figure 36.6, A).
Figure 36.6: Regulation of glycolysis: (A) Covalent Modification (B) Alloteric regulation of enzymes of glycolysis.
3. Allosteric regulation- All the three crucial enzymes Hexokinase, phosphofructokinase
and pyruvate kinase of glycolysis are regulated allosterically (Figure 36.6, B). In an
allosteric regulation, an enzyme binds the allosteric molecules and this modulates the
activity of the enzyme either in positive or negative manner.In glycolysis, fructose 2,6 bis
phosphate is produced from fructose-6, phosphate by the enzyme phosphofructo kinase-2.
fructose 2,6 bis phosphate is allosterically activating the enzymatic activity of phospho
fructokinase (PFK-1) and the same time it is down regulating the activity of fructose 1,6
bis phosphatase. In addition, ATP and citrate is inhibiting the activity of phospho
fructokinase where as ADP and AMP is allosterically enhancing the enzymatic activitiy.

NPTEL – Basic Courses – Basic Biology
Joint initiative of IITs and IISc – Funded by MHRD Page 39 of 44
Lecture 37: Carbohydrate (Part-II)
Kreb Cycle: Kreb Cycle is discovered by professor Hans Kreb and as it has all sugar
intermediates with three carbon. it is also known as tricarboxylic acid or citric acid cycle.
In higher eukaryotes, kreb cycle operates inside the mitochondrial stroma with the
different enzymes. In the presence of oxygen, pyruvate formed during glycolysis enters
into the kreb cycle for further oxidation to produce energy. But pyruvate can not enter
directly into the kreb cycle, instead it needs further activation to form acetyl co-A.
Production of Acetyl-CoA: it is a oxidative decarboxylation from pyruvate to release
CO2 and generation of acetyl coA and reducing equivalent NADH. It is an irreversible
reaction catalyzed by pyruvate dehydrogenase complex. Similar to glycolysis,
irreversible decarboxylation commits the pyruvate for kreb cycle. In addition, acetyl-CoA
is the reaction intermediate in fat metabolism and works as feeder point for kreb cycle
(discussed more later).
Acetyl-CoA enters into the kreb cycle and undergoes a chain of 8 different reactions to produce energy. These steps are given in Figure 37.1.
STEP 1: Formation of citric acid- This reaction is catalyzed by citrate synthase where
acetyl coA condense with oxaloacetate to form citric acid. During the reaction, citronyl-
CoA is produced due to joining of acetyl CoA and oxaloacetate. This high energy
intermediate undergoes hydrolysis to form citrate.
STEP 2: Formation of isocitrate- The reversible transformation of citrate to isocitrate
with cis-aconitate as an intermediate.This reaction is catalyzed by aconitase.

NPTEL – Basic Courses – Basic Biology
Joint initiative of IITs and IISc – Funded by MHRD Page 40 of 44
STEP 3: Oxidation of Isocitrate to α-keto glutarate- This is the first step of kreb cycle
where CO2 is produced with an additional oxidative decarboxylation of iso-citrate to form
α-keto glutarate catalyzed by isocitrate dehydrogenase. One molecule of NADH is
generated which will give 3 ATP molecule after oxidative phosphorylation.
Figure 37.1: Different Reactions of Kreb Cycle.
STEP 4: Oxidation of α-keto glutarate to succinyl CoA-This is the second oxidative
decarboxylation to produce succinyl CoA and CO2 in the presence of α-ketoglutarate
dehydrogenase complex. One molecule of NADH is generated which will give 3 ATP
molecule after oxidative phosphorylation. α-ketoglutarate dehydrogenase is a multimeric
enzyme complex comprised of 3 enzymes, E1, E2 and E3.
NPTEL – Basic Courses – Basic Biology
Joint initiative of IITs and IISc – Funded by MHRD Page 41 of 44
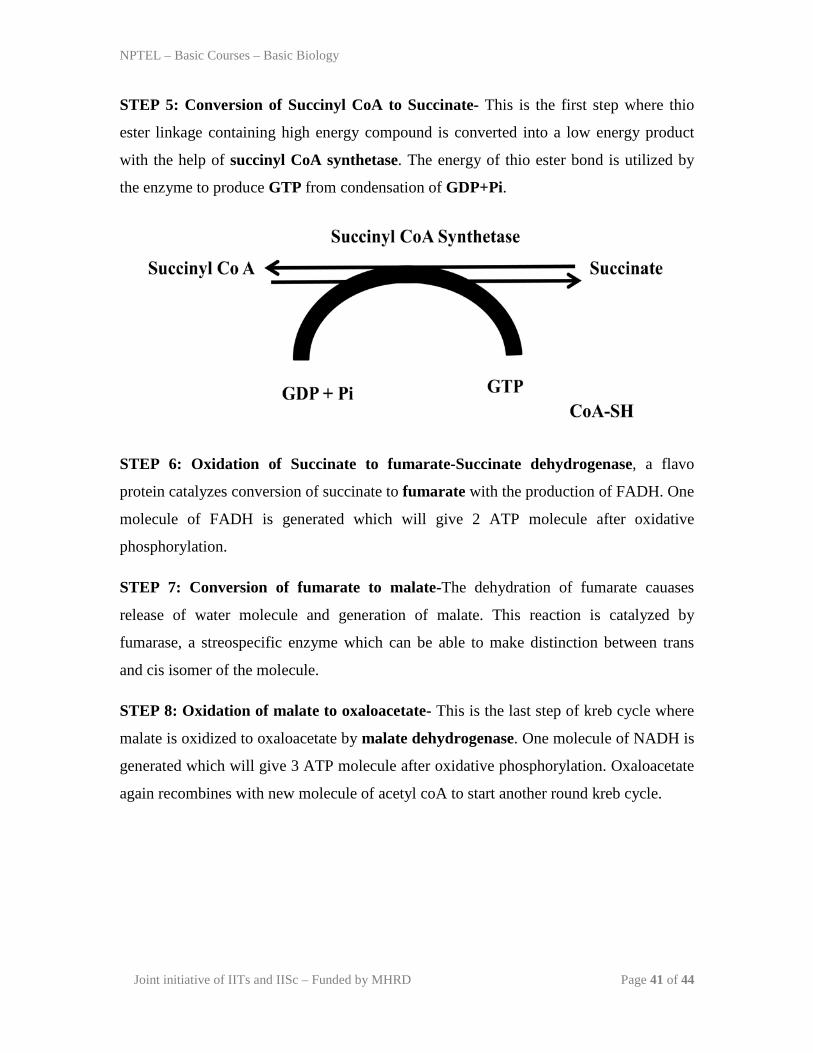
STEP 5: Conversion of Succinyl CoA to Succinate- This is the first step where thio
ester linkage containing high energy compound is converted into a low energy product
with the help of succinyl CoA synthetase. The energy of thio ester bond is utilized by
the enzyme to produce GTP from condensation of GDP+Pi.
STEP 6: Oxidation of Succinate to fumarate-Succinate dehydrogenase, a flavo
protein catalyzes conversion of succinate to fumarate with the production of FADH. One
molecule of FADH is generated which will give 2 ATP molecule after oxidative
phosphorylation.
STEP 7: Conversion of fumarate to malate-The dehydration of fumarate cauases
release of water molecule and generation of malate. This reaction is catalyzed by
fumarase, a streospecific enzyme which can be able to make distinction between trans
and cis isomer of the molecule.
STEP 8: Oxidation of malate to oxaloacetate- This is the last step of kreb cycle where
malate is oxidized to oxaloacetate by malate dehydrogenase. One molecule of NADH is
generated which will give 3 ATP molecule after oxidative phosphorylation. Oxaloacetate
again recombines with new molecule of acetyl coA to start another round kreb cycle.

NPTEL – Basic Courses – Basic Biology
Joint initiative of IITs and IISc – Funded by MHRD Page 42 of 44
Regulation of Kreb Cycle- There are 4 rate limiting steps in kreb cycle and the points where it can be regulated. These different steps are shown in Figure 6.2.
1. Conversion of pyruvate into the acetyl CoA is the first step which allow the entry of sugar moiety into the kreb cycle. Pyruvate dehydrogenase complex is allosterically inhibited by high ratio of ATP/ADP, NADH/NAD+ and acetyl CoA/CoA.
BOX 37.1 CALCULATION OF ATP PRODUCTION DURING KREB CYCLE.
The balance sheet of ATP generation from one molecule of glucose is as follows-
Steps of Kreb Cycle Number of ATP produced (+)
1. Production of Acetyl CoA
2. STEP 3, Generation of α-ketoglutarate
3. STEP 4, Generation of Succinyl CoA
4. STEP 5, Generation of GTP., GTP=ATP
5. STEP 6, Genration of fumarate, Generation of FADH,
6. STEP 8, Generation of oxaloacetate,
3x1=3
3x1=3
3x1=3
1x1=1
2x1=2
3x1=3
NET BALANCE for oxidation of one pyruvate molecule.
In glycolysis, two molecules of pyruvate is generated, hence total
be generated.
3+3+3+1+2+3=15 ATP molecules
2x15=30 molecules of ATP will
2. First reaction of kreb cycle, catalyzed by citrate synthase is inhibited by high level of NADH, ATP and succinyl-CoA.
3. Isocitrate dehyrogenase is inhibited by high level of ATP, NADH where as Ca2+ and ADP stimulate this step.
4. α-ketoglutarate dehydrogenase is inhibited by succinyl CoA and high level of NADH where as Ca2+ stimulate this step

NPTEL – Basic Courses – Basic Biology
Joint initiative of IITs and IISc – Funded by MHRD Page 43 of 44
In addition, rate of glycolysis indirectly regulates the kreb cycle through availability of
pyruvate in the feeding step. To maintain good co-ordination between two metabolic
pathways, citrate produced in first step of kreb cycle is an allosteric inhibitor of
phosphofructokinase-1 in the glycolytic pathway.
Significance of Kreb Cycle:
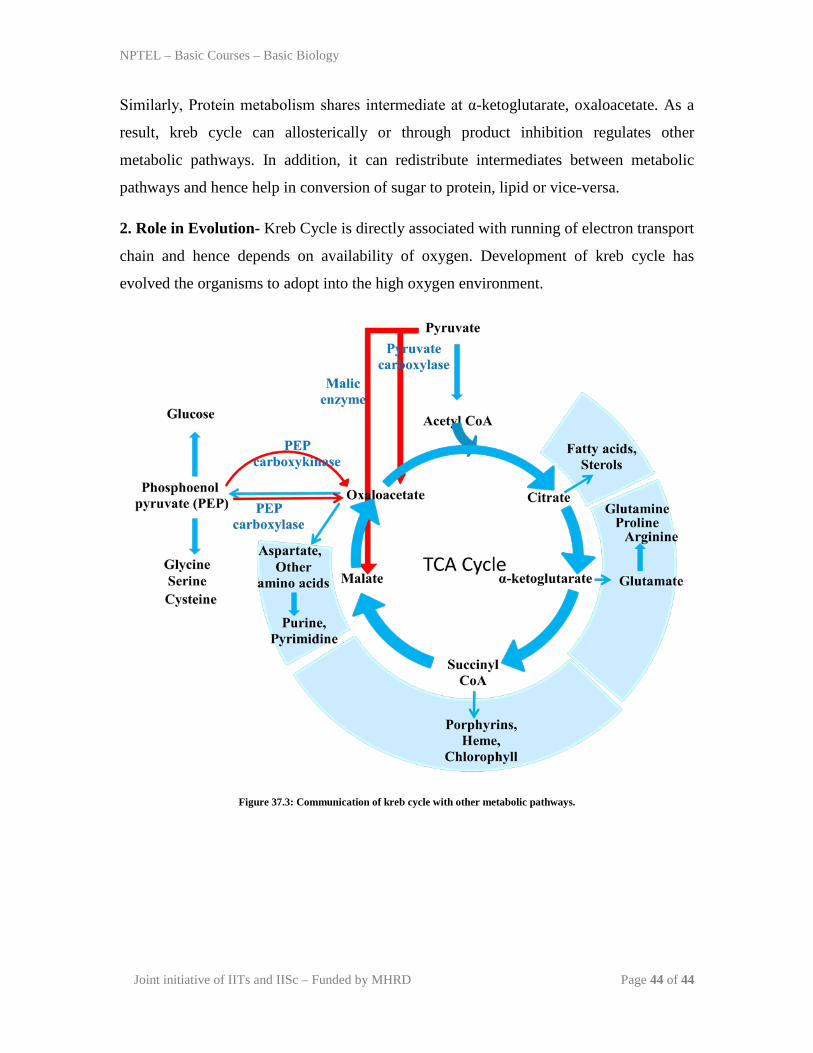
1. As a master regulator of metabolism- Kreb cycle is centrally connected to metabolic
intermediates of carbohydrate, protein and lipid metabolism (Figure 37.3). It has several
branching points where it can communicate with either protein or lipid metabolism. Lipid
metabolism is connected to kreb cycle through common intermediated as citrate and
acetyl Co-A.
Figure 37.2: Regulation of Kreb Cycle.
NPTEL – Basic Courses – Basic Biology
Joint initiative of IITs and IISc – Funded by MHRD Page 44 of 44
Similarly, Protein metabolism shares intermediate at α-ketoglutarate, oxaloacetate. As a
result, kreb cycle can allosterically or through product inhibition regulates other
metabolic pathways. In addition, it can redistribute intermediates between metabolic
pathways and hence help in conversion of sugar to protein, lipid or vice-versa.
2. Role in Evolution- Kreb Cycle is directly associated with running of electron transport
chain and hence depends on availability of oxygen. Development of kreb cycle has
evolved the organisms to adopt into the high oxygen environment.
Figure 37.3: Communication of kreb cycle with other metabolic pathways.