lecture notes: introduction to information theory
TRANSCRIPT

Lecture Notes:Introduction to Information Theory
Changho Suh1
December 4, 2019
1Changho Suh is an Associate Professor in the School of Electrical Engineeringat Korea Advanced Institute of Science and Technology, South Korea (Email:[email protected]).

EE623 Information Theory September 2, 2019KAIST, Fall 2019 Changho Suh ([email protected])
Lecture 1: Logistics and overview
About instructor
Welcome to EE623: Information Theory! My name is Changho Suh, an instructor of thecourse. A brief introduction of myself. A long time ago, I was one of the students in KAISTlike you. I spent six years at KAIST to obtain the Bachalor and Master degrees all fromElectrical Engineering in 2000 and 2002, respectively. And then I left academia, joining Samsungelectronics. At Samsung, I worked on the design of wireless communication systems like 4G-LTE systems. Spending four and a half years, I then left industry, joining UC-Berkeley where Iobtained the PhD degree in 2011. I then joined MIT as a postdoc, spending around one year.And then I came back to KAIST. While in Berkeley and MIT, I worked on a field, so calledinformation theory, which I am going to cover in this course. This is one of the main reasonsthat I am teaching this course.
Today’s lecture
In today’s lecture, we will cover two very basic stuffs. The first is logistics of this course: detailsas to how the course is organized and will proceed. The second thing to cover is a brief overviewto this course. In the second part, I am going to tell you a story of how the information theoryis developed, as well as what the theory is.
My contact information, office hours and TAs’ information
See syllabus uploaded on the course website. One special note: if you cannot make it neither formy office hours nor for TAs’ ones, please send me an email to make an appointment in differenttime slots.
Prerequisite
The basic prerequisite for this course is familiarity with the concept on probability and random
processes. In terms of a course, this means that you should have taken the following course:EE210, which is an undergraduate-level course on probability. This is the one that is offered inElectrical Engineering. Some of you from other departments might take a different yet equivalentcourse (e.g., MAS250). This is also okay.
There must be a reason as to why the concept of probability is crucial for this course. Hereis why. Information theory that we will cover in this course was developed in the context ofcommunication, which I am going to tell you with greater details in the second part of thislecture. So the communication is the field where one can see relationship between informationtheory and probability.
Now what is communication? Communication is the transfer of information from one end (calledtransmitter) to the other (called receiver), over a physical medium (like an air) between the twoends. The physical medium is so called the channel. Here the channel is the one that relatesthe concept of probability to communication. If you think about how the channel behaves,then you can easily see why. First of all, the channel is a sort of system (in other words, afunction) which takes a transmitted signal as an input and a received signal as an output. Hereone big problem arises in the system. The problem is that it is not a deterministic function.
1

If the channel is deterministic and one-to-one mapping, then one can easily reconstruct theinput from the output. So there is no problem in transferring information from the transmitterto the receiver. However, the channel is not deterministic in reality. It is actually a random
function. In other words, there is a random entity (also known as noise in the field) added intothe system. In typical communication systems, the noise is additive: a received signal is the sumof a transmitted signal and the noise. In general, we have no idea of the noise. In mathematicsor statistics, there is a terminology which indicates such a random quantity. That is, randomvariable or random process, which the probability forms the basis for. This is the very reasonthat this course requires a deep understanding on probability. Some of you may have no idea ofthe random processess although you took EE210. Please don’t be offended. It is nothing but asequence of random variables. Whenever the concept on random process comes up, I will providedetailed explanations and/or materials which serve you to understand the contents required.
If you think that you lack this prerequisite, then come and consult with me so that I can helpyou as much as possible. If you did not take this source, but if you took relevant courses heldin other departments, then probably it would be okay.
There is another important course which help understanding this course. That is EE528, whichis a course on random processes. This is a graduate-level course. It deals with the probability ina deeper manner and also covers many important concepts on random processes. So if you haveenough energy, passion and time, I strongly recommend you to take this course simultaneously.But notice that is not a prerequisite.
Course website
We have a course website on the KLMS system. You can simply login with your portal ID. Ifyou want to only sit in this course (or cannot register the course for some reason), please letme or one of TAs know your email address. Upon request, we are willing to distribute coursematerials to the email address that you sent us.
Text
The course consists of three parts. A textbook that we will use for the first and second partsis: Cover and Thomas’s book, which is the most renowned text in the field, titled “Elements ofInformation Theory.” I am going to call it CT for short. We will also use a celebrated paperwritten by the Father of Information Theory: Claude E. Shannon. Here is the title of the paper:“A mathematical theory of communication”. We will also use lecture notes by Prof. Robert G.Gallager, which we are going to use for the first few weeks. You can download them from thecourse website. On top of these three, I am going to provide you with lecture slides which I willuse during lectures, as well as course notes like the one that you are now reading. Perhaps thesematerials will be posted at night on a day before class.
There is no textbook for the last part. But don’t worry. I will instead provide you with lectureslides and course notes which contain every details and thus are self-contained. Reading thesematerials would suffice for you to understand all the contents covered in the last part.
Problem sets
There will be weekly or bi-weekly problem sets. So there would be seven to eight problem setsin total. Solutions will be usually available at the end of the due date. This means that inprinciple, we do not accept any late submission. We encourage you to cooperate with each otherin solving the problem sets. However, you should write down your own solutions by yourselves.
2

You are welcome to flag confusing topics in the problem sets; this will not lower your grade.
Exams
As usual, there will be two exams: midterm and final. Please see syllabus for the schedule thatour institution assigns by default. Please let us know if someone cannot make it for the schedule.With convincing reasons, we can change the schedule or can give a chance for you to take anexam in a different time slot that we will organize individually.
Two things to notice. First, for both exams, you are allowed to use one cheating sheet, A4-sizedand double-sided. So it is a kind of semi-closed-book exam. Second, for your convenience, wemay provide an instruction note for each exam (if you wish), which contains detailed guidelinesas to how to prepare for the exam. Such information includes: (1) how many problems are in theexam; (2) what types of problems are dealt with in what contexts; (3) the best way to preparefor such problems.
Course grade
Here is a rule for the course grade that you are mostly interested in perhaps. The grade will bedecided based on four factors: problem sets (22%); midterm (32%); final (40%); and interaction(6%). Here the interaction means any type of interaction. So it includes attendance, in-classparticipation, questions, and discussion.
Overview
Now let’s move onto the second part. Here is information for reading materials: Chapter 1 inGallager’s notes, Shannon’s paper, and Chapter 2 in CT. In this part, I will tell you how theinformation theory was developed and what the theory is. As I mentioned earlier, informationtheory was developed in the context of communication. So first I am going to tell you how theinformation theory was developed in that context. Perhaps next time, I will provide you withspecific topics that we will learn throughout the course.
History of communication systems
To talk about a story of how information theory was developed, we need to first know about thehistory of communication systems which in turn led to the foundation of information theory.Before getting into details, recall the terminologies that I mentioned earlier. Remember thatcommunication is the transfer of information from one end to the other end. Here the one endis called transmitter, and the other end is called receiver. Something that lies in between is aphysical medium, called the channel.
As you can easily image, communication has a long history. Even in the beginning of the world,there was a communication, which is a dialogue between people. The dialogue, also called con-versation, is definitely a type of communication although it is a very naive way of communicationand has nothing to with electrical engineering. Actually there was a breakthrough in the historyof communication, which is now related to the communication systems that have something todo with electrical engineering and so we are interested in. This breakthrough was the inven-tion of telegraph. Morse code1 is the first such example: a very simple transmission schemethat is initially used in telegraph. Actually this invention was based on a simple observation(discovered in physics) that electrical signals, like voltage or current signals can be transmitted
1Regarding the code, don’t be confused with computer programming languages (such as C++ and Python) thathave nothing to do with it. Code is a sort of terminology used in the context of communication which indicates atransmission scheme.
3

over wires such as copper lines. So it is the first communication system that have something todo with electrical signals. Actually this is the main reason as to why communication systemshave been studied within the field of electrical engineering where most of you guys are in. Laterthis technology was further developed. In the 1870s, Alexander Graham Bell invented a moreadvanced version of such systems, called telephone.
Communication systems were further upgraded. The upgrade was based on another finding inphysics: not only we can send electrical signals over wires, but we can also send them in awireless environment through electromagnetic waves, simply called radio waves. This findinginspired an Italian engineer at that time, named Guglielmo Marconi. He developed a wirelessversion of telegraph, called wireless telegraphy. Later this technology was further developed,which led to the invention of radio and TV.
State of the affairs in early 20th century
These are the communication systems that were developed in the early 20th century: telegraph,telephone, wireless telegraph, radio and TV. Actually at this time, there was one guy who couldmake some interesting observations on these communication systems, which in turn made himdo some great work in communication. The guy was Claude E. Shannon, known as the Fatherof Information Theory. He made the following two observations.
The first is that most communication systems at that time are analog. They directly dealtwith signals of interest. For example, in radio systems, signals of interest are audio waveforms.In TV, such interested signals are image pixels. Obviously these are analog continuous signalsbecause the signals are based on voltage or current signals which are definitely analog.
The second observation that he made is that engineering designs are pretty ad-hoc, being tai-lored for each specific application. This means that design principles were completely differentdepending on signals of interest.
Claude E. Shannon
What he felt from such observations is that such communication systems are really annoying.He did not like the communication systems because such systems are designed in a pretty ad-hoc manner (no systematic design principle!), in other words, in a completely different mannerdepending on each specific application of interest. He actually believed that there must beone simple & beautiful framework that can unify all such different communication systems. Sohe tried to unify the ad-hoc approach. As a specific effort, he raised the following three bigquestions.
Shannon’s three big questions
The first question is the most fundamental question regarding the possibility of unification.
Question 1: Is there a general unified methodology for designing communication systems?
The second question is a natural follow-up question which helps addressing the first question.He thought that if unification is possible, then there may exist a common currency (like dollar inthe context of economics) w.r.t. (with respect to) information. In the communication systems,we have a variety of different information sources, like text, voice, video, images. The secondquestion that he asked is related to the existence of such common currency.
Question 2: Is there a common currency of information that can represent all such different
information sources?
4

The last question is with respect to the task of interest: communication.
Question 3: Is there a limit to how fast one can communicate?
He had spent around eight years to address the above questions. Perhaps he had quite a difficulttime as the long period of eight years indicates. But he could make a progress in the end. Hecould address all the big questions in a single stroke. In the process of doing this, he coulddevelop a theory, later people call “information theory”.
What Shannon did
Specifically what he did are three-folded. First of all, he showed that the answer to the secondquestion is yes! He came up with a common currency of information that can represent all ofdifferent types of information sources. And then based on the common currency, he addressedthe first question. He developed a single beautiful framework that can unify all such differentcommunication systems that were prevalent in the days. Under this unified framework, hethen answered the last question. He demonstrated that there exists a limit on the amount ofinformation (represented in terms of the common currency - to be detailed later) that one canmaximally communicate. Not only that, he could also characterize the limit.
Especially in the process of characterizing the limit, he could make an interesting observationthat the limit is a sole function of a channel, regardless of any transmission and receptionstrategy. This means that given a channel, there exists a fundamental limit on the amountof information that we can transmit under which communication is possible, and below whichcommunication is impossible no matter what and whatsoever. This quantity is never changedgiven a channel. It is like a fundamental law that is dictated by the Nature. So it is like alaw in physics. Shannon was excited about this. So he theorized the law in a mathematicalframework, and called it “a mathematical theory of communication”, which became the title ofhis landmark paper. Later people call it information theory or Shannon theory.
Looking ahead
Next time, I will tell you how Shannon could do such things. Then, I am going to tell you whatspecific topics we are going to cover in this course.
5

EE623 Information Theory September 4, 2019KAIST, Fall 2019 Changho Suh ([email protected])
Lecture 2: Overview
Recap
Last time I told you about a story of how Claude Shannon came up with information theory. Thestory dates back to the early 20th century when a variety of different communication systemsare prevalent. Motivated by the fact that most of communication systems at that time weredesigned in an ad-hoc manner, Shannon intended to develop a single framework that can unifyall the different systems. To this end, he first came up with a common currency of information.Using this, he then established a unified framework. Based on the framework, he characterizedthe limit to how fast one can communicate. In the process of doing this, he was particularlyexcited by the fact that given a channel determined by the Nature, the limit does not change nomatter what transmitter and receiver do.
Shannon theorized all of these in a single mathematical framework. He then called it “a math-ematical theory of communication”, which people later called information theory or Shannontheory. This was how information theory was invented.
Today’s lecture
Today we are going to go a little bit deeper. Specifically I will tell you how Shannon did all ofthese in detail. Based on this, I will then list up specific topics that we are going to cover inthis course.
Communication architecture
Recall the three terminologies that we introduced last time: transmitter, receiver, and somethingthat lies in between transmitter and receiver, which is the channel. Now consider informationsignals that one wishes to transmit, such as text, voice, and image pixels. Here is anotherterminology which indicates such signals: “information source”. What Shannon thought inthe first place is that there must be something which processes the information source beforetransmission. He abstracted this process with a black box that he called “encoder”. Of coursethere must be something at receiver which attempts to recover the information source from thereceived signals that the channel yields. He abstracted the process at the receiver end withanother black box that he called “decoder”. This is the very first basic block diagram thatShannon imagined for a communication architecture. See Fig. 1. From a Shannon’s viewpoint,a communication system is nothing but a collection of encoder and decoder, so designing acommunication system is concerning how to develop such encoder and decoder.
encoder channelinformation
sourcedecoder
transmitter receiver
Figure 1: A basic communication architecture.
1

Representation of information source
With this simple picture in his mind, Shannon wished to unify all the different communicationsystems that were prevalent in the early 20th century. Most engineers at that time attempted totransmit information sources (which are of course different depending on applications of interest)directly without any significant modification. Shannon thought that this is the very reason asto why there were different communication systems.
He then thought that for the purpose of unification, there must be at least something thatcan represent different information sources. He believed that the common thing would leadto a universal framework. It turns out Shannon’s work on master thesis in MIT could play asignificant role to find a universal way of representing information source. His master thesiswas about Boolean algebra. What he did specifically is that any logical relationship in circuitsystems can be represented with 0/1 logic, in other words, binary string.
Inspired by this, Shannon thought that the same thing may happen in the context of commu-nication systems, meaning that any type of information source can be represented with binarystring. He showed that it is indeed the case. Specifically what he showed is that the binarystring that he called “bits” can represent the meaning of information.
For instance, suppose that information source is an English text that comprises English letters.Now how to represent each English letter with a binary string? Here one key observation is thatthere are only a finite number of candidates that each letter can take on. This number is thetotal number of English alphabets, which is 26.1 From this, we see that dlog2 26e = 5 numberof bits suffices to represent each letter.
A two-stage architecture
This observation led Shannon to introduce bits as a common currency of information. Specificallyhere is what he did. He first thought that we need a block which converts information sourceinto bits of our interest. Motivated by this, Shannon came up with a two-stage architecture inwhich the encoder is split into two parts. Here the role of the first block is to convert informationsource into bits. Shannon called the block “source encoder”, as it is a part of the encoder aswell as is related to how information source looks like. The role of the second block is to convertbits into a signal that can actually be transmitted over a channel. Shannon called it “channelencoder” because it is obviously concerning a channel. See the upper part in Fig. 2.
Similarly, receiver consists of two stages. But the way it is structured is opposite. In otherwords, we first convert the received signals into the bits that we sent at the transmitter (channeldecoder). Next, we reconstruct the information source from the bits (source decoder). As youcan see, this block is nothing but an inverse function of source encoder. Obviously source encodershould be one-to-one mapping; otherwise, there is no way to reconstruct the information source.See the lower part in Fig. 2.
Actually there is a terminology which indicates the part spanning from channel encoder, channel,to channel decoder. We call it “digital interface”. Here one thing to notice is that this digitalinterference is universal in a sense that it has nothing to do with type of information sourcebecause the input to the digital interference is always bits. So in that regard, it is indeed aunified communication architecture.
Two questions on the fundamental limits
1Here we ignore any special characters such as space.
2

channel
information
source
transmitter
receiver
bitssource
encoder
channel
encoder
bitssource
decoder
channel
decoder
digital interface
Figure 2: A two-stage communication architecture.
Keeping the two-stage architecture in his mind, Shannon tried to address the third question: isthere a limit to how fast one can communicate? To this end, Shannon first thought about thegoal of communication: transferring information as much as possible. Actually if informationsource itself is bits, then we only need to worry about the maximum number of bits that can betransmitted over a channel. But here notice in the two-staged architecture that we have anotherblock in front, that is, source encoder which converts the information source into bits.
This naturally led him to worry about efficiency of the first block. In order to maximizethe amount of information to send, first we need to minimize the number of bits that canrepresent the information source. This led Shannon to worry about what the most efficient wayof representing the information source is.
To make this more explicit, Shannon split the question on the limit into two. The first is aboutefficiency of the first block. What is the minimum number of bits that can represent informationsource? The second question is about transmission capability. What is the maximum numberof bits that can be transmitted over a channel?
Shannon developed two theorems to answer the two questions. He first developed a theoremthat he called “source coding theorem” to identify what the minimum number of bits is. He alsodeveloped another theorem that he called “channel coding theorem”, in which the maximumtransmission capability is characterized.
Source coding theorem
Let us first explore what the source coding theorem is. Information source is a kind of sequence.For example, it is a sequence of English alphabets, a sequence of audio signals, or a sequenceof image pixels. Let that sequence be {Si}. Actually one important view that Shannon took isthat he interpreted this sequence as a sequence of random quantities, in other words, a sequenceof random variables, or simply a random process. The rationale behind this viewpoint is thatthe information source is the one that has uncertainty from a receiver perspective. Note that itis unknown to the receiver. Then, one can readily expect that the minimum number of bits thatrepresent the random process depends on the probabilistic property that the random processhas: joint distribution.
For simplicity, let’s think about a simple case in which the joint distribution of the random pro-cess is greatly simplified. One such case is the one in which Si’s are independent and identicallydistributed, simply called the i.i.d. case. It turns out in this case, the source coding theorem is
3

very simple to state.
Let S be a generic random variable which indicates an individual random variable that forms therandom process. In the source coding context, each random variable is called “symbol”. It turnsout the minimum number of bits is related to one important notion that is very well-known inother fields such as physics and chemistry. That is “entropy”. The entropy is a kind of measureof disorder or randomness. It turns out this measure plays a crucial role to establish the sourcecoding theorem, formally stated below.
Theorem 0.1 (Source coding theorem in the i.i.d. case) The minimum number of bitsthat can represent the source per symbol is the entropy of the random variable S, denoted by
H(S) :=∑s∈S
p(s) log21
p(s). (1)
where p(s) denotes the distribution2 of S, and S (that we call “caligraph of S”) indicates therange, which is the set of all possible values that S can take on.
Source code example
To give you a concrete feel about why the source coding theorem makes sense, let me give youa source code example in which one can achieve the limit promised as (1). The design of sourcecode means the specification of functional relationship between input S and output, say f(S), inthe source encoder. In the source coding context, such output f(S) is called “codeword”. Let’sthink about a simple case in which the information source is DNA sequence where each symbolS can take on one of the four letters: A,C, T,G. For simplicity, let’s assume an unrealisticyet simple setting in which the random process {Si} is independent and identically distributed(i.i.d.), each Si being according to the following distribution:
S =
A, with probability (w.p.) 1
2 ;C, w.p. 1
4T, w.p. 1
8 ;G, w.p. 1
8 .
Now the question is: how to design f(S) such that the number of bits that represents S, reflectedin the average length of codeword E[f(S)], is minimized? Note that there are four letters intotal. So it suffices to use two bits to represent each symbol. One naive way is to take thefollowing simple mapping rule: A→ 00; C → 01; T → 10; G→ 11. This way, we can achieve 2bits/symbol. But the source coding theorem says that we can actually do better, as the claimedlimit reads:
H(S) =1
2· 1 +
1
4· 2 +
1
8· 3 +
1
8· 3 = 1.75. (2)
As the theorem promised, there is indeed a code that can achieve the limit. The code is basedon the following observations: (i) the letter A occurs more frequently than other letters; (ii) thelength of codeword is not necessarily fixed. This naturally leads to an idea: assigning a short-length codeword to frequent letters while assigning a long-length codeword to less frequentletters. Now the question is how to implement such an idea? For visualization purpose, let usintroduce a so-called “binary code tree” with which one can easily implement a mapping fromS to f(S).
2It is a probability mass function, simply called pmf, for the case where S is a discrete random variable.
4

Binary code tree: A binary tree is the one in which every internal node has only two branches.Notice that a node which has no branch is called the leaf. See an example in Fig. 3. Now let merelate the binary tree to a code. Suppose we assign a symbol to a leaf. We can then establishthe functional relationship by specifying the pattern of the corresponding codeword as follows:the sequence of binary labels (associated with branches) from the root to that leaf. For example,suppose we label 0 on an upper branch, 1 on a lower branch, and assign a symbol A to the topleaf. Then, f(A) = 0, as we have only one branch, labeled 0, that links the root to the leaf.Similarly f(C) = 10. Note that there are two branches (labeled 1 and 0 subsequently) whichconnect the root to the leaf assigned to C.
Figure 3: Representation of an optimal source code via a binary code tree.
Now how to implement an optimal mapping rule (which achieves 1.75 bits/sym) via a binarycode tree. As mentioned earlier, the idea is to assign a short-length codeword to frequent letters.Obviously we should assign the most frequent letter A to the top leaf, since it has the shortestcodeword length. Now what about for the second most frequent letter C? One may want toassign it to an internal node marked in a blue square in Fig. 3. But it is not valid. Why?That way, the codeword pattern ran out - this is problematic because we have only two leavesalthough we need four in total. So we must have another two branches generating from theinternal node. We can then assign the C to the second top leaf of codeword length 2. Similarlythe next frequent letter T (or G) cannot be assigned to a follow-up internal node marked in ared triangle in Fig. 3. So the node should have another set of two branches. The remainingletters T and G are now assigned to the two remaining leaves. With this mapping rule, one canreadily see that
E[length(f(S))] = Pr(S = A)length(f(A)) + Pr(S = C)length(f(C))
+ Pr(S = T )length(f(T )) + Pr(S = G)length(f(G))
=1
2· 1 +
1
4· 2 +
1
8· 3 +
1
8· 3 = 1.75 = H(S).
Channel coding theorem
Now let us move onto the channel coding theorem. It says that the maximum number of bitsthat can be transmitted over a channel is the capacity denoted by C. There is a mathematicaldefinition for such C. In fact, the definition relies on a bunch of concepts and notions that
5

we will need to study. One such important notion is “mutual information.” We will deal withdefinitions of those later on.
Course outline
The two theorems are parts of the main topics that we are going to cover in this course. Specif-ically, the course consists of three parts. In Part I, we will study basic concepts on key notionsin the field: (i) entropy (which played a fundamental role in establishing the source coding the-orem); (ii) mutual information (a crucial notion for the channel coding theorem); (iii) Kullback-Leibler (KL) divergence (another key notion which plays a similar role with mutual informationyet is known to more powerful in a widening array of other disciplines such as statistics, math-ematics, and machine learning). In Part II, we will prove the two major theorems using thenotions of entropy and mutual information. It turns out information theory can serve to addresssome important issues that arise in a wide variety of fields, not limited to communication, rang-ing from data science, computational biology, recently to machine learning and deep learning.In Part III, we will explore applications of information theory in machine learning and deeplearning. In particular, we will focus on the roles of the above key notions in the design ofsupervised and unsupervised learning algorithms.
6

EE623 Information Theory September 9, 2019KAIST, Fall 2019 Changho Suh ([email protected])
Lecture 3: Entropy
Recap
During the past lectures, I told you about a story of how Shannon came up with informationtheory. Shannon’s effort was initiated by a strong motivation for unifying distinct communicationsystems that were prevalent in the early 20th century. As an initial step towards unification,he introduced bits as a means to represent possibly different information sources and thenproposed a unified two-stage architecture in which the first block converts an information sourceinto bits and the second block generates a signal that can actually be transmitted over a channel.Within this framework, Shannon quantified the limit on the amount of information that one cancommunicate. In the process of doing this, he established two fundamental theorems which inturn laid the foundation of information theory. The first is the source coding theorem whichdemonstrates that the minimum number of bits that can represent an information source isthe entropy of the source. The second is the channel coding theorem which characterizes themaximum number of bits that can be transmitted over a channel.
Today’s lecture
Prior to proving the source and channel coding theorems which we are going to cover in depthin Part II, we will first study four key notions which form the basis of the theorems : (i) entropy;(ii) mutual information; (iii) Kullback-Leibler (KL) divergence; (iv) cross entropy. It turns outthese notions play a crucial role to address important issues that arise in a widening array ofother disciplines such as statistics, physics, computational biology and machine learning. So itis worthwhile being familiar with detailed properties about the notions for many purposes.
Today we will study in depth about the first notion: Entropy. Specifically what we are going todo are three folded. First we will review the definition of entropy that we already introducedlast time. I will then introduce a couple of intuitive interpretations on the meaning of entropy,which may help us to understand the source coding theorem as to why the limit on the numberof bits required to represent the information source must be the entropy. Next we will studysome key properties which are useful in a variety of contexts not limited to the source codingtheorem. Later in Part II you will see how the entropy comes up in the proof of the sourcecoding theorem. Please be patient until I show you such connection.
Definition of entropy
The entropy is defined with respect to (w.r.t.) a random quantity which has uncertainty. Moreformally, it is concerned about a random variable or a random process depending on the dimen-sion of a random quantity. For simplicity, let us focus on a simple case in which the randomquantity is a random variable. Later we will cover a general case dealing with a random process.
More precisely the entropy is defined w.r.t. a discrete1 random variable. Let X be a discreterandom variable and p(x) be its probability mass function (pmf). Let X (that we call “caligraph
1We say that a random variable is discrete if its range (the set of values that the random variable can take on)is finite or at most countably infinite. See Ch. 2.1 in BT for details.
1

ex”) be its range: the set of values that X can take on. The entropy is defined as:
H(X) :=∑x∈X
p(x) log21
p(x)bits. (1)
In this course, mostly we will use only one type of a logarithmic function, that is log base 2. Forsimplicity, we will drop the “2” throughout the course.
Actually there is an alternative expression for the entropy formula that I strongly recommendyou to remember. It is the one which is much simpler and thus easy to remember. In addition, ithelps greatly simplifying the proof of some important properties that we are going to investigatelater on. Note that the entropy is sort of a weighted sum of log 1
p(x) . So it can be representedas:
H(X) := E[log
1
p(X)
]. (2)
where the expectation is taken over the distribution of X: p(x).
Interpretation #1
Actually there are some well-known interpretations on the meaning of the entropy which arequite intuitive and therefore can give some insights into why the entropy is related to the limitpromised by the source coding theorem. Here we will investigate two of them. The first is:
Entropy is a measure of the uncertainty of a random quantity.
Let me give you a concrete example where we can see this interpretation makes sense. Considertwo experiments: (i) tossing a fair coin; (ii) rolling a fair dice. One simple random variable thatone can naturally think of for the first experiment is a function that maps the head (or tail)event to 0 (or 1). Since the coin is fair, we have:
X =
{0, w.p. 1
2 ;1, w.p. 1
2 ,
where “w.p” stands for “with probability”. On the other hand, a natural random variable inthe second experiment is a function that maps a dice result to the same number, which in turnyields:
X =
1, w.p. 16 ;
2, w.p. 16 ;
3, w.p. 16 ;
4, w.p. 16 ;
5, w.p. 16 ;
6, w.p. 16 .
Now which random variable is more uncertain, in other words, more random? Your intuitionpoints to the second one! No wonder. Actually the entropy supports your answer with explicitnumbers. Note that H(X) = 1 in the first experiment while H(X) = log 6 > 1 in the latter.Entropy can indeed quantify such uncertainty.
Let me give you another example. Suppose now we have a bent coin. Then, it yields a differenthead event probability, say p 6= 1
2 :
X =
{0, w.p. p;1, w.p. 1− p. (3)
2

Now the question is: Does this random variable has more uncertainty, compared to the fair coincase? To see this clearly, consider an extreme case in which p� 1 and thus:
H(X) = p log1
p+ (1− p) log
1
1− p≈ 0. (4)
Here we used the fact that limp→0 p log 1p = 0. Why? Remember the Lopital theorem that you
learned about from the course on calculus. This implies that the bent-coin case is definitelymore certain. This makes sense. Why? Very small p (� 1) means that the tail event happensalmost all the time, and thus the result is well predictable.
Interpretation #2
The second interpretation is related to a common way of removing uncertainty. What doesthis mean? Let me give you an example. Suppose we meet a person for the first time. Thenthe person is completely unknown to us. Here we can think of a common way to remove suchrandomness: asking questions. With answers to the questions, we can then somehow removerandomness w.r.t. him/her. With enough questions, we may have complete knowledge abouthim/her. So from this, we see that the number of questions required to have complete knowledgerepresents the amount of randomness: the more questions required, the more uncertain. Thisnaturally leads to:
Entropy is related to the number of questions required to determine the value of X.
Sometimes the number of questions (on average) exactly matches H(X). Here is an examplewhere that happens. Suppose
X =
1, w.p. 1
2 ;2, w.p. 1
4 ;3, w.p. 1
8 ;4, w.p. 1
8 .
A straightforward calculation gives H(X) = 1.75. Now suppose that questions are of the yes-or-no type. Then, the minimum number of questions (on average) required to determine thevalue of X is H(X). Here is the optimal way of asking questions that achieves H(X). We firstask whether or not X = 1. If yes, X = 1; otherwise, we ask if X = 2 or not. If yes, X = 2;otherwise we ask if X = 3 or not. Let f(x) be the number of questions when X = x. Then, thisway yields:
E [f(X)] =1
2f(1) +
1
4f(2) +
1
8f(3) +
1
8f(4)
=1
2· 1 +
1
4· 2 +
1
8· 3 +
1
8· 3 = 1.75.
Some of you may recognize that this is the same as the source code example that we examinedlast time.
Key properties
The entropy has several important properties. We can identify those properties by making someimportant observations.
Recall the bent-coin example. See (??) for the distribution of the associated random variableX. Consider the entropy calculated in (??). First we note that the entropy is a function of pwhich fully describes X. See Fig. ?? which plots H(X) as a function of p. From this, one can
3

Figure 1: Entropy of the binary random variable X with Pr(X = 0) = p and Pr(X = 1) = 1− p
make two observations: (i) the minimum entropy is 0; (ii) the entropy is maximized when p = 12 ,
i.e., X is uniformly distributed.
Consider another example in which X ∈ X = {1, 2, . . . ,M} and is uniformly distributed:
X =
1, w.p. 1
M ;2, w.p. 1
M ;...M, w.p. 1
M .
In this case,
H(X) =∑ 1
MlogM = logM = log |X |
where |X | indicates the cardinality (the size of the set) of X . This leads to another observation:the entropy of the uniformly distributed random variable X ∈ X is log |X |.The above three observations lead us to conjecture the following two: for X ∈ X ,
Property 1: H(X) ≥ 0.
Property 2: H(X) ≤ log |X |.
It turns that these properties indeed hold. The first is easy to prove. Using the definition ofentropy and the fact that p(X) ≤ 1, we get: H(X) = E[log 1
p(X) ] ≥ E[log 1] = 0. The proofof the second property is also easy once we rely on one of the very popular inequalities calledJensen’s inequality2, formally stated below.
Theorem 0.1 (Jensen’s inequality) For a concave3 function f(·),
E [f(X)] ≤ f (E[X]) .
Proof: The proof is immediate for a simple binary case, say X ∈ X = {x1, x2}. Bysetting p(x1) = λ and p(x2) = 1 − λ, we get: E[X] = λx1 + (1 − λ)x2 and E[f(X)] =λf(x1) + (1−λ)f(x2). Now the definition of the concavity (see the associated footnotefor the definition or Fig. ??) completes the proof. The generalization to an arbitraryX is not that hard. The idea is by induction. Try this in Problem Set 1. �
4

Figure 2: Jensen’s inequality for a concave function: E[f(X)] ≤ f(E[X])
Using the definition of entropy and the fact that log is concave, we get:
H(X) = E[log
1
p(X)
]≤ log
(E[
1
p(X)
])= log
(∑x∈X
p(x) · 1
p(x)
)= log |X |
where the inequality is due to Jensen’s inequality.
Joint entropy
Now let’s move on to the entropy defined w.r.t. multiple (say two) random variables. It is said tobe the joint entropy as it involves multiple quantities, and is defined as follows: for two discreterandom variables, X ∈ X and Y ∈ Y,
H(X,Y ) :=∑x∈X
∑y∈Y
p(x, y) log1
p(x, y).
We see that the only distinction w.r.t. the single random variable case is that the joint distri-bution p(x, y) comes into picture. Similarly, an alternative expression is:
H(X,Y ) = E[log
1
p(X,Y )
]where the expectation is now taken over p(x, y).
Chain rule2Jensen’s inequality is one of the most well-known inequalities widely used in mathematics, as well as the one
that underlies many of the basic results in information theory.3We say that a function f is concave if for any (x1, x2) and λ ∈ [0, 1], λf(x1)+(1−λ)f(x2) ≤ f(λx1+(1−λ)x2).
In other words, for a concave function, the weighted sum w.r.t. functions evaluated at two points is less than orequal to the function at the weighted sum of the two points. See Fig. ??.
5

There is a key property regarding the joint entropy, called the chain rule, which shows therelationship between the multiple random variables. For the two random variable case, it reads:
Property 3 (chain rule): H(X,Y ) = H(X) +H(Y |X)
where H(Y |X) is so called conditional entropy and defined as:
H(Y |X) :=∑x∈X
∑y∈Y
p(x, y) log1
p(y|x)= E
[1
p(Y |X)
]
where the expectation is taken over p(x, y). The proof of the chain rule is straightforward:
H(X,Y ) = E[log
1
p(X,Y )
](a)= E
[log
1
p(X)p(Y |X)
](b)= EX,Y
[log
1
p(X)
]+ E
[log
1
p(Y |X)
](c)= EX
[log
1
p(X)
]+ E
[log
1
p(Y |X)
]= H(X) +H(Y |X)
where (a) follows from the definition of the conditional distribution (see Ch. 1 & 2 in BT); (b)follows from linearity of expectation; (c) follows from
∑y∈Y p(x, y) = p(x) (why?). The last step
is due to the definition of entropy and conditional entropy.
Here we provide an interesting interpretation on the chain rule. Remember that entropy is ameasure of uncertainty. So we can interpret Property 3 as follows. The uncertainty of (X,Y )(reflected in H(X,Y )) is the sum of the following two: (i) the uncertainty of X (reflected inH(X)); (ii) the uncertainty that remains in Y given X (reflected in H(Y |X)). See Fig. ?? forvisual illustration. By mapping the area of a Venn diagram to the amount of uncertainty w.r.t.an associated random variable, we see that the interpretation makes sense. Here the area ofthe blue circle indicates H(X); the area of the red part denotes H(Y |X); and the entire areaindicates H(X,Y ).
Figure 3: A Venn diagram interpretation of the chain rule.
Lastly let me leave one remark on conditional entropy. Another way of expressing conditional
6

entropy (which I strongly recommend you to remember) is:
H(Y |X) =∑x∈X
∑y∈Y
p(x, y) log1
p(y|x)
=∑x∈X
p(x)∑y∈Y
p(y|x) log1
p(y|x)
=∑x∈X
p(x)H(Y |X = x)
where the last equality is due to the conventional definition of:
H(Y |X = x) :=∑y∈Y
p(y|x) log1
p(y|x).
Here H(Y |X = x) is the entropy defined w.r.t. Y when X = x. So the conditional entropycan be interpreted as the weight sum of H(Y |X = x), which sort of helps you to remember theformula as well as to provide an easy way to calculate.
Look ahead
We are now ready to prove the source coding theorem, but not for channel coding theorem. AsI mentioned earlier, the proof of the channel coding theorem requires the concept on anothernotion: mutual information. So next time we will study details on mutual information, rangingfrom its definition to several key properties which serve to prove the theorem as well as turn outto play crucial roles in other disciplines. We will also study about another key notion: the KLdivergence. Actually it is quite instrumental to proving the source coding theorem. Moreover, ithas played a significant role in other fields, in particular statistics, as it can serve as a quantitythat measures a sort of distance between distributions, which is of strong interest to the field.
7

EE623 Information Theory September 11, 2019KAIST, Fall 2019 Changho Suh ([email protected])
Lecture 4: Mutual information & KL divergence
Recap
Last time we learned about one key notion, entropy, which serves to play a central role inestablishing the source coding theorem that we will investigate in depth in Part II. Specificallywe started with the definition of entropy for the single random variable case and then extendedto a general case in which more random variables are involved. We then studied one importantrule which dictates the relationship across multiple random variables: the chain rule. For tworandom variables, say X and Y , the chain rule says:
H(X,Y ) = H(X) + H(Y |X) (1)
where H(Y |X) denotes conditional entropy. Remember the definition of conditional entropy:
H(Y |X) :=∑x∈X
H(Y |X = x) (2)
where H(Y |X = x) is the entropy w.r.t. p(y|x).
At the end of last time, I mentioned that the proof of the channel coding theorem which wewill also investigate in Part II requires knowledge on another key notion: mutual information.I also mentioned that there is another important notion worth being studied in depth: theKullabck-Leibler (KL) divergence.
Today’s lecture
So today we will study details on such two notions: mutual information and the KL divergence.Specifically what we are going to do are four-folded. First we will study the definition ofmutual information. We will then investigate some key properties of mutual information whichturn out to play crucial roles in establishing the channel coding theorem as well as addressingimportant issues that arise in other disciplines. Next we will learn about the KL divergenceand an interesting relationship with mutual information. Lastly we will discuss a connection ofmutual information to the channel coding theorem.
Observation
An interesting observation we made w.r.t. the chain rule (the Venn diagram interpretation inFig. 1) turns out to yield a natural definition for mutual information. The interpretation was:the randomness of two random variables X and Y (reflected in the total area of two Venndiagrams) is the sum of the randomness of one variable, say X, (reflected in the area of the blueVenn diagram) and the uncertainty that remains about Y conditioned on X (reflected in thecrescent-shaped red area). By the chain rule, the crescent-shaped red area can be representedas: H(Y |X).
Here we see an overlap between the blue and red areas. The area of the overlapped part dependshow large H(Y |X) is: the larger the overlapped area, the smaller H(Y |X). A small H(Y |X)somehow indicates a strong dependency between X and Y . Hence, one can say that: the largerthe overlapped area, the larger dependency between the two. In view of this, the overlapped
1

CN04_1
area area
= total area
Figure 1: A Venn diagram interpretation of the chain rule.
area captures the amount of information that X and Y share in common, sort of commoninformation.
Definition of mutual information
This leads to a natural definition for the overlapped area so as to capture such common infor-mation:
I(X;Y ) := H(Y )−H(Y |X). (3)
In the literature, this notion is called mutual information instead of common information.
Obviously from the picture in Fig. 1, one can define it as I(X;Y ) := H(X)−H(X|Y ) becausethe alternative indicates the same overlapped area. But by convention we follow the definitionof (3): The entropy of the right-hand-side term inside I(·; ·) minus the conditional entropy ofthe right-hand-side term conditioned on the left-hand-side term.
Key properties
As entropy has important properties (described with the non-negativity bound H(X) ≥ 0 andthe cardinality bound H(X) ≤ log |X |), mutual information has similar key properties:
Property 1: I(X;Y ) = I(Y ;X);
Property 2: I(X;Y ) ≥ 0;
Property 3: I(X;Y ) = 0⇐⇒ X ⊥⊥ Y.
The first property (named the symmetry property) is obvious from the picture. The proof is alsostraightforward:
I(X;Y ) := H(Y )−H(Y |X)
(a)= H(Y )− (H(X,Y )−H(X))
(b)= H(Y ) + H(X)− (H(Y ) + H(X|Y ))
(c)= I(Y ;X)
where (a) and (b) follows from the chain rule (1); and (c) is due to the definition of mutualinformation (3).
The second property is also very much intuitive, as the mutual information captures the size ofthe overlapped area and therefore it must be non-negative. But the proof is not that straight-forward. It requires a bunch of steps as well as the usage of an important inequality that welearned last time: Jensen’s inequality. See the next section for a detailed proof.
2

The third property also makes sense. Why? The mutual information being 0 means no corre-lation between X and Y , implying independence between the two. But the proof is not quitetrivial either. See a section followed by the next section for a proof.
Proof of I(X;Y ) ≥ 0 & its implication
Starting with the definition of mutual information, we get:
I(X;Y ) := H(Y )−H(Y |X)
(a)= EY
[log
1
p(Y )
]− EX,Y
[log
1
p(Y |X)
](b)= EX,Y
[log
1
p(Y )
]− EX,Y
[log
1
p(Y |X)
](c)= E
[log
p(Y |X)
p(Y )
](d)= E
[− log
p(Y )
p(Y |X)
](e)
≥ − logE[
p(Y )
p(Y |X)
]
= − log
∑x∈X
∑y∈Y
p(x, y)p(y)
p(y|x)
(f)= − log
∑x∈X
∑y∈Y
p(x)p(y)
(g)= − log 1 = 0
where (a) follows from the definition of entropy and joint entropy; (b) is due to the total prob-ability law
∑x∈X p(x, y) = p(y) (why?); (c) is due to the linearity of the expectation operator;
(d) comes from log x = − log 1x ; (e) is due to the fact that − log(·) is a convex function and
Jensen’s inequality; (f) follows from the definition of conditional distribution p(y|x) := p(x,y)p(x) ;
and (g) is due to an axiom of the probability distribution:∑
x∈X p(x) =∑
y∈Y p(y) = 1.
This non-negativity property has another very intuitive implication. Applying the definition ofmutual information and then re-arranging the two terms H(Y ) and H(Y |X) properly, we get:
H(Y ) ≥ H(Y |X) (4)
Remember one interpretation of entropy: a measure of uncertainty. So H(Y ) can be viewed asthe uncertainty of Y , while H(Y |X) being interpreted as the remaining uncertainty of Y after Xbeing revealed. Our intuition says: Given side information like X that is given as conditioning,we know more and more about Y (the uncertainty is removed further) and therefore, suchconditional entropy must be reduced. In short, conditioning reduces entropy. The above propertyproves this intuition.
Some curious students may want to ask: What if X is realized as a certain value X = x? Insuch case, does the particular form of conditioning still reduces entropy:
H(Y ) ≥ H(Y |X = x)? (5)
Please think about it while solving the last problem in PS1.
Proof of I(X;Y ) = 0⇐⇒ X ⊥⊥ Y
3

To prove this, first recall one procedure that we had while proving the second property above:
I(X;Y ) := H(Y )−H(Y |X)
= E[− log
p(Y )
p(Y |X)
]≥− logE
[p(Y )
p(Y |X)
].
Remember that the last inequality is due to Jensen’s inequality. As you will figure out whilesolving Problem 3 in PS1, the sufficient and necessary condition for the equality to hold in theabove is:
p(Y )
p(Y |X)= c (constant).
Please check this in PS1. The condition then implies that
p(y) = cp(y|x) ∀x ∈ X , y ∈ Y.
Using the axiom of probability distribution (the sum of the probabilities being 1), we get c = 1and therefore:
p(y) = p(y|x) ∀x ∈ X , y ∈ Y.
Due to the definition of independence between two random variables, the above implies that Xand Y are independent. Hence, this completes the proof:
I(X;Y ) = 0⇐⇒ X ⊥⊥ Y.
Interpretation on I(X;Y )
Let me say a few words about I(X;Y ). Using the chain rule and the definitions of entropy andjoint entropy, one can rewrite I(X;Y ) := H(Y )−H(Y |X) as
I(X;Y ) = H(Y ) + H(X)−H(X,Y )
= E[log
1
p(Y )
]+ E
[log
1
p(X)
]− E
[log
1
p(X,Y )
]= E
[log
p(X,Y )
p(X)p(Y )
].
(6)
This leads to the following interesting observation:
p(X,Y ) close to p(X)p(Y ) =⇒ I(X;Y ) ≈ 0;
p(X,Y ) far from p(X)p(Y ) =⇒ I(X;Y ) far above 0.
This naturally enables us to interpret mutual information as a sort of distance measure thatcaptures how far the joint distribution p(X,Y ) is from the product distribution p(X)p(Y ). Instatistics, there is a very well-known divergence measure that reflects soft of distance betweentwo distributions: the KL divergence. So it turns out mutual information can be represented asthe KL divergence. Before detailing such representation, let us first investigate the definition ofthe KL divergence1.
Definition of the KL divergence1The book of CT employs a different naming for the KL divergence: relative entropy. This naming is popular
(but only) in the Information Theory Society. It is not the case in other societies though; the naming of the KLdivergence is much more prevalent. Hence, I recommend you to use the naming of KL divergence.
4

Let Z ∈ Z be a discrete random variable. Consider two probability distributions w.r.t. Z: p(z)and q(z) where z ∈ Z. The KL divergence between the two distributions are defined as:
KL (p‖q) :=∑z∈Z
p(z) logp(z)
q(z)
= Ep(Z)
[log
p(Z)
q(Z)
].
(7)
Mutual information in terms of the KL divergence
Applying the definition (7) to (6), we then get:
I(X;Y ) = E[log
p(X,Y )
p(X)p(Y )
]= Ep(X,Y )
[log
p(X,Y )
p(X)p(Y )
](a)= Ep(Z)
[log
p(Z)
q(Z)
](b)= KL (p(Z)‖q(Z))
= KL (p(X,Y )‖p(X)p(Y ))
where (a) comes from my own definition: Z := (X,Y ) (note that p(x)p(y) is a valid probabilitydistribution. Why?); and (b) is because of the definition of the KL divergence.
Properties of the KL divergence
As mutual information has the three properties, the KL divergence has three similar properties:
Property 1: KL (p||q) 6= KL (q||p) ;
Property 2: KL (p||q) ≥ 0;
Property 3: KL (p||q) = 0⇐⇒ p = q.
The first property is similar to the one for mutual information but in a completely opposite man-ner. Unlike mutual information, the KL divergence is not symmetric. Notice in the definition (7)of the KL divergence that the expectation is taken only over the first probability distribution p.This breaks up symmetry. The second and third properties are very much similar to the onesfor mutual information. It turns out the proofs are also similar. Please check this in PS2.
Connection of mutual information to channel capacity C
Now let us discuss a connection of mutual information to the channel coding theorem. As Iclaim earlier, there is a very strong connection between the two.
For this, let us consider one very concrete exemplary channel, named the binary erasure channel(BEC for short). Actually this is the first toy-example channel which Shannon thought of. Hereis how it looks like. See Fig. 2. The input to the channel, say X, is binary, taking either 0 or1. The output, say Y , is ternary, taking either 0, 1 or some garbage information, called erasure(simply denoted by e). As I mentioned in the first lecture, the channel is sort of an enemy thatintroduces an uncertainty in the form of noise. In mathematics, the behavior of such uncertaintyin the channel can be described by conditional distribution p(y|x). In the BEC, the output is
5

CN04_2
0
1
0
1
channel erasure
0
1
0
1
e
Figure 2: Binary Erasure Channel.
the same as the input w.p. 1 − p; otherwise, it is an erasure no matter what x is. In terms ofconditional distribution, it is explained as:
p(y|x) =
1− p, for (x, y) = (0, 0);p, for (x, y) = (0, e);p, for (x, y) = (1, e);1− p, for (x, y) = (1, 1);0, otherwise.
(8)
A pictorial description of the BEC is in Fig. 2(b). Here a value placed above each arrow indicatesthe transition probability for a transition reflected by the arrow.
To see the connection, let us compute mutual information between the input and the output.
I(X;Y ) = H(Y )−H(Y |X).
As you can see, it requires a computation of the entropy H(Y ) of a ternary random variable Y .It turns out that H(Y ) is a bit complicated to compute, while a simpler calculation comes froman alternative expression:
I(X;Y ) = H(X)−H(X|Y ). (9)
Now to compute H(X), we need to know about p(x). However, p(x) is not given here. So letus make a simple assumption: X is uniformly distributed, i.e., (in other words), X ∼ Bern(12).Here “∼” refers to “is distributed according to”; Bern denotes the distribution of a binary (orBernoulli2) random variable; the value inside Bern(·) indicates the probability that the variabletakes 1, simply called the Bernoulli parameter. Assuming X ∼ Bern(12), the entropy of X issimply H(X) = 1 and the conditional entropy H(X|Y ) is calculated as:
H(X|Y )(a)= Pr(Y = e)H(X|Y = e) + Pr(Y 6= e)H(X|Y 6= e)
(b)= Pr(Y = e)H(X|Y = e)
(c)= p
where (a) is due to the definition of conditional entropy; (b) follows from the fact that Y 6= ecompletely determines X (no randomness) and therefore H(X|Y 6= e) = 0; (c) follows from the
2The Bernoulli random variable is named after a Swiss mathematician in the 1600s: Jacob Bernoulli. Heemploys such a simple binary random variable to discover one of the foundational laws in mathematics, called theLaw of Large Numbers (LLN). This is the reason that such a binary random variable is also called the Bernoullirandom variable. Later we will have a chance to investigate the LLN. Please be patient until we get to the point,unless you are familiar with the LLN.
6

fact that Y = e does not provide any information about X and hence X|Y = e has exactly thesame distribution as X, so H(X|Y = e) = H(X) = 1. Applying this to (9), we get:
I(X;Y ) = H(X)−H(X|Y ) = 1− p.
Now this is exactly where we can see the connection between mutual information and capacityC: the maximum number of bits that can be transmitted over a channel. It turns out thatI(X;Y ) = 1 − p is the capacity of the BEC. Remember that we assume the distribution of Xin computing I(X;Y ). It turns out that for a general channel which can be characterized by anarbitrary p(y|x), such p(x) can play a role as an optimization variable and the channel capacityis characterized as:
C = maxp(x)
I(X;Y ). (10)
This is the very statement of the channel coding theorem. From this, we see that mutualinformation is quite instrumental to describing the theorem. Later in Part II, we will prove thetheorem.
Look ahead
Next time, we will embark on Part II. And we will start proving the source coding theorem.
7

EE623 Information Theory September 16, 2019KAIST, Fall 2019 Changho Suh ([email protected])
Lecture 5: Source coding theorem for i.i.d. sources (1/3)
Recap
In the first two lectures, we studied Shannon’s two-staged architecture in which the encoder issplit into two parts: (i) source encoder; (ii) channel encoder. The reason that he proposed sucharchitecture is that he wished to convert an information source of a possibly different type intoa common currency of information: bits. He then established two theorems which deal withefficiency of the two blocks and therefore characterize the limits on the amount of informationthat one can transmit over a channel: (i) source coding theorem; (ii) channel coding theorem.We are now ready to embark on Part II, wherein the goal is to prove the two theorems. In thenext five lectures including today’s one, we are going to prove the source coding theorem.
Today’s lecture
The source coding theorem quantifies the minimum number of bits required to represent aninformation source without any information loss. The information source can be a collection ofdots and lines (in the case of Morse code), an English text, speech signals, video signals or imagepixels. So it consists of multiple components. For example, a text consists of multiple Englishletters. Speech signals (waveform) contain multiple points, each indicating the magnitude ofthe signal at a specific time instant. Also it can be viewed as a random from a perspectiveof a receiver who does not know about the signal. This leads us to model the source as arandom process: a collection of random variables. Let {Xi} be such process. Here Xi is called a“symbol” in the source coding context. For simplicity, we will start with a simple case in whichXi’s are i.i.d. (independent and identically distributed). Let X be a generic random variablewhich represents every individual instance Xi. In the i.i.d. case, the source coding theorem says:
Minimum number of bits required to represent the i.i.d. source {Xi} per symbol is H(X).
Today we will attempt to prove this theorem. Once we are done with the i.i.d. case, we willextend to a general case in which the source respects a realistic non-i.i.d. distribution.
Symbol-by-symbol source encoder
Since an information source consists of multiple components, an input to source encoder com-prises multiple symbols. So the encoder acts on multiple symbols in general. To understandwhat it means, let us think about a concrete example where source encoder acts on three consec-utive symbols. Here what it means by acting on multiple symbols is that an output is a functionof the three consecutive symbols. But for simplicity, we are going to consider a much simplercase for the time being in which the encoder acts on each individual symbol, being independentof other symbols. It means that the encoder produces bits in a symbol-by-symbol basis: a symbolX1 yields a corresponding binary string, and independently another binary string w.r.t. thenext symbol X2 follows, and this goes on similarly for other follow-up symbols. The reason thatwe consider this simple yet restrictive setting is that this case turns out to provide significantinsights into a general case. Actually it contains every key insight needed for generalization. Sobuilding upon the insights that we will obtain from this simple case, we will attack the generalcase later on. Please be patient until we get to that point.
1

The simple case allows us to greatly simplify notations. First it suffices to focus only on onesymbol, say X. The encoder is nothing but a function of X. Let’s call that function C.Please don’t be confused with the same notation that we used to indicate channel capacity.The reason that we employ the same notation is that the output C(X) is called “codeword”.Let `(X) be the length of codeword C(X). For example, consider X ∈ {a, b, c, d} in whichC(a) = 0, C(b) = 10, C(c) = 110, C(d) = 111. In this case, `(a) = 1, `(b) = 2, `(c) = 3, `(d) = 4.Note that `(X) is a function of a random variable X, hence it is also a random variable. Sowe are interested in a representative quantity of such varying quantity, which is the expectedcodeword length:
E [`(X)] =∑x∈X
p(x)`(x).
Optimization problem
The efficiency of source encoder is well reflected by such expected codeword length. Hence, wewish to minimize the expected codeword length. So the optimization problem of our interest is:
min`(x)
∑x∈X
p(x)`(x). (1)
There are many practical ways to estimate the distribution p(x) of an information source. So letus assume that p(x) is given. In this case, `(x)’s are only variables that we can optimize over.
Now are we done with the problem formulation? Of course, not! We should definitely worryabout constraints that the optimization variables `(x)’s should satisfy. What are constraints on`(x) then? The obvious constraints are: `(x) ≥ 1 and `(x) ∈ N. Are we now done? No! If itis done, the solution to this problem becomes trivial. It would be 1. One can set `(x) = 1 forall x’s to obtain 1. But this is too good to be true. In fact, there is another constraint on `(x),which is concerning the condition that a valid code should satisfy.
A naive condition: Non-singularity
For the validity of a code, the encoder function must be one-to-one. Why? Remember whatwe discussed in Lecture 2. The reason is that otherwise, there is no way to reconstruct theinput from the output. In the source coding context, a code is said to be non-singular if it isone-to-one mapping. Mathematically, the non-singularity condition reads:
C(x) = C(x′) =⇒ x = x′.
Here is an example that respects this condition:
C(a) = 0; C(b) = 010; C(c) = 01; C(d) = 10. (2)
Note that every codeword is distinct, ensuring one-to-one mapping.
Now is this non-singularity condition enough to ensure the validity of a code? Unfortunately,no. Actually what we care about is a sequence of multiple symbols. What we get in the outputis the sequence of binary strings which corresponds to a concatenation of such multiple symbols:X1X2 · · ·Xn =⇒ C(X1)C(X2) · · ·C(Xn). Remember we assume the symbol-by-symbol encoder;hence we get C(X1)C(X2) · · ·C(Xn) instead of C(X1X2 · · ·Xn). So one should be able toreconstruct the sequence X1X2 · · ·Xn of input symbols from that output C(X1)C(X2) · · ·C(Xn).But it turns out that in the above example (2), there is some ambiguity in decoding the sequence
2

of input symbols. Why? Here is a concrete example where one can see this. Suppose that theoutput sequence reads:
output sequence: 010
Then, what are the corresponding input sequence? One possible input would be simply “b”(C(b) = 010). But there are also some other patterns that yield the same output: “ca”(C(c)C(a) = 010) and “ad” (C(a)C(d) = 010). We have multiple candidates that agree uponthe same output. This is problematic because we cannot tell which input sequence is put into.In other words, we cannot uniquely figure out what the input is.
A stronger condition: Unique decodability
What additional condition do we need to satisfy in order to make a code valid? What we need isthat for any encoded bit sequence, there must be no decoding ambiguity, in other words, theremust be only one matching input sequence. This property is called unique decodability. This isequivalent to the one-to-one mapping constraint now w.r.t. the sequence of source symbols withan arbitrary length. Here is a mathematical expression for unique decodability: for any n andm,
C(x1)C(x2) · · ·C(xn) = C(x′1)C(x′2) · · ·C(x′m) =⇒ x1x2 · · ·xn = x′1x′2 · · ·x′m.
Example
Let me give you an example where the unique decodability condition holds:
C(a) = 10; C(b) = 00; C(c) = 11; C(d) = 110. (3)
One may wonder how to check unique decodability. Here is how. Suppose the output sequencereads:
output sequence: 10110101111 · · ·
First we read a binary string until we find a matching codeword or a codeword which includes thestring in part. In this example, the first read must be 10 because there is only one correspondingcodeword: C(a). So, the corresponding input is “a”. What about the next read? Here anambiguity arises in the next two bits: 11. We have two possible candidates: (i) a matchingcodeword C(c) = 11; (ii) another codeword C(d) = 110 which includes the string 11 in part.Here the “11” is either from “c” or from “d”. It looks this code is not uniquley decodable. Butit is actually uniquely decodable - we can tell which one is the correct one. How? Via looking atthe future string! What does this mean? Suppose we see one more bit after “11”, i.e., we read110. Still no way to identify which is correct one! However, suppose we see two more bits after“11”, i.e., we read 1101. We can then tell which symbol is actually put into. That is, “d”! Why?Another possibility “cb” (C(c)C(b) = 1100) does not agree upon the 1101. So it is eliminated.We repeat this. If one can uniquely decode the input sequence with this way, then the codeis said to be uniquely decodable. Actually one can readily verify that the above mapping (3)ensures unique decodability1.
Constraints on `(x) due to uniquely decodable property?
1There is a rigorous way of checking unique decodability, proposed by Sardinas and Patternson. Please checkProblem 5.27 in CT for details.
3

Recall our goal: finding constraints on `(x) in the optimization problem (1). So we now need toworry about what is an appropriate mathematical constraint on `(x)’s that respects the propertyof unique decodability. How to translate the unique decodability property into a mathematicalconstraint in terms of `(x)’s? It turns out the translation is a bit difficult.
But there is a good news. The good news is that there is an indirect and much easier way toidentify the constraint. A subclass of uniquely decodable codes, called prefix-free codes comes torescue! The prefix-free code that we will describe in greater details soon satisfies the followingtwo properties: (i) it yields exactly the same constraint as the constraint that the uniquelydecodable code should satisfy (meaning that if a code is uniquely decodable, then it mustrespect the constraint due to prefix codes as well); (ii) it offers a much easier way to identify theconstraint that the valid code should satisfy.
Here the first property means that the constraint due to prefix-free codes is a sufficient andnecessary condition for a valid uniquely-decodable code. So it suffices to consider the prefix-freecode when coming up with the constraint due to the valid code. The proof of the first propertyis not that simple. So you will be asked to prove it in PS2. But don’t worry. There would bemany subproblems which will help you to prove it without much difficulty although the proofitself is highly non-trivial.
To understand what the second property means, we should figure out what the prefix-free codeis in detail. So I will first explain what the code is and also will leave a side remark on one bigadvantage against non prefix-free yet uniquely decodable codes.
Prefix-free codes
Recall the previous example of (3) in which the code is uniquely decodable. Actually this is aperfect example which poses some issue w.r.t. decoding complexity, thereby motivating prefixcodes. What is that complexity issue? The issue is that as we saw in the prior example, decodingthe second input symbol requires looking at a future string, so decoding is not instantaneous.Actually this issue can be aggravated further. In the worst case, we can think of the followingoutput sequence:
1100000000000000000000000000000000000001.
In this case, decoding even the first symbol, we have to take a look at many future strings.
The prefix-free code that I will define soon is the one in which there is no such complexity issue.Here is an example of such code:
C(a) = 0; C(b) = 10; C(c) = 110; C(d) = 111. (4)
One key property of this code is that no codeword is a prefix of any other codeword. This iswhy the code is named the prefix-free code. As you can readily figure out, the code in theprevious example (3) is not prefix-free although it is indeed uniquely-decodable: there existssome codeword such that it is a prefix of some other codeword. This was the main reason thatdecoding such a code requires looking at future strings, in the worst case, we need to take a lookat the entire string to decode even the first input symbol. On the other hand, the prefix-free codelike (4) has no such codeword that is a prefix of any other codeword. This enables us to haveno such complexity issue in decoding because there is no ambiguity in decoding and thereforewe don’t need to look at any future string to decode an input. So the code is instantaneouslydecodable. That’s why such code is also called instantaneous.
Look ahead
4

Recall the optimization problem (1). As I mentioned earlier, the good news is that: (i) theconstraint on `(x) that the prefix-free code should satisfy is the same as that due to the uniquelydecodable code; (ii) it is easy to identify the constraint due to the prefix-free code. So next time,we will figure out the constraint that the prefix-free code property should respect. We will thenattack the optimization problem.
5

EE623 Information Theory September 18, 2019KAIST, Fall 2019 Changho Suh ([email protected])
Lecture 6: Source coding theorem for i.i.d. sources (2/3)
Recap
Last time, we tried to prove the source coding theorem for i.i.d. sources. As an initial effort, wefocused on a simple symbol-by-symbol encoder setting in which the code acts on each individualsymbol independently. We then set out the goal: designing a code C such that E [`(X)] isminimized. To achieve the goal, we formulated an optimization problem:
min`(x)
∑x∈X
p(x)`(x)
subject to some constraint on `(x).
Here the key to solving the problem is to come up with mathematical constraints on `(x) thata valid code (fully specified by the unique-decodability property) should respect.
At the end of the last lecture, I mentioned that it is a bit difficult to come up with suchconstraints. So we planned to take a different approach, being motivated by the following facts(which I claimed but did not prove): (1) constraints on `(x) that prefix-free codes (a subclass ofuniquely-decodable codes) satisfy are equivalent to those due to uniquely-decodable codes; (2)deriving mathematical constraints on `(x) induced by the prefix-free code property is relativelyeasier. We deferred the proof of the first property to PS2.
Today’s lecture
Today, we are going to derive the constraint due to the prefix-free code property, and will attackthe optimization problem accordingly.
Review of prefix-free codes
Let us start by reviewing the prefix-free code example that we introduced last time:
C(a) = 0; C(b) = 10; C(c) = 110; C(d) = 111. (1)
Notice that no codeword is a prefix of any other codeword. So it is indeed prefix-free.
From codeword to binary code tree
Let me introduce a pictorial representation of the code (1) that will guide us to easily figureout mathematical constraints on `(x). Actually the picture that I will introduce is the one thatyou saw earlier: the binary code tree. The binary code tree is the one in which there are onlytwo branches for each node (either the root or an internal node). As mentioned earlier, there isone-to-one correspondence between a code mapping rule and a representation of a binary codetree.
Let me explain how to draw a binary code tree given a code mapping rule. We start with theroot and draw two branches that originate from the root. We then assign a label of 0 on thetop branch, while assigning a label of 1 on the bottom. We may want to take the other wayaround: 1 for the top and 0 for the bottom. This is our own choice. We then have two nodes.
1

Next we assign each node, a sequence of binary labels that are along the path from the root tothat node. So 0 is assigned to the top node; 1 is assigned to the bottom. We then check if thereis a codeword which matches one of the two sequences 0 and 1. We see that the codeword C(a)matches the sequence 0 assigned to the top node. So we assign “a” to the top node. We repeatthis for the bottom. Note that this node has no matching codeword. If there is no matchingnode but there still exist codewords, then we generate two additional branches originating fromthe node. We then assign a label of 0 on the top, a label of 1 on the bottom. Again we cantake the other way around. We now assign to the top node a sequence of binary labels on thebranches connecting the root to the node: “10”. On the bottom, we assign “11”. Next we checkif there is a codeword that is identical either to “10” or to “11”. We see that C(b) = 10. So weassign “b” to the top node. Note that there is no matching codeword for “11”. So we split thebottom into two, assigning “110” on the top and “111’ on the bottom. Finally we assign “c” tothe top, “d” to the bottom. See Fig. 1 for visual representation.
Figure 1: The codeword representation via a binary code tree.
The binary-code-tree representation gives insights into identifying a mathematical constraint on`(x) that the prefix-free code should admit. Specifically the following two observations help.
Observation #1
The first observation is regarding the location of nodes to which symbols are assigned. A treeconsists of two types of nodes. One is an ending node (terminal) which has no further branch.We call that ending node a leaf. The second is a node from which another branch generates.We call it an internal node. Keeping these in our mind, let’s take a look at the earlier binarycode tree illustrated in Fig. 1. Notice that all codewords are assigned to leaves only. In otherwords, there is no codeword that is assigned to an internal node. Can you see why that is thecase? Actually it is obvious. In a prefix-free code, there is no codeword that is a prefix of anyother codeword. If there were a codeword that is assigned to an internal code, then we wouldviolate the prefix-free code property because that codeword is definitely a prefix of some othercodeword which lives in the associated leaf. So the first observation that one can make from theprefix-free code is:
Observation #1: Codeword must be a leaf in a binary code tree.
Observation #2
2

Now let’s move on to the second observation that serves to relate the prefix-free code propertyto the mathematical constraint on `(x). That is,
Observation #2: Any codeword can be mapped to a subinterval in [0, 1].
What does this mean? Let me explain what it means by drawing another picture on top of thebinary code tree in Fig. 1. Here an interval [0, 1] is associated with the entire set of codewords.See Fig. 2. We then draw a line that is crossing the root, and assign the average value of two endsin the associated interval (0+1
2 = 0.5) to a point that intersects the line and the [0, 1] interval.Now we assign a codeword to the [0, 0.5] interval. We see that there is only one codeword abovethe root level. So we map the codeword C(a) to the [0, 0.5] interval. Below the root level,there are multiple codewords though. We draw another line on the centered interior node inthe bottom level. We then assign 0.5+1
2 = 0.75 to a point that intersects the line and the [0.5, 1]interval. Here we do the same thing. We assign C(b) to the [0.5, 0.75] interval. We repeatthis until we map every codeword. See the resulting picture in Fig. 2. Here we see that everycodeword is mapped into a subinterval of [0, 1]:
C(a)↔ [0, 0.5];
C(b)↔ [0.5, 0.75];
C(c)↔ [0.75, 0.875];
C(d)↔ [0.875, 1].
Figure 2: Observation #2: Any codeword can be mapped to a subinterval in [0, 1].
This naturally leads to the following two facts: (1) subinterval size = 2−`(x); (2) there is nooverlap between subintervals. The second fact comes from the first observation: an interiornode cannot be a codeword. This leads to the following constraint:∑
x∈X2−`(x) ≤ 1. (2)
This is called Kraft’s inequality.
Optimization problem
3

Using Kraft’s inequality, we can now formulate the optimization problem as:
min`(x)
∑x∈X
p(x)`(x)
subject to∑x∈X
2−`(x) ≤ 1, `(x) ∈ N, `(x) ≥ 1.
Here one can ignore the constraint `(x) ≥ 1? Why? Otherwise, the Kraft’s inequality∑
x∈X 2−`(x) ≤1 is violated. So the simplified problem reads:
min`(x)
∑x∈X
p(x)`(x)
subject to∑x∈X
2−`(x) ≤ 1, `(x) ∈ N.(3)
Non-convex optimization problem
In fact, this optimization problem is very hard to solve. It is categorized into a certain type ofproblems which are known to be very difficult in general. To see this, let us start by rememberingone definition that we learned in Lecture 3: concave functions. We say that a function isconcave if ∀x1, x2 and λ ∈ [0, 1], λf(x1) + (1 − λ)f(x2) ≤ f(λx1 + (1 − λ)x2). Actually thereis another type of functions which are defined in a very similar yet opposite manner: convexfunctions. We say that a function f is convex if −f is concave, i.e., ∀x1, x2 and λ ∈ [0, 1],λf(x1) + (1− λ)f(x2) ≥ f(λx1 + (1− λ)x2). Note that the inequality has an opposite directioncompared to the one used in defining concave functions.
Consider the optimization problem (3) now with the concept of convex functions. Here theobjective function is convex in `(x), and also the left-hand-side of the inequality constraint(when it is massaged such that the right-hand-side is 0) is
∑x∈X 2−`(x) − 1, which is convex
in `(x). We say that the optimization problem is convex if the objective function and the left-hand-sides in constraints are convex in variables that we optimize over. The problem is said tobe non-convex otherwise, in other words, if it includes any non-convex objective function and/ornon-convex function in the inequalities.
We see in (3) that the objective function and the function in the inequality constraint are convex.What about the integer constraint `(x) ∈ N? Now we need to worry about the definition ofconvexity w.r.t. a set. Suppose we have two points, say A and B in a set. We say that theset is convex if any linear combination of the two points A and B is also an element of the set;otherwise, non-convex. Now is N convex or not? It is non-convex! Why? Suppose we have twointeger points, say 1 and 2. Now consider one linear combination of 1 and 2, say 1.5. Obviously1.5 is not an integer.
The integer constraint `(x) ∈ N is non-convex. So the optimization problem is non-convex.Especially when the non-convex constraint is an integer constraint, the problem is known to benotoriously difficult. It turns out the optimization problem of our interest is indeed extremelyhard to solve. So it has been open so far.
Approximate!
What did Shannon do in order to overcome this challenge? Here is what he did. Since theproblem is extremely hard, he just wanted to say something about the solution. He believedthat although the problem is hard, it may be doable to come up with something which is similarto the exact solution. To this end, what he attempted to do is to approximate the solution. In
4

other words, he intended to come with upper and lower bounds (on the solution) which are closeenough.
A lower bound
First consider a lower bound. Notice that the optimization problem of our interest aims tominimize the object function. So one can easily expect that with a larger (more relaxed) searchspace for `(x), the solution would be smaller than or equal to the exact solution in the originalproblem! This motivated Shannon to broaden the search space as it yields a lower bound. Whichconstraint did Shannon want to remove, in an effort to broaden the search space then? Shannonwas smart. Of course, he has chosen the integer constraint which contains a non-convex setand hence makes the problem quite challenging. Here is the relaxed version of the problem thatShannon formulated:
L := min`(x)
∑x∈X
p(x)`(x)
subject to∑x∈X
2−`(x) ≤ 1.(4)
Look ahead
So far we have formulated the optimization problem which aims at minimizing the expectedcodeword length subject to Kraft’s inequality and an integer constraint on `(x). Relaxing theinteger constraint, we translated the non-convex optimization into a tractable convex optimiza-tion problem. Next time we will derive a lower bound by solving such convex optimization. Wewill then derive an upper bound, and based on the lower and upper bounds, we will attempt toprove the source coding theorem.
5

EE623 Information Theory September 23, 2019KAIST, Fall 2019 Changho Suh ([email protected])
Lecture 7: Source coding theorem for i.i.d. sources (3/3)
Recap
Last time we formulated an optimization problem which aims at minimizing the expected code-word length subject to Kraft’ inequality (that prefix-free codes imply) and the integer constrainton `(x) (an intrinsic constraint due to the nature of the problem). We then realized that it isa non-convex optimization problem which is intractable in general. In an effort to make someprogress, we employed an approach that Shannon took, which is to approximate: Deriving lowerand upper bounds as close as possible. At the end of the last lecture, we introduced a trickwhich allows us to come up with a lower bound. The trick is to relax constraints, i.e., broad-ening search space in an effort to yield a better solution. Specifically we removed the integerconstraint which was the cause for non-convexity, and hence could translate the problem into atractable convex optimization problem:
L := min`
∑x∈X
p(x)`(x)
subject to∑x∈X
2−`(x) ≤ 1.(1)
Today’s lecture
While we derived a lower bound in class, CN6 did not contain details on the derivation of thebound, although LS6 did. So here we will provide such derivation. We will then derive an upperbound introducing another trick. Based on the lower and upper bounds, we will later completethe proof of the source coding theorem.
A lower bound
Actually the convex optimization problem (in this case, the objective function and the functionsthat appear in constraints are convex) is very well studied. So there are many ways of solvingthe problems. One of them is the one that you already learned about from a course on Calculus.That is, the Lagrange multiplier method. The way it works is very simple. To describe how itworks, we first need to define the Lagrange function. The Lagrange function is defined in termsof the optimization variables `(x)’s and some other variable called Lagrange multiplier, say λ:
L(`(x), λ) =∑x∈X
p(x)`(x) + λ
(∑x∈X
2−`(x) − 1
).
The number of Lagrange multipliers is the same as the number of constraints involved. So herewe have only one. Notice that the Lagrange function is the sum of two terms: (i) the objectivefunction; (ii) Lagrange multiplier times the left-hand-side of the inequality constraint in thecanonical form1.
1The canonical form of inequality constraints is the one in which the right-hand-side is 0 and the inequalitydirection is ≤.
1

Now then how does the Lagrange multiplier method work? We take a derivative of the Lagrangefunction w.r.t. optimization variables `(x)’s. We also take a derivative w.r.t. the Lagrangemultiplier λ. Setting these derivatives to zero, we get:
L(`(x), λ)
d`(x)= 0;
L(`(x), λ)
dλ= 0.
It turns out solving these under the constraint of λ ≥ 0 leads to the solution. This is how itworks. But in this lecture, we are not going to use this method. Why? There are two reasons:(i) this way is a bit complicated and messy; (ii) the method is not quite intuitive as to why itshould work2.
Instead we are going to use an alternative approach which turns out to be much simpler andintuitive. But don’t worry - in PS3, you will have a chance to take the Langrange multipliermethod to solve the problem. Before describing the method in details, let us first simplify theoptimization problem further. Here one thing to notice is that we do not need to consider thecase when the strict inequality holds:
∑x∈X 2−`(x) < 1. Here is why. Suppose there exists an
optimal solution, say `∗(x), such that the strict inequality holds:∑
x∈X 2−`∗(x) < 1. Then, one
can always come up with a better solution, say `′(x), such that: for some x0,
`′(x0) < `∗(x0);
`′(x) = `∗(x) ∀x 6= x0;∑x∈X
2−`′(x)=1.
Here we reduced `∗(x0) a bit for one particular symbol x0, in an effort to increase 2−`∗(x0) so
that we achieve∑
2−`′(x) = 1. Note that this is indeed a better solution as it yields a smaller
objective solution due to `′(x0) < `∗(x0). This is obviously contradiction! This implies that anoptimal solution occurs only when the equality constraint holds. Hence, it suffices to considerthe equality constraint. So the optimization can be simplified as:
L := min`(x)
∑x∈X
p(x)`(x)
subject to∑x∈X
2−`(x) = 1.(2)
Now the approach that we will take here is based on a method called “change of variables”. Letq(x) = 2−`(x). Then, the equality constraint becomes
∑x∈X q(x) = 1, and `(x) in the objective
function should be replaced with log 1q(x) :
L = minq(x)
∑x∈X
p(x) log1
q(x)
subject to∑x∈X
q(x) = 1, q(x) ≥ 0.(3)
2Actually there is a deep underlying theorem, so called the strong duality theorem, which proves that suchapproach leads to the optimal solution under convexity constraints. Since we will not deal with the proof in thiscourse, it is reasonable not to take the approach which relies on such deep theorem. But if you are interestedin the theorem, please refer to course notes (see CN12) for convex optimization which I uploaded on the coursewebsite. These are the notes which I wrote for the course; so if you don’t understand, please consult with me.
2

Here one thing to notice is that the constraint of q(x) ≥ 0 is newly introduced as q(x) = 2−`(x)
- remember that whenever we apply “change of variable”, we should worry about intrinsicconstraints on the new variables which did not appear in the original optimization problem.Now observe
∑x∈X q(x) = 1. What does this remind you of? Probability mass function! Recall
the axiom that the pmf should satisfy (if you don’t remember, please refer to Ch 1 and 2 inBT).
Here the objective function looks like the one that you saw earlier. That is, entropy H(X)! Nowwhat I claim is that the solution to the optimization problem is H(X) and the minimizer q∗(x)(that minimizes the objective function) is p(x). Here is the proof.
Let’s consider subtraction of the objective function from H(X). We then get:∑x∈X
p(x) log1
q(x)−∑x∈X
p(x) log1
p(x)
=∑x∈X
p(x) logp(x)
q(x)
= Ep
[log
p(X)
q(X)
]Now what does this remind you of? That is the Kullback-Leibler (KL) divergence that youencountered in Lecture 4! Applying one key fact regarding the KL divergence that it is non-negative (this is what you will prove in one of the subproblems in PS2), one can immediatelysee that the objective function is minimized as L = H(X), and the minimizer q∗(x) = p(x).
An upper bound
Now let us move on to an upper-bound issue. Remember the way to come up with a lowerbound. That is to broaden the search space. Then, what is a natural corresponding way tocome up with an upper bound? The answer is: the other way around! That is to reduce thesearch space. Here we will take one very naive way of reducing the search space. That is tomake one particular choice for optimization variables `(x)’s.
Now the question is: Which particular choice that we want to make for `(x)? Obviously arandom choice for `(x) will lead to a possibly very loose upper bound. So we need to be verycareful about the choice. One can imagine that a good choice might be similar to the optimalsolution in the relaxed optimization problem (without the integer constraint). In this regard,the minimizer `∗(x) for the relaxed optimization can shed some lights on this. Remember theminimizer in the case:
q∗(x) = p(x)
Since q(x) := 2−`(x), in terms of `(x), it would be:
`∗(x) = log1
p(x).
If `∗(x)’s were integers, then we are more than happy as we can obtain the exact solution tothe original optimization problem. In general, however, `∗(x)’s are not necessarily integers. Onenatural choice for `(x) is then to take an integer which is as close to `∗(x) as possible. So onecan think of two options: (i) blog 1
p(x)c; (ii) dlog 1p(x)e. Which one do you want to take? Actually
the first choice is not valid. Why? Think about the Kraft’s inequality. Hence, the natural choice
3

is the second one. Under the second choice, we then get:
L∗ ≤∑x∈X
p(x)
⌈log
1
p(x)
⌉≤∑x∈X
p(x)
(log
1
p(x)+ 1
)= H(X) + 1.
Are the bounds tight?
In summary, what we can say for L∗ is :
H(X) ≤ L∗ ≤ H(X) + 1.
First take a look at the lower bound. Note the lower bound is tight when log 1p(x) ’s are integers
(i.e., p(x)’s are integer powers of 2) and therefore `∗(x) can be chosen as log 1p(x) without violating
the integer constraint. However, this is a very particular case because in general p(x) is notlimited to that particular type. As for the upper bound H(X) + 1: one thing that we can say isthat if H(X) is large enough, the gap of 1 would be negligible. However, if H(X) is comparableto (or much smaller than) 1, then the bounds are quite loose. For instance, consider a case inwhich X is a binary r.v. with Pr(X = 0) = p where p � 1. In this case, H(X) is close to 0;hence, the bounds play almost no role in the case.
General source encoder
While we have made significant effort to approximate L∗, we figured out that the bounds are nottight in general. So our effort seems to play no role. While the bounds themselves are useless,the techniques that we used for deriving the bounds turn out to play a crucial role in provingthe source coding theorem. Here are details on why.
Actually we have restricted ourselves to a very special setting in source encoding. We focused ona symbol-by-symbol encoder which acts on each individual symbol independently. However, theencoder can take an arbitrary length of input sequence to yield an output. So in general it can acton multiple symbols. For example, one can take an n-length sequence of Zn := (X1, X2, . . . , Xn),say super-symbol, and generate an output like C(X1, X2, . . . , Xn). In fact, the sequence lengthn is sort of design parameters, the one that we can choose as per our wish.
Very interestingly, if one can apply the bounding techniques that we have learned to this generalsetting, we can readily prove the source coding theorem. Here is detail. Let L∗n be the minimumexpected codeword length w.r.t. the super-symbol Zn:
L∗n = min`(z)
∑z∈Z
pZn(z)`(z).
Applying the same bounding techniques to L∗n, we now get:
H(Zn) ≤ L∗n ≤ H(Zn) + 1.
Since the codeword length per symbol is of our interest, what we do care about is the one dividedby n:
H(Zn)
n≤ L
∗n
n≤ H(Zn) + 1
n.
4

Remember that the length n of super-symbol is of our design choice and hence we can choose itso that it is an arbitrary integer. In an extreme case, we can make it arbitrarily large. Actuallythis is exactly the way that we achieve the limit. Note that the lower and upper bounds coincidewith H(Zn)
n as n tends to infinity.
We are now almost done with the proof. What remains is to calculate such matching quantity.Using the chain rule (a generalized version of the chain rule - check in PS2), we get:
H(X1, X2, . . . , Xn)
n=H(X1) +H(X2|X1) + · · ·+H(Xn|X1, · · · , Xn−1)
n(a)=H(X1) +H(X2) + · · ·+H(Xn)
n(b)= H(X)
where (a) follows from the independence of (X1, X2, . . . , Xn) and the fact that H(X2|X1) =H(X2) when X1 and X2 are independent (check in PS2); and (b) is due to the fact that(X1, X2, . . . , Xn) are identically distributed.
Hence,
limn→∞
L∗nn
= H(X).
This proves the source coding theorem for i.i.d. sources: the minimum number of bits thatrepresents an information source per symbol on average is indeed H(X).
Look ahead
So far we have proved the source coding theorem. We formulated an optimization problem andthen showed that the solution to the optimization problem is entropy. What this result impliesis that there exist optimal codes that can achieve the limit. Actually we never talked aboutexplicit sequence pattern of such optimal codes. In other words, we never discussed how to designsuch codes. Next time, we will discuss this issue in depth.
5

EE623 Information Theory September 25, 2019KAIST, Fall 2019 Changho Suh ([email protected])
Lecture 8: Source code design
Recap
So far we have proved the source coding theorem for the i.i.d. source case. In an effort to gainsome insights, we first considered a simple yet restricted setting in which source encoder actson each individual symbol, i.e., the symbol-by-symbol encoder setting. We then formulated anoptimization problem which aims at minimizing the expected codeword length under the setting.Realizing the difficulty of such problem, we attempted to approximate the solution via derivingreasonably tight lower and upper bounds. Applying simple yet power lower-&-upper tricks, wecould come up with the bounds which differ by 1.
We then applied these bounding techniques to a general setting in which source encoder can actnow on multiple symbols, the number of which can possibly be arbitrarily large. We ended upwith:
H(X1, . . . , Xn)
n≤ L
∗n
n≤ H(X1, . . . , Xn) + 1
n
where L∗n indicates the minimum expected codeword length w.r.t. a super symbol Zn :=(X1, . . . , Xn). This led us to obtain: In the limit of n,
L∗nn−→ H(X).
Today’s lecture
Here what this result implies is that there exist optimal codes that can achieve the limit. Actuallywe never talked about explicit sequence pattern of such optimal codes. In other words, we neverdiscussed how to design such codes. In this lecture, we will discuss this issue in details.
Regimes in which one can achieve the limit
Recall the setting where we can achieve the limit. That is the one in which we take a super-symbol and the length of the super-symbol tends to infinity. Now how to design such codes?To this end, we need to know about two things: the length and pattern of codewords. Actuallythe minimizer of the relaxed optimization problem gives insights into the length of optimalcodewords. Recall:
`∗(Xn) = log1
p(Xn).
So to figure out what the length looks like in the interested regime of large n, we should take alook at the behavior of p(Xn) for that regime.
Behavior of p(Xn) for large n
To gain insights, we focus on the binary alphabet case in which Xi ∈ {a, b} and Pr(Xi = a) = p.Later we will consider the general alphabet case. Obviously the sequence consists of a certaincombination of two symbols: a’s and b’s. For very large n, there is an interesting behavior on two
1

quantities regarding the sequence. One is the faction of symbol “a”, represented as the numberof a’s divided by n. This is an empirical mean of occurrences of symbol “a”. The second is thefraction of symbol “b”, the number of b’s divided by n.
To see this clearly, let’s compute the probability of observing Xn. Since Xn is i.i.d., p(Xn) issimply the product of individual probabilities:
p(Xn) = p(X1)p(X2) · · · p(Xn).
Here each probability is p or 1− p depending on the value of Xi. So the result would be of thefollowing form:
p(Xn) = p{# of a’s}(1− p){# of b’s}.
Now consider log 1p(Xn) that we are interested in:
log1
p(Xn)= {# of a’s} · log
1
p+ {# of b’s} · log
1
1− p.
Dividing by n on both sides, we then get:
1
nlog
1
p(Xn)={# of a’s}
n· log
1
p+{# of b’s}
n· log
1
1− p. (1)
Now what can we say about this in the limit of n? Your intuition says: {# of a’s}n → p as n→∞!
One can naturally expect that when n → ∞, the fraction would be very close to Pr(X = a).Actually this is indeed the case. Relying on a very well-known theorem, so called the Weak Lawsof Large Numbers (WLLN1), one can prove this. Here is the proof. Let Yi = 1(Xi = a) where1{·} is an indicator function that returns 1 when the event · is true, 0 otherwise. Consider:
Sn :=Y1 + Y2 + · · ·+ Yn
n.
The Sn indicates the fraction of a’s. Obviously it is a sequence of n. Now consider the con-vergence of the sequence. Remember from the course on Calculus that you learned about theconvergence of sequences, which are deterministic.
But here the story is a bit different. The reason is that Sn is a random variable (not deter-ministic). So now we need to consider the convergence w.r.t. a random process. Actually thereare multiple types of convergence w.r.t. random processes. One type of the convergence that isneeded to be explored in our problem context is the convergence in probability. Actually whatthe WLLN that I mentioned above says is that
WLLN: Sn converges to E[Y ] = p in probability.
What it means by this in words is very simple. It means that Sn converges to p with highprobability. But in mathematics, the meaning should be rigorously stated. What it means bythis in mathematics is that for any ε > 0,
Pr (|Sn − p| ≤ ε)→ 1.
In other words, Sn is within p± ε with high probability (w.h.p.).
1This is exactly the law which I mentioned in Lecture 4 Jacob Bernoulli discovered!
2

Now applying the WLLN to {# of a’s}n and {# of b’s}
n , we get: for any ε1, ε2 > 0,
{# of a’s}n
is within p± ε1,
{# of b’s}n
is within 1− p± ε2,
as n→∞. Applying this to (1), we can then say that in the limit of n,
1
nlog
1
p(Xn)= (p± ε1) log
1
p+ (1− p± ε2) log
1
1− p= H(X)± ε
where ε := ε1 log 1p + ε2 log 1
1−p .
Manipulating the above, we get:
p(Xn) = 2−n(H(X)±ε) holds w.h.p. (2)
Here the key observation is that for very large n, ε can be made arbitrarily close to 0 and thusp(Xn) is almost the same for all such Xn. We call such sequences typical sequences. The setthat contains typical sequences is said to be a typical set, formally defined as below.
A(n)ε := {xn : 2−n(H(p)+ε) ≤ p(Xn) ≤ 2−(H(p)−ε)}.
Notice that p(Xn) ≈ 2−nH(X) is almost uniformly distributed. It turns out this property playsa crucial role to design optimal codes. In the sequel, we will use this property to design suchcodes.
Prefix-free code design
What (2) suggests is that any arbitrary sequence is asymptotically equiprobable. Rememberin LS2 that a good source code assigns a short-length codeword to a frequent symbol, whileassigning a long-length codeword to a less frequent symbol. Here we see that any sequence isalmost equally probable. This implies that the optimal length of a codeword assigned for anyarbitrary sequence would be roughly the same as:
`∗(Xn) = log1
p(Xn)≈ nH(X).
So one can consider a binary code tree in which the depth of the tree is roughly nH(X) andcodewords are assigned to leaves. Recall for a prefix-free code that codewords live only in leaves.
Now let’s check if we can map all the possible sequence patterns of Xn into leaves. To thisend, we need to check two values: (1) total number of leaves; (2) total number of possibleinput sequences. First of all, the total number of leaves is roughly 2nH(X). Now what aboutthe second value? Obviously the total number of input sequence patterns is 2n because eachsymbol can take on one of the two values (“a” and “b”) and we have n of them. But here onething that we have to keep in our mind is that in the limit of n, the sequence Xn behaves in aparticular manner, more specifically, in a manner that p(xn) ≈ 2−nH(X); hence, the number ofsuch sequences is not the maximum possible value of 2n. Then, now the question is: how manysequences such that p(xn) ≈ 2−nH(X)? To see this, consider:∑
xn:p(xn)≈2−nH(X)
p(xn) ≈ |{xn : p(xn) ≈ 2−nH(X)}| × 2−nH(X).
3

Obviously, the aggregation of all the probabilities of such sequences cannot exceed 1; hence,
|{xn : p(xn) ≈ 2−nH(X)}| . 2nH(X).
Note that the cardinality of such set does not exceed the total number of leaves ≈ 2nH(X). Soby using parts of leaves, we can map all of such sequences. This completes the design of sourcecode. See Fig. 1. Finally let’s check if this code indeed achieves the fundamental limit of H(X).Notice that the length of every codeword is ≈ nH(X). So the expected codeword length per
symbol would be ≈ nH(X)n = H(X).
# of leaves
� Use part of the leaves
for mapping codewords
Figure 1: Design of optimal prefix-free codes
Extension to non-binary sources
So far we have considered the binary alphabet case. A natural question arises: how about fornon-binary sources? Actually using the WLLN that we studied earlier, one can readily provethat:
1
nlog
1
p(Xn)−→ H(X) in prob.
although X is an arbitrary r.v., not limited to the binary one. Please check this is indeed the casein PS3. Roughly speaking, this implies that p(Xn) ≈ 2−nH(X) w.h.p. - any arbitrary sequenceis asymptotically equally probable. So using this and applying the code design rule based ona binary code tree, we can easily construct an optimal source code - every input sequence ismapped to a leaf in a binary code tree with depth ≈ nH(X) and hence, the expected codewordlength per symbol is H(X). The sequence pattern of a codeword is determined by which leafthe codeword is assigned to.
General non-i.i.d. sources
So far we have considered only i.i.d. sources. However, in practice, many of the informationsources are far from i.i.d. One such example is an English text. Here is a concrete example whereone can see this clearly. Suppose the first and second letters are “t” and “h” respectively. Then,what do you guess about the third letter? Yes, many of you would expect “e”! The reason isthat there are many “the”s in an usual English text. What this example implies is that symbolsthat form a text are actually quite correlated with each other, meaning that the sequence isdependent. In fact, many other information sources are like that, not i.i.d. at all. Then, nowthe question is: What about for general non-i.i.d. sources? What is the corresponding sourcecoding theorem? How to design optimal codes?
4

Actually we can readily answer these questions by applying the bounding techniques that welearned. Suppose we employ a super symbol-based source code of the super-symbol size n. LetL∗n = E [`(Xn)]. Applying exactly the same lower-&-upper bound techniques that we learned,one can show that
H(X1, X2, · · · , Xn) ≤ L∗n ≤ H(X1, X2, · · · , Xn) + 1.
Dividing the above by n, we get:
H(X1, X2, . . . , Xn)
n≤ L
∗n
n≤ H(X1, X2, . . . , Xn) + 1
n.
Here what we can say is that the expected codeword length per symbol is definitely related tothe following quantity:
limn→∞
H(X1, X2, . . . , Xn)
n.
Now the question is: Does the limit exist? If the limit exists, then we are done! The answer is:Not always. Actually there are some very contrived examples where the limit does not exist -one such example is in page 75 in CT. But the good news is: in many practically-relevant casesof our interest, the limit does exist. So let’s consider only these cases where the limit exists.Then, we can state the source coding theorem as follows:
Minimum # of bits that represent general source per symbol = limn→∞
H(X1, X2, . . . , Xn)
n.
Actually there is a terminology which indicates such limit. To understand the rationale behindthe terminology that you will see soon, let’s consider a plot in which x-axis and y-axis indicaten and H(X1, X2, . . . , Xn) respectively. See Fig. 2. What the above limit means is the slope. Inother words, it means the growth rate of the sequence uncertainty w.r.t. n. Hence, it is calledthe entropy rate.
Figure 2: Entropy rate.
Look ahead
In the latter part of this lecture, we have proved the source coding theorem for general in-formation source (not limited to the i.i.d. case): the minimum number of bits that representinformation source per symbol is entropy rate. Next time, we will explore how to constructoptimal codes that achieve such limit.
5

EE623 Information Theory September 30, 2019KAIST, Fall 2019 Changho Suh ([email protected])
Lecture 9: Source coding theorem for general sources
Recap
Last time, we studied how to construct an optimal code that can achieve H(X) promised by thesource coding theorem for the i.i.d source case. The construction was based on a super-symbol-based approach in which the source encoder acts on multiple input symbols, say n symbols,and the parameter n is of our design choice. The idea of the construction was to make thesuper-symbol size n arbitrarily large. In the interested regime of large n, what we found withthe help of the WLLN is:
1
nlog
1
p(Xn)
in prob.−→ H(X) (1)
i.e., 1n log 1
p(Xn) becomes in between H(X)− ε and H(X)+ ε for any ε > 0, as n tends to infinity.Inspired by the fact that the codeword length solution for the lower bound in the optimizationproblem that we formulated earlier is `∗(xn) = log 1
p(xn) , we focused on the quantity of 1p(xn) .
From (1), we observed that in the limit of n, the quantity becomes:
log1
p(Xn)≈ nH(X).
This then motivated us to consider a prefix free code in which an input sequence xn is mappedto one of the leaves that reside in the level with the tree depth of ≈ nH(X). This ensures theexpected codeword length per symbol to be ≈ H(X), matching with the promised limit. Wealso checked that the number of possible input sequences such that p(xn) ≈ 2−nH(X) is less thanthe total number 2nH(X) of leaves. This ensured a mapping for every such input sequence.
Today’s lecture
We have thus far considered only i.i.d. sources. However, in practice, many of the informationsources are far from i.i.d. Remember the English text example that we introduced last time. Soa natural question arises: What about for general non-i.i.d. sources? What is the correspondingsource coding theorem? How to design optimal codes? In this lecture, we will address thesequestions.
Source coding theorem for general sources
Actually we can readily characterize the limit by applying the bounding techniques that welearned in previous lectures. Suppose we employ a super symbol-based source code of the super-symbol size n. Let L∗n = E [`(Xn)]. Applying exactly the same lower-&-upper bound techniquesthat we learned, one can show that
H(X1, X2, . . . , Xn) ≤ L∗n ≤ H(X1, X2, . . . , Xn) + 1.
Dividing the above by n, we get:
H(X1, X2, . . . , Xn)
n≤ L
∗n
n≤ H(X1, X2, . . . , Xn) + 1
n.
1

Here what we can say is that the expected codeword length per symbol is definitely related tothe following quantity:
limn→∞
H(X1, X2, . . . , Xn)
n.
Now the question is: Does the limit exist? If the limit exists, then we are done! However, theanswer is: Not always. Actually there are some very contrived examples where the limit doesnot exist - one such example is in page 75 in CT. But there is a good news. The good newsis: in many practically-relevant cases of our interest, the limit does exist. So let’s consider onlythese cases where the limit exists. We can then state the source coding theorem as follows:
Minimum # of bits that represent a general source per symbol = limn→∞
H(X1, X2, . . . , Xn)
n.
Actually there is a terminology which indicates such limit. To understand the rationale behindthe terminology that you will see soon, let’s consider a plot in which x-axis and y-axis indicaten and H(X1, X2, . . . , Xn) respectively. See Fig. 1. What the above limit means is the slope. Inother words, it means the growth rate of the sequence uncertainty w.r.t. n. Hence, it is calledthe entropy rate.
Figure 1: Entropy rate.
Stationary process
Now how to compute the entropy rate? It turns out in many practical information sources, theentropy rate is easy to compute. One such practical example is the one in which informationsource is a stationary process. Here is the definition of the stationary process. We say that arandom process is stationary if {Xi} is a statistical copy (e.g., having the same joint distribution)of its shifted version {Xi+`} for any non-negative integer `. One concrete example is again anEnglish text. Notice that the statistics of 10-year-old text would be almost the same as that ofa nowaday’s text; for instance, the frequency of “the” in an old text would be roughly the sameas that of a current text.
As claimed earlier, the limit can be simplified a bit further when specialized to the stationaryprocess case. To see this, we consider:
H(X1, X2, . . . , Xn) = H(X1) +H(X2|X1) + · · ·+H(Xn|X1, . . . , Xn−1)
=
n∑i=1
H(Xi|X1, X2, . . . , Xi−1)
=
n∑i=1
H(Xi|Xi−1)
2

where the first equality is due to the chain rule and the last comes from the shorthand notationthat we introduced earlier: Xi−1 := (X1, . . . , Xi−1). Let ai = H(Xi|Xi−1). Now we can seetwo properties of the deterministic sequence {ai}. First it is non-negative. Second, it is non-increasing, i.e., ai+1 ≤ ai. To see this, consider:
ai+1 = H(Xi+1|X1, X2, . . . , Xi)
≤ H(Xi+1| X2, . . . , Xi)
= H(Xi|X1, . . . , Xi−1)
= ai
where the inequality follows from the fact that conditioning reduces entropy and the secondlast equality is due to the stationarity of the process. These two properties imply that thedeterministic sequence {ai} has a limit. Why? Please think about the definition of the existenceof a limit that you learned perhaps from the course on Calculus or somewhere else. Otherwise,look for wikipedia.
Now let’s consider
H(X1, . . . , Xn)
n=
1
n
n∑i=1
ai.
Notice that this quantity indicates the running average of the sequence {ai}. Keeping in yourmind that {ai} has a limit, what your intuition says is that the running average will converge tothe limit as well because almost all the components that form the running average will convergeto the limit. It turns out this is indeed the case. So the entropy rate of the stationary processis:
H(X ) = limi→∞
H(Xi|Xi−1). (2)
Please see PS3 for the rigorous proof of this.
Now how to design optimal codes for such a stationary process? We can apply the same method-ology that we developed earlier. The first thing to do is to check that such a stationary sequenceis also asymptotically equiprobable. In fact, one can resort to a generalized version of the WLLNto prove that this is indeed the case:
p(Xn) ≈ 2−nH(X ). (3)
The proof of this is not that simple, requiring some non-trivial tricks. So we will not deal withthe proof here. But if you are interested, I am happy to issue a problem for the proof in a laterhomework, say PS4 or PS5. Please let me know your interest in class or via any communicationroute. Recalling what we learned last time, what (3) suggests is that the optimal code assignsthe same codeword length for every sequence and the length should read roughly nH(X ). Thesequence patterns will be determined by the binary code tree of depth ≈ nH(X ) in whichcodewords are mapped to leaves.
From theory to practice
So far we have characterized the limit (entropy rate) on the number of bits that representinformation source (stationary process in almost all practically-relevant cases), and also learnedabout how to design optimal codes that achieve the limit. But here one thing to notice is thatwe focused on a somewhat idealistic scenario in which the super-symbol size n can be madearbitrarily large. In reality, n should be finite though. Why? Two reasons. One is that the
3

hardware that we will employ for the use of a code obviously cannot support an infinite size ofn. The other is that the amount of information source available is definitely limited, as pointedout by a student in class. So one natural question that we can ask in this context is then: Whatif n is finite? What are optimal codes for finite n? Actually this is exactly the question thatShannon raised right after establishing the source coding theorem. Also this question was sharedwith a bunch of professors in MIT at that time including Prof. Robert Fano. Prof. Fano alsoshared this question with students who took the information theory course that he held at thattime.
As I mentioned earlier, for the finite n case, we need to solve a non-convex optimization problemin order to give a concrete answer. I told you that this problem is extremely hard, and a closed-form solution to the limit has been open thus far. So Prof. Fano never expected that any onewould come up with a solution to this very difficult problem.
But surprisingly, one of the students in class, named David Huffmnan, came up with a verysimple and straightforward algorithm which leads to the optimal code. Huffman did not providethe exact closed-form solution to the limit, but instead could provide a very explicit design rule,called algorithm, which leads to the optimal code. This code is called the Huffman code. Oneamazing fact is that he did this as a term project in the class, implying that you may also beable to do something great right now!
While the Huffman code provides the optimal code in a practical scenario where n is finite, itstill has limitations in implementation. One such limitation is that the codes require knowledgeof source statistics. In other words, to design Huffman code, we need to know about the jointdistribution of a super symbol: p(x1, x2, . . . , xn). But in practice, it may not be that easy toobtain the statistical knowledge. So one follow-up question that arises in this more practicalscenario is: What if source statistics is unknown? Are there any optimal codes that require nopriori knowledge on source statistics?
A universal code
Two very smart Jewish people could answer this question: Lempel & Ziv. They developed auniversal code that does not require any statistical knowledge on information sources. Thiscode is called Lempel-Ziv code. Since this code can be applied to any type of information sourcewhile still approaching the limit (entropy rate), many system designers were very interested inimplementing their code. So it turns out the code was implemented in a variety of systems asthe following protocols named: gzip, pkzip, UNIX compression.
The idea of the Lempel-Ziv code is very simple. The idea is the one that many people in ourdaily life are using. Let us explain the idea in one specific context: “closing email phrases”. Asa closing phrase, people usually use the following:
“I look forward to your reply.”;
“I look forward to seeing you.”;
“I look forward to hearing from you.”;
“Your prompt repay would be appreciated.”, etc.
Actually if one intends to represent this English phrase as it is, then we may need a bunch ofbits, of which the number is definitely larger than the number of alphabets in a phrase. But theLempel-Ziv code says that we can do much better than this. The idea is based on dictionary.One noticeble property is that we have only a few number of closing phrases because peopleusually use very similar phrases. Inspired by this, one can imagine a dictionary that maps eachphrase into an index like 1, 2, 3. This dictionary forms the basis of the Lempel-Ziv code.
4

Roughly speaking, here is how the Lempel-Ziv code works. First of all, we make a dictionaryfrom some pilot sequence which are part of the entire sequence. We then share this betweensource encoder and decoder. The source encoder encodes only indices and the decocder decoesthe indices using the shared dictionary. This way, we do not need to know about the statisticsof information sources. Also it has been shown that this code can achieve the limit (entropyrate) as the dictionary size increases.
In the interest of time, we will not cover more details on the Huffman code and the Lempel-Zivcode. For those who are interested in, I will upload a supplementary material w.r.t. the Huffmancode. Unfortunately, I don’t have a course note for the Lempel-Ziv code. So if you are interestedin, please look for wikipedia.
Look ahead
So far we have proved the source coding theorem for general information source, and learnedabout how to design optimal codes that achieve the limit. We also briefly overviewed somepractical codes such as the Huffman code and the Lempel-Ziv code. Next time, we will moveonto another core topic in Part II: the channel coding theorem.
5

EE623 Information Theory October 2, 2019KAIST, Fall 2019 Changho Suh ([email protected])
Lecture 10: Overview of channel coding theorem
Recap
In the first two lectures, we learned about the two-stage communication architecture that Shan-non developed. The role of the first stage that we call source coding is to convert an informationsource (which is possibly of a different type) into a common currency of information, bits. Therole of the second stage that we call channel coding is to convert the bits into a signal so thatit can be reliably transmitted over a channel to the receiver. During the past five lectures,we studied the source coding theorem which quantifies the fundamental limit on the number ofbits required to represent an information source without loss of meaning. In the upcoming fivelectures (including today’s one), we will study the channel coding theorem which quantifies thefundamental limit on the number of bits that can be reliably transmitted over a channel.
Today’s lecture
Remember the verbal statement of the channel coding theorem that we made in Lecture 2. Like alaw in physics, there is a law in communication systems: Given a channel, the maximum numberof bits that can be transmitted over a channel is determined, regardless of any operations doneat the transmitter and the receiver. In other words, there is a fundamental limit on the numberof bits, under which communication is possible and above which communication is impossible,no matter what we do and whatsoever. The limit is so called channel capacity. In today’slecture, we will study what this statement means in a more explicit and precise manner. To thisend, we will study the following: (i) a specific problem setup that Shannon considered; (ii) amathematical model of channels; (iii) precise meaning of possible (or impossible) communication.Once the statement becomes clearer, we will later prove the theorem.
Problem setup
The goal of the communication problem is to deliver an information of binary string type (bits)to the receiver as much as possible. Let’s start by investigating the statistics of the binary string.Fortunately, unlike the information source in the source coding context, one can make a verysimple assumption on the statistics of the binary string.
To see this, let’s recall the source coding setup that we considered in the past. Notice thatan information source is of arbitrary statistics depending on applications of our interest. Sothe source code design was tailored for the statistics of the information source. On the otherhand, we have a good news in the channel coding part. The good news is that the statisticsof the input binary string is not arbitrary - it follows a particular statistics under a reasonableassumption. Here the reasonable assumption is that we use an optimal source code. Now thencan you see why the binary string is of a particular statistics?
To see this, let’s recall the source coding theorem that we proved. Let the binary string(b1, b2, . . . , bm) be an output of an optimal source encoder. Then, using the source codingtheorem, we get:
m = H(information source)
= H(b1, b2, . . . , bm)(1)
1

where the second equality follows from the fact that a source encoder is one-to-one mapping andthe fact H(X) = H(f(X)) for an one-to-one mapping function f (Why?). Now observe that
H(b1, b2, . . . , bm) = H(b1) + H(b2|b1) + · · ·+ H(bm|b1, . . . , bm−1)
≤ H(b1) + H(b2) + · · ·+ H(bm)
≤ m
(2)
where the first inequality is due to the fact that conditioning reduces entropy and the lastinequality comes from the fact that bi’s are binary r.v. This together with (1) suggests thatthe inequalities in (2) are actually tight. This implies that bi’s are independent (from the firstinequality) and identically distributed ∼ Bern(12) (from the second inequality). Hence, we canmake the following simple assumption: a binary string, an input to a channel encoder, is i.i.d.,each being according to Bern(12).
For notational simplicity, information theorists introduced a simple notation which indicatessuch an i.i.d. random process {bi}. They expressed it with a single r.v., say W , using thefollowing mapping rule:
(b1, . . . , bm) = (0, 0, . . . , 0) −→W = 1;
(b1, . . . , bm) = (0, 0, . . . , 1) −→W = 2;
...
(b1, . . . , bm) = (1, 1, . . . , 1) −→W = 2m.
This allows us to express the input only with a single r.v. W and the distribution of W isuniform. Why uniform?
Things to design
The design of the digital communication system means the design of two things: (i) channelencoder, say f ; (ii) channel decoder, say g. See Fig. 1. One crucial thing to consider in designingthe encoder and the decoder is the behavior of channel. As mentioned earlier, the channel isan enemy against the communication system because it induces errors, making the system arandom function. So the encoder and the decoder should be designed so as to protect againstsuch errors. A natural way to protect against the errors is to add some redundancy. Noticein our conversation that we say again when the communication is not successful. Inspired bythis, we can think of a sequence of symbols instead of a single quantity for the channel encoderoutput, say (X1, X2, . . . , Xn). Here we use a shorthand notation Xn := (X1, X2, . . . , Xn) forsimplicity, and n is called code length. Note here that n has nothing to do with the super-symbolsize employed in the source coding context. Denote by Y n the output of the channel. The goalof the decoder g is to infer W given the channel output Y n. Here as we can easily imagine,there is a challenge in decoding W . The challenge is that Y n is not a deterministic function ofXn. Actually if the channel were deterministic, then the function g is nothing but an inversefunction of the concatenation of the two: f and channel. But the problem is that the channel isnot deterministic. So the design of g is not that simple. Actually the design of g requires a deepunderstanding of how the channel behaves. So before getting into details as to how to design fand g, let’s briefly talk about how the channel behaves as well as how to model it.
Channel modeling
Let Xi and Yi be input and output of the channel at time i, respectively. One typical way tocapture the randomness of the channel is via a conditional distribution: p(y|x). To give you anidea, let us consider one concrete example: binary symmetric channel (BSC). The other example
2

channel
encoderchannel
channel
decoder
Figure 1: Channel coding problem setup
that one can think of is: binary erasure channel (BEC). But this is the one that we studied inthe past (Lecture 4). So let’s consider only the BSC.
In the BSC, Yi is a flipped version of Xi with probability, say p (called crossover probability):p(y|x) = p when y 6= x. So the relation between Xi and Yi is captured by the following:
Yi =
{Xi, w.p. 1− p;Xi ⊕ 1, w.p. p.
Another simpler way to represent this is:
Yi = Xi ⊕ Zi
where Zi ∼ Bern(p). Usually we consider a so called mememoryless channel in which the noisesare independent across different time instants. So one natural assumption is that Zi’s are i.i.d.
Two performance metrics
Let us go back to our main business, which is to design f and g such that communication ispossible. But to this end, we need to fully understand what it means by possible communication.To explain what the possible communication means, we need to rely on two performance metricsand the relationship between the two.
The first performance metric is the one that captures the amount of bits that we wish to transmit.Suppose W ∈ {1, 2, . . . ,M}. Then, the total number of bits that we intend to send is logM .Since code length is n, the number of channels (time instants) that we use is n and hence, thenumber of bits transmitted per channel use (called data rate) is
R =logM
nbits/channel use.
The second performance metric is the one which captures the decoding quality. Since the channelis random, we cannot always guarantee the decoded message (say W ) to be the same as theoriginal message W . So the decoding quality can be captured by the probability of an errorevent:
Pe := Pr{W 6= W}.
The smaller Pe, the better the decoding quality.
Optimization problem
With these two performance metrics, Shannon came up with a very natural optimization problemto be explained soon. He then came up with a concept of possible communication. Let us firsttake a look at the optimization problem. One can easily expect that there should be tradeoff
3

relationship between R and Pe. The larger R, the larger Pe and vice versa. So one naturaloptimization problem is: Given R and n:
P ∗e := min
f,gPe.
What Shannon realized is that unfortunately, this is again a non-convex optimization problem,being very difficult to solve. So Shannon took a different approach, as he did for the sourcecoding theorem. This is, to approximate! In other words, he attempted to develop upper andlower bounds on P ∗
e .
In the process of doing this, he discovered something very interesting and came up with a conceptof possible communication. What he found is that when R is below some value, an upper boundon P ∗
e can be made arbitrarily close to 0 as n increases. This implies that in that case, actualP ∗e can be made very small. He also found that when R is above some value, an lower bound
on P ∗e cannot be made arbitrarily close to 0 no matter what we do. This implies that in that
case, actual P ∗e cannot be made very small.
From this observation, he then came up with the concept of possible communication. We saythat communication is possible if one can make P ∗
e arbitrarily close to 0 as n → ∞; otherwisecommunication is said to be impossible. He also came up with a follow-up natural concept ofachievable rate. We say that data rate R is achievable if we can make P ∗
e → 0 as n→∞ givenR; otherwise R is said to be not achievable.
Channel coding theorem
Moreover, Shannon made a very interesting observation. What he observed is that the thresholdbelow which communication is possible and above which communication impossible is sharp. Inother words, there is a sharp phase transition on the achievable rate. He then called that limitchannel capacity and denoted it by C. This forms the channel coding theorem:
The maximum achievable rate is channel capacity C.
Now from the next lecture on, we will try to prove this theorem. Specifically we will prove twothings:
R ≤ C =⇒ Pe → 0
R > C =⇒ Pe 9 0.
The first is called the achievability proof or the direct proof. The second is called the converseproof. Notice that the contraposition of the second statement is:
Pe → 0 =⇒ R ≤ C,
which is exactly the converse of the first statement.
Looking ahead
Next time, we will prove the achievability for a simple example. Gaining insights from theexample, we will later prove the acheivability for a general channel specified by an arbitraryconditional distribution p(y|x).
4

EE623 Information Theory October 7, 2019KAIST, Fall 2019 Changho Suh ([email protected])
Lecture 11: Achievability proof of the binary erasure channel
Recap
Last time we introduced the channel coding problem setup. Specifically we came up with aprecise mathematical statement of channel coding theorem which was only vaguely stated inthe beginning of this course. To this end, we first took into account two performance metrics:(i) data rate R := logM
n (bits/channel use); (ii) probability of error Pe := Pr(W 6= W ). Herethe message W ∈ {1, 2, . . . ,M} and n indicates code length (the number of channels used). Inan effort to understand the tradeoff relationship between the two performance metrics, we thenconsidered the following optimization problem: Given R and n:
P ∗e = min
f,gPe
where f and g indicate channel encoder and decoder respectively. Unfortunately, Shannon couldnot solve this problem. Instead he looked into upper and lower bounds. In the process of doingthis, he made a very interesting observation: If R is less then a threshold, say C, then Pe canbe made arbitrarily close to 0 as n→∞; otherwise, Pe 9 0 no matter what we do. This leadsto a natural concept of achievable rate: data rate R is said to be achievable if given R we canmake Pe → 0. This finally formed the channel coding theorem:
Maximum achievable rate = C.
The channel coding theorem requires the proof of two parts. The first one is: R ≤ C =⇒ Pe → 0.To this end, we need to come up with an achievable scheme such that given R ≤ C, one canmake Pe → 0. Hence, the proof is so called the achievability proof. The second part to proveis: R > C =⇒ Pe 9 0. Notice that the contraposition of this statement is: Pe → 0 =⇒ R ≤ C,which is exactly the opposite of the statement for the first part proof. Hence, it is so called theconverse proof.
Today’s lecture
In today’s lecture, we will attempt to prove the achievability. Specifically we will try to gainsome insights from a simple channel example: the binary erasure channel (BEC). It turns outthe BEC provides significant insights into proving the achievability for arbitrary channels. Oncewe are equipped with enough insights, we will later attack a fairly general channel model setting.
Binary erasure channel (BEC)
Remember in the BEC that the channel output reads:
Yi =
{Xi, w.p. 1− p;e, w.p. p,
where e stands for “erasure” (garbage) and p indicates the erasure probability. As mentionedearlier, we consider a memoryless channel in which noises are independent across different timeinstances.
1

First of all, let’s guess what the channel capacity C is. Actually one can make a naive guessbased on the following observation: the channel is perfect w.p. 1 − p; erased w.p. p; and theerasure (garbage) does not provide any information w.r.t. what we transmit. This naturallyleads to: C is at most 1 − p. Then, a question arises: Is this achievable? Let’s think abouta very easy case in which the transmitter knows all erasure patterns across all time instancesbeforehand. Of course this is far from reality. But just for simplicity, let’s think about thiscase for the time being. In this case, one can readily achieve 1 − p. The achievable scheme is:Transmit a bit whenever the channel is perfect. Since the perfect channel probability is 1 − p,by the Law of Large Number (LLN), we can achieve 1− p as n tends to infinity.
Now let’s consider the realistic scenario in which we cannot predict the future events and thusthe transmitter has no idea of erasure patterns. In this case, we cannot apply the above naivetransmission scheme because each transmission of a bit is not guaranteed to be successful dueto the lack of the knowledge of erasure patterns. Perhaps one may imagine that it is impossibleto achieve 1− p. But it turns out that very interestingly one can still achieve 1− p even in thisrealistic setup.
How to encode?
Here is a transmission scheme. First fix R arbitrarily close to 1 − p. Now given R, what isM (the cardinality of the range of the message W )? Since R := logM
n , one needs to set as:M = 2nR. So the message W takes one of the values among 1, 2, . . . , 2nR.
Next, how to encode the message W? In other words, what is a mapping rule between W andXn? Here we call Xn codeword1. It turns out Shannon’s encoding rule, to be explained inthe sequel, enables us to achieve R = 1 − p. Shannon’s encoding is extremely simple - it lookseven dumb! (You’ll see why soon). The idea is to generate a random binary string given anyW = w. In other words, for any W = w, every component of Xn(w) follows a binary r.v.with parameter 1
2 and those are independent with each other, i.e., Xi(w)’s are i.i.d. ∼ Bern(12)across all i’s. These are i.i.d. also across all w’s. This looks like a really dumb scheme. Butsurprisingly Shannon showed that this dumb scheme can achieve the rate of 1 − p. Here thereis a terminology which indicates a collection (book) of Xi(w)’s. It is called codebook.
How to decode?
Let’s move onto the decoder side. Obviously the decoder input is a received signal Y n (channeloutput). Here one can make a reasonable assumption on the decoder: the codebook (the collec-tion of Xi(w)’s) is known. This assumption is realistic because this information is the one thatsuffices to share only at the beginning of communication. Once this information is shared, wecan use this all the time until communication is terminated.
Now the question is: How to decode W from Y n, assuming that the codebook is known? Whatis an optimal way of decoding W? Remember the second performance metric: the probabilityof error Pe := Pr(W 6= W ). Since the channel is not deterministic (i.e., random), the onlything that we can do for the best is to minimize the probability of error as small as possible.So the optimal decoder can be defined as the one that minimizes the probability of error. Analternative way to define the optimal decoder is: Optimal decoder is the one that maximizes thesuccess probability : Pr(W = W ). But here the received signal is given because it is an input tothe decoder. So the success probability should be a conditional probability:
Pr(W = W |Y n = yn).
1The word of codeword was used to indicate the output of the source encoder in prior lectures. It is a sort ofconvention to use the same word also to indicate the output of channel encoder.
2

Then, a more formal definition of the optimal decoder is:
W = arg maxw
Pr(W = w|Y n = yn).
Actually there is a terminology which indicates such optimal decoder. Notice that Pr(W =w|Y n = yn) is the probability after an observation yn is made; and Pr(W = w) is so called thea priori probability because it is the one known beforehand. Hence, Pr(W = w|Y n = yn) iscalled the a posteriori probability. Observe that the optimal decoder is the one that MaximizesA Posteriori (MAP) probability. So it is called the MAP decoder. The MAP decoder acts as anoptimal decoder for many interesting problems not limited to this problem context. As long as aproblem of interest is an inference problem (infer X from Y when X and Y are probabilisticallyrelated), then the optimal decoder is always the MAP decoder.
In fact, this MAP decoder can be simplified further in many cases including our case as a specialcase. Here is how it is simplified. Using the definition of conditional probability, we get:
Pr(W = w|Y n = yn) =Pr(W = w, Y n = yn)
Pr(Y n = yn)
=Pr(W = w)
Pr(Y n = yn)· Pr(Y n = yn|W = w).
Here one thing to notice is that Pr(W = w) = 12nR - it is irrelevant to w. Also Pr(Y n = yn)
is not a function of w. This implies that it suffices to consider only Pr(Y n = yn|W = w) infiguring out when the above probability is maximized. Hence, we get:
W = arg maxw
Pr(W = w|Y n = yn)
= arg maxw
Pr(Y n = yn|W = w).
Observe that given W = w, Xn is known as xn(w). Hence,
W = arg maxw
Pr(Y n = yn|W = w)
= arg maxw
Pr(Y n = yn|Xn = xn(w),W = w).
Also given Xn = xn(w), Y n is a sole function of the channel, meaning that given Xn = xn(w),Y n is independent of w. Hence,
W = arg maxw
Pr(Y n = yn|Xn = xn(w),W = w)
= arg maxw
Pr(Y n = yn|Xn = xn(w)).
Notice that Pr(Y n = yn|Xn = xn(w)) is nothing but a conditional distribution, given by thechannel, which is easy to compute. Actually there is another name for the conditional distribu-tion: likelihood. So the decoder is called the Maximum Likelihood (ML) decoder.
How to derive the ML decoder?
It turns out the ML decoder is extremely simple in our problem context. Let’s see this througha very simple example where n = 4 and R = 1
2 . In this example, M = 2nR = 4. Consider aparticular codebook example as follows:
Xn(1) = 0000;
Xn(2) = 0110;
Xn(3) = 1010;
Xn(4) = 1111.
3

Suppose yn = 0e00. Then, we can easily compute the likelihood P(yn|xn(w)). For instance,
P(yn|xn(1)) = (1− p)3p
because the channel is perfect three times (time 1, 3 and 4), while being erased at time 2. Onthe other hand,
P(yn|xn(2)) = 0
because the third bit 1 does not match y3 = 0, and this is the event that would never happen,meaning that the probability must be 0. In other words, the second message is incompatiblewith the received signal yn. Then, what is the ML decoding rule? Here is how it works.
1. We eliminate all the messages which are incompatible with the received signal.
2. If there is only one message that survives, then we declare the survival is the correct messagethat the transmitter sent.
However, this procedure is not sufficient to describe the ML decoding rule. The reason is thatwe may have a different erasure pattern that confuses the rule. To see this clearly, consider thefollowing concrete example. Suppose that the received signal is now yn = (0ee0). Then, we seethat
Xn(1) = (1− p)2p2;
Xn(2) = (1− p)2p2.
Now the two messages (1 and 2) are compatible and those likelihood functions are equal. Inthis case, what we can do for the best is to flip a coin, choosing one out of the two in a randommanner. This forms the ML decoding rule.
3. If there are multiple survivals, choose one randomly.
Look ahead
Next time, we will demonstrate that we can achieve the rate of 1 − p under the optimal MLdecoding rule.
4

EE623 Information Theory October 14, 2019KAIST, Fall 2019 Changho Suh ([email protected])
Lecture 12: Achievability proof of BEC & BSC
Recap
Last time, we claimed that the capacity of the BEC with erasure probability is
CBEC = 1− p.
We then attempted to prove achievability: if R < 1 − p, we can make Pe arbitrarily close to 0as n → ∞. We employed a random codebook where each component Xi(w) of the codebookfollows Bern(12) and i.i.d. across all i ∈ {1, . . . , n} and w ∈ {1, . . . , 2nR}. We also employedthe optimal decoder: the maximum likelihood (ML) decoder in our problem context where themessage W is uniformly distributed. We then tried to complete achievability proof, by showingthat Pe → 0 under the problem setup.
Today’s lecture
Today we are going to complete this proof. We will then consider another channel examplewhich turns out give further insights into a general channel setting. The channel is the one thatwe saw earlier: the binary symmetric channel.
Probability of error
The probability of error is a function of codebook C. So here we are going to investigatethe average error probability EC [Pe(C)] taken over all possible random codebooks, and willdemonstrate that EC [Pe(C)] approaches 0 as n → ∞. This then implies the existence of anoptimal deterministic codebook, say C∗, such that Pe(C∗) → 0 as n → ∞ (Why? See PS4 fordetails), which completes achievability proof. Consider:
EC [Pe(C)](a)=∑c
Pr(C = c)Pr(W 6= W |C = c)
(b)= Pr(W 6= W )
(c)=
2nR∑w=1
Pr(W = w)Pr(W 6= w|W = w
) (1)
where (a) follows from the fact that Pr(C = c) indicates the probability that codebook is chosenas a particular realization c; (b) and (c) are due to the total probability law (check Ch. 1 and 2in BT if you do not get it).
Now consider Pr(W 6= w|W = w). Notice that [X1(w), . . . , Xn(w)]’s are identically distributedover all w’s. This means that the way that the wth codeword is constructed is exactly the samefor all w’s. This implies that Pr(W 6= w|W = w) is irrelevant of what the particular value of wis, meaning that
Pr(W 6= w|W = w) is the same for all w.
1

This together with (1) gives:
EC [Pe(C)] = Pr(W 6= 1|W = 1
)= Pr
2nR⋃w=2
{W = w}|W = 1
.(2)
Here the second equality is due to the fact that {W 6= 1} implies that W = w for some w 6= 1. Ingeneral, the probability of the union of multiple events is not that simple to compute. Actuallyit is quite complicated especially when it involves a large number of multiple events. Even forthe three-event case (A,B,C), the probability formula is not that simple:
Pr(A ∪B ∪ C) =Pr(A) + Pr(B) + Pr(C)
− Pr(A ∩B)− Pr(A ∩ C)− Pr(B ∩ C) + Pr(A ∩B ∩ C).
Even worse, the number of associated multiple events here in (2) is 2nR−1 and this will make theformula of that probability very complicated. So the calculation of that probability is not thatsimple. Of course, Shannon realized the difficulty of the calculation. To make some progress,he took an indirect approach as he did in the proof of the source coding theorem. He did notattempt to compute the probability of error exactly. Instead, he intended to approximate it!Specifically he tried to derive an upper bound because at the end of day what we want to showis that the probability of error approaches 0. Note that if an upper bound goes to zero, thenthe exact quantity also approaches 0. We have a very well-known upper bound w.r.t. the unionof multiple events. That is, the union bound : for events A and B,
Pr(A ∪B) ≤ Pr(A) + Pr(B).
The proof is immediate because Pr(A ∩B) ≥ 0.
Now applying the union bound to (2), we get:
EC [Pe(C)] ≤2nR∑w=2
Pr(W = w|W = 1
)= (2nR − 1)Pr
(W = 2|W = 1
)where the equality follows from the fact that the codebook employed is symmetric w.r.t messageindices. The event of W = 2 implies that message 2 is compatible; otherwise, W cannot bechosen as 2. Using the fact that for two events A and B such that A implies B, Pr(A) ≤ Pr(B),we get:
EC [Pe(C)] ≤ (2nR − 1)Pr (message 2 is compatible|W = 1)
≤ 2nRPr (message 2 is compatible|W = 1) .
Notice that the fact that message 2 is compatible implies that for time i in which the transmittedsignal is not erased, Xi(2) must be the same asXi(1); otherwise, message 2 cannot be compatible.To see this clearly, let B = {i : Yi 6= e}. Then, what the above means is that we get:
EC [Pe(C)] ≤ 2nRPr
(⋂i∈B{Xi(1) = Xi(2)}|W = 1
)
= 2nR(
1
2
)|B| (3)
2

where the equality is due to the fact that Pr(Xi(1) = Xi(2)) = 12 and the codebook is indepen-
dent across all i’s.
Now here one key thing to notice is that due to the LLN, for sufficiently large n:
|B| ≈ n(1− p).
This together with (3) yields:
EC [Pe(C)] . 2n(R−(1−p)).
Hence, EC [Pe(C)] can be made arbitrarily close to 0 as n → ∞, as long as R < 1 − p. Thiscompletes achievability proof.
Binary symmetric channel (BSC)
Before generalizing to arbitrary channels, let’s exercise a bit more, exploring the binary sym-metric channel (BSC). The reason is that the techniques employed in the BEC achievabilityproof are not enough for generalization, while the techniques that we will learn in the BSCachievability proof turn to provide enough insights into extension.
Remember in the BSC that:
Yi = Xi ⊕ Ziwhere Zi’s are i.i.d. ∼ Bern(p). Without loss of generality, assume that p ∈ (0, 12); otherwise,we can flip all 0’s and 1’s to 1’s and 0’s, respectively.
Let’s start with claiming what the capacity is:
CBSC = 1−H(p)
where H(p) := p log 1p + (1− p) log 1
1−p . For the rest of this lecture, we will prove achievability:if R < 1−H(p), one can make the probability of error arbitrarily close to 0 as n→∞.
Encoder & Decoder
The encoder that we will employ is exactly the same as before: the random code where Xi(w)’sare i.i.d. ∼ Bern(12) across all i’s and w’s. We will also use the optimal decoder, which is theML decoder:
WML = arg maxw
P (yn|xn(w)) .
But the way that we compute the likelihood function is different from that in the BEC case.Let’s see this difference through the following example. Suppose that (n,R) = (4, 12) and thecodebook is:
Xn(1) = 0000;
Xn(2) = 1110;
Xn(3) = 1010;
Xn(4) = 1111.
Suppose that the received signal yn is (0100). Then, the likelihood functions are:
P(yn|xn(1)) = (1− p)3p1;P(yn|xn(2)) = (1− p)2p2;P(yn|xn(3)) = (1− p)p3;P(yn|xn(4)) = (1− p)p3.
3

Here one thing to notice is that unlike the BEC case, all the messages are compatible becausethe likelihood functions are strictly positive. So we need to now compare all the functions tochoose the message that maximizes the function. Since we assume that p ∈ (0, 12) without lossof generality, in the above example, the first message is the maximizer. Notice that it has theminimum number of flips (marked in red) and the flipping probability is smaller than 1
2 , andhence, the corresponding likelihood function is maximized.
From this, one can see that the number of non-matching bits (number of flips) plays a crucialrole in a decision:
d(xn, yn) := |{i : xi 6= yi}| .
This is so called the Hamming distance. Using this, the ML decoder can be re-written as:
WML = arg minwd(xn(w), yn).
Now what remains to do is to show that one can make the probability of error arbitrarily closeto 0 as n→∞, when using the ML decoder. However, here we will not employ the ML decoderbecause of two reasons. The first is that the error probability analysis is a bit complicated.The second one is more critical: the proof technique is not extensible to general cases in whichchannels are arbitrary. Now then how can we prove the achievabiliy without using the MLdecoder? Fortunately, there is a different yet suboptimal decoder under which the achievabilityproof can be greatly simplified as well as which still achieves 1 −H(p). More importantly, thesuboptimal decoder that we will describe soon is extensible. So we are going to employ suchsuboptimal decoder to prove the achievability.
A suboptimal decoder
The suboptimal decoder that we will employ is inspired by a key observation that one can make.Notice that the input to the decoder is Y n and codeword is available at the decoder, i.e., Xn(w)is known for all w’s. Now observe that
Y n ⊕Xn = Zn
and we know the statistics of Zn: i.i.d. ∼ Bern(p).
Suppose that actually transmitted signal is Xn(1). Then,
Y n ⊕Xn(1) = Zn ∼ Bern(p).
On the other hand, for w 6= 1,
Y n ⊕Xn(w) = Xn(1)⊕Xn(w)⊕ Zn.
Here the key observation is that the statistics of the resulting sequence is Bern(12). Notice thatthe sum of any two independent Bernoulli r.v. is Bern(12), as long as at least one r.v. followsBern(12) (Why?). This motivates us to employ the following decoding rule.
1. Compute Y n ⊕Xn(w) for all w’s.
2. Eliminate messages such that the resulting sequence is not typical w.r.t. Bern(p). Moreprecisely, let
A(n)ε := {zn : 2−n(H(p)+ε) ≤ p(zn) ≤ 2−n(H(p)−ε)}
be a typical set w.r.t. Bern(p). Eliminate all w’s such that Y n ⊕Xn(w) /∈ A(n)ε .
4

3. If there is only one message that survives, then declare the survival is the correct message.Otherwise, declare an error.
Note that the error event is of two types: (i) multiple survivals; (ii) no survival.
Probability of error
We are now ready to analyze the probability of error to complete achievability proof. Fornotational simplicity, let Pe := EC [Pe(C)]. Using exactly the same argument that we made inthe BEC case, we can get:
Pe := EC [Pe(C)] = Pr(W 6= 1|W = 1
).
As mentioned earlier, the error event is of the two types: (i) multiple survivals; (ii) no survival.
The multiple-survival event implies that there exists w 6= 1 such that Y n ⊕Xn(w) ∈ A(n)ε . The
no-survival event implies that even the Y n ⊕ Xn(1) w.r.t. the correct message “1” is not a
typical sequence, meaning that Zn /∈ A(n)ε . Hence, we get:
Pe = Pr(W 6= 1|W = 1
)≤ Pr
⋃w 6=1
{Y n ⊕Xn(w) ∈ A(n)ε } ∪ {Zn /∈ A(n)
ε }|W = 1
(a)
≤2nR∑w=2
Pr({Y n ⊕Xn(w) ∈ A(n)
ε }|W = 1)
+ Pr(Zn /∈ A(n)
ε |W = 1)
(b)= (2nR − 1)Pr
(Y n ⊕Xn(2) ∈ A(n)
ε |W = 1)
+ Pr(Zn /∈ A(n)
ε |W = 1)
(c)≈ (2nR − 1)Pr
(Y n ⊕Xn(2) ∈ A(n)
ε |W = 1)
(4)
where (a) follows from the union bound; (b) is by symmetry of the codebook; and (c) followsfrom the fact that Zn is a typical sequence w.h.p due to the WLLN. Now observe that
Y n ⊕Xn(2) = Xn(1)⊕Xn(2)⊕ Zn ∼ Bern
(1
2
).
How to compute Pr(Y n ⊕ Xn(2) ∈ A(n)ε |W = 1)? To compute this, we need to consider two
quantities: (i) the total number of possible sequences that Y n ⊕Xn(2) ∼ Bern(12) can take on;
(ii) the size of the typical set |A(n)ε |. Specifically, we have:
Pr(Y n ⊕Xn(2) ∈ A(n)
ε |W = 1)
=
∣∣∣A(n)ε
∣∣∣total number of Bern(12) sequences
Note that the total number of Bern(12) sequences is 2n and |A(n)ε | ≤ 2n(H(p)+ε) (Why?). Hence,
Pr(Y n ⊕Xn(2) ∈ A(n)
ε |W = 1)≤ 2n(H(p)+ε)
2n.
This together with (4), we get:
Pe . 2n(R−(1−H(p)−ε)).
5

Since ε can be made arbitrarily close to 0, we can conclude that if R < 1−H(p), then Pe → 0as n→∞. This completes the proof.
Look ahead
We have proved achievability for BSC. We will defer the converse proof for the time being. Thereason is that it turns out the converse proof technique can be applied to a very general problemcontext directly. So next time, we will extend achievability proof to the general case in whichthe channel is characterized by an arbitrary conditional distribution p(y|x). Later we will proveconverse for the general case.
6

EE623 Information Theory October 16, 2019KAIST, Fall 2019 Changho Suh ([email protected])
Lecture 13: Achievability proof of DMC
Recap & outline
Last time, we have proved the achievability for BSC. We will defer the converse proof for thetime being. The reason is that it turns out the converse proof technique can be applied to avery general problem context directly. So we will first extend achievability proof to the generalcase in which the channel is characterized by an arbitrary conditional distribution p(y|x). Laterwe will prove converse for the general case.
Discrete memoryless channel (DMC)
The general channel that we will consider is the one so called the discrete memoryless channel
(DMC). Let’s start with the definition of the channel. We say that a channel is DMC if inputand output are on discrete-alphabet sets and the following condition is satisfied:
p(yi|xi, xi−1, yi−1,W ) = p(yi|xi).
This condition is called memoryless. Notice that given the current channel input xi, the currentoutput yi is independent of the past input/output (xi−1, yi−1) and any other things includingthe message W . Here one key property that we need to keep in our mind is:
p(yn|xn) =
n∏
i=1
p(yi|xi). (1)
This can be proved by using the memoryless property (check in PS5). It turns out this propertyplays a crucial role in proving achievability as well as converse. This will be clearer later.
Guess on the capacity formula
Let’s start by guessing the capacity formula for the DMC. Remember the capacity formulas ofthe BEC and BSC: CBEC = 1 − p; CBSC = 1 − H(p). Here one thing that we can say aboutis that these capacities are closely related to one key notion that we introduced earlier: mutual
information. Specifically what we can easily show is: when X ∼ Bern(12),
CBEC = 1− p = I(X;Y );
CBSC = 1−H(p) = I(X;Y ).
Also one can verify that for an arbitrary distribution of X,
CBEC = 1− p ≥ I(X;Y );
CBSC = 1−H(p) ≥ I(X;Y ).
Check this in PS5. Hence, what one can guess on the capacity formula from this is:
CDMC = maxp(x)
I(X;Y ). (2)
1

It turns out it is indeed the case. For the rest of this lecture, we will prove achievability: ifR < maxp(x) I(X;Y ), then the probability of error can be made arbitrarily close to 0 as n → ∞.
Encoder
The encoder that we will employ is a random code, meaning that Xi(w)’s are generated in ani.i.d. fashion according to some input distribution p(x). We know in the BEC and BSC thatthe input distribution is fixed as Bern(1
2). And one can verify that Bern(1
2) is the maximizer of
the above optimization problem (2). This motivates us to choose p(x) as:
p∗(x) = argmaxp(x)
I(X;Y ).
It turns out this choice enables us to achieve the capacity guessed in (2).
Decoder
As before, we also assume that the codebook is known at the decoder. We use the suboptimaldecoder that we employed in the BSC case. Remember that the suboptimal decoder is basedon a typical sequence and the fact that Y n ⊕ Xn = Zn. But one significant distinction in thegeneral DMC case is that Y n is a kind of arbitrary random function of Xn. So now what wecan do is to take a look at pairs of (Y n,Xn(w)) and to check if we can see a particular behaviorof the pair associated with the true codeword, compared to the other pairs w.r.t. the wrongcodewords.
To illustrate this clearly, let’s consider the following situation. Suppose that Xn(1) is actuallytransmitted, i.e., the message 1 is the correct one. Then, the joint distribution of the correctpair (xn(1), yn) would be:
p(xn(1), yn) = p(xn(1))p(yn|xn(1))
(a)=
n∏
i=1
p(xi(1))p(yi|xi(1))
=
n∏
i=1
p(xi(1), yi)
where (a) follows from the key property (1). This implies that the pairs (xi(1), yi)’s are i.i.dover i’s. Then, using the WLLN on the i.i.d. sequence of pairs, one can easily show that
1
nlog
1
p(Xn(1), Y n)−→ H(X,Y ) in prob.
Check in PS5. From this, one can say that
p(xn(1), yn) ≈ 2−nH(X,Y )
for sufficiently large n (Why?).
On the other hand, the joint distribution of the wrong pair (xn(w), yn) for w 6= 1 would be:
p(xn(w), yn) = p(xn(w))p(yn).
The reason is that yn is associated only with (xn(1), channel noise), which is independent ofxn(w). Remember that we use a random code in which codewords are independent with each
2

other. Also here one can verify that yn is also i.i.d. (check!). Again using the WLLN on xn(w)and yn, one can get:
p(xn(w), yn) ≈ 2−n(H(X)+H(Y ))
for sufficiently large n. This motivates the following decoder. Let
A(n)ǫ =
{
(xn, yn) : 2−n(H(X)+ǫ) ≤ p(xn) ≤ 2−n(H(X)−ǫ)
2−n(H(Y )+ǫ) ≤ p(yn) ≤ 2−n(H(Y )−ǫ)
2−n(H(X,Y )+ǫ) ≤ p(xn, yn) ≤ 2−n(H(X)+H(Y )−ǫ)}
.
Then, the decoding rule is as follows:
1. Eliminate all the messages w’s such that (xn(w), yn) /∈ A(n)ǫ .
2. If there is only one message that survives, then declare that the survival is the correctmessage.
3. Otherwise, declare an error.
Similar to the previous case, note that the error event is of two types: (i) multiple survivals (orone wrong survival); (ii) no survival.
Probability of error
We are now ready to analyze the probability of error to complete the achievability proof. Usingexactly the same argument that we made in the BEC case, we can get:
Pe := EC [Pe(C)] = Pr(
W 6= 1|W = 1)
.
Now as mentioned earlier, the error event is of the two types: (i) multiple survivals; (ii) nosurvival. The multiple-survival event implies the existence of the wrong pair being a jointly
typical pair, meaning that there exists w 6= 1 such that (Xn(w), Y n) ∈ A(n)ǫ . The no-survival
event implies that even the correct pair is not jointly typical, meaning that (Xn(1), Y n) /∈ A(n)ǫ .
Hence, we get:
Pe = Pr(
W 6= 1|W = 1)
≤ Pr
⋃
w 6=1
{(Xn(w), Y n) ∈ A(n)ǫ } ∪ {(Xn(1), Y n) /∈ A(n)
ǫ }|W = 1
(a)
≤
2nR
∑
w=2
Pr(
{(Xn(w), Y n) ∈ A(n)ǫ }|W = 1
)
+ Pr(
(Xn(1), Y n) /∈ A(n)ǫ |W = 1
)
(b)
≤ 2nRPr(
(Xn(2), Y n) ∈ A(n)ǫ |W = 1
)
+ Pr(
(Xn(1), Y n) /∈ A(n)ǫ |W = 1
)
(c)≈ 2nRPr
(
(Xn(2), Y n) ∈ A(n)ǫ |W = 1
)
3

where (a) follows from the union bound; (b) is by symmetry of the codewords w.r.t. messageindices; and (c) follows from the fact that (Xn(1), Y n)) is jointly typical for sufficiently large nw.h.p due to WLLN. Now observe that Xn(2) and Y n are independent. So the total number ofpair patterns w.r.t. (Xn(2), Y n) would be:
total number of (Xn(2), Y n) pairs ≈ 2nH(X) · 2nH(Y )
= 2n(H(X)+H(Y )).
On the other hand, the cardinality of the jointly typical pair set A(n)ǫ is:
|A(n)ǫ | ≈ 2nH(X,Y )
(Why?). Hence, we get:
Pr(
Y n ⊕Xn(2) ∈ A(n)ǫ |W = 1
)
=
∣
∣
∣A
(n)ǫ
∣
∣
∣
total number of (Xn(2), Y n) pairs
≈2n(H(X,Y )−H(X)−H(Y ))
2n
=2−nI(X;Y )
2n.
Using this, we get:
Pe . 2n(R−I(X;Y )).
So one can conclude that if R < I(X;Y ), then Pe → 0 as n → ∞. Since we choose p(x) such thatI(X;Y ) is maximized, we see that maxp(x) I(X;Y ) is achievable, which completes the proof.
Look ahead
So far we have proved achievability for discrete memoryless channels. Next time, we will proveconverse to complete the proof of channel coding theorem.
4

EE623 Information Theory October 28, 2019KAIST, Fall 2019 Changho Suh ([email protected])
Lecture 14: Converse proof
Recap & outline
Last time, we have proven achievability for discrete mememoryless channels which are describedby conditional distribution p(y|x):
R < maxp(x)
I(X;Y ) =⇒ Pe → 0.
Today’s lecture
Today we will prove converse:
Pe → 0 =⇒ R < maxp(x)
I(X;Y ).
The proof relies on two important inequalities: (1) Fano’s inequality; (2) data processing in-equality (DPI). Let us start by studying the two inequalities.
Fano’s inequality
Fano’s inequality is one of the well-known inequalities that plays a significant role in the contextof inference problems. Here the inference problem is the one of which the task is to infer inputfrom output given that the input and output are related in a probabilistic manner. Notice in theinference problems that the input and output are probabilistically related, and so the only thingthat we can do w.r.t. the input from the output is to guess about the input. In a mathematicallanguage, the guess refers to inference. Actually the communication problem of our interestcan be viewed as an inference problem because the goal in the problem is to infer the messageW from the received signal Y n that is stochastically related to W . In this inference problemcontext, Fano’s inequality captures relationship between the following performance metrics:
Pe := Pr(W 6= W ) & H(W |W ).
Here what one can easily expect is that the smaller Pe, the smaller H(W |W ). Fano’s inequalitycaptures such relation. Remember in the converse converse that we need to come up with alower bound on Pe because at the end of the day, we intend to show that Pe 9 0 (when R > C),and the fact that a lower bound of Pe does not goes to 0 ensures the actual Pe not to convergeto 0. Here Fano’s inequality plays a role to provide such a lower bound. Actually a lower boundon Pe in terms of H(W |W ) can be written as an upper bound on H(W |W ) in terms of Pe. Andthe upper bound formula is well-known and we will focus on such upper-bound presentation:
Fano’s inequality: H(W |W ) ≤ 1 + Pe · nR. (1)
Notice that this indeed captures the tradeoff relationship between Pe and H(W |W ): the smallerPe, the more contracted H(W |W ). The proof of this is very simple. Let
E = 1{W 6= W}.
1

By the definition of the probability of error and the fact that E[1{W 6= W}] = Pr{W 6= W},E ∼ Bern(Pe). Starting with the fact that E is a function of (W, W ), we have:
H(W |W ) = H(W,E|W )
(a)= H(E|W ) +H(W |W , E)
(b)
≤ 1 +H(W |W , E)
(c)= 1 + Pr(E = 1) ·H(W |W , E = 1)
= 1 + Pe ·H(W |W , E = 1)
(d)
≤ 1 + Pe · nR
where (a) is due to a chain rule; (b) follows from the cardinality bound on entropy; (c) comesfrom the definition of conditional entropy; and (d) follows from the cardinality bound on entropy.
Data processing inequality (DPI)
The second inequality that plays a role in the converse proof is the data processing inequality,DPI for short. In words, the DPI says that any processed data of the original data cannotimprove the quality of inference. In our problem context, it means that the interference qualityon W based on Xn (let’s view this as original data) cannot be worse than that based on aprocessed data, say Y n. Actually the precise mathematical statement of the DPI is made in thecontext of a Markov process. So let’s first study what the Markov process is. We say that arandom process, say {Xi}, is a Markov process if
p(xi+1|xi, xi−1, . . . , x1) = p(xi+1|xi).
Here what this condition means is that given the current state xi, the future state xi+1 andthe past states xi−1’s are independent with each other. There is a very well-known graphicalrepresentation of such a Markov process. Suppose that (X1, X2, X3) forms a Markov process.Then, we represent it as:
X1 −X2 −X3.
The rationale behind this representation is based on the following observation: Given X2, itcan be removed from the above graph as it is known; but this removal leads (X3, X1) to bedisconnected, meaning that these have nothing to do with each other, in a statistical language,being independent. Note that the graph looks like a chain. So it is also called a Markov chain.
In our problem context, there is a Markov chain. First of all, one can show that (W,Xn, Y n)forms a Markov chain:
W −Xn − Y n.
The proof is straightforward. Given Xn, Y n is a sole function of the noise induced by thechannel, which has nothing to do with the message W , meaning that (Y n,W ) are independentwith each other.
The DPI is the one defined w.r.t. the Markov chain. Specifically it captures the relationshipbetween the following mutual information: I(W ;Xn), I(W ;Y n), I(Xn;Y n). Actually I(W ;Xn)captures somehow common information between W and Xn, hence it can be interpreted as theamount of information regarding W that one can infer from Xn. So it can be viewed as inferencequality on W when the inference is based on Xn. Similarly one can view I(W ;Y n) as inference
2

quality on W when the inference is based on Y n. Remember the verbal statement of the DPI:any processed data (say Y n) of the original data (say Xn) cannot improve inference quality onW , meaning that
I(W ;Y n) ≤ I(W ;Xn).
The proof of this is very simple. Starting with a chain rule and non-negativity of mutualinformation, we have:
I(W ;Y n) ≤ I(W ;Y n, Xn)
= I(W ;Xn) + I(W ;Y n|Xn)
(a)= I(W ;Xn)
(2)
where (a) follows from the fact that W −Xn − Y n. There is another DPI w.r.t. I(W ;Y n) andanother mutual information I(Xn;Y n). Note that Xn is closer to Y n compared to W . So onecan guess:
I(W ;Y n) ≤ I(Xn;Y n).
It turns out this is indeed the case. The proof is also very simple.
I(W ;Y n) ≤ I(W,Xn;Y n)
= I(Xn;Y n) + I(W ;Y n|Xn)
= I(Xn;Y n).
(3)
From (2) and (3), one can summarize that the mutual information between two ending termsin the Markov chain does not exceed the mutual information between any two terms that liein-between the two ends.
Looking at our problem setting, there is another term: W . It turns out this together with theabove Markov chain (W −Xn − Y n) forms a longer Markov chain:
W −Xn − Y n − W .
Notice that given Y n, W is completely determined regardless of (W,Xn) because it is a functionof Y n. Now applying the DPI, one can readily verify that
I(W ; W ) ≤ I(W ;Y n) (4)
I(W ; W ) ≤ I(W ;Xn) (5)
I(W ; W ) ≤ I(Xn; W ) (6)
I(W ; W ) ≤ I(Xn;Y n) (7)
I(W ; W ) ≤ I(Y n; W ). (8)
Converse proof
We are now ready to prove the converse with the two inequalities that we learned. Starting with
3

the fact that nR = H(W ) (why?), we have:
nR = H(W )
= I(W ; W ) +H(W |W )
(a)
≤ I(W ; W ) + 1 + Pe · nR(b)= I(W ; W ) + nεn(c)
≤ I(Xn;Y n) + nεn
= H(Y n)−H(Y n|Xn) + nεn
(d)= H(Y n)−
n∑i=1
H(Yi|Xi) + nεn
(e)
≤n∑
i=1
[H(Yi)−H(Yi|Xi)] + nεn
=
n∑i=1
I(Xi;Yi) + nεn
(f)
≤ nC + nεn
where (a) follows from Fano’s inequality (1); (b) comes from the definition of εn that we set as:
εn :=1
n(1 + nPeR);
(c) is due to the DPI (7); (d) follows from the memoryless channel property (p(Y n|Xn) =∏ni=1 p(Yi|Xi) and hence H(Y n|Xn) =
∑ni=1H(Yi|Xi)); (e) conditioning reduces entropy; and
(f) is due to the definition C := maxp(x) I(X;Y ). Now dividing by n on both sides, we get:
R ≤ C + εn.
If Pe → 0, then εn := 1n(1 + PenR) tends to 0 as n→∞. Hence, we get:
R ≤ C,
which completes the proof.
Look ahead
So far we have proved the channel coding theorem for a fairly general channel: discrete mem-oryless channel. But in the proof, we only showed the existence of an optimal code such thatunder the code Pe can be made arbitrarily close to 0 as n → 0. Next time, we will discussexplicit deterministic codes which approach (or exactly achieve) the capacity. This togetherwith the proof of the channel coding theorem forms all the contents of Part II. So right afterthe discussion on deterministic codes, we will embark on Part III.
4

EE623 Information Theory October 30, 2019KAIST, Fall 2019 Changho Suh ([email protected])
Lecture 15: Overview of Part III and supervised learning
Recap
Last time, we have proven the converse for discrete mememoryless channels to complete theproof of the channel coding theorem:
C = maxp(x)
I(X;Y ).
This completes Part II. Before moving onto Part III, let me tell you an interesting story behindthe development of the channel coding theorem, which later motivated some efforts on explicitcode constructions that we did not deal with in this course.
Initial reactions on Shannon’s work
The story started from interesting initial reactions that people had at the time on Shannon’swork. Actually people’s initial responses were not that good. Many people, especially commu-nication systems engineers, did not appreciate the work. The reasons are three-folded.
First and mostly importantly, many of the engineers did not understand what Shannon wastalking about. Perhaps they were not familiar with the concept of reliable (possible) commu-nication, achievable data rate and capacity. This might prevent them from grasping the gist ofthe theorem.
Second, even the smart engineers who understood the result had a pessimistic viewpoint onthe development of an optimal code because the optimal code, as per the achievability proof ofthe theorem, seems to require a sufficiently long code-length to achieve the capacity. So theybelieved that complexity is way too high, considering the technology of the day; and hence, theoptimal code is far from implementation.
Lastly, even the smart and optimistic engineers who appreciated the potential of implementationpossibly with an advanced technology emerging in the future were not that positive. The reasonis that Shannon did not really tell people exactly how to design an optimal code. His idea for theachievability proof is based on random coding - he never talked about how to explicitly constructsuch an optimal code. In other words, the proof only showed the existence of optimal codes.
Two major efforts
Due to these reasons, Shannon and his advocators including a few smart MIT folks made signif-icant efforts to develop explicit & deterministic optimal codes possibly with low implementationcomplexity. Actually Shannon himself failed to come up with a good deterministic code. Insteadhis advocators at MIT came up with some good codes. Here we will discuss two major effortsby them.
One effort was made by Robert G. Gallager1. He developed a code called “Low Density ParityCheck code” (LDPC code for short) in 1960. Obviously it is an explicit and deterministic code,meaning that it provides a detailed guideline as to how to design such a code. The performanceof the code is also remarkable. It has been shown that it approaches the capacity as the code
1He is the right person who wrote the Gallager’s note that I uploaded on the website. He is actually myacademic grandfather - an advisor of my PhD advisor.
1

length tends to infinity, although it does not match the capacity exactly. Encouragingly (perhapsespecially to you guys), he developed such a code during his “PhD study” as the first piece ofwork - meaning that you can also do that kind of great works in the near future!
Unfortunately, his work did not receive enough credits at that time. The main reason is that theLDPC code was still of high implementation complexity considering the digital signal processing(DSP) technology of the day.2 30 years later, however, the code was revived, receiving significantattention. The reason is that the code became an efficient code – the DSP technology had beenevolved, finally enabling the code to be implemented. Later the code was more appreciated witha more advanced DSP technology – it is now widely being employed in a variety of systems suchas LTE, WiFi, DMB3 and storage systems.
At the time when Gallager developed the LDPC code, he was not fully satisfied with his resultthough. The reason was that his code is not guaranteed to exactly achieve the capacity evenin the limit of code length. This motivated one of his PhD students, Erdal Arikan, to work ondeveloping the capacity-achieving deterministic code. It turned out Arikan could develop sucha code, called Polar code. It is a first capacity-achieving deterministic code. Interestingly, hecould develop the code in 2007, 30+ years later than his PhD day when the motivation began.4
Due to its great performance and low-complexity nature, it is now being seriously consideredfor implementation in a variety of systems.
These are the two major efforts. Due to the interest of time, we will not cover these in thiscourse. If you are interested in details, I can instead share some course notes w.r.t. the Polarcode which I drafted in earlier semesters. Please let me know your interest. Unfortunately, Imade no course note for the LDPC code.
Summary of Part I and II
So far we have studied the core contents of information theory. In Part I, we learned three keynotions that arise in the field: (i) entropy; (ii) mutual information; (iii) the Kullback-Leibler(KL) divergence. In Part II, we explored the roles of such notions in the context of Shannon’s twomajor theorems: source coding theorem and channel coding theorem. Specifically we found thatthe entropy serves to characterize the fundamental limit on the number of bits that representinformation source, promised by source coding theorem; the mutual information serves as a keymeasure for the channel capacity, characterized in channel coding theorem.
Goal of Part III
Encouragingly, the key notions have proved quite instrumental in a widening array of otherfields and disciplines, ranging from social networks (e.g., community detection via Facebook’sfriendship graph), computational biology (e.g., DNA and RNA sequencing), to machine learningand deep learning.
The goal of Part III is to demonstrate such roles in one recent spotlight field that has beenrevolutionized in the past decades: machine learning and deep learning. In particular, we aim atinvestigating: (i) the role of entropy for one of the prominent methodologies of machine learning,called supervised learning ; (ii) the role of KL divergence for another popular methodology, calledunsupervised learning ; (iii) the role of mutual information in the design of machine learning
2Nonetheless, he became an MIT faculty right after graduation mainly due to that piece of work. It is fortunatethat there are some serious & patient scholars who appreciate the potential of the great piece of work which doesnot demonstrate any immediate impact upon the world.
3It is the name of the technology for a digital broadcast system, standing for Digital Multmedia Broadcasting.4Remarkably he devoted most of his time to the development of the code, and finally succeeded. How dramatic
the story is!
2

algorithms that ensure fairness for disadvantageous against advantageous groups.
During upcoming lectures
During the upcoming lectures (possibly three), we will focus on the first: the role of entropyfor supervised learning. Specifically we will first study what supervised learning is and thenformulate an optimization problem based on the methodology. Next we will demonstrate that theentropy plays a central role to define an objective function that leads to an optimal architecturefor such optimization problem. Lastly we will learn how to solve the optimization problemvia one powerful and computationally-efficient algorithm, called the gradient descent algorithm.The last process also includes programming implementation via one of the prominent and mostintuitive deep learning frameworks, named Pytorch. If you are not familiar with Pytorch, pleaseread the pytorch tutorial (uploaded on the course website), as well as try the last problem ofPS5.
Machine learning
Machine learning is about an algorithm which is defined to be a set of instructions that acomputer system can execute. Formally speaking, machine learning is the study of algorithmswith which one can train a computer system so that the trained system can perform a specifictask of interest. Pictorially, it means the following; see Fig. 1.CN18_1
computer system
(machine)
algorithm
training
(together w/ data)
Figure 1: Machine learning is the study of algorithms which provide a set of explicit instructionsto a computer system (machine) so that it can perform a specific task of interest. Let x be theinput which indicates information employed to perform a task. Let y be the output that denotesa task result.
Here the entity that we are interested in building up is a computer system, which is definitelya machine. Since it is a system (i.e., a function), it has the input and the output. The input,usually denoted by x, indicates information which is employed to perform a task of interest.The output, usually denoted by y, indicates a task result. For instance, if a task of interest islegitimate-emails filtering against spam emails, then x could be multi-dimensional quantities5:(i) frequency of a keyword like dollar signs $$$; (ii) frequency of another keyword, say winner.And y could be an email entity, e.g., y = +1 indicates a legitimate email while y = −1 denotesa spam email. In machine learning, such y is called a label. Or if an interested task is cat-vs-dogclassification, then x could be image-pixel values and y is a binary value indicating whether thefed image is a cat (say y = 1) or a dog (y = 0).
Machine learning is about designing algorithms, wherein the main role is to train (teach) thecomputer system (machine) so that it can perform such task well. In the process of designing
5In machine learning, such quantity is called the feature. Usually this refers to a key component that welldescribes characteristics of data.
3

algorithms, we use something that is data.
Why called “Machine Learning”?
One can easily see the rationale of the naming via changing a viewpoint. From a machine’sperspective, one can say that a machine learns the task from data. Hence, it is called machinelearning, ML for short. This naming was originated in 1959 by Arthur Lee Samuel. See Fig. 2.CN18_5
Arthur Samuel ’59
Father of machine learningcheckers
Figure 2: Arthur Lee Samuel is an American pioneer in the field of artificial intelligence, knownmostly as the Father of machine learning. He found the field in the process of developingcomputer checkers which later formed the basis of AlphaGo.
Arthur Samuel is actually one of the pioneers in the broader field of Artificial Intelligence (AI)which includes machine learning as a sub-field. The AI field is the study of creating intelligenceby machines, unlike the natural intelligence displayed by intelligent beings like humans andanimals. Since the ML field is about building up a human-like machine, it is definitely a sub-field of AI.
In fact, Arthur Samuel found the ML field in the process of developing a human-like computerplayer for a board game, called checkers; see the right figure in Fig. 1. He proposed manyalgorithms and ideas while developing computer checkers. It turns out those algorithms couldform the basis of AlphaGo, a computer program for the board game Go which defeated one ofthe 9-dan professional players, Lee Sedol with 4 wins out of 5 games in 2016.
Mission of machine learning
Since ML is a sub-field of AI, its end-mission is achieving artificial intelligence. So in view of theblock diagram in Fig. 1, the goal of ML is to design an algorithm so that the trained machinebehaves like intelligence beings.
Supervised learning
There are some methodologies which help us to achieve the goal of ML. One specific yet verypopular method is the one called:
Supervised Learning.
What supervised learning means is learning a function f(·) (indicating a functional of the ma-chine) with the help of a supervisor. See Fig. 3.
What the supervisor means in this context is the one who provides input-output samples. Ob-viously the input-output samples form the data employed for training the machine, usually
4

CN18_2
machine
Figure 3: Supervised Learning: Design a computer system (machine) f(·) with the help of asupervisor which offers input-output pair samples, called a training dataset {(x(i), y(i))}mi=1.
denoted by:
{(x(i), y(i))}mi=1, (1)
where (x(i), y(i)) indicates the ith input-output sample (or called a training sample or an exam-ple) and m denotes the number of samples. Using this notation (1), one can say that supervisedlearning is to:
Estimate f(·) using the training samples {(x(i), y(i))}mi=1. (2)
Optimization
A common way to estimate f(·) is through optimization. To understand what this means, letus first explain what optimization is.
Optimization is to choose an optimization variable that minimizes (or maximizes) a certainquantity of interest possibly given some constraints. There are two important quantities in thedefinition. One is the optimization variable which affects the interested quantity and is subjectto our design. This is usually a multi-dimensional quantity. The second is the certain quantityof interest that we wish to minimize (or maximize). This is called the objective function in thefield, and an one-dimensional scalar.
Objective function
Now what is the objective function in the supervised learning framework? To figure this out,we need to know about the objective that supervised learning wishes to achieve. In view of thegoal (2), what we want is obviously:
y(i) ≈ f(x(i)), ∀i ∈ {1, . . . ,m}.
A natural question that arises is then: How to quantify closeness (reflected in the “≈” notation)between the two quantities: y(i) and f(x(i))? One very common way that has been used in thefield is to employ a function, called a loss function, usually denoted by:
`(y(i), f(x(i))). (3)
One obvious property that the loss function `(·, ·) should have is that it should be small whenthe two arguments are close, while being zero when the two are identical. Using such loss
5

function (3), one can then formulate an optimization problem as:
minf(·)
m∑i=1
`(y(i), f(x(i))). (4)
How to introduce optimization variable?
Now what is optimization variable? Unfortunately, there is no variable. Instead we have adifferent quantity that we can optimize over: the function f(·), marked in red in (4). Thequestion is then: How to introduce optimization variable? A common way employed in the fieldis to represent the function f(·) with parameters (or called weights), denoted by w, and thenconsider such weights as an optimization variable. Taking this approach, one can then translatethe problem (4) into:
minw
m∑i=1
`(y(i), fw(x(i))) (5)
where fw(x(i)) denotes the function f(x(i)) parameterized by w.
The above optimization problem depends on how we define the two functions: (i) fw(x(i)) w.r.t.w; (ii) the loss function `(·, ·). In machine learning, lots of works have been done for the choiceof such functions.
A choice for fw(·)Around at the same time when the machine learning (ML) field was founded, one architecturewas suggested for the function fw(·) in the context of simple binary classifiers in which y takesone among the two options only, e.g., y ∈ {−1,+1} or y ∈ {0, 1}. The architecture is called:
Perceptron,
and was invented in 1957 by one of the pioneers in the AI field, named Frank Rosenblatt.Interestingly, Frank Rosenblatt was a psychologist. He was interested in how brains of intelligentbeings work and his study on brains led him to come up with the perceptron, and therefore gavesignificant insights into neural networks that many of you guys heard of.
How brains work
Here are details on how the brain structure inspired the perceptron architecture. Inside a brain,there are many electrically excitable cells, called neurons; see Fig. 4. Here a red-circled oneindicates a neuron. So the figure shows three neurons in total. There are three major propertiesabout neurons that led to the architecture.
The first is that a neuron is an electrical quantity, so it has a voltage. The second property isthat neurons are connected with each other through mediums, called synapses. So the main roleof synapses is to deliver electrical voltage signals across neurons. Depending on the connectivitystrength level of a synapse, a voltage signal from one neuron to another can increase or decrease.The last is that a neuron takes a particular action, called activation. Depending on its voltagelevel, it generates an all-or-nothing pulse signal. For instance, if its voltage level is above acertain threshold, then it generates an impulse signal with a certain magnitude, say 1; otherwise,it produces nothing.
Perceptron
6

CN18_3
neuron
voltage
activation
Figure 4: Neurons are electrically excitable cells and are connected through synapses.
The above three properties led Frank Rosenblatt to propose the perceptron architecture, asillustrated in Fig. 5. CN18_4
neuron
synapse
activation
Figure 5: The architecture of perceptron.
Let x be an n-dimensional real-valued signal: x := [x1, x2, . . . , xn]T . Suppose each component xiis distributed to each neuron, and let xi indicates a voltage level of the ith neuron. The voltagesignal xi is then delivered through a synapse to another neuron (placed on the right in the figure,indicated by a big circle). Remember that the voltage level can increase or decrease dependingon the connectivity strength of a synapse. To capture this, a weight, say wi, is multiplied to xiso wixi is a delivered voltage signal at the terminal neuron. Based on an empirical observationthat the voltage level at the terminal neuron increases with more connected neurons, Rosenblattintroduced an adder which simply aggregates all the voltage signals coming from many neurons,so he modeled the voltage signal at the terminal neuron as:
w1x1 + w2x2 + · · ·+ wnxn = wTx. (6)
Lastly in an effort to mimic the activation, he modeled the output signal as
fw(x) =
{1 if wTx > th,0 o.w.
(7)
where “th” indicates a certain threshold level. It can also be simply denoted as
fw(x) = 1{wTx > th}. (8)
7

Activation functions
Taking the percentron architecture in Fig. 5, one can then formulate the optimization problem (5)as:
minw
m∑i=1
`(y(i),1{wTx(i) > th}). (9)
This is an initial optimization problem that people came up with. However, people figuredout there is an issue in solving this optimization. The issue comes from the fact that theobjective function contains an indicator function, so it is not differentiable. It turns out non-differentiability makes the problem difficult to solve. This will be clearer soon in a later lecture.Please be patient until we get to the point. What can we do then? One typical way that peoplehave taken in the field is to approximate the activation function. There are many ways forapproximation. From below, we will investigate one of them.
Approximate the activation!
One popular way is to use the following function that makes a smooth transition from 0 to 1:
fw(x) =1
1 + e−wT x. (10)
Notice that fw(x) ≈ 0 when wTx is very small; it then grows exponentially with an increase inwTx; later grows logarithmically; and finally saturates as 1 when wTx is very large. Actuallythe function (10) is a very popular one used in statistics, called the logistic6 function. There isanother name for the function, which is the sigmoid7 function.
There are two good things about the logistic function. First it is differentiable. The second isthat it can serve as the probability for the output in the binary classifier, e.g., Pr(y = 1) wherey denotes the ground-truth label in the binary classifier. So it is interpretable.
Look ahead
Under the choice of the logistic activation, what is then a good choice for a loss function? Itturns out the entropy plays an important role in the design of an optimal loss function in somesense. Next time we will investigate in what sense it is optimal. We will then figure out howthe entropy comes up in the design of the optimal loss function.
6The word logistic comes from a Greek word which means a slow growth, like a logarithmic growth.7Sigmoid means resembling the lower-case Greek letter sigma, S-shaped.
8

EE623 Information Theory November 4, 2019KAIST, Fall 2019 Changho Suh ([email protected])
Lecture 16: Logistic regression
Recap
Last time we formulated an optimization problem for supervised learning based on the percetronarchitecture:
minw
m∑i=1
`(y(i), fw(x(i))). (1)
As an activation function, we considered a logistic function that is widely used in the field:
fw(x) =1
1 + e−wT x. (2)
I then mentioned that a concept related to entropy appears in the design of the optimal lossfunction.
Today’s lecture
Today we will prove this claim. Specifically what we are going to do are three folds. We willfirst investigate what it means by the optimal loss function. We will next figure out how entropycomes up in the design of the optimal loss function. Lastly we will also learn how to solve theoptimization problem.
Optimality in a sense of maximizing likelihood
A binary classifier with the logistic function (2) is called logistic regression. See Fig. 1 forillustration.
CN19_2
logistic
regression
Figure 1: Logistic regression
Notice that the range of the output y of the logistic regression is in between 0 and 1:
0 ≤ y ≤ 1.
1

Hence, one can interpret this as a probability quantity. Now the optimality of a classifier can bedefined under the following assumption inspired by such interpretation:
Assumption : y = Pr(y = 1|x). (3)
To understand what it means in detail, consider the likelihood of the ground-truth classifier:
Pr({y(i)}mi=1 | {x(i)}mi=1
). (4)
Notice that the classifier output y is a function of weights w. Hence, we see that assuming (3),the likelihood (4) is also a function of w.
We are now ready to define the optimal w. The optimal weight, say w∗, is defined as the onethat maximizes the likelihood (4):
w∗ := arg maxw
Pr({y(i)}mi=1|{x(i)}mi=1
). (5)
Accordingly the optimal loss function, say `∗(·, ·) is defined as the one that yields:
arg minw
m∑i=1
`∗(y(i), y(i)
)= arg max
wPr({y(i)}mi=1|{x(i)}mi=1
). (6)
As I mentioned earlier, an entropy-related concept appears in `∗(·, ·). Let us now figure this out.
Finding the optimal loss function `∗(·, ·)Usually samples are obtained from different data x(i)’s. Hence, it is reasonable to assume thatsuch samples are independent with each other:
{(x(i), y(i))}mi=1 are independent over i. (7)
Under this assumption, we can then rewrite the likelihood (4) as:
Pr({y(i)}mi=1|{x(i)}mi=1
)(a)=
Pr({(x(i), y(i))}mi=1
)Pr({x(i)}mi=1
)(b)=
∏mi=1 P
(x(i), y(i)
)∏mi=1 P(x(i))
(c)=
m∏i=1
P(y(i)|x(i)
)(8)
where (a) and (c) are due to the definition of conditional probability; and (b) comes fromthe independence assumption (7). Here P(x(i), y(i)) denotes the probability distribution of theinput-output pair of the system:
P(x(i), y(i)) := Pr(X = x(i), Y = y(i)) (9)
where X and Y indicate random variables of the input and the output, respectively.
Recall the probability-interpretation-related assumption (3) made with regard to y:
y = Pr(y = 1|x).
2

This implies that:
y = 1 : P(y|x) = y;
y = 0 : P(y|x) = 1− y.
Hence, one can represent P(y|x) as:
P(y|x) = yy(1− y)1−y.
Now using the notations of (x(i), y(i)) and y(i), we then get:
P(y(i)|x(i)
)= (y(i))y
(i)(1− y(i))1−y(i) .
Plugging this into (8), we get:
Pr({y(i)}mi=1|{x(i)}mi=1
)=
m∏i=1
P(x(i))m∏i=1
(y(i))y(i)
(1− y(i))1−y(i) .(10)
This together with (5) yields:
w∗ := arg maxw
m∏i=1
(y(i))y(i)
(1− y(i))1−y(i)
(a)= arg max
w
m∑i=1
y(i) log y(i) + (1− y(i)) log(1− y(i))
(b)= arg min
w
m∑i=1
−y(i) log y(i) − (1− y(i)) log(1− y(i))
(11)
where (a) comes from the fact that log(·) is a non-decreasing function and∏m
i=1(y(i))y
(i)(1 −
y(i))1−y(i) is positive; and (b) is due to changing a sign of the objective while replacing max withmin.
In fact, the term inside the summation in the last equality in (11) respects the formula of anotherkey notion in information theory: cross entropy. In particular, in the context of a loss function,it is named the cross entropy loss:
`CE(y, y) := −y log y − (1− y) log(1− y). (12)
Hence, the optimal loss function that yields the maximum likelihood solution is the cross entropyloss:
`∗(·, ·) = `CE(·, ·).
Remarks on cross-entropy loss (12)
Let me say a few words about why the loss function (12) is called the cross-entropy loss. Actuallythis comes from the definition of cross entropy. The cross entropy is defined w.r.t. two randomvariables. For simplicity, let us consider two binary random variables, say X ∼ Bern(p) and
3

Y ∼ Bern(q) where X ∼ Bern(p) indicates a binary random variable with p = Pr(X = 1). Forsuch two random variables, the cross entropy is defined as:
H(p, q) := −p log q − (1− p) log(1− q). (13)
Notice that the formula of (12) is exactly the same as the term inside summation in (11), exceptfor having different notations. Hence, it is called the cross entropy loss.
Then, you may now wonder why H(p, q) in (13) is called cross entropy. Of course, there is arationale. The rationale comes from the following fact that you were asked to prove in PS5:
H(p, q) ≥ H(p) := −p log p− (1− p) log(1− p) (14)
where H(p) denotes the entropy of Bern(p). Also you were asked to verify that the equalityholds when p = q. So from this, one can interpret H(p, q) as an entropic-measure of discrepancyacross distributions. Hence, it is called cross entropy.
How to solve (11)?
In view of (11), the optimization problem for logistic regression can be written as:
minw
m∑i=1
−y(i) log1
1 + e−wT x(i)− (1− y(i)) log
e−wT x(i)
1 + e−wT x(i). (15)
Let J(w) be the normalized version of the objective function:
J(w) :=1
m
m∑i=1
−y(i) log y(i) − (1− y(i)) log(1− y(i)). (16)
It turns out the above optimization belongs to convex optimization that we are familiar with.In other words, J(w) is convex in optimization variable w. So for the rest of this lecture, we willfirst prove the convexity of the objective function, and then discuss how to solve such convexoptimization.
Proof of convexity
One can readily show that convexity preserves under addition (why? think about the definitionof convex functions). So it suffices to prove the following two:
(i)− log1
1 + e−wT xis convex in w;
(ii)− loge−wT x
1 + e−wT xis convex in w.
Since the second function in the above can be represented as the sum of a linear function andthe first function:
− loge−wT x
1 + e−wT x= wTx− log
1
1 + e−wT x,
it suffices to prove the convexity of the first function.
Notice that the first function can be rewritten as:
− log1
1 + e−wT x= log(1 + e−wT x). (17)
4

In fact, proving the convexity of the function (17) is a bit involved if one relies directly on thedefinition of convex functions. It turns out there is another way to prove. That is based onthe computation of the second derivative of a function, called the Hessian. How to computethe Hessian? What is the dimension of the Hessian? For a function f : Rd → R, the gradient∇f(x) ∈ Rd and the Hessian ∇2f(x) ∈ Rd×d. If you are not familiar, check from the vectorcalculus course or from Wikipedia.
A well-known fact says that if the Hessian of a function is positive semi-definite (PSD)1, thenthe function is convex. We will not prove this here. But if you are interested, you will have achance to prove it in PS6. If this is too much, you may want to simply remember this fact only.No need to prove, but the statement itself is very instrumental. Here we will use this fact toprove the convexity of the function (17).
Taking a derivative of the RHS formula in (17) w.r.t. w, we get:
∇w log(1 + e−wT x) =−xe−wT x
1 + e−wT x.
This is due to a chain rule of derivatives and the fact that ddz log z = 1
z , ddz e
z = ez and ddww
Tx = x.Taking another derivative of the above, we obtain a Hessian as follows:
∇2w log(1 + e−wT x) = ∇w
(−xe−wT x
1 + e−wT x
)(a)=xxT e−wT x(1 + e−wT x)− xxT e−wT xe−wT x
(1 + e−wT x)2
=xxT e−wT x
(1 + e−wT x)2
� 0
(18)
where (a) is due to the derivative rule of a quotient of two functions: ddz
f(z)g(z) = f ′(z)g(z)−f(z)g′(z)
g2(z).
Here you may wonder why ddw (−xe−wT x) = xxT e−wT x. Why not xx, xTxT or xTx in front of
e−wT x? One rule-of-thumb that I strongly recommend is to simply try all the candidates andchoose the one which does not have a syntax error (matrix dimension mismatch). For instance,xx (or xTxT ) is just an invalid operation. xTx is not a right one because the Hessian must be and-by-d matrix. The only candidate left without any syntax error is xxT ! We see that xxT hasthe single eigenvalue of ‖x‖2 (Why?). Since the eigenvalue ‖x‖2 is non-negative, the Hessian isPSD, and therefore we prove the convexity.
Gradient decent algorithm
Now how to solve the convex optimization problem (11)? Since there is no constraint in theoptimization, w∗ must be the stationary point, i.e., the one such that
∇J(w∗) = 0. (19)
But there is an issue in deriving such optimal point w∗ from the above. The issue is that an-alytically finding such point is not doable because it turns out there is no closed-form solution(check!). However, there is a good news. The good news is that there developed several algo-rithms which allow us to find such point efficiently without the knowledge of the closed-form
1We say that a symmetric matrix, say Q = QT ∈ Rd×d, is positive semi-definite if vTQv ≥ 0, ∀v ∈ Rd, i.e.,all the eigenvalues of Q are non-negative. It is simply denoted by Q � 0.
5

solution. One prominent algorithm that has been widely used in the field is: the gradient decentalgorithm.
Here is how the algorithm works. It is an iterative algorithm. Suppose that at the t-th iteration,we have an estimate of w∗, say w(t). We then compute the gradient of the function evaluatedat the estimate: ∇J(w(t)). Next we update the estimate along a direction being opposite to thedirection of the gradient:
w(t+1) ←− w(t) − α∇J(w(t)) (20)
where α > 0 indicates a stepsize (or called a learning rate). If you think about it, this updaterule makes sense. Suppose w(t) is placed right relative to the optimal point w∗, as illustrated inFig. 2.
CN16_2
slope:
t-th estimate
Figure 2: Gradient decent algorithm.
Then, we should move w(t) to the left so that it is closer to w∗. The update rule actually doesthis, as we subtract by α∇J(w(t)). Notice that ∇J(w(t)) points to the right direction given thatw(t) is placed right relative to w∗. We repeat this procedure until it converges. It turns out: ast→∞, it actually converges:
w(t) −→ w∗, (21)
as long as the stepsize is chosen properly, like the one delaying exponentially w.r.t. t. We willnot touch upon the proof of this convergence. Actually the proof is not that simple - even thereis a big field in statistics which intends to prove the convergence of a variety of algorithms (if itis the case).
Look ahead
So far we have formulated an optimization problem for supervised learning, and found that crossentropy serves as a key component in the design of the optimal loss function. We also learnedhow to solve the problem via a famous algorithm, called gradient decent. As mentioned earlier,there would be programming implementation of such algorithm. Next time, we will study suchimplementation details in the context of a simple classifier via Pytorch.
6

EE623 Information Theory November 6, 2019KAIST, Fall 2019 Changho Suh ([email protected])
Lecture 17: Algorithm implementation
Recap
We have thus far formulated an optimization problem for supervised learning:
minw
m∑i=1
`CE
(y(i),
1
1 + e−wT x(i)
)(1)
where
`CE(y, y) = −y log y − (1− y) log(1− y), (2)
y :=1
1 + e−wT x. (3)
We proved that the cross entropy loss `CE(·, ·) is the optimal loss function in a sense of maximizinglikelihood. We also showed that the normalized version J(w) of the above objection functionis convex in w, and therefore, it can be solved via one prominent algorithm that enables us toefficiently find the unique stationary point: gradient decent.
J(w) :=1
m
m∑i=1
−y(i) log y(i) − (1− y(i)) log(1− y(i)). (4)
Today’s lecture
Today we will study how to implement the algorithm in the context of a simple classifier.Specifically we will first investigate what that simple classifier setting of our focus is. We willthen study four implementation details w.r.t. such classifier: (i) dataset that we will use fortraining and testing1; (ii) a deep neural network2 model & ReLU3 activation; (iii) Softmax: anatural extension of a logistic activation for multiple (more than two) classes; (iv) Adam: Anadvanced version of gradient decent algorithm that is widely used in practice. Lastly we willlearn how to do programming for the classifier via one deep learning framework: Pytorch.
Handwritten digit classification
The simple classifier that we will focus on for implementation exercise is a handwritten digitclassifier wherein the task is to figure out a digit from a handwritten image; see Fig. 1. Thefigure illustrates an instance in which a image of digit 2 is correctly recognized.
For training a model, we employ a popular dataset, named the MNIST (Modified NationalInstitute of Standards and Technology)4 dataset. It contains m = 60, 000 training images and
1In the machine learning field, testing refers to performance evaluation of a trained machine learning model.For this purpose, we often employ an unseen dataset, called test dataset. Here unseen means never being employedduring training.
2So far we have studied the single layer neural network. By convention, the input layer is not counted, so itis called a single layer network instead of a two-layer one. We say that a neural network is deep if it has at leastone hidden layer (two layers).
3Yes, it is the one that you encountered in PS5, defined as ReLU(x) = max(0, x).4It was created by re-mixing the examples from NIST’s origional dataset. Hence, the naming was suggested.
It was prepared by one of the deep learning heroes, named Yann LeCun.
1
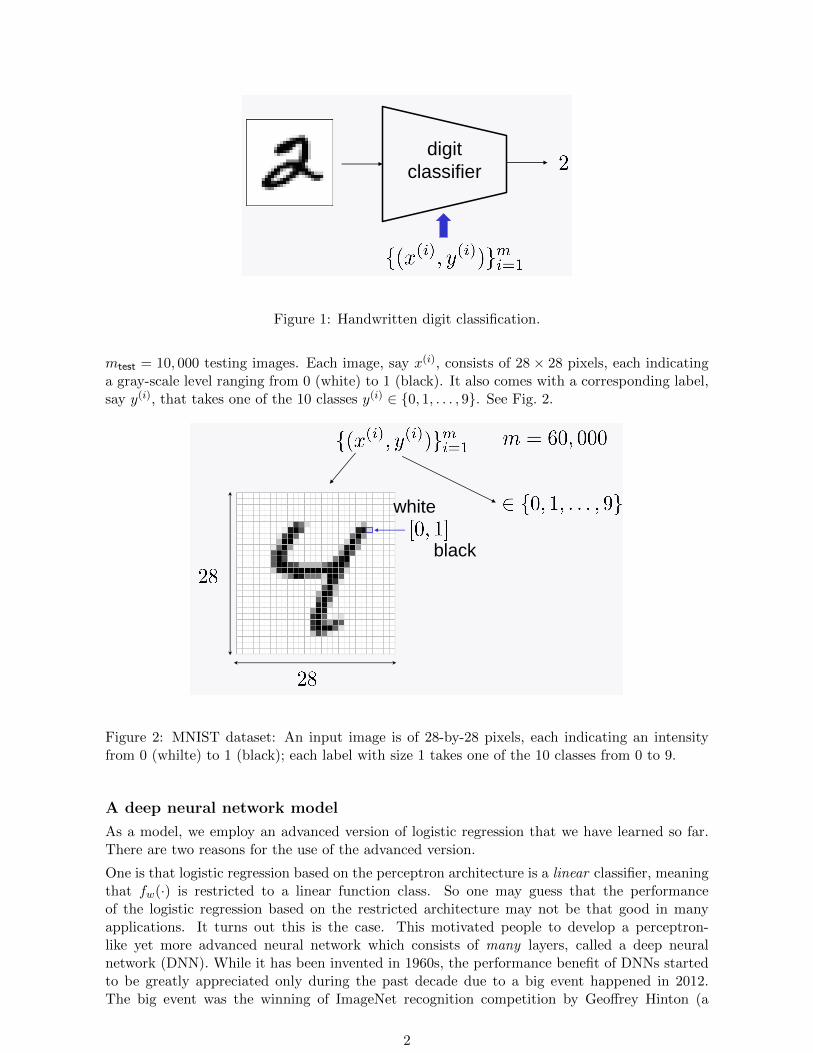
CN17_1
digit
classifier
Figure 1: Handwritten digit classification.
mtest = 10, 000 testing images. Each image, say x(i), consists of 28 × 28 pixels, each indicatinga gray-scale level ranging from 0 (white) to 1 (black). It also comes with a corresponding label,say y(i), that takes one of the 10 classes y(i) ∈ {0, 1, . . . , 9}. See Fig. 2.CN17_2
white
black
Figure 2: MNIST dataset: An input image is of 28-by-28 pixels, each indicating an intensityfrom 0 (whilte) to 1 (black); each label with size 1 takes one of the 10 classes from 0 to 9.
A deep neural network model
As a model, we employ an advanced version of logistic regression that we have learned so far.There are two reasons for the use of the advanced version.
One is that logistic regression based on the perceptron architecture is a linear classifier, meaningthat fw(·) is restricted to a linear function class. So one may guess that the performanceof the logistic regression based on the restricted architecture may not be that good in manyapplications. It turns out this is the case. This motivated people to develop a perceptron-like yet more advanced neural network which consists of many layers, called a deep neuralnetwork (DNN). While it has been invented in 1960s, the performance benefit of DNNs startedto be greatly appreciated only during the past decade due to a big event happened in 2012.The big event was the winning of ImageNet recognition competition by Geoffrey Hinton (a
2

very well-known figure in the AI field, known as the Godfather of deep learning) and his twoPhD students. What was astonishing at the time is that their DNN can achieve human-levelrecognition performances, which were never attained earlier. Hence, this anchored the startof deep learning revolution. It turns out digit classification of our interest here is one suchapplication where a linear classifier does not perform well. So we will employ a DNN yet a verysimple version with only two layers: one-hidden layer and output layer, illustrated in Fig. 3.CN17_3
500 hidden neurons 10 classesinput size = 784
softmax
activation
ReLU activation
Figure 3: A two-layer fully-connected neural network where input size is 28 × 28 = 784, thenumber of hidden neurons is 500 and the number of classes is 10. We employ ReLU activationfor the hidden layer, and softmax activation for the output layer; see Fig. 4 for details.
Each neuron in the hidden layer respects exactly the same procedure as that in the perceptron:a linear operation followed by activation. For activation, the logistic function or its shiftedversion, called the tanh function (spanning -1 and +1), were frequently employed in the earlydays. However, many practitioners recently found that another function, named Rectified LinearUnit (ReLU for short), is more powerful in enabling faster training while yielding a better orequal performance. As mentioned earlier, the functional of ReLU is: ReLU(x) = max(0, x).Hence, a common rule-of-thumb that have been applied in the deep learning field is to use ReLUactivation in all hidden layers. So we adopt the rule-of-thumb, as illustrated in Fig. 3.
Softmax activation for output layer
The second reason that we employ an advanced version of logistic regression is w.r.t. the numberof classes in our interested classifier. Logistic regression is intended for the binary classifier.However, in our digit classifier, there are 10 classes in total. So logistic regression is not directlyapplicable. One natural extension of logistic regression for a general classifier with more thantwo classes is to use a generalized version, called softmax. See Fig. 4.
Let z be the output of the last layer in a neural network prior to activation:
z := [z1, z2, . . . , zc]T ∈ Rc (5)
where c denotes the number of classes. The softmax function is then defined as:
yj := [softmax(z)]j =ezj∑ck=1 e
zkj = 1, 2, . . . , c. (6)
3

CN17_4
output layer softmax
Figure 4: Softmax activation for output layer. This is a natural extension of logistic activationintended for the 2-class case.
Note that this is a natural extension of a logistic function: for c = 2,
y1 := [softmax(z)]1 =ez1
ez1 + ez2
=1
1 + e−(z1−z2)
= σ(z1 − z2)
(7)
where σ(·) is a logistic function. Viewing z1− z2 as the binary classifier output y, this coincidesexactly with the logistic regression.
Here yi can be interpreted as the probability that the ith example belong to the class i. Hence,like the binary classifier, one may want to assume:
yi = Pr(y = [0, . . . , 1︸︷︷︸ith position
, . . . , 0]T |x), i = 1, . . . , c. (8)
As you may expect, under this assumption, one can verify that the optimal loss function (in asense of maximizing likelihood) is again the cross entropy loss:
`∗(y, y) = `CE(y, y) =
c∑j=1
−yj log yj
where y indicates a label of one-hot vector type. For instance, in the case of label= 2 with
4

c = 10, y takes:
y =
0010000000
0123456789
The proof of this is almost the same as that in the binary classifier. So we will omit the proofhere. Instead you will have a chance to prove it in PS6.
Due to the above rationales, the softmax activation has been widely used for many classifiers inthe field. Hence, we will also use the conventional function in our digit classifier.
Adam optimizer
Let us discuss a specific algorithm that we will employ in our setting. As mentioned earlier, wewill use an advanced version of gradient decent algorithm, called Adam optimizer. To see whatthe optimizer operates, let us first recall the vanilla gradient decent:
w(t+1) ← w(t) − α∇J(w(t))
where w(t) indicates the estimated weight in the tth iteration, and α denotes the learning rate.Notice that the weight update relies only on the current gradient, reflected in ∇J(w(t)). Hence,in case ∇J(w(t)) fluctuates too much over iterations, the weight update oscillates significantly,thereby bringing about unstable training. To address this, people often use a variant algorithmthat exploits past gradients for the purpose of stabilization. That is, Adam optimizer.
Here is how the Adam works. The weight update takes the following formula instead:
w(t+1) = w(t) + αm(t)√s(t) + ε
(9)
where m(t) indicates a weighted average of the current and past gradients:
m(t) =1
1− βt1
(β1m
(t−1) − (1− β1)∇J(w(t))). (10)
Here β1 ∈ [0, 1] is a hyperparameter that captures the weight of past gradients, and hence it iscalled the momentum. So the notation m stands for momentum. The factor 1
1−βt1
is applied in
front, in an effort to stabilize training in initial iterations (small t). Check the detailed rationalebehind this in PS6.
s(t) is a normalization factor that makes the effect of ∇J(w(t)) almost constant over t. In case∇J(w(t)) is too big or too small, we may have significantly different scalings in magnitude.Similar to m(t), s(t) is defined as a weighted average of the current and past values:
s(t) =1
1− βt2
(β2s
(t−1) − (1− β2)(∇J(w(t)))2)
(11)
5

where β2 ∈ [0, 1] denotes another hyperparameter that captures the weight of past values, ands stands for square.
Notice that the dimensions of w(t), m(t) and s(t) are the same. So all the operations that appearin the above (including division in (9) and square in (11)) are component-wise. In (9), ε is a tinyvalue introduced to avoid division by 0 in practice (usually 10−8). Here (β1, β2) is exactly thebetas that you encountered in PS5.
Pytorch: MNIST data loading
Now let us study how to do Pytorch programming for implementing the simple digit classifierthat we have discussed so far. First, MNIST data loading. MNIST is a very famous dataset, soit is offered by many libraries including torchvision.datasets. So in order to download thedataset into your machine, you may want to use the following command:
train dataset = torchvision.datasets.MNIST(root=‘../datasets’,
train = True,
transform = transforms.ToTensor(),
download = True)
where ‘../datasets’ indicates the directory that the MNIST dataset would be downloaded(‘../’ means the directory prior to the current direction that you are working on), andtransforms.ToTensor() denotes conversion from raw images into tensor data that we willplay with.
During training, we often employ a part of the entire examples to compute a gradient of a lossfunction. Such part is called the batch. Hence, the dataset is usually reorganized in the form ofbatches. To this end, you can use the following:
train loader = torchvision.utils.data.DataLoader(dataset= train dataset,
batch size = batch size,
shuffle = True)
In the MNIST dataset, the size of train dataset should be m = 60, 000 and the size oftrain loader should read m
batch size.
Pytorch: 2-layer neural network
The simple two-layer neural network model, illustrated in Fig. 3, can be implemented by thefollowing code:
6

import torch.nn as nn
class Net(nn.Module):
def init (self, input size, hidden size, num classes):
super(Net, self). init
self.fc1 = nn.Linear(input size,hidden size)
self.relu = nn.ReLU()
self.fc2 = nn.Linear(hidden size,num classes)
def forward(self, x):
x = self.fc1(x)
x = self.relu(x)
x = self.fc2(x)
return x
my model = Net(input size,hidden size,num classes).to(device)
where device denotes cuda if available; cpu otherwise. See the pytorch tutorial for details.Here nn.Linear(in, out) is a built-in class implemented in torch.nn. The main functional isa linear operation where the associated matrix is of size out-by-in and a bias vector is of sizeout. For instance, the command “x = self.fc1(x)” means the following:
x← W x + b
where W ∈ Rhidden size×input size and b ∈ Rhidden size. nn.ReLU() is another built-in classwhich contains the following functional: max(0, input argument). For example, the command“x = self.relu(x)” means: x← max(0, x).
Pytorch: Cross entropy loss
The cross entropy loss that we learned is also implemented in torch.nn. The correspondingbuilt-in class is:
nn.CrossEntropyLoss()
To use this class for our classifier, you may want to consult with the following commands:
criterion = nn.CrossEntropyLoss()
loss = criterion(output,label)
where output denotes an output of my model defined earlier, and label indicates the ground-truth class of an associated image ∈ {0, 1, . . . , 9}. Here one important to notice is that theoutput is the result prior to softmax activation.
Pytorch: Adam optimizer
The Adam optimizer is also implemented in torch.optim via the following built-in class:
torch.optim.Adam()
7

This is how to use in our classifier:
my model = Net(input size,hidden size,num classes).to(device)
optimizer = torch.optim.Adam(my model.parameters(),lr=learning rate,betas=betas)
Remember that Adam optimizer includes three important parameters: learning rate, b1 andb2. While these are hyperparameters that we can choose as per our wish, a default choice is:lr:=learning rate=0.001, betas:=(b1,b2)=(0.9,0.999).
Pytorch: Training
For training, we should first enable the “train mode” via:
my model.train()
To initialize the gradient of optimizer, we use:
optimizer.zero grad()
To compute a gradient of a loss function, we use:
loss = criterion(output,label)
loss.backward()
To update the weight as per (9), we use:
optimizer.step()
Pytorch: Testing
For testing, we should transit to “test mode” via:
my model.eval()
One important distinction relative to training is that testing does not involve any gradientcomputation. Hence, once we are under the “test mode” (through the above command), all theoperations should be programmed within the following command:
with torch.no grad():
To make a prediction from output of my model, we use:
, predicted = torch.max(output.data, 1)
To counter the number of correct predictions, we use:
correct += (predicted == label).sum().item()
Look ahead
Now we are done with the first application that we would deal with in Part III. Next time, wewill move onto the second application of information theory: unsupervised learning.
8

EE623 Information Theory November 11, 2019KAIST, Fall 2019 Changho Suh ([email protected])
Lecture 18: Unsupervised learning: Generative models
Recap
During the past three lectures, we have studied some basic and trending contents on super-vised learning. The goal of supervised learning is to estimate a functional f(·) of an interestedcomputer system (machine) from input-output samples, as illustrated in Fig. 1.
CN22_1
machine
Figure 1: Supervised learning: Learning the functional f(·) of an interested system from data{(x(i), y(i))}mi=1.
In an effort to translate a function optimization problem (a natural formulation of supervisedlearning) into a parameter-based optimization problem that we are familiar with, we expressedthe function with parameters (or called weights) assuming a certain architecture of the system.
The certain architecture was: Perceptron. Taking the logistic function, we obtained logisticregression. We then proved that cross entropy is the optimal loss function in a sense of maxi-mizing the likelihood of the ground-truth system w.r.t. training data. We also considered theDeep Neural Network (DNN) architecture for f(·), which has been shown to be more expressive.Since there is no theoretical basis on the choice of activation functions in the DNN context,we investigated only a rule-of-thumb which is common to use in the field: Taking ReLU at allhidden neurons while taking the logistic (or softmax) function at the output layer.
With regard to how to solve the optimization, we explored one popular algorithm that enables usto solve the problem numerically: gradient decent. We have also studied a more complicated yetpowerful version of gradient decent, Adam optimizer, which exploits past gradients to yield muchstable training. Lastly we studied how to do programming for implementing such algorithm viaPytorch.
Unsupervised learning
Now what is next? Actually we face one critical challenge that arises in supervised learning.The challenge is that it is not that easy to collect labeled data in many realistic situations. Ingeneral, gathering labeled data is very expensive, as it usually requires extensive human-labour-based annotations. So people wish to do something without such labeled data. Then, a naturalquestion that arises is: What can we do only with {x(i)}mi=1?
This is where the concept of unsupervised learning kicks in. Unsupervised learning is a method-ology for learning something about the data {x(i)}mi=1. You may then ask: What is something?
1

There are a few candidates for such something to learn in the field. One very popular candidateis probability distribution. In fact, this is a sort of the most complex yet most fundamentalinformation. The probability distribution allows us to create realistic signals as we wish. Theunsupervised learning method for learning such fundamental entity is: generative models. Thisis actually the most famous unsupervised learning method, which has received a particularlysignificant attention in the field nowadays. So in this course, we are going to focus on thismethod.
Generative Adversarial Networks (GANs)
Among many generative models in the literature, we will focus on one very popular generativemodel: Generative Adversarial Networks (GANs). The GANs were invented by one of youngestheroes in the history of the AI field, named Ian Goodfellow; see Fig. 2. He was a bachelor and
CN22_3
Ian Goodfellow 2014
Figure 2: Ian Goodfellow, a young yet big figure in the modern AI field. He is best known as theinventor of the Generative Adversarial Networks (GANs), which made a big wave in the historyof the AI field.
master student at Stanford, working with Prof. Andrew Ng. But he moved to the University ofMontreal for PhD study to join Joshua Bengio’s group. During his PhD, he could develop the“GANs”. The GANs are shown to be extremely instrumental in a wide variety of applications,even not limited to the AI field. Such applications include: image creation, human imagesynthesis, image inpainting, coloring, super-resolution image synthesis, speech synthesis, styletransfer, robot navigation, to name a few. Since it works pretty well, as of Oct. 3 2019, thestate of California even passed a bill that would ban the use of GANs to make fake pornographywithout the consent of the people depicted.
In view of information theory, the GAN is also an interesting framework. It turns out the GANis closely related to the KL divergence and mutual information that we have learned thus far.
During upcoming lectures ...
During upcoming lectures (possibly three lectures including this), we will investigate such con-nection. Specifically what we are going to do are four-folded. First we will study what generativemodels are in a mathematical framework. We will then formulate a corresponding optimizationproblem; in particular will put an emphasis on one particular framework, which led to the GAN.Next we will make a connection to the KL divergence and mutual information. Lastly we willlearn how to solve the GAN optimization and implement it via Pytorch. Today we will focus onthe first two.
Generative models
2

A generative model is defined as a mathematical model which allows us to generate fake datawhich has a similar distribution as that of real data. See Fig. 3 for a pictorial representation.The model parameters are learned via real data so that the learned model outputs fake data
CN22_4
generative
model
real data
fake data
Figure 3: A generative model is the one that generates fake data which resembles real data.Here what resembling means in a mathematical language is that it has a similar distribution.
that resemble real data. Here an input signal (which should be placed in front of the model yetnot appeared in the figure) can be either an arbitrary random signal or a specifically synthesizedsignal that forms the skeleton of fake data. The type of the input depends on applications ofinterest - this will be detailed later on.
Remarks on generative models
In fact, the problem of designing a generative model is one of the most important problems instatistics, so it has been a classical age-old problem in that field. This is because the major goalof the field of statistics is to figure out (or estimate) the probability distribution of data that arisein the real world (that we call real data), and the generative model plays a role as a underlyingframework in achieving the goal. Actually the model can do even more - it provides a concretefunction block (called the generator in the field) which can create realistic fake data. There isa very popular name in statistics that indicates such problem, that is the density estimationproblem. Here the density refers to the probability distribution.
Actually this problem was not that popular in the AI field until very recently, precisely 2014when the GANs were invented.
How to formulate an optimization problem?
Now let us relate generative models to optimization. As mentioned earlier, we can feed someinput signal (that we call fake input or latent signal) which one can arbitrarily synthesize. Com-mon ways employed in the field to generate them are to use Gaussian or uniform distributions.Another way will be explored in PS7. Since it is an input signal, we may wish to use a conven-tional “x” notation. So let us use x ∈ Rk to denote a fake input where k indicates a dimensionof the latent signal.
Notice that this has a conflict with real data notation {x(i)}mi=1. To avoid the conflict, let us usea different notation, say {y(i)}mi=1, to denote real data. Please don’t be confused with labeleddata - these are not labels any more. In fact, the convention in the machine learning field is touse a notation z to indicate the latent signal while maintaining real data notation as {x(i)}mi=1.This may be another way to go; perhaps this is the way that you should take especially whenwriting papers. Anyhow let us take the first unorthodox yet reasonable option for this course.
3

Let y ∈ Rn be a fake output. Considering m examples, let {(x(i), y(i))}mi=1 be such fake input-output m pairs and let {y(i)}mi=1 be m real data examples. See Fig. 4.
CN22_5
real data
fake outputfake inputgenerative
model
Figure 4: Problem formulation for generative models.
Goal
Let G(·) be a function of the generative model. Then, the goal of the generative model can bestated as follows: Designing G(·) such that
{y(i)}mi=1 ≈ {y(i)}mi=1 in distribution.
Here what does it mean by “in distribution”? To make it clear, we need to quantify closenessbetween two distributions. One natural yet prominent approach employed in the statistics fieldis to take the following two steps:
1. Compute empirical distributions or estimate distributions from {y(i)}mi=1 and {(x(i), y(i))}mi=1.Let such distributions be:
QY ,QY
for real and fake data, respectively.
2. Next employ a well-known divergence measure in statistics which can serve to quantifythe closeness of two distributions. Let D(·, ·) be one such divergence measure. Then, thesimilarity between QY and QY can be quantified as:
D(QY ,QY ).
Taking the above natural approach, one can concretely state the goal as: Designing G(·) suchthat
D(QY ,QY ) is minimized.
Optimization under the approach
Hence, under the approach, one can formulate an optimization problem as:
minG(·)
D(QY ,QY ). (1)
4

As you may easily notice, there are some issues in solving the above problem (1). One issue isthat it is a function optimization problem which we are not familiar with. As mentioned earlier,one natural way to resolve this issue is to parameterize the function with a neural network:
minG(·)∈N
D(QY ,QY ). (2)
where N indicates a class of neural network functions.
There are two more yet non-trivial issues. The first is that the objective function D(QY ,QY ) isa very complicated function of the knob G(·). Note that QY is a function of G(·), as y = G(x).So the objective is a twice folded composite function of G(·). The second is perhaps the mostfundamental issue. It is not clear as to how to choose a divergence measure D(·, ·).
Look ahead
It turns out there are some ways to address the above issues. Very interestingly, one such wayleads to an optimization problem for GANs! So next time, we will study what that way is, andthen will take the way to derive an optimization problem for GANs.
5

EE623 Information Theory November 13, 2019KAIST, Fall 2019 Changho Suh ([email protected])
Lecture 19: Generative Adversarial Networks (GANs)
Recap
Last time we started investigating unsupervised learning. The goal of unsupervised learning isto learn something about the data, which we newly denoted by {y(i)}mi=1, instead of {x(i)}mi=1.Depending on target candidates for something to learn, there are a few unsupervised learningmethods. Among them, we explored one very prominent method which aims to learn the proba-bility distribution. That is, generative models. We then formulated an optimization problem forgenerative models:
minG(·)∈N
D(QY ,QY ), (1)
where QY and QY indicate the empirical distributions (or the estimates of the true distributions)for real and fake data, respectively; G(·) denotes the function of a generative model; D(·, ·) isa divergence measure; and N is a class of neural network functions. We then mentioned twomajor issues that arise in the problem: (i) the objective is a very complicated function of G(·);(ii) it is not clear as to how to choose D(·, ·).At the end of the last lecture, I claimed that there are some ways to address such issues, and veryinterestingly, one such way leads to an optimization problem for a recently-developed powerfulgenerative model, named Generative Adversarial Networks (GANs).
Today’s lecture
Today we are going to explore details on the GANs. Specifically what we are going to do arethree-folded. First we will investigate what that way leading to the GANs is. We will then takethe way to derive an optimization problem for the GANs. Lastly we will demonstrate that theGANs indeed have close connection to the KL divergence and mutual information.
What is the way that led to GANs?
Remember one challenge that we faced in the optimization problem (1): D(QY ,QY ) is a compli-cated function of G(·). To address this, Ian Goodfellow, the inventor of GANs, took an indirectway to represent D(QY ,QY ). He was thinking how D(QY ,QY ) should behave, and his insightfulobservation (that we will discuss soon) led him to come up with an indirect way of mimickingthe behaviour. It turned out the way enabled him to explicitly compute D(QY ,QY ). Below aredetails.
How D(QY ,QY ) should behave?
First of all, Goodfellow imagined how D(QY ,QY ) should behave. What he imagined is that ifone can easily discriminate real data y from fake data y, then the divergence must be large;otherwise, it should be small. This naturally motivated him to:
Interpret D(QY ,QY ) as a measure that can quantify the ability to discriminate.
In order to express such ability, he believed there must be something that plays a role of dis-
1

criminating. So he introduced an entity that can play such role, and named it:
Discriminator.
Goodfellow considered a simple binary-output discriminator which takes as an input, either realdata y or fake data y. He then wanted to design D(·) such that D(·) well approximates theprobability that the input (·) is real data:
D(·) ≈ Pr((·) = real data).
Noticing that
Pr(y = real) = 1;
Pr(y = real) = 0,
he wanted to design D(·) such that:
D(y) is as large as possible, close to 1;
D(y) is as small as possible, close to 0.
See Fig. 1. CN23_1
Discriminator
fake data
real data
Figure 1: Discriminator wishes to output D(·) such that D(y) is as large as possible while D(y)is as small as possible.
How to quantity the ability to discriminate?
Keeping the picture in Fig. 1 in his mind, he then wanted to quantify the ability to discriminate.To this end, he first observed that if D(·) can easily discriminate, then we should have:
D(y) ↑; 1−D(y) ↑.
One naive way to capture the ability is simply adding the above two terms. But Goodfellow didnot take the naive way. Instead he took the following logarithmic summation:
logD(y) + log(1−D(y)). (2)
Actually I was wondering why he took this particular way, as his paper does not mention aboutthe rationale behind the choice. In NIPS 2016, he gave a tutorial on GANs, mentioning thatthe problem formulation was inspired by a paper published in AISTATS 2010:
http : //proceedings.mlr.press/v9/gutmann10a.html
2

Reading the paper, I realized that the logarithmic summation (2) comes from Eq. (3) in thepaper. Actually this is also related to the binary cross entropy. Think about why.
Making the particular choice, the ability to discriminate for m examples can be quantified as:
1
m
m∑i=1
logD(y(i)) + log(1−D(y(i))). (3)
A two-player game
Goodfellow then imagined a two-player game in which Player 1, Discriminator D(·), wishes tomaximize the quantified ability (3), while Player 2, Generator G(·), wants to minimize (3). SeeFig. 2.
CN23_2
real data
fake dataGenerator
Discriminator
Player #1
Player #2
Figure 2: A two-player game.
Optimization for GANs
This naturally motivated him to formulate the following min max optimization problem:
minG(·)
maxD(·)
1
m
m∑i=1
logD(y(i)) + log(1−D(y(i))). (4)
You may wonder why not max min (meaning that we first take “min” and then “max”). Thatmay be another way to go, but Goodfellow made the above choice. Actually there is a reasonwhy he took the way. This will be clearer soon. Here notice that the optimization is overthe two functions of D(·) and G(·), meaning that it is still a function optimization problem.Luckily the year of 2014 (when the GAN paper was published) was after the starting point ofthe deep learning revolution, the year of 2012. Also at that time, Goodfellow was a PhD studentof Joshua Bengio, one of the deep learning heroes. So he was very much aware of the powerof neural networks: “Deep neural networks can well represent any arbitrary function.” Thismotivated him to parameterize the two functions with neural networks, which in turn led to thefollowing optimization problem:
minG(·)∈N
maxD(·)∈N
1
m
m∑i=1
logD(y(i)) + log(1−D(y(i))), (5)
where N denotes a class of neural network functions. This is exactly the optimization problemfor GANs!
Related to original optimization?
3

Remember what I mentioned earlier: the way leading to the GAN optimization is an indirectway of solving the original optimization problem:
minG(·)
D(QY ,QY ). (6)
Then, a natural question that arises is: How are the two problems (5) and (6) related? Itturns out these are very much related. This is exactly where the choice of min max (instead ofmax min) plays the role; the other choice cannot establish a connection - it was a smart choice. Ithas been shown that assuming that deep neural networks can represent any arbitrary function,the GAN optimization (5) can be translated into the original optimization form (6). We willprove this below.
Simplification & manipulation
Let us start by simplifying the GAN optimization (5). Since we assume that N can representany arbitrary function, the problem (5) becomes unconstrained :
minG(·)
maxD(·)
1
m
m∑i=1
logD(y(i)) + log(1−D(y(i))). (7)
Notice that the objective is a function of D(·), and the two functions D(·)’s appear but withdifferent arguments: one is y(i), colored in blue; the other is y(i), colored in red. So in the currentform (7), the inner (max) optimization problem is not quite tractable to solve. In an attemptto make it tractable, let us express it in a different manner using the following notations.
Define a random vector Y which takes one of the m real examples with probability 1m (uniform
distribution):
Y ∈ {y(1), . . . , y(m)} =: Y; QY (y(i)) =1
m, i = 1, 2, . . . ,m,
where QY indicates the probability distribution of Y . Similarly define Y for fake examples:
Y ∈ {y(1), . . . , y(m)} =: Y; QY (y(i)) =1
m, i = 1, 2, . . . ,m,
where QY indicates the probability distribution of Y . Using these notations, one can thenrewrite the problem (7) as:
minG(·)
maxD(·)
m∑i=1
QY (y(i)) logD(y(i)) + QY (y(i)) log(1−D(y(i))). (8)
Still we have different arguments in the two D(·) functions.
To address this, let us introduce another quantity. Let z ∈ Y∪Y. Newly define QY (·) and QY (·)such that:
QY (z) := 0 if z ∈ Y \ Y; (9)
QY (z) := 0 if z ∈ Y \ Y. (10)
Using the z notation, one can then rewrite the problem (8) as:
minG(·)
maxD(·)
∑z∈Y∪Y
QY (z) logD(z) + QY (z) log(1−D(z)). (11)
4

We now see that the same arguments appear in the two D(·) functions.
Solving the inner optimization problem
We are ready to solve the inner optimization problem in (11). Key observations are: logD(z)is concave in D(·); log(1 − D(z)) is concave in D(·); and therefore, the objective function isconcave in D(·). This implies that the objective has the unique maximum in the function spaceD(·). Hence, one can find such maximum by searching for the one in which the derivative iszero. Taking a derivative and setting it to zero, we get:
Derivative =∑z
[QY (z)
D∗(z)−
QY (z)
1−D∗(z)
]= 0.
Hence, we get:
D∗(z) =QY (z)
QY (z) + QY (z). (12)
Plugging this into (11), we obtain:
minG(·)
∑z∈Y∪Y
QY (z) logQY (z)
QY (z) + QY (z)+ QY (z) log
QY (z)
QY (z) + QY (z). (13)
Connection to KL divergence
Let us massage the objective function in (13) to express it as:
minG(·)
∑z∈Y∪Y
QY (z) logQY (z)
QY (z)+QY (z)
2
+ QY (z) logQY (z)
QY (z)+QY (z)
2︸ ︷︷ ︸−2 log 2. (14)
Notice that the above underbraced term can be expressed with a well-known divergence measurethat we are familar with: the KL divergence. Hence, we get:
minG(·)
∑z∈Y∪Y
QY (z) logQY (z)
QY (z)+QY (z)
2
+ QY (z) logQY (z)
QY (z)+QY (z)
2
− 2 log 2 (15)
= minG(·)
KL(QY ‖(QY + QY )/2
)+ KL
(QY ‖(QY + QY )/2
)− 2 log 2. (16)
Slightly manipulating the above, we obtain an equivalent optimization:
G∗GAN = arg minG(·)
1
2
{KL(QY ‖(QY + QY )/2
)+ KL
(QY ‖(QY + QY )/2
)}. (17)
Also note that the objective coincides with Jensen-Shannon divergence that you encountered inPS2.
Connection to mutual information
Looking at (17), we can also make a connection to mutual information. To see this, recall whatyou were asked to prove in PS2 and midterm. That is, for two random variables, say T and Z,
I(T ;Z) =∑t∈T
PT (t)KL(PZ|t‖PZ) (18)
5

where PT and PZ denote the probability distributions of T and Z, respectively; and PZ|t indicatesthe conditional distribution of Z given T = t.
Now suppose that T ∼ Bern(12
)and we define Z as:
Z =
{Y, T = 0;
Y , T = 1.
Then, we get:
PZ|0 = QY , PZ|1 = QY , PZ =(QY + QY
)/2
where the last is due to the total probability law (why?). This together with (17) and (18) gives:
G∗GAN = arg minG(·)
I(T ;Z). (19)
Look ahead
So far we have formulated an optimization problem for GANs and made an interesting connectionto the KL divergence and mutual information. Next time, we will study how to solve the GANoptimization (5) and implement it via Pytorch.
6

EE623 Information Theory November 18, 2019KAIST, Fall 2019 Changho Suh ([email protected])
Lecture 20: GAN implementation
Recap
Last time we investigated Goodfellow’s approach to deal with an optimization problem forgenerative models, which in turn led to GANs. He started with quantifying the ability todiscriminate real against fake samples:
1
m
m∑i=1
logD(y(i)) + log(1−D(y(i))) (1)
where y(i) and y(i) := G(x(i)) indicate real and fake samples (the outputs of Generator), respec-tively; D(·) denotes the output of Discriminator; and m is the number of examples. He thenintroduced two players: (i) Player 1, Discriminator, who wishes to maximize the ability; (ii)Player 2, Generator, who wants to minimize it. This naturally led to the optimization problemfor GANs:
minG(·)∈N
maxD(·)∈N
1
m
m∑i=1
logD(y(i)) + log(1−D(G(x(i)))) (2)
where N denotes a class of neural network functions. Lastly we demonstrated that the prob-lem (2) can be stated in terms of the KL divergence or mutual information, thus making aconnection to information theory.
Now two questions arise: (i) How to solve the problem (2)?; (ii) How to do programming, sayvia Pytorch?
Today’s lecture
Today we will answer these two questions. Specifically we are going to cover four stuffs. Firstwe will investigate a practical method to solve the problem (2). We will then do one case studyfor the purpose of exercising such method. In particular, we will study how to implement anMNIST-like image generator. Next we will study one important implementation detail: BatchNormalization, particularly useful for very deep neural networks. Lastly we will learn how to doprogramming via Pytorch.
Parameterization
Solving the problem (2) starts with parameterizing the two functions G(·) and D(·) with neuralnetworks:
minw
maxθ
1
m
m∑i=1
logDθ(y(i)) + log(1−Dθ(Gw(x(i))))︸ ︷︷ ︸
=:J(w,θ)
(3)
where w and θ indicate parameters for G(·) and D(·), respectively. Now the question of interestis: Is the parameterized problem (3) the one that we are familiar with? In other words, is J(w, θ)is convex in w? Is J(w, θ) is concave in θ? It turns out unfortunately, it is not the case. Ingeneral, the objective is highly non-convex in w and also highly non-concave in θ.
1

Then, what can we do? Actually there is nothing we can do more beyond what we know. Weonly know how to find a stationary point via a method like gradient decent. So one practicalway to go is to simply look for a stationary point, say (w∗, θ∗), such that
∇wJ(w∗, θ∗) = 0, ∇θJ(w∗, θ∗) = 0,
while cross-fingering that such point yields a near optimal performance. It turns out very luckilyit is often the case in reality, especially when employing neural networks for parameterization.There have been huge efforts by many smart theorists in figuring out why that is the case.However, a clear theoretical understanding is still missing despite their serious efforts.
Alternating gradient decent
One practical method to attempt to find (yet not necessarily guarantee to find) such a stationarypoint in the context of the min-max optimization problem (3) is: alternating gradient decent.Here is how it works. At the tth iteration, we first update Generator’s weight:
w(t+1) ← w(t) − α1∇wJ(w(t), θ(t))
where w(t) and θ(t) denote the weights of Generator and Discriminator at the tth iteration,respectively; and α1 is the learning rate for Generator. Given (w(t+1), θ(t)), we next updateDiscriminator’s weight as per:
θ(t+1) ← θ(t) + α2∇θJ(w(t+1), θ(t))
where α2 is the learning rate for Discriminator. Here one important thing to notice is that thedirection along which the Discriminator’s weight is updated should be aligned with the gradient,reflected in the plus sign colored in blue. Why? Lastly we repeat the above two until converged.
In practice, we may wish to control the frequency of Discriminator weight update relative tothat of Generator. To this end, we often employ the k : 1 alternating gradient decent:
1. Update Generator’s weight:
w(t+1) ← w(t) − α1∇wJ(w(t), θ(t·k)).
2. Update Discriminator’s weight k times while fixing w(t+1): for i=1:k,
θ(t·k+i) ← θ(t·k+i−1) + α2∇θJ(w(t+1), θ(t·k+i−1)).
3. Repeat the above.
You may wonder why we update Discriminator more frequently than Generator. Usually moreupdates in the inner optimization yield better performances in practice. Further, we oftenemploy the Adam counterpart of the algorithm together with batches. Details are omittedalthough we will apply such practical version for programming assignment in PS7.
A practical tip on Generator
Before moving onto a case study for implementation, let me say a few words about Generatoroptimization. Given Discriminator’s parameter θ: the Generator wishes to minimize:
minw
1
mB
∑i∈B
logDθ(y(i)) + log(1−Dθ(Gw(x(i))))
2

where B indicates a batch of interest and mB is the batch size (the number of examples in theinterested batch). Notice that logDθ(y
(i)) in the above is irrelevant of Generator’s weight w.Hence, it suffices to minimize the following:
minw
1
mB
∑i∈B
log(1−Dθ(Gw(x(i))))︸ ︷︷ ︸generator loss
where the underbraced term is called “generator loss”. However, in practice, instead of mini-mizing the generator loss directly, people often rely on the following proxy :
minw
1
mB
∑i∈B− logDθ(Gw(x(i))).
You may wonder why. There is a technically detailed rationale behind the use of such proxy forthe generator loss. Check this in PS7.
Task
Now let us discuss one case study for implementation. The task that we will focus on is the onerelated to the simple digit classifier that we exercised on in Lecture 17. The task is to generateMNIST-like images, as illustrated in Fig. 1. Here we intend to train Generator with MNIST
CN20_1
GeneratorA random
signal
MNIST dataset
MNIST-like
fake image
Figure 1: MNIST-like image generation.
dataset so that it outputs a MNIST-like fake image when fed by a random input signal.
Model for Generator
As a Generator model, we employ a 5-layer fully-connected (linear) neural network with fourhidden layers, as depicted in Fig. 2. For activation at each hidden layer, we employ ReLU.Remember that an MNIST image consists of 28-by-28 pixels, each indicating a gray-scaled valuethat spans from 0 to 1. Hence, for the output layer, we use 784 (= 28× 28) neurons and logisticactivation to ensure the range of [0, 1].
Here the employed network has five layers, so it is deeper than the 2-layer case that we usedearlier. In practice, for a somewhat deep neural network, each layer’s signals can exhibit quitedifferent scalings. It turns out such dynamically-swinged scaling yields a detrimental effect upontraining: unstable training. So in practice, people often apply an additional procedure (priorto ReLU) so as to control such scaling in our own manner. The procedure is called: Batch
3

CN20_2
100 128
256
512
1024784
ReLU logistic
BN
Figure 2: Generator: A 5-layer fully-connected neural network where the input size (the dimen-sion of a latent signal) is 100; the numbers of hidden neurons are 128, 256, 512, 1024; and theoutput size is 784 (= 28 × 28). We employ ReLU activation for every hidden layer, and logisticactivation for the output layer to ensure 0-to-1 output signals. We also use Batch Normalizationprior to ReLU at each hidden layer. See Fig. 3 for details.
Normalization.
Batch Normalization
Here is how it works; see Fig. 3. For illustrative purpose, focus on one particular hidden layer.CN20_3
A hidden layer
1. Normalization
2. Customized scaling
component-wise
(learnable parameters)
BN
Figure 3: Batch Normalization (BN). First we do zero-centering and normalization with themean µB and the variance σ2B computed over the examples in an associated batch B. Next wedo customized scaling by introducing two new parameters that would also be learned duringtraining: γ ∈ Rn and β ∈ Rn.
Let z := [z1, . . . , zn]T be the output of the considered hidden layer prior to activation. Here ndenotes the number of units (neurons) in the hidden layer.
4

The Batch Normalization (BN for short) consists of two steps. First we do zero-centering andnormalization using the mean and variance w.r.t. examples in an associated batch B:
µB =1
mB
∑i∈B
z(i), σ2B =1
mB
∑i∈B
(z(i) − µB)2 (4)
where (·)2 indicates a component-wise square, and hence σ2B ∈ Rn. In other words, we generatethe normalized output, say znorm, as:
znorm =z(i) − µB√σ2B + ε
(5)
where division and multiplication are all component-wise. Here ε is a tiny value introduced toavoid division by 0 (typically 10−5).
Second, we do customized scaling as per:
z(i) = γz(i)norm + β (6)
where γ, β ∈ Rn indicate two new scaling parameters which are learnable via training. Noticethat again the operations in (6) are all component-wise.
The BN lets the model learn the optimal scale and mean of the inputs for each hidden layer. Itturns out this technique plays a significant role in stabilizing and speeding up training especiallyfor a very deep neural network. This has been verified experimentally by many practitioners,although no clear theoretical justification has been provided thus far.
Model for Discriminator
As a Discriminator model, we use a simple 3-layer fully-connected network with two hiddenlayers; see Fig. 4. Here the input size must be the same as that of the flattened real (or fake)image. Again we employ ReLU at hidden layers and logistic activation at the output layer.
Pytorch: How to use BN?
Now let us talk about how to do Pytorch programming for implementation. MNIST data loadingis exactly the same as before. So we omit it. Instead let us first discuss how to use BN.
As you expect, Pytorch provides a built-in class for BN: nn.BatchNorm1d(). Here is how to use
5

CN20_4
256512
784
ReLU
logistic
1
Figure 4: Discriminator: A 3-layer fully-connected neural network where the input size (thedimension of a flattened vector of a real (or fake) image) is 784 (= 28 × 28); the numbers ofhidden neurons are 512, 256; and the output size is 1. We employ ReLU activation for everyhidden layer, and logistic activation for the output layer.
such class in our setting:
class Generator(nn.Module):
def init (self, latent dim):
super(Generator, self). init
self.fc1 = nn.Linear(latent dim,128)
self.bn1 = nn.BatchNorm1d(128)
self.relu = nn.ReLU()
...
def forward(self, x):
x = self.fc1(x)
x = self.bn1(x)
x = self.relu(x)
...
where latent dim is the dimension of the latent signal (which we set as 100) and nn.BatchNorm1d(128)
indicates a class that does BN for 128 hidden neurons.
Pytorch: Optimizers for Generator & Discriminator
We use Adam optimizers with lr=0.0002 and (b1,b2)=(0.5,0.999). Since we have two models
6

(Generator and Discriminator), we employ two optimizers accordingly:
generator = Generator(latent dim)
discriminator = Discriminator()
optimizer G = torch.optim.Adam(generator.parameters(),lr=lr,betas=(b1,b2))
optimizer D = torch.optim.Adam(discriminator.parameters(),lr=lr,betas=(b1,b2))
where Discriminator is another neural network model which respects the structure in Fig. 4.Think about how to do programming for the model.
Pytorch: Generator input
As a generator input, we use a random signal with the Gaussian distribution. In particular, weuse:
x ∈ Rlatent dim ∼ N (0, Ilatent dim).
Here is how to generate such Gaussian random signal in Pytorch:
x = torch.normal(mean=0,std=1,size=(batch size,latent dim))
Pytorch: Binary cross entropy loss
Consider the batch version of the GAN optimization (3):
minw
maxθ
1
mB
∑i∈B
logDθ(y(i)) + log(1−Dθ(Gw(x(i)))) (7)
Now introduce the ground-truth real-vs-fake indicator vector [1, 0]T (real=1, fake=0). Then, herethe term logDθ(y
(i)) can be viewed as the minus binary cross entropy between the real/fakeindicator vector and its prediction counterpart [Dθ(y
(i)), 1−Dθ(y(i))]T :
logDθ(y(i)) = 1 · logDθ(y
(i)) + 0 · log(1−Dθ(y(i)))
= −`BCE(1, Dθ(y(i))).
On the other hand, another term log(1−Dθ(y(i))) can be interpreted as the minus binary cross
entropy between the fake-vs-real indicator vector (fake=0, real=1) and its prediction counter-part:
log(1−Dθ(y(i))) = 0 · logDθ(y
(i)) + 1 · log(1−Dθ(y(i)))
= −`BCE(0, Dθ(y(i))).
From this, we see that the cross entropy plays a role in computation of the objective function.In Lecture 17, we used a built-in class: nn.CrossEntropyLoss(). However, here we will useanother slightly different built-in class: nn.BCELoss(). Here is to how to use in our setting:
CE loss = nn.BCELoss()
loss = CE loss(output,real fake indicator)
where output denotes an output of discriminator defined earlier, and real fake indicator
is real/fake indicator vector (real=1, fake=0). Here one important thing to notice is that the
7

output is the result after logistic activation; and real fake indicator is also a vector with thesame dimension as output. The function in nn.BCELoss() automatically detects the number ofexamples in an associated batch, thus yielding a normalized version (through division by mB).
Pytorch: Generator loss
Recall the proxy for for the generator loss that we will use:
minw
1
mB
∑i∈B− logDθ(Gw(x(i))).
To implement this, we use:
g loss = CE loss(discriminator(gen imgs),valid)
where gen imgs indicate fake images (corresponding to Gw(x(i))’s) and valid denotes an all-1’svector with the same dimension as gen imgs (why?).
Pytorch: Discriminator loss
Recall the batch version of the optimization problem:
maxθ
1
mB
∑i∈B
logDθ(y(i)) + log(1−Dθ(Gw(x(i))))
Taking the minus sign in the objective, we obtain the equivalent minimization optimization:
minθ
1
mB
∑i∈B− logDθ(y
(i))− log(1−Dθ(Gw(x(i))))︸ ︷︷ ︸discriminator loss
where the discriminator loss is defined as such minus version. Here is how to implement thediscriminator loss:
real loss = CE loss(discriminator(real imgs),valid)
fake loss = CE loss(discriminator(gen imgs.detach()),fake)
d loss = real loss + fake loss
where real imgs indicate real images (corresponding to y(i)’s) and fake denotes an all-0’svector with the same dimension as gen imgs. Here we apply .detach() into gen imgs whichwas associated with generator. This process is needed to enable a different computation w.r.t.discriminator loss.
Look ahead
Now we are done with the second application that we would deal with in Part III. Next time,we will move onto the last application of information theory: fairness algorithms.
8

EE623 Information Theory November 20, 2019KAIST, Fall 2019 Changho Suh ([email protected])
Lecture 21: Fairness machine learning
Recap
During the past six lectures, we have explored two prominent methodologies that arise in machinelearning: (i) supervised learning; (ii) unsupervised learning. The goal of supervised learning is toestimate a functional f(·) of an interested system from input-output example pairs, as illustratedin Fig. 1(a).
CN21_1
Neural
networkGenerator fake samples
(a) (b)
Figure 1: (a) Supervised learning: Learning the functional f(·) of an interested system frominput-output example pairs {(x(i), y(i))}mi=1; (b) Generative modeling (an unsupervised learningmethodology): Generating fake data that resemble real data, reflected in {x(i)}mi=1.
In an effort to translate a function optimization problem (a natural formulation of supervisedlearning) into a parameter-based optimization problem, we parameterized the function with adeep neural network. We also investigated some common practices adopted by many practi-tioners: Employing ReLU activation at hidden layers and softmax at the output layer; using thecross entropy loss (the optimal loss function in a sense of maximum likelihood); and applyingan advanced version of gradient descent, named Adam optimizer.
We then moved onto unsupervised learning. We put a special emphasis on one famous unsuper-vised learning method: generative modeling, wherein the goal is to generate fake examples sothat their distribution is as close as possible to that of real examples; see Fig. 1(b). In particular,we focused on one powerful generative model, named Generative Adversarial Network (GAN),which have played a revolutionary role in the modern AI field. We explored an interesting con-nection to two information-theoretic notions: KL divergence and mutual information. We alsostudied a practical method for solving the GAN optimization: Alternating gradient descent.Moreover, we learned how to do Pytorch implementation for GAN.
Next application
Now what is next? As the last application of information theory, we will explore one recenttrending topic that arises in the modern machine learning: Fairness machine learning. Thereare three reasons that I pick up the topic as the last application.
The first reason is motivated by the recent trend in the machine learning field. As machinelearning becomes prevalent in our daily lives involving a widening array of applications suchas medicine, finance, job hiring and criminal justice, one morally & legally motivated need
1

in the design of machine learning algorithms is to ensure fairness for disadvantageous againstadvantageous groups. The fairness issue has received a particular attention from the learningalgorithm by the US Supreme Court that yields unbalanced recidivism (criminal reoffending)scores across distinct races, e.g., predicts higher scores for blacks against whites; see Fig. 2.Hence, I wish to touch upon such trending & important topic for this course. I hope this may
CN21_3
Figure 2: The current machine learning algorithm employed in the US Supreme Courtpredicts higher recidivism scores for blacks against whites. If you want to know more, seehttps://www.propublica.org/article/machine-bias-risk-assessments-incriminal-sentencing
be of great interest to you guys. The second is w.r.t. a connection to information theory. Itturns out that mutual information plays a key role in formulating an optimization problem forfairness machine learning algorithms. The last reason is that the optimization problem is closelyrelated to the GAN optimization that we learned in the past lectures. You may see the perfectcoherent sequence of applications, from supervised learning, GAN to fairness machine learning.
During upcoming lectures
For a couple of upcoming lectures (probably three lectures including today’s one), we will inves-tigate fairness machine learning in depth. Specifically what we are going to cover are four-folded.First off, we will figure out what fairness machine learning is. We will then study two prominentfairness concepts that have been established in the recent literature. We will also formulatean optimization for fairness machine learning algorithms which respect the fairness constraintsbased on the concepts. Next we will demonstrate that mutual information forms the basis of suchoptimization and the optimization can be rewritten as the GAN optimization that we learnedin the prior application. Lastly we will learn how to solve the optimization and implement viaPytorch. Today we will cover the first two.
Fairness machine learning
Fairness machine learning is a subfield of machine learning that focuses on the theme of fairness.In view of the definition of machine learning, fairness machine learning can concretely be definedas a field of algorithms that train a machine so that it can perform a specific task in a fair manner.
Like traditional machine learning, there are two methodologies for fairness ML. One is fairnesssupervised learning, wherein the goal is to develop a fair classifier using input-output samplepairs: {(x(i), y(i))}mi=1. The second is the unsupervised learning counterpart. In particular, whatis a proper counterpart for generative modeling? A natural one is: fair generative modeling inwhich the goal is to generate fairness-ensured fake data which are also realistic. Due to theinterest of time, we will focus only on the fairness supervised learning in this course.
Two major fairness concepts
2

In order to develop a fair classifier, we first need to understand what it means by fairness.Actually the fairness is a terminology that arises in law that deals with justice. So it has a longand rich history, and there are numerous concepts prevalent in the field of law. Here we focusonly on two major and prominent concepts on fairness, which have received particular attentionin the modern machine learning field.
The first is disparate treatment (DT). This means an unequal treatment that occurs directlybecause of some sensitive information (such as race, sex, and religion), often called sensitive at-tributes in the literature. It is also called direct discrimination (“Gikjeop Chabyeol” in Korean),since such attributes directly serve to yield discrimination.
The second is disparate impact (DI). This means an action that adversely affects one groupagainst another even with formally neutral rules wherein sensitive attributes are never usedin classification and therefore the DT does not occur. It is also called indirect discrimination(“Ganjeop Chabyeol” in Korean), since a disparate action is made indirectly through biasedhistorical data.
Criminal reoffending predictor
Now how to design a fair classifier that respects the above two fairness concepts: DT and DI?For simplicity, let us explore this in the context of a simple yet concrete classification setting:Criminal reoffending prediction, wherein the task is to predict whether or not an interestedindividual with criminal records1 would reoffend within two years. This is indeed the classifica-tion being done by the US Supreme Court for the purpose of deciding parole (“Gaseokbang” inKorean).
A simple setting
For illustrative purpose, here we consider a simplified version of the predictor wherein only afew information are employed for prediction. See Fig. 3.
CN21_2
Criminal reoffending
predictor
objective
sensitive
Figure 3: A criminal reoffending predictor.
There are two types of data employed: (i) objective data; (ii) sensitive data (or called sensitiveattributes). For objective data that we denote by x, we consider only two features, say x1 and x2.Let x1 be the number of prior criminal records. Let x2 be a criminal type, e.g., misdemeanouror felony. For sensitive data, we employ a different notation, say z. Here we consider a simplescalar and binary case in which z indicates a race type only among white (z = 0) and black(z = 1). Let y be the classifier output which aims to represent the ground-truth conditionaldistribution p(y|x, z). Here y denotes the ground-truth label: y = 1 means reoffending within 2years; y = 0 otherwise. This is a supervised learning setup, so we are given m example triplets:
1A casual terminology for criminal records is priors.
3

{(x(i), z(i), y(i))}mi=1.
How to avoid disparate treatment?
Firs of all, how to deal with disparate treatment? Recall the DT concept: An unequal treatmentdirectly because of sensitive attributes. Hence, in order to avoid the DT, we should ensure thatthe prediction should not be a function of the sensitive attribute. A mathematical preciseexpression for this is:
p(y|x, z) = p(y|x) ∀z. (1)
Now how to ensure the above? The solution is very simple: Not using the sensitive attribute zat all in the prediction, as illustrated with a red-colored “x” mark in Fig. 3. Here an importantthing to notice is that the sensitive attribute is offered as part of training data although it isnot used as part of input. So z(i)’s can be employed while designing an algorithm.
What about disparate impact?
How about for the other fairness concept: disparate impact? How to avoid the DI? Again recallthe DI concept: An action that adversely affects one group against another even with formallyneutral rules. Actually it is not that clear as to how to implement this mathematically.
To gain some insights, let us investigate the precise mathematical definition of DI. To this end,let us introduce a few notations. Let Z be a random variable that indicates a sensitive attribute.For instance, consider a binary case, say Z ∈ {0, 1}. Let Y be a binary hard-decision value ofthe predictor output Y at the middle threshold: Y := 1{Y ≥ 0.5}. Observe a ratio of likelihoodsof positive example events Y = 1 for two cases: Z = 0 and Z = 1.
Pr(Y = 1|Z = 0)
Pr(Y = 1|Z = 1). (2)
One natural interpretation is that a classifier is more fair when the ratio is closer to 1; becomesunfair if the ratio is far away from 1. The DI is quantified based on this, so it is defined as:
DI := min
(Pr(Y = 1|Z = 0)
Pr(Y = 1|Z = 1),Pr(Y = 1|Z = 1)
Pr(Y = 1|Z = 0)
). (3)
Notice that 0 ≤ DI ≤ 1 and the larger DI, the more fair the situation is.
Two cases
In view of the mathematical definition (3), reducing disparate impact means maximizing themathematical quantity (3). Now how to design a classifier so as to maximize the DI then?Depending on situations, the design methodology can be different. To see this, think about twoextreme cases.
The first is the one in which training data is already fair:
{(x(i), z(i), y(i))}mi=1 → large DI.
In this case, a natural solution is to simply rely on a conventional classifier that aims to maximizeprediction accuracy. Why? Because maximizing prediction accuracy would well respect trainingdata, which in turn yields large DI. The second is a non-trivial case in which training data is farfrom being fair:
{(x(i), z(i), y(i))}mi=1 → small DI.
4

In this case, the conventional classifier would yield small DI. This is indeed a challenging scenariowhere we need to take some non-trivial action for ensuring fairness.
In fact, the second scenario can often occur in reality, since there could be biased historicalrecords which form the basis of training data. For instance, the Supreme Court can make somebiased decisions for blacks against whites, and these are likely to be employed as training data.See Fig. 4 for one such unfair scenario. In Fig. 4, a hallowed (or black-colored-solid) circleCN9_2
non-reoffend
reoffend
black white
Figure 4: Data points visualization: A hallowed (or black-colored-solid) circle indicates a datapoint of an individual with white (or black) race; the red (or blue) colored edge denotes y = 1reoffending (or y = 1 non-reoffending) label.
indicates a data point of an individual with white (or black) race; and the red (or blue) colorededge (ring) denotes the event that the interested individual reoffends (or non-reoffends) withintwo years. This is an unfair situation. Notice that for positive examples y = 1, there are moreblack-colored-solid circles than hallowed ones, meaning sort of biased historical records favouringwhites against blacks. Similarly for negative examples y = 0, there are more hallowed circlesrelative to solid ones.
How to ensure large DI?
Now how to ensure large DI under all possible scenarios including the above unfair challengingscenario? To gain insights, first recall an optimization problem that we formulated earlier forthe design of a conventional classifier:
minw
1
m
m∑i=1
`CE(y(i), y(i)) (4)
where `CE(·, ·) indicates binary cross entropy loss, and w denotes weights (parameters) for aclassifer. Here one natural approach to ensure large DI is to incorporate an DI-related constraintin the optimization (4). Maximizing DI is equivalent to minimizing 1 − DI (since 0 ≤ DI ≤ 1).So we can resort to a very well-known technique in the optimization field: regularization. Thatis to add the two objectives with different weights.
Regularized optimization
5

Here is a regularized optimization:
minw
1
m
m∑i=1
`CE(y(i), y(i)) + λ · (1− DI) (5)
where λ denote a regularization factor that balances predication accuracy against the DI-associated objective (minimizing 1−DI). However, here an issue arises in solving the regularizedoptimization (5). Recalling the definition of DI
DI := min
(Pr(Y = 1|Z = 0)
Pr(Y = 1|Z = 1),Pr(Y = 1|Z = 1)
Pr(Y = 1|Z = 0)
),
we see that DI is a complicated function of w. We have no idea as to how to express DI in termsof w.
Another way
Since directly expressing DI as a function of w is not doable, one can rely on another way to go.Another way that I will take is inspired by information theory, particularly by mutual informa-tion. Notice that DI = 1 means that the sensitive attribute Z is independent of the hard decisionY of the prediction. Remember one key property of mutual information: Mutual informationbetween two input random varibles being zero is the “sufficient and necessary condition” for theindependence between the two inputs. This motivates us to represent the constraint of DI = 1as:
I(Z; Y ) = 0. (6)
This captures the complete independence between Z and Y . Since the predictor output is Y(instead of Y ), we consider another stronger condition that concerns Y directly:
I(Z; Y ) = 0. (7)
Notice that the condition (7) is indeed stronger than (6), i.e., (7) implies (6). This is because
I(Z; Y )(a)
≤ I(Z; Y , Y )
(b)= I(Z; Y )
(8)
where (a) is due to the chain rule and non-negativity of mutual information; and (b) is becauseY is a function of Y : Y := 1{Y ≥ 0.5}. Notice that (7) together with (8) gives (6).
Strongly regularized optimization
In summary, the condition (7) indeed enforces the DI = 1 constraint. This then motivates us toconsider the following optimization:
minw
1
m
m∑i=1
`CE(y(i), y(i)) + λ · I(Z; Y ). (9)
Now the question of interest is: How to express I(Z; Y ) in terms of classifier parameters w? Itturns out interestingly there is a way to express it. The idea is to use a GAN trick that welearned!
Look ahead
Next time we will review the GAN trick w.r.t. I(Z; Y ) and then use the trick to explicitlyformulate an optimization.
6

EE623 Information Theory November 25, 2019KAIST, Fall 2019 Changho Suh ([email protected])
Lecture 22: Fairness-GAN
Recap
Last time, we introduced the last application of information theory: A fair classifier. As anexample of a fair classifier, we considered a recidivism predictor wherein the task is to predict ifan interested individual with prior criminal records (priors for short) would reoffend within twoyears; see Fig. 1 for illustration.
CN22_1
Recidivism
predictor
Figure 1: A simple recidivism predictor: Predicting a recidivism score y from x = (x1, x2). Herex1 indicates the number of prior criminal records; x2 denotes a criminal type (misdemeanor orfelony); and z is a race type among white (z = 0) and black (z = 1).
In order to avoid disparate treatment (one famous fairness concept), we made the sensitiveattribute not to be included as part of input. To reflect another fairness constraint (disparateimpact - DI for short), we introduced a regularized term into the original optimization dealingonly with prediction accuracy, thus arriving at:
minw
1
m
m∑i=1
`CE(y(i), y(i)) + λ · I(Z; Y ) (1)
where λ ≥ 0 is a regularization factor that balances prediction accuracy (reflected in the bi-nary cross entropy terms) against the fairness constraint, reflected in I(Z; Y ). Remember thatI(Z; Y ) = 0 is a sufficient condition for DI = 1. At the end of the last lecture, I claimed that onecan express the mutual information I(Z; Y ) of interest in terms of an optimization parameterw, thereby enabling us to train the model parameterized by w. I then told you that the idea fortranslation is to use a GAN trick that we learned in the past lectures.
Today’s lecture
Today we will support the claim. Specifically we are going to cover three stuffs. First we willfigure out what I meant by the GAN trick is. Next we will use the GAN trick to formulatean optimization yet in a simple binary sensitive attribute setting. Lastly we will extend to thegeneral non-binary sensitive attribute case.
The GAN trick
1

Recall the inner optimization in GAN:
maxD(·)
1
m
m∑i=1
logD(y(i)) + log(1−D(y(i)))
where y(i) and y(i) indicate the ith real and fake samples, respectively; and D(·) is a discriminatoroutput. Also remember that we could make an interesting connection with mutual information:
I(T ;Z) = maxD(·)
1
m
m∑i=1
logD(y(i)) + log(1−D(y(i))) (2)
where T = 1{Discriminator’s input is real} and Z is a random variable that takes a real sampleif T = 1; a fake sample if T = 0. Please do not be confused with the different Z in (1).
Here what I meant by the GAN trick is the other way around (reverse), meaning that we startwith the mutual information of interest and then express it in terms of an optimization problemsimilarly to (2). Now let us apply this trick to our problem setting. For illustrative purpose, letus start with a simple binary sensitive attribute setting.
Mutual information vs. KL divergence
Notice in our optimization (1) that Z is a sensitive-attribute indicator, which plays the samerole as T in (2). Similarly Y in (1) serves the same role as Z in (2). So one can expect thatI(Z; Y ) in (1) would be expressed similarly as in (2). It turns out it is indeed the case. Butthere is a slight distinction in a detailed expression. To see what the distinction is, let us startby manipulating I(Z; Y ) from scratch.
Starting with the key relationship between mutual information and KL divergence, we get:
I(Z; Y ) = KL(PY ,Z‖PY PZ
)(a)=
∑y∈Y,z∈Z
PY ,Z(y, z) logPY ,Z(y, z)
PY (Y )PZ(z)
=∑
y∈Y,z∈Z
PY ,Z(y, z) logPY ,Z(y, z)
PY (Y )+
∑y∈Y,z∈Z
PY ,Z(y, z) log1
PZ(z)
(b)=
∑y∈Y,z∈Z
PY ,Z(y, z) logPY ,Z(y, z)
PY (Y )+∑z∈Z
PZ(z) log1
PZ(z)
(c)=
∑y∈Y,z∈Z
PY ,Z(y, z) logPY ,Z(y, z)
PY (Y )+H(Z)
where (a) is due to the definition of KL divergence; (b) comes from the total probability law;and (c) is due to the definition of entropy.
Observation
2

For the binary sensitive attribute case, we have:
I(Z; Y ) =∑
y∈Y,z∈Z
PY ,Z(y, z) logPY ,Z(y, z)
PY (Y )+H(Z)
=∑y∈Y
PY ,Z(y, 1) logPY ,Z(y, 1)
PY (y)︸ ︷︷ ︸=:D∗(y)
+∑y∈Y
PY ,Z(y, 0) logPY ,Z(y, 0)
PY (y)︸ ︷︷ ︸=1−D∗(y)
+H(Z).(3)
Notice that the first log-inside term, defined as D∗(y), has the close relationship with the secondlog-inside term in the above: the sum of the two is 1. This reminds us of the maximizationformula in (2). So one may conjecture that I(Z; Y ) can be expressed in terms of an optimizationproblem as follows:
Claim 1:
I(Z; Y ) = maxD(·)
∑y∈Y
PY ,Z(y, 1) logD(y) +∑y∈Y
PY ,Z(y, 0) log (1−D(y)) +H(Z). (4)
Proof: It turns out it is indeed the case. The proof is very simple. Taking the derivative w.r.t.D(y), we get:
PY ,Z(y, 1)
D?(y)−PY ,Z(y, 0)
1−D?(y)= 0 ∀y
where D?(y) is the optimal solution to the optimization (4). Hence, we get:
D?(y) =PY ,Z(y, 1)
PY ,Z(y, 1) + PY ,Z(y, 0)=PY ,Z(y, 1)
PY (y)
where the second equality is due to the total probability law. Since this is exactly the same asD∗(y) that we defined in (3), we complete the proof. �
How to compute I(Z; Y )?
Notice that the formula (4) contains two probability quantities (PY ,Z(y, 1), PY ,Z(y, 0)) which are
not available. The only things that we are given are: {(x(i), z(i), y(i))}mi=1. So we need to nowworry about what we can do with this information for computation of the probability quantities.First we can compute {y(i)}mi=1 from the samples. This together with the samples allows us tocompute empirical distributions: QY ,Z(y(i), 1) and QY ,Z(y(i), 0). So as an estimate, we can takethe empirical version of the true distributions:
QY ,Z(y(i), 0) =1
m;
QY ,Z(y(i), 0) =1
m.
We have m samples in total. So the empirical distributions are uniform with the probability 1m .
Why? Applying these empirical distributions to (4), we can approximate I(Z; Y ) as:
I(Z; Y ) ≈ maxD(·)
1
m
∑i:z(i)=1
logD(y(i)) +∑
i:z(i)=0
log(
1−D(y(i)))+H(Z). (5)
3

Notice that this approximation is exactly the same as the inner optimization formula in theGAN (2).
Fairness-GAN optimization
Now let us go back to our original optimization setting:
minw
1
m
m∑i=1
`CE(y(i), y(i)) + λ · I(Z; Y ).
Applying the approximation (5) into the above, one can consider:
minw
maxθ
1
m
m∑i=1
`CE(y(i), y(i)) + λ
∑i:z(i)=1
logDθ(y(i)) +
∑i:z(i)=0
log(
1−Dθ(y(i))) (6)
where D(·) is parameterized with θ. The sensitive-attribute entropy H(Z) in (5) is removedhere, since it is irrelevant of the optimization parameters (θ, w). Observe now that the objec-tive function has an explicit relationship with the optimization parameters (θ, w). Hence, theparameters are trainable via some practical algorithms such as gradient descent.
Extension to non-binary sensitive attribute
So far we have considered the binary sensitive attribute setting. However, in practice, thismay not be necessarily the case. For instance, there are many race types such as Black, White,Asian, Hispanic, to name a few. Also there could be multiple sensitive attributes like gender andreligion. In order to reflect such practical scenarios, we now consider a sensitive attribute withan arbitrary alphabet size. Notice that one can represent a collection of any multiple sensitiveattributes as a single random variable yet with an arbitrary alphabet size. Hence, we considersuch setting: Z ∈ Z where |Z| is not limited to two.
Recalling the key relationship between mutual information and KL divergence, we get:
I(Z; Y ) = KL(PY ,Z‖PY PZ
)=
∑y∈Y,z∈Z
PY ,Z(y, z) logPY ,Z(y, z)
PY (y)PZ(z)
=∑
y∈Y,z∈Z
PY ,Z(y, z) logPY ,Z(y, z)
PY (y)︸ ︷︷ ︸=:D∗(y,z)
+H(Z).
(7)
Defining the log-inside term in the above as D∗(y, z), we obtain:∑z∈Z
D∗(y, z) = 1 y ∈ Y.
This is due to the total probability law. Now what does this remind you of? You should bereminded of the claim that appeared in the extra problem in midterm!
Claim 2:
I(Z; Y ) = maxD(y,z):
∑z∈Z D(y,z)=1
∑y∈Y,z∈Z
PY ,Z(y, z) logD(y, z) +H(Z). (8)
4

Proof: For those who do not remember details and/or do not prove the claim, let me providea proof here. Since we have multiple equality constraints, marked in blue in the above, we firstdefine the Lagrange function:
L(D(y, z), ν(y)) =∑
y∈Y,z∈Z
PY ,Z(y, z) logD(y, z) +∑y∈Y
ν(y)
(1−
∑z∈Z
D(y, z)
)
where ν(y)’s are Lagrange multipliers. Notice that there are the number |Y| of Lagrange multi-pliers. Since the objective function is concave in D(·, ·), we can solve the problem via the KKTconditions:
dL(D(y, z), ν(y))
dD(y, z)=PY ,Z(y, z)
D?(y, z)− ν?(y) = 0 ∀y, z
dL(D(y, z), ν(y))
dν(y)= 1−
∑z∈Z
D?(y, z) = 0 ∀y.
Notice that plugging the following,
D?(y, z) =PY ,Z(y, z)
PY (y), ν?(y) = PY (y).
we satisfy the KKT conditions. This implies that D?(y, z) is indeed the optimal solution. SinceD?(y, z) is exactly the same as D∗(y, z) that we defined in (7), we complete the proof. �
Fairness-GAN optimization: General case
Again for computation of I(Z; Y ), we rely on the empirical version of the true distributionPY ,Z(y, z):
QY ,Z(y(i), z(i)) =1
m. (9)
So we get:
I(Z; Y ) ≈ maxD(y,z):
∑z∈Z D(y,z)=1
m∑i=1
1
mlogD(y(i), z(i)) +H(Z). (10)
Lastly by parameterizing D(·, ·) with θ and excluding H(Z) (irrelevant of (θ, w)), we obtain thefollowing optimization:
minw
maxθ:∑z∈Z Dθ(y,z)=1
1
m
{m∑i=1
`CE(y(i), y(i)) + λm∑i=1
logDθ(y(i), z(i))
}. (11)
While it is similar to the GAN, it comes with a couple of distinctions. First the Generatoris replaced with the Classifier. Hence, it includes additional loss term that captures predictionaccuracy, reflected in
∑mi=1 `CE(y(i), y(i)). Also we now have multiple (the number of |Z|) outputs
in the Discriminator. Here each Dθ(y(i), z(i)) can be interpreted as:
Pr(y(i) belongs to z(i)
).
Fairness-GAN architecture
5

CN22_2
softmax
Classifier Discriminator
Figure 2: Fairness-GAN architecture.
In view of the final optimization formula (11), the Fairness-GAN architecture can be illustratedas in Fig. 2. Notice that we have the number |Z| of outputs in the Discriminator. In an attemptto ensure the equality constraint in (11), we may want to use the softmax activation in theoutput layer.
Look ahead
We are now done with the optimization problem formulation for Fairness-GAN. Next time, wewill study how to solve the optimization (11), as well as how to implement it via Pytorch.
6

EE623 Information Theory December 2, 2019KAIST, Fall 2019 Changho Suh ([email protected])
Lecture 23: Fairness-GAN implementation
Recap
Last time, we formulated an optimization that respects two fairness constraints: disparate treat-ment (DT) and disparate impact (DI). Given m example triplets {(x(i), z(i), y(i))}mi=1:
minw
1
m
m∑i=1
`CE(y(i), y(i)) + λ · I(Z; Y )
where y(i) indicates the Classifier output, depending only on x(i) (not on the sensitive attributez(i) due to the DT constraint); and λ is a regularization factor that balances prediction accuracyagainst the DI constraint, reflected in I(Z; Y ). Using the GAN trick, we could approximateI(Z; Y ) in the form of optimization; for the binary sensitive attribute case, the approximationreads:
I(Z; Y ) ≈ maxD(·)
1
m
∑i:z(i)=1
logD(y(i)) +∑
i:z(i)=0
log(
1−D(y(i)))+H(Z).
We then parameterized D(·) with θ to obtain:
minw
maxθ
1
m
m∑i=1
`CE(y(i), y(i)) + λ
∑i:z(i)=1
logDθ(y(i)) +
∑i:z(i)=0
log(
1−Dθ(y(i))) . (1)
Two questions that arise are: (i) how to solve the optimization (1)?; and (ii) how to implementthe algorithm via Pytorch?
Today’s lecture
Today we will address these two questions. Specifically what we are going to do are four-folded.First we will investigate a practical algorithm that allows us to attack the optimization (1). Wewill then do a case study for the purpose of exercising the algorithm: recidivism prediction. Inthe process, we will put a special emphasis on one implementation detail: synthesizing unfairdataset that we will use in our experiments. Lastly we will learn how to implement programmingvia Pytorch.
Observation
1

Let us start by translating the optimization (1) into the one that is more programming-friendly:
minw
maxθ
1
m
m∑i=1
`CE(y(i), y(i)) + λ
∑i:z(i)=1
logDθ(y(i)) +
∑i:z(i)=0
log(
1−Dθ(y(i)))
(a)= min
wmaxθ
1
m
{m∑i=1
`CE(y(i), y(i)) + λ
(m∑i=1
z(i) logDθ(y(i)) + (1− z(i)) log
(1−Dθ(y
(i))))}
(b)= min
wmaxθ
1
m
{m∑i=1
`CE
(y(i), y(i)
)− λ
m∑i=1
`CE
(z(i), Dθ(y
(i)))}
= minw
maxθ
1
m
{m∑i=1
`CE
(y(i), Gw(x(i))
)− λ`CE
(z(i), Dθ(Gw(x(i)))
)}︸ ︷︷ ︸
=:J(w,θ)
where (a) is due to z(i) ∈ {0, 1}; and (b) is due to the definition of the binary cross entropyloss `CE(·, ·). Notice that J(w, θ) contains two cross entropy loss terms, each being a non-trivialfunction of Gw(·) and/or Dθ(·). Hence, in general, J(w, θ) is highly non-convex in w and highlynon-concave in θ.
Alternating gradient descent
Similar to the prior GAN setting, what we can do in this context is to apply the only techniquethat we are aware of: alternating gradient descent. And then hope for the best. So we employthe k : 1 alternating gradient descent:
1. Update Classifier (Generator)’s weight:
w(t+1) ← w(t) − α1∇wJ(w(t), θ(t·k)).
2. Update Discriminator’s weight k times while fixing w(t+1): for i=1:k,
θ(t·k+i) ← θ(t·k+i−1) + α2∇θJ(w(t+1), θ(t·k+i−1)).
3. Repeat the above.
Again one can use the Adam optimizer possibly together with the batch version of the algorithm.
Optimization used in our experiments
Here is the optimization that we will use in our experiments:
minw
maxθ
1
m
{m∑i=1
(1− λ)`CE
(y(i), Gw(x(i))
)− λ`CE
(z(i), Dθ(Gw(x(i)))
)}. (2)
In order to restrict the range of λ into 0 ≤ λ ≤ 1, we apply the (1− λ) factor to the predictionaccuracy loss term.
Like the prior GAN setting, let us define two loss terms. One is “Generator (or Classifier) loss”:
minw
maxθ
1
m
{m∑i=1
(1− λ)`CE
(y(i), Gw(x(i))
)− λ`CE
(z(i), Dθ(Gw(x(i)))
)e
}︸ ︷︷ ︸
“generator (classifier) loss”
.
2

Given w, the Discriminator wishes to maximize:
maxθ− λm
m∑i=1
`CE
(z(i), Dθ(Gw(x(i)))
).
This is equivalent to minimizing the minus of the objective:
minθ
λ
m
m∑i=1
`CE
(z(i), Dθ(Gw(x(i)))
)︸ ︷︷ ︸
“discriminator loss”
. (3)
This is how we define the “Discriminator loss”.
Performance metrics
Unlike to the prior two settings (supervised learning and GAN), here we need to introduceanother performance metric that captures the degree of fairness. To this end, let us first definethe hard-decision value of the prediction output w.r.t. an unseen (test) example:
Ytest := 1{Ytest ≥ 0.5}.
The test accuracy is then defined as:
1
mtest
mtest∑i=1
1{y(i)test = y(i)test}
where mtest denotes the number of test examples. This is an empirical version of the groundtruth Pr(Ytest = Ytest).
Now how to define a fairness-related performance metric? Recall the mathematical definition ofDI:
DI := min
(Pr(Y = 1|Z = 0)
Pr(Y = 1|Z = 1),Pr(Y = 1|Z = 1)
Pr(Y = 1|Z = 0)
). (4)
Here you may wonder how to compute two probability quantities of interest: Pr(Y = 1|Z = 0)and Pr(Y = 1|Z = 1). Again we use its empirical version relying on the Law of Large Number:
Pr(Y = 1|Z = 0) =Pr(Y = 1, Z = 0)
Pr(Z = 0)≈∑mtest
i=1 1{y(i)test = 1, z(i)test = 0}∑mtest
i=1 1{z(i)test = 0}.
The above approximation is getting more and more accurate as mtest gets larger. Similarly wecan approximate Pr(Y = 1|Z = 1). This way, we can evaluate the DI (4).
A case study
Now let us exercise what we have learned so far with a simple example. As a case study, weconsider the same simple setting that we introduced earlier: recidivism prediction, wherein thetask is to predict if an interested individual reoffends within 2 years, as illustrated in Fig. 1.
Synthesizing unfair dataset
One thing that we need to be careful about in the context of fairness machine learning is w.r.t.unfair dataset. Here for simplicity, we will employ a synthetic dataset, not real-world dataset.
3

CN23_1
Recidivism
predictor
Figure 1: Predicting a recidivism score y from x = (x1, x2). Here x1 indicates the number ofprior criminal records; x2 denotes a criminal type: misdemeanor or felony; and z is a race typeamong white (z = 0) and black (z = 1).
In fact, there is a real-world dataset that concerns the recidivism prediction, called the COMPASdataset. But this contains many attributes, so it is a bit complicated. Hence, we will take aparticular yet simple method to synthesize a much simpler unfair dataset.
Recall the visualization of an unfair data scenario that we investigated in Lecture 21 and willform the basis of our synthetic dataset (to be explained in the sequel); see Fig. 2. In Fig. 2,
CN23_2
non-reoffend
reoffend
Figure 2: Data points visualization: A hallowed (or black-colored-solid) circle indicates a datapoint of an individual with white (or black) race; the red (or blue) colored edge denotes y = 1reoffending (or y = 1 non-reoffending) label.
a hallowed (or black-colored-solid) circle indicates a data point of an individual with white (orblack) race; and the red (or blue) colored edge (ring) denotes the event that the interestedindividual reoffends (or non-reoffends) within two years. This is indeed an unfair scenario: fory = 1, there are more black-colored-solid circles than hallowed ones; similarly for y = 0, thereare more hallowed circles relative to solid ones.
To generate such an unfair dataset, we employ a simple method. See Fig. 3. We first generatem labels y(i)’s so that they are i.i.d. each being according to Bern(12). For indices of positive
examples (y(i) = 1), we then generate i.i.d. x(i)’s according to N ((1, 1), 0.52I); and i.i.d. z(i)’s
4

as per Bern(0.8), meaning that 80% are blacks (z = 1) and 20% are whites (z = 0) among thepositive individuals. Notice that the generation of x(i)’s is not quite realistic - the first andsecond components in x(i) do not precisely capture the number of priors and a criminal type.You can view this generation as sort of a crude abstraction of such realistic data. On the otherhand, for negative examples (y(i) = 0), we generate i.i.d. (x(i), z(i))’s with different distributions:x(i) ∼ N ((−1,−1), 0.52I) and z(i) ∼ Bern(0.2), meaning that 20% are blacks (z = 1) and 80%are whites (z = 0). This way, z(i) ∼ Bern(12). Why?
CN23_3
Figure 3: Synthesizing a simple unfair dataset.
Model architecture
Fig. 4 illustrates the architecture of Fairness-GAN. Since we focus on the binary sensitive at-tribute, we have a single output Dθ(y) in the Discriminator. For models of Classifier and
CN23_4
Classifier Discriminator
Figure 4: The architecture of Fairness-GAN.
Discriminator, we employ very simple single-layer neural networks with logistic activation in theoutput layer; see Fig. 5.
Pytorch: Synthesizing unfair dataset
Now let us discuss how to implement such details via Pytorch. First unfair dataset synthesis.
5

logistic
input
CN23_6
logistic
input
(a) (b)
output output
Figure 5: Models for (a) Classifier and (b) Discriminator.
To generate i.i.d binary random variables for labels, we use:
y train = numpy.random.binomial(1,0.5,size=(train size, ))
where the first two arguments of (1,0.5) specify Bern(0.8); and the null space followed bytrain size indicates a single dimension. Remember we generate i.i.d. Gaussian random vari-ables for x(i)’s. To this end, one can use one of the following two ways:
x = torch.normal(mean=(1,1),std=0.5,size=(train size,2))
x = numpy.random.normal(loc=(1,1),scale=0.5,size=(train size,2))
Pytorch: Optimizers for Classifier & Discriminator
For Classifier, we use Adam optimizer with lr c=0.005 and (b1,b2)=(0.9,0.999). For Dis-criminator, we use SGD with lr d=0.005:
classifier = Classifier()
discriminator = Discriminator()
optimizer G = torch.optim.Adam(classifier.parameters(),lr=lr c,betas=(b1,b2))
optimizer D = torch.optim.SGD(discriminator.parameters(),lr=lr d)
where Classifier() and Discriminator() are neural network models which respect the struc-ture in Fig. 5. Since you may be familiar with how to program the models, we omit detailshere.
Pytorch: Classifier (Generator) loss
Recall the optimization problem of interest:
minw
maxθ
1
m
{m∑i=1
(1− λ)`CE
(y(i), Gw(x(i))
)− λ
m∑i=1
`CE
(z(i), Dθ(Gw(x(i)))
)}.
To implement the Classifier loss (the objective in the above), we use:
p loss = CE loss(y pred,y train)
f loss = CE loss(discriminator(y pred.detach()),z train)
g loss = (1- lambda)*p loss - lambda*f loss
6

where y pred indicates the Classifier output; y train denotes a label; and z train is a binarysensitive attribute. Note in this Fairness-GAN implementation that we use the full batch.
Pytorch: Discriminator loss
Recall the Discriminator loss that we defined in (3):
minθ
λ
m
m∑i=1
`CE
(z(i), Dθ(Gw(x(i)))
).
To implement this, we use:
f loss = CE loss(discriminator(y pred.detach()), z train)
d loss = lambda*f loss
Pytorch: Evaluation
Recall the DI performance:
DI := min
(Pr(Y = 1|Z = 0)
Pr(Y = 1|Z = 1),Pr(Y = 1|Z = 1)
Pr(Y = 1|Z = 0)
).
To evaluate the DI performance, we rely on the following approximation:
Pr(Y = 1|Z = 0) ≈∑mtest
i=1 1{y(i)test = 1, z(i)test = 0}∑mtest
i=1 1{z(i)test = 0}.
Here is how to implement this in details:
y tilde = (y pred >0.5).int().squeeze()
z0 ind = (z train == 0.0)
z1 ind = (z train == 1.0)
z0 sum = int(torch.sum(z0 ind))
z1 sum = int(torch.sum(z1 ind))
Pr y1 z0 = float(torch.sum((y tilde==1)[z0 ind]))/z0 sum
Pr y1 z1 = float(torch.sum((y tilde==1)[z1 ind]))/z1 sum
7

EE623 Information Theory December 4, 2019KAIST, Fall 2019 Changho Suh ([email protected])
Lecture 24: Remarks on how to do research
Today’s lecture
Today is the last lecture day for the course. So I would like to share something which may beuseful for your future careers. In particular, I wish to talk about two things w.r.t. how to doresearch. The first is my personal advice which might be helpful for you to advance moderntechnologies. The second is my own methodology w.r.t. how to efficiently read research papers.
Summary of the course
Prior to telling you my advice on your future career, let me summarize what we have learnedso far. In Part I, we have studied three information-theoretic notions: (i) entropy; (ii) mutualinformation; (iii) KL divergence. In Part II, we explored important roles of the notions whileproving Shannon’s two celebrated theorems: (a) source coding theorem; (b) channel codingtheorem.
In Part III, we could find interesting roles of such notions in a different trending field: machinelearning. We investigated: (i) the core role of cross entropy in the design of a loss function forsupervised learning; (ii) the fundamental role of the KL divergence in the design of a powerfulunsupervised learning framework: GAN; (iii) the recently discovered role of mutual informationin the design of machine learning algorithms that ensure fairness.
Be strong at fundamentals
One key message that we can see from what we have learned is that fundamental concepts(entropy, KL divergence, and mutual information in this context) play important roles. So inview of this, my advice is: Be strong at fundamentals! But you may be confused about myadvice because there are many fundamentals and what I meant by fundamentals are not clearenough. So you may wonder which fundamentals which I recommend you to focus on. Thefundamentals that I would like to put a special emphasis on are w.r.t. modern technologies. Toexplain what it means, let us first investigate fundamentals which played important roles in olddays.
Fundamentals in old days
As we all know, old-days technologies were driven by 1st, 2nd and 3rd industrial revolutions.Such revolutions were due to breakthrough inventions, insired by scientific results. The keyinvention that led to the 1st industrial revolution was the steam engine. It is based on theomo-dynamics in which physics and chemistry play foundational roles. The invention that triggeredthe 2nd revolution was electricity which is based on electromagnetism which again physics pro-vides a theory behind. The invention for the 3rd revolution was computer which forms thebasis of our daily lives. The computer is based on the invention of semiconductor which againphysics and chemistry provide the foundation for. These fundamentals are definitely important.However, these are not the ones that I meant. What I wish to put an emphasis on is w.r.t.modern-day technologies.
Fundamentals in modern days
1

The modern-days technologies are being driven by the 4th industrial revolution. As we all know,the main theme of the 4th industrial revolution is: Artificial Intelligence (AI). Now what arethe fundamentals that form the basis of AI technologies? Remember that the fields of machinelearning and deep learning which provide key methodologies for achieving machine intelligenceare all based on optimization, which is a branch of mathematics. Hence, one major driving forcefor AI technologies is: mathematics.
Four fundamentals in mathematics
In particular, the following four branches in mathematics play foundational roles in AI technolo-gies. The first is obviously the optimization. The second is a field which provides instrumentaltools with which one can translate the objective function and/or constraints into simple andtractable formulas. The field is: linear algebra. As you may be familiar with, many seemingly-complicated mathematical formulas can be expressed as simple terms that involve matrix mul-tiplications and additions. The third is a field that plays a role in dealing with uncertaintythat appears in random quantities. The field is: probability. The last is a field that serves toshed optimal architectural insights into machine learning models of interest. That is: informa-tion theory. Again remember the roles of information-theoretic notions that we investigated forsupervised learning and unsupervised learning.
These are the very fundamentals which I believe are crucial for advancing the 4th industrialrevolution empowered by AI technologies. So my advice is: Be strong at these fundamentals.One caveat here is that such fundamentals are highly likely to be built only when you areat school. Of course it is a bit exaggerated, but it seems indeed the case according to theexperiences of my own and many others. You may be able to understand what this means afteryou graduate; not enough time would be given for you to deeply understand some principles andalso your stamina would not be as good as that of now.
Another thing that you should be strong at
Is building up such fundamentals enough for you to advance AI technologies? Unfortunately itis not the case. There is another crucial thing that you should be strong at. Remember theend product of machine learning. In most cases, it yields “algorithms” instead of “closed-formsolutions”. In other words, it provides a set of instructions on what we should do in order toperform a task of interest, instead of directly telling us a task result. As you experienced, suchset of instructions requires heavy computations; the computation by hand is almost impossible,so it should be done on a computer. This is exactly where another important thing kicks in.That is: programming tools such as Python and Pytorch that we have experienced in Part III. Ihighly recommend you to be strong at this as well. Fast implementations via great programmingskills will help you to realize your ideas as well as to advance them.
One caveat w.r.t. programming tools is that unfortunately the tools are changing over time.This is because the capability and efficiency of programming languages depend on computationresource and power which are being advanced in a fast manner. Hence, you should follow upwhenever such changes are made.
How to read research papers?
A second thing that I would like to share with you is regarding a methodology as to how todo research. In particular, I want to discuss on: how to read research papers. Two reasonsthat I picked up this topic. One is that very unfortunately, there is no systematic curriculumon this, although this may be of the greatest interest to students. So students simply attemptto read any seemingly-interesting (or randomly chosen) paper without any particular thought
2

and strategy in their minds. The second is that reading papers efficiently is perhaps the mostdifficult thing even for experienced students who are often exposed to research environments.These are the reasons that I decided to talk about this topic.
Disclaimer: The contents that I will share soon are my own opinions.
Two strategies
There are two strategies depending on what you wish to do. The first is a passive approachwhich can be applied to the case when you want to learn some basics and trends (not necessarilyto write a paper) in an interested field. The second is an active approach which I think isapplicable to the case when you wish to be an expert (or forced to write a paper) in a trendingand non-mature field.
Passive approach
What I mean by the passive approach is to rely on experts. In other words, it is to wait untilexperts can teach in a very accessible manner, and then read well-written papers by such experts.It would be the best if such papers are of survey type. Two natural questions that you can askthen are: (i) how to figure out such experts?; (ii) how to read such well-written papers? Hereare my answers.
How to figure out experts?
For the first question, I recommend the following three ways. The first is to ask professors,seniors and/or peers who are actually working in the field. Usually well-known figures are easilyrecognized by anyone in the field. So simply ask them. The second is to rely on Google: searchingwith proper keywords. Nowadays many (actually too many) blogs are floating around websites.So some famous relevant blogs may provide pointers and references which might hint for suchexperts. Once you locate someone, you may want to check their Google citation records. The lastis to check organizers and tutorial/keynote speakers in flagship conferences and/or workshops.Those are likely to be experts. You may be confused when identified scholars are too young andso their track records may be a bit weak. In such case, you may want to check their advisors.Great advisors usually yield great students.
How to read well-written papers?
Once you figure out experts, the next is to read well-written papers by them. Usually most-citedsurvey papers are a good choice. Here are a couple of guidelines on how to read them.
The first and most important suggestion is to read intensively. Not skimming through a paper.Preferably, please read while writing down what you understand. You will have a better, clearerand deeper understanding when you translate their words into your own. I also recommendyou to ponder on theorems prior to reading their proofs. Key messages are delivered mostly inthe form of theorems, and understanding the main messages and their implications, reflected inthe theorems, is the most important part. Diving into proofs (usually containing technical andnon-insightful details) prior to understanding what the theorems mean will distract you withoutany insight, so you will lose your interest and/or burn out quickly. Once you grasp the mainmessages, you can then dive into technical details.
The second suggestion is to read the paper several times until you fully absorb contents. Per-sonally I consider a very good paper as a Bible. Reading several times will you make have deepand diverse understandings on the contents. Also be familiar with proof techniques if any. Agood paper usually contains very simple and insightful proof techniques. Simply a short proof
3

is not necessarily good unless it is insightful. I believe that a good proof comes with insightsalthough it is rather long.
The last guideline is to respect experts’ notations, logical flows, mindsets and writing-styles.Usually excellent writers spend lots of time in choosing their notations, making a storyline andrefining their writings. So theirs are best picks and well-cultivated. You may also have yourowns. But if you find theirs better than yours, then please do not hesitate to replace yours withthem. Or if you have none or if you cannot judge, simply follow theirs. It is worth copying.
Active approach
Now let us move onto the second approach: the active approach. As mentioned earlier, this isintended for those who wish to write papers in a relatively new (emerging) field. In other words,it is for those who cannot wait until the field becomes mature so that experts start to world-tourfor delivering keynotes and/or tutorials. The spirit of the approach is based on trials-&-errors.It is to read many recent papers and do back-and-forth until you figure out a big picture. Asyou may image, this is not that simple. It is in fact quite difficult. The keys to this approachare to: (i) identify relevant and good papers quickly ; (ii) figure out main ideas of the identifiedpapers quickly. Now how to do such quickly? How to do back-and-forth with multiple papers?
How to identify relevant/good papers quickly?
For the first question, I recommend the following two ways. The first is almost the same as theone mentioned in the passive approach. That is to ask professors, seniors and/or peers workingin the field. But there is one caveat here. The caveat is that they should be experts in the field.This is because figuring out good papers in a new field is not that simple. So usually non-expertsdo not easily identify such papers, and even if they are able to do so with non-trivial efforts,they are not motivated to spend much time in searching for papers on behalf of others.
The second suggestion is to search in relevant conferences and workshops, yet in a very strategicmanner. As you may imagine, there are many conferences/workshops and so there are manypapers to check. So the key is to quickly figure out relevancy and quality of papers to make ashort list that contains only the core papers worth delving into. Here is my recommendation todo this. First look only at the “title”. If it contains some relevant keywords, it is grammaticallycorrect, and looks fancy (at least not awkward), then start to read “abstract”. Otherwise removeit from a list. There may be some non-well-written papers which yet contain ground-breakingresults, but this is a very rare case. Also even if we miss it according to such a strict rule, lateryou will have enough chances to revisit the papers by others. Don’t worry. Next, if an abstractof a surviving paper is relevant and well-written, we can then add it to a short list. Otherwise,throw it away. Usually authors make lots of efforts in writing and polishing an abstract, so ifit includes some awkward sentences, then it would be likely to contain much worse sentences inthe main body. This will make you have hard time figuring out the main idea of the paper. Nota good idea to keep the paper in the list.
Further short-list papers if needed
Once you apply the above rules, then you may end up with several or more papers. If the numberof filtered papers is around (or beyond) 10, I recommend you to further short-list papers viainvestigating more information. Here is how. First set up your goal: what you want to knowfrom a chosen paper. You then start reading “introduction” while keeping in mind your goal. Ifit is relevant to your goal and again it is well-written, then make it stay in the list. Otherwise,
4

throw it away.
Figure out main ideas of the short-listed papers
At this moment, the list should contain only several (or a couple of) papers. Otherwise, repeatthe prior step with a more strict caliber until you have only several papers in the list. Onceyou pass the step, then search for the punch-line sentence in the introduction of each paper. Ifyou do not locate or do not understand it, then start reading other sections until you figure out.Once you figure out, rephrase the punch-line sentence into your own and write it down in thefirst-page heading of the paper. If you feel very annoyed while figuring out, simply stop readingand move onto a next paper.
Do back-and-forth
Iterate the above procedure while summarizing the main ideas of possibly all the short-listedpapers. Two things that you should keep in mind during the iteration process. The first is: Donot spend much time in reading “related works”. Usually “related works” are heavy and arenot along the main storyline of the paper. This is because authors are sort of forced to cite allthe relevant (although not quite related) works to avoid any negative reviews potentially fromnon-cited paper authors. So you do not need to investigate all the contents in “related works”.Rather it is mostly okay to simply ignore all of them. The second is w.r.t. the investigation ofother references. If you really need to read another referenced paper in the process, then tryto read it very quickly while keeping in mind you goal. Preferably do not be distracted withreading other references or with spending much time on them.
You can stop the iteration process until either: (a) you figure out a big picture; or (b) you finda very well-written paper (which I called the “anchor paper”) that describes a whole pictureclearly. The way to read the “anchor paper” is the same as the one that I mentioned w.r.t. thepassive approach. This way, you will figure out a big picture.
Do your own research
Once you figure out a big picture, I recommend you to focus on doing your own research whilenot being too much distracted with reading other papers. Here is a guideline for the step.
1. Choose a challenge that you want to address;
2. Formulate a simple yet concrete problem that can address the challenge;
3. Try to solve the problem with conventional wisdom from first-principle thinking.
You may be stuck especially at the 3rd procedure in the above. If so, you may want to interactwith your advisors, seniors and/or peers.
Two final remarks
Finally I would like to leave two remarks. The first is: Don’t give up during the process. Doingresearch is not a simple process at all. It is very natural for you to feel discouraged and head-aches several times while in the process. But the patience will get you rewarded in the end.The second is w.r.t. communication skills. As you may see in the guidelines, a key is to quicklyfigure out the writing quality and the main idea of a paper. So I strongly recommend you towork hard to improve reading comprehension and grammars.
5