lecture notes sampling
TRANSCRIPT

8/8/2019 Lecture Notes Sampling
http://slidepdf.com/reader/full/lecture-notes-sampling 1/26

8/8/2019 Lecture Notes Sampling
http://slidepdf.com/reader/full/lecture-notes-sampling 2/26
2
B asics of sampling IB asics of sampling I
A sample is a³part of a wholeto show what therest is like´.
Sampling helps todetermine thecorresponding value of the
population and plays a vital role inmarketing research.
Samples offer many benefits:Save costs : L ess expensive to study thesample than the population.
Save time : L ess time needed to study thesample than the population .A ccuracy : Since sampling is done withcare and studies are conducted by skilled and qualified interviewers, the results are
expected to be accurate.
8/8/2019 Lecture Notes Sampling
http://slidepdf.com/reader/full/lecture-notes-sampling 3/26
3
B asics of sampling IIB asics of sampling II
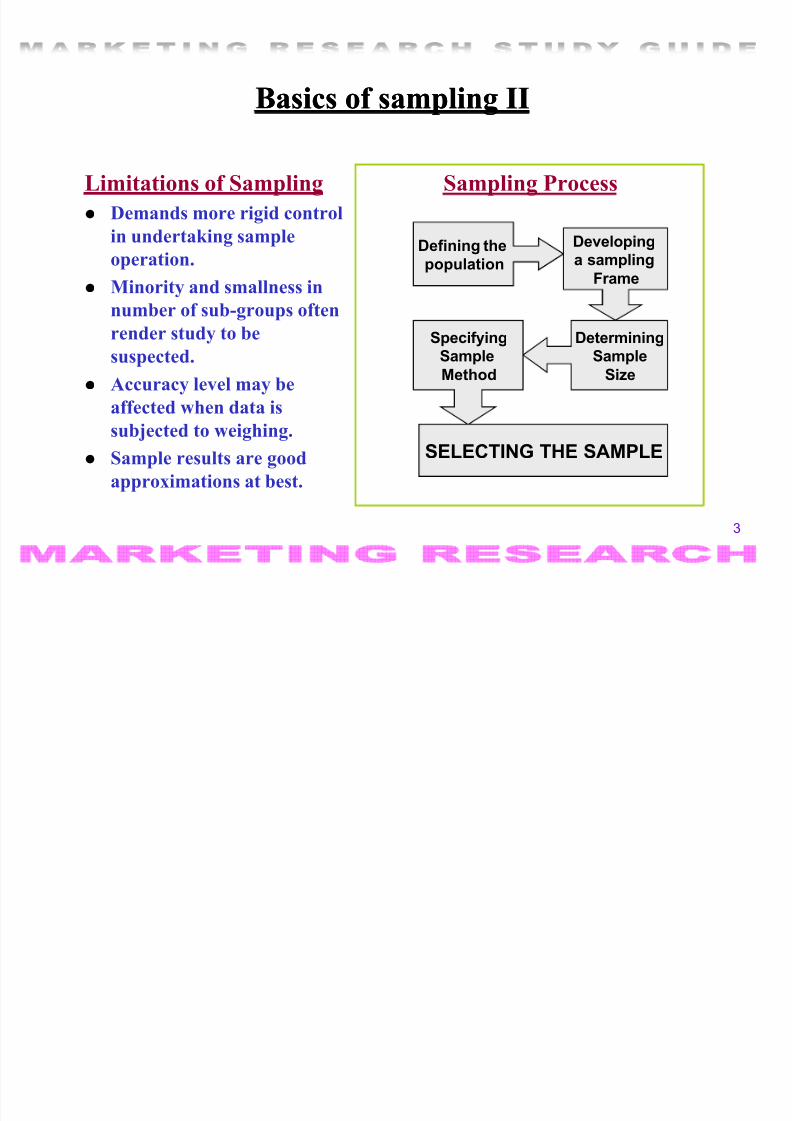
Limitations of SamplingD emands more rigid controlin undertaking sampleoperation.
Minority and smallness innumber of sub-groups oftenrender study to besuspected.A ccuracy level may be
affected when data issubjected to weighing.Sample results are goodapproximations at best.
Sampling Process
Defining thepopulation
Developinga sampling
Frame
DeterminingSample
Size
SpecifyingSampleMethod
SELECTING THE SAMPLE

8/8/2019 Lecture Notes Sampling
http://slidepdf.com/reader/full/lecture-notes-sampling 4/26
4
Sampling: Step 1
D efining the UniverseUniverse or population is thewhole mass under study.H ow to define a universe:
»W
hat constitutes the units of analysis (H DB apartments)?» W hat are the sampling units
(H DB apartments occupied inthe last three months)?
» W hat is the specific designationof the units to be covered (H DB in town area)?
» W hat time period does the datarefer to ( D ecember 31, 1995)
Sampling: Step 2
Establishing the SamplingFrame
A sample frame is the list of all elements in the population(such as telephone directories,electoral registers, clubmembership etc.) from whichthe samples are drawn.A sample frame which does notfully represent an intended
population will result in frameerror and affect the degree of reliability of sample result .

8/8/2019 Lecture Notes Sampling
http://slidepdf.com/reader/full/lecture-notes-sampling 5/26
5
StepStep -- 33
D etermination of Sample SizeD etermination of Sample Size
Sample size may be determined by using:» Subjective methods ( less sophisticated methods )
± T he rule of thumb approach: eg. 5% of population ± Conventional approach: eg. A verage of sample sizes of
similar other studies; ± Cost basis approach: T he number that can be studied
with the available funds;
» Statistical formulae ( more sophisticated methods ) ± Confidence interval approach.

8/8/2019 Lecture Notes Sampling
http://slidepdf.com/reader/full/lecture-notes-sampling 6/26
6
Conventional approach of Sample size determination using
Sample sizes used in different marketing research studies
TY PE OF S T UDY MINIMUMSIZE
TY PIC A LR A NGE
Identifying a problem (e.g.marketsegmentation) 500 1000-2500Problem-solving (e.g., promotion) 200 300-500Product tests 200 300-500A dvertising ( TV , Radio, or print Mediaper commercial or ad tested) 150 200-300T est marketing 200 300-500T est market audits 10
stores/outlets10-20
stores/outletsFocus groups 2 groups 4-12 groups

8/8/2019 Lecture Notes Sampling
http://slidepdf.com/reader/full/lecture-notes-sampling 7/26
7
Sample size determination using statistical formulae:Sample size determination using statistical formulae:T he confidence interval approach
T o determine sample sizes using statistical formulae,researchers use the confidence interval approach based on thefollowing factors:
» D esired level of data precision or accuracy;» A mount of variability in the population (homogeneity);» L evel of confidence required in the estimates of population values.
A vailability of resources such as money, manpower and time
may prompt the researcher to modify the computed samplesize. Students are encouraged to consult any standard marketing research textbook to have an understanding of these formulae.

8/8/2019 Lecture Notes Sampling
http://slidepdf.com/reader/full/lecture-notes-sampling 8/26
8
tep 4:Step 4:Specifying the sampling methodSpecifying the sampling method
Probability Sampling» Every element in the target population or universe [sampling
frame] has equal probability of being chosen in the sample for
the survey being conducted.» Scientific, operationally convenient and simple in theory.
» Results may be generalized.
Non-Probability Sampling» Every element in the universe [sampling frame] does not have
equal probability of being chosen in the sample.
» Operationally convenient and simple in theory.
» Results may not be generalized.

8/8/2019 Lecture Notes Sampling
http://slidepdf.com/reader/full/lecture-notes-sampling 9/26
9
Probability samplingProbability sampling
A ppropriate for
homogeneous population» Simple random sampling
± Requires the use of a randomnumber table.
» Systematic sampling ± Requires the sample frame
only, ± No random number table is
necessary
A ppropriate for
heterogeneous population» Stratified sampling
± Use of random number table may be necessary
» Cluster sampling ± Use of random number
table may be necessary
Four types of probability sampling

8/8/2019 Lecture Notes Sampling
http://slidepdf.com/reader/full/lecture-notes-sampling 10/26
10
NonNon--probability samplingprobability sampling
Four types of non-probability sampling techniques
» V ery simple types, based on subjective criteria ± Convenient sampling ± Judgmental sampling
» More systematic and formal
± Quota sampling » Special type
± Snowball Sampling

8/8/2019 Lecture Notes Sampling
http://slidepdf.com/reader/full/lecture-notes-sampling 11/26
11
Simple Random SamplingSimple Random Sampling
A lso called randomsampling
Simplest method of probabilitysampling
1 2 3 4 5 6 7 8 9 10 11 1 2 1 3 1 4 1 5 1 6 1 7 1 8 1 9 2 0
1 37 75 10 49 98 66 0 3 86 34 8 0 98 44 22 22 45 83 53 86 23 5 1
2 50 91 56 4 1 52 82 98 11 57 96 27 10 27 1 6 35 34 47 01 36 0 83 99 1 4 23 5 0 21 01 0 3 25 79 0 7 80 54 55 4 1 1 2 1 5 1 5 0 3 68 564 70 72 01 00 33 25 1 9 1 6 23 58 0 3 78 47 43 77 88 1 5 0 2 55 675 1 8 46 0 6 49 47 32 58 0 8 75 29 63 66 89 0 9 22 35 97 74 3 0 80
6 65 76 34 11 33 6 0 95 0 3 53 72 0 6 78 28 1 4 5 1 78 76 45 26 457 83 76 95 25 7 0 60 1 3 32 52 11 87 38 49 01 82 84 99 0 2 64 00
8 58 9 0 0 7 84 2 0 98 57 93 36 65 10 71 83 93 42 46 34 6 1 44 01
9 54 74 67 11 1 5 78 2 1 96 43 1 4 11 22 74 1 7 0 2 54 5 1 78 76 7610 56 8 1 92 73 4 0 0 7 2 0 0 5 26 63 57 86 48 5 1 59 1 5 46 0 9 75 64
11 34 99 0 6 21 22 38 22 32 85 26 37 00 62 27 74 46 0 2 6 1 59 8 1
1 2 0 2 26 92 27 95 87 59 38 1 8 3 0 95 38 36 78 23 2 0 1 9 65 48 5 0
1 3 43 0 4 25 36 00 45 73 8 0 0 2 6 1 31 10 0 6 72 39 0 2 00 47 0 6 981 4 92 56 5 1 22 11 0 6 86 88 77 86 59 57 66 1 3 82 33 97 2 1 31 61
1 5 67 42 43 26 2 0 60 84 1 8 68 48 85 00 00 48 35 48 57 63 38 84
Need to use Need to useRandomNumber T able

8/8/2019 Lecture Notes Sampling
http://slidepdf.com/reader/full/lecture-notes-sampling 12/26
12
How to U R om mbe r b les
________________________________________________ 1. Assign a unique number to each population element in the
sampling frame. Start with serial number 1, or 1, or 1,etc. upwards depending on the number of digits required.
2. Choose a random starting position.. Select serial numbers systematically across rows or down
columns.. Discard numbers that are not assigned to any population
element and ignore numbers that have already been
selected.. Repeat the selection process until the required number of
sample elements is selected.

8/8/2019 Lecture Notes Sampling
http://slidepdf.com/reader/full/lecture-notes-sampling 13/26
13
How to Use a T able of Random Numbers to Select a Sample
Y our marketing research lecturer wants to randomly select 20 students from your class of 100 students. H ere is how he can do it using a random number table.Step 1 : Assign all the 100 members of the population a unique number.You mayidentify each element by assigning a two-digit number. Assign 01 to the first nameon the list, and 00 to the last name. If this is done, then the task of selecting thesample will be easier as you would be able to use a 2-digit random number table.
NA ME NUM B ER N A ME NUM B ER
Adam, Tan 01 Tan Teck Wah 42«««««« «««««««« «Carrol, Chan 0 8 Tay Thiam Soon 6 1
««««««. « ««««««.. «
Jerry Lewis1
8 Teo Tai Meng 87««««««. « «««««««. «Lim Chin Nam 26 «««««««« «««««««. « Yeo Teck Lan 99Singh, Arun 3 0 Z ailani bt Samat 00

8/8/2019 Lecture Notes Sampling
http://slidepdf.com/reader/full/lecture-notes-sampling 14/26
14
Ste 2: S elect any starting point in the Random umber Table and ind the irst number thatcorresponds to a number on the list o your population. In the example belo , # 0 8 has beenchosen as the starting point and the irst student chosen is arol han.
10 0 9 73 25 33 7637 54 2 0 48 0 5 640 8 42 26 89 53 1 990 01 90 25 29 0 91 2 80 79 99 7 0 80
66 06 57 47 1 7 3431 06 01 0 8 0 5 45
Ste 3: M ove to the next number, 42 and select the person corresponding to that number intothe sample. #87 ± Tan Teck Wah
Ste 4: ontinue to the next number that quali ies and select that person into the sample.# 26 -- Jerry e is, ollo ed by #89, #53 and # 1 9
Ste 5: ter you have selected the student # 1 9, go to the next line and choose #9 0 . ontinuein the same manner until the ull sample is selected. I you encounter a number selectedearlier (e.g., 9 0 , 0 6 in this example) simply skip over it and choose the next number.
Starting point:move right to the end
of the row, then downto the next row row;
move left to the end,then down to the next row, and so on.
How to use random number table to select a random sample

8/8/2019 Lecture Notes Sampling
http://slidepdf.com/reader/full/lecture-notes-sampling 15/26
15
Systematic samplingSystematic samplingy V ery similar to simple random sampling with one exception.y In systematic sampling only one random number is needed throughout the
entire sampling process.y T o use systematic sampling, a researcher needs:
[i] a sampling frame of the population; and is needed.[ii] a skip interval calculated as follows:
Skip interval = population list sizeSample size
y Names are selected using the skip interval.y f a researcher were to select a sample of 1000 people using the local telephone
directory containing 215,000 listings as the sampling frame, skip interval is [215,000/1000], or 215. T he researcher can select every 215 th name of the entiredirectory [sampling frame], and select his sample .

8/8/2019 Lecture Notes Sampling
http://slidepdf.com/reader/full/lecture-notes-sampling 16/26
16
E xample: H ow to T ake a Systematic Sample
Step 1: Select a listing of the population, say the City T elephone D irectory, from which to
sample. Remember that the list will have an acceptable level of sample frame error.
Step 2: Compute the skip interval by dividing the number of entries in the directory by thedesired sample size. E xample: 250,000 names in the phone book, desired a sample size of 2500,
So skip interval = every 100 th name
Step 3: Using random number(s), determine a starting position for sampling the list. E xample: Select: Random number for page number. (page 01)
Select: Random number of column on that page. ( col. 03) Select: Random number for name position in that column (#38, say, A ..Mahadeva)
Step 4: A pply the skip interval to determine which names on the list will be in the sample.
E xample: A . Mahadeva (Skip 100 names), new name chosen is A Rahman b A hmad.
Step 5: Consider the list as ³circular´; that is, the first name on the list is now the initial nameyou selected, and the last name is now the name just prior to the initially selected one. E xample: When you come to the end of the phone book names (Zs), just continue on
through the beginning ( A s).

8/8/2019 Lecture Notes Sampling
http://slidepdf.com/reader/full/lecture-notes-sampling 17/26
17
Stratified sampling IStratified sampling I
A three-stage process:
Step 1- D ivide the population intohomogeneous, mutually exclusiveand collectively exhaustive subgroupsor strata using some stratificationvariable;
Step 2- Select an independent simplerandom sample from each stratum.
Step 3- Form the final sample byconsolidating all sample elements
chosen in step 2.May yield smaller standard errors of estimators than does the simple randomsampling. T hus precision can be gainedwith smaller sample sizes.
Stratified samples can be:
Proportionate: involving theselection of sample elementsfrom each stratum, such thatthe ratio of sample elementsfrom each stratum to thesample size equals that of thepopulation elements withineach stratum to the totalnumber of populationelements.D isproportionate: the sampleis disproportionate when theabove mentioned ratio isunequal.

8/8/2019 Lecture Notes Sampling
http://slidepdf.com/reader/full/lecture-notes-sampling 18/26
18
T o select a proportionate stratified sample of 20 members of the Island V ideo Club which has100 members belonging to three language based groups of viewers i.e., English (E), Mandarin(M) and Others (X).
Step 1: Identify each member from the membership list by his or her respective language groups00 (E ) 20 (M) 40 (E ) 60 ( X ) 80 (M)01 (E ) 21 ( X ) 41 ( X ) 61 (M) 81 (E )02 ( X ) 22 (E ) 42 ( X ) 62 (M) 82 (E )03 (E ) 23 ( X ) 43 (E ) 63 (E ) 83 (M)04 (E ) 24 (E ) 44 (M) 64 (E ) 84 ( X )
05 (E ) 25 (M) 45 (E ) 65 ( X ) 85 (E )06 (M) 26 (E ) 46 ( X ) 66 (M) 86 (E )07 (M) 27 (M) 47 (M) 67 (E ) 87 (M)08 (E ) 28 ( X ) 48 (E ) 68 (M) 88 ( X )09 (E ) 29 (E ) 49 (E ) 69 (E ) 89 (E )10 (M) 30 (E ) 50 (E ) 70 (E ) 90 ( X )11 (E ) 31 (E ) 51 (M) 71 (E ) 91 (E )12 ( X ) 32 (E ) 52 ( X ) 72 (M) 92 (M)
13 (M) 33 (M) 53 (M) 73 (E ) 93 (E )14 (E ) 34 (E ) 54 (E ) 74 ( X ) 94 (E )15 (M) 35 (M) 55 (E ) 75 (E ) 95 ( X )16 (E ) 36 (E ) 56 (M) 76 (E ) 96 (E )17 ( X ) 37 (E ) 57 (E ) 77 (M) 97 (E )18 ( X ) 38 ( X ) 58 (M) 78 (M) 98 (M)19 (M) 39 ( X ) 59 (M) 79 (E ) 99 (E )
Selection of a proportionate Stratified Sample

8/8/2019 Lecture Notes Sampling
http://slidepdf.com/reader/full/lecture-notes-sampling 19/26
19
Ste 2: Sub - ivi e t e cl ub mem b ers i to t ree omoge eo u s s ub -gro up s or strata b y t ela g u age gro up s: glis , a ari a ot ers .
English anguage M andarin anguage Other anguage S tratum S tratum S tratum .00 22 4 0 64 82 0 6 35 66 0 2 4201 24 43 67 85 0 7 44 68 1 2 460 3 26 45 69 86 10 47 72 1 7 520
4 2 9 4 8 70
891
3 51
771
8 60
0 5 3 0 49 7 1 91 1 5 53 78 2 1 650 8 3 1 50 73 93 1 9 56 8 0 23 740 9 32 54 75 94 2 0 58 83 28 8411 34 55 76 96 25 59 87 38 881 4 36 57 79 97 27 6 1 92 39 9 0
1 6 3 7 6 3 8 1 99 33 62 98 4 1 95
1. C alc u late t e overall sam p li g fractio , f, i t e follo i g ma er:
f = n = 20 = 1 = 100 5
here n = sample size and = population size
0 .
Selection of a proportionate stratified sample II

8/8/2019 Lecture Notes Sampling
http://slidepdf.com/reader/full/lecture-notes-sampling 20/26
8/8/2019 Lecture Notes Sampling
http://slidepdf.com/reader/full/lecture-notes-sampling 21/26
21
Cluster samplingCluster sampling
Is a type of sampling in which clusters or groups of elements are sampled at the same time.Such a procedure is economic, and it retains thecharacteristics of probability sampling.A two-step-process:
» Step 1- D efined population is divided into number of mutuallyexclusive and collectively exhaustive subgroups or clusters;
» Step 2- Select an independent simple random sample of clusters.O ne special type of cluster sampling is called area sampling, where
pieces of geographical areas are selected.

8/8/2019 Lecture Notes Sampling
http://slidepdf.com/reader/full/lecture-notes-sampling 22/26
22
E xample : O ne-stage and two-stage Cluster sampling
Consider the same Island V ideo Club example involving 100 club members:
y Step 1: Sub-divide the club members into 5 clusters, each cluster containing 20 members.
l st r N . E lis M ri Ot rs
1 00, 22, 40, 64, 82 06, 35, 66 02, 4201, 24, 43, 67, 85 07, 44, 68 12, 46
2 03, 26, 45, 69, 86 10, 47, 72 17, 52
04, 29, 48, 70, 89 13, 51, 77 18, 603 05, 30, 49, 71, 91 15, 53, 78 21, 65
08, 31, 50, 73, 93 19, 56, 80 23, 744 09, 32, 54, 75, 94 20, 58, 83 28, 84
11, 34, 55, 76, 96 25, 59, 87 38, 885 14, 36, 57, 79, 97 27, 61, 92 39, 90
16, 37, 63, 81, 99 33, 62, 98 41, 95
y
Step 2: Select one of the 5 clusters. If cluster 4 is selected, then all its elements (i.e. ClubMembers with numbers 0 9, 11 , 32, 34, 54, 55, 75, 76, 94, 96, 2 0 , 25, 58, 59, 83, 87, 28, 38, 84,88) are selected.
y Step 3: If a two-stage cluster sampling is desired, the researcher may randomly select 4 membersfrom each of the five clusters. In this case, the sample will be different from that shown in step 2above.

8/8/2019 Lecture Notes Sampling
http://slidepdf.com/reader/full/lecture-notes-sampling 23/26
23
Stratified Sampling vs Cluster Sampling
Stratified Sampling Cluster Sampling1. T he target population is sub-divided
into a few subgroups or strata, eachcontaining a large number of elements.
1. T he target population is sub-divided into a large number of sub-population or clusters, each
containing a few elements.2. W ithin each stratum, the elements arehomogeneous. However, high degree of heterogeneity exists between strata.
2. W ithin each cluster, the elementsare heterogeneous. B etweenclusters, there is a high degree of homogeneity.
3. A sample element is selected each time. 3. A cluster is selected each time.
4. Less sampling error. 4. More prone to sampling error.5. Objective is to increase precision. 5. Objective is to increase sampling
efficiency by decreasing cost.

8/8/2019 Lecture Notes Sampling
http://slidepdf.com/reader/full/lecture-notes-sampling 24/26
8/8/2019 Lecture Notes Sampling
http://slidepdf.com/reader/full/lecture-notes-sampling 25/26
25
Non Non--probability samples probability samples
Convenience sampling» D rawn at the convenience of the researcher. Common in exploratory research.
D oes not lead to any conclusion.
J udgmental sampling» Sampling based on some judgment, gut-feelings or experience of the researcher.
Common in commercial marketing research projects. If inference drawing is not
necessary, these samples are quite useful.
Q uota sampling» A n extension of judgmental sampling. It is something like a two-stage judgmental
sampling. Quite difficult to draw.
Snowball sampling» Used in studies involving respondents who are rare to find. T o start with, the
researcher compiles a short list of sample units from various sources. E ach of these respondents are contacted to provide names of other probable respondents.

8/8/2019 Lecture Notes Sampling
http://slidepdf.com/reader/full/lecture-notes-sampling 26/26
26
Choosing probability vs. nonChoosing probability vs. non- -probability sampling probability sampling
Probability E valuation Criteria Non-probabilitysampling sampling
Conclusive Nature of research Exploratory
Larger sampling Relative magnitude Larger non-sampling
errors sampling vs. errornon-sampling error
High Population variability Low
[Heterogeneous] [Homogeneous]
Favorable Statistical Considerations Unfavorable
High Sophistication Needed Low
Relatively Longer T ime Relatively shorter
High Budget Needed Low