legal information - nsbar. · pdf filedec 91 96 498,984 499,000 476,000 476,250 ... oct 137 97...
TRANSCRIPT
Produced by NSBAR from information in MRED
Legal
Legal Information
The following representations are based in whole or
in part on data supplied by various participants in the
Midwest Real Estate Data, LLC (MRED. Neither North
Shore Barrington Association of Realtors (NSBAR) nor
the Midwest Real Estate Data LLC guarantees, nor is in
any way responsible for its accuracy. Data maintained by
the Midwest Real Estate Data, LLC may not reflect all
real estate activity in the market.

1,194
1,277
2,190
762
1,355
2,676
817
895
1,933
735
1,182
2,086
Price Changes
Off-Market
New Contracts
Pending
Closed
New&BOMK
North Shore Area Quick Data
2014 2015

267
258
205
53
146
379
158
189
177
53
125
323
Price Changes
Off-Market
New Contracts
Pending
Closed
New&BOMK
Barrington Area Quick Data
2014 2015
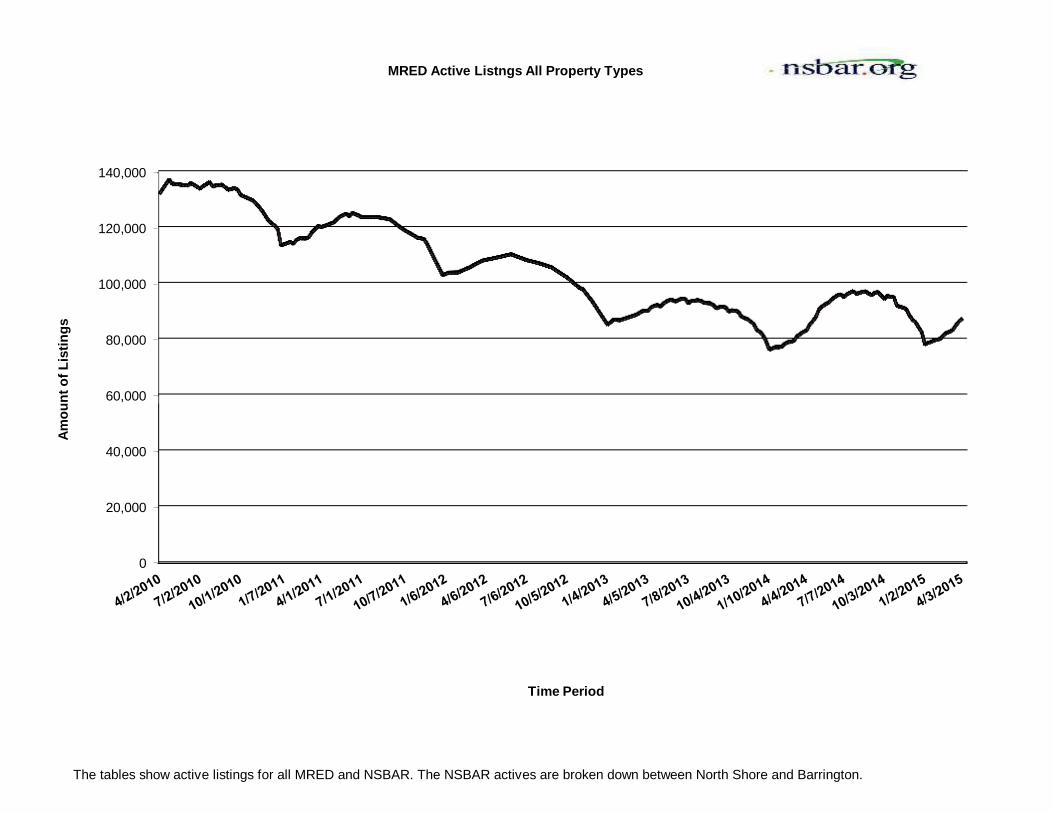
The tables show active listings for all MRED and NSBAR. The NSBAR actives are broken down between North Shore and Barrington.
0
20,000
40,000
60,000
80,000
100,000
120,000
140,000
Am
ou
nt
of
Lis
tin
gs
Time Period
MRED Active Listngs All Property Types

0
1,000
2,000
3,000
4,000
5,000
6,000
7,000
8,000
Am
ou
nt
of
Lis
tin
gs
Time Period
North Shore Area Active Listings All Property Types

0
200
400
600
800
1,000
1,200
1,400
Barrington Area Active Listings - All Property Types

0
10,000
20,000
30,000
40,000
50,000
60,000
Am
ou
nt
of
Lis
tin
gs
Time Period
MRED Single Family Homes Active Listings (DE)

0
500
1,000
1,500
2,000
2,500
3,000
3,500
4,000
Am
ou
nt
of
Lis
tin
gs
Time Period
North Shore Area Single Family Homes Active Listings (DE)

0
100
200
300
400
500
600
700
800
Am
ou
nt
of
Lis
tin
gs
Time Period
Barrington Area Single Family Homes Active Listings (DE)

Information is for Property Type 2, Attached, for type of Property C for Condominium. This does not include townhouses, co-ops, or any other type of property listed under Attached Property types.
0
5,000
10,000
15,000
20,000
25,000
30,000
Am
ou
nt
of
Lis
tin
gs
Time Period
MRED Active Condo Listings(AT-C)

Information is for Property Type 2, Attached, for type of Property C for Condominium. This does not include townhouses, co-ops, or any other type of property listed under Attached Property types.
0
200
400
600
800
1,000
1,200
1,400
1,600
1,800
Am
ou
nt
of
Lis
tin
gs
Time Period
North Shore Area Active Condo Listings

Information is for Property Type 2, Attached, for type of Property C for Condominium. This does not include townhouses, co-ops, or any other type of property listed under Attached Property types.
0
10
20
30
40
50
60
Am
ou
nt
of
Lis
tin
gs
Time Period
Barrington Area Active Condo Listings

Information is for all types of properties listed under Attached, Property Type 2
0
5000
10000
15000
20000
25000
30000
35000
40000
45000
Am
ou
nt
of
Lis
tin
gs
Time Period
MRED Attached Active Listings

Information is for all types of properties listed under Attached, Property Type 2
0
500
1,000
1,500
2,000
2,500
Am
ou
nt
of
Lis
tin
gs
Time Period
North Shore Area Active Attached Listings

Information is for all types of properties listed under Attached, Property Type 2
0
20
40
60
80
100
120
140
Am
ou
nt
of
Lis
tin
gs
Time Period
Barrington Area Active Attached Listings

2013 2014 2014 2013 2014 2015 2013 2014 2015
Jan 193 225 209 527,489 708,373 671,419 501,983 667,198 532,586
Feb 189 191 199 545,132 576,168 682,472 511,134 548,268 648,706
Mar 295 238 309 585,130 673,223 627,470 544,376 637,601 596,833
Apr 406 330 623,486 647,072 593,139 615,966
May 478 414 619,158 711,011 592,553 679,350
Jun 577 548 740,341 695,618 699,676 664,591
Jul 531 506 683,101 704,967 653,305 676,002
Aug 573 498 671,042 761,706 643,999 729,674
Sep 408 379 656,402 645,879 628,506 613,678
Oct 349 352 675,113 711,069 637,167 670,567
Nov 288 268 656,295 678,795 626,562 643,241
Dec 358 298 666,354 650,338 630,870 609,994
TOTAL 4,645 4,247 717 652,733 709,017 620,638 654,582
MEDIAN LIST PRICE MEDIAN SALE PRICE2013 2014 2015 2013 2014 2015 2013 2014 2015
Jan 151 111 118 422,450 525,000 549,900 404,500 510,000 504,000
Feb 150 114 137 429,000 475,000 525,000 410,000 460,000 500,000
Mar 150 118 114 449,900 479,950 479,000 430,000 476,800 458,500
Apr 128 93 512,000 498,500 498,500 477,000
May 112 87 489,000 550,000 480,000 532,500
Jun 90 83 559,000 550,000 550,000 527,500
Jul 86 75 549,000 549,000 530,000 527,000
Aug 80 72 529,000 599,000 519,500 573,000
Sep 93 70 525,000 499,000 510,000 475,000
Oct 91 90 469,900 532,499 455,000 513,250
Nov 95 99 477,000 529,950 459,000 513,750
Dec 91 96 498,984 499,000 476,000 476,250
TOTAL 110 88 492,520 549,000 487,000 510,000
PRICE
NorthShore - Statistics as of 4/1/2015Prepared by: North Shore - Barrington Association of REALTORS
Property Type: Detached Single Family
# HOUSES
AVERAGE TIME
ON MARKET
SOLD YTD
AVERAGE LIST
PRICE
AVERAGE SALE
2013 2014 2015 2013 2014 2015 2013 2014 2015
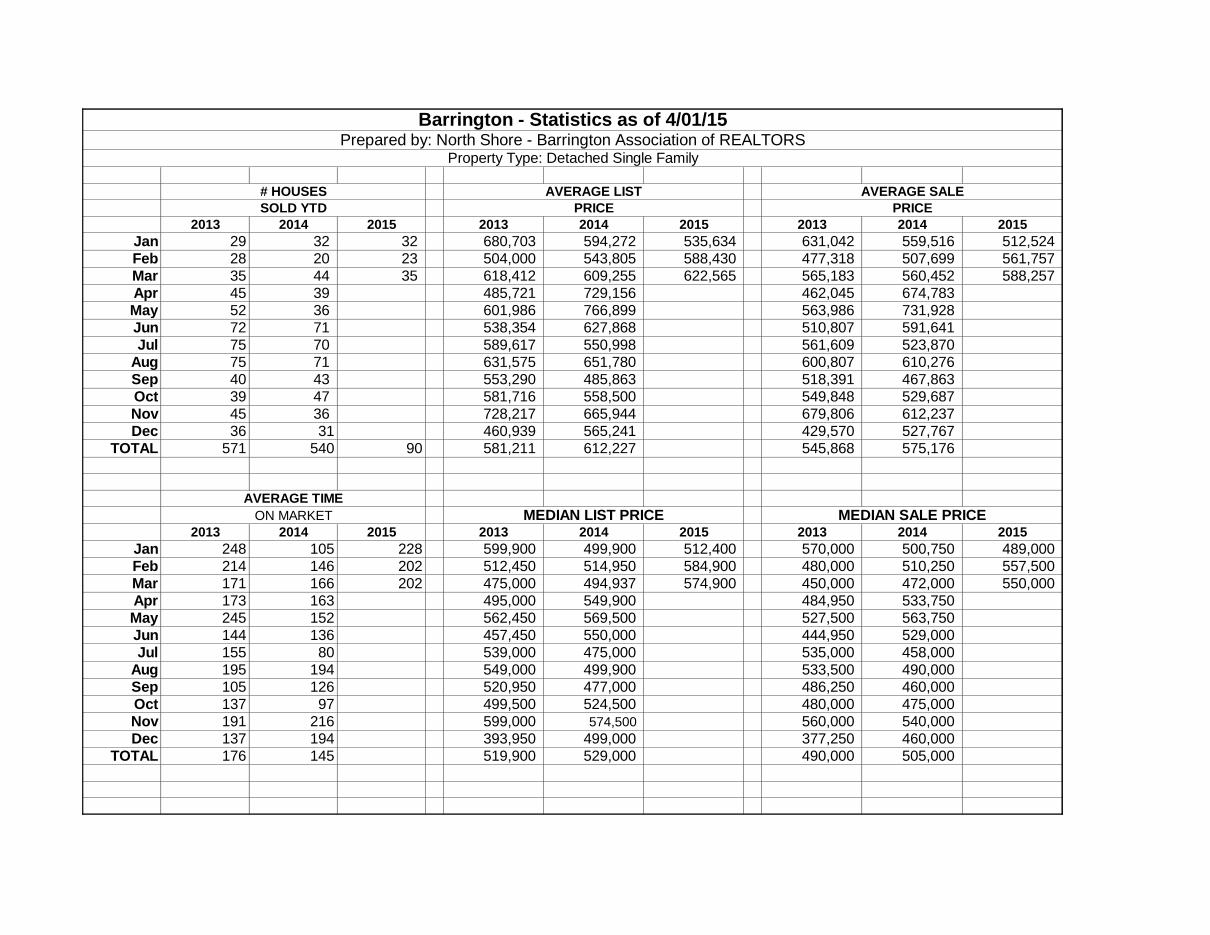
Jan 29 32 32 680,703 594,272 535,634 631,042 559,516 512,524
Feb 28 20 23 504,000 543,805 588,430 477,318 507,699 561,757
Mar 35 44 35 618,412 609,255 622,565 565,183 560,452 588,257
Apr 45 39 485,721 729,156 462,045 674,783
May 52 36 601,986 766,899 563,986 731,928
Jun 72 71 538,354 627,868 510,807 591,641
Jul 75 70 589,617 550,998 561,609 523,870
Aug 75 71 631,575 651,780 600,807 610,276
Sep 40 43 553,290 485,863 518,391 467,863
Oct 39 47 581,716 558,500 549,848 529,687
Nov 45 36 728,217 665,944 679,806 612,237
Dec 36 31 460,939 565,241 429,570 527,767
TOTAL 571 540 90 581,211 612,227 545,868 575,176
MEDIAN LIST PRICE MEDIAN SALE PRICE2013 2014 2015 2013 2014 2015 2013 2014 2015
Jan 248 105 228 599,900 499,900 512,400 570,000 500,750 489,000
Feb 214 146 202 512,450 514,950 584,900 480,000 510,250 557,500
Mar 171 166 202 475,000 494,937 574,900 450,000 472,000 550,000
Apr 173 163 495,000 549,900 484,950 533,750
May 245 152 562,450 569,500 527,500 563,750
Jun 144 136 457,450 550,000 444,950 529,000
Jul 155 80 539,000 475,000 535,000 458,000
Aug 195 194 549,000 499,900 533,500 490,000
Sep 105 126 520,950 477,000 486,250 460,000
Oct 137 97 499,500 524,500 480,000 475,000
Nov 191 216 599,000 574,500 560,000 540,000
Dec 137 194 393,950 499,000 377,250 460,000
TOTAL 176 145 519,900 529,000 490,000 505,000
Barrington - Statistics as of 4/01/15Prepared by: North Shore - Barrington Association of REALTORS
Property Type: Detached Single Family
# HOUSES
AVERAGE TIME
ON MARKET
SOLD YTD
AVERAGE LIST
PRICE
AVERAGE SALE
PRICE

NORTH SHORE - BARRINGTON ASSOCIATION OF REALTORS
YTD Sales for Detached Single Family - Listed by TOWN
Detached Single Family
TOWN YTD YTD YOY AVG PRICE AVG PRICE YOY MEDIAN MEDIAN YOY
2015 2014 % CHG 2015 2014 % CHG 2015 2014 % CHG
ALGONQUIN 70 49 42.9% 234,228 225,554 3.8% 230,000 230,500 -0.2%
ANTIOCH 60 60 0.0% 208,608 161,471 29.2% 192,500 159,000 21.1%
ARLINGTON HEIGHTS 130 89 46.1% 367,730 350,332 5.0% 332,500 323,500 2.8%
BARRINGTON AREA 92 96 -4.2% 550,611 549,149 0.3% 521,500 488,500 6.8%
BARTLETT 67 50 34.0% 261,866 236,517 10.7% 256,000 229,250 11.7%
BEACH PARK 31 30 3.3% 125,302 113,090 10.8% 125,000 121,000 3.3%
BUFFALO GROVE 66 41 61.0% 382,620 377,002 1.5% 327,500 342,500 -4.4%
CAROL STREAM 46 65 -29.2% 230,901 209,826 10.0% 217,000 188,000 15.4%
CARPENTERSVILLE 72 95 -24.2% 144,299 131,611 9.6% 124,950 123,720 1.0%
CHICAGO - ALBANY PARK 31 16 93.8% 347,582 251,694 38.1% 333,000 212,500 56.7%
CHICAGO - DUNNING 70 65 7.7% 227,931 214,049 6.5% 223,500 205,000 9.0%
CHICAGO - EDGEWATER 10 10 0.0% 616,400 597,750 3.1% 605,000 602,750 0.4%
CHICAGO - IRVING PARK 44 49 -10.2% 410,117 363,152 12.9% 383,751 340,000 12.9%
CHICAGO - LAKE VIEW 29 21 38.1% 1,459,129 1,143,571 27.6% 1,310,000 1,160,000 12.9%
CHICAGO - LINCOLN PARK 34 35 -2.9% 2,112,453 1,718,861 22.9% 1,880,000 1,425,000 31.9%
CHICAGO - LINCOLN SQUARE 24 15 60.0% 705,310 840,267 -16.1% 737,500 661,000 11.6%
CHICAGO - LOGAN SQUARE 37 33 12.1% 600,603 582,825 3.1% 630,000 509,000 23.8%
CHICAGO - NEAR NORTH SIDE 6 8 -25.0% 1,912,503 2,611,250 -26.8% 1,677,510 2,682,500 -37.5%
CHICAGO - NEAR SOUTH SIDE 0 2 -100.0% - 855,000 -100.0% - 855,000 -100.0%
CHICAGO - NEAR WEST SIDE 8 6 33.3% 408,039 742,500 -45.0% 355,000 752,500 -52.8%
CHICAGO - PORTAGE PARK 80 70 14.3% 270,468 260,205 3.9% 255,000 238,000 7.1%
CHICAGO - ROGERS PARK 5 11 -54.5% 401,000 365,636 9.7% 325,000 360,000 -9.7%
CHICAGO - UPTOWN 5 6 -16.7% 779,480 889,433 -12.4% 912,500 577,500 58.0%
CHICAGO - WEST RIDGE 28 28 0.0% 339,314 332,271 2.1% 301,250 342,750 -12.1%
CHICAGO - WEST TOWN 36 30 20.0% 970,033 866,249 12.0% 842,450 797,500 5.6%
DE KALB 46 47 -2.1% 138,103 129,506 6.6% 126,000 134,900 -6.6%
DEERFIELD 51 37 37.8% 603,275 522,952 15.4% 483,500 462,000 4.7%
DES PLAINES 85 82 3.7% 246,979 229,946 7.4% 225,003 213,500 5.4%
ELGIN 225 251 -10.4% 180,984 158,010 14.5% 160,000 128,000 25.0%
ELK GROVE VILLAGE 44 42 4.8% 251,114 255,771 -1.8% 240,000 243,500 -1.4%
EVANSTON 75 55 36.4% 448,789 430,273 4.3% 350,000 415,000 -15.7%
FOX LAKE 8 20 -60.0% 69,128 149,768 -53.8% 60,019 127,000 -52.7%
# OF HOUSES SOLD AVERAGE SALE PRICE MEDIAN SALE PRICE
Disclaimer:
Statistics provided using data from Midwest Real Estate Data LLC.
The Association makes no claim as to the accuracy of this data and has provided this data as a service to our members.

NORTH SHORE - BARRINGTON ASSOCIATION OF REALTORS
YTD Sales for Detached Single Family - Listed by TOWN
Detached Single Family
TOWN YTD YTD YOY AVG PRICE AVG PRICE YOY MEDIAN MEDIAN YOY
2015 2014 % CHG 2015 2014 % CHG 2015 2014 % CHG
# OF HOUSES SOLD AVERAGE SALE PRICE MEDIAN SALE PRICE
GLENCOE 20 16 25.0% 1,109,848 1,144,635 -3.0% 860,000 1,043,327 -17.6%
GOLF-GLENVIEW 67 78 -14.1% 657,704 610,613 7.7% 501,899 561,500 -10.6%
GREEN OAKS-LIBERTYVILLE 62 50 24.0% 479,002 442,961 8.1% 450,000 424,325 6.1%
GREENWOOD- WOODSTOCK 61 56 8.9% 190,989 195,255 -2.2% 189,000 166,000 13.9%
GURNEE 61 62 -1.6% 233,457 240,938 -3.1% 240,000 227,450 5.5%
HAINESVILLE-GRAYSLAKE 76 80 -5.0% 167,219 202,714 -17.5% 169,450 205,000 -17.3%
HANOVER PARK 63 65 -3.1% 165,494 154,913 6.8% 164,300 154,900 6.1%
HIGHLAND PARK 75 56 33.9% 570,196 544,727 4.7% 517,000 475,000 8.8%
HIGHWOOD 5 6 -16.7% 317,100 251,833 25.9% 306,000 252,500 21.2%
HOFFMAN ESTATES 73 72 1.4% 262,068 268,708 -2.5% 248,000 249,250 -0.5%
INGLESIDE 22 21 4.8% 113,584 143,275 -20.7% 122,250 136,100 -10.2%
INVERNESS 21 20 5.0% 545,970 601,525 -9.2% 508,000 576,500 -11.9%
ISLAND LAKE 23 23 0.0% 142,593 126,282 12.9% 107,500 132,000 -18.6%
KENILWORTH 5 5 0.0% 2,084,000 1,345,000 54.9% 960,000 1,285,000 -25.3%
LAKE BLUFF 31 21 47.6% 496,902 828,000 -40.0% 495,000 675,000 -26.7%
LAKE FOREST 44 53 -17.0% 892,007 1,195,860 -25.4% 702,000 816,500 -14.0%
LAKE IN THE HILLS 67 77 -13.0% 187,483 184,458 1.6% 192,000 188,000 2.1%
LAKE VILLA- LINDENHURST 96 75 28.0% 190,852 196,602 -2.9% 173,250 189,805 -8.7%
LAKEWOOD-CRYSTAL LAKE 105 125 -16.0% 211,302 229,241 -7.8% 180,000 215,000 -16.3%
LINCOLNSHIRE 23 13 76.9% 580,722 602,508 -3.6% 525,000 525,000 0.0%
LINCOLNWOOD 26 17 52.9% 443,930 412,816 7.5% 422,000 365,000 15.6%
LONG GROVE-LAKE ZURICH- HAWTHORN WOODS- KILDEER 96 66 45.5% 444,271 397,005 11.9% 437,000 390,250 12.0%
METTAWA 1 3 -66.7% 445,000 488,167 -8.8% 445,000 497,500 -10.6%
MORTON GROVE 50 36 38.9% 268,411 266,033 0.9% 246,250 250,649 -1.8%
MT. PROSPECT 60 81 -25.9% 293,849 290,620 1.1% 256,750 267,000 -3.8%
MUNDELEIN 76 68 11.8% 218,861 212,311 3.1% 191,600 172,500 11.1%
NAPERVILLE 269 265 1.5% 425,208 438,284 -3.0% 380,000 400,000 -5.0%
NILES 33 45 -26.7% 257,375 264,861 -2.8% 245,000 252,900 -3.1%
NORTH CHICAGO 21 12 75.0% 39,155 40,172 -2.5% 37,000 34,250 8.0%
NORTHBROOK 79 68 16.2% 601,028 519,585 15.7% 575,000 476,800 20.6%
NORTHFIELD 12 14 -14.3% 600,288 832,071 -27.9% 613,275 870,000 -29.5%
OAKWOOD HILLS - CARY 59 52 13.5% 207,848 186,096 11.7% 180,000 162,500 10.8%
PALATINE 75 76 -1.3% 352,101 328,370 7.2% 293,000 290,500 0.9%
Disclaimer:
Statistics provided using data from Midwest Real Estate Data LLC.
The Association makes no claim as to the accuracy of this data and has provided this data as a service to our members.

NORTH SHORE - BARRINGTON ASSOCIATION OF REALTORS
YTD Sales for Detached Single Family - Listed by TOWN
Detached Single Family
TOWN YTD YTD YOY AVG PRICE AVG PRICE YOY MEDIAN MEDIAN YOY
2015 2014 % CHG 2015 2014 % CHG 2015 2014 % CHG
# OF HOUSES SOLD AVERAGE SALE PRICE MEDIAN SALE PRICE
PARK CITY -WAUKEGAN 124 139 -10.8% 76,376 71,426 6.9% 65,000 58,500 11.1%
PARK RIDGE 70 73 -4.1% 454,228 428,000 6.1% 416,500 385,000 8.2%
PRAIRIE VIEW 2 3 -33.3% 259,500 293,000 -11.4% 259,500 270,000 -3.9%
PROSPECT HEIGHTS 25 18 38.9% 387,169 344,726 12.3% 385,000 330,225 16.6%
ROLLING MEADOWS 22 32 -31.3% 242,634 228,377 6.2% 244,250 189,900 28.6%
ROUND LAKE 128 127 0.8% 117,021 105,826 10.6% 110,000 83,099 32.4%
SCHAUMBURG 78 51 52.9% 293,526 267,315 9.8% 265,000 254,900 4.0%
SKOKIE 77 78 -1.3% 299,928 263,231 13.9% 280,000 244,500 14.5%
STREAMWOOD 81 57 42.1% 151,302 146,792 3.1% 150,000 148,000 1.4%
SUNNYSIDE -MCHENRY-LAKE MOOR-McCULLOM LAKE-JOHNSBURG 143 110 30.0% 159,587 154,261 3.5% 145,000 135,000 7.4%
SYCAMORE 45 38 18.4% 199,705 189,831 5.2% 205,000 175,250 17.0%
VERNON HILLS 38 28 35.7% 405,822 407,157 -0.3% 369,500 375,000 -1.5%
WADSWORTH - OLD MILL CREEK 11 11 0.0% 227,800 231,545 -1.6% 243,600 185,000 31.7%
WAUCONDA 35 39 -10.3% 207,957 163,543 27.2% 228,000 143,000 59.4%
WHEELING 30 25 20.0% 198,854 196,415 1.2% 176,000 172,000 2.3%
WILMETTE 48 57 -15.8% 907,418 692,947 31.0% 686,750 625,000 9.9%
WINNETKA 36 25 44.0% 1,418,316 1,339,700 5.9% 1,288,250 970,000 32.8%
WINTHROP HARBOR 13 21 -38.1% 142,108 130,297 9.1% 152,000 118,000 28.8%
ZION 74 65 13.8% 80,805 88,601 -8.8% 77,750 70,314 10.6%
Disclaimer:
Statistics provided using data from Midwest Real Estate Data LLC.
The Association makes no claim as to the accuracy of this data and has provided this data as a service to our members.

2013 2014 2015 2013 2014 2015 2013 2014 2014
Jan 139 120 109 204,723 221,264 284,053 194,518 214,122 271,948
Feb 130 104 110 224,204 256,346 230,710 214,167 248,660 221,703
Mar 145 152 166 229,679 260,129 264,011 224,138 253,033 253,578
Apr 193 190 232,948 285,010 222,132 273,336
May 257 192 256,922 295,853 244,872 286,156
Jun 241 239 257,399 282,780 246,382 273,782
Jul 273 246 269,362 285,540 257,409 275,283
Aug 263 213 261,253 308,484 250,112 298,649
Sep 190 187 260,622 292,584 250,874 279,498
Oct 185 188 252,278 264,174 242,500 254,032
Nov 149 128 276,465 288,076 268,087 274,068
Dec 178 159 283,499 268,597 273,215 258,592
TOTAL 2,343 2,118 385 262,951 286,100 242,958 268,878
MEDIAN LIST PRICE MEDIAN SALE PRICE2013 2014 2015 2013 2014 2015 2013 2014 2014
Jan 159 96 83 159,000 165,000 225,000 146,400 162,500 210,998
Feb 166 96 84 165,000 222,400 189,000 151,000 215,000 180,000
Mar 223 103 88 209,500 221,950 224,950 200,000 212,000 214,075
Apr 173 77 184,500 246,400 179,000 231,000
May 133 70 179,900 253,250 170,000 245,000
Jun 140 55 209,900 245,000 200,000 230,000
Jul 90 65 228,900 249,750 215,000 240,000
Aug 97 67 219,000 284,500 210,000 270,000
Sep 95 80 194,950 265,000 190,000 250,000
Oct 103 69 195,000 232,000 190,000 219,625
Nov 74 78 243,750 224,950 230,000 213,750
Dec 80 93 235,000 235,000 226,000 222,500
TOTAL 124 76 214,950 247,000 195,000 228,500
PRICE
NorthShore - Statistics as of 4/1/2015Prepared by: North Shore - Barrington Association of REALTORS
Property Type: Attached Single Family
# HOUSES
AVERAGE TIME
ON MARKET
SOLD YTD
AVERAGE LIST
PRICE
AVERAGE SALE

2013 2014 2015 2013 2014 2015 2013 2014 2015
Jan 6 8 10 228,067 295,762 243,080 218,500 281,989 229,900
Feb 8 5 10 283,533 275,960 212,525 275,027 256,000 199,750
Mar 14 7 7 167,350 225,829 234,514 155,079 206,429 228,500
Apr 10 4 212,820 169,100 200,250 158,250
May 7 19 247,829 209,358 231,500 202,400
Jun 23 13 248,722 216,592 237,687 204,654
Jul 12 12 225,654 259,558 208,279 252,513
Aug 12 9 261,767 226,356 247,750 214,333
Sep 16 13 196,269 289,069 186,244 274,762
Oct 10 9 214,735 287,956 205,200 277,000
Nov 5 8 251,060 239,350 233,650 233,738
Dec 11 13 235,490 332553 226,172 314769
TOTAL 134 120 27 231,108 252,287 218,778 239,736
MEDIAN LIST PRICE MEDIAN SALE PRICE2013 2014 2015 2013 2014 2015 2013 2014 2015
Jan 202 120 81 214,900 323,700 193,250 136,750 307,000 183,500
Feb 202 189 140 144,500 165,000 206,327 288,750 155,000 190,250
Mar 286 240 80 309,450 222,000 178,900 146,728 208,000 165,000
Apr 67 128 236,950 175,750 203,000 168,750
May 101 63 279,000 179,000 210,000 177,000
Jun 202 130 225,000 199,900 215,000 189,000
Jul 59 27 153,000 271,000 206,750 260,000
Aug 98 156 176,700 199,900 259,500 176,000
Sep 109 91 189,900 219,000 176,500 213,000
Oct 89 59 167,450 199,900 198,000 190,000
Nov 83 77 244,450 221,000 213,750 215,250
Dec 70 116 169,950 258000 220,000 249000
TOTAL 131 116 209,271 219,513 206,227 209,000
PRICE
Barrington - Statistics as of 4/01/2015Prepared by: North Shore - Barrington Association of REALTORS
Property Type: Attached Single Family
# HOUSES
AVERAGE TIME
ON MARKET
SOLD YTD
AVERAGE LIST
PRICE
AVERAGE SALE
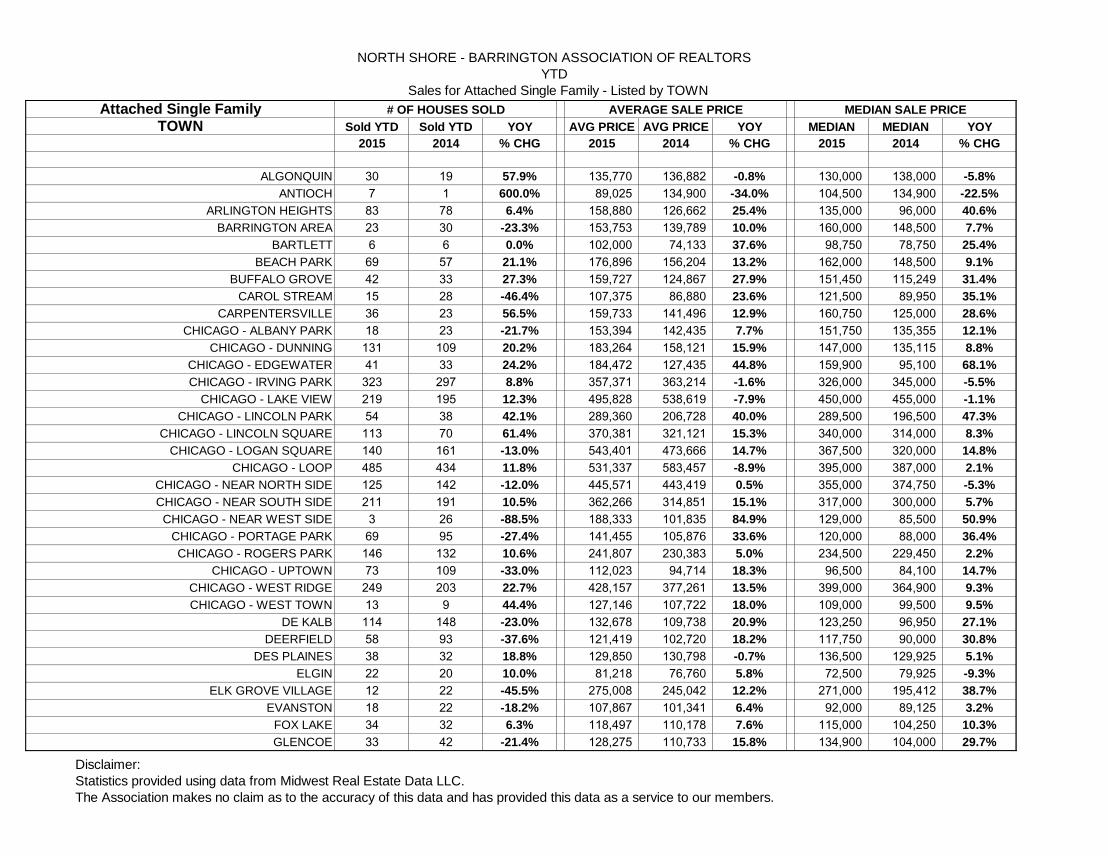
NORTH SHORE - BARRINGTON ASSOCIATION OF REALTORS
YTD
Sales for Attached Single Family - Listed by TOWN
Attached Single FamilyTOWN Sold YTD Sold YTD YOY AVG PRICE AVG PRICE YOY MEDIAN MEDIAN YOY
2015 2014 % CHG 2015 2014 % CHG 2015 2014 % CHG
ALGONQUIN 30 19 57.9% 135,770 136,882 -0.8% 130,000 138,000 -5.8%
ANTIOCH 7 1 600.0% 89,025 134,900 -34.0% 104,500 134,900 -22.5%
ARLINGTON HEIGHTS 83 78 6.4% 158,880 126,662 25.4% 135,000 96,000 40.6%
BARRINGTON AREA 23 30 -23.3% 153,753 139,789 10.0% 160,000 148,500 7.7%
BARTLETT 6 6 0.0% 102,000 74,133 37.6% 98,750 78,750 25.4%
BEACH PARK 69 57 21.1% 176,896 156,204 13.2% 162,000 148,500 9.1%
BUFFALO GROVE 42 33 27.3% 159,727 124,867 27.9% 151,450 115,249 31.4%
CAROL STREAM 15 28 -46.4% 107,375 86,880 23.6% 121,500 89,950 35.1%
CARPENTERSVILLE 36 23 56.5% 159,733 141,496 12.9% 160,750 125,000 28.6%
CHICAGO - ALBANY PARK 18 23 -21.7% 153,394 142,435 7.7% 151,750 135,355 12.1%
CHICAGO - DUNNING 131 109 20.2% 183,264 158,121 15.9% 147,000 135,115 8.8%
CHICAGO - EDGEWATER 41 33 24.2% 184,472 127,435 44.8% 159,900 95,100 68.1%
CHICAGO - IRVING PARK 323 297 8.8% 357,371 363,214 -1.6% 326,000 345,000 -5.5%
CHICAGO - LAKE VIEW 219 195 12.3% 495,828 538,619 -7.9% 450,000 455,000 -1.1%
CHICAGO - LINCOLN PARK 54 38 42.1% 289,360 206,728 40.0% 289,500 196,500 47.3%
CHICAGO - LINCOLN SQUARE 113 70 61.4% 370,381 321,121 15.3% 340,000 314,000 8.3%
CHICAGO - LOGAN SQUARE 140 161 -13.0% 543,401 473,666 14.7% 367,500 320,000 14.8%
CHICAGO - LOOP 485 434 11.8% 531,337 583,457 -8.9% 395,000 387,000 2.1%
CHICAGO - NEAR NORTH SIDE 125 142 -12.0% 445,571 443,419 0.5% 355,000 374,750 -5.3%
CHICAGO - NEAR SOUTH SIDE 211 191 10.5% 362,266 314,851 15.1% 317,000 300,000 5.7%
CHICAGO - NEAR WEST SIDE 3 26 -88.5% 188,333 101,835 84.9% 129,000 85,500 50.9%
CHICAGO - PORTAGE PARK 69 95 -27.4% 141,455 105,876 33.6% 120,000 88,000 36.4%
CHICAGO - ROGERS PARK 146 132 10.6% 241,807 230,383 5.0% 234,500 229,450 2.2%
CHICAGO - UPTOWN 73 109 -33.0% 112,023 94,714 18.3% 96,500 84,100 14.7%
CHICAGO - WEST RIDGE 249 203 22.7% 428,157 377,261 13.5% 399,000 364,900 9.3%
CHICAGO - WEST TOWN 13 9 44.4% 127,146 107,722 18.0% 109,000 99,500 9.5%
DE KALB 114 148 -23.0% 132,678 109,738 20.9% 123,250 96,950 27.1%
DEERFIELD 58 93 -37.6% 121,419 102,720 18.2% 117,750 90,000 30.8%
DES PLAINES 38 32 18.8% 129,850 130,798 -0.7% 136,500 129,925 5.1%
ELGIN 22 20 10.0% 81,218 76,760 5.8% 72,500 79,925 -9.3%
ELK GROVE VILLAGE 12 22 -45.5% 275,008 245,042 12.2% 271,000 195,412 38.7%
EVANSTON 18 22 -18.2% 107,867 101,341 6.4% 92,000 89,125 3.2%
FOX LAKE 34 32 6.3% 118,497 110,178 7.6% 115,000 104,250 10.3%
GLENCOE 33 42 -21.4% 128,275 110,733 15.8% 134,900 104,000 29.7%
# OF HOUSES SOLD AVERAGE SALE PRICE MEDIAN SALE PRICE
Disclaimer:
Statistics provided using data from Midwest Real Estate Data LLC.
The Association makes no claim as to the accuracy of this data and has provided this data as a service to our members.

NORTH SHORE - BARRINGTON ASSOCIATION OF REALTORS
YTD
Sales for Attached Single Family - Listed by TOWN
Attached Single FamilyTOWN Sold YTD Sold YTD YOY AVG PRICE AVG PRICE YOY MEDIAN MEDIAN YOY
2015 2014 % CHG 2015 2014 % CHG 2015 2014 % CHG
# OF HOUSES SOLD AVERAGE SALE PRICE MEDIAN SALE PRICE
GOLF-GLENVIEW 29 38 -23.7% 100,323 95,356 5.2% 88,111 78,500 12.2%
GREEN OAKS-LIBERTYVILLE 58 62 -6.5% 116,387 100,559 15.7% 90,000 85,750 5.0%
GREENWOOD- WOODSTOCK 0 2 -100.0% - 126,750 -100.0% - 126,750 -100.0%
GURNEE 10 4 150.0% 495,224 403,475 22.7% 515,000 419,450 22.8%
HAINESVILLE-GRAYSLAKE 4 11 -63.6% 88,663 84,012 5.5% 86,000 78,000 10.3%
HANOVER PARK 23 33 -30.3% 107,891 105,030 2.7% 110,000 105,000 4.8%
HIGHLAND PARK 6 13 -53.8% 141,333 126,743 11.5% 147,450 119,000 23.9%
HIGHWOOD 12 7 71.4% 254,029 201,129 26.3% 255,500 185,000 38.1%
HOFFMAN ESTATES 43 49 -12.2% 136,694 126,625 8.0% 103,500 99,900 3.6%
INGLESIDE 13 27 -51.9% 162,338 141,268 14.9% 176,000 149,000 18.1%
INVERNESS 142 127 11.8% 196,886 184,987 6.4% 180,000 165,000 9.1%
ISLAND LAKE 35 18 94.4% 175,691 154,761 13.5% 170,000 148,000 14.9%
LAKE BLUFF 2 2 0.0% 41,375 38,500 7.5% 41,375 38,500 7.5%
LAKE FOREST 14 18 -22.2% 120,925 110,456 9.5% 133,500 109,000 22.5%
LAKE IN THE HILLS 8 9 -11.1% 75,381 58,083 29.8% 67,275 53,760 25.1%
LAKE VILLA- LINDENHURST 23 27 -14.8% 236,311 179,232 31.8% 197,000 139,500 41.2%
LAKEWOOD-CRYSTAL LAKE 34 33 3.0% 138,309 107,378 28.8% 101,950 78,000 30.7%
LINCOLNSHIRE 22 31 -29.0% 118,055 89,256 32.3% 114,350 75,127 52.2%
LINCOLNWOOD 34 65 -47.7% 101,069 92,266 9.5% 101,000 93,000 8.6%
LONG GROVE-LAKE ZURICH- HAWTHORN WOODS- KILDEER 129 144 -10.4% 149,000 133,548 11.6% 137,500 119,450 15.1%
MORTON GROVE 61 58 5.2% 134,767 107,022 25.9% 129,000 101,500 27.1%
MT. PROSPECT 20 30 -33.3% 96,830 76,622 26.4% 110,162 72,000 53.0%
MUNDELEIN 13 7 85.7% 141,012 148,143 -4.8% 126,100 146,500 -13.9%
NAPERVILLE 46 42 9.5% 187,831 183,076 2.6% 139,900 151,500 -7.7%
NILES 5 4 25.0% 114,880 119,750 -4.1% 112,500 118,250 -4.9%
NORTH CHICAGO 9 14 -35.7% 114,378 119,821 -4.5% 126,400 128,000 -1.3%
NORTHBROOK 63 61 3.3% 145,380 136,324 6.6% 139,000 123,650 12.4%
NORTHFIELD 0 0 0.0% - - 0.0% - - 0.0%
OAKWOOD HILLS - CARY 2 3 -33.3% 65,750 45,500 44.5% 65,750 46,500 41.4%
PALATINE 27 20 35.0% 218,370 249,046 -12.3% 180,500 226,500 -20.3%
PARK CITY -WAUKEGAN 17 18 -5.6% 273,538 227,094 20.5% 254,000 210,250 20.8%
PARK RIDGE 96 86 11.6% 253,978 232,971 9.0% 210,000 217,000 -3.2%
PRAIRIE VIEW 1 1 0.0% 251,000 127,000 97.6% 251,000 127,000 97.6%
PROSPECT HEIGHTS 56 59 -5.1% 264,407 306,571 -13.8% 210,000 297,500 -29.4%
ROLLING MEADOWS 15 11 36.4% 335,560 427,591 -21.5% 248,500 324,000 -23.3%
Disclaimer:
Statistics provided using data from Midwest Real Estate Data LLC.
The Association makes no claim as to the accuracy of this data and has provided this data as a service to our members.

NORTH SHORE - BARRINGTON ASSOCIATION OF REALTORS
YTD
Sales for Attached Single Family - Listed by TOWN
Attached Single FamilyTOWN Sold YTD Sold YTD YOY AVG PRICE AVG PRICE YOY MEDIAN MEDIAN YOY
2015 2014 % CHG 2015 2014 % CHG 2015 2014 % CHG
# OF HOUSES SOLD AVERAGE SALE PRICE MEDIAN SALE PRICE
ROUND LAKE 0 4 -100.0% - 263,875 -100.0% - 279,250 -100.0%
SCHAUMBURG 6 8 -25.0% 155,284 131,781 17.8% 161,352 117,625 37.2%
SKOKIE 13 6 116.7% 310,331 366,167 -15.2% 270,000 367,500 -26.5%
STREAMWOOD 36 39 -7.7% 133,974 110,673 21.1% 131,000 121,000 8.3%
SUNNYSIDE -MCHENRY-LAKE MOOR-McCULLOM LAKE-JOHNSBURG 8 7 14.3% 407,250 341,679 19.2% 340,000 263,500 29.0%
SYCAMORE 11 5 120.0% 204,636 170,100 20.3% 190,000 165,000 15.2%
VERNON HILLS 23 19 21.1% 169,635 166,429 1.9% 185,000 160,000 15.6%
WADSWORTH - OLD MILL CREEK 54 50 8.0% 296,229 259,531 14.1% 231,500 250,000 -7.4%
WAUCONDA 9 7 28.6% 333,500 315,464 5.7% 195,000 190,000 2.6%
WHEELING 127 119 6.7% 140,514 134,788 4.2% 102,000 95,000 7.4%
WILMETTE 0 0 0.0% - - 0.0% - - 0.0%
WINNETKA 62 72 -13.9% 144,813 140,027 3.4% 129,500 126,667 2.2%
WINTHROP HARBOR 16 19 -15.8% 302,156 291,862 3.5% 265,000 250,000 6.0%
ZION 7 4 75.0% 416,786 362,875 14.9% 415,000 368,750 12.5%
Disclaimer:
Statistics provided using data from Midwest Real Estate Data LLC.
The Association makes no claim as to the accuracy of this data and has provided this data as a service to our members.

Apr-13 May-13 Jun-13 Jul-13 Aug-13 Sep-13 Oct-13 Nov-13 Dec-13 Jan-14 Feb-14 Mar-14 Apr-14 May-14 Jun-14 Jul-14 Aug-14 Sep-14 Oct-14 Nov-14 Dec-14 Jan-15 Feb-15 Mar-15
NonDistressed 532 603 723 691 741 517 463 369 450 284 229 301 442 560 720 716 567 519 486 357 305 342 270 410
Foreclosures 49 72 55 46 54 47 61 47 65 46 49 62 65 52 45 36 42 39 45 40 44 33 39 68
Short Sales 37 49 51 49 48 42 39 33 41 31 22 25 23 26 23 23 16 22 21 22 15 18 19 19
0
100
200
300
400
500
600
700
800
900
To
tal U
nit
s S
old
Time Period
North Shore Units Sold by Type of Sale (Distressed vs NonDistressed) NonDistressed
Foreclosures
Short Sales
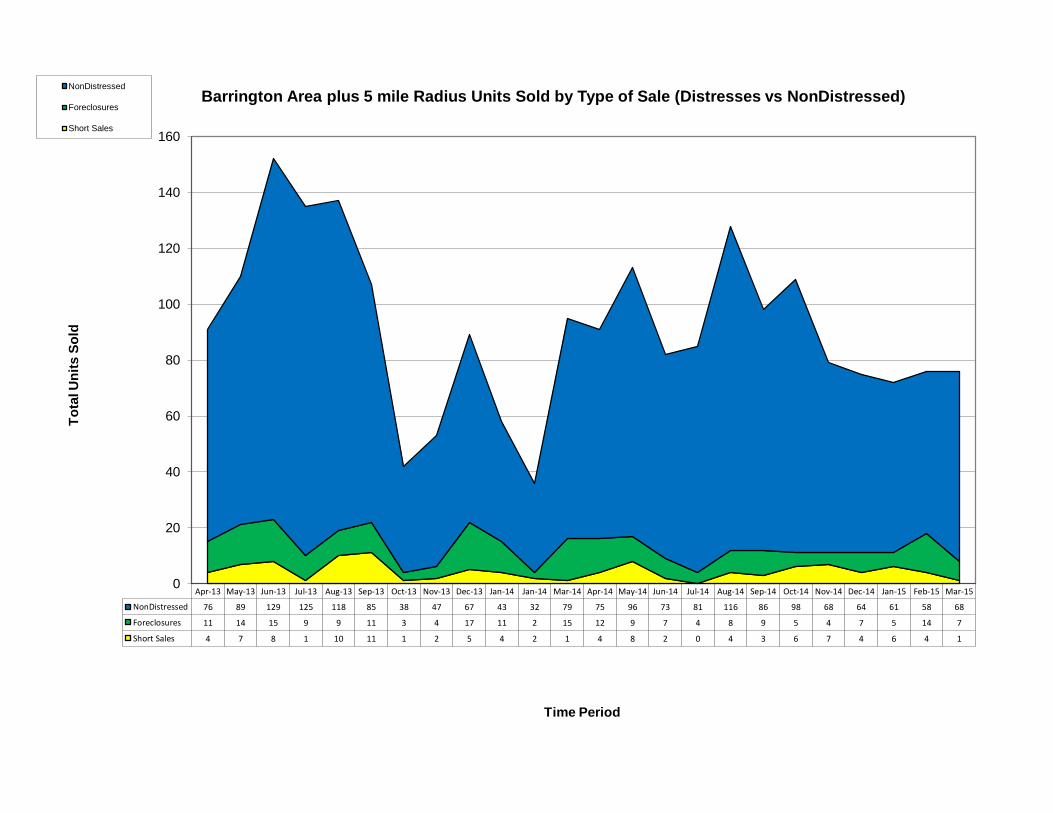
Apr-13 May-13 Jun-13 Jul-13 Aug-13 Sep-13 Oct-13 Nov-13 Dec-13 Jan-14 Jan-14 Mar-14 Apr-14 May-14 Jun-14 Jul-14 Aug-14 Sep-14 Oct-14 Nov-14 Dec-14 Jan-15 Feb-15 Mar-15
NonDistressed 76 89 129 125 118 85 38 47 67 43 32 79 75 96 73 81 116 86 98 68 64 61 58 68
Foreclosures 11 14 15 9 9 11 3 4 17 11 2 15 12 9 7 4 8 9 5 4 7 5 14 7
Short Sales 4 7 8 1 10 11 1 2 5 4 2 1 4 8 2 0 4 3 6 7 4 6 4 1
0
20
40
60
80
100
120
140
160
To
tal U
nit
s S
old
Time Period
Barrington Area plus 5 mile Radius Units Sold by Type of Sale (Distresses vs NonDistressed) NonDistressed
Foreclosures
Short Sales
0
20
40
60
80
100
120
Weeks T
o S
ell
Cu
rren
t In
ven
tory
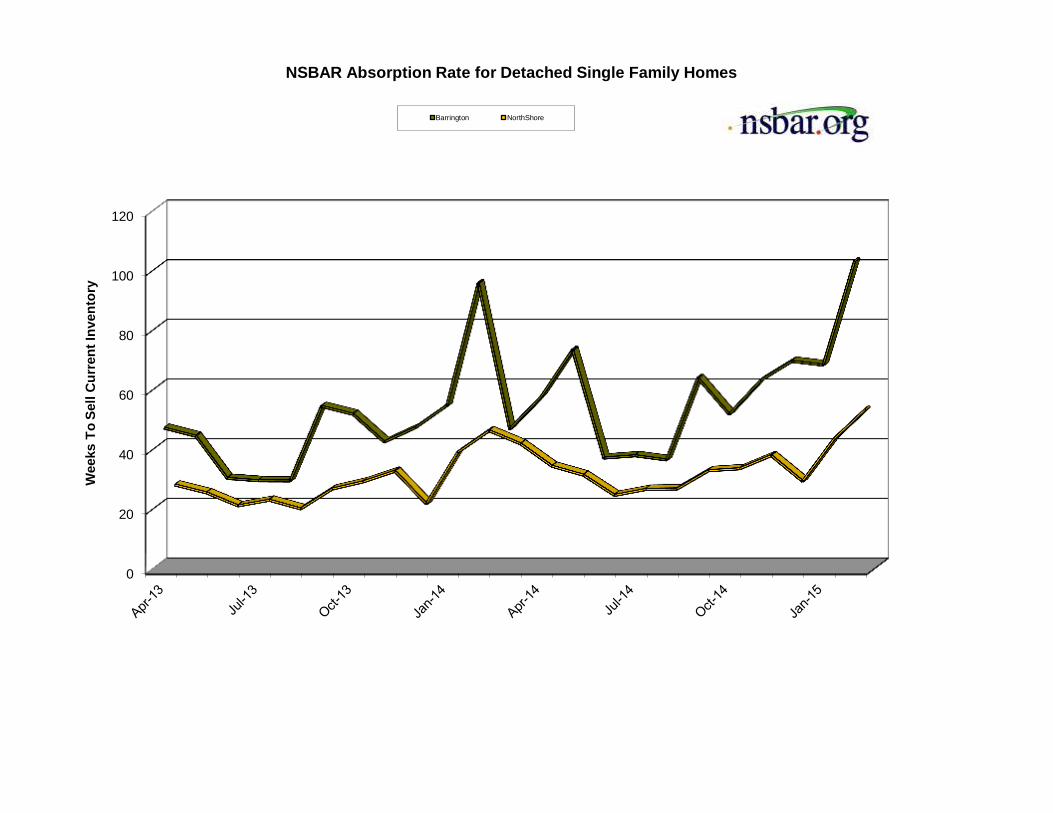
NSBAR Absorption Rate for Detached Single Family Homes
Barrington NorthShore

The numbers in the chart represent the ratio of the number of homes for sale to the number of homes sold. The higher the S/D ratio, the more supply there is relative to demand. Optimaal S/D ratio is 6
.0. Produced by NSBAR from information in MRED
0.0
5.0
10.0
15.0
20.0
25.0
Su
pp
ly/D
em
an
d R
ati
o
NSBAR Supply Demand Ratio for Single Family Homes
Barrington North Shore

0
50
100
150
200
250
300
350
400
450
500
Am
ou
nt
of
Co
ntr
acts
Month
Contracts for Detached Homes by NSBAR Agents
2013
2014
2015

0
50
100
150
200
250
300
350
400
450
Am
ou
nt
of
Co
ntr
acts
Month
Contracts for Attached Homes by NSBAR Agents
2013
2014
2015

1612
1507
1152
0 200 400 600 800 1000 1200 1400 1600 1800
2013
2014
2015
Contracts for Detached Homes by NSBAR Agents YTD

996
841
766
0 200 400 600 800 1000 1200
2013
2014
2015
Contracts for Attached Homes by NSBAR Agents YTD

These chart shows new construction data for the past fifteen months th number of new homes in the North Shore area for all property types both Residential and Commerical..
Produced by NSBAR from information in MRED
0
50
100
150
200
250
Jan-14 Feb-14 Mar-14 Apr-14 May-14 Jun-14 Jul-14 Aug-14 Sep-14 Oct-14 Nov-14 Dec-14 Jan-15 Feb-15 Mar-15
FS # 143 138 163 165 167 172 177 167 183 191 179 169 166 176 209
UC # 12 7 20 22 16 14 10 3 6 16 9 10 13 12 23
New # 27 27 44 31 37 33 38 29 31 34 30 23 31 40 52
Sold # 9 8 10 10 21 10 13 12 5 10 3 9 8 7 10
Am
ou
nt
of
Lis
tin
gs
Time Period
North Shore Area New Construction for All Property Types
FS #
UC #
New #
Sold #

These chart shows new construction data for the past fifteen months th number of new homes Barrington for all property types both Residential and Commerical..
Produced by NSBAR from information in MRED
0
10
20
30
40
50
60
Jan-14 Feb-14 Mar-14 Apr-14 May-14 Jun-14 Jul-14 Aug-14 Sep-14 Oct-14 Nov-14 Dec-14 Jan-15 Feb-15 Mar-15
FS # 29 36 38 39 47 42 44 48 47 47 47 46 58 57 60
UC # 0 0 4 1 3 0 0 2 0 1 0 0 0 1 1
New # 4 11 6 5 8 3 2 6 4 6 7 6 15 7 6
Sold # 0 0 1 0 0 0 0 1 2 0 0 1 1 0 0
Am
ou
nt
of
Lis
tin
gs
Time Period
Barrington Area New Construction for All Property Types
FS #
UC #
New #
Sold #

Glossary of Terms and Abbreviations
Absorption Rate:
Absorption rates are used to determine the amount of weeks that it will take to sell the current inventory at the present rate of sales.
Twenty six weeks is considered neutral. When the absorption is rate is higher than 26 weeks, it is considered a buyer's market and sale prices become stagnant. When the rate is lower, homes are selling faster and sales prices increase.
To formulate Absorption Rate you need to know 2 figures.
1) How many listings are currently on the market? 2) How many listings sold last month? Then A.) Multiple the number of solds last month by 12 (months). B.) Divided by the current listings equals # of Units that would sell each week. C.) Divide the # or units that should sell each week into the number available = absorption rate.
Supply Demand Ratio
The amount of homes for sales divided by the amount of sold properties for a given time period. When there are six active listings for every sold listing, the market is considered to be at its equilibrium, homes are being sold at the exact right price.
Listing
Listing in MRED - when the current titleholders of the property have signed an exclusive or exclusive right to sell agreement and the agreement is in effect with an MRED office.
Statuses for Active Listings
ACTV - An A
ctive listing is where an agreement and an owner of real property and a real estate agent, whereby the agent agrees to secure a buyer or tenant for specific property at a certain price and terms in return for a fee or commission.
BOMK - Back on Market: A listing previously showing Off-Market (Canceled, Closed, Expired, or Rented) status is now active again.
CTG - Contingent on a contract pending – A valid sales contract has been signed by a Buyer and Seller with provisions to be met before a contract can become binding.
CONTINGENCY FLAGS
A/I - Attorney Approval/Home Inspection CTGO - Denotes other contingency that may apply. Call Listing Agent for specifics of contingency FIN - Financing HC** - Buyer has home to close. Code is followed by number of hours in kick out period HS** - Buyer has home to sell. Code is followed by number of hours in kick out period
NEW - A New listing.
PCHG - Price Change: A listing showing a change in list price – new list price is required.
RACT Reactivate: A listing that was previously showing as Contingent, Pending or
Temporarily Off-Market

TEMP - Active -Temporarily Off-Market (still listed) exclusive brokerage agreement in effect, property unable to be shown, except for reasonable restrictions noted on the listing in the showing instructions.
BOMK, NEW, PCHG & RACT - statuses will show on MRED® for 5 days (unless a status change is made to the listing) and then revert to an ACTV status.
OFF-MARKET LISTING
Closed property in MRED is when an active listing has been sold and the title has changed from the seller titleholder to the new title holder. Expired listing in MRED is an active listing which has reached it's expiration date and has moved from active status to expired and the listing agreement is no longer in effect. Temporary off the market/withdrawn is a listing in MRED which still has a valid listing agreement but the titleholders have asked the property be taken out of MRED. Cancelled listing in MRED is when seller titleholders and the real estate company have cancelled the listing agreement and the property is no longer for sale with that company.
OFF MARKET STATUSES
CANC - A Canceled listing - cancellation date is required
CLSD - A Closed listing - must be reported within 72 hours of closing. Selling Price,
Contract Date, Closed Date, Seller’s Concessions Y/N (if Y is entered, Seller’s Concessions $ amount is required (PNT)), and Selling Agent are required.
EXP - An Expired listing.
PEND - Pending: A fully executed purchase contract with no contingencies other than closing. Property must be placed in Pending in order to report it closed and show the correct Market Time. Requires entry/confirmation of the Contract Date and Selling Agent ID.
RNTD - Rented: Property type 6 only - requires Rental Date, Selling Agent and Rented Price. Median Sale Price - The median price is the price that is midway between the least expensive and most expensive home sold in an area during a given period of time. During that time, half the buyers bought homes that cost more than the median price and half bought homes for less than the median price.
Average Sale Price - The average home price is the sum of prices of all homes sold in a certain area in a certain period, divided by the number of properties sold in the same area in that period. Days On Market (DOM) or Market Time (MT) - The number of days a listing is active in a multiple listing service before it is entered into "pending" status. Pending status is when an offer has been accepted by the seller but the transaction is not yet closed. Many agents refer to "average days on market," which is derived by adding all the days on market of each listing and dividing by the number of listings. In a buyer's market, the DOM are generally higher because inventory takes longer to sell. In a seller's market, the DOM are fewer. Additional Abbreviations: FS= For Sale or Active Property UC= Under Contract, Property under contract but has not had all contingencies met. OLP = Original List Price LP = List Price LLP = Last List Price