lenovo q4 ppt eng finalx · us$ million q4 fy2010/11 q4 fy2009/10 yty qtq fy2010/11 yty sales 4,879...
TRANSCRIPT


Yang YuanqingChief Executive OfficerChief Executive Officer
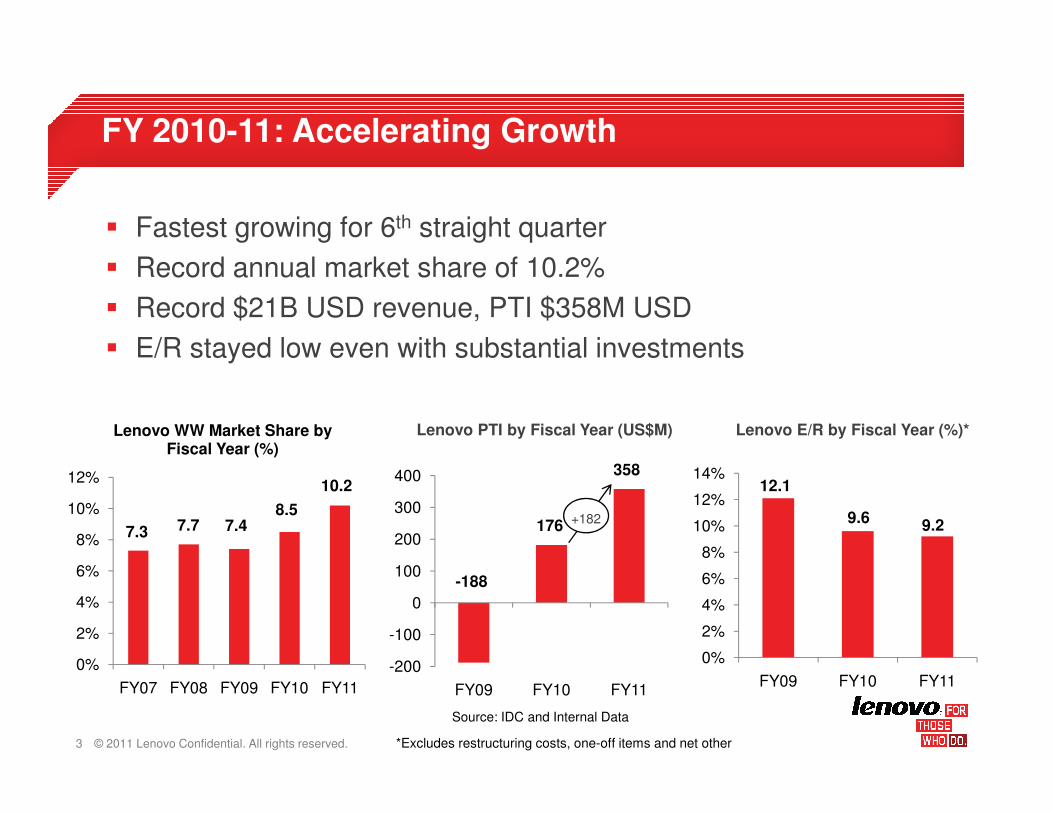
� Fastest growing for 6th straight quarter
� Record annual market share of 10.2%
� Record $21B USD revenue, PTI $358M USD
� E/R stayed low even with substantial investments
FY 2010-11: Accelerating Growth
3 © 2011 Lenovo Confidential. All rights reserved.
0%
2%
4%
6%
8%
10%
12%
FY07 FY08 FY09 FY10 FY11
Lenovo WW Market Share by Fiscal Year (%)
7.3 7.7 7.48.5
10.2
-200
-100
0
100
200
300
400
FY09 FY10 FY11
-188
176
358
0%
2%
4%
6%
8%
10%
12%
14%
FY09 FY10 FY11
Lenovo E/R by Fiscal Year (%)*
12.1
9.6 9.2
*Excludes restructuring costs, one-off items and net other
Lenovo PTI by Fiscal Year (US$M)
+182
Source: IDC and Internal Data

� Increased profitability; outgrew market all 4 quarters
� Reached record market share of 29.5%
� Lenovo Mobile outgrew market, launched new MID products
Protect China
70Lenovo China Shipment YTY Growth (%) Lenovo China Market Share(%)
4 © 2011 Lenovo Confidential. All rights reserved.
0
10
20
30
40
50
60
70
Q1 09/10
Q2 09/10
Q3 09/10
Q4 09/10
Q1 10/11
Q2 10/11
Q3 10/11
Q4 10/11
Market
26.4 26.1 26.0 27.129.5
FY11FY10FY09FY08FY07
16%
8%
Source: IDC and Internal Data

� Improved profitability by $143M USD YTY
� Record market share
� Outgrew market all four quarters
Mature Markets: Protect and Attack
Lenovo MM Operating Profit (US$) Lenovo MM Market Share (%)
5 © 2011 Lenovo Confidential. All rights reserved.
0%
1%
2%
3%
FY09 FY10 FY11
-150
-100
-50
0
50
100
FY09 FY10 FY11
-137 -65
78
4.3%
5.5%
4.3%
+143
Source: IDC and Internal Data

� #1 Global Emerging Markets (including China)
� Grew nearly 3x faster than the market for the year
� Increased share across Emerging Markets
Attack Emerging Markets
Lenovo Share Gains in All EM RegionsLenovo EM Shipment YTY Growth (%)
6 © 2011 Lenovo Confidential. All rights reserved.
0
10
20
30
40
50
60
FY09 FY10 FY11
4.0%
4.5%
9.2%
8.4%
7.0%
6.1% +0.9
+1.3
+3.5
+2.2
+0.8
+0.4
FY11 SharesShare Change
YTY (pts)
6.4%
+0.7
HTK
ASEAN
Russia
India
MEA
EET
LA/Brazil
18%Market
50%
Source: IDC and Internal Data

Protect/Attack 2011-12
7 © 2011 Lenovo Confidential. All rights reserved.

� Strategic focus on attacking mobile internet
� Formed Mobile Internet Digital Home business unit
� China and Commercial markets are focus
� Launching consumer and commercial tablets
Attack: Mobile Internet
8 © 2011 Lenovo Confidential. All rights reserved.

� Continue to invest in business for future growth
� Strategic investments in:
− Innovation and our products
− Global brand
− Refining our business model
− In-house Service capability
Investing in Future Growth
9 © 2011 Lenovo Confidential. All rights reserved.
− In-house Service capability
− Strategic IT deployment
− Improve Transactional capability

� Optimistic about:
− PC growth
− Expansion in mobile internet
� Focused on executing our strategy
� Confident we will drive sustainable growth
Outlook for the Year
10 © 2011 Lenovo Confidential. All rights reserved.
� Confident we will drive sustainable growth

Wong Wai MingChief Financial OfficerChief Financial Officer

� Balanced strong shipments and share growth across the board:
Q4 FY11: Another Solid Quarter Outperforming WW Markets
Shipments Growth (YTY)
Market Share
Q4 FY11 Lenovo Market Lenovo YTY9.9%
10.0%
12.0%
Lenovo’s WW Market Share Trend
12 © 2011 Lenovo Confidential. All rights reserved.
Q4 FY11 Lenovo Market Lenovo YTY
Worldwide +16.0% -1.1% 9.9% +1.5 pts
China +15.8% +7.6% 27.6% +1.9 pts
EM (Ex. China) +31.5% +12.7% 5.7% +0.8 pts
MM +7.0% -12.1% 5.7% +1.0 pts
Commercial +16.9% +3.0% 13.8% +1.6 pts
Consumer +14.3% -4.4% 6.7% +1.1 pts 4.0%
6.0%
8.0%
10.0%
Q4 FY08 Q4 FY09 Q4 FY10 Q4 FY11

US$ Million
Q4
FY2010/11
Q4
FY2009/10YTY QTQ FY2010/11 YTY
Sales 4,879 4,317 562 (929) 21,594 4,989
Gross Profit 600 449 151 (48) 2,364 574
Operating Expenses* (531) (402) (129) (10) (1,978) (392)
Operating Profit* 69 47 22 (58) 386 182
Other Non-Operating Expenses (10) (7) (3) (6) (24) 19
Pre-tax Income* 59 40 19 (64) 362 201
One-off Items and Restructuring Costs 1 (20) 21 3 (4) 64
Other income, net 0 0 0 0 0 (83)
Financial Summary
13 © 2011 Lenovo Confidential. All rights reserved.
Pre-tax Income 60 20 40 (61) 358 182
Taxation (18) (7) (11) 3 (85) (38)
Profit attributable to Equity Holders 42 13 29 (58) 273 144
EPS (US cents)
- Basic 0.43 0.14 0.29 (0.60) 2.84 1.42
- Diluted 0.42 0.13 0.29 (0.56) 2.73 1.40
Dividend per share (HK cents) 7.60 2.10
Q4
FY2010/11
Q4
FY2009/10
Q3
FY2010/11FY2010/11 FY2009/10
Gross margin 12.3% 10.4% 11.2% 10.9% 10.8%
E/R ratio* 10.9% 9.3% 9.0% 9.2% 9.6%
Operating margin* 1.4% 1.1% 2.2% 1.8% 1.2%
PTI margin* 1.2% 0.9% 2.1% 1.7% 1.0%
Net margin 0.9% 0.3% 1.7% 1.3% 0.8%
* Exclude restructuring costs, one-off items and other income, net
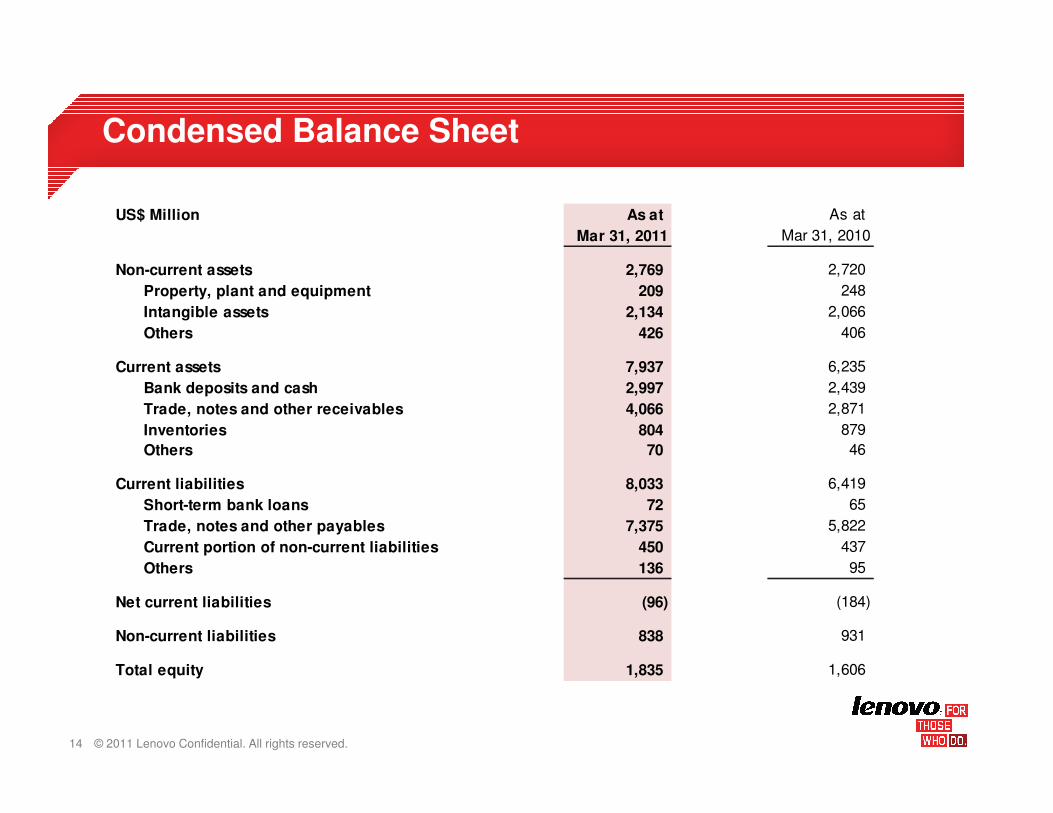
US$ Million As at As at
Mar 31, 2011 Mar 31, 2010
Non-current assets 2,769 2,720
Property, plant and equipment 209 248
Intangible assets 2,134 2,066
Others 426 406
Current assets 7,937 6,235
Bank deposits and cash 2,997 2,439
Trade, notes and other receivables 4,066 2,871
Condensed Balance Sheet
14 © 2011 Lenovo Confidential. All rights reserved.
Trade, notes and other receivables 4,066 2,871
Inventories 804 879
Others 70 46
Current liabilities 8,033 6,419
Short-term bank loans 72 65
Trade, notes and other payables 7,375 5,822
Current portion of non-current liabilities 450 437
Others 136 95
Net current liabilities (96) (184)
Non-current liabilities 838 931
Total equity 1,835 1,606

Cash and Working Capital
US$ Million Q4 FY2010/11 Q4 FY2009/10 FY 2010/11 FY 2009/10
Bank deposits and cash 2,997 2,439 2,997 2,439
Total Bank Borrowings 272 495 272 495
15 © 2011 Lenovo Confidential. All rights reserved.
Net Cash Reserves 2,725 1,944 2,725 1,944
Days Inventory 18 18 18 15
Days Receivable 32 30 29 24
Days Payable 83 76 75 69
Cash Conversion Cycle -33 days -28 days -28 days -30 days

Q4 FY11: Performance by Geography
China China – Strong share growth to 27.6% (+1.9pts YTY)
– Solid shipments growth driven by stronger presence in emerging cities
– Increased investments in R&D and marketing for PC & MIDH products
Emerging Markets (Excluding China)Emerging Markets (Excluding China)– Continuous share gains; close to 10% market share benchmark in selected countries (e.g. India)
– Continuous share expansion to improve profitability
Mature MarketsMature Markets– Record high market share at 5.7% (+1.0pts YTY) benefited from strong commercial PC demand
16 © 2011 Lenovo Confidential. All rights reserved.
Q4
FY11Y/Y Q/Q
Q4
FY11
Q4
FY10
Q3
FY11
Q4
FY11
Q4
FY10
Q3
FY11
China* 2,195 12.3% -18.2% 88 108 132 4.0% 5.5% 4.9%
China- PC # 2,008 7.7% -18.5% 101 106 137 5.0% 5.7% 5.6%
Emerging Markets (Ex. China) 850 14.2% -23.9% (10) (38) (13) -1.2% -5.1% -1.2%
Mature Markets 1,834 13.3% -8.7% 36 (6) 22 1.9% -0.4% 1.1%
(Excluding restructuring
charges & one-off items)
Sales
Segment Operating
Profit / (Loss) Segment
US$ Million US$ Million Operating Margin
* Included PC & Mobile business# Financials on China PC extracted from management report are not presented as a separate reportable segment in
external report and are shown for reference only.
– Record high market share at 5.7% (+1.0pts YTY) benefited from strong commercial PC demand
– Enhanced profitability due to enhanced product mix and better operational efficiency

Desktop Desktop – Shipments up 17% YTY; Sales up 13% YTY
– World’s third largest desktop player
– Market share up 1.8 pts YTY
– Strong growth through launch of enhanced AIO and SMB targeted desktops
NotebookNotebook
(2.1%)
MobileMobile3.8%
(1.9%)
OthersOthers0.7%
Revenue by Product*Revenue by Product*
Q4 FY11: Performance By Product
17 © 2011 Lenovo Confidential. All rights reserved.
NotebookNotebook– Shipments up 15% YTY; Sales up 12% YTY
– Market share up 1.2 pts YTY
– World’s largest relationship notebook player
– New generation of ultraportable laptops to target SMB customers
Mobile Mobile – Shipments up 27% YTY
– Strong feature phones shipment growth at 24% YTY with market share up 1.5 pts YTY
– China’s largest domestic mobile handset brand
NotebookNotebook61.3%(61.7%)
DesktopDesktop34.1%(34.3%)
* Comparative figures based on Lenovo Mobile pro-forma information

Liu ChuanzhiChairman of the BoardChairman of the Board

Appendix
• FY11: Shipments Performance by Geography
• FY11: Performance by Geography
• Highlights of Q4 Geography Performance
• FY11: Performance by Product
• Consolidated Income Statement
• Condensed Consolidated Cash Flow Statement

FY11: Shipments Performance by Geography
Shipments Growth (YTY)
Market Share
Lenovo Market Lenovo YTY
Worldwide +28.2% +7.4% 10.2% +1.7 pts
20 © 2011 Lenovo Confidential. All rights reserved.
China +22.2% +12.4% 29.5% +2.4 pts
EM (Ex. China) +50.1% +17.8% 6.1% +1.3 pts
MM +27.4% -0.2% 5.5% +1.2 pts
Commercial +27.6% +8.8% 14.3% +2.1 pts
Consumer +29.3% +6.2% 6.8% +1.2 pts

FY11 YTY FY11 FY10 FY11 FY10
China* 10,015 26.9% 507 444 5.1% 5.6%
China- PC # 9,211 18.1% 523 442 5.7% 5.7%
(Excluding restructuring
charges & one-off items)
Sales
Segment Operating
Profit / (Loss) Segment Operating
US$ Million US$ Million Profit Margin
FY11: Performance by Geography
21 © 2011 Lenovo Confidential. All rights reserved.
China- PC # 9,211 18.1% 523 442 5.7% 5.7%
Emerging Markets (Ex. China) 3,860 46.2% (65) (97) -1.7% -3.7%
Mature Markets 7,719 27.1% 78 (65) 1.0% -1.1%
* Included PC & Mobile business# Financials on China PC extracted from management report are not presented as a separate reportable segment in external
report and are shown for reference only.

Highlights of Q4 Geography Performance
Lenovo Mature Markets
Segment Operating Profit/(Loss)* (US$M)
20 22
36
20
40
Emerging Market RegionsMarket Shares (Q4 FY11)
5.2% +0.6
Q4 SharesShare Change
YTY (pts)
HTK
22 © 2011 Lenovo Confidential. All rights reserved.
-37
-15-7 -6
0
20 22
(40)
(20)
0
20
Q409/10
Q109/10
Q209/10
Q309/10
Q110/11
Q210/11
Q310/11
Q410/11
3.8%
4.1%
10.0%
8.9%
6.9% +1.3
+3.5
+2.8
+0.8
-0.3
4.9% -1.3
ASEAN
RUCIS
India
MEA
EET
LA/Brazil
* Exclude restructuring costs, one-off items and other income, net

FY11: Performance By Product
(2.8%)
MobileMobile3.7%
(1.9%)
OthersOthers2.3%
Revenue by Product*Revenue by Product* Desktop Desktop – Shipments up 26% YTY; Sales up 25% YTY
– World’s third largest desktop player
– Market share up 1.8 pts YTY
NotebookNotebook– Shipments up 30% YTY; Sales up 24% YTY
– Market share up 1.5 pts YTY
23 © 2011 Lenovo Confidential. All rights reserved.
NotebookNotebook60.2%(61.2%)
DesktopDesktop33.8%(34.2%)
– Market share up 1.5 pts YTY
– World’s second largest commercial notebook player
Mobile Mobile – Shipments up 48% YTY
– Strong feature phones shipment growth at 40% YTY with market share up 0.9 pts YTY
– China’s largest domestic mobile handset brand
– LePhone shipments reached over 500K
* Comparative figures based on Lenovo Mobile pro-forma information
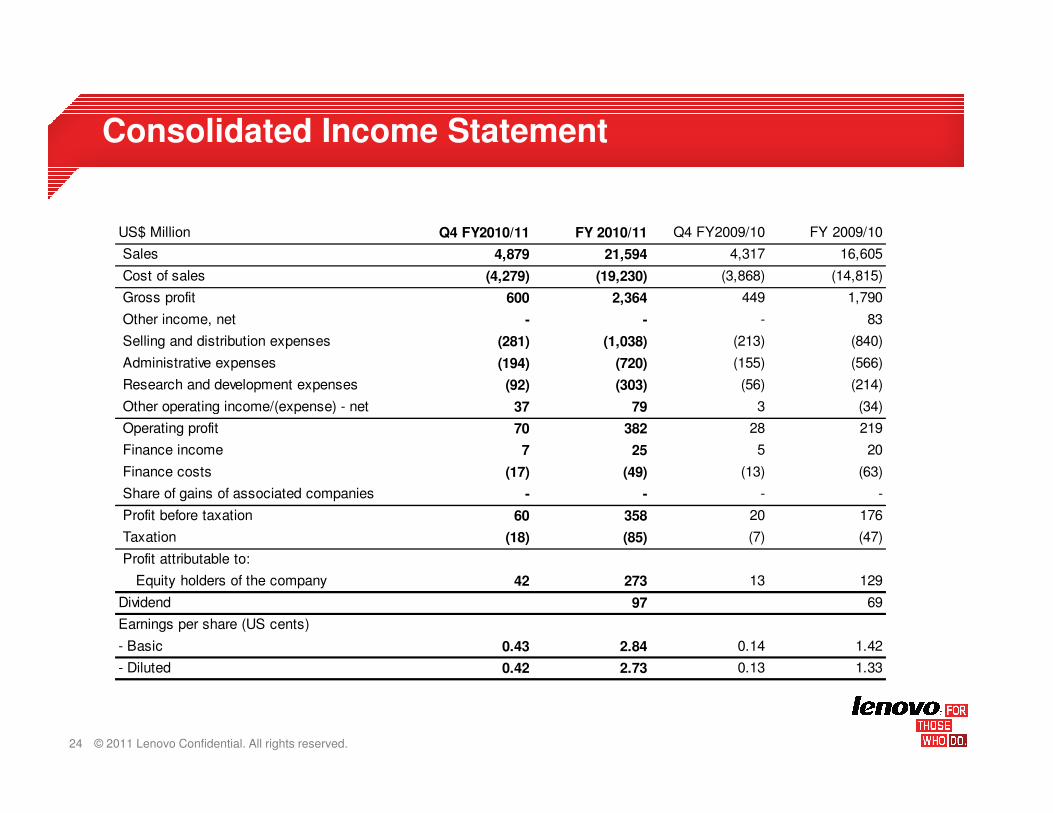
Consolidated Income Statement
US$ Million Q4 FY2010/11 FY 2010/11 Q4 FY2009/10 FY 2009/10
Sales 4,879 21,594 4,317 16,605
Cost of sales (4,279) (19,230) (3,868) (14,815)
Gross profit 600 2,364 449 1,790
Other income, net - - - 83
Selling and distribution expenses (281) (1,038) (213) (840)
Administrative expenses (194) (720) (155) (566)
Research and development expenses (92) (303) (56) (214)
Other operating income/(expense) - net 37 79 3 (34)
24 © 2011 Lenovo Confidential. All rights reserved.
Other operating income/(expense) - net 37 79 3 (34)
Operating profit 70 382 28 219
Finance income 7 25 5 20
Finance costs (17) (49) (13) (63)
Share of gains of associated companies - - - -
Profit before taxation 60 358 20 176
Taxation (18) (85) (7) (47)
Profit attributable to:
Equity holders of the company 42 273 13 129
Dividend 97 69
Earnings per share (US cents)
- Basic 0.43 2.84 0.14 1.42
- Diluted 0.42 2.73 0.13 1.33

Condensed Consolidated Cash Flow Statement
US$ Million FY 2010/11 FY 2009/10
Net cash generated from operating activities 965 835
Net cash generated from/(used in) investing activities 66 (255)
25 © 2011 Lenovo Confidential. All rights reserved.
Net cash used in financing activities (373) (217)
Increase in cash and cash equivalents 658 363
Effect of foreign exchange rate changes 58 12
Cash and cash equivalents at the beginning of the year 2,238 1,863
Cash and cash equivalents at the end of the year 2,954 2,238
