fy2010 results presentation - abc.es
TRANSCRIPT

FY2010 Results Presentation
23 March 2011

2
Disclaimer
This document is of a purely informative nature and does not constitute an offer to sell, exchange or buy, or the
solicitation of an offer to buy, securities issued by any of the companies mentioned herein.
This document contains forward-looking statements. All statements other than statements of historical fact included
herein, including, without limitation, those regarding our financial position, business strategy, management plans and
objectives for future operations are forward-looking statements. Any such forward-looking statements are subject to
risk and uncertainty and thus could differ materially from actual results.
Some of these risks include, amongst others, ongoing competitive pressure in the sector, consumer tastes and
spending trends, economic, political, regulatory and trade conditions in the markets where the Inditex Group is
present or in the countries where the Group’s products are manufactured or distributed.
The risks and uncertainties that could affect the forward-looking statements are difficult to predict. The company
assumes no obligation to publicly revise or update its forward-looking statements in the case of unexpected
changes, events or circumstances that could affect them. Given the uncertainties of forward-looking statements, we
caution readers not to place undue reliance on these statements.
For a discussion of these and other factors that may affect forward looking statements and the Inditex Group’s
business, financial conditions and results of operations, see the documents and information communicated by the
company to the Comisión Nacional del Mercado de Valores (the Spanish Securities Commission).
The contents of this disclaimer should be taken into account by all persons or entities.

Overview

4
FY2010: Overview
A year of strong expansion for Inditex
Satisfactory sales growth and gross margin evolution
High operational efficiency and cost control
Strong cash flow and reinvestment in the business
Increased shareholder remuneration
Global growth opportunity

5
FY2010: Overview
Sales growth of 13%
LFL sales growth 3%
EBITDA growth 25%
Net income growth 32%, EPS of 2.78€
RoCE 39%
33% increase in dividend proposal

Financial Summary
7
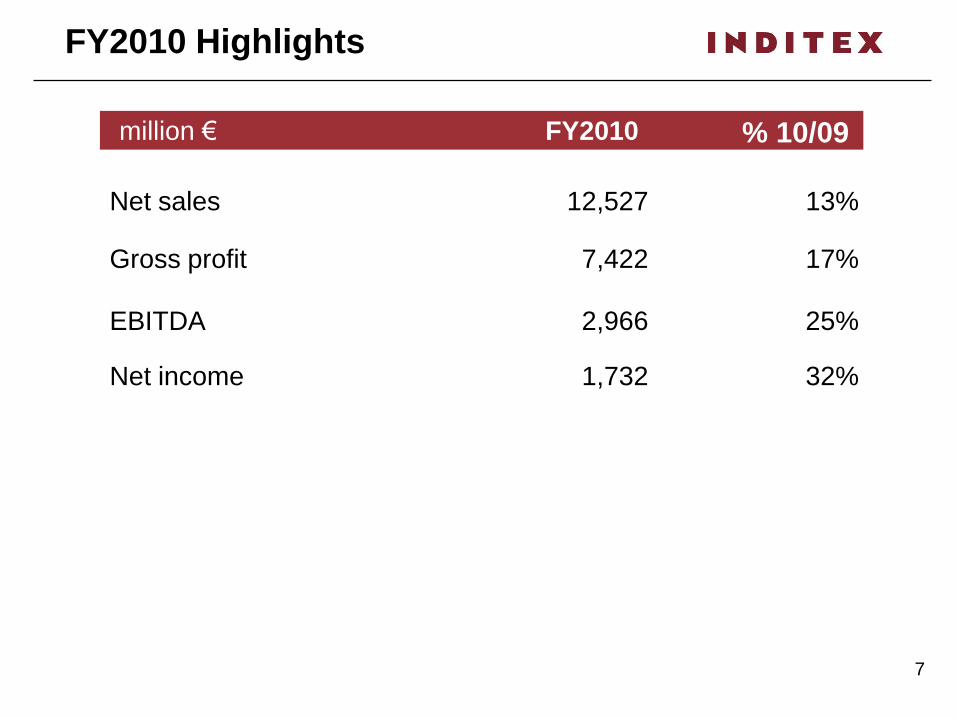
FY2010 Highlights
million € FY2010 % 10/09
Net sales 12,527 13%
Gross profit 7,422 17%
EBITDA 2,966 25%
Net income 1,732 32%

8
10%12%
12%15%
46%45%Europe ex-Spain
32%28%
FY2009FY2010
Diversified sales platform
Store sales: Includes sales in OMS and franchises
Store sales (%)
Americas
Asia & RoW
SpainEurope
Ex-Spain
Spain
RoW
Asia &
Americas
Europe ex-Spain
Asia & RoW
Americas
Spain

9
Sales growth breakdown
FY2010
Space contribution 7%
LFL 3%
Currency 3%
Sales growth 13%

10
Selling area
sqm. FY2010 FY2009 % 10/09
Total space 2,587,648 2,348,709 10%
239,000 m2 added to the retail base
11
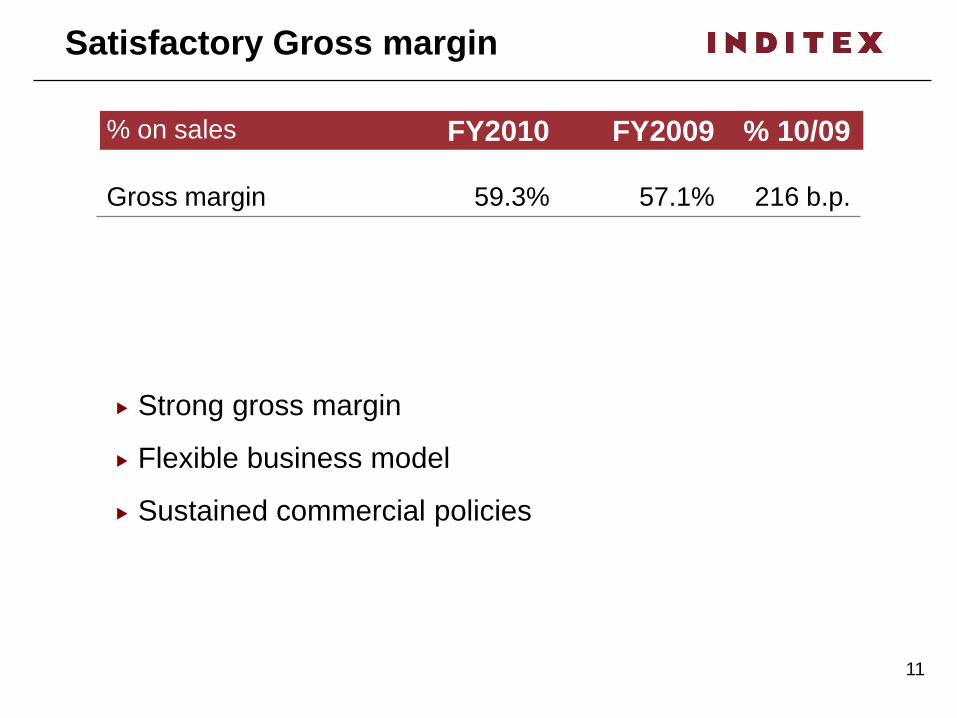
Satisfactory Gross margin
% on sales FY2010 FY2009 % 10/09
Gross margin 59.3% 57.1% 216 b.p.
Strong gross margin
Flexible business model
Sustained commercial policies
12
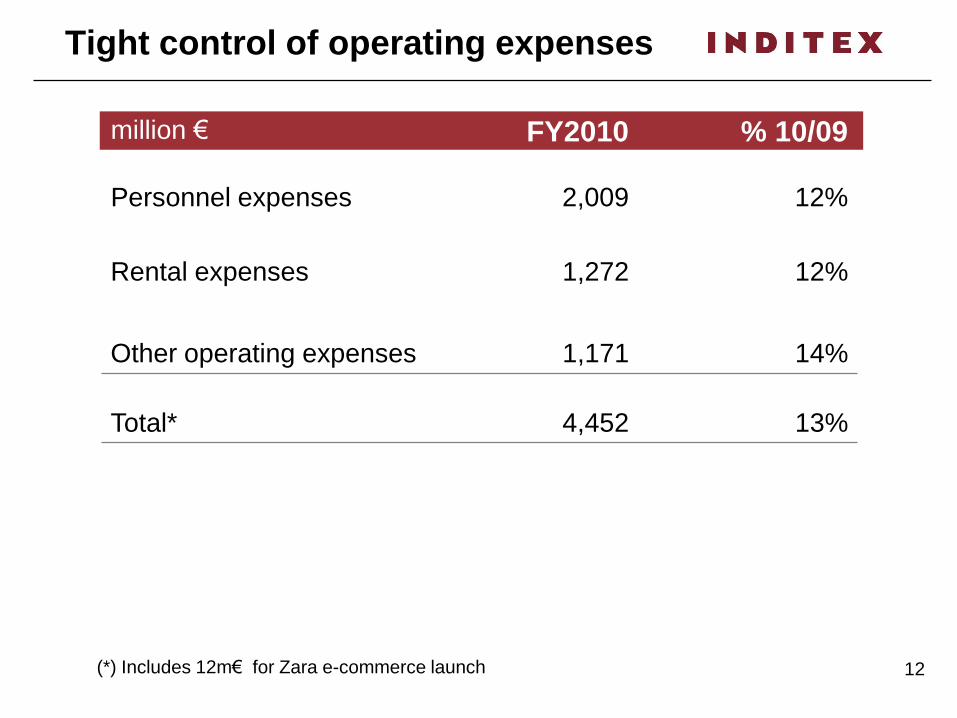
Tight control of operating expenses
million € FY2010 % 10/09
Personnel expenses 2,009 12%
Rental expenses 1,272 12%
Other operating expenses 1,171 14%
Total* 4,452 13%
(*) Includes 12m€ for Zara e-commerce launch

13
Flexible business model
million € FY2010 FY2009
Inventory 1,215 993
Receivables 482 422
Payables (2,672) (2,270)
Operating working capital (976) (856)

14
Strong cash flow
million € FY2010
Funds from operations 2,540
CAPEX 754
Dividends 751

Inditex concepts

16
Sales by concept
Concept FY2010 FY2009
Zara 64.6% 63.8%
Non Zara 35.4% 36.2%
Pull and Bear 6.8% 7.0%
Massimo Dutti 7.2% 7.1%
Bershka 10.0% 10.6%
Stradivarius 6.2% 6.3%
Oysho 2.4% 2.5%
Zara Home 2.3% 2.2%
Uterqüe 0.5% 0.4%
Zara
Non Zara

17
FY2010: Openings
Store openings
Zara 115
Pull and Bear 56
Massimo Dutti 33
Bershka 69
Stradivarius 78
Oysho 40
Zara Home 23
Uterqüe 23
Total net openings 437
Global growth opportunities
Openings in 45 countries in FY 2010
5,044 stores worldwide

18
million € FY2010 % 10/09
Net Sales 8,088 14%
EBIT 1,534 39%
EBIT margin 19.0%
Zara
Strong performance of Zara
19
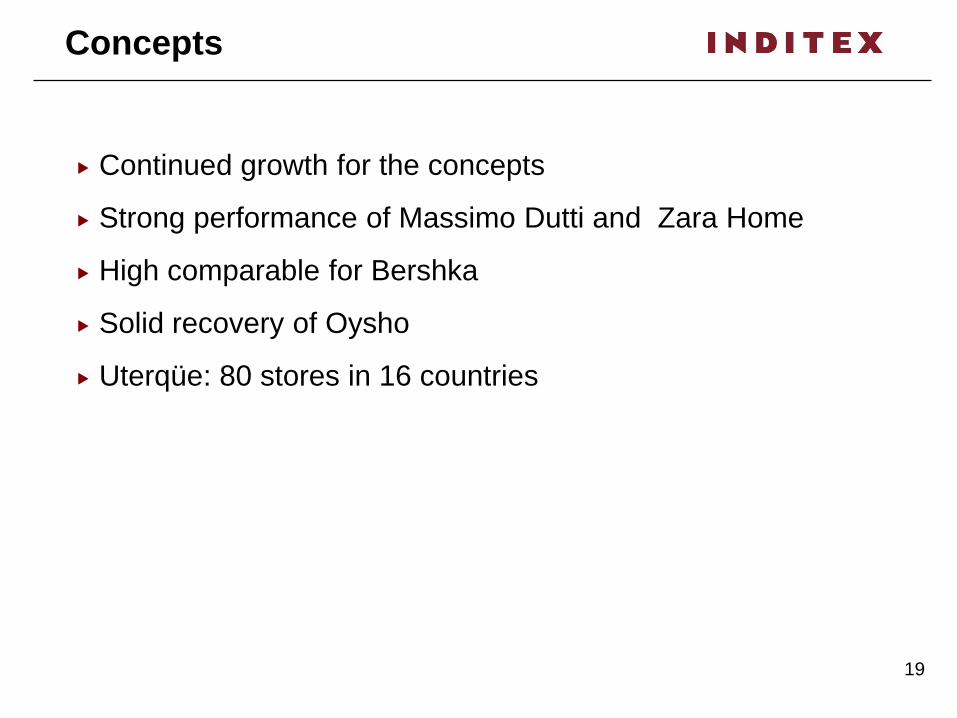
Concepts
Continued growth for the concepts
Strong performance of Massimo Dutti and Zara Home
High comparable for Bershka
Solid recovery of Oysho
Uterqüe: 80 stores in 16 countries

Outlook

21
Outlook
Global growth opportunities
Outlook FY2011
22
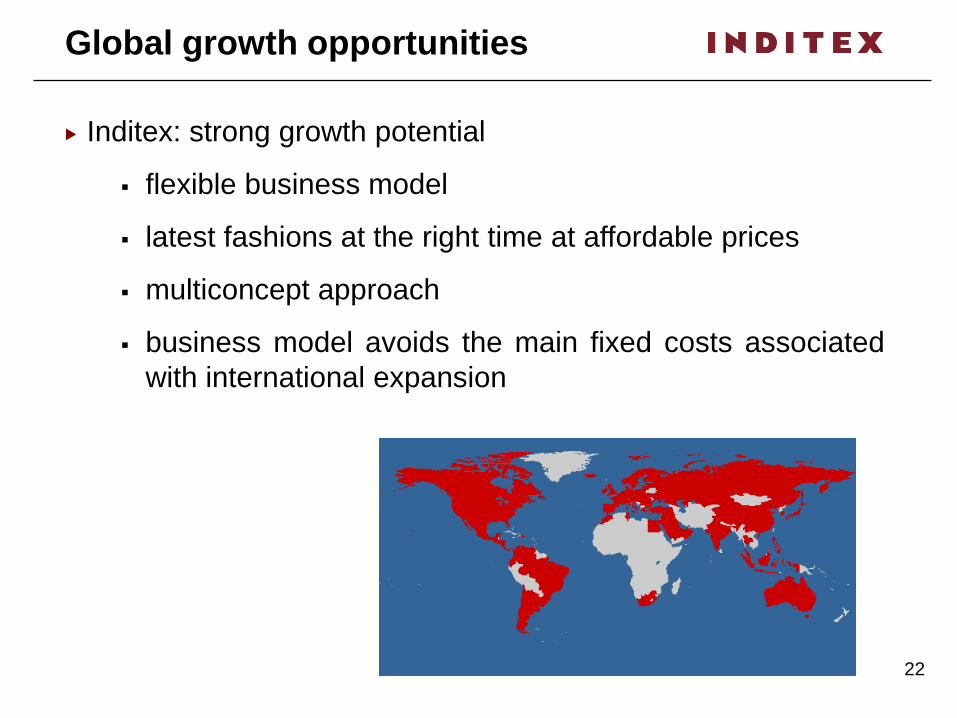
Global growth opportunities
Inditex: strong growth potential
flexible business model
latest fashions at the right time at affordable prices
multiconcept approach
business model avoids the main fixed costs associated
with international expansion

23
Global growth opportunities
Profitable expansion of the business remains a key priority
Focus in Europe and Asia

24
Global growth opportunities
Growth in Europe
Significant growth opportunities
Balanced expansion between Western and Eastern Europe
Multiconcept growth

25
Global growth opportunities
Growth in Asia: Leveraging on a strategic presence
Markets in transformation
Multiconcept expansion
Strong growth opportunity

26
China
2006: Main capitals (HK,
Shanghai, Beijing, Macau)
2007: Tier II cities (+5M)
2009: Tier III cities (+2.5M)
2010:
Multi-concept launch
Tier IV cities (+1.5M)
143 stores at FYE
2011: 120 openings/8 concepts
FYE 2010: 30 cities FYE11: 42 cities

27
India
Launch of Zara in 2010
2011: Additional Zara
openings in Delhi, Mumbai
Bangalore and Pune

28
Global growth opportunities
Growth in the Americas:
Build on current platform through selective expansion
Brazil: attractive growth market

29
Global growth opportunities
Launch in Australia in April: Sidney and Melbourne
South Africa: Second half 2011

30
Zara e-commerce
Launched in 16 countries in Europe
2 Sept.10: France, Germany, Italy, Portugal, Spain and UK
4 Nov. 10: The Netherlands, Belgium, Luxembourg, Austria and Ireland
3 March 11: Switzerland, Monaco, Sweden, Denmark and Norway.
Satisfactory customer reception

31
Zara e-commerce US and Japan
Launch of Zara online sales in second half 2011
US
Japan
Progressive rollout in all Zara markets

32
2011: All concepts in e-commerce
Second half 2011
Online sales launch in selected European markets for:
Massimo Dutti
Bershka
Pull&Bear
Stradivarius
Oysho
Uterqüe

33
FY2011: Outlook
Store opening programme Range
Zara 125 130
Pull and Bear 45 50
Massimo Dutti 40 45
Bershka 70 75
Stradivarius 80 85
Oysho 40 45
Zara Home 35 40
Uterqüe 25 30
Total net openings 460 500
Capital Expenditure c.800 million €
Extraordinary investment of 230 million € for
acquisition of Zara at 666 Fifth Avenue New York

34
FY2011: Outlook
Shareholder remuneration
33% increase over FY2009
FY2010 dividend proposal 1.60 € per share payable:
• 2 May: 0.80 € ordinary
• 2 November: 0.60 € ordinary + 0.20 € bonus
997 million € to be distributed to shareholders

35
FY2011: Outlook
Store sales in local currencies have increased 10% from
1 February to 14 March 2011
The Spring-Summer season is influenced by the
performance over the Easter period due to its significant
sales volumes

FY2010 Results Presentation
Q&A
23 March 2011