results announcement for the fy2010 - tstech.co.jp · japjapanan (actual) fy2009 (act ual) reasons...
TRANSCRIPT

0All Rights Reserved. Copyright TS TECH CO.,LTD.
Results announcement for the FY2010(April1, 2009 – March 31, 2010)
Good Quality Good Quality for the Whole Worldfor the Whole World
ACURA ZDX seat
Securities code: 7313Securities code: 7313First Section, Tokyo Stock ExchangeFirst Section, Tokyo Stock Exchange
http://http://www.tstech.co.jpwww.tstech.co.jp

1All Rights Reserved. Copyright TS TECH CO.,LTD.
Outline Toshio Komeji, President
- Business overview and results outline for FY2010 (April 1, 2009 – March 31, 2010)- Outline of forecast for FY2011 (April 1, 2010 – March 31, 2011)- Direction of the company’s future growth strategy
Detail Akira Nemoto, Managing Director & Executive General Manager of theCorporate Administration Division
- Consolidated results for FY2010 (April 1, 2009 – March 31, 2010)- Consolidated forecast for FY2011 (April 1, 2010 – March 31, 2011)

2All Rights Reserved. Copyright TS TECH CO.,LTD.
Outline Toshio Komeji, President
- Business overview and results outline for FY2010 (April 1, 2009 – March 31, 2010)- Outline of forecast for FY2011 (April 1, 2010 – March 31, 2011)- Direction of the company’s future growth strategy
Detail Akira Nemoto, Managing Director & Executive General Manager of theCorporate Administration Division
- Consolidated results for FY2010 (April 1, 2009 – March 31, 2010)- Consolidated forecast for FY2011 (April 1, 2010 – March 31, 2011)

3All Rights Reserved. Copyright TS TECH CO.,LTD.
Business overview and results outline for FY2010
(April 1, 2009 – March 31, 2010)

4All Rights Reserved. Copyright TS TECH CO.,LTD.
SuzukiSubaru
KawasakiYamaha
Japan
North AmericaSouth
America
ChinaAsia
Europe
April 2009 March 2010
Honda
AutomobilesMotorcycles
Red: New model/full model change
Black: Minor model change
JAZZ
Z1000
RM-X450RM-Z250
VN900CUSTOM
T-MAX
SR400
SUPER CUB110
ACTY TRUCK
STEPWGN
FAZE
SUPER CUB110PRO
VFR1200F VT1300CR
CB1300
CR-V
CIVIC
ODYSSEY(China)JAZZ (India)
SPIRIOR (China)
FREED(Indonesia)
CITY (Brazil)ZDX (Canada)
ACCORD CROSSTOUR(USA)
Key models entering production during FY2010
CB Twister(India)
VT750S
CB1100
XT1200Z Super TenereAPV TRUCK

5All Rights Reserved. Copyright TS TECH CO.,LTD.
L’zaNew product
PARAMOUNT BED
Saitama Plant(Konosu)
FAZENew modelHonda
Kyusyu T・S
Dialysis/chemotherapy chair
STEPWGNHonda
Japan
Motorcycle seats
ACTY TRUCKFull model changeHonda
Suzuka Plant
Order: Seats
Key models entering production during FY2010
Full model changeSaitama Plant(Gyoda)
Order: Seats

6All Rights Reserved. Copyright TS TECH CO.,LTD.
CITYNew ModelHonda
TS TECH BRASIL
Order: Seats
North/South America
Key models entering production during FY2010
ZDXNew modelAcura
TS TECH CANADA
Order: Seats
Order: Seats, doors, roofs
ACCORD CROSSTOUR
New model
Honda
TS TECH USA/TS TRIM INDUSTRIES

7All Rights Reserved. Copyright TS TECH CO.,LTD.
China
CITYFull model changeHonda
Order: Seats, doors
Key models entering production during FY2010
New model
Order: Doors
ODYSSEYHonda
Order: Seats, doors
GUANGZHOU TSFull model change
GUANGZHOU TSK AUTO PARTSGUANGZHOU TSGUANGZHOU TSK AUTO PARTS
ACCORD (SPIRIOR)Honda
WUHAN TS

8All Rights Reserved. Copyright TS TECH CO.,LTD.
FREEDNew model
Honda
TS TECH INDONESIA
Order: Seats
Asia
Europe
FIT (JAZZ)
New model
Honda
TS TECH UK
Order: Seats
CB TwisterNew modelHonda
TS TECH INDIA
Key models entering production during FY2010
FIT (JAZZ)New model
Honda
TS TECH INDIA
Order: Seats

9All Rights Reserved. Copyright TS TECH CO.,LTD.
0
50
100
150
200
250
300
350
400
FY2009 FY20100
20
40
60
80
100
120
140
FY2009 FY2010 FY2009 FY2010 FY2009 FY2010 FY2009 FY2010 FY2009 FY2010 FY2009 FY2010
Source: TS TECH production data, in-house research based on figures published by Honda Motor Co., Ltd.
630,000 vehicles
730,000 vehicles
130,000 vehicles
70,000 vehicles
240,000 vehicles
590,000 vehicles
70%
63%
100%
81%83%
94%
2.67 million
vehicles
73%
2.40 million
vehicles
75%
TS TECH
Others (Technical assistance provided by TS TECH, etc.)
790,000 vehicles
69%58%
720,000 vehicles
96%
510,000 vehicles
85%
260,000 vehicles
83%
230,000 vehicles
100%
130,000 vehicles
JapanJapan N. AmericaN. America ChinaChina S. AmericaS. AmericaAsiaAsia EuropeEurope
Share of Honda automobile production
Share of Honda automobile production Share of production according to regionShare of production according to region
* Figures rounded down to the nearest 10,000 vehicles
Supplying 75% of seats for Honda automobiles
Competitors (2 Companies)
(10,000vehicles) (10,000vehicles)

10All Rights Reserved. Copyright TS TECH CO.,LTD.
FY2009 FY2010Consolidated
Sales ratio Sales ratioDifference Year-on-year
Net sales 404,761 100.0% 317,990 100.0% - 86,771 - 21.4%Operating income 16,093 4.0% 9,598 3.0% - 6,494 - 40.4%Ordinary income 14,962 3.7% 11,436 3.6% - 3,526 - 23.6%Net income 4,741 1.2% 6,328 2.0% + 1,586 + 33.5%
Non-consolidatedFY2009 FY2010
Difference Year-on-yearSales ratio Sales ratio
Net sales 135,852 100.0% 102,247 100.0% - 33,605 - 24.7%Operating income - 2,969 --- - 2,457 --- + 512 ---Ordinary income 2,666 2.0% 2,694 2.6% + 28 + 1.1%Net income 1,199 0.9% 3,702 3.6% + 2,503 + 208.7%
Results outline for FY2010(Unit: Million yen)[Results compared to FY2009]
[Results compared to FY2009](Unit: Million yen)
* Cash dividends per share in brackets based on projected figures.
End of year
End of 1st half
Cash dividendsper share ¥22 (¥20) - ¥2 - 9.1%
¥11 ¥9 - ¥2 -18.2%¥11 (¥11) ¥0 0%
11All Rights Reserved. Copyright TS TECH CO.,LTD.
Outline of forecast for FY2011 (April 1, 2010 – March 31, 2011)

12All Rights Reserved. Copyright TS TECH CO.,LTD.
FY2010(Actual)
FY2011(Forecast)Consolidated
Sales ratio Sales ratioDifference Year-on-year
Net sales 317,990 100.0% 366,600 100.0% + 48,609 + 15.3%
Operating income 9,598 3.0% 17,500 4.8% + 7,901 + 82.3%
Ordinary income 11,436 3.6% 19,000 5.2% + 7,563 + 66.1%
Net income 6,328 2.0% 10,200 2.8% + 3,871 + 61.2%
Outline of forecast for FY2011
(Unit: Million yen)[Forecast compared to results for FY2010]
* Cash dividends per share in brackets based on projected figures.
Cash dividends per share ¥20 (¥22) ¥2 10.0%
End of 1st half ¥9 (¥11) ¥2 22.2%End of year (¥11) (¥11) ¥0 0%

13All Rights Reserved. Copyright TS TECH CO.,LTD.
3.1%3.9%
5.5%
4.0%
3.0%
4.8%
0
100000
200000
300000
400000
500000
600000
FY2006 FY2007 FY2008 FY2009 FY2010 FY20110.0%
1.0%
2.0%
3.0%
4.0%
5.0%
6.0%
0.80
0.90
1.00
1.10
1.20
1.30
1.40
Dec Jan Feb Mar Apr May Jun Jul Aug Sep Oct Nov Dec Jan Feb Mar
Production per person and personnel numbers (global)
Results of increasing improvement
Rate of change since December 2008 (1.00)
2008 2009 2010
Personnel
Vehicles produced per person
(Points)
Net sales
Operating margin
Impact of increasing improvement measures
Increasing improvement measures in order to increase productivity
Implement production line upgradesMaintain personnel numbers in spite of increasing productionIncrease margin for FY2011 based on same level of sales as FY2006
(Forecast)

14All Rights Reserved. Copyright TS TECH CO.,LTD.
埼玉工場視察会Outline of Japan Segment
122,220110,207
144,457
193,775
FY2008 FY2009 FY2010 FY2011
3,460
641580
10,589
FY2008 FY2009 FY2010 FY2011
Net sales
Operating income
(Unit: Million yen)
(Unit: Million yen)
FY2008 FY2009 FY2010 FY2011
(10,000 vehicles)100
79
63
Positioning of Japan Segment
Domestic production declining, with no clear signs
of recovery in the future
Japan’s roleStarting point for all
information and technology
Reinforcing role as global “mother ship”
Vehicles produced in Japan Segment
Ensuring that our Japanese operations perform their role effectively will result in improved revenue in Japan
(Projected)
(Forecast)
(Forecast)

15All Rights Reserved. Copyright TS TECH CO.,LTD.
Outline of North America Segment
Results from the North America Segment
As production volume increase receive starting to the benefits of revenue improvement measures in line with increasing production
34,42630,68128,133
24,65122,449
35,62040,46938,637
1Q 2Q 3Q 4Q 1Q 2Q 3Q 4Q
Net sales
- 162 - 155
223
- 1,326- 1,068
- 284
280713
1Q 2Q 3Q 4Q 1Q 2Q 3Q 4Q
Operating income
(Million yen)
(Million yen)
FY2009
1st half 2nd half 1st half 2nd half 1st half 2nd half
(10,000 vehicles)
39
32 32
40
Vehicles produced in the North America Segment
(half-year totals)
2010.3期 2011.3期
133,620
FY2010 FY2011
133,620117,893
2010.3期 2011.3期FY2010 FY2011
- 358
2,530
Full year
Full year
FY2011(Projected)
FY2009 FY2010 FY2009
FY2010
FY2010
(Forecast)
(Forecast)

16All Rights Reserved. Copyright TS TECH CO.,LTD.
Sustaining growth as the cornerstone of consolidated income
Strong growth in productionFor the time being the percentages of genuine leather seats are expected to remain at current levels.The percentage will slightly decline as the composition of models ordered shifts towards compact vehicles.
(10,000 vehicles)
Outline of the China Segment
Margin trends and tactics
14.8
11.613.1 12.6
FY2008 FY2009 FY2010 FY2011
Operating marginVehicles produced and percentage of leather seats
Securing the top line
- Catering to growing market
- Continuing orders for global models- Focusing on independent brands in China
Increasing rate of local procurement
Targeting other models on the current ACCORD level (90%)
(%)
(Projected)
(Forecast)
4651
59
0
10
20
30
40
50
60
70
FY2008 FY2009 FY2010 FY20110%
50%
100%
17All Rights Reserved. Copyright TS TECH CO.,LTD.
Direction of the company’s future growth strategy

18All Rights Reserved. Copyright TS TECH CO.,LTD.
Achieving global top-level quality
Achieving global top-level quality
From stepping up emergency measures to new initiatives
Evolving technologies for safety,
environmentally friendly, and attractive products
Evolving technologies for safety,
environmentally friendly, and attractive products
Strengthening global management
Strengthening global management
Advancing TS TECH’scorporate governanceAdvancing TS TECH’scorporate governance
Four key policiesEmergency measures in line
with shrinking markets(December 2008 onwards)
Stepping up measures
Laying foundations for production in line with
order volumes
Laying foundations for production in line with
order volumes
Reviewing profit structure (overseas local capabilities/
reliance on exports)
Reviewing profit structure (overseas local capabilities/
reliance on exports)
Positioning TS
TEC
H in the leading pack
once the market recovers
Responding to shift in demand towards compact vehicles
Sales expansion initiatives
Targeting new markets
1
2

19All Rights Reserved. Copyright TS TECH CO.,LTD.
(1) Responding to the shift towards compact vehicles

20All Rights Reserved. Copyright TS TECH CO.,LTD.
Source: Compiled by TS TECH based on data published by CSM Worldwide
Growth expected fromcompact vehicles
Breakdown of forecast growth according to vehicle category
Direction of growth in the vehicle market
Large-scale shift expected towards compact vehicles, including surge in
demand in emerging countries
2009 2015
Forecast increase in production
(Forecast)
Category A
12%
Approx. 70%
Category B
Category C
27%
29%
Others vehicles
As a percentage of forecast growth in Japan, South Korea, North America and Europe (to 2015)
(Japan, S. Korea, N. America & Europe)

21All Rights Reserved. Copyright TS TECH CO.,LTD.
Shift towards compact vehicles
Growing demand for entry-level
vehicles
Growing demand for entry-level
vehiclesChallenge for
low cost / new costChallenge for
low cost / new cost
Advantages of a global network consisting of 11 countries worldwide
Growing demand for
environmentally friendly and fuel efficient vehicles
Growing demand for
environmentally friendly and fuel efficient vehicles
Balance between safety and lightweight vehicles
Advances in safety, environmental and core technology
Responding to the shift towards compact vehicles
Worldwide
Emerging countries

22All Rights Reserved. Copyright TS TECH CO.,LTD.
Challenging for low cost / new cost
Establishment of optimum
regional vehicle
specifications
Competition from
branded models
Competition for business in emerging
countries
Creating business in low-end markets and new price ranges
[Ideal scenario]
Establishing sales, development and buying capabilities in China and Southeast Asia
Working towards ideal product specifications in line with regional needs
Harnessing global network to ensure best-price procurement
Analyzing products from component manufacturers in emerging countries
Examining specifications and quality of whole ranges of components
Expanding local procurement, including local manufacturers
Examining procurement costs
Optimum specifications
Best-price procurement
Aiming to enhance cost competitiveness and lay the foundationsto secure profit from compact vehicles

23All Rights Reserved. Copyright TS TECH CO.,LTD.
(2) Sales expansion initiatives

24All Rights Reserved. Copyright TS TECH CO.,LTD.
Sales expansion strategy
TS TECH
Strengths, core technology
Seats, interior products
Components
Harnessing products’ competitive edge as part of a sales expansion strategy focusing on component procurement
Other
Honda
Suzuki
Other auto manufacturers(overseas companies)
Other customers
Trim covers, safety apparatus, etc.
Medical sector, trains, etc.
ExpansionExpansion
ExpansionExpansion
ApplicationApplication

25All Rights Reserved. Copyright TS TECH CO.,LTD.
North AmericaEuropean & USmanufacturers
S. AmericaEuropean
manufacturers
China
AsiaEuropean & USmanufacturers
Europeanmanufacturers
SDB
SDB SDBS
Establishing new sales, development and buying capabilities (SDB)in China (Ningbo) and Southeast Asia (Bangkok)
New models, best-price procurement, sales expansion
JapanMother ship
JapanMother ship
Sales expansion strategy
European & USmanufacturers
Japanesemanufacturers
Japanesemanufacturers
Chinesemanufacturers Japanese
manufacturers

26All Rights Reserved. Copyright TS TECH CO.,LTD.
Toward year 2020

27All Rights Reserved. Copyright TS TECH CO.,LTD.
Year ending March 2011
Toward year 2020
50th anniversaryFinal year of 10th Medium-Term Management Plan
Starting to formulate a new medium-term management plan aimed to become a “100 year company”
Expanding component
sales
Targeting compact vehicles
Production capacity
Advances in
technology
Vision for 2020
Profit structure
Environment/CSR
Expand scale of operations andenhance corporate value

28All Rights Reserved. Copyright TS TECH CO.,LTD.
Toward year 2020
Toward year 2020
Positioning of 11th Medium-Term Management Plan
13th Medium-TermManagement Plan
Aiming to finalize medium- and long-term management plan before the end of 2011
12th Medium-TermManagement Plan
11th Medium-TermManagement Plan
2011 20132012
10th Medium-TermManagement Plan
20082009
2010
Becoming a “Good Quality Company”Accomplishing four key priorities
Launching initiatives aimed at establishing a new market structure
Three years to lay foundations for 2020Advances in core technology/enhancing
component competitiveness
9th Medium-TermManagement Plan
8th Medium-TermManagement Plan
2010 VisionGood Quality Company
Achieving global top-level quality

29All Rights Reserved. Copyright TS TECH CO.,LTD.
Outline Toshio Komeji, President
- Business overview and results outline for FY2010 (April 1, 2009 – March 31, 2010)- Outline of forecast for FY2011 (April 1, 2010 – March 31, 2011)- Direction of the company’s future growth strategy
Detail Akira Nemoto, Managing Director & Executive General Manager of theCorporate Administration Division
- Consolidated results for FY2010 (April 1, 2009 – March 31, 2010)- Consolidated forecast for FY2011 (April 1, 2010 – March 31, 2011)
30All Rights Reserved. Copyright TS TECH CO.,LTD.
Consolidated results for FY2010 (April 1, 2009 – March 31, 2010)

31All Rights Reserved. Copyright TS TECH CO.,LTD.
Outline of consolidated results for FY2010Results compared to FY2009 / results compared to revised forecast (Jan 29)
(Unit: Million yen)
FY2010FY2009 (actual) Revised forecast (Jan 29) Actual results
Year-on-year Difference from forecast
Net sales 404,761 314,800 317,990 - 21.4% + 1.0%
Operating income 16,093 8,900 9,598 - 40.4% + 7.9%
Ordinary income 14,962 10,500 11,436 - 23.6% + 8.9%
Net income 4,741 4,700 6,328 + 33.5% + 34.6%
Capital investment 13,547 8,700 8,382 - 38.1% - 3.7%
Depreciation 10,067 11,000 11,038 + 9.6% + 0.3%
R&D expenses 10,874 9,430 9,617 - 11.6% + 2.0%
USDFull year average
¥100.59Full year average
¥92.00Full year average
¥92.88Exchange rates
CNYFull year average
¥14.88Full year average
¥13.70Full year average
¥13.70
Cash dividends per share ¥22 ¥18 (¥20)
Year-on-year[Net sales]- Decline in revenue due to substantial decline in order volumes, particularly
in Japan and other regions- Decline in revenue to due exchange rates
[Operating income/ordinary income/net income]- Increase in income due to reduced costs and savings on expenses- Decline in income due to decline in revenue- Increase in income due to corporate tax refund for previous fiscal year, etc.
Compared to revised forecast (Jan 29)[Net sales]- Increase in revenue due to exchange rates- Increase in revenue due to changes to model makeup
[Operating income/ordinary income/net income]- Increase in income due to increase in revenue- Increase in income due to savings on expenses- Increase in income due to corporate tax refund for previous year, etc.
* Cash dividends per share in brackets based on projected figures

32All Rights Reserved. Copyright TS TECH CO.,LTD.
(Unit: Million yen)
Net sales according to segmentResults compared to FY2009
Revenue down across all segments
2009年3月期 2010年3月期
393,664
3,3107,786
- 2,405(Down 30.9%)
- 83,368(Down 21.2%)
404,761
317,990
310,295
2,3135,380
Other0.8%
Motorcycles1.9%
Automobiles97.3%
- 996(Down 30.1%)
FY2009 FY2010
Motorcycles1.7%
Automobiles97.6%
Other0.7%
33All Rights Reserved. Copyright TS TECH CO.,LTD.
(Unit: Million yen)
2009年3月期 2010年3月期
328,605
27,498
6,660
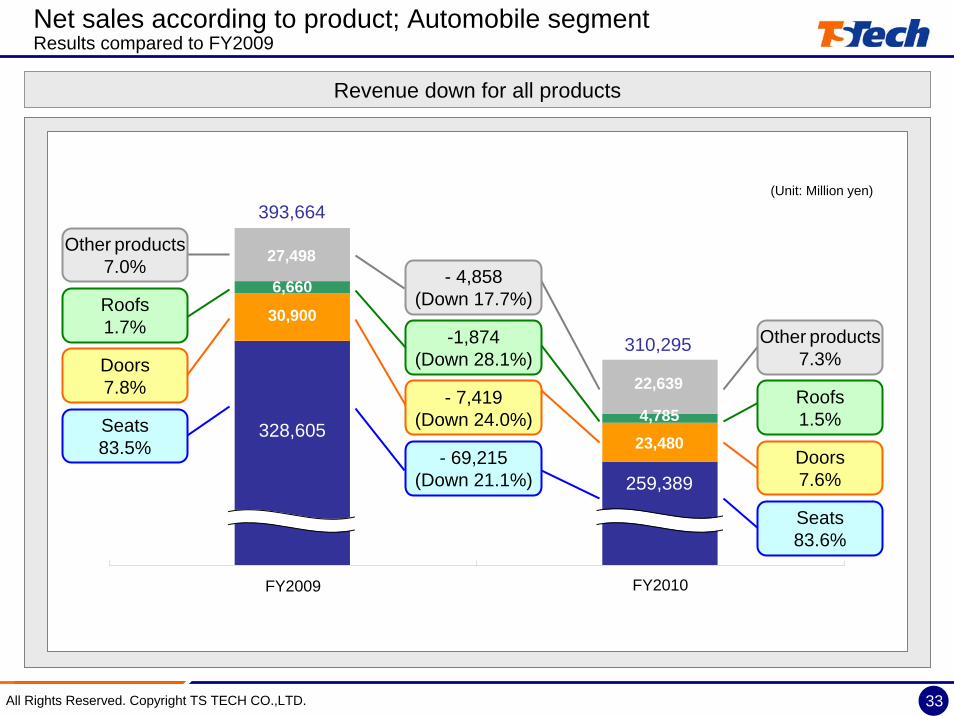
Net sales according to product; Automobile segmentResults compared to FY2009
393,664
Revenue down for all products
30,900
259,389
22,639
4,785
310,295
23,480
Other products7.0%
Seats83.5%
Doors7.8%
Roofs1.7%
- 69,215(Down 21.1%)
- 7,419(Down 24.0%)
-1,874(Down 28.1%)
- 4,858(Down 17.7%)
Other products7.3%
Seats83.6%
Doors7.6%
Roofs1.5%
FY2010FY2009

34All Rights Reserved. Copyright TS TECH CO.,LTD.
Results according to region (net sales)
JapanJapan
(Actual)FY2009(Actual)
Reasons for year-on-year increase/decrease- Decline in revenue due to decline in order
volumes- Decline in revenue due to decline in sales of
components supplied from Japan
Reasons for increase/decrease compared to revised forecast (Jan 29)- Increase in revenue due to changes to
model makeup, despite decline in order volumesFY2010
Year-on-year - 34,249 (down 23.7%)Revised forecast (Jan 29)
+ 2,027 (up 1.9%)
ChinaChina
Reasons for year-on-year increase/decrease- Increase in revenue due to increased order
volumes- Decline in revenue due to exchange rates
Reasons for increase/decrease compared to revised forecast (Jan 29)- Adjustments for consolidation (exclusion of
internal transactions)
Exchange rate impactYear-on-year - ¥6,228 millionRevised forecast (Jan 29) + ¥0 million
Year-on year - 980 (down 1.4%)Revised forecast (Jan 29)
- 22 (down 0.0%)
North AmericaNorth America
Reasons for year-on-year increase/decrease- Decline in revenue due to exchange rates- Decline in revenue due to changes to
model makeup
Reasons for increase/decrease compared to revised forecast (Jan 29)- Increase in revenue due to exchange rates- Increase in revenue to due changes to
model makeup, despite decline in order volumes
Exchange rate impactYear-on-year - ¥9,436 millionRevised forecast (Jan 29) + ¥1,021 million
Year-on-year - 19,283 (down 14.1%)Revised forecast (Jan 29)
+ 1,843 (up 1.6%)
Reasons for year-on-year increase/decrease- Suspension of production in UK subsidiary- Decline in revenue due to overall decline in
order volumes
Reasons for increase/decrease compared to revised forecast (Jan 29)- Increase in revenue due to exchange rates- Decline in revenue due to decline in order
volumes
Exchange rate impactYear-on-year - ¥8,596 millionRevised forecast (Jan 29) + ¥156 million
Year-on-year - 34,475 (down 42.5%)Revised forecast (Jan 29)
- 29 (down 0.1%)
67,978 67,020 66,997
46,62046,650
81,095
108,180
144,457
110,207
137,177
116,050 117,893
(Jan 29forecast)
(Actual)FY2009(Actual)
FY2010(Jan 29
forecast) (Actual)FY2009(Actual)
FY2010(Jan 29
forecast)
(Actual)FY2009(Actual)
FY2010(Jan 29
forecast)
OthersOthers
(Million yen)
(Million yen)
(Million yen)
(Million yen)

35All Rights Reserved. Copyright TS TECH CO.,LTD.
Results according to region (operating income)
JapanJapan
Reasons for year-on-year increase/decrease- Decline in income due to decline in revenue- Increase in income due to reduced costs
and savings on expenses- Increase in income due to material costs
Reasons for increase/decrease compared to revised forecast (Jan 29)- Increase in income due to increase in
revenue- Increase in income due to savings on
expenses
Year-on-year + 61 (up 10.5%)Revised forecast (Jan 29) + 741 (-)
ChinaChina
Reasons for year-on-year increase/decrease- Decline in income due to exchange rates- Increase in income due to reduced costs
and savings on expenses
Reasons for increase/decrease compared to revised forecast (Jan 29)- Adjustments for consolidation (adjustments
to internal transactions)
Exchange rate impactYear-on-year - ¥839 millionRevised forecast (Jan 29) + ¥0 million
Year-on-year + 900 (up 11.4%)Revised forecast (Jan 29)
- 8 (down 0.1%)
North AmericaNorth America
Reasons for year-on-year increase/decrease- Decline in income due to decline in revenue- Increase in income due to reduced costs
and savings on expenses
Reasons for increase/decrease compared to revised forecast (Jan 29)- Increase in income due to increase in
revenue- Increase in income due to savings on
expenses
Exchange rate impactYear-on-year + ¥74 millionRevised forecast (Jan 29) + ¥24 million
Year-on-year + 1,063 (-)Revised forecast (Jan 29) + 41 (-)
OthersOthers
Reasons for year-on-year increase/decrease- Decline in income due to decline in revenue- Decline in income due to increased
expenses as a result of suspension of production in UK subsidiary
Reasons for increase/decrease compared to revised forecast (Jan 29)- Adjustments for consolidation (adjustments
to internal transactions)- Decline in income due to decline in revenue
Exchange rate impactYear-on-year - ¥473 millionRevised forecast (Jan 29) - ¥4 million
Year-on-year - 8,491 (down 71.5%)Revised forecast (Jan 29)
- 160 (down 4.5%)7,890
8,800 8,791
3,540
11,871
- 100580 641
- 1,422 - 400 - 358
3,379
(Actual)FY2009(Actual)
FY2010(Jan 29
forecast)
(Actual)FY2009(Actual)
FY2010(Jan 29
forecast) (Actual)FY2009(Actual)
FY2010(Jan 29
forecast)
(Actual)FY2009(Actual)
FY2010(Jan 29
forecast)
(Million yen)
(Million yen)
(Million yen)
(Million yen)

36All Rights Reserved. Copyright TS TECH CO.,LTD.
Reasons for increase/decrease in ordinary incomeResults compared to FY2009
2008年3月期 2009年3月期
- 3,526 (down 23.6%)
14,962
Reduced costs
3,546
Fluctuating sales & changes to
model makeup
- 12,333Other non-operating
factors
- 85
11,436
Reduced SG&A
expenses
1,866
Exchange rates
- 1,238
Fluctuating material costs
1,663Foreign
exchangegains & losses
3,054
Decline in income due to substantial decline in revenue, despite reduced costs and savings on expenses
(Unit: Million yen)
FY2009(Actual)
FY2010(Actual)

37All Rights Reserved. Copyright TS TECH CO.,LTD.
(Unit: Million yen)
Increase in income due to factors such as changes to model makeup, despite a decline in order volumes
Reasons for increase/decrease in ordinary incomeResults compared to revised forecast (Jan 29)
+ 936 (up 8.9%)
Fluctuating sales & changes to
model makeup
936
Reduced SG&A
expenses
49
Exchange rates
19
Other non-operating
factors
118
14,962
11,436
Fluctuating material costs
- 82
Foreign exchange
gains & losses
118
FY2009(Actual)
FY2010(Revised forecast
(Jan 29))
FY2010(Actual)
10,500
Reducedcosts
- 224

38All Rights Reserved. Copyright TS TECH CO.,LTD.
Net salesNet sales
Quarterly results
Operating incomeOperating income
91,15686,702
109,999 110,955 109,341
74,464
65,575
74,556
1Q 2Q 3Q 4Q 1Q 2Q 3Q 4Q
(Million yen)
FY2009 FY2010
4,1084,420
5,651
4,696
1,481
- 613
1,015
4,729
1Q 2Q 3Q 4Q 1Q 2Q 3Q 4Q
FY2009 FY2010
(Million yen)
- 36,399(Down 32.8%)
- 44,424(Down 40.4%)
- 3,215(Down 68.5%)
- 6,264(-)
- 22,639(Down 20.7%)
- 308(Down 6.5%)
+ 16,691(Up 22.4%)
+ 3,092(Up 304.5%)

39All Rights Reserved. Copyright TS TECH CO.,LTD.
Consolidated forecast for FY2011 (April 1, 2010 – March 31, 2011)

40All Rights Reserved. Copyright TS TECH CO.,LTD.
Outline of consolidated forecast for FY2011Forecast compared to results for FY2010
(Unit: Million yen)
FY2010 (actual) FY2011 (forecast)Sales ratio Sales ratio
Difference Year-on-year
Net sales 317,990 100.0% 366,600 100.0% + 48,609 + 15.3%
Operating income 9,598 3.0% 17,500 4.8% + 7,901 + 82.3%
Ordinary income 11,436 3.6% 19,000 5.2% + 7,563 + 66.1%
Net income 6,328 2.0% 10,200 2.8% + 3,871 + 61.2%
Capital investment 8,382 9,700 + 1,317 + 15.7%
Depreciation 11,038 9,970 - 1,068 - 9.7%
R&D expenses 9,617 8,760 - 857 - 8.9%
Exchange rates(full year averages) USD: ¥92.88 CNY: ¥13.70 USD: ¥90 CNY: ¥13.2
1st half (actual) 2nd half (actual) 1st half (forecast) 2nd half (forecast)
Net sales 140,131 177,858 184,500 182,100
Operating income 886 8,712 8,800 8,700
Ordinary income 1,722 9,713 9,600 9,400
Net income 1,194 5,133 5,000 5,200
[Net sales]- Increase in revenue due to increased order volumes in all regions
[Operating income/ordinary income/net income]- Increase in income due to increase in revenue- Increase in income due to efforts to reduce costs
[Main capital investments]- Acquisition of land at Saitama Plant- Acquisition of machinery and dies for new models

41All Rights Reserved. Copyright TS TECH CO.,LTD.
Forecast according to region (net sales)
JapanJapan
Year-on-year + 12,012 (up 10.9%)
(Million yen)
ChinaChina
Year-on-year + 12,242 (up 18.3%)
(Million yen)
North AmericaNorth America
Year-on-year + 15,726 (up 13.3%)
(Million yen)
OthersOthers
Year-on-year + 11,389 (up 24.4%)
(Million yen)
110,207122,220
66,99779,240
46,62058,010
Reasons for year-on-year increase/decrease- Decline in revenue due to exchange
rates- Increase in revenue due to increase in
order volumes
Exchange rate impact- ¥3,011 million
Reasons for year-on-year increase/decrease- Decline in revenue due to exchange
rates- Increase in revenue due to increase in
order volumes- Full year operations in UK subsidiary
Exchange rate impact- ¥842 millionFY2011
(Forecast)FY2010(Actual)
117,893133,620
Reasons for year-on-year increase/decrease- Increase in revenue due to increase in
order volumes- Increase in revenue due to increase in
sales of components supplied from Japan
Reasons for year-on-year increase/decrease- Decline in revenue due to exchange
rates- Increase in revenue due to increase in
order volumes
Exchange rate impact- ¥4,200 million
FY2011(Forecast)
FY2010(Actual)
FY2011(Forecast)
FY2010(Actual)
FY2010(Actual)
FY2011(Forecast)

42All Rights Reserved. Copyright TS TECH CO.,LTD.
Forecast according to region (operating income)
JapanJapan
Year-on-year + 2,818 (up 439.1%)
(Million yen)
ChinaChina
Year-on-year + 1,178 (up 13.4%)
(Million yen)
North AmericaNorth America
Year-on-year + 2,888 (-)
(Million yen)
OthersOthers
Year-on-year + 2,040 (up 60.4%)
(Million yen)
641
3,460
2009年3月期 2010年3月期
8,7919,970
3,379
5,420
Reasons for year-on-year increase/decrease- Decline in income due to material costs- Decline in income due to exchange
rates- Increase in income due to increase in
revenue- Increase in income due to efforts to
reduce costs
Exchange rate impact- ¥360 million
Reasons for year-on-year increase/decrease- Increase in income due to increase in
revenue- Full year operations in UK subsidiary
Exchange rate impact+ ¥53 million
FY2011(Forecast)
FY2010(Actual)
- 358
2,530
Reasons for year-on-year increase/decrease- Decline in income due to material
costs- Increase in income due to increase in
revenue- Increase in income due to efforts to
reduce costs
Reasons for year-on-year increase/decrease- Increase in income due to increase in
revenue- Increase in income due to efforts to
reduce costs
Exchange rate impact- ¥38 million
FY2011(Forecast)
FY2010(Actual)
FY2011(Forecast)
FY2010(Actual)
FY2010(Actual)
FY2011(Forecast)

43All Rights Reserved. Copyright TS TECH CO.,LTD.
Reasons for increase/decrease in ordinary incomeForecast compared to FY2010
009年3月期 実績 2010年3月期見通
Fluctuating sales & changes to
model makeup
7,576 Increased SG&A
expenses
- 2,013
Exchange rates
- 344Other non-operating
factors
- 97
Reduced costs
3,144
+ 7,563 (up 66.1%)
11,436
19,000Fluctuating
material costs
- 460Foreign
exchange gains & losses
- 240
(Unit: Million yen)
FY2011(Forecast)
FY2010(Actual)
Increase in income as a result of increased revenue and efforts to reduce costs
44All Rights Reserved. Copyright TS TECH CO.,LTD.
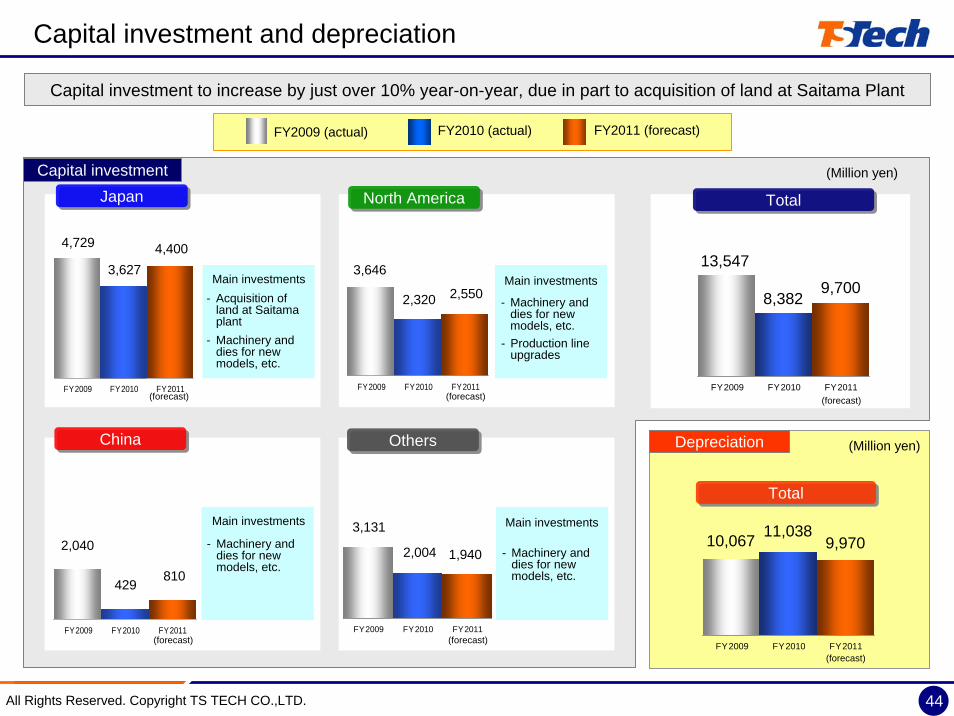
Capital investment and depreciation
FY2009 FY2010 FY2011 FY2009 FY2010 FY2011
JapanJapan
ChinaChina
TotalTotal
Capital investment
FY2009 (actual) FY2010 (actual) FY2011 (forecast)
(Million yen)
Capital investment to increase by just over 10% year-on-year, due in part to acquisition of land at Saitama Plant
FY2009 FY2010 FY2011
3,646
2,320
13,547
8,382
10,067 11,038
2,550 9,700
9,970
Depreciation
FY2009 FY2010 FY2011FY2009 FY2010 FY2011
FY2009 FY2010 FY2011
North AmericaNorth America
4,729 4,400
2,040
429810
OthersOthers
3,131
2,004 1,940
TotalTotal
(Million yen)
3,627Main investments
- Acquisition of land at Saitama plant
- Machinery and dies for new models, etc.
- Production line upgrades
Main investments
Main investmentsMain investments
- Machinery and dies for new models, etc.
- Machinery and dies for new models, etc.
- Machinery and dies for new models, etc.
(forecast) (forecast) (forecast)
(forecast)
(forecast)(forecast)

45All Rights Reserved. Copyright TS TECH CO.,LTD.
IR inquiriesTS TECH Co., Ltd. Public Relations Section.
Corporate Social Responsibility Office.048-462-1136
Forward-looking statements and forecast results contained in this presentation represent TS TECH’s assumptions based on information currently available and are subject to a degree of risk and uncertainty. Please bear in mind that actual results may vary significantly from the forward-looking statements contained in this presentation due to a range of variable factors.
Thank you for listening