lesotho four towns water supply project project …
TRANSCRIPT
LESOTHO
FOUR TOWNS WATER SUPPLY PROJECT
PROJECT COMPLETION REPORT
AFRICAN DEVELOPMENT FUND

TABLES OF CONTENTS
Page1. INTRODUCTION
1.1. General 11.2. Sources of Information 11.3. Project Area 11.4. Water Supply and Sanitation Sector 2
2. PROJECT IDENTIFICATION, PREPARATION AND APPRAISAL2.1. Origin 62.2. Preparation, Appraisal, Negotiation and Approval 62.3. Project’s Role in Long Term Plan 72.4. Project Description 72.5. Covenants 7
3. PROJECT IMPLEMENATION AND COST3.1. Loan Effectiveness and Project Start-up 83.2. Revisions 93.3. Implementation Schedule 103.4. Procurement 113.5. Project Cost, Financing Source and Disbursements 123.6. Performance of Parties Involved in the Project 14
4. OPERATING PERFORMANCE4.1. Assessment of Services Rendered 184.2. Market 194.3. Project’s Role 204.4. Project Spin-offs 20
5. FINANCIAL PERFORMANCE5.1. Financial Results 215.2. Analysis of Capital Structure 225.3. Financial Projections 225.4. Rates of Return 22
6. INSTITUTIONAL PERFORMANCE6.1. Legal and Institutional Framework 236.2. Management and Organizational Effectiveness 236.3. Staff and Training 246.4. Tariffs, Billing and Collection 256.5 Accounting and Audit 27
7. CONCLUSIONS7.1. Project Achievements 287.2. Lessons Learnt 297.3. Recommendations 30


ANNEXES
1. Map of Lesotho showing the project areas2. Details Description of Components Executed under the Project3. Implementation Schedule4. Detail Project Cost Estimate5. Disbursement Schedule6. WSB & WASA’s Financial Statements and Balance Sheet for the Period
ended 31 March 1989/90 – 1993/94.7. Projected Financial Statements and Balance Sheets for the Period ending
31 March 1994/95 – 1998/99.8. WSB & WASA’s Organisational Charts9. WASA’s Water Tariffs
FINANCIAL YEAR
April 1 to March 31
----------------------------------------------------------------------------------------------------------This report has been prepared by Mr. Habte-Selassie W.T., Water/Sanitary Engineer and Mr. Y. Zhai,Public Utilities Economist, following their mission to Lesotho in June 1994.


EQUIVALENTS, MEASURES AND ABBREVIATIONSCURRENCY EQUIVALENT
Currenty Unit = MALOTI (M)1 Maloti = 100 Licente1 UA = M 1.24856 (At Appraisal)1 UA = M 4.91514 (2nd quarter of 1994)1 UA = USD 1.41260 (2nd quarter of 1994)1 UA = USD 1.09224 (At Appraisal)
MEASURES
1 pcd = litres per capita per day1/sec = litres per secondm = metrem3 = cubic metrem3/d = cubic meters per daymm = millimetrekm = kilometre
ACRONYMS and ABBREVIATIONS
AC = Asbestos CementADB = African Development BankADF = African Development FundDWA = Department of Water AffairsF.C. = Foreign Exchange CostEHS = Environmental Health SectionFUA = Fund Unit of AccountsGOL = Government of LesothoICB = International Competitive BiddingL.C. = Local CostKfW = Kreditanstalt fur WiedweraufbauLHDA = Lesotho Highlands Development AuthorityMCRD = Ministry of Cooperation and Rural DevelopmentMFEPMD = Ministry of Finance, Economic Planning and
Manpower DevelopmentMICARD = Ministry of Interior and Chieftainship AffairsMHSW = Ministry of Healt and Social WelfareMNR = Ministry of Natural ResourcesMOI = Ministry of InteriorNORAD = Norwegian Aid for DevelopmentNRSC = National Rural Sanitation CoordinatorNRSP = National Rural Sanitation ProgramOPEC = Organization of Petroleum Exporting CountriesuPVC = un-plasticized Polyvinyl ChlorideRSU = Rural Sanitation UnitUA = Units of AccountsUSIT = Urban Sanitation Improvement TeamVIP = Ventilated Improved TeamVWSS = Village Water Supply SectionWASA = Water and Sewerage AuthorityWEMIN = Ministry of Water, Energy and MinesWSB = Water and Sewerage Branch

BASIC DATA SHEET
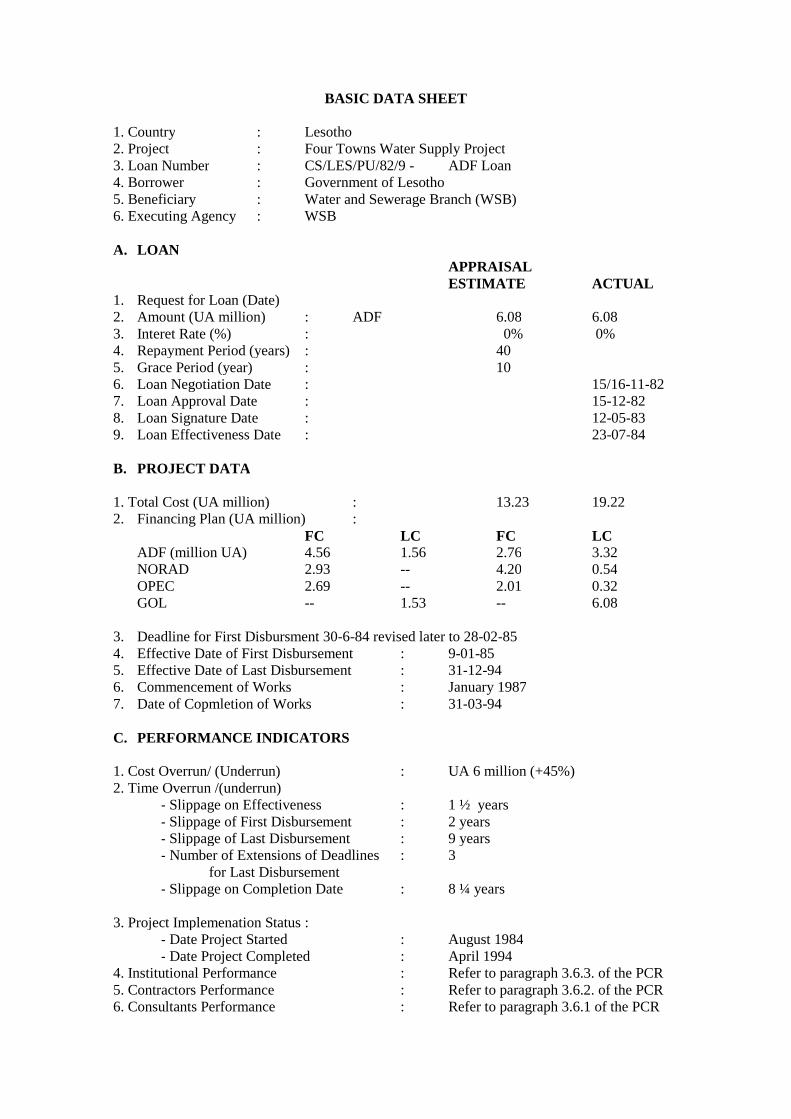
1. Country : Lesotho2. Project : Four Towns Water Supply Project3. Loan Number : CS/LES/PU/82/9 - ADF Loan4. Borrower : Government of Lesotho5. Beneficiary : Water and Sewerage Branch (WSB)6. Executing Agency : WSB
A. LOANAPPRAISALESTIMATE ACTUAL
1. Request for Loan (Date)2. Amount (UA million) : ADF 6.08 6.083. Interet Rate (%) : 0% 0%4. Repayment Period (years) : 405. Grace Period (year) : 106. Loan Negotiation Date : 15/16-11-827. Loan Approval Date : 15-12-828. Loan Signature Date : 12-05-839. Loan Effectiveness Date : 23-07-84
B. PROJECT DATA
1. Total Cost (UA million) : 13.23 19.222. Financing Plan (UA million) :
FC LC FC LCADF (million UA) 4.56 1.56 2.76 3.32NORAD 2.93 -- 4.20 0.54OPEC 2.69 -- 2.01 0.32GOL -- 1.53 -- 6.08
3. Deadline for First Disbursment 30-6-84 revised later to 28-02-854. Effective Date of First Disbursement : 9-01-855. Effective Date of Last Disbursement : 31-12-946. Commencement of Works : January 19877. Date of Copmletion of Works : 31-03-94
C. PERFORMANCE INDICATORS
1. Cost Overrun/ (Underrun) : UA 6 million (+45%)2. Time Overrun /(underrun)
- Slippage on Effectiveness : 1 ½ years- Slippage of First Disbursement : 2 years- Slippage of Last Disbursement : 9 years- Number of Extensions of Deadlines : 3
for Last Disbursement- Slippage on Completion Date : 8 ¼ years
3. Project Implemenation Status :- Date Project Started : August 1984- Date Project Completed : April 1994
4. Institutional Performance : Refer to paragraph 3.6.3. of the PCR5. Contractors Performance : Refer to paragraph 3.6.2. of the PCR6. Consultants Performance : Refer to paragraph 3.6.1 of the PCR
ii
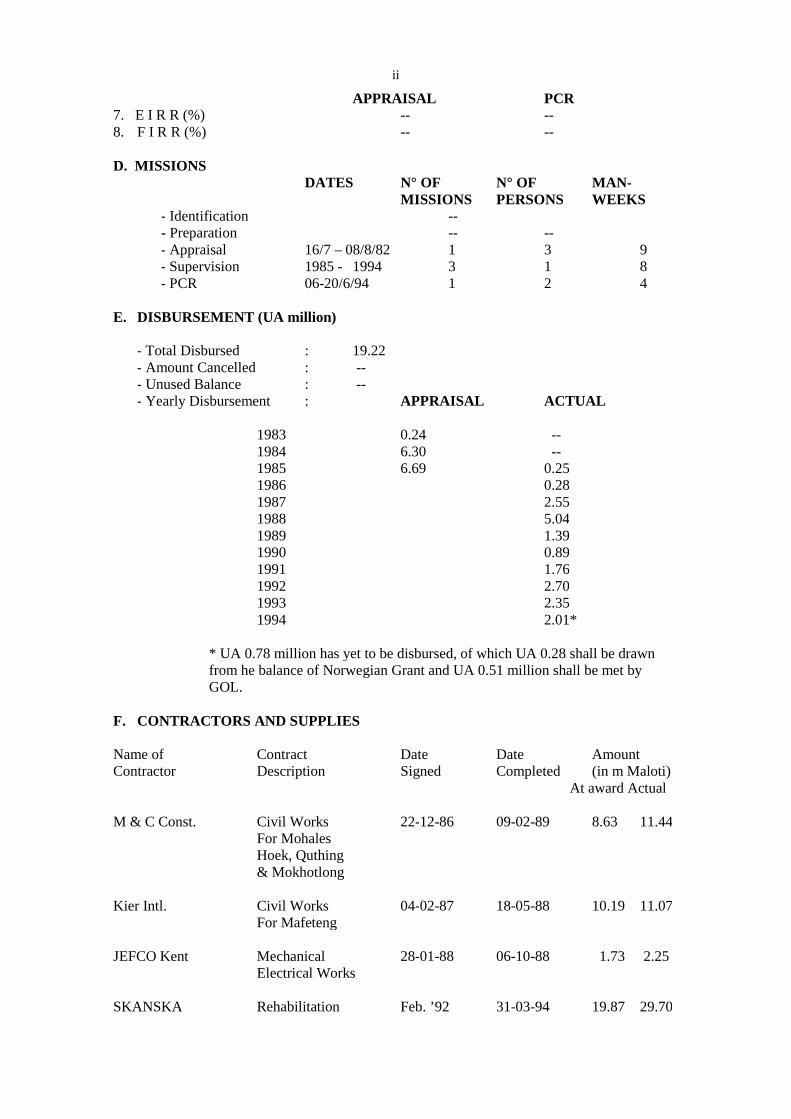
APPRAISAL PCR7. E I R R (%) -- --8. F I R R (%) -- --
D. MISSIONSDATES N° OF N° OF MAN-
MISSIONS PERSONS WEEKS- Identification --- Preparation -- --- Appraisal 16/7 – 08/8/82 1 3 9- Supervision 1985 - 1994 3 1 8- PCR 06-20/6/94 1 2 4
E. DISBURSEMENT (UA million)
- Total Disbursed : 19.22- Amount Cancelled : --- Unused Balance : --- Yearly Disbursement : APPRAISAL ACTUAL
1983 0.24 --1984 6.30 --1985 6.69 0.251986 0.281987 2.551988 5.041989 1.391990 0.891991 1.761992 2.701993 2.351994 2.01*
* UA 0.78 million has yet to be disbursed, of which UA 0.28 shall be drawnfrom he balance of Norwegian Grant and UA 0.51 million shall be met byGOL.
F. CONTRACTORS AND SUPPLIES
Name of Contract Date Date AmountContractor Description Signed Completed (in m Maloti)
At award Actual
M & C Const. Civil Works 22-12-86 09-02-89 8.63 11.44For MohalesHoek, Quthing& Mokhotlong
Kier Intl. Civil Works 04-02-87 18-05-88 10.19 11.07For Mafeteng
JEFCO Kent Mechanical 28-01-88 06-10-88 1.73 2.25Electrical Works
SKANSKA Rehabilitation Feb. ’92 31-03-94 19.87 29.70

iii
G. CONSULTANT
Name Date Date Duration ContractContract Contract (Years) AmountSigned Completed (UA) million)
Nicholas 23-8-84 31-12-88 4.3 1.57
Lahmeyer Int. 01-12-89 31-03-94 4.5 1.67
H. PROJECT IMPLEMENTATION UNIT
Revenue Accountant 13-06-88 30-06-92 4.0 0.12Supply Officer 15-06-88 30-06-90 2.0 0.06Project Engineer 13-06-88 30-06-91 3.0 0.10
I. OTHER BANK GROUP FINANCED PROJECTS IN THE WATERSUPPLY AND SANITATION SECTOR IN LESOTHO
Name of Project Loan n° Amount Approval Completion(mill. UA) Date Date
Maseru WaterSupply Phase I CS/LES/PU/77/4 5.75 (ADF) 27-6-77 Dec.’83
Maseru Water CS/LES/PU(W)/85/005 6.6 (ADB)Supply Phase II CS.LES/PU (W)/85/117 7.38(ADF) 28-08-85 Dec ‘93


1. INTRODUCTION
1.1. GENERAL
1.1.1. The main objective of the project as stated in the appraisal report was toaugment the capacity of water sources, treatment plants, transmission mains, and storagefacilities and extend the water distribution network to needy communities in Mafeteng,Mohale’s Hoek, Mokhotlong and Quthing in order to meet their water demands up to the year2000. It was also envisaged to improve the operational of efficiency of water and SewerageBranch (WSB) through the provision vehicles, workshop, communication & accountingequipment, and Technical Assistants.
1.1.2. The Project was appraised in July/August 1982 and the loan became effectivetwo years later in July 1984. It was envisaged at appraisal that the implementation of theproject would start by the beginning of 1983 with the review of designs and tender documents.It was also envisaged that physical execution of the Project would commence by the beginningof 1984 and completed two years later, at the end of 1985.
1.1.3. The construction works were prepared in three contract packages and allcontracts were awarded during the period 1987/88. Except the water supply scheme forMafeteng all contracts were completed by mid- 1988 and have been giving services since then.Mafeteng water supply scheme was also nearly completed by the beginning of 1988, butunfortunately the newly constructed dam collapsed in February 1988 during the first filling ofthe reservoir. It was established that design error was the main cause for the failure of the dam.A new consultant was therefore recruited to re-design and supervise the rehabilitation works,and subsequently rehabilitation works were started at the beginning of 1992 and completed inApril 1994. The Treatment Plant and other components of the Mafeteng water supply systemwhich were left idle for almost six years were also rehabilitated. Mainly as a result of thefailure of Mafeteng Dam the Project took 10 years to complete.
1.2 SOURCES OF INFORMATION
This report is based on the information obtained from the project files in the Bankincluding the appraisal report, loan agreement document, progress reports and variouscorrespondences on the project. This was supplemented by the information obtained from theexecuting agency, the consultants, and contractors during the discussions which were held withthe Bank’s PCR mission in June 1994.
1.3. PROJECT AREA
1.3.1. The Project areas include the towns of Mafeteng, Mohale’s Hoek, Quthing andMokhotlong. Each town is the main administrative centre of the respective district and maincommercial centre. Major regional institutions such as hospitals, schools, and missions are alsolocted there. Mafeteng in situated 80Km south of Maseru, in the Westen lowlands at an altitudeof some 1,700 metres Mohale’s Hoek is situated some 45 km further in the south west ofLesotho’s western lowlands at the base of steep sided hills. The town is situated about 7 kmeast of the Makhaleng River. Quthing is situated 180 km south of Maseru in the south westerncorner of Lesotho in a mountaines region about 5 km south of the Sengu (Orange) River.Mokhotlong is situated 270 km from Maseru in the east part of the country at the foot of theDrakansburg Mountain range. The town has an average altitude of about 2,250 metres. Forlocation of Project area refer to Annexe 1.
2
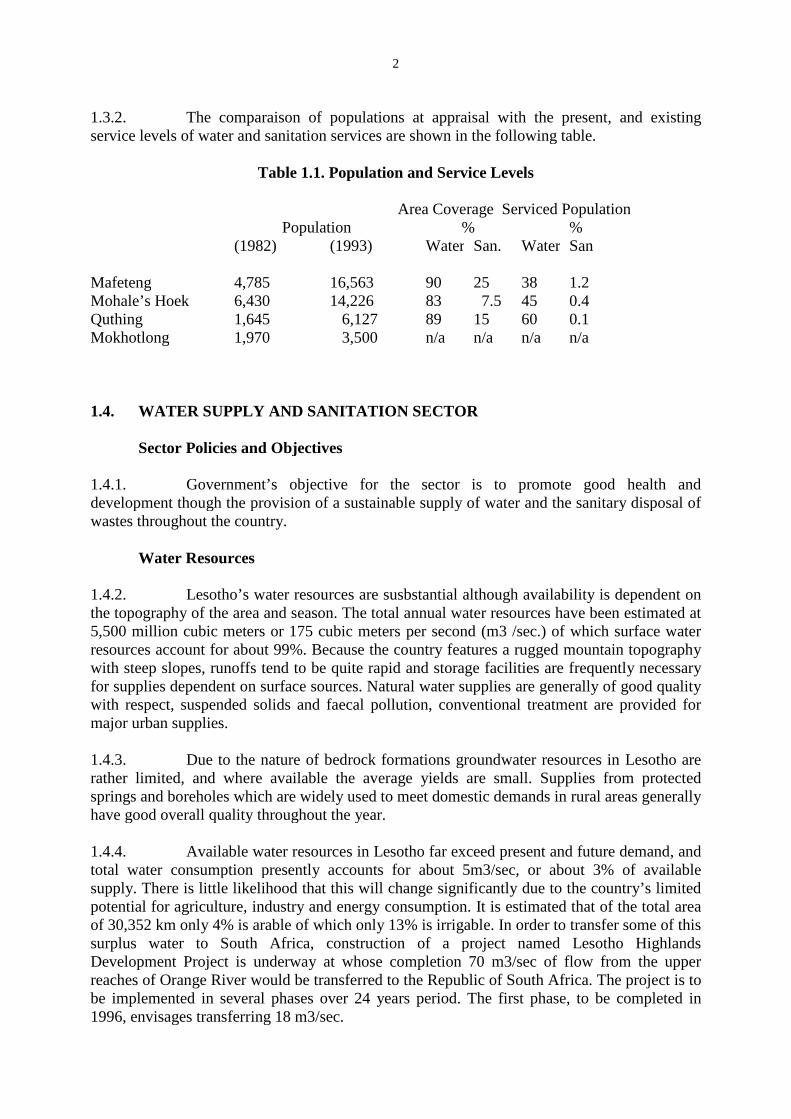
1.3.2. The comparaison of populations at appraisal with the present, and existingservice levels of water and sanitation services are shown in the following table.
Table 1.1. Population and Service Levels
Area Coverage Serviced PopulationPopulation % %
(1982) (1993) Water San. Water San
Mafeteng 4,785 16,563 90 25 38 1.2Mohale’s Hoek 6,430 14,226 83 7.5 45 0.4Quthing 1,645 6,127 89 15 60 0.1Mokhotlong 1,970 3,500 n/a n/a n/a n/a
1.4. WATER SUPPLY AND SANITATION SECTOR
Sector Policies and Objectives
1.4.1. Government’s objective for the sector is to promote good health anddevelopment though the provision of a sustainable supply of water and the sanitary disposal ofwastes throughout the country.
Water Resources
1.4.2. Lesotho’s water resources are susbstantial although availability is dependent onthe topography of the area and season. The total annual water resources have been estimated at5,500 million cubic meters or 175 cubic meters per second (m3 /sec.) of which surface waterresources account for about 99%. Because the country features a rugged mountain topographywith steep slopes, runoffs tend to be quite rapid and storage facilities are frequently necessaryfor supplies dependent on surface sources. Natural water supplies are generally of good qualitywith respect, suspended solids and faecal pollution, conventional treatment are provided formajor urban supplies.
1.4.3. Due to the nature of bedrock formations groundwater resources in Lesotho arerather limited, and where available the average yields are small. Supplies from protectedsprings and boreholes which are widely used to meet domestic demands in rural areas generallyhave good overall quality throughout the year.
1.4.4. Available water resources in Lesotho far exceed present and future demand, andtotal water consumption presently accounts for about 5m3/sec, or about 3% of availablesupply. There is little likelihood that this will change significantly due to the country’s limitedpotential for agriculture, industry and energy consumption. It is estimated that of the total areaof 30,352 km only 4% is arable of which only 13% is irrigable. In order to transfer some of thissurplus water to South Africa, construction of a project named Lesotho HighlandsDevelopment Project is underway at whose completion 70 m3/sec of flow from the upperreaches of Orange River would be transferred to the Republic of South Africa. The project is tobe implemented in several phases over 24 years period. The first phase, to be completed in1996, envisages transferring 18 m3/sec.

3
Coverage
1.4.5. An estimated 90% of the urban population (13% of total population) have safewater supply service through individual house connection and through public standpipes. In therural areas, approximately 45% have reasonable access to piped water supplies through publicstandpipes and the remaining draw water from unprotected sources. Thus as a whole, presentlyabout 52% of the population have access to safe drinking water.
1.4.6. Adequate urban sanitation in the form of water borne sewerage and VentilatedImproved Pit (VP) latrines are provided for 33% of the population of Maseru and for 19% inother urban areas. The rest of the urban population utilizes other forms of sanitation facilitiessuch as bucket latrines and unimproved pit latrines. The on-going 13 Towns Sanitation Projectinvolves provision of low cost on-site sanitation for low income communities by promotingconstruction of VIP latrines and conversion of ordinary latrines into VIPs through a revolvingfund facility is due for completion in 1995, and this is envisaged to susbtantially improve thi sscenario of serviced population. In the rural areas, 20% of the population are being served bysanitary latrines of which about one quarter are VIP latrines. Thus all in all about 21% of thepopulation of Lesotho have access to adequate sanitation facilities.
Sector Organisation
1.4.7 Five ministries are active in the sector. These include ministries of Finance,Economic Planning and Manpower Development (MFEPMD), Natural Resources (PNR),Cooperation and Rural Development (MINICARD) and Health and Social Welfare (MHSW).The first two ministries play principal roles while the three later ones play more or less asupporting role.
1.4.8. The MFEPMD is responsible for ensuring that all capital development is in thenational interest and in accordance with overall national development plans. All new projectsin the sector are therefore processed through the MFEPMD. The Water and SewerageAuthority (WASA) of MNR is the agency responsible for the provision of the water andsewerage services to the urban areas.
1.4.9. MCRD is responsible for the provision of water supplies for villages utilizingtechnical assistance and self-help labor through its Village Water Supply Section (VWSS).VWSS has also a Rural Sanitation Unit (RSU) which will augment the efforts of MHSW in theprovision of rural sanitation.
1.4.10. MSHW through its Environmental Health Section (EHS) is responsible forNational Rural Sanitation Program (NRSP) with technical support provided from the VWSS.Since its establishment in 1983 NRSP has developed into a dominant feature of EHS fieldactivity. The management of NRSP is the responsibility of National Rural SanitationCoordinator (NRSC) drawn from EHS and assisted by Chief Technical Officer in VWSS.
1.4.11. The development of improved on-site sanitation in gazetted urban areas lieswith the Urban Sanitation Improvement Team (USIT) in the MICARD. USIT was establishedas a section in MICARD in the early 1980s and successfully introduced the VentilatedImproved Pit (VIP) latrine as the most appropriate option for non-waterborne sanitation inurban Lesotho. USIT is currently implementing two major programs of promoting VIP latrinesin Maseru and in other 13 urban centers.
4
1.4.12 . In general most of the new projects in the sector are prepared by consultants andfinanced from bilateral and multilateral assistance agencies usually on grant or soft loans.Construction works, except for minor extensions and house connections, are usually carried outon contract basis.
Sector Development
1.4.13. In 1981, a National Steering Committee (NSC) for the International DrinkingWater and Sanitation Decade (IDWSSD) was formed. NSC published the first SectoralNational Action Plan in 1983 in which targets and strategies for the water supply and sanitationsector during the Decade were formulated. In order to achieve the objectives of the provision ofsafe drinking water and adequate sanitation facilities to all the population four inter-linked sub-sectoral programs have been developed : Urban Water Supply, Urban Sanitation, Rural WaterSupply, and Rural Sanitation. The targets and achievements for each of the above programsduring the Fourth Five-Year Development Plan (1987/88-1991/92) were as follows:
Table 1.1 : Coverage--------------- % coverage ------------
Target Actual1985 (1991) (1993)
Urban Water Supply 65 100 90Urban Sanitation 22 80 33Rural Water Supply 31 60 45Rural Sanitation 15 38 20
1.4.14. Total capital expenditure for the period was M 128 million. Requirements forthe current planning period are relatively modest, with the emphasis being placed on extendingexisting supply networks.
1.4.15. The institutional development has been mixed during the 1980s. Major sub-sector programs have been established, however, the institutional security for most of theseprograms except for the urban water supply and water-borne sewerage has yet to be achieved.As of the beginning of 1991, the Water and Sewerage Branch (WSB) has been transformed to aparastatal organization as Water and Sewerage Authority (WASA). This development alongwith the adoption of a full cost recovery policy for the provision of urban piped water supplyand sewerage is expected to alleviate the heavy financial burden of the Government and wouldallow WASA to resolve organizational and management problems within a somewhat moreflexible framework.
1.4.16. In order to render more effective management and streamline the accountabilityof manpower involved in VWSS and NRSP, preparations are underway to establish a fullyintegrated national water supply and sanitation agency by 1995 by formulating a revision to theinstitutions and management structures.
1.4.17. Government’s overall policy during the 5th Five Year Development Plan(1991/92 – 1995/96) is to rationalize the exploitation of water resources for substainabledevelopment and to continue the expansion of the water supply and sanitation services, withthe aim of achieving close to full coverage by the year 2000. The targets for the plan period1990-2000 are as below :

5
Table 1.2 : Projected Coverage--------------- % coverage -----------1990 1995 2000
Urban Water Supply 65 100 90Urban Sanitation 22 80 33Rural Water Supply 31 60 45Rural Sanitation 15 38 20
1.4.18. It is noted from table 1.1 that the target were not achieved during the planningperiod mainly because they were not realistic. Similarly, the targets in table 1.2 appearambitious and most likely would not be achieved unless a significant changes in the financialbase of the sector institutions are brought about.
1.4.19. Lesotho Highland Development Project: The main objective of the Project is toraise revenue for the Government of Lesotho by transferring its surplus water from thecatchment of the Senqu/Orange River to meet the growing water demands in the majorindustrial and population centres of South Africa. Through a sub-project the Project will alsobenefit Lesotho by enabling it generate its own hydro-power to reduce its dependence onimported power from South Africa. The Project will take 24 years to complete and willeventually comprise of 6 dams, 240 km of tunnels, a 274 MW hydro-electric power stations,and 278 km of new roads. The total estimated cost in 1985 value was more than Maloti 4.1Billion of which the construction of Phase 1 works, estimated to cost M 1 Billion is underway.
Constraints in the Sector
1.4.20 Manpower development has not kept pace with other aspects of the institutionaldevelopment. Most sub-sector programs continue to depend on expatriate technical assistants.Manpower problems have been exacerbated within the sector in recent years by the demand forskilled personnel and the attractive remunerations created by the establishment of the LesothoHighlands Development Authority (LHDA). Subsequently it has become very difficulty toretain any skilled and experienced personnel in the sector institutions. In the case of WASA ithad even became difficult to identify suitable candidates for training to hold seniormanagement posts. However, following its transformation into a parastatal organisation, withimproved conditions of service, it is hoped that some qualified people would be attracted to theinstitution.
1.4.21. Other constraints in the sector include the inadequacy of cost recovery measuresand shortage of capital to finance both capital works and operations and maintenance activities.

6
2. PROJECT IDENTIFICATION, PREPARATION AND APPRAISAL
2.1. ORIGIN
The Project was identified under the 12 Towns Water Supply Study which wascarried out by consultants, under KFW financing, around mid-1970s. That study wascompleted towards the beginning of 1978, and immediately after, the Government of Lesothostarted seeking external financial assistance for the implementation of the first phase works.The KFW agreed to finance the execution works for six of the centres, and the IDA approved aloan in 1979 for financing the schemes in two of the centres. Funds to finance the water supplyschemes in the last remaining centres were not obtained until the beginning of 1982.
2.2. PREPARATION, APPRAISAL, NEGOCIATION AND APPROVAL
2.2.1. During Bank’s Identification Mission in February 1982, GOL requested ADBGroup’s assistance to finance the water supply schemes in the remaining four centres. Themission in its BOR recommended the Bank to finance the proposed Project. Bank’sManagement accepted the recommendation, and subsequently without any preparation mission,an appraisal mission was launched in July 1982.
2.2.2. The appraisal mission noted that the detail designs of the project were alreadycompleted in 1978 under the 12 Towns Water Supply Study. It further noted that somecomponents such as Intakes & Reservoirs were over designed and that Asbestos Cement wasthe only specified material for all pipe lines. In order to accommodate any changes that havetaken place in the centres since the completion of the study report in 1978, the missionrecommended that both the designs and tender documents be reviewed and updated.
2.2.3. The mission estimated the Project Cost at Maloti 16.51 million (UA 13.23million), which was later adopted without any change. The mission noted that OPEC hadindicated its willingness to offer a grant of UA 2.69 million for the project in order to financethe foreign exchange cost of one of the major components, Pipelines. Accordingly thefinancing plan was prepared with OPEC’s grant, ADF loan of UA 8.76 million andGovernment contribution of UA 1.53 million. However, during the negotiation which was heldwith the Government during the period 15-16 November 1982, the Government delegationnoted that the Government of Norway was also willing to contribute UA 2.93 million as grantto finance the foreign exchange cost of the Pipelines Component. Consequently a newfinancing plan was prepared with NORAD financing Pipelines, and OPEC financing 100% ofthe F.C. for Intakes and 2% of the F.C. for Pump Stations. The ADF was to participate in allcomponents except Pipelines. This revised Financing Plan resulted in the lowering of the ADFcommitment.
2.2.4 The Loans Committee after noting the problems of recruitment of staff, tariffsand financial situation of the Executing Agency, WSB, proposed a loan condition for thetransformation of the WSB to a parastatal organization within two years from the signing of theagreement. GOL’s contribution remained the same at UA 1.53 million.
7
2.3 PROJECT’S ROLE IN THE LONG-TERM PLAN
2.3.1. Government’s long term goal in the sector is to promote good health and socio-economic development through the provision of a sustainable water supply and sanitationfacilities. Accordingly the proposed project was a continuation of the programme stated by theGovernment in the early 1970s for the general improvement of social services andinfrastructures in regional centres.
2.3.2 It was intended, under the project, to augment the capacities of raw water sourceworks, treatment plants, transmission mains, and storage facilities and extend the waterdistribution network in 4 district centres; Mafeteng, Mohale’s Hoek, Moktonglong andQuthing. After the successful completion of the project it was envisaged that the water servicesto the consumers in those 4 centres were to be substantially improved in terms of quantity andquality and about 8,000 new consumers were to benefit from the extension of the existingreticulation services. In order to enhance the operational efficiency of WSB some essentialoperational equipment as well as Technical Assistants were to be provided. All theseprovisions were therefore in line with Government’s goal for the sector.
2.4. PROJECT DESCRIPTION
2.4.1. The Project comprised of the following components :
A. Improvement of raw water intake works in all 4 centres;B. Provision of increased water treatment capacity at Mafeteng, Mokhotlong and
Quthing;C. Construction of pump houses and supply and installation of pumping
equipment;D. Construction of water storage facilities;E. Construction of water transmission and distribution pipelines inclusive of bulk
meters, flow control equipment and communal water points;F. Construction of workshops, accommodation and office buildings.G. Provision of Engineering Services for design and supervision of the above
works;H. Provisional of operational assistance comprising of vehicles, communication
and accounting equipment, and 78-man months of Technical Assistants.
2.4.2. Except for the raw water source works for Mafeteng, which was substantiallyrevised involving the construction of a dam, all other components were implemented asenvisaged at appraisal. For details of components executed under the Project refer to Annex 2.
2.5. COVENANTS
2.5.1 The covenants were as follows :
A. Conditions precedent to First Disbursement. Prior to first disbursement, the Borrowshall :
i) give an undertaking to make adequate budgetary allocations to meet its share inthe project cost;
ii) give an understaking to assume the responsibility to meet all cost overruns ofthe project;
8
iii) conclude a loan Agreement with the OPEC Fund for obtaining complementaryfunds necessary for the execution and completion of the project;
iv) give an undertaking that it will, within two years of the signature of the loanAgreement, transform WSB into a public corporate body with full juridical andfinancial autonomy.
B. Other Conditions : The Borrower shall :
i) review the existing water tariff structure with a view to allowing WSB togenerate enough revenue to cover all financial, operation and maintenance costsof the utility;
ii) recruit or assign local counterparts to understudy existing and proposedtechnical assistance staff;
iii) ensure that no local taxes, duties or levies of any kind are financed out of theresources of the loan.
3. PROJECT IMPLEMENTATION AND COST
3.1. LOAN EFFECTIVENESS AND PROJECT START-UP
3.1.1 The loan agreement was signed on 12 May 1983 and condition 2.5.1 A. (iii) wasfulfilled on 18 April 1983, ahead the signing of the loan agreement. Conditions 2.5.1 A. and A.(ii) was fulfilled on 9 March 1984. Conditions 2.5.1.A. (iv) was later revised, and the revisedcondition was fulfilled on 11 July 1984 and the Loan was declared effective soon after on 23July 1984.
3.1.2 Recruitment of Technical Assistants actually occurred in June 1988. This delaywas mainly caused by differences between the then Ministries of Water, Energy and Mining,Planning and Economic Development; and Public Services on the level of salaries that thetechnical assistants should be paid. The appointment of local counterpart was even moredelayed due to difficulty in identifying suitable candidates.
3.1.3 The adjustment of WASA’s tariff also occurred in June 1988, when tariffs wereraised to M 1.00/cu.m for domestic and other consumers respectively. At the same timesewerage tariffs were pegged at 75% and 60%, respectively, of the water bills for domestic andother consumers. WASA has subsequently adjusted tariffs in June 1991 and April 1993, withthe 1991 adjustment increasing water tariff for domestic consumers by 50% and that of otherconsumers by 100%. Only an across-the-board 4% tariff adjustment was allowed in April1993. Since then there has not been any tariff increase.
3.1.4 Notwithstanding the above tariff adjustments WASA’s tariffs are still below theauthority’s economic cost of providing water and sewerage services, especially in the districtswhich have tended to be subsidized by Maseru Water Supply. As a result, the Authority’sfinancial standing has been precarious. WASA’s financial reports show that the institution isrunning in deficit since 1992/93.

9
3.2. REVISIONS
Water Supply Source for Mafeteng
3.2.1. The water source for Mafeteng recommended in the appraisal report was anexisting Scot’s Vlei & Luma Lake reservoirs. From those sources raw water was to be pumpedto a treatment plant which was to be located near Scot’s Vlei Reservoir. From the TreatmentWorks water was to gravitate to a new clear tank from where areas which were located at ahigher level were to be supplied through 220 mm rising main. Another rising main of 100 mmdiametre was to be constructed to connect two existing boreholes. A new borehole and a newcircular reinforced concrete tank of 1050 m3 were also to be constructed under the Project.
3.2.2. During the review of design which were carried out by the consultant recruitedunder the project, it was found that the proposed raw water source from Scots Vlei Reservoirwas not the most economical, as stages of pumping were required. Besides, it was found outthat the Scots Vlei Reservoir two location was in the drainage basin of the Mafeteng Town andunless special protection was made there was a risk of pollution of the source. The consultanttherefore identified a new raw water source at a new site on the Rasebela Stream, some 4.5kmeast of the town centre. In the financial analysis which was carried out by the Consultant it wasfound out that the overall cost (capital and operating costs) of new alternative was slightlyhigher, about 7%. However because of other non-quantifiable benefits of the new source whichincluded : i) the new reservoir site was considered relatively free of pollutants as therehabilitation within the catchment was low; and (ii) its safe yield of 2100m3/d was suchbigger than the 680m3/d from the original alternative, the proposal was in favour of the source.Therefore in consultation with the Executing Agency and the Bank, in the last quarter of 1985,the new proposed source was adopted for construction.
3.2.3. The dam as designed consisted of an earthfill dam about 450 m long along thecrest and 17 m high at its deepest section. It had a side slops of l in 2.5 upstream and 1 in 2downstream. The live storage of the reservoir was 900,000 m3 and had a safe yield of 1,500m3/d. The spillway, located 2.75 m lower than the crest of the dam considered of Ogee crestweir 37 m long and had s design capacity of 110 m3/s (1: 20 year flood) at 1.5 m head. Thecontract for the construction of the dam was awarded to M/s Kier International through ICB.The contractor having obtained suitable dam fill material near its optimum moisture content inthe impoundment area accelerated the construction of the dam and all earthwork items on thedam were completed in October 1987. Unfortunately, the dam failed on February 21, 1988,during the first filling of the reservoir. It was established that the failure was caused by pipingalong the spillway wall and embankment interface in which about 10 m wide of theembankment material and the left inclined spillway retaining wall slab were breached. Theintake tower which was founded on mudstone was also undermined.
Rehabilitation of Mafeteng Dam
3.2.4. In order to alleviate the acute shortage of water in Mafeteng Town, as well toprotect the newly constructed water treatment plant and distribution systems againstdeterioration, as there was no flow passing through them, the Government initiated theRehabilitation of Mafeteng Dam. A new consultant was recruited on December 1, 1989 toreview the previous design, to recommend rehabilitation measures, and to supervise subsequentrehabilitation works. As part of its TOR the Consultant recommended the followingrehabilitation measures :
10
- sealing of foundation and up-stream side of the dam through the construction ofbentonite cut-off wall and geo-membrane respectively;
- stabilizing the up-stream side of the embankment using gypsum;- provision of drainage layers on the up-stream side underlain by geo-textile layers;- relocation and re-construction of the spillway and intake structures.
3.2.5 The rehabilitation work was financed through the utilization of the balance ofADF (US3.70 Million), Government of Norway additional contribution of UA 1.84 million,and additional contributions from GOL. The contract for the rehabilitation work was awardedon December, 1st 1991 and the total cost at completion was UA 6.96 million for constructionand UA 1.68 million for engineering services.
3.2.6. It was established that both design and construction errors had caused thefailure, and consequently the Government initiated legal actions against both the Consultantand the Contractor. The litigation process still continues.
Additional Works Under Contracts 1 & 2
3.2.7. GOL in September 1987, requested the Bank to approve the utilization of theexpected balance of project fund to extend water supply services to those areas whichdeveloped since the completion of the design works as well as to those which were proposedfor immediate development. The proposed works included : extention of distribution lines forall centres, refurbishment of treatment works in Mohale’s Hoek; provision of small dwellinghouse at the intake in Mokhotlong; miscellaneous works at Mafeteng including provision ofgravel layer to dam access road, and refurbishment of 450 m3 reservoir. At that time, the totalestimated cost of the project which was nearing completion was UA 8.84 million, leaving anenvisaged balance of US 0.66 million. The Bank therefore approved the request andsubsequently the additional works were executed as a variation order to the on-going contracts.
Provision of Project Engineer
3.2.8. To improve the operation capability of WSB, the appraisal report includedprovision of a Revenue Accountant & Supplies Officer. Later, on GOL’s request, a ProjectEngineer was also provided to monitor and coordinate the implementation of the project.
3.3 IMPLEMENTATION SCHEDULE
3.3.1. It was envisaged at appraisal that the implementation of the project would startby the beginning of 1983 with the review of designs and tender documents. It was alsoenvisaged that physical execution of the Project would commence by the beginning of 1984and completed two years later, at the end of 1985.
3.3.2. Due to the longer time taken in the recruitment of the consultant and the reviewof designs and tender documents, execution of physical works commenced at the beginning of1987, which is 3 years later than what was envisaged at Appraisal. Except the water supplyscheme for Mafeteng, all contracts were completed by mid 1988 and have been giving servicessince then. Mafeteng water supply scheme was nearly completed by the beginning of 1988when the newly constructed dam collapsed in February 1988, during the first filling of thereservoir. A new consultant was recruited to design and supervise the rehabilitation works andsubsequently rehabilitation works were started at the beginning of 1992 and completed in April1994.

11
3.3.3. The recruitment of Technical Assistants actually occurred in June 1988, aftersubstantial completion of the major portion of the Project.
3.3.4. The comparison of the actual implementation schedule with what was envisageat appraisal is shown in Annex 3.
3.4. PROCUREMENT
3.4.1 It was stated in the appraisal report that the procurement of goods and servicescovered under the proposed ADF loan will generally be subject to ICB limited to ADBmember countries and ADF state participants in accordance with procedure approved by theBank. Some minor works such as the procurement of vehicles and equipment however wouldnot be subject to ICB in view of small quantities involved.
3.4.2 For the procurement of consultancy services for design review and supervisionof construction, in order to assist the executing agency (EA) draw up short-list of consultantsfor project, the Bank on April 18, 1983 sent to the EA a list of 12 firms all of which were frommember countries of the Bank. Later, through a telex dated September 9, 1983, the EArequested the Bank to approve short-list of five firms which it stated were selected from 25applications. In the short-list, M/s Nicolas O’Dwyer (International) Limited was included. It isnoted that the firm was from Ireland, which is not a member country of the Bank. Bank’sactual response to the above telex is not available in the project file; however, from EA’s telexdated October 20, 1983 it is noted that the Bank agreed to the proposed short-list. In the sametelex the Bank recommended the inclusion of two more firms to the short-list, one of whichwas from the regional member country of the Bank, to which the EA complied with. It is notedthat subsequent selection process was carried out in accordance with Bank’s procedure. On theevaluation of Technical Proposals, Nicholas O’Dwyer was found to be one of the three BestRanked firms. Its financial proposal was also evaluated to be the Lowest. Consequently theagreement of Nicholas O’Dwyer in the short-list appears to be partly an oversight by both theEA and the Bank.
3.4.3. The construction work was prepared in three contract packages. The CivilWorks for Mohale’s Hoek, Quthing and Mokhotlong were prepared as Contrast 1. For thiscontract 12 firms collected documents and only 4 SUBSMITTED BIDS. Poor respponse wasattributed to the small size of the contract. The contract amounts ranged from M 8.63 millionto Maloti 19.93 million, while the Engineer’s estimate was Maloti 5.8 million. On therecommendation of the both the Consultant and GOL, the Bank agreed the award of thecontract to the lowest bidder. The contract was awarded on 22 December, 1986 and thecompletion date was set as 5 January 1988.
3.4.4. Contract 2 concerned Civil Works for Mafeteng. For the contract it was earlieragreed that only those contractors which submitted for Contract 1 would be allowed to tender ifthey so wish. Of the 4 contractors which tendered for Contract 1 only 3 submitted bids. The bidamounts were close and ranged from Maloti 10.19 million to Maloti 11.213 million. The bidderwhich submitted the lowest evaluated bid was awarded the contract on February 4, 1987 andthe completion date was set as March 4, 1988.
3.4.5 Contract 3 concerned the supply and installation of mechanical and electricalequipment for all schemes. Out of 5 short-lists firms which were considered to posses relevantexperiences 4 were prequalified. Later on two of the prequalified firms withdrew and tenders

12
were received only from two firms. The reasons for the poor response was attributed partly dueto scattered nature of the centres which made mobilization difficult and partly due to the risksassociated with shipping of goods and equipment to a country completely land locked by non-member country of the Bank. The evaluated tender prices were Maloti 1,732,994 and Maloti2,531,895 while Engineers estimate was Maloti 1.4 million. The firm which submitted thelowest evaluated bid was awarded the contract on January 28, 1988 and the completion datewas set as August 25, 1988.
3.4.6 Engineering Services for the Rehabilitation of Mafeteng Dam : The workincluded review of all studies on Mafeteng Dam, design of rehabilitation works, preparation oftender document, evaluation of tenders and supervision of construction. Seven firms wereshort-listed, and because of the specialized nature of the rehabilitation works none of thesewere from regional member countries. In the evaluation of consultancy proposals five werefound to be best ranked and therefore the firm which submitted the lowest evaluated financialoffer was selected.
3.4.7 Construction Works for the Rehabilitation of the Mafeteng Dam Because of thespecialized nature of the rehabilitation works it was decided to limit the tender to firms withrelevant experience. Accordingly 9 firms were short listed 2 of which were from Nordiccountries. The firm which submitted the lowest evaluated bid was awarded the contract.
3.4.8 Technical Assistants (TA) : The TAs included Special Projects Engineer,Revenue Accountant and Supplies Officer. The positions were advertised in the internationalmedia during the period July-September, 1987, and 34 responses for the Special ProjectEngineer, 7 for Revenue Accountant and 6 for the Supplies Officer were received. For eachposition 3 candidates were short listed by a panel appointed by the Government, and followinginterviews one candidate was selected for each post. All positions were filled in June 1988 fora contract period ranging from 2 to 4 years.
3.5. PROJECT COST, FINANCING SOURCE AND DISBURSEMENTS
Project Cost
3.5.1 The estimated project cost at appraisal was US 13.23 million (M 16.51 million)of which UA 10.18 million (M 12.17 million) would be in foreign exchange and the rest, UA3.05 million (M 3.80 million) in local currency. Breakdowns of cost estimate by componentsare given in Annex 4. Actual total cost of the Project is about UA 19.22 million (M 66.47million) of which UA 8.97 million (M 33.93 million) is in foreign exchange and UA 10.25million (M 32.55 million) is in local costs. Of the total cost, the cost for the Rehabilitation ofthe Mafeteng Dam accounts 45% in terms of UA, and 55% in terms of Maloti.
Sources of Finance
3.5.2 The Project was proposed to be financed by ADF, OPEC Fund, NORAD Fundand the Government’s contribution. The comparison of the Financing Plan agreed upon atappraisal with actual is as follows :

13
Table 3.1. Source of Finance(in million UA)
Original Commitment Actual constributionFinancingSource F.C. L.C. Total F.C. L.C. Total
ADF 4.56 1.52 6.08 2.76 3.32 6.08NORAD 2.93 -- 2.93 4.20 0.54 4.74OPEC 2.69 -- 2.69 2.01 0.32 2.33GOL -- 1.53 1.53 66 6.08 6.08
Total 10.18 3.05 13.23 8.97 10.25 19.22
3.5.3 As could be seen from the above table Government’s contribution increased by300% in termes of UA. Because of the devaluation of Maloti against UA over the Projectimplementation period, the percentage increase in terms of Maloti is even higher. The originalcommitment from OPEC was US$ 3 million, and their contribution was also same, however,in-terms of UA the amount decreased by 9% due to exchange rate fluctuations. ADFcontribution did not change from its original commitment whereas, the Government of Norwaymade an additional contribution of UA 1.81 million for the Rehabilitation of the MafetengDam.
Disbursements
3.5.4 According to Bank’s Summary Ledgers the amounts disbursed include : UA6.08 million from ADF loan, UA 2.33 million from OPEC Fund, and UA 4.46 million from theNorwegian Government Grant. The comparison of the actual disbursement schedule with whatwas envisaged at appraisal is shown in Annex 5.
3.5.5 The mission estimated that the balance from the Government of Norway grantfund is UA 0.28 million whereas the balance according to FDIS was about UA 0.5 million. Inorder to determine the actual balance from Norwegian Governement’s grant the meeting whichwas convened following the recommendations of the Inter-departmental Working Grouprecommended that FDIS should prepare a comprehensive report on disbursements made on therehabilitation of Mafeteng Dam by source of funds including list of Direct Payments,Reimbursements, etc. Subsequently, FDIS, in a meeting stated that the figures given by themission were correct.
3.5.6 In order to fully utilize the contribution from the Government of Norway, aswell as to realize any balances on the ADF loan only, the meeting recommended FDIS toprepare a report for reversal of all payments made from ADF loan for the full amount of theavailable balance of the contributions from the Government of Norway.
3.5.7 Since clear records of Government’s contributions are not available, the UA6.08 million shown as Government contribution has some approximation. The figures includeabout M 2.5 million (about UA 0.5 million) which the Government has to raise to pay allcommitments made on the project. This additional contribution could change if the balancefrom the Government of Norway grant fund is different from UA 0.28 million mentioned in thepreceding paragraph.

14
3.5.8 Delays and cost overruns have been incurred in the Project as a result of delaysin disbursement caused by the Bank. For further details on this issue refer to paragraph 3.6.4.
3.6 PERFORMANCE OF PARTIES INVOLVED IN THE PROJECT
3.6.1. Consultants
i) Nicholas O’Dwyer and Partners
The performance of the consultant which was recruited earlier to review designs andtender documents as well as to supervise constructions for all schemes wasunsatisfactory due to the following reasons :
- Mafeteng Dam failed during the fist filling of the reservoir. The dam has beenrehabilitated at a cost of more than Maloti 30 million;
- The infiltration galleries which were constructed under the project failed in all threeschemes soon after commissioning;
- The chlorine dosing equipment in all centres became a non-operational few monthsafter commissioning;
- The sand washing facility in Mohale’s Hoek became a non-starter; and- All the building components were over designed.
On the other hand, throughout the Project execution period, the consultant prepared andsubmitted Progress Reports on a regular basis, and the quality of the reports wassatisfactory.
ii) Lahmeyer International
The performance of the consultant which was recruited for the rehabilitation ofMafeteng Dam was mixed due to the following reasons :
- The lowest evaluated tender for the rehabilitation of Mefeteng Dam contract wasmuch higher than the estimate the engineer has made earlier. Even after the awardof the contract, the consultant wrongly estimated the final cost of the contract. Therehabilitation work became by the most expensive of the schemes;
- The progress reports prepared by for the consultant were very substandard and weresubmitted after long delays;
- On the rehabilitation of the Treatment Plant at Mafeteng, due to the alleged non-functioning of the air scouring equipment for the filter back wash operation, theconsultant recommended the utilization of the filters as slow sand filters.
On the other hand, consultant’s performance in quality control and general supervisionof the rehabilitation works was satisfactory.
iii) Technical Assistants
The project provided a Project Engineer, a Revenue Accountant and a Supplies Officer.The performance of the Project Engineer was generally satisfactory. The RevenueAccountant helped to computerize the billing system and also contributed to improvethe reporting systems from districts to the Headquarters. However, the performance of
15
the Supplies Officer was considered as non-satisfactory by the Executing Agency as hefailed to introduce an adequate stores system which matches the needs of WASA.
3.6.2 Contractors
i) M & C Construction
As the contractor’s main experience was in building works, the quality of works inother civil engineering works were not satisfactory. This was demonstrated by thefailure of the infiltration galleries in two centres. Contractor’s site staff managementhad also been noted to be un-satisfactory. To make up for its inefficiency it was notedthat the contractor was capitalizing on claims.
ii) Jefco Kent
The chlorine dosing equipment in all centres which were provide by and installed bythe contractor became non-operational soon after their commissioning. The air scouringdevice for back washing operation of filters. The air scouring device for back washingoperation of filters at Mafeteng, and the sand washing device at Mohale’s Hoek whichwere supplied and installed by the contractor also became non-starters.
Project management by the contractor had also been noted to be very poor, as result ofwhich delays were incurred.
iii) Kier International
Mafeteng Dam failed soon after its construction, during the first filling of the reservoir.For the failure of the dam although it was established that faulty design was the mainreason, construction deficiency had also a part to play. On the other hand, the quality ofits performance in other components of the contract were satisfactory.
iv) Skanska Construction
Despite the delays in payment incurred by the contractor from time to time, contractor’sdiligence, quality of work and adherence to implementation schedule were satisfactory.
The performance of the sub-contractor for the construction of the cut-off wall was,however, found to be un-satisfactory. During the testing of the deep concrete cut-offwall which was constructed under the up-stream toe of the dam, it was found that somesections of the wall were not water tight. The consultant stated that this was as a resultof wrong construction method adopted by the sub-contractor and consequentlyinstructed for the reconstruction of the defective sections at sub-contractor’s own cost.This decision was disputed by the sub-contractor until finally the main contractoraccepted its responsibility and re-constructed the defective sections at their own cost.
3.6.3 Borrower / Executing Agency :
(i) During the short listing and subsequent recruitment process of the consultant forthe provision of engineering services, the executing agency recommended aconsultant which was from non-member country of the Bank.
16
(ii) The executing agency recommended to the Bank the consultant which wasrecruited for the design of intakes, pumping stations, pipelines, treatment works,etc. to continue with the design of the Mafeteng Dam without proper assessmentof its relevant experience.
(iii) The Government has met its commitments to make adequate budgetaryallocations for the project. In fact, as could be seen from para. 3.5.3 itcontributed about 300% more then what it agreed to pay at appraisal.
(iv) The Government did not give the litigation process on the failure of theMafeteng Dam the urgency it deserved. Although it is four years since thelitigation starts, the process made to date is not substantial.
(v) The performance of the Executing Agency, WASA, on the other hand has beenmixed partly as a result of many turnover of the staff involved in the projectwhich at times made project information difficult to trace. Partly as a result ofthis, project record keeping especially financial records was poor. Consequentlyeven on this date, despite mission’s efforts, the disbursements made byGovernment have some approximations.
(vi) Despite the fact that various malfunctioning works were executed undercontracts 1 and 3, yet the EA released retention monies without deducting thecosts of rehabilitation or replacement of defective works.
(vii) Due to inadequate laboratory facilities and water treatment chemicals, thequality control of the different water treatment plants is not satisfactory.
(viii) Despite the remarks mentioned above, the performance of both the Governmentand the executing agency in the project has been fair.
3.6.4 Bank
i) The performance of the Bank has been considered to be mixed also. TheExecuting Agency in its draft PCR stated that Bank’s Technical Supervisionmissions were instrumental for the completion of the Project. It further statedthat the mission periods had always been learning sessions as the executingagency were able to discuss and resolve many technical and financial issues ofthe Project.
ii) Bank’s performance on disbursement has been considered to be unsatisfactoryas the implementation of some contracts such as the Rehabilitation of MafetengDam incurred delays and cost overruns as a result of delays in disbursement bythe Bank. The Executing Agency noted that it paid to the contractor over Maloti200,000 (about UA 50,000) as interest claims on delayed payments and aboutMaloti 2 million (about UA 500.000) to contractor and consultant due tosuspension of work due to delay in payment for works done. The delay appearsto have been caused as the result of the confusion that prevails in the Bank inthe handling of co-financiers grant funds. The meeting which was convened torecommend how the Bank could improve in its handling of bilateral funds infuture, recommended some measures and these are given in paragraph 7.3.6.
iii) During the short listing and subsequent recruitment process of the consultant forthe prevision of engineering services, the Bank failed to notice that theconsultant was from non-member country of the Bank.
iv) The Bank approved executing agency’s request that the consultant which wasrecruited for the design of intakes, pumping stations, pipelines, treatment works,
17
etc. was allowed to continue with the design of the Mafeteng Dam withoutproper assessment of its relevant experience.
3.6.5 Government of Norway
i) In addition to its additional financial contribution for the rehabilitation ofMafeteng Dam, the Government of Norway offered technical assistance aimedat :- periodic site visits to Lesotho in order to monitor the construction works;- training of Basotho nationals on dam safety regulations and practices.
ii) To carry these programmes the Government of Norway allocated NOK650.000, and also delegated the Norwegian Water Resources and EnergyAdministration Agency (NVE) to take up the task. As part its task NVE sent atotal of four missions to Lesotho of which 3 were for supervision and 1 to assistWASA form an opinion on the contractual dispute that had arisen between theconsultant and the contractor over the construction of the cut-off wall. As partof its monitoring task the NVE mission carried out a study of the sedimentationinflow in the reservoir and recommended the setting up of a monitoring systemfor the sediment build-up in the reservoir.
iii) Perhaps the most important aspect of the technical assistance programme was itscreation of awareness on WASA management, the need to monitor the safetyand performance of their various dams. In this regard most of the dams beingoperated by WASA were visited by the NVE mission and recommendationswere made for the setting up of the monitoring systems. Two WASA engineerswere also sent to Norway on short-term visit in order to be exposed to damsafety measures and regulations.
iv) The assistance given by the Government of Norway towards the implementationof the Project is praiseworthy.
18
4. OPERATION PERFORMANCE
4.1 ASSESSMENT OF SERVICES RENDERED
i) Mokhotlong Water Supply System- The present average production of the system is about 290 m3/d. The spring source
is operating satisfactorily except frequent blocage of the intake with debris whichrequire cleaning especially after rainy seasons. The other source, infiltration galleryin Mokhotlong River, has however failed to operate soon after commissioning.Similarly the newly furnished chlorination equipment also failed few months aftercommissioning. The reasons for the failure of the infiltration gallery as stated byWASA is due to deficiencies in the design and also in the construction. For thefailure of the chlorination equipment the main reason has been stated to be due torust caused by the chlorine gas to delivery pipe works and joints which are ofgalvanized steel rather than appropriate plastic materials.
- The mission has noted that the disinfection of the treated water was inadequate dueto inadequate supply of chemicals as well as due to lack of monitoring instruments.
ii) Mafeteng Water Supply System- The design and construction of the rehabilitation works have been carried out by
firms which had adequate experience in similar works. Some of the features of therehabilitation dam include the following :The foundation and up-stream side of the dam have sealed through the constructionof bentonite cut-off wall and geo-membrane respectively;The up-stream side of the embankment has been stabilized using gypsum;Drainage layers have been provided on the up-stream side underlain by geo-textilelayers, andThe spillway and intake structures have been relocated and reconstructed.
- The present average production of the new system is about 240 m3/d at 8 hrsoperation time. Unlike the other 3 schemes which had been in operation for the last6 years, Mafeteng works have just been commissioned and as a result theirsustained performance cannot be established at this stage. However, during therehabilitation of the treatment works it has been found that the air scouring devicewhich was constructed in 1988 for back washing of filters was defective. As a resultof this the consultant and WASA decided to utilize the filters as simple Slow SandFilters rather than Rapid Sand Filters. Because of this arrangement the productioncapacity of the plant is lowered from the envisaged 2100 m3/d by half.
- The mission noted that Lahmeyer’s consultancy agreement for supervision of therehabilitation came to an end as of end of April 1994. The mission also noted thatWASA assumed responsibility for the consultancy work during the defects liabilityperiod. The tasks include supervision of the completion of the nag items listedduring provisional acceptance, review and approval of contractor’s final paymentcertificate, review and approval of as-built drawings, and issuance of certificate forFinal Acceptance. The mission believes that these items are critical and cannot bedone satisfactorily by WASA under its present set-up.
iii) Qutihng Water Supply- The present average production of the system is about 400 m3/d. Other than the
non-operational chlorination equipment, problem is experienced with the quality ofthe water. The infiltration gallery which is being as raw water intake works is very
19
close to the surface of the river bed and, besides, the filtration media around theperforated pipe is inadequate to screen fine materials. As a result of this, the rawwater which is pumped to the works become very turbid especially during the rainyseason. Besides, since there is no any filter in the works the same turbid water ispumped to the distribution system.
- The mission noted that the operational cost of the water supply systeme per unitvolume delivered, is the most expensive of the four schemes. This in mainly due tothe utilization of the generator due to non-availability of power supply from theLesotho Electricity Corporation (LEC).
iv) Mohale’s Hoek Water Supply- The average production of the system at present is about 732 m3/d. Here too, the
infiltration gallery and the chlorination equipment became non-operational soonafter commissioning. As a result of this, to supplement the inflow from theinfiltration gallery, raw water is pumped using submersible flood pumps. Fordisinfection, chloride of lime solution is used. Both systems, which are temporaryarrangements, are inefficient. In addition, it has been noted that the sand washingfacility which was installed under the project became a non-starter.
4.2 MARKET
4.2.1. At the end of financial year 1993/94, i.e. March 1994, WASA had a total of19,269 consumers, of which domestic consumers accounted for 84%, government/institutionsfor 8%, and commercial for the remaining 8%. Among WASA’s, consumers 56% of them arein Maseru while 44% are in 14 different district centers.
4.2.2. The four district centers under the project, i.e. Mafeteng, Mohale’s Hoek,Quthing and Makhotlong had 2,658 consumers as at 31 March 1994, representing 14% ofWASA’s consumers. The number of consumers by category for these four centers is shown inthe table below :
Table 4.1 Number of Consumers by Category in the 4 Districts(as at 31 March 1994)
Domestic Gvt/inst. Commercial Total
Mafeteng 697 92 109 898Mohale’s Hoek 55 88 76 919Quthing 369 62 44 475Makhotlong 279 59 28 366
4.2.3. The amount billed for water and sewerage services in the four centers wasM1.75 million for the year 1993/94, accounting for 8% of Wasa’s total income. During thesame period, however, the expenditure of the four districts for providing water and sewerageservices amounted to about M 1.70 million, representing more than 8% of WASA’s totalexpenditure. As it is shown from the table below, except Mafeteng, all other three districtsincurred operational losses during the last financial year. These deficits are mainly due to highoperational costs (electricity, chemicals as well as transport) while a flat rate of tariffs isapplied for the whole country..

20
Table 4.2. Income and Expenditure of Water and Sewerage Servicesin the Four Districts in 1993/94 (Maloti 000’)
Income Expenditure Profit (Loss)
Mafeteng 539 353 186Mohale’s Hoek 565 615 -50Quthing 354 412 -58Makhotlong 294 325 -31
4.3 PROJECT’S ROLE
4.3.1 With the exception of the Mafeteng Water Supply Scheme the Project wasimplemented as appraised and the anticipated productions were achieved. However, due to thepassage of time production were not sustained due to some malfunctioning components in thesystems. Full utilisation of the capacities could be realized when these items are rehabilitated.The PCR mission has recommended to the Government to immediately rehabilitate the non-performing items.
4.3.2 With the completion of the construction of the water supply systems, it has beennoted that, new commercial centres, hospitals, schools, and some industries have been set-up inall centres.
4.4 PROJECT SPIN-OFFS
4.4.1 WASA’s revenues would be substantially increased provided that an economictariff is changed. This would permit WASA to build up financial reserves on which reserves onwhich it can rely to finance its own development projects.
4.4.2. For the community, especially for women, the time spent in search of cleanpotable water has been considerably reduced. Although monitoring statistics has not beenestablished, it is believed that the water borne diseases have been reduced as a result ofimproved water supplies.
4.4.3. The provision of reliable water supply systems have created a favourablecondition for extending and developing properly planned residential areas, institutions such asschools, hospitals, etc. and commercial and industrial activities.
4.4.4. Phase I of the Thirteen Towns Sanitation Project, which included all 4 centres,was implemented during the same period. The Project included construction of public toilets inshopping and other public areas, rehabilitation of sewers and sewage treatment ponds, andpromotion of pit latrines. With the help of the Water Supply Project, which wascomplementary to the Sanitation Project, the environments in the 4 Centres were greatlyimproved.

21
5. FINANCIAL PERFORMANCE
5.1. FINANCIAL RESULTS
5.1.1. The review of WASA’s financial results covers its actual performance since itsestablishment from 1991/94 to 1992/1994.. With the exception of the latest financial year(1993/94) all the accounts that form the basis of the review have been audited by theGovernment’s Auditor General.
5.1.2. Prior to the 1991/92 financial year WASA was a government department knownas Water and Sewerage Branch (WSB). As part of the government establishment WSBoperated a Trading Account of the government and its accounts were in the same format as thatof government accounts viz- on cash basis. Accordingly, income and expenditure statementswere prepared for the period 1988/89 – 1990/91. No balance sheets were prepared by the WSBin this period as that statement was not required by government accounting. WSB’ssummarized income and expenditure statements relating to the period 1988/89 – 1990/91 inAnnex 6
5.1.3. Under the Lesotho Water and Sewerage Authority Order which transformsWSB into WASA, WASA acquired all fixed assets and functions operated by the former WSBand is liable for interest on all loans current or under negotiation as April, 1st 1992 while thegovernment shall pay the principals. WASA is also liable for corporation tax at the applicablestandard rate, which is currently 45%, on its assessed taxable profit.
5.1.4. The financial system of WASA improved significantly since its transformationin 1992 from Water and Sewerage Branch of the Ministry of Water, Energy and Mining. Thesystem has changed from the government cash-basis accounting to a partially computerized,accrual basis of accounting, more suitable for commercially oriented organization. As a result,WASA has had its assets valued and it annually prepares an income statement and a balancesheet audited by the Government’s Auditor General. Considerable improvement has also beenachieved in WASA’s billing system which was computerized under the project is financing.
5.1.5. WASA’s summarized income statements as well as balance sheets covering theperiod 1991/92 – 1993/94 are presented in Annex 6. Analysis of financial statements coveringits last three years of operation (1991/92 – 1993/94) as a commercially oriented rganisationindicates that while a profit of M 2.73 million was realized in 1991/92, WASA has run intodeficit during the following two financial years with losses amounting to M 1.86 million and M0.76 million respectively and the operating ratio deteriorated from 87% in 1991/92 to 93% in1993/94. The losses were essentially due to the payment of interests on loans as required by theLesotho Water and Sewerage Authority Order. Actually, the income generated was inadequateto cover the payment of financial charges as the financial charges cover was only 0.78 in1993/94.

22
5.2. ANALYSIS OF CAPITAL STRUCTURE
5.2.1. The status of WASA’s capital structure is evident from its balance sheets for the1991/92 and 1993/94 financial years (Annex 6). The capital structure was dominated by fixedassets stated at M 178.8 million at the end of 1993/94. Its liabilities comprised a relativelysmall amount in the form of current liabilities (mainly the interest payable on loans) indicatedas M 10.87million at the end of 1993/94. WASA had no medium and long-term debt becausethe GOL has decided to continue to take responsibility for repayment of principal of all theloans it contracted for water projects prior to WASA’s transformation.
5.2.2. Despite its low debt position, WASA’s finances are not sound enough to enableit make the large monetary contributions that are called for in connection with the provision ofcounterpart funds for on-going projects. Indeed, as an infant public utility which was notprovided with any significant seed money at the time of its transformation, it needs to use itslimited resources to operate with a view to building up reserves that would enable it to becomefinancially autonomous.
5.3. FINANCIAL PROJECTION
5.3.1. The financial projections for WASA cover the period 1994/95 – 1998/99.Details of the projections as well as the assumptions underlying them are presented in Annex 7.
5.3.2. The projections indicate a general improvement in WASA’s performance overthe past although a deficit is still expected for the year 1994/95. The operating ratio will dropfrom 91% in 1994/95 to 66% in 1998/99. Meanwhile, the financial charges cover wouldbecome more adequate towards the end of the projection period.
5.3.3. However, it may be noted that the expected improving financial situation is onlypossible by the assumption that, in addition to efficient operations, WASA would be permittedto adjust its tariffs based on the costs of providing water and sewerage services and maintainthe tariffs in real terms as from the financial year 1994/95. It is worth noting that thegovernment appears to accept the principle of regular tariff adjustments based on costs ofproviding water services.
5.4. RATES OF RETURN
5.4.1. The financial internal rate of return (FIRR) was not calculated in the AppraisalReport to assess the viability of the project. Actually, the project could not be justified onfinancial grounds; although it offers significant social and economic benefits to the projectareas. At 10% discount rate, which was taken as a the appropriate opportunity cost of capital inLesotho, the average incremental cost of water supply was M 1.93/m3. The difference betweenthis figure and the then average tariff rate of M 0.45/m3, i.e. M 1.48/m3 represented theGovernment’s equivalent subsidy to the project at the time of appraisal.
5.4.2. The successive tariff increases as well as a significant cost saving during theimplementation (see para.6.5.3) of the project would have definitely improved the project’sfinancial viability if the Mafeteng Dam had not failed. However, the need for the rehabilitationof Mafeteng Dam not only incurred additional costs but also delayed by six years thecommissioning of installed facilities in Mafeteng. At 7% discount rate, which is the estimatedcapital cost in Lesotho, the average incremental cost of water produced under the project is
23
estimated at M8/m3, which means that the Government has to subsidize about M5/m3 to theproject at the present tariffs.
5.4.3. Nevertheless, it should be noted that the project has significant the macro-economic and social benefits of water supply such as increased economic activity andproductivity, improved health, savings on medical expenses, increased productivity, etc…Since these factors cannot be easily quantified, the Economic Internal Rate of Return (EIRR)of the project is not calculated.
6. INSTITUTIONAL PERFORMANCE
6.1. LEGAL AND INSTITUTIONAL FRAMEWORK
6.1.1. At appraisal the Water and Sewerage Branch (WSB) of the Ministry of Water,Energy and Mining (MWEM) was designated the executing agency for the project. At the timeof appraisal, there were discussions on the desirability of transforming the Branch into aparastatal with a view to increasing its autonomy and at the same time enabling it to becomecommercially oriented. As one of the conditions of the loan, the government was required togive an undertaking that it will transform WSB into a public corporate body with full legal andfinancial autonomy. ADF provided funds for the commissioning of a consultant to study theimplications of WSB’s transformation and to prepare an action plan for the transformation.
6.1.2. Having had a transformation study done, the GOL decided to transform WSBinto the Water and Sewerage Authority (WASA) in December 1991 by the issue of Order n° 29of 1991. This was subsequently followed with the publication of Lesotho Government Gazettein January 13, 1992. Under this Order, WASA acquired all fixed assets and functions operatedby the former Water and Sewerage Branch of the Ministry of Water, Energy and Mining. In itsnew form the Water and Sewerage Authority is answerable to the Ministry of NaturalResources.
6.1.3. WASA has been assigned several functions by the Government gazette referredto above but its main functions comprise the following :
- to abstract water, undertake studies, design, construct, operate and maintainwaterworks and distribution systems and sell water from such schemas;
- undertake studies, design, construct, operate and maintain sewerage and sewagetreatment schemes and other schemes for the reception and disposal of wastesarising from on site excreta and waterborne waste, store, collect, charge for anddischarge and dispose of treated effluent and wastes from such schemes.
- Secure the supply of water and the treatment and disposal of effluent at reasonableprices;
- Promote and encourage the economic and efficient use of water and especially theuse thereof for domestic, social, commercial, fisheries, agricultural, industrial,manufacturing and recreational and tourist purposes; etc.
6.2. MANAGEMENT AND ORGANIZATIONAL EFFECTIVENESS
6.2.1. The organizational structures at appraisal and at the end of projectimplementation are presented in Annex 8. Needless to say, the structure at appraisal was that of
24
WSB, a branch of the then Ministry of Water, Energy and Mining, while that at projectcompletion is the current structure of WASA. A major difference between the twoorganizational structures is that because the WSB was an integral part of Government itsmanagement reported directly to the responsible Ministry; the management of WASA, on theother hand, reports to a Board of Directors.
6.2.2. Membership of WASA’s Board of Directors comprises seven membersappointed by the Government. The Principal Secretary of Ministry of Natural Resources is theChairman and the other members are the Principal Secretaries of Ministry of EconomicPlanning, Ministry of Finance and Ministry of Interior, the General Manager of Lesotho Bank,a representative of the Lesotho Chamber of Commerce as well as the Managing Director ofWASA. Members of the Board shall hold the office for a period of not less than three years andshall be eligible for reappointment.
6.2.3. The managing Director of WASA is the most senior executive officer of theAuthority, responsible for the execution of policy of the Board and the day to day operations.The managing Director is assisted by Head of Technical Services, Head of Finance and Headof Personnel.
6.2.4. WASA has three major divisions – Technical Services, Finance and Personnel.The Technical Services Division makes up about 76% of the total staff strength and is incharge of both engineering and operations and maintenance functions. Personnel Divisioncovers recruitment, training and manpower development while the Finance Division isresponsible generally for keeping the accounts, purchasing, billing and collection. In addition,there is a small office under the direction of the Corporate Secretary, a lawyer, whose mainfunctions are to assist the Managing Director on matters relating to Board Meetings.
6.2.5. Apart from its Headquarters in Maseru, WASA has 14 district officesresponsible for water and sewerage services in these district centers. Each district office isheaded by a Technical Officer who reports to the Principal Engineer (Districts) based at theHeadquarters. The cashiers and meter readers report to the Revenue Controller of FinanceDivision. The number of employees at the district level represent about 35% of WASA’s totalstaff strength.
6.2.6. Generally speaking, WASA’s organizational structure as developed after thetransformation was an improvement on the previous one to permit efficient management ofresources. Following the transformation it was expected to have autonomy in personnel mattersas well as financial autonomy. In practice, this has not been the case as WASA still operates asa government department in many respects. It does not have the final say in recruitment,compensation, transfer as well as dismissal of personnel. If WASA is to be able to operate asan autonomous, commercial entity as the Act transforming it espouses, then, there is a need tominimize Government’s involvement and exercise of authority on WASA’s personnel matters.
6.3. STAFF AND TRAINING
6.3.1. At appraisal in 1982 WSB’s staffing was found to be very deficient at theprofessional and sub-professional level with only about 3% of its total staff of 589 in thiscategory. This has increased to about 10% of its current manning level of about 600. Womenrepresented more than 20% of WASA’s total staff strength including six at the professionallevel.

25
6.3.2. In order to improve on the operational efficiency and capacity of WSB, theproject has provided three Technical Assistants, i.e. 1 Revenue Accountant, 1 Supply Officerand 1 Senior Project Engineer. The Technical Assistance were beneficial and local counterpartshave successfully taken over these positions after the departure of the Technical Assistants.During this period the Key positions of Managing Director, Chief Engineer have also beenlocalized. The process for recruitment for the post for Head of Finance is underway.
6.3.3. Meanwhile, WASA is still benefiting from Technical Assistance provided byvarious donor agencies. There are currently seven Technical Assistants in place including 5engineers, 1 financial expert and 1 economist/planner. It is noted that WASA has prepared a 5-year training programme (1993-1998) for professional staff with one of its objectives being todevelop local competence to take over from expatriates.
6.3.4. Since its transformation in 1992, WASA salaries and wages were raised by 50%in average. And, there were also additional increases ranging from 5% to 25 % in April 1993.With these increases, the remuneration in WASA, together with advantageous benefits, nowseems competitive vis-à-vis many other utilities or institutions in Lesotho. Therefore, it isexpected that an increasing number of qualified personnel can be employed and retained at theprofessional and sub-professional level.
6.4. TARIFFS, BILLING AND COLLECTION.
Tariffs
6.4.1. WASA’s tariffs for both water and sewerage are characterized by a “split”structure with one rate for domestic consumers and a higher rate for all other consumers. Thetariff for each category of consumers is uniform throughout the country. It is to be noted thatthe tariff applied to public taps is same as that applied to institutions and the Ministry ofInterior is responsible for the payment for consumption of public taps. WASA’s prevailingwater tariffs and historical tariffs are presented in Annex 9.
6.4.2. In spite of the Government’s intention to make WASA autonomous when iteffected the transformation of WSB to WASA, it continues to exercise control over water andsewerage charges. Government’s willingness to agree to tariff adjustments is, therefore, a keyfactor in tariff increases. If WASA is to be able to operate as an autonomous and commercialentity, there is a clear need for the Government to minimize the exercise of its authority overWASA. In particular, it is desirable that the Government might consider to introduce a morerationalized and cost-based pricing formula for water and sewerage services, so that WASAcould adjust its tariffs on a regularly basis.
6.4.3. Since the commencement of project implementation in 1986, there have beenthree tariff adjustments. The first of these occurred in June 198_, when tariffs were raised to M1.00 per cubic meter and M1.50 per cubic meter for domestic and other consumersrespectively. At the same time sewerage tariffs were pegged at 75% for domestic and 60% forother consumers water bills. WASA has subsequently adjusted tariffs in June 1991 and April1993, with the 1991 adjustment increasing water tariff for domestic consumers by 50% andthat of other consumers by 100%. However, only an across-the-board adjustment of 4% wasallowed by the Government in April 1993 even though inflation for 1992/93 was as much as17%. The table below showing the tariffs in Maloti and US Dollar equivalent clearly indicatingthe inadequacy of the 1993 tariff adjustment as it resulted in the reduction of tariffs in USDollar terms.
26
Table 6.1. Comparative Water Tariffs in Maloti and US Dollar
Domestic Consumers Other ConsumersM/m3 US $/m3 M/m3 US $/m3
1985 0.45 0.34 N/A N/A1988 1.00 0.49 1.50 0.741991 1.50 0.54 3.00 1.081993 1.56 0.46 3.12 0.92
6.4.4. The above tariff adjustments, notwithstanding, WASA’s tariffs, are still belowits cost of providing water and sewerage services, especially in the districts which have tendedto be subsidized by Maseru Water Supply. Actually, while the unit cost of production is aboutM 3.19 per m3, water is being sold at about M 2.82 per m3. Assuming a 100% collection rate,WASA’s water operations are making a surplus of about 3% in Maseru and a loss of about28% in the districts. Consequently, WASA’s financial standing has not been very sound sinceits transformation and indications are that it would still make losses as from 1994/95 evenconsidering that a 10% tariff increase will be allowed.
6.4.5. Comparing to tariffs applied in neighbouring Orange Free State of South Africa,the charges for domestic consumers are generally lower in Lesotho. However, for commercialand industrial consumers, water charges are significantly higher in Lesotho than in the OrangeFree State, which is clearly detrimental to the development of local industries.
Billing and Collection
6.4.6. At appraisal WASA’s billing systems was manual and unreliable. This haschanged into a partially mechanized system that is very effective at data capturing as well aspreparation of customer’s bill’s, reports on age analysis of debtors, etc. In the newcomputerized system billing continues to be on a monthly cycle but it is more efficient thanbefore. Customer accounting at Maseru is fully computerized and online, and, therefore, updatedaily, thus, it is easy to know the status of any customer’s account in a very short time.Although customer accounts in the districts are still handled manually, their integration intoWASA’s financial accounting is done very quickly when the source documents reach Maseru.The bills for consumers in various districts are prepared in WASA’s headquaters in Maseru.
6.4.7. WASA’s billing system is still in need of improvement in respect of meterreading. A significant proportion of meter reading tends to be unreliable because readersdishonestly estimate figures instead of actually reading the meters. The other problem is thereliability of meters. WASA is making efforts to test and replace defective meters.
6.4.8. Water bills are despatched monthly and are normally mailed to consumers.WASA may disconnect a consumer if he fails to pay the billed amount within three months. Asat 31 march 1994, about 1.700 or 9% of total WASA’s consumers were being disconnectedpending payment of their debt as well as a re-connection fee.
6.4.9. The collection rate was about 90% in average for the last financial year.However, there was still a considerable amount of arrears. As shown in the table below,WASA’s total account receivables at the end of last financial year amounted to M 10.9 million,of which more than 60% are due for over 90 days. Government agencies are the main

27
defaulters with 40% of total debts followed by commercial organization with 35%. In thefinancial year 1993/94, the account receivables represented 190 days of billing, showing adeteriorating trend since 1991/92. Despite the high level of outstanding indications are thatWASA has not been aggressive enough in policing its receivables with the defaultingcustomers especially the government agencies.
Table 6.2 Summarized Age Analysis of Account ReceivablesAs at 31 March 1994 (Maloti’000)
Current 30 days 60 days 90 days Total
Domestic 337 286 201 1.431 2.256Government 663 586 98 3.058 4.405Commercial 730 635 524 1.912 3.801Institutions 73 34 37 269 413Total 1.803 1.541 860 6.670 10.875
6.5. ACCOUNTING AND AUDIT
Accounting
6.5.1. The accounting systems of WASA improved considerably during projectimplementation. The system changed from the government cash-basis accounting, which failedto account for all costs and transactions in connection with fixed assets, depreciation, loans,loan charges, etc., to a partially computerized, accrual basis of accounting, more suitable for acommercially oriented organization. In line with this development WASA has had its assetsvalued and it annually prepares an income statement and a sheet balance unlike before when itonly prepared an income and expenditure account in the government accounting format.
6.5.2. However, the project accounting is still manual and rudimentary. Sourcedocuments are simply filed after processing by financiers or the Government. Thus, in additionto being manual, the project accounting subsystem fails to produce reports on payments toconsultants and contractors as well as the sources of such payments. Consequently, informationon the disbursement status of a given project is not readily available. This undesirable state ofaffairs could have been prevented through project supervision and auditing. The mission hasnoted the accounts of Four Towns Supply project as well as those Maseru II Water SupplyProject have been under audit since March 1994 by the Auditor General. The exercise isexpected to be completed by end of June 1994.
6.5.3. A key factor responsible for the poor state of project accounts is the heavyworkload of the responsible official, the Expenditure Controller. Apart from processingexpenditures the officer is also required to keep detailed accounts of all project costs withvirtually no supporting staff. The volume of work calls for assistants who should be assignedthe responsibility of accounting for project costs and expenditures for specific projects onregular basis. In order to correct the deficiencies, WASA has taken some initial steps tocomputerize the project accounting.
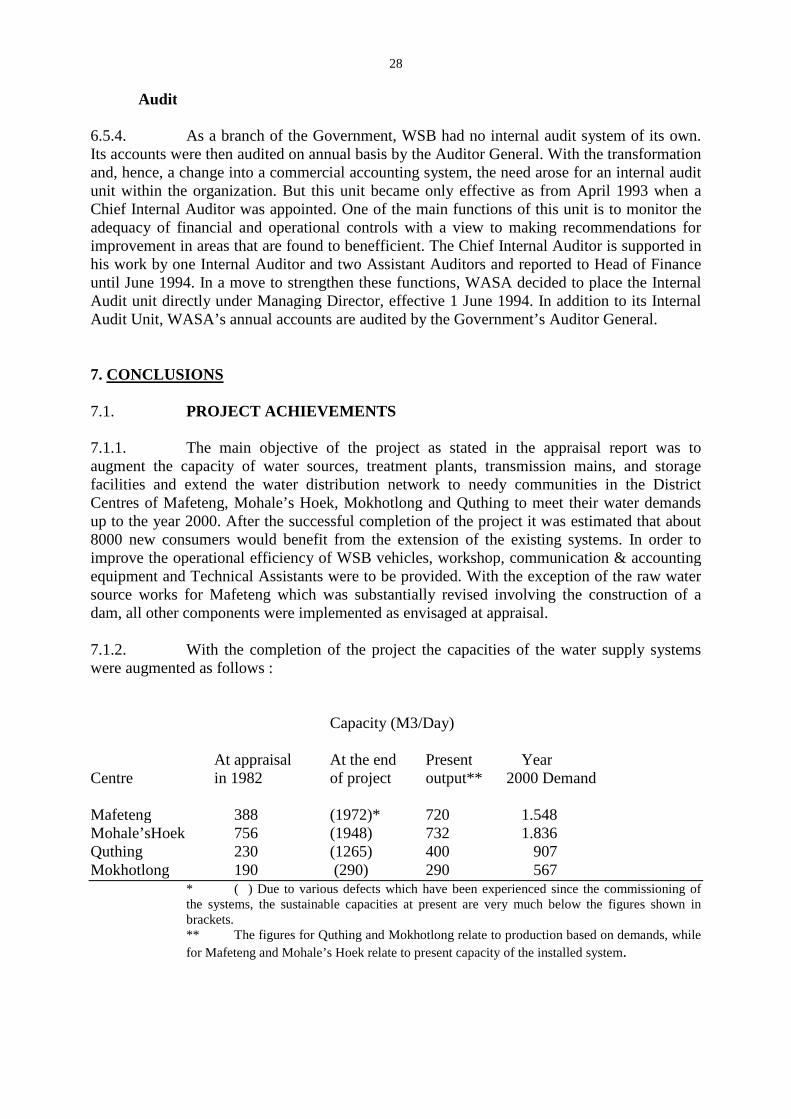
28
Audit
6.5.4. As a branch of the Government, WSB had no internal audit system of its own.Its accounts were then audited on annual basis by the Auditor General. With the transformationand, hence, a change into a commercial accounting system, the need arose for an internal auditunit within the organization. But this unit became only effective as from April 1993 when aChief Internal Auditor was appointed. One of the main functions of this unit is to monitor theadequacy of financial and operational controls with a view to making recommendations forimprovement in areas that are found to benefficient. The Chief Internal Auditor is supported inhis work by one Internal Auditor and two Assistant Auditors and reported to Head of Financeuntil June 1994. In a move to strengthen these functions, WASA decided to place the InternalAudit unit directly under Managing Director, effective 1 June 1994. In addition to its InternalAudit Unit, WASA’s annual accounts are audited by the Government’s Auditor General.
7. CONCLUSIONS
7.1. PROJECT ACHIEVEMENTS
7.1.1. The main objective of the project as stated in the appraisal report was toaugment the capacity of water sources, treatment plants, transmission mains, and storagefacilities and extend the water distribution network to needy communities in the DistrictCentres of Mafeteng, Mohale’s Hoek, Mokhotlong and Quthing to meet their water demandsup to the year 2000. After the successful completion of the project it was estimated that about8000 new consumers would benefit from the extension of the existing systems. In order toimprove the operational efficiency of WSB vehicles, workshop, communication & accountingequipment and Technical Assistants were to be provided. With the exception of the raw watersource works for Mafeteng which was substantially revised involving the construction of adam, all other components were implemented as envisaged at appraisal.
7.1.2. With the completion of the project the capacities of the water supply systemswere augmented as follows :
Capacity (M3/Day)
At appraisal At the end Present YearCentre in 1982 of project output** 2000 Demand
Mafeteng 388 (1972)* 720 1.548Mohale’sHoek 756 (1948) 732 1.836Quthing 230 (1265) 400 907Mokhotlong 190 (290) 290 567
* ( ) Due to various defects which have been experienced since the commissioning ofthe systems, the sustainable capacities at present are very much below the figures shown inbrackets.** The figures for Quthing and Mokhotlong relate to production based on demands, while
for Mafeteng and Mohale’s Hoek relate to present capacity of the installed system.
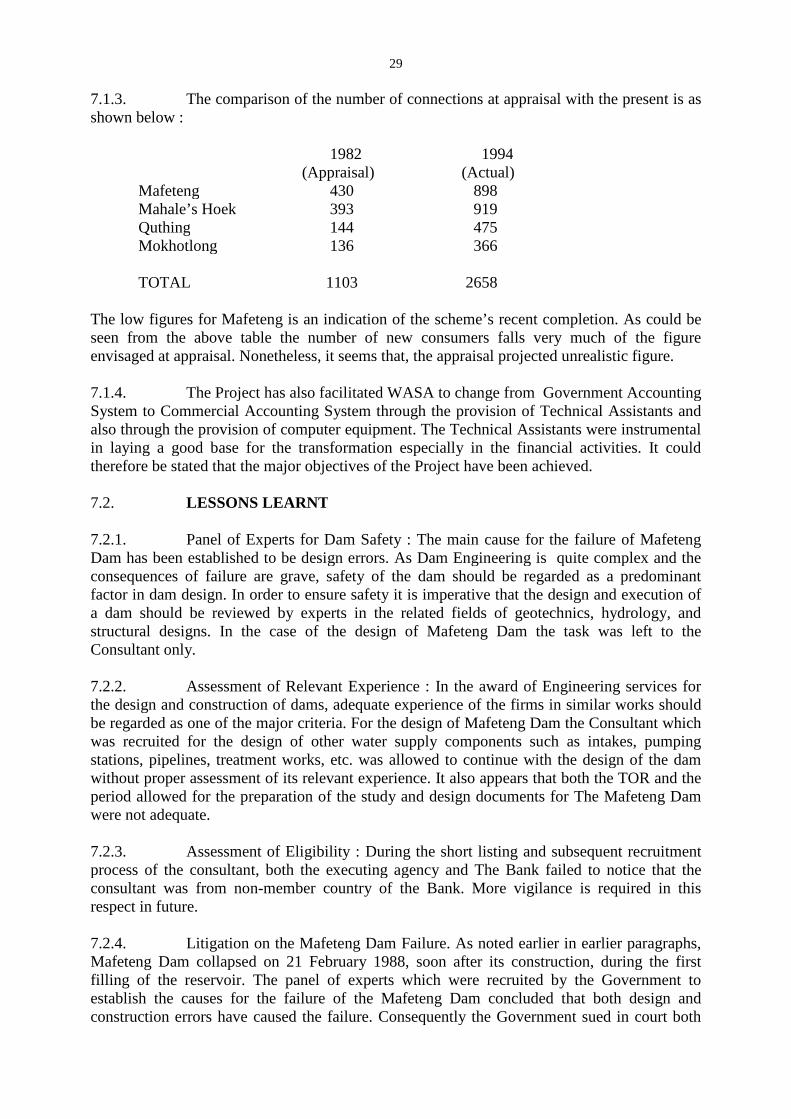
29
7.1.3. The comparison of the number of connections at appraisal with the present is asshown below :
1982 1994(Appraisal) (Actual)
Mafeteng 430 898Mahale’s Hoek 393 919Quthing 144 475Mokhotlong 136 366
TOTAL 1103 2658
The low figures for Mafeteng is an indication of the scheme’s recent completion. As could beseen from the above table the number of new consumers falls very much of the figureenvisaged at appraisal. Nonetheless, it seems that, the appraisal projected unrealistic figure.
7.1.4. The Project has also facilitated WASA to change from Government AccountingSystem to Commercial Accounting System through the provision of Technical Assistants andalso through the provision of computer equipment. The Technical Assistants were instrumentalin laying a good base for the transformation especially in the financial activities. It couldtherefore be stated that the major objectives of the Project have been achieved.
7.2. LESSONS LEARNT
7.2.1. Panel of Experts for Dam Safety : The main cause for the failure of MafetengDam has been established to be design errors. As Dam Engineering is quite complex and theconsequences of failure are grave, safety of the dam should be regarded as a predominantfactor in dam design. In order to ensure safety it is imperative that the design and execution ofa dam should be reviewed by experts in the related fields of geotechnics, hydrology, andstructural designs. In the case of the design of Mafeteng Dam the task was left to theConsultant only.
7.2.2. Assessment of Relevant Experience : In the award of Engineering services forthe design and construction of dams, adequate experience of the firms in similar works shouldbe regarded as one of the major criteria. For the design of Mafeteng Dam the Consultant whichwas recruited for the design of other water supply components such as intakes, pumpingstations, pipelines, treatment works, etc. was allowed to continue with the design of the damwithout proper assessment of its relevant experience. It also appears that both the TOR and theperiod allowed for the preparation of the study and design documents for The Mafeteng Damwere not adequate.
7.2.3. Assessment of Eligibility : During the short listing and subsequent recruitmentprocess of the consultant, both the executing agency and The Bank failed to notice that theconsultant was from non-member country of the Bank. More vigilance is required in thisrespect in future.
7.2.4. Litigation on the Mafeteng Dam Failure. As noted earlier in earlier paragraphs,Mafeteng Dam collapsed on 21 February 1988, soon after its construction, during the firstfilling of the reservoir. The panel of experts which were recruited by the Government toestablish the causes for the failure of the Mafeteng Dam concluded that both design andconstruction errors have caused the failure. Consequently the Government sued in court both

30
the Contractor and the Consultant for negligence and a claim for M. 9.8 million. The litigationprocess has been paintfully slow mainly because the Government did not give the issue theurgency it required.
7.2.5 Non-performance of Some Components. One of the problems of the existingwater supply system has been found to be the failure of the infiltration galleries andchlorination equipment. Although infiltration galleries are in principle appropriate forms ofwater abstraction devices from river bed aquifers unless their designs and construction iscarefully executed they are very susceptible to failures. Similarly it is important that dueimportance should be given to small details in the specifications of materials and equipment.
7.2.6. Projects Record Keeping. It has been noted earlier that partly as a result ofmany turnover of Executing Agency’s project staff, project record keeping especially financialrecords was poor. It is important to insure that from the start of project implementationappropriate project data forms are discussed and agreed upon by all parties concerned.
7.2.7 Transfer of Knowledge. It has been noted that as the EA did not attach itsstaff to consultants or to contractors, it has not much benefited from the transfer of knowledgein the implementation of a project. It is therefore recommended that the attachment of EA’sstaff to consultants and contractors be introduced as a condition to Bank’s loans and grants.
7.3. RECOMMENDATIONS
7.3.1. For the defective components noted in the system including the infiltrationgalleries, chlorination equipment, and air compressors the mission believes that rehabilitationwould be the least cost option. The mission therefore recommends that the GOL shouldrehabilitate the different malfunctioning items in the urgently in order to realize the fullbenefits of the Project and to prevent the system from further deterioration.
7.3.2. WASA’s tariffs are substantially below economic costs of providing water andsewerage services. It is recommended that the Government should consider to introduce a morerationalized and cost-based pricing formula for water sewerage services, so that WASA couldadjust its tariffs on a regularly basis. Bank should follow up closely the issue and make surethat such a pricing formula be introduced prior to any new intervention in the sector.
7.3.3. As WASA’s project accounting is in a very unsatisfactory state, it shouldexpedite its efforts to improve the project accounting preferably through computerization. It isalso desirable to have the project accounts be audited regularly by internal auditor as well asexternal auditors.
7.3.4. WASA’s precarious financial position is further affected by a substantialamount of uncollected bills with the Government agencies as main defaulters. There is anurgent need to take up the issue with the Government and establish a mechanism to minimizesuch debts irrespective of the kind of debtors.
7.3.5. WASA should also explore and implement without delay ways and means toreduce its operation costs especially those of electricity. To this, it must be added a need toimplement a mains extension programme in order to enlarge WASA’s revenue base. It is notedthat both Maseru and consumers and some other District Centres have suffficient capacity toserve additional there exist also a large unserved population in these same areas.

31
7.3.6. Bank’s Handling of Co-financiers Funds : It has also been noted that there hadbeen confusion in the Bank in the handling of bilateral grant funds. In order not to loosecredibility from co-financiers and beneficiaries, as well as improve project execution, the InterDepartmental Working Group recommended that the issue be discussed in a special meetingwhereby all concerned departments were represented. Subsequently this special meetingrecommended the following:
a) a copy of the financial statement for co-financed projects which are prepared byFACT on quarterly basis should be sent to FIDS, and a copy should be sent to allconcerned departments;
b) COOP should ensure on a monthly basis that :i) bilateral funds are available for disbursements;ii) disbursements are effected promptly by FIDS.
7.3.7. The main cause for the failure of Mafeteng Dam has been established to bedesign errors. As Dam Engineering is quite complex and the consequences of failure are grave,safety of the dam should be regarded as a predominant factor in dam design. In order to ensuresafety it is imperative that the design and execution of a dam should be reviewed by experts inthe related fields of geotechnics, hydrology, and structural designs.
7.3.8 In the award of Engineering Services for the Design and Construction of Damsthe Bank should ensure that the firms posses adequate experience in similar works. The Bankshould also be thorough in its assessment of eligibility of consultants and contractors.

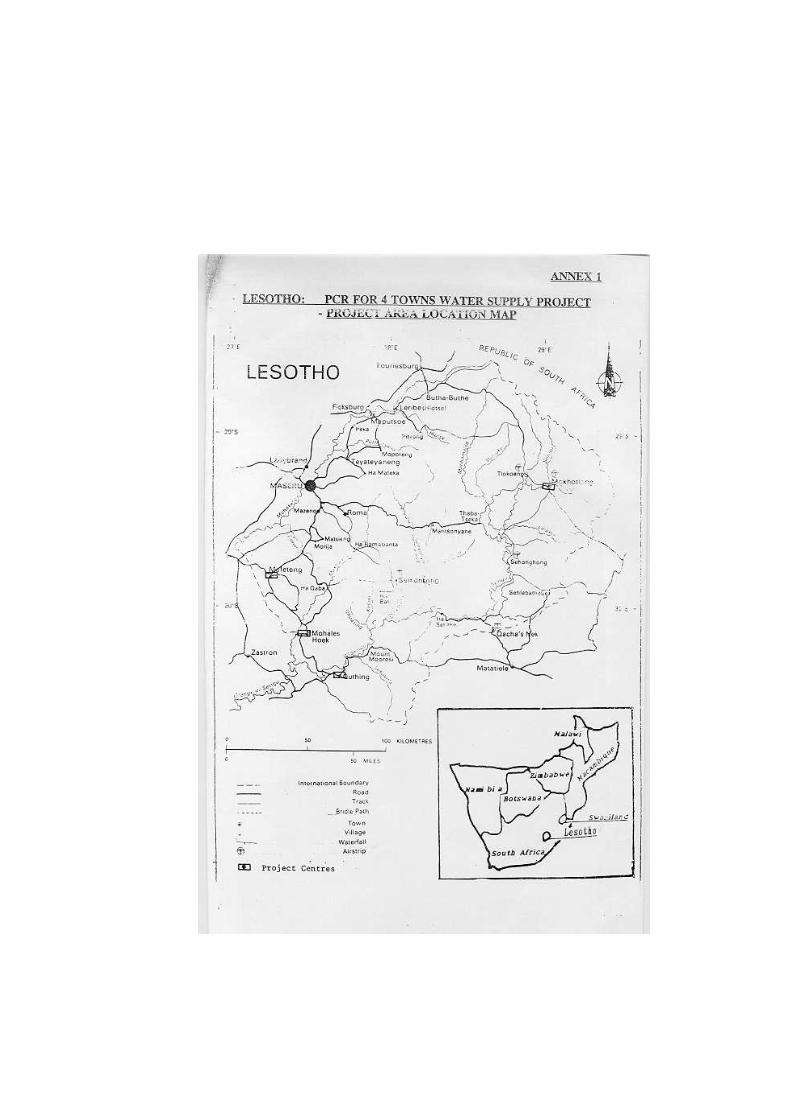


ANNEX 2Page 1 of 5
LESOTHO
PCR FOR THE 4 TOWNS WATER SUPPLY PROJECT
Detail Description of Components Executed under the Project
For execution purposes the project was divided into 3 major contracts as follows :
CONTRACT 1 :
Contract 1 included the following items :
A. Mohale’s Hoek
i) GeneralThe new scheme provides for a zoned system of supply to the town. The
high level areas will be fed from an existing borehole and well, which are beingupgraded under the scheme, through two new 400 m3 and 100 m3 steel tanks.The major portion of the town will be supplied with treated water fromMakhaleng River. An infiltration gallery in the river will deliver after to anintake sump whence it will be pumped to the inlet dosing channel at the nearbywater treatment works. The treatment work is being upgraded and extendedunder the contract to include an additional 51 m3 of clear water storage and newchlorine dosing house. From here water is pumped in two stages through theexisting 150 mm rising main to a new 1000 m3 storage tank located on the samesite as an existing reservoir.
The existing reticulation system in both zone is to be reinforced and/orextended under the project. Two small outlying villages near the Treatment Plantare also supplied through 25 m3 and 10 m3 storage tanks off the existing risingmain.
ii) Civil Works
a) Infiltration Gallery Intake and Sump on the Makhaleng River (*)b) Extension to Treatment Works :
- Clear Water Tank- Chlorination House
c) Booster Pump Stationd) Reservoirs :
- 1000 m3- 400 m3- 100 m3- 25 m3- 10m3

ANNEX 2Page 2 of 5
LESOTHO
PCR FOR THE 4 TOWNS WATER SUPPLY PROJECT
Detail Description of Components Executed under the Project
e) Pipelines (total length 10.2 km) :- 8.6 km of 250-25 mm Gravity Main
f) Accommodation, Workshop and office___________________________________________________________
* Intake : An Interesting feature of this component is the proposed method of itsconstruction. Firstly, intake sump consisting of 5m diameter caisson is constructed in thealluvial formation. A steel sleeve is then jacked into the river bed gravel and the material iswithdrawn. The well screen is then placed within the sleeve and the sleeve subsequentlywithdrawn. The aquifer is then developed using a high pressure jetting process.
B. Quthing
i) GeneralAn infiltration gallery in the Qomoqomong River is the source for the
new scheme. From the intake Caisson water is pumped to a chemical dosingchannel. In the treatment building high-lift pumps also located in this buildingdeliver fully-treated water through 2.2 km of 150 mm rising main to 1200 m3intermediate level reservoir whence most of the town can be serviced. Anadjacent Booster pumping Station delivers water to a 500 m3 high levelreservoir which serve a substantial high level area.
The existing reticulation system in both zones is reinforced and/orextended under the project. In addition considerable lengths of existing supplypipe work which have been laid over ground will be buried under this contract.
Intake : It was originally intended to use an intake system similar to that atMohale’s Hoek but due to the discovery of large boulders in the river bed duringa recent site investigation it was decided to alter the intake system. The newsystem involves laying the well screens in a gravel surrounded within a stonefilled gabon and using a laver of no-fines concrete to contain the gravel . On sitetests indicate that this system should prove successful.
ii) Civil Worksa) Infiltration Gallery Intake and Sump on the Qomoqong Riverb) Treatment Buildingc) Booster Pump Stationd) Reservoirs : - 1200m3
- 600 m3e) Pipelines (Total length : 11.1 km)
- 8.2 km of 100:75/50 Gravity Main- 2.9 km of 150/100 Rising Main
f) Accommodation, Workshop and Office

ANNEX 2Page 3 of 5
LESOTHO
PCR FOR THE 4 TOWNS WATER SUPPLY PROJECT
Detail Description of Components Executed under the Project
C. Mokhotong
i) General
Water is abstracted from a mountain stream at a high elevation toprovide a reliable gravity supply for the scheme for much of the year. In dryweather the gravity source will be augmented by pumping from an infiltrationgallery intake on the Mokhotlong River. The Treatment Works is beingextended to include 2 No. sedimentation tanks; a sand washing bay and a 700m3 clear water tank/reservoir. A small pumping installation will deliver treatedwater to a 75 m3 high level which will supply a nearby high level area.
The existing town reticulation system is reinforced and/or extendedunder the project.
ii) Civil Worksa) Intake on Mountain Streamb) Infiltration Gallery Intake and Sump on the Mokhotlong Riverc) High-lift Pumping Station adjacent to intaked) Extension to Treatment Works :
- 2 No sedimentation Works- Sand Washing Bay- 700 m3 Clear Water Tank- Pump house
e) 75 m3 High level reservoirf) Pipelines (total length : 9.1 km)
- 2.5 km of 75/150/ Rising Main- 6.6 km of 150/100/75/50 Gravity Main
g) Accommodation, Workshop and office
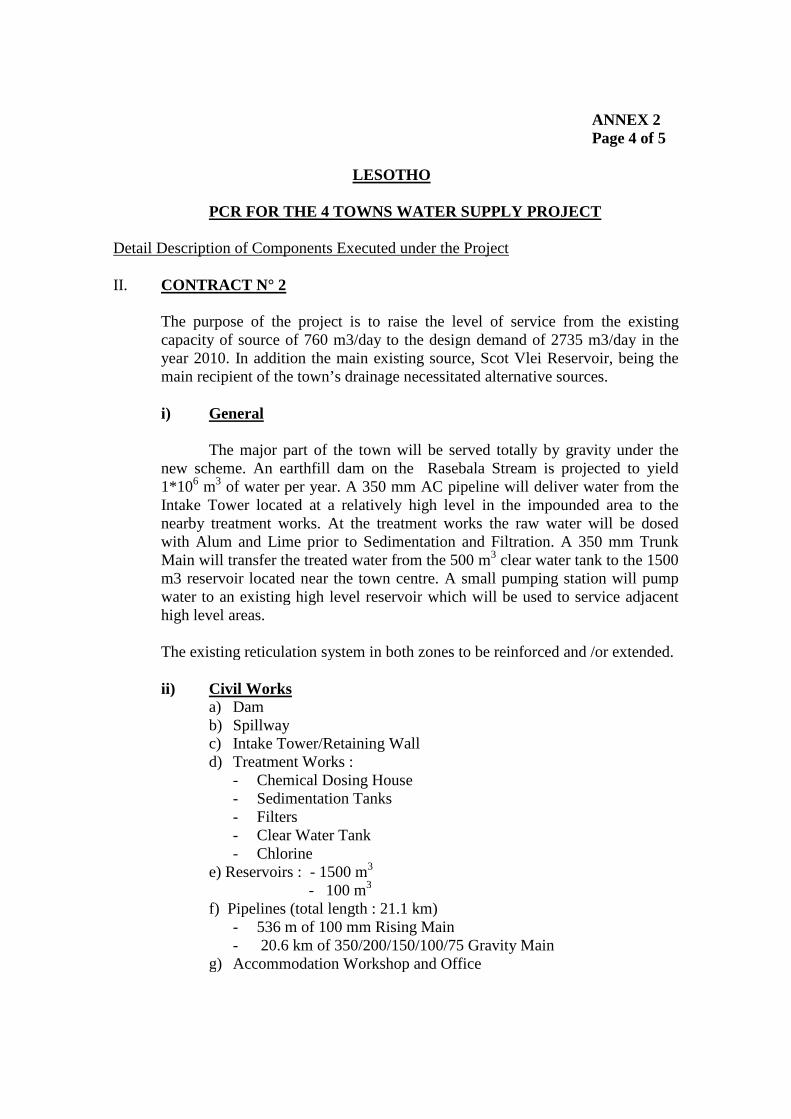
ANNEX 2Page 4 of 5
LESOTHO
PCR FOR THE 4 TOWNS WATER SUPPLY PROJECT
Detail Description of Components Executed under the Project
II. CONTRACT N° 2
The purpose of the project is to raise the level of service from the existingcapacity of source of 760 m3/day to the design demand of 2735 m3/day in theyear 2010. In addition the main existing source, Scot Vlei Reservoir, being themain recipient of the town’s drainage necessitated alternative sources.
i) General
The major part of the town will be served totally by gravity under thenew scheme. An earthfill dam on the Rasebala Stream is projected to yield1*106 m3 of water per year. A 350 mm AC pipeline will deliver water from theIntake Tower located at a relatively high level in the impounded area to thenearby treatment works. At the treatment works the raw water will be dosedwith Alum and Lime prior to Sedimentation and Filtration. A 350 mm TrunkMain will transfer the treated water from the 500 m3 clear water tank to the 1500m3 reservoir located near the town centre. A small pumping station will pumpwater to an existing high level reservoir which will be used to service adjacenthigh level areas.
The existing reticulation system in both zones to be reinforced and /or extended.
ii) Civil Worksa) Damb) Spillwayc) Intake Tower/Retaining Walld) Treatment Works :
- Chemical Dosing House- Sedimentation Tanks- Filters- Clear Water Tank- Chlorine
e) Reservoirs : - 1500 m3
- 100 m3
f) Pipelines (total length : 21.1 km)- 536 m of 100 mm Rising Main- 20.6 km of 350/200/150/100/75 Gravity Main
g) Accommodation Workshop and Office

ANNEX 2Page 5 of 5
LESOTHO
PCR FOR THE 4 TOWNS WATER SUPPLY PROJECT
Detail Description of Components Executed under the Project
III. CONTRACT N° 3
This contract includes provision and installations for the electrical /mechanical and treatment plant equipment for the Four Towns Water SupplyProject. Lists of major component by town are shown below.
Location Pumps Generators Others(N°s) (N°s)
A. Mohale HoekIntake Caisson 3 1Treatment Works 3 Alum, lime and
chlorination equipmentBooster Station 3 1Borehole 1 1Well 2 1Sub-Total 12 4
B. QuthingIntake Caisson 3Treatment Plant 3 1 Lime and chlorination
EquipmentBooster Station 3 1Sub-Total 9 2
C. MokhotlongIntake Caisson 3Intake Pump Station 3 1Treatment Works 2 1 Chlorination equipmentSub-Total 8 2
D. MafetengBooster Station 2 1Treatment Works 2 -Sub-Total 4 1
TOTAL 33 9

ANNEX 3
LESOTHO : PCR FOR 4 TOWNS WATER SUPPLY PROJECTIMPLEMENTATION SCHEDULE
ACTIVITY / YEAR 1983 1984 1985 1986 1987 1988 1989 1990 1991 1992 1993 1994
Review of designsAnd tender docs
Recruitment ofConsultant
PrequalificationTendering andAward
Supply andConstruction
PIU
According to the Appraisal Report
Actual Schedule
Rehabilitation of Mafeteng dam

ANNEX 4
LESOTHO : PCR FOR THE 4 TOWNS WATER SUPPLY PROJECT,Breakdowns of Appraisal Cost Estimate by Major Components
---in ‘000 Maloti-- --in ‘000 UA--Component F.C L.C. Total F.C. L.C Total
Cost Cost
A. Intakes 2,865 654 3,519 2,294 524 2,818
B. Treatment Works 1,669 417 2,086 1,336 333 1,670
C. Pumping Stations 1,812 263 2,075 1,452 210 1,662
D. Storage Facilities 987 247 1,234 781 198 988
E. Pipelines 3,660 1,569 5,229 2,931 1,257 4,189
F. Works, Accom- 192 128 320 154 102 256modation and Offices
G. Engineering Servicesi)Review Design & preparation
tender Docs --- 200 200 --- 160 160ii) Supervision 800 200 1,000 641 160 801
Physical Contingency 800 400 1,200 641 320 961Price Escalation 319 96 415 255 77 332Sub Total 1,119 496 1,615 896 398 1,294
H. Operational 405 30 435 324 24 348Assistance
TOTAL 12,709 3,804 16,513 10,179 3,047 13,226
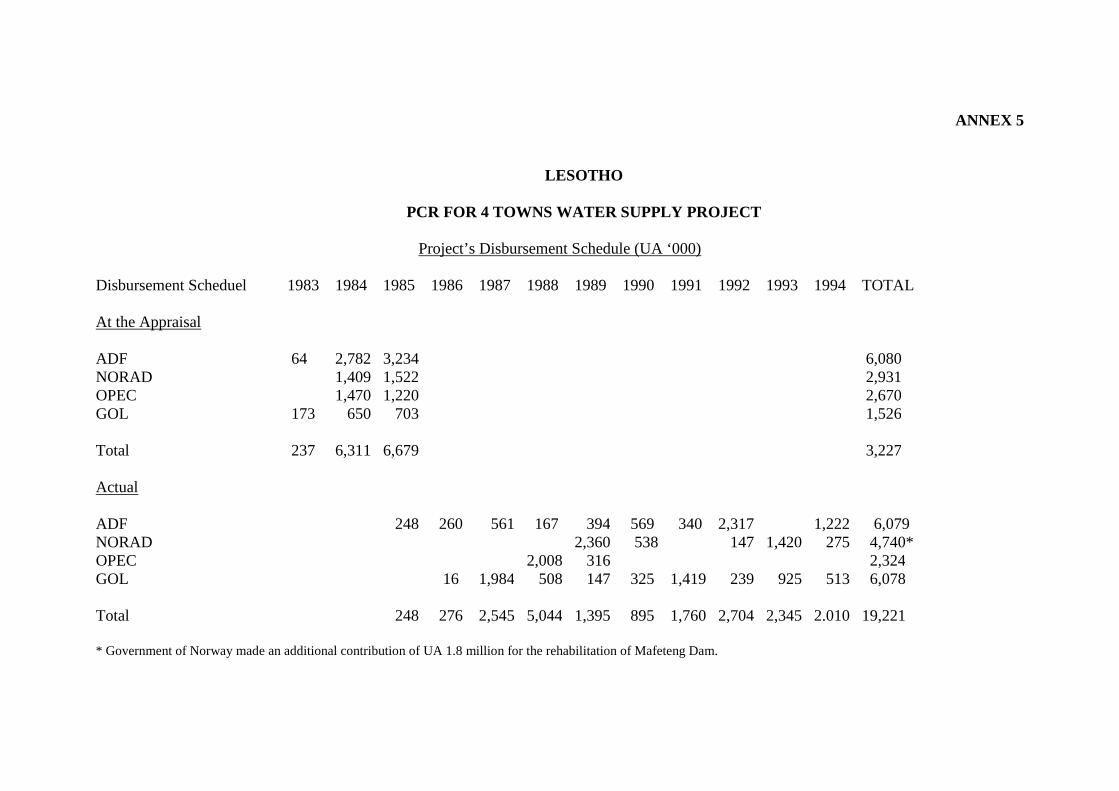
ANNEX 5
LESOTHO
PCR FOR 4 TOWNS WATER SUPPLY PROJECT
Project’s Disbursement Schedule (UA ‘000)
Disbursement Scheduel 1983 1984 1985 1986 1987 1988 1989 1990 1991 1992 1993 1994 TOTAL
At the Appraisal
ADF 64 2,782 3,234 6,080NORAD 1,409 1,522 2,931OPEC 1,470 1,220 2,670GOL 173 650 703 1,526
Total 237 6,311 6,679 3,227
Actual
ADF 248 260 561 167 394 569 340 2,317 1,222 6,079NORAD 2,360 538 147 1,420 275 4,740*OPEC 2,008 316 2,324GOL 16 1,984 508 147 325 1,419 239 925 513 6,078
Total 248 276 2,545 5,044 1,395 895 1,760 2,704 2,345 2.010 19,221
* Government of Norway made an additional contribution of UA 1.8 million for the rehabilitation of Mafeteng Dam.

ANNEX 6Page 1 of 3
LESOTHO
PCR FOR FOUR TOWNS WATER SUPPLY PROJECT
Water and Sewerage Branch Financial Statements for the Period ended March 31 1988/89-1990/91 in Maloti million)
REVENUES 1988/89 1989/90 1990/91
Maseru 4.20 4.79 8.64Districts 1.42 1.94 2.21
Total Revenues 5.62 6.73 10.85
EXPENDITURES
Common ExpendituresAdministration 0.52 0.55 0.73Accounts and stores 0.47 0.41 0.97Workshop 0.23 0.47 0.47Training 0.02 0.06Design and construction 0.05 0.02 0.10Grounds and Buildings 0.01 0.01Special Expenditure 0.08 0.16
Total Common Expenditures 1.38 1.68 2.27
Area ExpendituresMaseru 2.39 3.06 4.19Districts 1.49 1.78 2.24
Total Area Expenditures 3.88 4.84 6.43
Total Common and Area Expenditures 5.26 6.52 8.70
Surplus for the Year 0.36 0.21 2.15

ANNEX 6PAGE 2 of 3
LESOTHOPCR FOR FOUR TOWNS WATER SUPPLY PROJECT
Water and Sewerage Authority Financial Statements for the Period ended March 31 1991/92-1993/94. In Maloti ‘000)
REVENUE 1991/92 1992/93 1993/94(estimated)
Water and Sewerage Charges 15,016 17,635 19,851New Service Connections 1,957 1,729 2,172Operating Revenue 16,975 19,364 22,023
OPERATING EXPENSES
Manpower Costs 4,374 6,051 8,168Electricity 2,214 1,850 3,173Reticulation and Plant Maintenance 518 1,080 1,164Chemicals 789 551 674Transport 1,088 1,356 932New Connections 757 901 1,233Drought Relief 204General and Administrative Expenses 898 1,744 1,722Other Expenses 35 59Depreciation 3,296 3,484Provision for Doubtful Debts 4,119 1,271
Total Operating Expenses 14,792 18,393 20,550
Operating Profit 2,183 971 1,473Other Income* 545 936 1,293
Profit before Financial Charges 2,728 1,907 2,766Financial Charges 3,771 3,527
Net Profit before Taxation 2,728 (1,864) (761)Provision for Taxation n/a** 0 0
Net Profit after Taxation 2,728 (1,864) (761)
Financial Performance IndicatorsOperatinf Ratio 87% 95% 93%Financial Charges Cover -- 0.51 0.78Depreciation/Operating revenue -- 17% 16%
* Comprises rent, interest received, profit or loss on disposal of assets and others.** WASA becomes liable for corporate tax starting from financial year 1992/93.
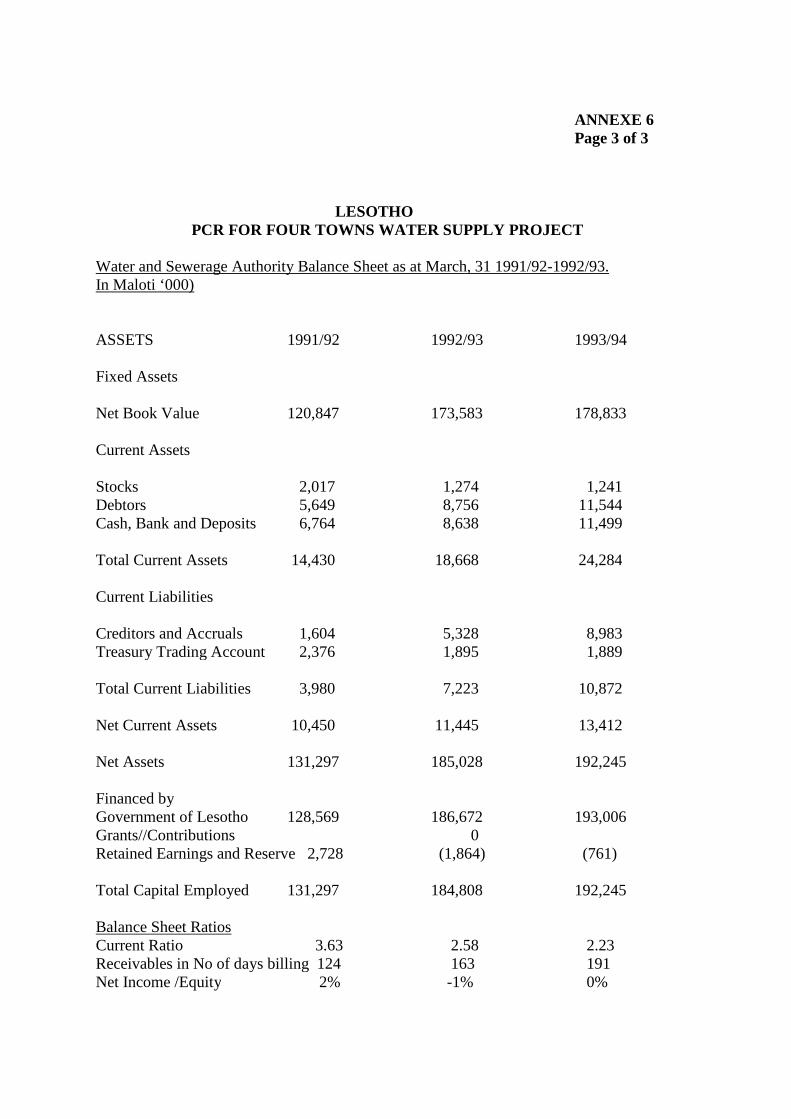
ANNEXE 6Page 3 of 3
LESOTHOPCR FOR FOUR TOWNS WATER SUPPLY PROJECT
Water and Sewerage Authority Balance Sheet as at March, 31 1991/92-1992/93.In Maloti ‘000)
ASSETS 1991/92 1992/93 1993/94
Fixed Assets
Net Book Value 120,847 173,583 178,833
Current Assets
Stocks 2,017 1,274 1,241Debtors 5,649 8,756 11,544Cash, Bank and Deposits 6,764 8,638 11,499
Total Current Assets 14,430 18,668 24,284
Current Liabilities
Creditors and Accruals 1,604 5,328 8,983Treasury Trading Account 2,376 1,895 1,889
Total Current Liabilities 3,980 7,223 10,872
Net Current Assets 10,450 11,445 13,412
Net Assets 131,297 185,028 192,245
Financed byGovernment of Lesotho 128,569 186,672 193,006Grants//Contributions 0Retained Earnings and Reserve 2,728 (1,864) (761)
Total Capital Employed 131,297 184,808 192,245
Balance Sheet RatiosCurrent Ratio 3.63 2.58 2.23Receivables in No of days billing 124 163 191Net Income /Equity 2% -1% 0%

ANNEX 7Page 1 of 3
LESOTHO
PCR FOR FOUR TOWNS WATER SUPPLY PROJECT
Assumption for Financial Projections
1) WASA revenu are expected from two sources – water sales and sewerage charges.Connection fees are not considered as revenue as they are only aimed at recovering thecost of connection.
2) Average tariffs for financial projections are as following (in Maloti Cubic meter) :
1994/95 1995/96 1996/97 1997/98 1998/99
3.05 3.50 3.85 4.24 4.66
3) Recurrent costs are divided into six categories : manpower, energy, transport, chemicals,recticulation and plant maintenance and general administrative expenses.
4) The average inflation rate for Lesotho in the last five years, estimated to be about 14%per annum, has been applied in all costs of financial projections upto 1997/98. The samerate has also been applied in the revaluation of the WASA’s fixed assets in the balancesheet projections.
5) WASA is liable for interest on all loans current and under negociation at 1st April 1992.These loans include the following :
ADF - Maseru Water Supply Phase IMaseru Water Supply Phase IIFour Centers Water Supply
ADB - Maseru Water Supply Phase IIOPEC - Four Centers Water SupplyKUWAIT - Greater Maseru Sanitation, Phase IIIDA - Seven Towns Water SupplyBADEA - Greater Maseru Sanitation Phase II
6) WASA is liable for coporation tax at the applicable standard rate, i.e.45% currently, on itsassessed taxable profit.
7) Assets depreciation is provided on a straight line basis over the estimateduseful/economic life for each group of assets such as buildings, plant and machnary,vehicles and office equipment.
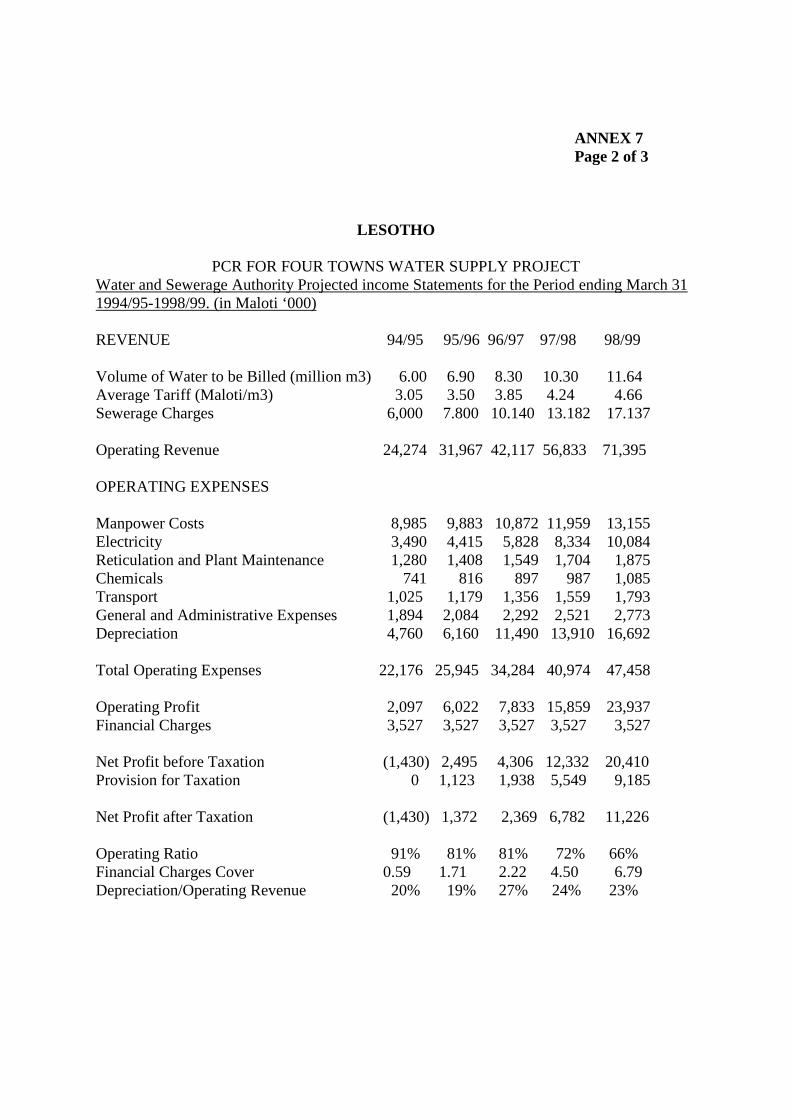
ANNEX 7Page 2 of 3
LESOTHO
PCR FOR FOUR TOWNS WATER SUPPLY PROJECTWater and Sewerage Authority Projected income Statements for the Period ending March 311994/95-1998/99. (in Maloti ‘000)
REVENUE 94/95 95/96 96/97 97/98 98/99
Volume of Water to be Billed (million m3) 6.00 6.90 8.30 10.30 11.64Average Tariff (Maloti/m3) 3.05 3.50 3.85 4.24 4.66Sewerage Charges 6,000 7.800 10.140 13.182 17.137
Operating Revenue 24,274 31,967 42,117 56,833 71,395
OPERATING EXPENSES
Manpower Costs 8,985 9,883 10,872 11,959 13,155Electricity 3,490 4,415 5,828 8,334 10,084Reticulation and Plant Maintenance 1,280 1,408 1,549 1,704 1,875Chemicals 741 816 897 987 1,085Transport 1,025 1,179 1,356 1,559 1,793General and Administrative Expenses 1,894 2,084 2,292 2,521 2,773Depreciation 4,760 6,160 11,490 13,910 16,692
Total Operating Expenses 22,176 25,945 34,284 40,974 47,458
Operating Profit 2,097 6,022 7,833 15,859 23,937Financial Charges 3,527 3,527 3,527 3,527 3,527
Net Profit before Taxation (1,430) 2,495 4,306 12,332 20,410Provision for Taxation 0 1,123 1,938 5,549 9,185
Net Profit after Taxation (1,430) 1,372 2,369 6,782 11,226
Operating Ratio 91% 81% 81% 72% 66%Financial Charges Cover 0.59 1.71 2.22 4.50 6.79Depreciation/Operating Revenue 20% 19% 27% 24% 23%
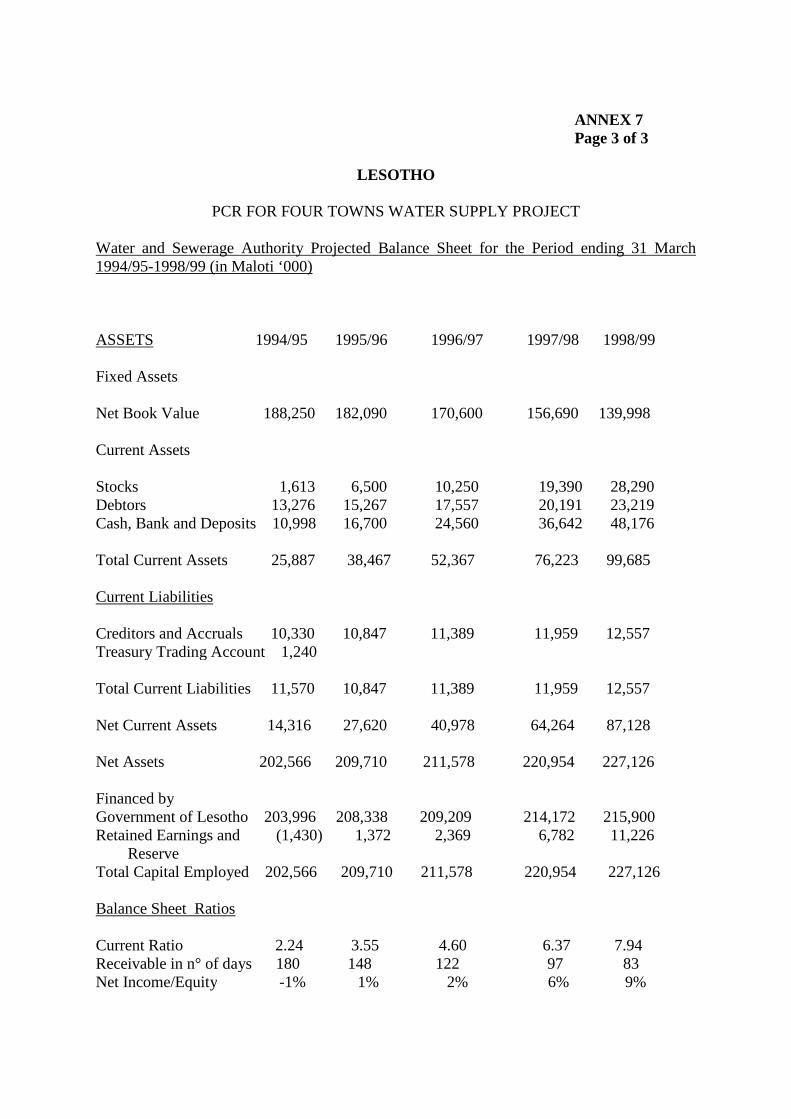
ANNEX 7Page 3 of 3
LESOTHO
PCR FOR FOUR TOWNS WATER SUPPLY PROJECT
Water and Sewerage Authority Projected Balance Sheet for the Period ending 31 March1994/95-1998/99 (in Maloti ‘000)
ASSETS 1994/95 1995/96 1996/97 1997/98 1998/99
Fixed Assets
Net Book Value 188,250 182,090 170,600 156,690 139,998
Current Assets
Stocks 1,613 6,500 10,250 19,390 28,290Debtors 13,276 15,267 17,557 20,191 23,219Cash, Bank and Deposits 10,998 16,700 24,560 36,642 48,176
Total Current Assets 25,887 38,467 52,367 76,223 99,685
Current Liabilities
Creditors and Accruals 10,330 10,847 11,389 11,959 12,557Treasury Trading Account 1,240
Total Current Liabilities 11,570 10,847 11,389 11,959 12,557
Net Current Assets 14,316 27,620 40,978 64,264 87,128
Net Assets 202,566 209,710 211,578 220,954 227,126
Financed byGovernment of Lesotho 203,996 208,338 209,209 214,172 215,900Retained Earnings and (1,430) 1,372 2,369 6,782 11,226
ReserveTotal Capital Employed 202,566 209,710 211,578 220,954 227,126
Balance Sheet Ratios
Current Ratio 2.24 3.55 4.60 6.37 7.94Receivable in n° of days 180 148 122 97 83Net Income/Equity -1% 1% 2% 6% 9%
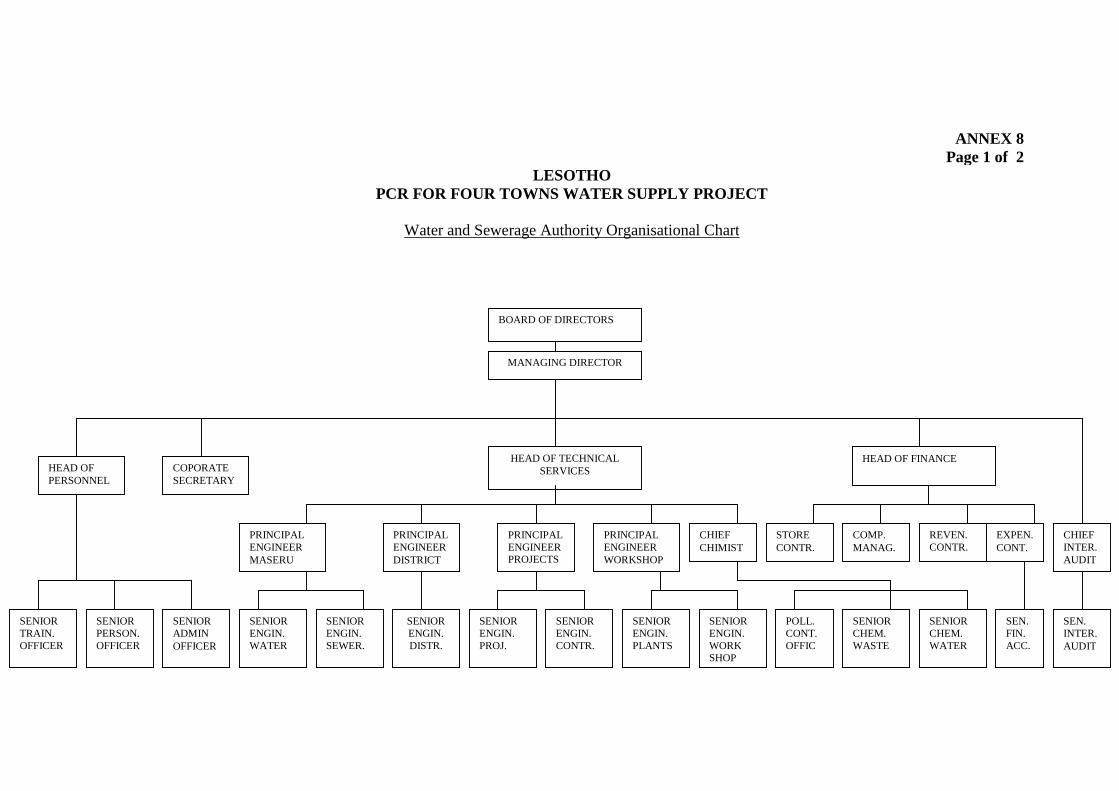
ANNEX 8Page 1 of 2
LESOTHOPCR FOR FOUR TOWNS WATER SUPPLY PROJECT
Water and Sewerage Authority Organisational Chart
BOARD OF DIRECTORS
MANAGING DIRECTOR
HEAD OFPERSONNEL
COPORATESECRETARY
HEAD OF TECHNICALSERVICES
PRINCIPALENGINEERDISTRICT
SENIORTRAIN.OFFICER
SENIORADMINOFFICER
SENIORENGIN.WATER
SENIORENGIN.SEWER.
SENIORENGIN.DISTR.
SENIORENGIN.PROJ.
SENIORENGIN.CONTR.
SENIORENGIN.PLANTS
SENIORENGIN.WORKSHOP
POLL.CONT.OFFIC
SENIORCHEM.WASTE
SENIORPERSON.OFFICER
SENIORCHEM.WATER
SEN.FIN.ACC.
PRINCIPALENGINEERMASERU
PRINCIPALENGINEERPROJECTS
PRINCIPALENGINEERWORKSHOP
CHIEFCHIMIST
COMP.MANAG.
REVEN.CONTR.
EXPEN.CONT.
HEAD OF FINANCE
STORECONTR.
CHIEFINTER.AUDIT
SEN.INTER.AUDIT

ANNEX 8Page 2 of 2
LESOTHO
PCR FOR FOUR TOWNS WATER SUPPLY PROJECTWater and Sewerage Branch Organisational Chart
MINISTRY OFENERGY AND MINING
WSBMANAGING DIRECTOR
ADMINISTRATIVEDEPARTMENT
ADMINISTR. DIRECTOR
ADMINISTRATIVEOFFICER
PERSONNELOFFICER
TRAININGOFFICER
REVENUEACCOUNT
PRINCIPALACCOUNT
SENIORWATERENGINEER
SENIORSEWERAGEENGINEER
ENGINEERING TECHNICALDEPARTMENT
CHIEF WATER&SEWERAGEENGINEER
SUPPLIESOFFICES
FINANCEDEPARTMENT
FINANCIAL CONTROL
STOREKEEPER
WAGE/SALARY
ACCOUNTSSEWERAGEMASERU
WATERMASERU
METERREADER
DISTRICTS