lessons learnt from trading journal 1:- week 1 (29 april ...fx+trading... · trading journal 2 –...
TRANSCRIPT

Trading Journal 2 – Mark Epsley Date 29.04.2013 - 31 May 2013 Lessons learnt from trading journal 1:-
I will start journal 2 next with the following points in mind. I must not trade into resistance or support. I need to measure better the distances and even enter on a lower timeframe. I must have a 12/36 cross. The few successful trades have been after a trend line break, first or second 123. I am learning the importance of a nice looking 123 and a retracement back to the 36 EMA. I am learning the importance of correct top down analysis. Bounce trades may be better in a range?? WEEK 1 (29 APRIL TO 5 MAY) Trade1 GBPCHF 29/04/2013 @10:44Hrs Type: Bounce trade - Aggressive
Weekly- Price is moving sideways. Pressure up. Nearing overhead trend line (blue vertical line).
Daily- Price is moving up to the trend line and 200 EMA, expect a bounce (blue vertical line).

H1 - Price made 2 attempts to break the trend line. Entry on a red candle after the second attempt.
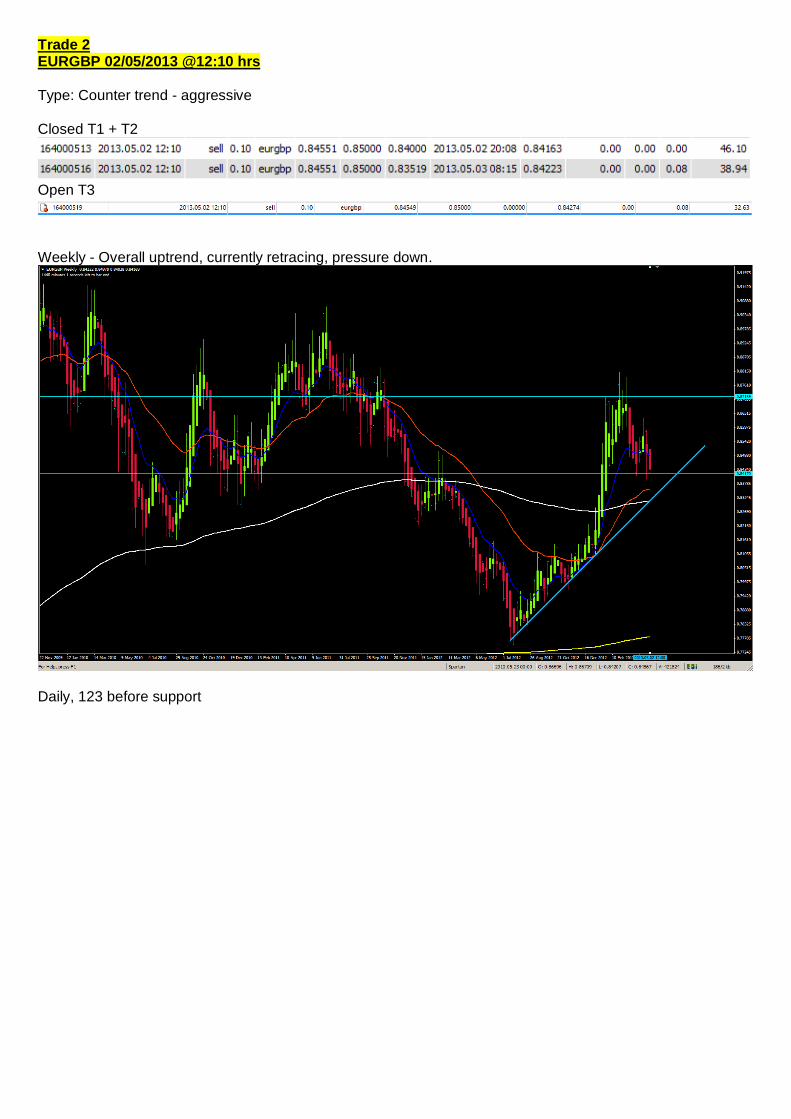
Trade 2 EURGBP 02/05/2013 @12:10 hrs Type: Counter trend - aggressive Closed T1 + T2
Open T3
Weekly - Overall uptrend, currently retracing, pressure down.
Daily, 123 before support

Entry on H4 - Taken out T1 and T2 at daily support line (strong)
One position open in case it breaks. Will manage the third lot aggressively if it breaks the 36. Will not take a loss on this. Later price broke the TL and the 36 (shown below):-

Trade 3 GBPJPY 03/05/2013 @15:38 hrs Type: Non-Farm Payroll Closed T1
Open T2 and T3
Summary as of Friday

How far can this go? Weekly/Daily in an uptrend, H4 and H1 still look bullish. Later, trade went sideways and due to lack of patience, allowed it to stop itself out.
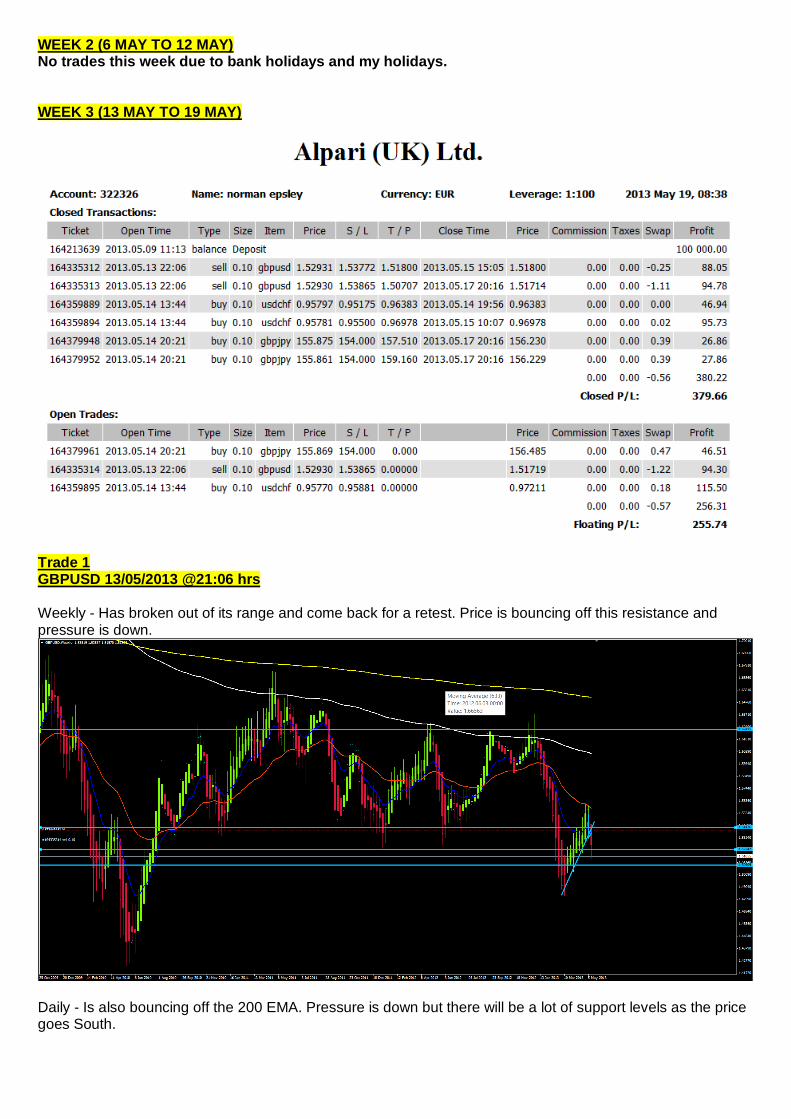
WEEK 2 (6 MAY TO 12 MAY) No trades this week due to bank holidays and my holidays. WEEK 3 (13 MAY TO 19 MAY)
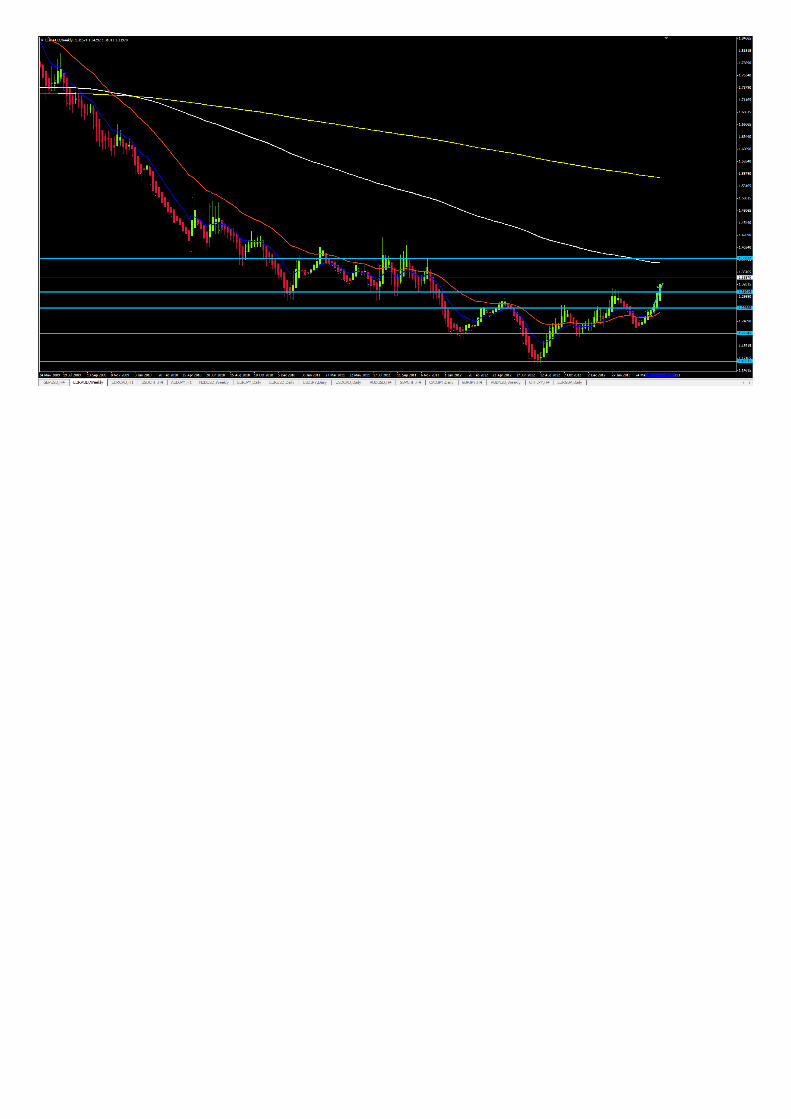
Trade 1 GBPUSD 13/05/2013 @21:06 hrs Weekly - Has broken out of its range and come back for a retest. Price is bouncing off this resistance and pressure is down.
Daily - Is also bouncing off the 200 EMA. Pressure is down but there will be a lot of support levels as the price goes South.
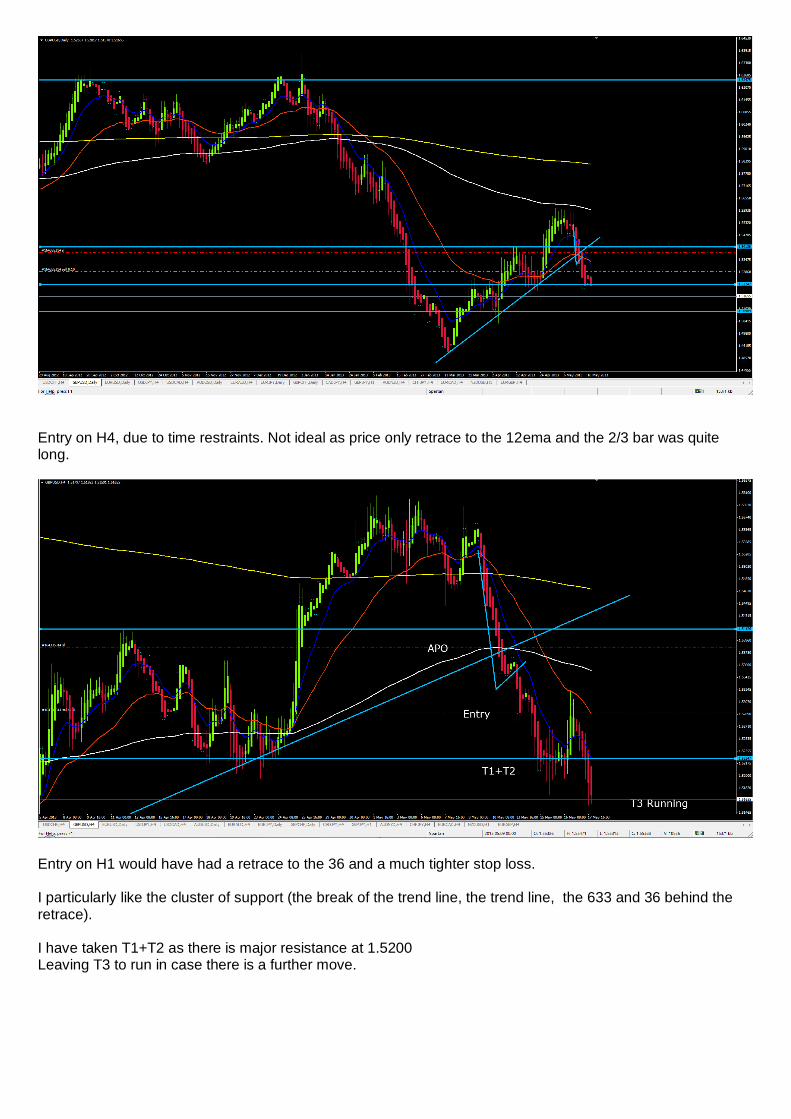
Entry on H4, due to time restraints. Not ideal as price only retrace to the 12ema and the 2/3 bar was quite long.
Entry on H1 would have had a retrace to the 36 and a much tighter stop loss. I particularly like the cluster of support (the break of the trend line, the trend line, the 633 and 36 behind the retrace). I have taken T1+T2 as there is major resistance at 1.5200 Leaving T3 to run in case there is a further move.
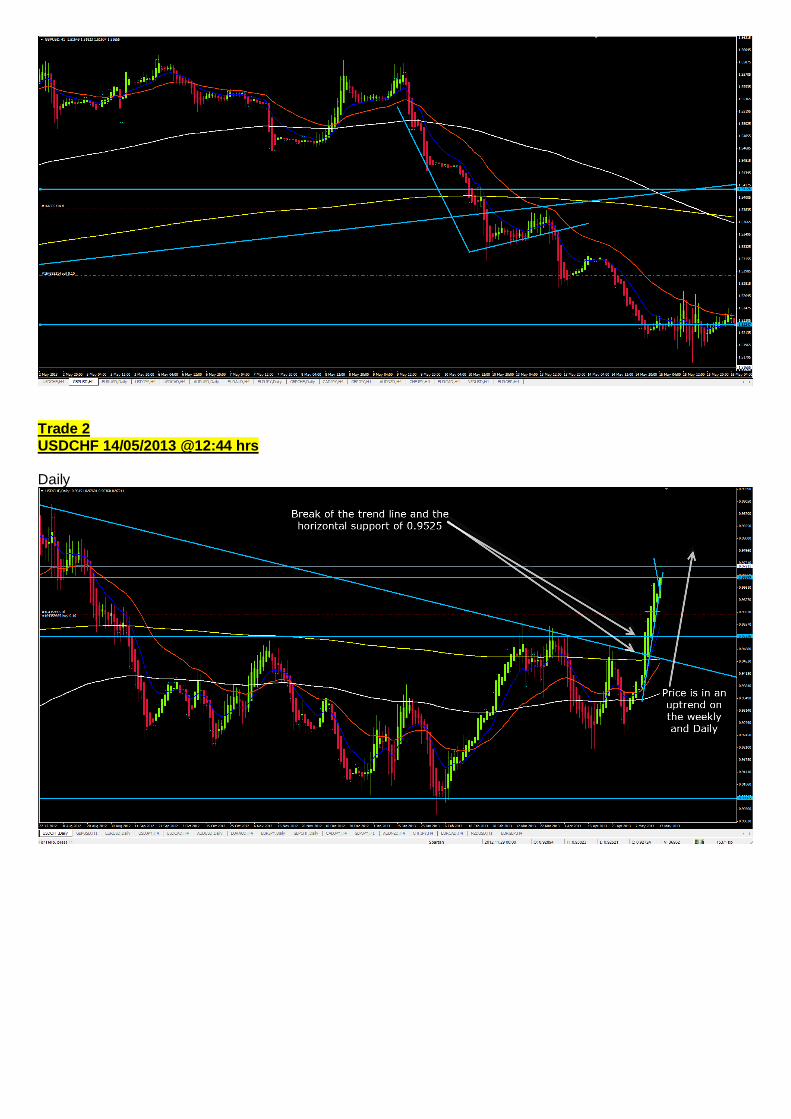
Trade 2 USDCHF 14/05/2013 @12:44 hrs Daily
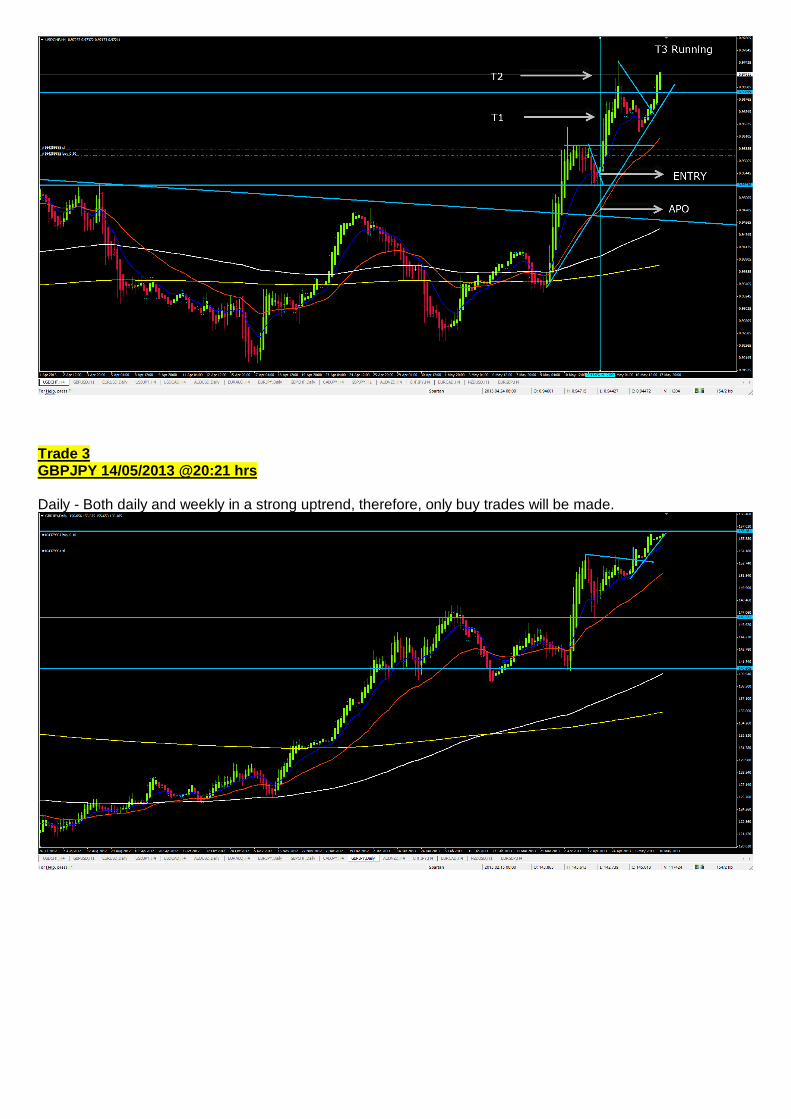
Trade 3 GBPJPY 14/05/2013 @20:21 hrs Daily - Both daily and weekly in a strong uptrend, therefore, only buy trades will be made.
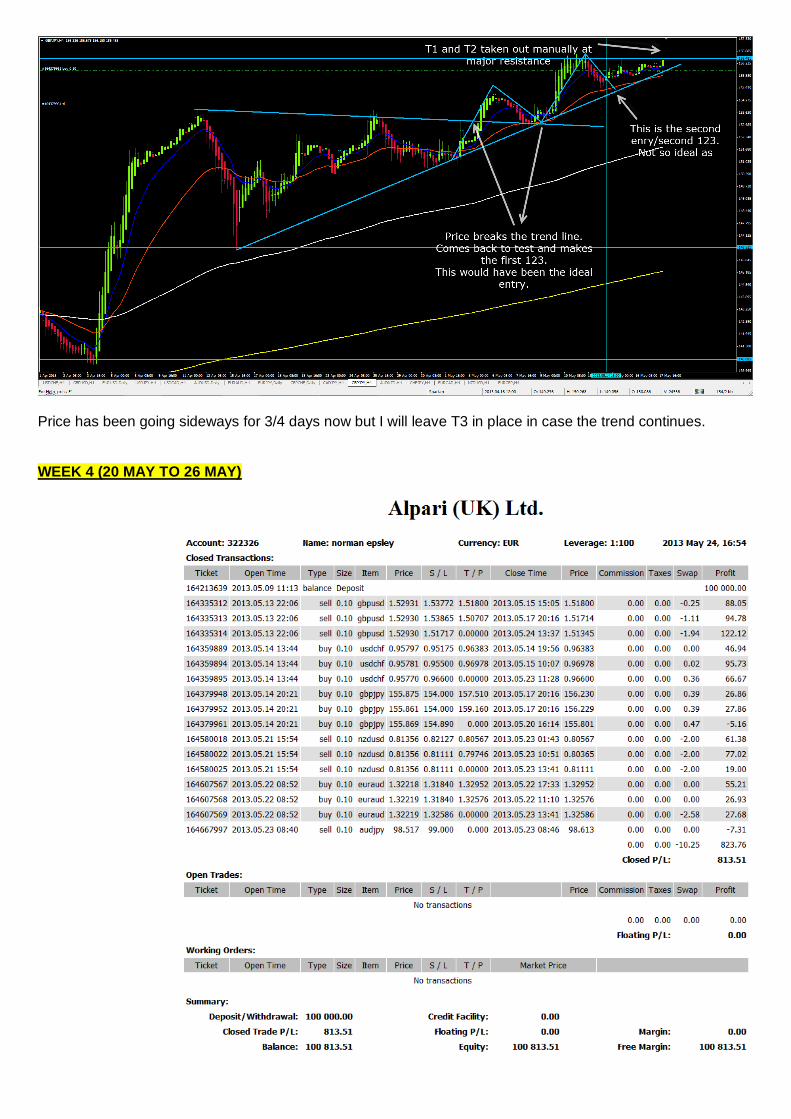
Price has been going sideways for 3/4 days now but I will leave T3 in place in case the trend continues. WEEK 4 (20 MAY TO 26 MAY)

Summary GBPUSD Trade Entry: Entry on H1 after break of trend line. Trend on Weekly, Daily and H4 were down. Trade management: Managed trade on H4. Closed last position, prematurely, based on daily support and higher high and higher low. With hindsight the 36 and trend line are not yet broken. As I am not yet hedging, I am happy bank profits now and wait for a new entry if price continues down.
Summary USDCHF Trade Entry: Entry on H4. Trend on Weekly, Daily were up. Trade management: Managed trade on H4. Closed last position, based lower high and lower low, break ofthe 36 and trend line.
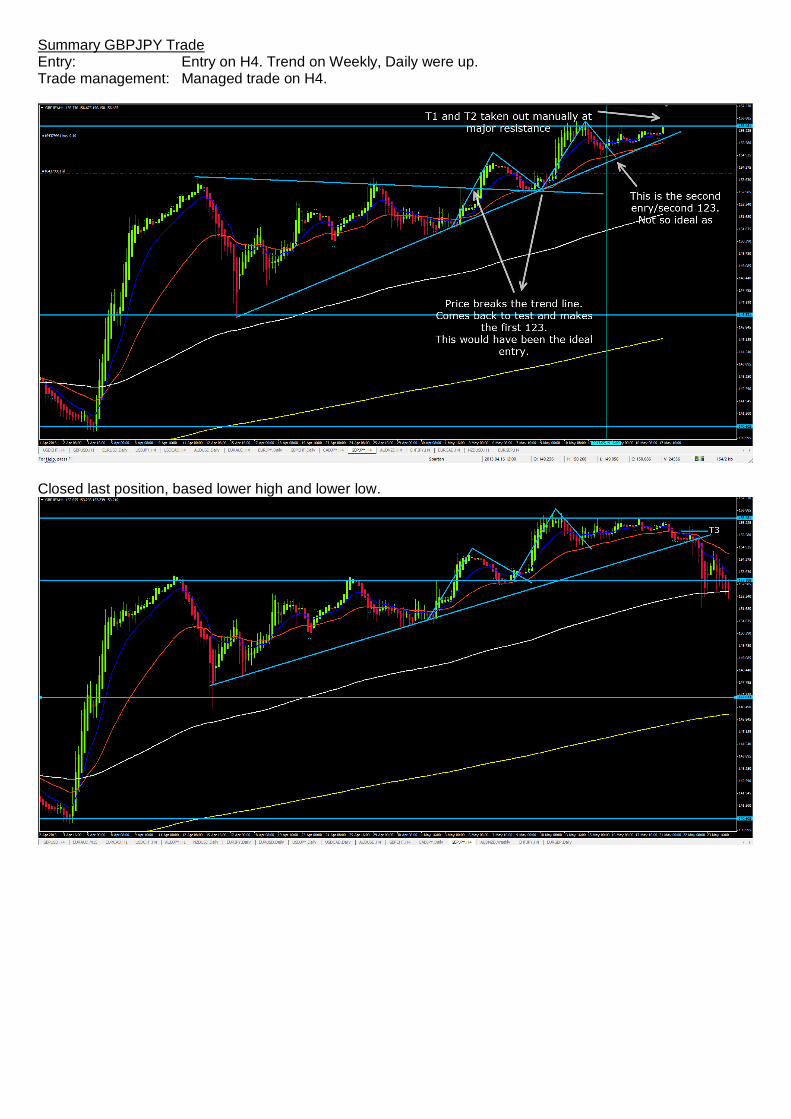
Summary GBPJPY Trade Entry: Entry on H4. Trend on Weekly, Daily were up. Trade management: Managed trade on H4.
Closed last position, based lower high and lower low.

NZDUSD 21/5/2013 @ 14:54 hrs CET
Entry: Entry on H4. Trend on Weekly, Daily were down. Trade management: Managed trade on H4. I know that strong support is nearby so I will manage this trade aggressively. Closed positions around strong daily/weekly support. Prefer to wait for a new entry underneath support if it turns to resistance
EURAUD 22/5/2013 @ 07:52 hrs CET
Entry : On 15 minute 123 Trade Management : On H1 Exit: Exit was on the break of the 36 on the next higher timeframe, that is the H1.
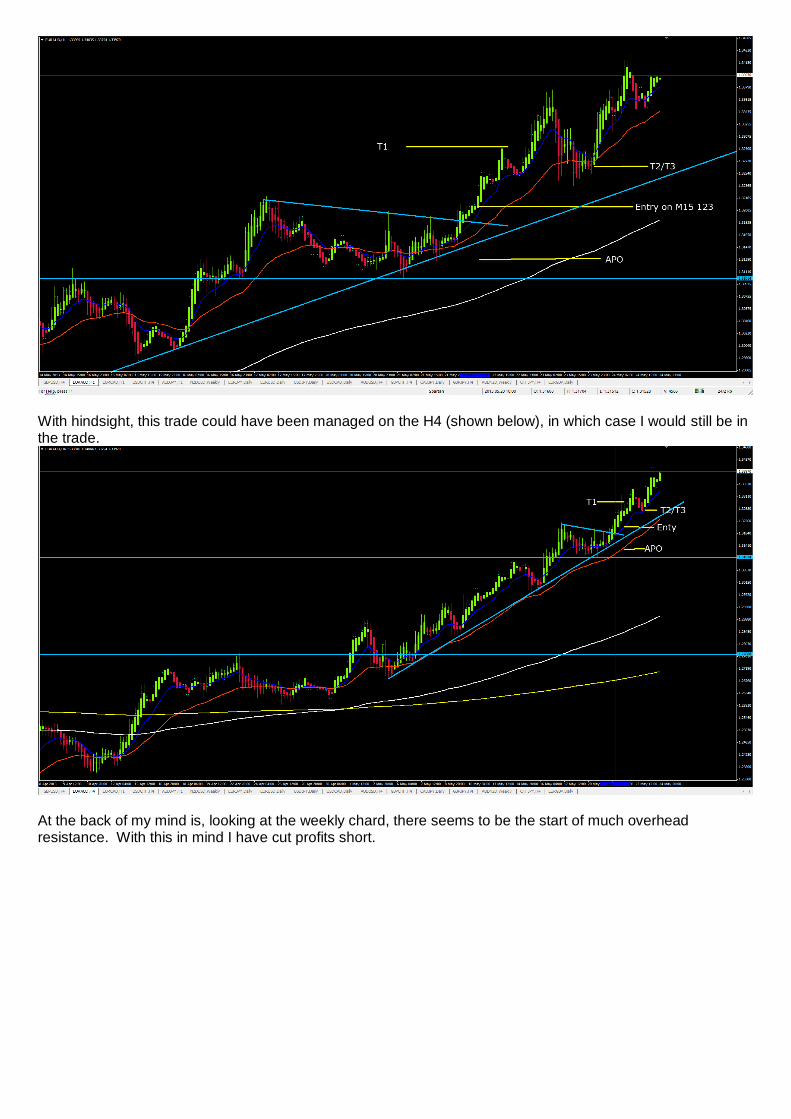
With hindsight, this trade could have been managed on the H4 (shown below), in which case I would still be in the trade.
At the back of my mind is, looking at the weekly chard, there seems to be the start of much overhead resistance. With this in mind I have cut profits short.