let the good times roll? global situation and outlook for ... · good times for merino wool; not...
TRANSCRIPT
Let the Good Times Roll?
Global Situation and
Outlook for Sheep and
Wool
ASI Board of Directors
February 2018
Chris Wilcox
Poimena Analysis
and
Chairman, Market
Intelligence Committee of
IWTO

Grant and Tatiana Roberts,Broken Hill, New South Wales
Prices

Source: Meat & Livestock Australia, Beef & Lamb NZ, USDA, UK Agriculture and Horticulture Development
Board
Notes: Trade lamb carcass weight for Australia; all lamb carcass weight export price for NZ; average 90-
160lb, choice and prime lamb 2-3 for US; Standard Quality Quotation – 12 to 25 kg carcass weight
lamb for the UK
Lamb Prices on the Rise in Australia and NZ
75
100
125
150
175
USA UK
US$ Index: Jan 2013 = 100
75
100
125
150
175
Australia NZ
US$ Index: Jan 2013 = 100

Good Times for Merino Wool;
Not for Broad Wool
0
200
400
600
800
1,000
1,200
1,400
1,600
1,800
2,000
2,200
Aus 18um
South Af 21um
Aus 28um
USc/kgAustralia and South Africa
Source: AWEX, BWMB, NZ Wool Services
Prices to 25th January 2018
NZ Broad crossbred wool is 33-38 micron.
The UK wool price is the British Wool Marketing Board Indicator.
0
100
200
300
400
500
600
700
United Kingdom - Broad
NZ Broad Xbred
USc/kgNew Zealand and the UK
50
75
100
125
150
175
200
All Items Food
Metals Oil
Index: Jan 2016=100
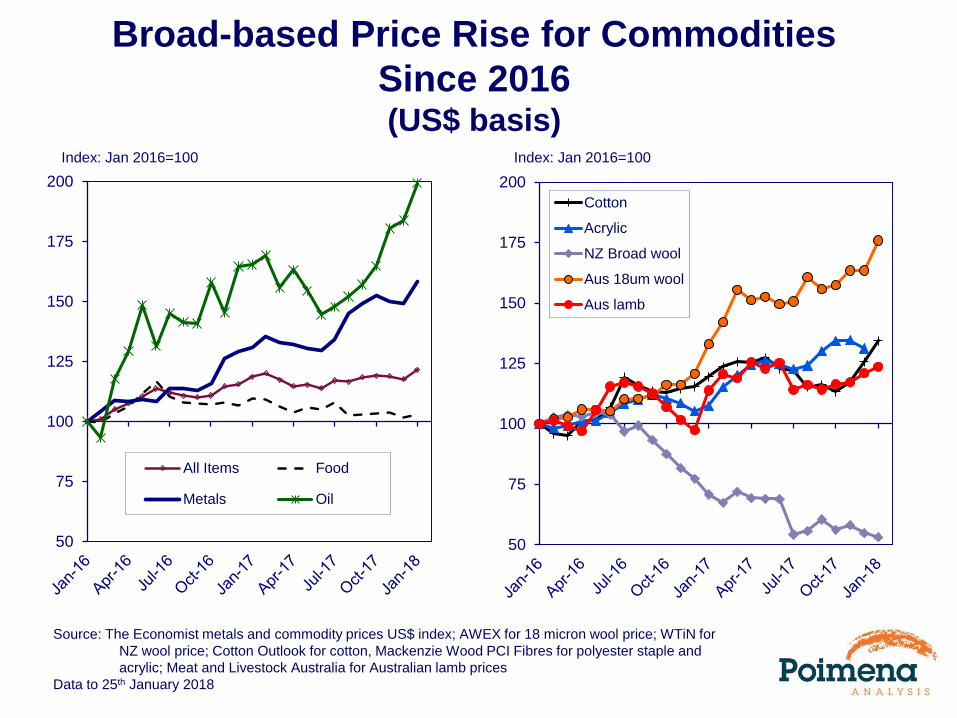
Broad-based Price Rise for Commodities
Since 2016(US$ basis)
Source: The Economist metals and commodity prices US$ index; AWEX for 18 micron wool price; WTiN for
NZ wool price; Cotton Outlook for cotton, Mackenzie Wood PCI Fibres for polyester staple and
acrylic; Meat and Livestock Australia for Australian lamb prices
Data to 25th January 2018
50
75
100
125
150
175
200
Cotton
Acrylic
NZ Broad wool
Aus 18um wool
Aus lamb
Index: Jan 2016=100

Production and Supply

0
2
4
6
8
10
12
14
16
mill tonnes World Sheepmeat Production
600
700
800
900
1000
1100
1200
'000 head World Sheep Numbers
World Sheepmeat Production Up
Source: OECD-FAO
Note: The year refers to the season ending e.g. 2000 = 1999/2000
Data in 2017 is an estimate and for 2018 is a forecast
Updated January 2018

Source: Meat & Livestock Australia, Beef & Lamb NZ, OECD-FAO
f forecast
Updated January 2018
Lamb Production and Exports on the Rise in
Australia
0
50
100
150
200
250
300
350
400
450
500
550
600
Production
Exports
‘000 tonnes carcase weight
Australia
0
50
100
150
200
250
300
350
400
450
500
550
600
Production
Exports
‘000 tonnes carcase weight
New Zealand
ForecastForecast

0
200
400
600
800
1000
1200
1400
1600
1800
mkg clean
Production Opening stocks
Global Wool Production Remains Low
Source: Poimena Analysis, International Wool Textile Organisation
Note: The year refers to the season ending e.g. 2000 = 1999/2000
Data in 2016 is an estimate and data in 2017 and 2018 is a forecast
Updated January 2018
2016 total production
1,140.5 mkg clean
2017 total production
1,147.9 mkg clean
Near 70 year lows
2018 total production
1,158.6 mkg clean
Stocks:Use ratio
~11%

World Production of Meat Grows
0
50
100
150
200
250
300
350
Beef & veal Pigmeat Poultry meat Sheepmeatmil. tonnescwe
Source: OECD-FAO Agricultural Outlook 2017 database
e estimate f Forecast by OECD-FAO cwe carcase weight equivalent
Annual growth rate
2000 – 2017
Beef +1.0%
Pigmeat +1.7%
Poultry +3.5%
Sheepmeat +1.6%

World Production of Wool and Competing Fibres:
Wool Cannot Compete on Volume
0
1,000
2,000
3,000
4,000
5,000
6,000
7,000
8,000
Wool
Cellulosics
'000 tonnes
Source: CIRFS, USDA, Poimena Analysis, IWTO Market Information Report
Note: For wool and cotton the years are seasonal years i.e. 2011 = 2010/11 season
0
5,000
10,000
15,000
20,000
25,000
30,000
Cotton
Synthetic staple
'000 tonnes

Demand

Source: The US Conference Board, the European Commission and www.tradingeconomics.com
Data to December 2017
20
30
40
50
60
70
80
90
100
110
120
130
140
150
US
EU
Index
Jan 2008 = 100
60
70
80
90
100
110
120
130
140
China
Japan
South Korea
Index
Jan 2008 = 100
Consumer Confidence Lifts in the Major Wool
Consuming Countries

0
100
200
300
400
500
600
700Australia
Other Japan
UK Middle East
China USA
Million lbs
Growing Demand for Lamb by China
Source: Beef + Lamb NZ, MLA
0
100
200
300
400
500
600
700
800
900New Zealand
Other Germany
Middle East UK
China US
Million lbs

Higher Sheepmeat Consumption in 2018, but not
in the US
-10%
-8%
-6%
-4%
-2%
0%
2%
4%
6%
8%
World China EU USA Mexico Canada
av 2005-14
2014
2015
2016
2017
2018f
% change yr-on-yr
Source: OECD-FAO
Total consumption in 2017 (‘000 tonnes)
17,712 4,852 1,113 140 76 37
Per capita consumption
1.73 3.08 1.94 0.38 0.52 0.89

World Consumption of Meat Predicted to Lift
3.0%
3.5%
4.0%
4.5%
5.0%
5.5%
0
50
100
150
200
250
300
350
400
Beef & veal Pigmeat
Poultry meat Sheepmeat
Sheepmeat share
mil tonnes
cwe% share
sheepmeat
Source: OECD-FAO Agricultural Outlook 2017 database
e estimate f Forecast by OECD-FAO
cwe carcase weight equivalent
• Growth in per capita
income and population
driving increased meat
consumption
• Higher income leads to
higher protein
consumption
• Growing middle class in
key countries such as
China – focus on quality
• Increased share for
sheepmeat

China Drives Demand for Raw Wool
-60%
-40%
-20%
0%
20%
40%
Australia
New Zealand
Total
% change y-o-y
Source: China Customs, China Wool Textile Association, US Department of Commerce
12 month moving average to November 2017
-80%
-60%
-40%
-20%
0%
20%
40%
60%
80%
100%
Uruguay South Africa
Others USA
% change y-o-y

0 500 1000 1500 2000 2500 3000 3500
Knitwear
Total women'swovens
Total men's wovens
Total wovenwear
Total knit andwoven
US$ million
2017 2016 2015
2014 2013
-11%
-12%
-10%
-14%
-3%
-11%
Decline in Wool Garment Imports by the USValue - year to November
Source: OTEXA


Let the Good Times Roll?
Prospects for 2018 and Beyond
Sheepmeat
1. Production of sheepmeat to lift over next five
years
2. Economic growth gathering pace and
consumers are confident
3. Lower US sheepmeat consumption in 2017
and flat in 2018
4. Increased consumption of sheepmeat by
developing countries, notably China
5. Higher incomes and higher population driving
the increased demand for protein, including
sheepmeat
6. Sheepmeat to gain consumption share (from
other meat - off a low base)
7. Opportunity to lift per capita consumption in
USA?
Wool
1. Low production of finer wool, increased production
of broader wool
2. Higher economic growth and confident consumers
3. Increased raw wool demand, notably from China
4. But wool clothing imports by US declining
5. Merino wool prices doing well, but reaching a
cyclical peak?
6. Long-term demand for superfine Merino wool
growing
7. Increased use of Merino wool in active and
leisurewear
8. Broad wool prices may be at the bottom
9. Can broad wool recover lost markets or develop
new markets?

Some Policy Challenges
• Animal welfare and the consumer
– Wool
– Sheepmeat
• Sustainability
– Life cycle assessment and wool
• Rebuilding flock numbers

Thank You!