leveraging six sigma disciplines to reduce scrap in … enterprise association of australia and new...
TRANSCRIPT
Small Enterprise Association of Australia and New Zealand 26th Annual SEAANZ Conference Proceedings 11-12 Sydney 2013
Leveraging Six Sigma Disciplines to Reduce Scrap in
Indian Foundry SMEs
Bikram Jit Singhᵃ and Dinesh Khandujaᵇ
ᵃMechanical Engineering Department, Maharishi Markandeshwar University, Sadopur, Ambala
(Haryana) India, contact: Email: [email protected]; ᵇMechanical Engineering Department, National
Institute of Technology Kurukshetra, India.
Abstract:
The study focuses on scrap reduction in foundries and tries to find out the reasons of low productivity
index among Indian subcontinent. It briefly discusses some facts and figures about foundry scenario in
world and in the India. The Indian foundry industry is the fourth largest in the world. There are more
than 70,000 foundries in India and most foundries (nearly 95%) fall under small and medium scale
category. For global competitiveness, Indian industries need overall operational and service excellence
and are extensively engaged in Quality Circles, TQM and ISO Certifications. However, these methods
have failed to deliver required performance over the last decade or so. The average growth rate of
productivity for Indian SMEs has been 4.95% in comparison to 7.31% for China, 9.45% for Singapore and
8.65% for Pakistan. It seems a comprehensive quality approach like ‘Six Sigma’ is not fully explored
among Indian industries. This paper tends to shatter the various phobias of SMEs in context of Six Sigma
concepts and its implementation by validating the compatibility of it by performing a case study in an
Indian environment itself. In present case, overall sigma level has been raised by 0.24 by reducing the
scrap of a non-ferrous piston foundry from 22% to 10% after successfully implementing the DMAIC
(Define-Measure-Analyse-Improve-Control) methodology of Six Sigma.
Keywords: Productivity, Non-Ferrous Foundry, DMAIC, Susceptible Sources of Variations
(SSVs), Analysis of Variance (ANOVA), Design of Experiments (DOE)
©copyright Singh and Khanduja (2013) all rights reserved. This article may be used for research, teaching, and private study purposes. Any substantial or systematic reproduction, redistribution, reselling, loan, sub-licensing, systematic supply, or distribution in any form to anyone is expressly forbidden.
INTRODUCTION
India has around 5500 foundries, producing about 3.24 MT of castings worth ten millions (Government
of India, 2002). These units are mostly located in clusters with numbers varying from less than 100 to
around 400 per cluster. Some of the notable clusters in this regard are Agra, Howrah, Batala,
Coimbatore, Kolhapur, Rajkot and Belgaum (Chhabilendra and Roul, 2001). The foundry produces a wide
variety of castings such as manhole covers, pipe and pipe fittings, sanitary items, tube well body, metric
weights, automobile components, railway parts, electric motor, fan body etc. 90% of the castings
produced are from the Small Scale Industry sector (Government of India, 2006). India has exported
castings worth USD 131.35 Million and sanitary castings worth USD 55.39 in 1999-2000, mainly to USA
and Europe (Alistair Nolan, 2003).
LITERATURE REVIEW
In India, productivity levels of SMEs are alarmingly low due to host of problems (Director of Industries,
2003). For higher productivity in SMEs, ‘Defects reduction’ will be one of the most promising and viable
strategy and it will also be capable to cope up the emerging future challenges (Antony et al., 2005). Six
Sigma concept has been widely used in manufacturing sector from last 25 years as company like
Motorola has been improving its processes since 1986 by using its defect reduction approach (Eckes,
2001). Similarly manufacturing giants like General Electric and Honey Well have been using it as cycle
time reduction tool, since 1996 (Zu et al., 2011). Other well-known companies like Ford, Caterpillar, Our
lady of Lourdes medical centre, LG and Samsung etc. are also practicing Six Sigma as a quality
improvement technique in their respective manufacturing processes from 1999. Table 1 cites major
works of the researchers related to application of Six Sigma in manufacturing sector during the past
decade.
After analyzing significant contribution of Six Sigma approach among SMEs, an effort has been made to
implement DMAIC methodology in non-ferrous (medium scale) foundry, without ignoring its existing
Indian constraints. It further demystifies various myths regarding Six Sigma and SMEs, specifically for the
foundry units.

Table-1: Application of Six Sigma in Manufacturing Sector
SN Author(s) Company / Unit Parameters Achievements
1. Henderson & Evans (2000)
General Electric Company
Implementation as a quality tool. Reduced the cycle time at repair shops.
Annual saving of $2 billion Process improvement done
2. Ingle and Roe (2001)
Medium sized welding unit
Optimization of welding process parameters
Joint strength is increased by 26% and scrap work is reduced by 3%
3. Does et al. (2002)
A bulb manufacturing SME
Improve the process and reduced the shell cracking of bulbs
Sigma level increased from 3.1 to 4.5
6. Hollenstein (2005)
A medium scale IC engine manufacturing unit
Improve the Cpk Process capability improved from 1.1 to 2.9
7. Andersson et al. (2006)
A gravity die casting unit Casting scrap reduced from 23% to 11%
40% reduction in manufacturing cost with annual savings of $72000 p.a.
8. Lin et al. (2008)
Cranberry Drinks Ltd. Improvement in packing process.
DPMO level improved from 3011 to 178 only. 17% reduction in packing time.
9. Antony and Desai (2009)
Wilson Tools Shorten the heat treatment time
Roughly $10000 per year savings. 2% reduction in overall Lead time
10. Singh and Khanduja (2010)
A copper wire manufacturing plant
Quality improvement in rolling operation
Defect are decreased by 19% within nine months of DMAIC project
[[[[[
PROBLEM FORMULATION
In India, manufacturing industries like foundries do not enjoy monopoly but they have to face
competition (Chaganti and Greene, 2002). To overcome this problem and to retain the share of the
market, it is necessary to constantly improve the quality of the cast product without increasing price of
the products. The price is influenced by the cost of production, which in turn is influenced by rework or
rejection. Attention to quality assurance can reduce the wasteful rework. Aiming for quality in the first
instance can reduce the cost of casting production. This quality production results in the company’s
growth and profitability. Among various reasons responsible for this malady, low utilization of
productive capacity is the major reason, which should cause concern for production planning and for
this capacity waste, rejection and scrap accounts for a major share (Hollenstein, 2005). The technology
gap is alarming and a company in India spends less than 0.6% on average, of its turnover on R&D as
against the world average of 2.5% (Coronado and Antony, 2002). In a small unit, where investment in
plant and machinery is less than Rs.10 million, productivity and profitability are indispensable to assess

the performance of such an organization. Arita and McCann (2002) in their study have observed that
reduction in cost and product rejection rate are among the main pressures on small units. The main
barriers for these units to be competitive are inadequate technologies causing lot of defects, poor
human expertise and scarcity of resources impairs their ability to become internationalized (Lucas,
2002).
METHODOLOGY ADOPTED
For global competitiveness, Indian industries are working hard to achieve overall operational excellence
in their business (Zu et al., 2011). Six Sigma has evolved into a powerful business improvement
methodology in many Indian industries and its importance is growing (Voelkel, 2002). Within Indian
SMEs, this paper has validated the concept of Six Sigma successfully by unveiling a tested DIMAC
methodology for foundry SMEs. In the present market, competitors are looking for flexibility and shorter
production lead times because only such a configuration of production system can fulfil the ever-
changing demands of customers (Antony, 2004). But for this it is necessary to have less scrap as it is well
known that this will result into economic production (Eckes, 2001). To handle these challenges,
competitors are forced to move towards such strategies/techniques which can make production less
costly and of optimum quality. Wright and Basu (2008) highlight that by Scrap reduction, one can have
maximum utilization of machine or equipment, which will obviously enhance the production rate and
make the overall production more feasible. This can be remarkably tackled by inculcating above cited
DMAIC approach uniformly in the given foundry conditions, particularly in foundry SMEs of India. Six
Sigma is a highly structured program developed by Motorola and used to improve quality world widely
(Singh and Khanduja, 2010). This contains a number of management and statistical tools and techniques
in its respective phases (Lin et al., 2008). There is always a risk of choosing wrong tools due to
negligence or production constraints for performing improvements, that ultimately leads to failure of
this approach and it only bounds to produce paper work projects that are far away from real world
savings. The proposed work tries to simplify the phases of Six Sigma and categories the given
tools/techniques with respect to their utility and further successfully validates its effectiveness by
conducting a successful case study in a non-ferrous foundry.
Literature review also shows that Six Sigma research has been mostly empirical in nature which
reinforces the use of real-world data. Case study was the dominant approach in Six Sigma research and
this is perhaps due to the fact that quality problems in manufacturing and service contexts are usually
treated as a case in terms of documentation and analysis. Figure 1.9 defines the growing gap over the
years between case study method and other research methods, particularly survey research. Case study
method is used to document and analyze Six Sigma implementation in particular contexts; industry,
service, process or phase of a specific project. In addition, the lack of implementing Six Sigma tools and
methodologies across a wide range of processes or organizations makes the use of survey approach
impractical. The graph in figure 1 shows that case study based approach has been well acceptable and
successful since 1992, as far as Six Sigma concept and its implementation are concerned. From 2004 to
2008, researchers seem to be using this approach exponentially as compared to survey based and
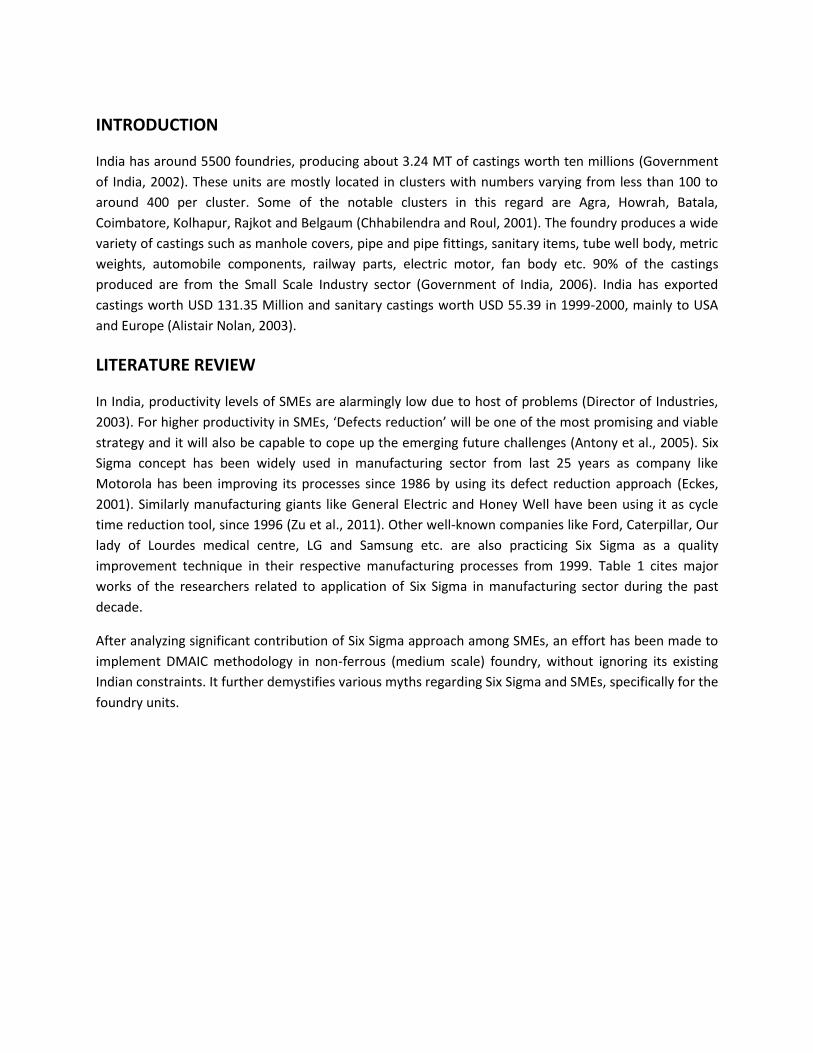
review based frameworks by analyzing the benefits and authenticity of case study based works in the
field of Six Sigma.
Figure-1: Historical Trend of Six Sigma Implementations
(Source; Aboelmaged, 2009)
The present work has taken this case study based approach to achieve the pre-defined goals and
objectives relating to Six Sigma implementation in Indian foundries.
A CASE STUDY
A case study has been carried out in a non-ferrous foundry at Federal Mogul India Limited Bhadurgarh,
Patiala (Punjab) which casts around 9.5 million pistons annually. Foundry has a covered area of about
50144 m2 and was established in 1954. It is a medium scale unit used to cast pistons for export to US
and uses mostly semi-automatic die casting machines. Dies of different types of pistons have been
installed on machines as per the monthly planning/scheduling and pouring of metal is performed
manually by operators. Foundry under consideration is used to cast piston of diameter ranging from
30mm to 300mm and capable to manufacture 13 million pistons per annum. In July 2010, a six months
Six Sigma project was initiated to reduce the scrap of export-pistons (form 22% to 10% approximately).
The main five phases of project (Define, Measure, Analyse, Improve and Control) have been executed in
the given foundry environment to make the Six Sigma implementation more compatible with the
present dynamic environments of foundry industry.
Define phase
The first step was to precisely define the problem, keeping in mind business objectives, customer needs
and feedback (Singh and Khanduja, 2012a). This involves identification of Critical to Quality (CTQ) issues
and other items that have an impact on quality and customer satisfaction.
Major Tools Used: Voice of Customer (QFD), Project Charter, Project Scheduler, Historical analysis of
problem, Process by Value Stream Mapping and Project Goals.
Findings: The house of quality was generated to hear the voice of customers effectively and ‘reduction
in casting scrap’ has been adopted as the most critical issue (refer figure 2). To define the problem of
large scrap quantitatively, previous six month’s data was collected regarding scrap and good pieces from
production reports. It was found that H-749 pistons had around 20% to 24% of scrap, which was causing
substantial financial and non-financial losses. The impact of high rejection became clearly obvious as net
rejection cost came out to be around Rs.30,70,000/-per annum and is substantial for a medium scale
foundry. For intense focusing on the foundry. The whole process was mapped (refer figure 3). Key
process input variables at each operation were found out and further classified into three categories;
Noise Variables, Critic Variables and Controlled Variables respectively.
Measure phase
Measure phase is the second step after defining the problem which involves measurement system
analysis, capability studies and finding performance gaps for the identified problem (Singh and
Khanduja, 2012c).
Major Tools Used: Sigma Calculator, Pareto Charts, Cause and Effect Matrix, Gauge R&R study, Bias
Checking and Stability Test.
Findings: The existing sigma level of casting process has been calculated by a sigma calculator that works
on the principle of DPMO and this was calculated as 3.43 for the process. The existing foundry process
has been mapped minutely and drawn as in figure 3 ahead. Pareto chart has defined all the 20% factors
that are causing 80% of the problem (see figure 4). In the present case shrinkage at ring zone and skirt,
bottom thickness (BT) variation, blow holes in ring zone and bottom, cold lap and porosity are emerging
as the prime reasons of high casting scrap in H-749 pistons.

Figure-2: House of Quality
Θ Θ Θ Θ
Imp
orta
nce
to
Cu
stom
er
Eva
ult
ion
of
Ven
dor
s
Goo
d P
roce
ss C
ontr
ols
Red
uct
ion
in
Scr
ap d
ue
to
Cas
tin
g D
efec
ts
Les
s D
ie/M
ach
ine
Set
up
tim
e
Imp
lem
enta
tion
of
Mai
nte
nan
ce S
ched
ule
s
En
sure
Ad
her
ence
of
Qu
alit
y
Sys
tem
Goo
d I
nsp
ecti
on P
lan
s
Tec
hn
olog
y
Up
grad
atio
n/I
nn
ovat
ion
Tra
inin
g P
lan
s fo
r W
ork
For
ce
Eff
icie
nt
Sch
edu
lin
g to
com
ple
te P
rod
uct
ion
Ord
ers
Completeness
Criteria
M M H H M H M M L M
15 15 45 45 15 45 15 15 5 15
L M H M M M M M L L
5 15 45 15 15 15 15 15 5 5
M M M N L H H L M N
12 12 12 0 4 36 36 4 12 0
N M L H L L L H M M
0 15 5 45 5 5 5 45 15 15
L M H N N M M M M N
5 15 45 0 0 15 15 15 15 0
L L N N N L N H M L
3 3 0 0 0 3 0 27 9 3
H M H N L M M M M L
27 9 27 0 3 12 12 12 12 3
M H L N H M M M L N
15 45 5 0 15 15 15 15 5 0
M M H N L M L M N M
9 9 27 0 3 9 3 9 0 9
M M H L M M M M H H
15 15 45 5 15 15 15 15 45 45
IMPORTANCE RATING OF X's 106 153 256 110 75 170 131 172 123 95
10%
Symbol Relationship Between X & Y Rating
H Strong (H) 9
M Medium (M) 3
L Weak (W) 1 Θ
N No Relation (N) 0
5
3
5
3
5
5
4
3
5
5
6
5
4
3
Meet Deadlines/Schedules
Strong Information System
Reduce Rework
TARGET DIRECTION
1
7
Satisfy Quality Initiatives (Overall Quality of the Product)
Reduction in Production Cost
Reduce Waste
Develop Closer Supplier Relations
Less Dimensional Problems
Accountabilty of Supplied Product
2
Cycle Time Reduction
Targer Directions
More is Better
Less is Better
Specific Amount
125
48
117
130
230
150
VOC ( Machine Shop)
TARGET VALUE OF CTC (Critical to Customer) FACTOR
128
155
78
23010
9
8

26th
Annual SEAANZ Conference 2013 Page | 13
Figure-3: Process Mapping with Key Performance Input Variables (KPIVs)
Figure-4: Pareto Chart for Defect Analysis
Step 5:
F
A B B,C C D E
J,K,L I
H G
Steps
10.- Die preparation Input Classification
20.- Ingots transportation to foundry Critic
30.- Ingots storage (in Cell) Controlled
40.- Furnace charge Noise
50.- Melting
60.- Degassing and flux treatment A.- Die coating
70.- Holding time and impurity flotation B.- Furnace charge relation
80.- Start up casting cell machine C.- Molten metal temperature
90.- Pouring D.- Density Index (ID)
100.- Croppers E.- Cycle time
110.- AQFD F.- Pouring speed
120.- Visual inspection and baskets accommodation G.- AQFD
130.- Storage before heat treatment H.- Without visual defects
140.- Heat Treatment I.- Aging
150.- Q.A. Release J.- Microstructure
160.- Transportation to release material area K.- Hardness
170.- Storage before machining L.- Chemical analysis
Write Down and Classify the Key Process Input
CTQ's
10 20 30 40 50 60
ID=1,5 max.
Si
No
7080 90
100
110120130Si
No
Scrap
130140150Si
No
Scrap
160170
Die temperature
Die coating density
Spray gunFree of humidity
Free of slag
Charge relation
(60 Ingot /40 scrap)
Temperature
Metal Temp.
N2 Flow
RPM
TimeTime
Water cooling
system
Cycle time
Pouring speed
Ladle cleaning
Metal temperature
Die Coating
Water cooling time
Water coling temp.
Ingate separation
AQFD
Free of visual
defects
Separate in baskets by
cavity
Temperature
Time
Chemical Analysis
Microstructure
Hardness
Q.A. Release card
10 20 30 40 50 60
ID=1,5 max.
Si
No
7080 90
100
110120130Si
No
Scrap
130140150Si
No
Scrap
160170
10 20 30 40 50 60
ID=1,5 max.
Si
No
7080 90
100
110120130Si
No
Scrap
130140150Si
No
Scrap
160170
NUMBERS 26 19 52426 203 133 99 98 52 40 32
Percent 2.2 1.6 4.436.1 17.2 11.3 8.4 8.3 4.4 3.4 2.7
Cum % 94.0 95.6100.036.1 53.3 64.6 73.0 81.3 85.7 89.1 91.8
DEFECTS
Other
Cold la
p
Def. B
lank
s In
side
Poro
sity Skir
t
Shrin
kage
Skir
t
Blow
Holes
Bot
tom
Shrinka
ge B
otto
m
Poro
sity Rin
g Zo
ne
Blow
Holes
Ring
Zone
Botto
m th
ickne
ss var
iatio
n
Shrin
kage
Ring
Zone
1200
1000
800
600
400
200
0
100
80
60
40
20
0
NU
MB
ERS
Pe
rce
nt
Pareto Chart of H-749
26th
Annual SEAANZ Conference 2013 Page | 14
By conducting Cause & effect Analysis, Process parameters (SSVs) like; In-gate Design, Die
Temperature, Die Coating Thickness, Alloy Temperature, Discharge of Cooling Water, Shift
Dependency and Delay during Casting have been measured as the main reasons of the above defects
in piston castings. The next crucial step in the measurement phase is the measurement of the
accuracy and precision of already ‘in-use’ measuring equipment s or gauges. In the present case, it
was decided to validate the calibration by conducting Gage R&R study for bottom thickness gauge
(BT gauge), bias checking of immersion pyrometer and stability test of Vac-tester (metal density
checker) respectively.
Analyze phase
At the end of Measure Phase, seven critical to quality (CTQ) process parameters were short listed
and these seemed to be the major reasons for high scrap. As per DMAIC methodology, before
targeting these susceptible sources of variations (SSVs) through ‘Improve Phase’, the authenticity
and impact realization of each SSV on scrap, is required to be judged by conducting suitable
investigation under Analyse Phase. This phase helps to focus improvement efforts on those SSVs
which can be highly significant (Singh and Khanduja, 2011a).
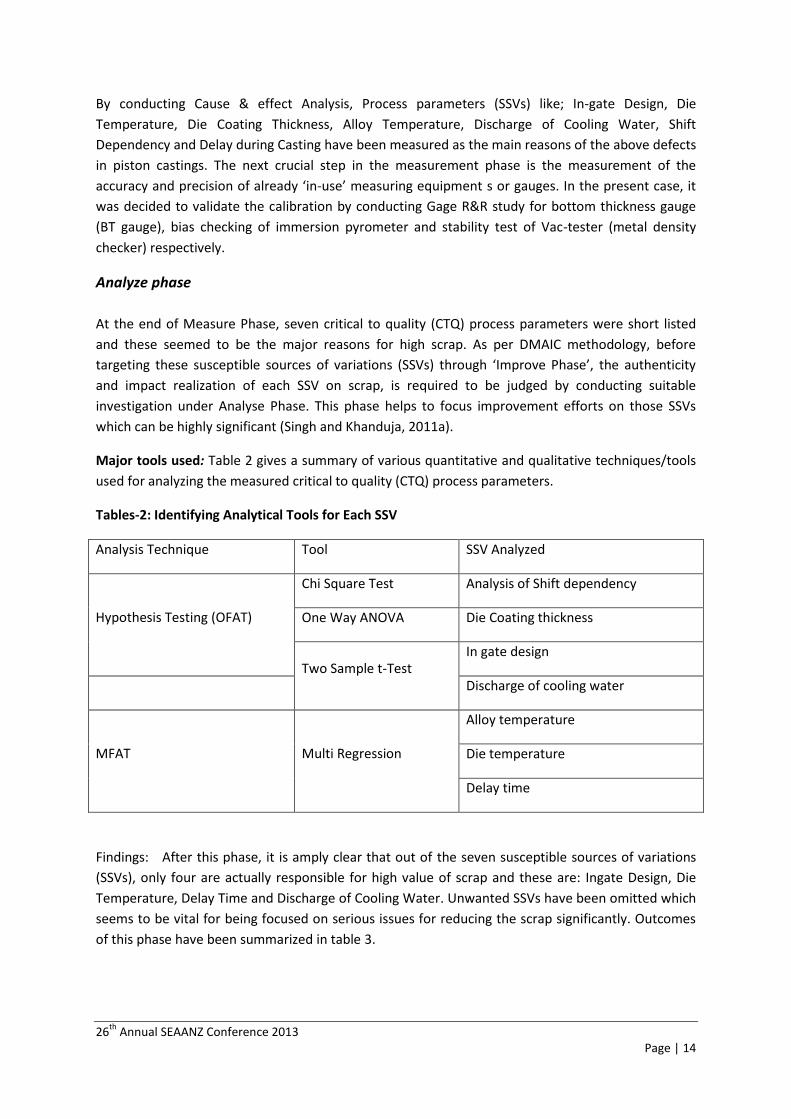
Major tools used: Table 2 gives a summary of various quantitative and qualitative techniques/tools
used for analyzing the measured critical to quality (CTQ) process parameters.
Tables-2: Identifying Analytical Tools for Each SSV
Analysis Technique Tool SSV Analyzed
Hypothesis Testing (OFAT)
Chi Square Test Analysis of Shift dependency
One Way ANOVA Die Coating thickness
Two Sample t-Test In gate design
Discharge of cooling water
MFAT Multi Regression
Alloy temperature
Die temperature
Delay time
Findings: After this phase, it is amply clear that out of the seven susceptible sources of variations
(SSVs), only four are actually responsible for high value of scrap and these are: Ingate Design, Die
Temperature, Delay Time and Discharge of Cooling Water. Unwanted SSVs have been omitted which
seems to be vital for being focused on serious issues for reducing the scrap significantly. Outcomes
of this phase have been summarized in table 3.

26th
Annual SEAANZ Conference 2013 Page | 15
Table-3: Out Comes of Analyse Phase
Analysis of Shift Dependency: The
overall chi- square value is coming
out to be 6.150 and value of p is
0.908 at 12 degree of freedoms. As it
is higher than 0.005. The null
hypothesis cannot be rejected at 5%
significance level. Therefore there is
no difference between the mean
scrap value of morning, afternoon
and night shift. Hence it makes clear
that this factor does not contribute
to scrap in the shop-floor and can be
dropped here only.
Effect of Die Coating Thickness:
Under given temperature and time
conditions, die has been made to run
with various coating thicknesses (i.e.
at 50 microns, 80 microns 110
microns and 140 microns)
separately. After giving input of
above data, Minitab has compiled
Analysis of Variance for all the four
groups and generated p value as
0.932 at 95% confidence level. It
implies again that the null
hypothesis is acceptable. The graph
drawn shows less variation among
the mean of all populations. Hence
this factor seems to be less
significant in context of high casting
scrap.
Impact of In-gate Design: This
analysis contains two groups and
each has samples less than 30, hence
2-sample t-test is best for such type
of data populations. For this analysis,
two piston dies of H-749 have been
selected, one has existing runner
riser volume (i.e. 250-260 cm3) and
other is modified to the volume of
runner riser up to 260-270 cm3 (by
altering the gate design). t-value is
coming out to be 4.63 and
probability value (p) is 0.001, which
is less than 0
confidence). It concludes that the
null hypothesis has been rejected in
the favour of alternate hypothesis
for the given two populations.
Session Confirmation from MinitabExpected
value =
(Row obs. total) * (Column obs. total)
Grand observation Total
Expected Value of “B.T.” in Defect
type of the N/S
E = (26 X 31)/77 = 10.47
Chi-Square = (O-E) / E
Chi-Square = (13-10.47) /10.47
= 0.613
2
2
Since P Value > 0.05 ;
Reject Ha , Accept Ho
Hence Scrap in piston
foundry is independent of shifts
B.T.vary B. hole Prsty Shrkg Dep. C. lap P.H. defect Total
1 13 4 1 3 2 1 2 26
10.47 4.05 2.03 3.71 1.69 2.03 2.03
0.613 0.001 0.520 0.137 0.058 0.520 0.000
2 8 6 2 3 1 2 2 24
9.66 3.74 1.87 3.43 1.56 1.87 1.87
0.286 1.365 0.009 0.054 0.200 0.009 0.009
3 10 2 3 5 2 3 2 27
10.87 4.21 2.10 3.86 1.75 2.10 2.10
0.070 1.158 0.382 0.339 0.035 0.382 0.005
Total 31 12 6 11 5 6 6 77
Chi-Sq = 6.150, DF = 12, P-Value = 0.908
Die co
ating thick
ness
140
µm
Die co
ating thick
ness
110
µm
Die co
ating thick
ness
80µ
m
Die co
ating thick
ness
50µ
m
10.0
9.9
9.8
9.7
9.6
9.5
Da
ta
With Enlarged volume of RunnerWith Existing volume of Runner
22.00%
20.00%
18.00%
16.00%
14.00%
12.00%
10.00%
Da
ta
Boxplot of With Existing volume of Runner, With Enlarged volume of Runner

26th
Annual SEAANZ Conference 2013 Page | 16
It implies that with increase in
runner and riser volume (or altering
In-gate design) casting defects are
reducing.
Discharge of Cooling Water: The p
value for this factor is less than 0.05
while conducting the 2 sample t-test.
So, Discharge of cooling water has also erupted as major factor for
casting defects as null hypothesis of no affect has been rejected.
Analysis of Process Parameters: In
the present study, three process
parameters (namely; Alloy
temperature, Die temperature and
Delay time) have been measured as
more critical as far as question of
high casting scrap of piston castings
is raised. In order to verify their
dependability on dependent out-put
variable (scrap), the Six Sigma team
has decided to perform Multi-
regression analysis.
The regression calculations and
results have been quoted in sideline
figure. From the calculated p values,
it represents Alloy temperature is in
control conditions and only Delay in-
between casting process and Die
temperature are impacting casting
scrap seriously.
Improve phase
In this phase actions are piloted and real tolerances are established to deliver desired
performance (Singh and Khanduja, 2011b). Various suggestions and new activities have
been added during optimization of the out-put variable.
Major Tools Used: Design of Experiments (DOE).
Findings: Scrap reduction is the main problem which depends upon four selected casting
process variables (factors). Each factor is defined in terms of high and low values of levels
(refer to table 4). To realize the effect of each factor or their interactional impact on scrap,
‘full factorial design’ has been selected for optimizing the process in-put factors. No blocking
Regression Analysis: %age of Scrap versus Alloy Temp., Stoppage (in secs) & Die Temp.
The regression equation is
%age of Scrap = 114 + 0.118 Alloy Temperature + 0.306 Stoppage (in Sec) - 0.745 Die Temp
Predictor Coef SE Coef T P
Constant 114.4 476.2 0.24 0.822
Alloy Temperature 0.1184 0.6554 0.18 0.865
Stoppage (IN Sec) 0.30615 0.08153 3.76 0.020
Die Temp -0.7454 0.2130 -3.50 0.025
S = 7.70734 R-Sq = 83.5% R-Sq(adj) = 71.1%
Analysis of Variance
Source DF SS MS F P
Regression 3 1200.75 400.25 6.74 0.048
Residual Error 4 237.61 59.40
Total 7 1438.37
Source DF Seq SS
Alloy Temperature 1 129.92
Stoppage (IN Sec) 1 343.56
Die Temp 1 727.28
As P>0.05 for Alloy temp.
It implies it is already in control.
As P<0.05 for Stoppage or delay
It effects Scrap positively.
As P<0.05 for Die temperature
It also effects Scrap.
As P<0.05 for overall regression
It implies input variables have
impact on dependent variables.
26th
Annual SEAANZ Conference 2013 Page | 17
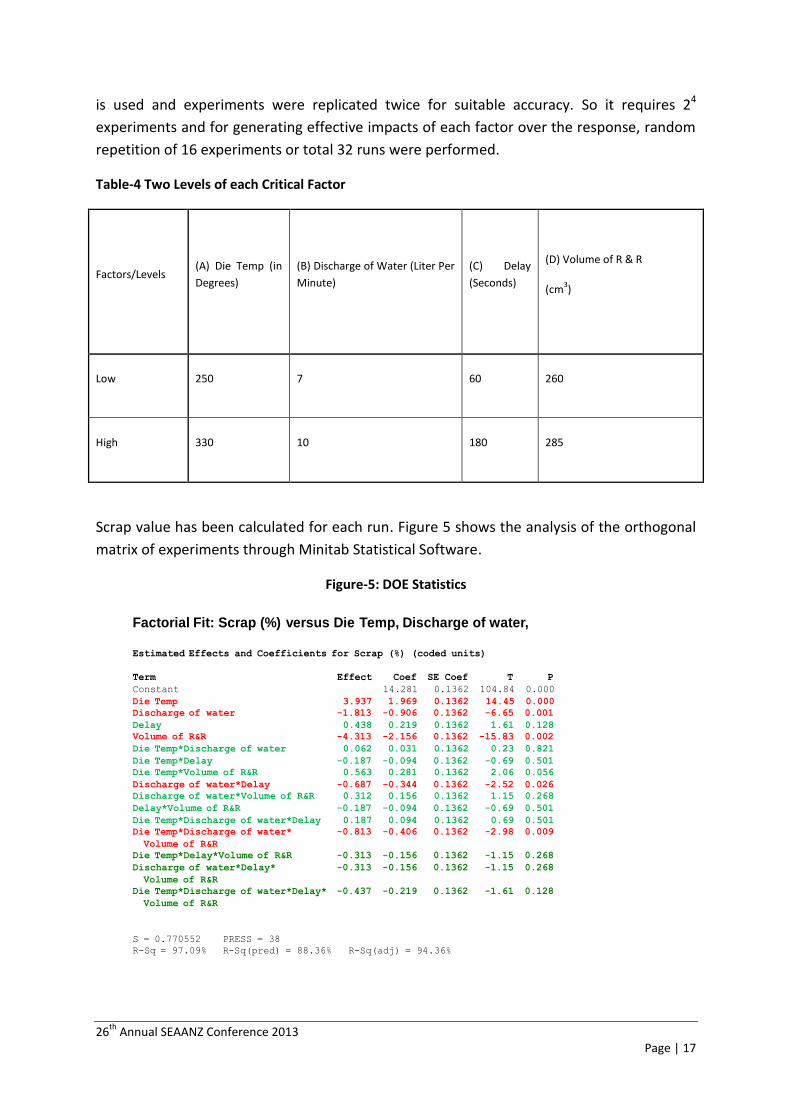
is used and experiments were replicated twice for suitable accuracy. So it requires 24
experiments and for generating effective impacts of each factor over the response, random
repetition of 16 experiments or total 32 runs were performed.
Table-4 Two Levels of each Critical Factor
Factors/Levels (A) Die Temp (in
Degrees)
(B) Discharge of Water (Liter Per
Minute)
(C) Delay
(Seconds)
(D) Volume of R & R
(cm3)
Low 250 7 60 260
High 330 10 180 285
Scrap value has been calculated for each run. Figure 5 shows the analysis of the orthogonal
matrix of experiments through Minitab Statistical Software.
Figure-5: DOE Statistics
Factorial Fit: Scrap (%) versus Die Temp, Discharge of water,
Estimated Effects and Coefficients for Scrap (%) (coded units)
Term Effect Coef SE Coef T P
Constant 14.281 0.1362 104.84 0.000
Die Temp 3.937 1.969 0.1362 14.45 0.000
Discharge of water -1.813 -0.906 0.1362 -6.65 0.001
Delay 0.438 0.219 0.1362 1.61 0.128
Volume of R&R -4.313 -2.156 0.1362 -15.83 0.002
Die Temp*Discharge of water 0.062 0.031 0.1362 0.23 0.821
Die Temp*Delay -0.187 -0.094 0.1362 -0.69 0.501
Die Temp*Volume of R&R 0.563 0.281 0.1362 2.06 0.056
Discharge of water*Delay -0.687 -0.344 0.1362 -2.52 0.026
Discharge of water*Volume of R&R 0.312 0.156 0.1362 1.15 0.268
Delay*Volume of R&R -0.187 -0.094 0.1362 -0.69 0.501
Die Temp*Discharge of water*Delay 0.187 0.094 0.1362 0.69 0.501
Die Temp*Discharge of water* -0.813 -0.406 0.1362 -2.98 0.009
Volume of R&R
Die Temp*Delay*Volume of R&R -0.313 -0.156 0.1362 -1.15 0.268
Discharge of water*Delay* -0.313 -0.156 0.1362 -1.15 0.268
Volume of R&R
Die Temp*Discharge of water*Delay* -0.437 -0.219 0.1362 -1.61 0.128
Volume of R&R
S = 0.770552 PRESS = 38
R-Sq = 97.09% R-Sq(pred) = 88.36% R-Sq(adj) = 94.36%

26th
Annual SEAANZ Conference 2013 Page | 18
In the present case, it has been found that A, B, D, BC and ABD are more critical factors and factor
interactions, that are affecting overall casting scrap substantially. These are dotted in red and lying
far away from the normal plot line of standardized effects. Figure 6 represents the ‘relative
percentage of significance’ for every factor responsible for scrap. The main effect plots have been
drawn to describe the individual effect of each factor on the response. Figure 7 shows four factors
plotted in between their respective two levels and against scrap to show their impact,
independently. The slope of the main effect line in each plot represents the high impact of that
factor on response.
Figure-6: Normal Plot of Effects to Foreground CTQ Factors
Figure-7: Main-Effect Plot (OFAT)
151050-5-10-15-20
99
95
90
80
70
60
50
40
30
20
10
5
1
Standardized Effect
Pe
rce
nt
A Die Temp
B Discharge of water
C Delay
D V olume of R&R
Factor Name
Not Significant
Significant
Effect Type
ABD
BC
D
B
A
Normal Plot of the Standardized Effects(response is Scrap (%), Alpha = .05)
330250
16
15
14
13
12
107
18060
16
15
14
13
12
285260
Die Temp
Me
an
Discharge of water
Delay Volume of R&R
Main Effects Plot for Scrap (%)Data Means
26th
Annual SEAANZ Conference 2013 Page | 19
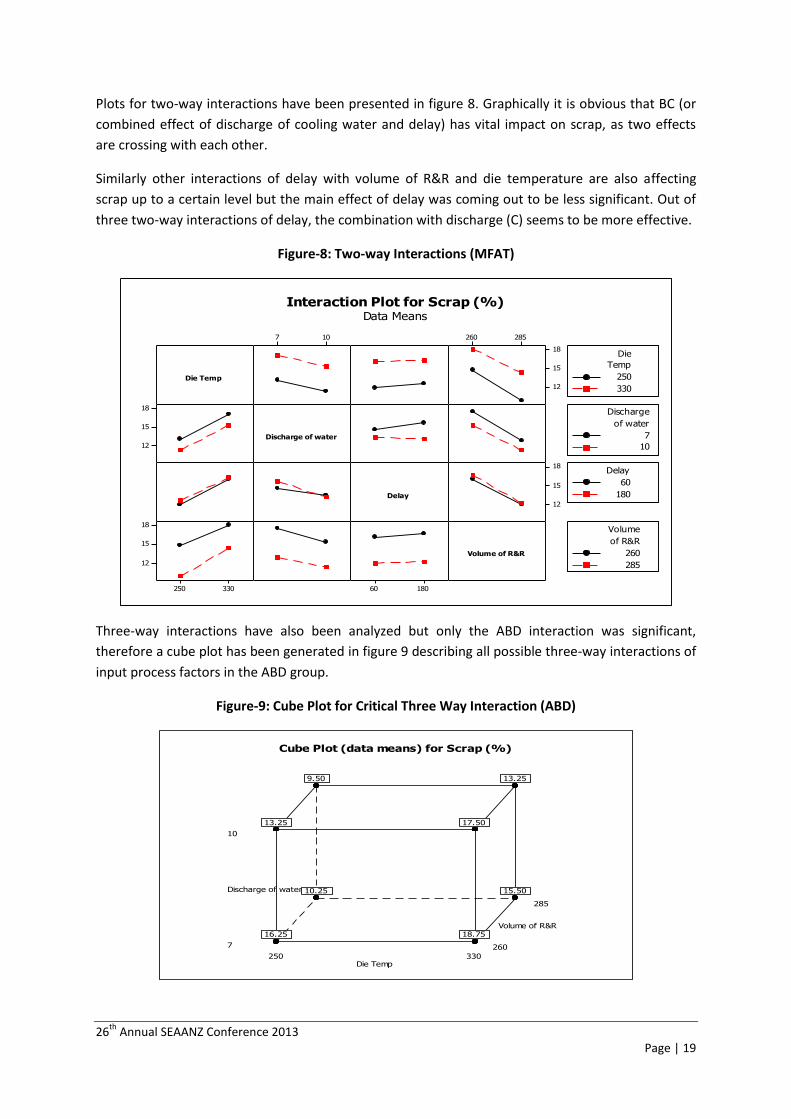
Plots for two-way interactions have been presented in figure 8. Graphically it is obvious that BC (or
combined effect of discharge of cooling water and delay) has vital impact on scrap, as two effects
are crossing with each other.
Similarly other interactions of delay with volume of R&R and die temperature are also affecting
scrap up to a certain level but the main effect of delay was coming out to be less significant. Out of
three two-way interactions of delay, the combination with discharge (C) seems to be more effective.
Figure-8: Two-way Interactions (MFAT)
107 285260
18
15
12
18
15
12
18
15
12
330250
18
15
12
18060
Die Temp
Discharge of water
Delay
Volume of R&R
250
330
Temp
Die
7
10
of water
Discharge
60
180
Delay
260
285
of R&R
Volume
Interaction Plot for Scrap (%)Data Means
Three-way interactions have also been analyzed but only the ABD interaction was significant,
therefore a cube plot has been generated in figure 9 describing all possible three-way interactions of
input process factors in the ABD group.
Figure-9: Cube Plot for Critical Three Way Interaction (ABD)
285
260
10
7
330250
Volume of R&R
Discharge of water
Die Temp
13.25
15.5010.25
9.50
17.50
18.7516.25
13.25
Cube Plot (data means) for Scrap (%)
26th
Annual SEAANZ Conference 2013 Page | 20
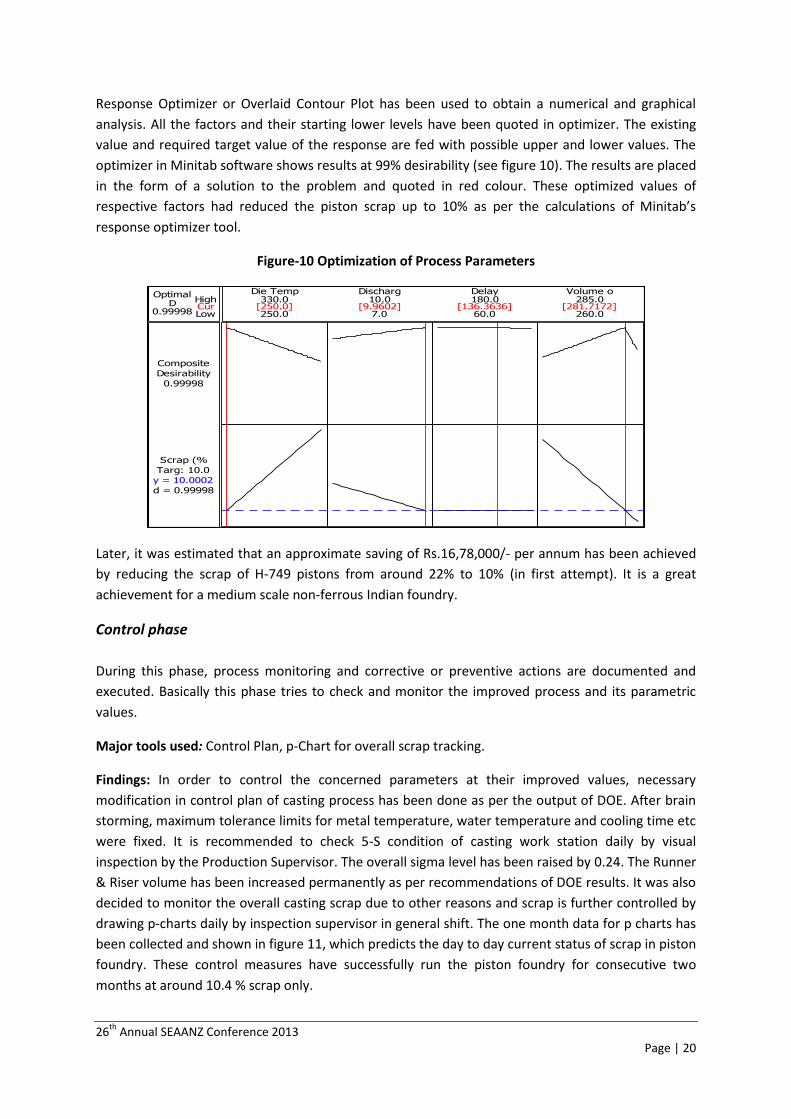
Response Optimizer or Overlaid Contour Plot has been used to obtain a numerical and graphical
analysis. All the factors and their starting lower levels have been quoted in optimizer. The existing
value and required target value of the response are fed with possible upper and lower values. The
optimizer in Minitab software shows results at 99% desirability (see figure 10). The results are placed
in the form of a solution to the problem and quoted in red colour. These optimized values of
respective factors had reduced the piston scrap up to 10% as per the calculations of Minitab’s
response optimizer tool.
Figure-10 Optimization of Process Parameters
CurHigh
Low0.99998D
Optimal
d = 0.99998
Targ: 10.0
Scrap (%
y = 10.0002
0.99998
Desirability
Composite
260.0
285.0
60.0
180.0
7.0
10.0
250.0
330.0Discharg Delay Volume oDie Temp
[250.0] [9.9602] [136.3636] [281.7172]
Later, it was estimated that an approximate saving of Rs.16,78,000/- per annum has been achieved
by reducing the scrap of H-749 pistons from around 22% to 10% (in first attempt). It is a great
achievement for a medium scale non-ferrous Indian foundry.
Control phase
During this phase, process monitoring and corrective or preventive actions are documented and
executed. Basically this phase tries to check and monitor the improved process and its parametric
values.
Major tools used: Control Plan, p-Chart for overall scrap tracking.
Findings: In order to control the concerned parameters at their improved values, necessary
modification in control plan of casting process has been done as per the output of DOE. After brain
storming, maximum tolerance limits for metal temperature, water temperature and cooling time etc
were fixed. It is recommended to check 5-S condition of casting work station daily by visual
inspection by the Production Supervisor. The overall sigma level has been raised by 0.24. The Runner
& Riser volume has been increased permanently as per recommendations of DOE results. It was also
decided to monitor the overall casting scrap due to other reasons and scrap is further controlled by
drawing p-charts daily by inspection supervisor in general shift. The one month data for p charts has
been collected and shown in figure 11, which predicts the day to day current status of scrap in piston
foundry. These control measures have successfully run the piston foundry for consecutive two
months at around 10.4 % scrap only.

26th
Annual SEAANZ Conference 2013 Page | 21
Figure-11: p-Chart for Scrap Monitoring
31st D
ec
28th D
ec
25th
Dec
22nd
Dec
19th D
ec
16th
Dec
13th
Dec
10th D
ec
7th
Dec
4th Dec
1st D
ec
0.20
0.18
0.16
0.14
0.12
0.10
0.08
0.06
Time
ind
ivid
ua
l p v
alu
es
_X=0.1043
UCL=0.1380
LCL=0.0707111
1
1
11
1
1
1
p-value (np/n) chart
The Control phase has been integrated to configure infrastructure (hardware and software) and to
with-hold the settings, improvements, adjustments and optimizations performed during Six Sigma
case- study, with passage of time. This phase may also include some Value-Engineering proposals for
input parameters to resist changes in improved process variables, like:
Proper On-the-job training schedule for awareness of all the concerned shop floor staff, so that their
code of conduct becomes positive and responsive to tackle responsibilities. For more awareness and
to understand the significance of Six Sigma improvements, a ‘Six Sigma Corner’ should be developed
in the middle of production floor that should usually be operated by a black belt champion.
A comprehensive check list to cover every factor of all phases could be helpful to related work force
in reminding vital steps at the right time.
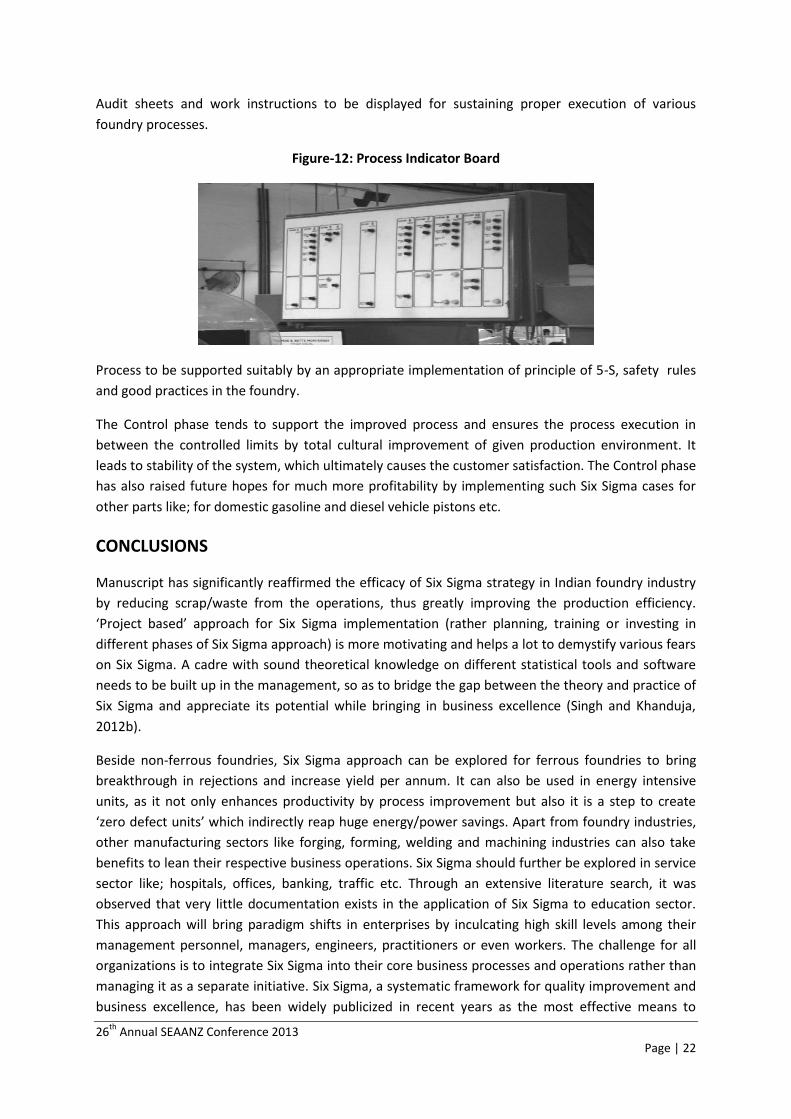
A Process-Indicator board (look figure 12) has been specifically designed to mitigate the execution
of all the casting activities/set up activities of H-749 pistons in a desired sequence like die
installation, setting of cooling time and emergency timer, installing of top frame of die with ram of
machine, alignment of top and bottom frame of die, level of molten metal in the holding-furnace,
metal temperature reading and checking of proper water supply connections with die top etc.,
before commencing regular production runs. It also supports important process variables like die
temperature, cooling water temperature and control over cycle time with series of successive
indicators, once the relevant check or activity has been performed or ensured successfully. Proper
hooters have also been installed with the board to warn the machine operators in case of missing of
any casting activity or its parameters settings. It really makes the whole die casting process well
sustained and ensures optimisation of relevant variables efficiently and as per process requirements.
Three patrol teams of expert casting operators are constituted to vigil the critical foundry processes
and their vital parameters, while patrolling in each shift.
To sustain the overall improvements acquired by DMAIC process, one executive level person to be
deputed to have a round at least once a week on the production shop floor, so that value adding
activities can be performed in a more controlled and consistent manner in future.
26th
Annual SEAANZ Conference 2013 Page | 22
Audit sheets and work instructions to be displayed for sustaining proper execution of various
foundry processes.
Figure-12: Process Indicator Board
Process to be supported suitably by an appropriate implementation of principle of 5-S, safety rules
and good practices in the foundry.
The Control phase tends to support the improved process and ensures the process execution in
between the controlled limits by total cultural improvement of given production environment. It
leads to stability of the system, which ultimately causes the customer satisfaction. The Control phase
has also raised future hopes for much more profitability by implementing such Six Sigma cases for
other parts like; for domestic gasoline and diesel vehicle pistons etc.
CONCLUSIONS
Manuscript has significantly reaffirmed the efficacy of Six Sigma strategy in Indian foundry industry
by reducing scrap/waste from the operations, thus greatly improving the production efficiency.
‘Project based’ approach for Six Sigma implementation (rather planning, training or investing in
different phases of Six Sigma approach) is more motivating and helps a lot to demystify various fears
on Six Sigma. A cadre with sound theoretical knowledge on different statistical tools and software
needs to be built up in the management, so as to bridge the gap between the theory and practice of
Six Sigma and appreciate its potential while bringing in business excellence (Singh and Khanduja,
2012b).
Beside non-ferrous foundries, Six Sigma approach can be explored for ferrous foundries to bring
breakthrough in rejections and increase yield per annum. It can also be used in energy intensive
units, as it not only enhances productivity by process improvement but also it is a step to create
‘zero defect units’ which indirectly reap huge energy/power savings. Apart from foundry industries,
other manufacturing sectors like forging, forming, welding and machining industries can also take
benefits to lean their respective business operations. Six Sigma should further be explored in service
sector like; hospitals, offices, banking, traffic etc. Through an extensive literature search, it was
observed that very little documentation exists in the application of Six Sigma to education sector.
This approach will bring paradigm shifts in enterprises by inculcating high skill levels among their
management personnel, managers, engineers, practitioners or even workers. The challenge for all
organizations is to integrate Six Sigma into their core business processes and operations rather than
managing it as a separate initiative. Six Sigma, a systematic framework for quality improvement and
business excellence, has been widely publicized in recent years as the most effective means to
26th
Annual SEAANZ Conference 2013 Page | 23
combat quality problems and win customer satisfaction but it is still at its infancy stage as far as
Indian industries are concerned.
REFERENCE
Aboelmaged, M.G. (2009), “Six Sigma quality: a structured review and implications for future
research”, International Journal of Quality and Reliability Management, Vol. 27, No. 3, pp. 268-
317.
Alistair Nolan, (2003), “Public Policy on Business Incubators: an OECD Perspective”, International
Journal of Entrepreneurship and Innovation Management, Vol-3, pp. 22-30.
Andersson, R., Eriksson, H. and Torstensson, H. (2006), “Similarities and differences between TQM,
Six Sigma and lean”, The TQM Magazine, Vol. 18, No. 3, pp. 282-96.
Antony, J., Kumar, M. and Madu, C.N. (2005), ‘‘Six Sigma in small and medium sized UK
manufacturing enterprises – some empirical observations’’, International Journal of Quality and
Reliability Management, Vol. 22, No. 8, pp. 860-74.
Antony, F. (2004), “Six Sigma in the UK service organizations: Results from a pilot survey”,
Managerial Auditing Journal, Vol. 19, No.8, pp. 1003–1013.
Antony, J. and Desai, D. A. (2009), “Assessing the status of six sigma implementation in the Indian
industry: Results from an exploratory empirical study”, Management Research News, Vol. 32,
No. 5, pp. 413-23.
Arita, T., & McCann, P. (2002), “The spatial and hierarchical organization of Japanese and US
multinational semiconductor firms”, Journal of International Management, Vol. 8, pp. 121–139.
Chaganti, R. and Greene, P.G. (2002), “Who are ethnic entrepreneurs?: a study of Entrepreneurs
ethnic involvement and business characteristics”, Journal of Small Business Management, Vol.
40, pp.126–143.
Chhabilendra & Roul (2001), “Bitter to Better Harvest Post–Green Revolution”, a book on
Agricultural and Marketing Strategy for India.
Coronado, R. B., & Antony, F. (2002), “Critical success factors for the successful implementation of
Six Sigma projects in organizations”, The TQM Magazine, Vol. 14, No.2, pp. 92–99.
Director of Industries (2003), “Data on Employment, Number of Units, Investment and Production of
Industrial Sector”.
Does, R., Van Den Heuvel, J., De Mast, J. and Bisgaard, S. (2002), “Comparing non-manufacturing
with traditional applications of Six Sigma”, Quality Engineering, Vol. 15, No. 1, pp. 177-82.
Government of India (2002), “State Development Reports on Industrial Development”, Small
Industries Service Institute (SISI), Ludhiana.
Government of India (2006), Planning Commission, Eleventh Five-Year Plan (2007–2012).
Henderson, K. and Evans, J. (2000), “Successful implementation of Six Sigma: benchmarking General
Electric Company”, Benchmarking: An International Journal, Vol. 7, No. 4, pp. 260-81.
Hollenstein, H. (2005), “Determinants of international activities: are SMEs different?”, Small Business
Economics, Vol. 24, pp.431–450.
Ingle, S. and Roe, W. (2001), “Six Sigma black belt implementation”, The TQM Magazine, Vol. 13, No.
4, pp. 273-80.
26th
Annual SEAANZ Conference 2013 Page | 24
Eckes, G. (2001), “The Six Sigma Revolution, How General Electric and Others Turned Process Into
Profits”, JohnWiley & Sons, New York, NY.
Fredendall, L. and Douglas, T. (2008), “The evolving theory of quality management: the role of Six
Sigma”, Journal of Operations Management, Vol. 26, No. 5, pp. 630-50.
Lin, J., Tien, S. and Hsu, C. (2008), “The adoption of Six Sigma methodology to close learning-doing
gap”, Journal of Statistics and Management Systems, Vol. 11 No. 1, pp. 49-64.
Lucas, J.M. (2002), ‘‘The essential Six Sigma’’, Quality Progress, January, pp. 27-31.
Singh, B.J. and Khanduja, D. (2010), “DMAICT: a road map to quick changeovers”, International
journal of Six Sigma and competitive advantage, Vol.6, No.1/2, pp.31-52.
Singh, B.J. and Khanduja, D. (2011a), Does Analysis Matter in Six Sigma?: A Case Study, International
Journal of Data Analysis Techniques and Strategies, Vol. 3, No. 3, pp. 300-324.
Singh, B.J. and Khanduja, D. (2011b), Introduce Quality Processes through DOE: A Case Study in Die
Casting Foundry, International Journal of Productivity and Quality Management, Vol. 8, No. 4,
pp. 373-397.
Singh, B.J. and Khanduja, D. (2012a), Essentials of D-phase to Secure the Competitive Advantage
through Six Sigma, International Journal of Business Excellence, Vol. 5, No. 1/2, pp. 31-51.
Singh, B.J. and Khanduja, D. (2012b), Ambience of Six Sigma in Indian Foundry SMEs-An Empirical
Investigation, International Journal of Six Sigma and Competitive Advantage, Vol. 7, No. 1, pp.
12-40.
Singh, B.J. and Khanduja, D. (2012c), Developing Operation Measurement Strategyduring Six Sigma
Implementation: A Foundry Case Study, International Journal of Advanced Operation
Management, Vol.4, No. 4, pp. 323-349.
Voelkel, J.G. (2002), ‘‘something’s missing – an education in statistical methods will make employees
more valuable to Six Sigma corporations’’, Quality Progress, May, pp. 98-101.
Wright, J. and Basu, R. (2008), “Project management and Six Sigma: obtaining a fit”, International
Journal of Six Sigma and Competitive Advantage, Vol. 4, No. 1, pp. 81-94. 23.
Zu, X., Zhou, H., Zhu, X. and Yao, D. (2011) "Quality management in China: The effects of firm
characteristics and cultural profile", International Journal of Quality & Reliability Management,
Vol. 28, No. 8, pp. 32-45.
Acknowledgement - We acknowledge concerned industrial personnel for their time to time
technical help while conducting the Case study. We are also grateful to Reviewers of SEAAZ-2013 for
giving us valuable suggestions to formulate the manuscript in present form.