leveraging the private sector to improve primary school ... · leveraging the private sector to...
TRANSCRIPT
! 1!
Leveraging the Private Sector to Improve Primary School Enrolment:
Evidence from a Randomized Controlled Trial in Pakistan 1
(November 2013)
[PRELIMINARY AND INCOMPLETE — DO NOT DISTRIBUTE]
Felipe Barrera-Osorio (Harvard, Graduate School of Education)
David S. Blakeslee
(Columbia University)
Matthew Hoover (RAND)
Leigh L. Linden
(University of Texas at Austin, BREAD, J-PAL, IPA, IZA, NBER)
Dhushyanth Raju (The World Bank)
Stephen Ryan
(University of Texas at Austin) Abstract: We evaluate the effects of publicly funded private primary schools on child enrollment in a sample of 199 villages in 10 underserved districts of rural Sindh province, Pakistan. The program is found to significantly increase child enrollment, which increases by 30 percentage points in treated villages. There is no overall differential effect of the intervention for boys and girls, due to similar enrollment rates in control villages. We find no evidence that providing greater financial incentives to entrepreneurs for the recruitment of girls leads to a greater increase in female enrollment than does an equal compensation scheme for boys and girls. Test scores improve dramatically in treatment villages, rising by 0.67 standard deviations relative to control villages.
!!!!!!!!!!!!!!!!!!!!!!!!!!!!!!!!!!!!!!!!!!!!!!!!!!!!!!!!1 We are deeply grateful to Mariam Adil and Aarij Bashir of The World Bank for their valuable insights in the design of the survey and their crucial support in its implementation.
! 2!
I. Introduction
The promotion of universal primary education is an important policy priority, as reflected
in such initiatives as the Millennium Development Goals and the Education for All
movement. Considerable progress has been made in recent years in raising primary
education levels; nonetheless, low enrollment levels persist in regions such as Sub-
Saharan Africa, West and Southwestern Asia, and South Asia (Hausmann et al., 2012).
Finding viable strategies for increasing educational attainment is of paramount
importance to donors and policy-makers. Our research explores the feasibility of low-cost
public-private partnerships for extending educational opportunity to marginal,
underserved communities in developing countries.
A central challenge in this final push for universal enrollment is the inequality in
educational opportunity between boys and girls. It is estimated that women constitute
two-thirds of the world’s illiterate adults and 54% of un-enrolled school-age children
(UNESCO, 2010). A separate but related issue is the rural-urban divide in educational
opportunity: within developing countries, enrollment rates in rural areas tend to lag those
in urban locations (UN, 2008a), with the gender disparity in enrollment being driven
primarily by inequalities in rural areas (UN, 2008b).
Both supply and demand considerations have been invoked to explain low levels of
primary enrollment. Though some research has found school access to be a negligible
factor in explaining low enrollment rates, arguing for the importance of demand-side
factors,2 a substantial literature has found access to be highly important, and often
!!!!!!!!!!!!!!!!!!!!!!!!!!!!!!!!!!!!!!!!!!!!!!!!!!!!!!!!2 Filmer (2007), for example, examines the relationship between enrollment and availability using Demographic and Health Surveys (DHS) data from 21 countries; the design is primarily cross-sectional, and controls for endogeneity concerns through the inclusion of possibly confounding socio-economic
! 3!
entirely decisive, for enrollment.3 Gender disparities in enrollment are often attributed to
a lower parental demand for female-child education. However, both demand and supply
factors have been found to play a significant role, with girls having important economic
responsibilities within the household, or facing additional physical insecurities in
transiting to-and-from school.4
The intervention we evaluate entailed the provision of schools through public-private
partnerships to 161 villages randomly chosen from a sample of 199 qualifying locales.
Private entrepreneurs were given the responsibility of establishing and operating primary
schools, to which all local children between the ages of 5 and 9 were eligible for free
enrollment, with the entrepreneurs receiving a per-child subsidy from the Sindh
provincial government. In addition, in half of the treatment villages the subsidy scheme
!!!!!!!!!!!!!!!!!!!!!!!!!!!!!!!!!!!!!!!!!!!!!!!!!!!!!!!!!!!!!!!!!!!!!!!!!!!!!!!!!!!!!!!!!!!!!!!!!!!!!!!!!!!!!!!!!!!!!!!!!!!!!!!!!!!!!!!!!!!!!!!!!!!!!!!!!!!!!!!!!!!!!variables,! as!well! as! through! the!use!of! a!partial!panel! component.!The!author! finds! little!evidence!that!school!access!is!important!to!enrollment!rates.!3!Duflo! (2001)! and! Foster! and! Rosenzweig! (1996)! are! two! early! papers! showing! the!importance!of!school!availability!for!enrollment,!in!Indonesia!and!India,!respectively.!More!recently,!Burde!and!Linden!(2013),!using!an!RCT!design!in!rural!Afghanistan,!find!positive!effects!of!the!presence!of!communityLbased!schools,!with!villages!receiving!schools!showing!a!52!percentage!point!increase!in!enrollment!for!girls,!and!a!35!percentage!points!increase!for!boys,!entirely!removing!the!preLexisting!gender!gap.!Kazianga,!et#al.!(2013)!evaluate!the!enrollment!effects!of!the!BRIGHT!program!in!Burkina!Faso,!which!consisted!of!constructing!primary! schools! and! implementing! a! set! of! complementary! interventions! designed! to!increase! girls’! enrollment! rates! in! villages! where! initial! female! enrollment! was! low.! The!authors!find!that!school!enrollment!increased!by!17.6!percentage!points!for!boys!and!22.2!percentage!points!for!girls.!4!With!girls!playing!a!larger!role!in!domestic!work!than!boys,!the!opportunity!cost!of!female!enrollment!is!higher!than!that!of!males,!potentially!contributing!to!educational!disparities.!Consistent!with!this,!Glick!and!Sahn!(2000)!find!that!domestic!responsibilities,!represented!by!the!number!of!very!young!siblings,!have!a!strongly!adverse!effect!on!girls’!enrollment!but!not!on!boys’.!Similarly,!Pitt!and!Rosenzweig!(1990)! find! that!daughters!are!more! likely! to!increase!their!time!in!household!work!relative!to!school!than!their!brothers!in!response!to!a!younger!sibling’s!illness.!Females!may!be!deemed!more!at!risk!of!physical!harm!than!males,!thereby!posing!either!a!psychological!cost! for!parents!of!allowing! their!daughters! to!walk!long! distances,! or! a! pecuniary! cost! if! this! induces! parents! to! pay! for! transportation.!Consistent!with! this,! several!papers! find! that! the!distance! to! school!appears! to!be!a!more!significant! deterrent! to! girls’! enrollment! than! boys’! (Alderman,! et! al.,! 2001;! Lloyd,! et! al.,!2005;!Burde!and!Linden,!2013).!
! 4!
was structured such that entrepreneurs received a higher subsidy for girls than boys. The
introduction of program schools leads to large gains in enrollment: overall, treatment
villages experience a 30 percentage points increase in enrollment for children within the
target age group, and a 12 percentage points increase in enrollment for older children.
Test scores increase by 0.67 standard deviations in treatment villages, and by 2.01
standard deviations for children induced to enroll by the introduction of program schools.
These effects are the same for boys and girls. The subsidy providing enhanced
compensation for girls shows no greater effectiveness in inducing female enrollment than
the equal-valued subsidy. In comparison to control villages, parents in treatment villages
prefer more that their boys have future careers as doctors and engineers, rather than as
security personnel; and that their girls become doctors, engineers, or teachers, rather than
housewives.
II. Pakistan and the PPRS Program
A. Education in Pakistan
School participation is low in Pakistan, even in comparison with countries having a
similar level of economic development (Andrabi et al., 2008).5 Nationwide, the primary
school net enrollment rate6 for children ages 5-9 is 56%: 60% for males and 51% for
females. These national averages subsume large regional disparities: in the poorer, more
rural provinces, net enrollment rates are lower for both sexes, and gender disparities
higher. In the rural areas of Sindh province, for example, where the program was !!!!!!!!!!!!!!!!!!!!!!!!!!!!!!!!!!!!!!!!!!!!!!!!!!!!!!!!5!Using! a! simple! regression! of! the! netLenrollment! rate! on! log! perLcapita! income! and! its!square! for! 138! countries,! the! authors! show! that! the! Pakistan’s! predicted! netLenrollment!rate!is!77%,!but!its!actual!rate!only!51%.!6!Net!enrollment!is!defined!as!the!number!of!children!aged!5!to!9!years!attending!primary!level!divided!by!the!number!of!children!aged!5!to!9.!

! 5!
implemented, only 49% of males and 31% of females between the ages of 5 and 9 are
enrolled in primary school (PSLM 2007).
An important development in recent years has been the rapid expansion of for-profit
private education in Pakistan, with 35% of all primary-enrolled children attending private
schools in 2000 (Andrabi et al., 2008). The high level of private-school enrollment is a
relatively recent phenomenon: private schools were once the preserve of the elite; in the
last two decades, however, private-school education has become widely accessible even
to those on the lower rungs of the socio-economic ladder. The cause of this change has
been a dramatic expansion in the availability of low-cost private schools in poor urban
neighborhoods and remote rural villages. These schools have succeeded along
dimensions of both cost and quality: at an average $18 per year in villages, the cost
represents a small fraction of household income (Andrabi et al., 2008);7 while student
achievement levels have been better than in government schools, even controlling for
village and household characteristics (Das et al., 2006).
There exist large disparities, however, in the prevalence of private schooling across
the provinces of Pakistan. In villages with private schools in Punjab province, 23% of
children enrolled in primary school were in private schools, while only 11% of those in
villages lacking private schools were so enrolled. In Sindh province, in contrast, the
private enrollment rates were 5% and 2%, respectively.
B. PPRS Description
!!!!!!!!!!!!!!!!!!!!!!!!!!!!!!!!!!!!!!!!!!!!!!!!!!!!!!!!7!The!costLeffectiveness!of!these!schools!is!attributable!largely!to!their!ability!to!recruit!local!women!as! teachers,! to!whom!significantly! lower!wages! can!be!paid!due! to! the! scarcity!of!alternative!employment!options!in!rural!areas.!
! 6!
The intervention was implemented by the Sindh Education Foundation (SEF), a quasi-
governmental agency of the Sindh provincial government. SEF was established in 1992
as a semi-autonomous organization to undertake education initiatives in less-developed
areas, and among marginalized populations within Sindh province; and empowered to
adopt non-conventional strategies in pursuit of this objective. Pursuant to this mandate,
the SEF has undertaken a variety of programs, such as: supporting local communities in
establishing and managing small schools, providing assistance to pre-existing low-cost
private schools, enlisting the private sector for management of dysfunctional public
schools, and promoting non-formal adult education.
The Promoting Low-Cost Private Schooling in Rural Sindh (PPRS) program,
evaluated in this paper, is a notable example of the SEF’s innovate innovative approach
to extending educational access. Leveraging the fore-mentioned advantages of private
education, the program seeks to expand access to primary education in underserved rural
communities through public-private partnerships with local entrepreneurs. In addition,
through the submission of applications for villages they have identified as plausibly
meeting the necessary criteria, the local entrepreneurs involved in the program play an
important role in identifying the villages most in need of educational facilities.
Those private entrepreneurs selected through the vetting and randomization processes
are granted a per-student cash subsidy to operate co-educational primary schools, as well
as additional, non-monetary assistance to improve the quality of the education provided.
Enrollment is tuition-free and open to all children in the village between the ages of 5 and
9 (extending by a year with additional cohorts), with the entrepreneur receiving directly
an enrollment-based subsidy from the SEF, which is verified through surprise
! 7!
inspections.8 In addition, to explore strategies for reducing the gender-gap, two different
subsidy schemes were introduced. In the first, the entrepreneur is provided a monthly
subsidy of 350 rupees (USD 4.7) for each child enrolled; while, in the second, the
entrepreneur receives the same 350 rupees for each male student and 450 rupees for each
female. These two schemes are termed the “Gender-Uniform subsidy” and “Gender-
Differentiated subsidy” schemes, respectively.
By assigning local entrepreneurs responsibility for operating these schools, coupled
with appropriate incentives and oversight from the government, the PPRS program seeks
to take advantage of the local knowledge and underutilized resources within these
communities to provide viable, appropriate, and affordable education in these remote, and
previously neglected, areas. In addition, it is hoped that the gender-differentiated subsidy
scheme, by providing a higher remuneration for girls relative to boy, will encourage the
school operators to take specific measures that will be attractive to the parents of girls,
such as hiring female teachers, providing safe transportation and a safe schooling
environment, or even offering small stipends to girls.
III. Methodology
A. Research Design
The program was first implemented on a pilot basis in 10 districts of Sindh province.
These districts were chosen to participate due to their being the most deprived in terms of
educational resources.9 Interested entrepreneurs were asked to apply to the program by
!!!!!!!!!!!!!!!!!!!!!!!!!!!!!!!!!!!!!!!!!!!!!!!!!!!!!!!!8!SEF!determines!the!number!of!students!using!both!school!enrollment!reports!and!surprise!inspections.!9!Based!on!rankings!determined!by!several!indicators!of!educational!deprivation!–!including!the! size! of! the! outLofLschool! child! population,! the! initial! gender! disparities! in! school!

! 8!
submitting proposals to set up and operate primary schools in rural communities within
these districts. These proposals were vetted according to several criteria: sufficient
distance to the nearest school;10 written assent from the parents of at least 75 children
who would enroll their children in the program schools should they be established; and
identification of qualified teachers, with at least two being female,11 and an adequate
facility in which to hold classes. A total of 263 localities were deemed eligible, from
which 200 were randomly selected to receive treatment. The 200 treatment villages were
further subdivided equally by subsidy type.
A baseline survey was conducted in February 2009, for the purpose of vetting
applications for final consideration. Following this, the 263 qualifying villages were
randomly assigned to the two treatments and the control group, and the schools then
established in the summer of 2009. Because the new school term normally commences in
the spring, the students received an abbreviated term in their first year. An initial follow-
up survey was conducted in June 2010.12 In April/May 2011, a second follow-up survey
was conducted, which was significantly more extensive in scope than the first.13
Table 1 summarizes the sample sizes across the three surveys, disaggregated by
treatment status. There were 199 villages included in our sample, with 82 and 79 in
!!!!!!!!!!!!!!!!!!!!!!!!!!!!!!!!!!!!!!!!!!!!!!!!!!!!!!!!!!!!!!!!!!!!!!!!!!!!!!!!!!!!!!!!!!!!!!!!!!!!!!!!!!!!!!!!!!!!!!!!!!!!!!!!!!!!!!!!!!!!!!!!!!!!!!!!!!!!!!!!!!!!!participation,! and! the! share! of! households! at! least! 15! minutes! away! from! the! nearest!primary!school!–!the!10!lowest!ranked!districts!were!selected!for!participation.!10!There!could!be!no!primary!school!within!a!1.5!kilometers!radius!of!the!proposed!school!site.!However,!due!to!problems!with!the!baseline!survey,!a!number!of!villages!were!included!that!failed!this!criterion.!11!The!teachers!were!required!to!have,!at!minimum,!an!8th!grade!education.!This!was!set!at!a!sufficiently!high!level!that!the!teachers!would!have!competence!in!primary!educationLlevel!subjects,!but!low!enough!that!qualified!local!women!could!be!found.!12!This! consisted! of! a! complete! census! of! the! villages.! Because! it! occurred! a! year! after!commencement!of!the!project,!we!employ!the!data!collected!as!a!followLup!survey.!13!This!survey!was! initially!scheduled! to!commence! just!after! the!census.!However,!due! to!the! widespread! flooding! occurring! during! in! lateLsummer! 2010,! it! was! necessarily!postponed.!

! 9!
treatment groups 1 and 2, respectively, and 38 in the control group.14 The baseline data
from these 199 villages included 2033 randomly selected households and 5556 children.15
In these villages there were 8639 households with children between the ages of 5 and 15,
and 25157 children within this age group, as determined during the first follow-up
survey, which consisted of a complete census of each village. From each village up to 42
households were randomly selected for inclusion in the second follow-up survey; for
villages with fewer than 42 households, which comprised the majority, all willing
households were included in the second follow-up.16 In total, 17721 children between the
ages of 5 and 17 were included in the follow-up survey.17
B. Data
In the baseline survey, basic child and household information was collected for 12
randomly selected households in each village.18 Among the details record were: age,
gender, and enrollment status of all children between the ages of 5 and 9; the profession
and education of the household head; and the number of individuals within the
household. Data was also collected on teachers and building facilities proposed by the
entrepreneur, as well as the availability of proximate primary schools.
!!!!!!!!!!!!!!!!!!!!!!!!!!!!!!!!!!!!!!!!!!!!!!!!!!!!!!!!14 There were 237 villages for which data was collected in the baseline. An additional 38 villages were removed from the sample at the time of census due to their being too large to be considered villages. 15 The method by which the baseline data was the “spin-the-bottle” technique, whereby 12 households were chosen based on their being along a straight line determined by a bottle spun in the center of the village. Though this is the approach adopted by many development organizations, it falls short of representing a truly randomly drawn sample, and as such the results must be used with caution. However, insofar as the technique was employed consistently across treatment groups, the populations should still be roughly balanced if the randomization has been successful. 16 Only households with at least one child between the ages of 5 and 9 at the time of the first follow-up were included in the sample. 17 During the second follow-up survey, the age range of children was extended to 17. The reason for this change was two-fold: (1) to ensure coverage of children who were included in the first follow-up, but may have aged out of the 5-15 range by the time of the second follow-up; and (2) because the age requirement was difficult to enforce, meaning older children were often enrolled in the program schools. 18 The method of randomization was the “spin-the-bottle” technique.
! 10!
In the first follow-up survey, information was collected for all households in the
villages. Information was collected on the age, gender, and enrollment status of all
children between the ages of 5 and 15. The caste, profession, and education of the
household head were collected, as well as the number of adults, the amount of land
owned by the household, and the building material of the family’s house.
The second follow-up survey consisted of three elements: (1) a household survey,
which included socio-economic questions on the household, a detailed module on child
characteristics, parental preferences over various dimensions of the education of each
young child, and questions on the characteristics of the schools in the village; (2) a school
survey; and (3) a child survey, which included numeracy and literacy exams of 24 and 14
questions, respectively.
The household survey had three principal components. First, household-level
characteristics were collected, covering details such as: the household head’s profession
and level of education; ownership of land, livestock, and other assets; income (both
monetary and in-kind) and remittances; and attitude towards religion and social issues.
Second, the respondent was asked the characteristics of every child in the house, covering
items such as: age, gender, marital status, work within and outside the household,
enrollment, and study habits. In addition, the respondent was asked their personal
preference over the education of each child: for example, how important it is that the
specified child receive instruction in topics such as mathematics and English, or that their
teacher be female. Lastly, there was a school module, in which the respondent was asked
to describe the characteristics of each school near to the village, and to rank them
according to these characteristics.

! 11!
The child survey was administered to each child between the ages of 5 and 10. A few
basic questions were asked of the child regarding types of work done inside and outside
the home, enrollment status, and their desired adulthood professions. Each child was then
administered a language exam, consisting of 14 questions, and a math exam, with 24
questions.
The third element was the school survey. The headmaster provided information on
various school characteristics such as: the number of years the school had been
operational, its daily schedule, and the medium instruction; the overall characteristics of
teachers at the school, including the number that are female, their educational
qualification, and years of experience; and class sizes, tuition, and other fees. Through
visual inspection, the enumerators established the physical characteristics of each school,
covering the number of classrooms, desks, electrification, drinking water, and toilet
facilities. In addition, each teacher was individually interviewed, with information being
gathered on their age, teaching experience, educational qualifications, and salary; as well
as the number of hours spent each week on different teaching activities, such as teaching
small groups and individuals, administering exams, and enforcing discipline. Finally,
attendance was taken of each class, with the attendance lists to be used during conduct of
the household survey to verify child enrollment.
C. Statistical Models
The principal outcomes of interest are child enrollment and educational achievement, as
measured by the numeracy and literacy exams. The principal explanatory variable is the

! 12!
treatment status of the village. We will be also be interested in determining differential
effects of the two treatment groups, across boys and girls.
The baseline model used in the analysis is:
Yi =β0+β1Ti +β2Xi+εij , (1)
where Yi is the outcome of interest for child i, Ti is a dummy variable indicating whether
child i lives in a village assigned a PPRS school, and Xi is a vector of socio-demographic
controls. Standard errors are clustered at the village level, j. In alternative specifications,
we disaggregate the two treatments, and include interactions of the treatment with the
female dummy.
IV. Internal Validity and Treatment Differential
A. Internal Validity
The validity of our results depends upon the comparability of populations across
treatment and control groups. Because the villages were randomly selected, treatment
should be orthogonal to household and child characteristics that might be correlated with
the outcomes of interest. Insofar as this holds, it will be sufficient to compare outcomes
across groups to evaluate the effect of the intervention. To assess the comparability of
villages, we tabulate household and child characteristics across the treatment and control
for the baseline and two follow-up surveys.
Table 2 gives the tabulation for the baseline and two follow-up surveys. Columns (1),
(3), and (5) gives the mean values of the indicated variable in control villages, while
columns (2), (4), and (6) gives the treatment differential, as identified from a regression
of the variable on a pooled treatment dummy. Columns (1)-(2) use the baseline survey,

! 13!
and columns (4)-(8) the two follow-up surveys. The differences across survey groups are
quite small: the only apparent imbalance is in the percentage of children who are girls,
with each of the three surveys showing a slightly higher percentage of girls than boys in
treatment villages (4.1, 3.8, and 2.7 ppts for the baseline and two follow-up surveys,
respectively). In appendix table A1, we provide the same tabulation, showing the balance
across the two treatment groups. The differences are again quite small: the only apparent
imbalance here is a smaller average household size in the Differentiated-subsidy villages
(-0.798 members), though this difference is found only in the first follow-up survey.
In sum, the research design appears to have successfully randomized the sample, so
that treatment status is orthogonal to village characteristics that one would be concerned
might be correlated with the outcomes of interest.
B. Treatment Differential
We first assess the characteristics of the program schools, and compare them to
government and private schools. To do this, we make use of the school surveys
conducted during the second follow-up survey, in which information was gathered on a
variety of school and teacher characteristics, using both visual inspection by enumerators,
as well as interviews with headmasters and individual teachers.
Table 3 shows differences according to school type. Columns (1) and (4) provide
mean levels of the indicated variables for PPRS schools, with the level of observation
being the child-school. Columns (2) and (5) present the PPRS-government school
differentials according to the same characteristics, with the differences estimated from a
regression of the indicated variable on a dummy for program schools. Columns (3) and

! 14!
(6) repeat the exercise, now giving the differences between PPRS and private schools.
PPRS schools are open 0.764 more days per week than government schools, indicating
that they are generally open 6 days per week. Program schools are also more likely to use
English as the medium of instruction (31.3 ppts), and less likely to use Sindhi (-37.4
ppts). The quality of physical infrastructure is also higher in program than government
schools, with more having an adequate number of desks (20.3 ppts), potable drinking
water (34.7 ppts), electricity (12.9 ppts), and a toilet (34.0 ppts).
There is also a marked difference in the characteristics of the teachers in program
schools. Using the information collected from headmasters, program schools are reported
to be staffed with more teachers than government schools (0.939), with a larger number
of teachers being female (1.470); and more of these teachers having either less than 5
years of teaching experience (2.505) or 5 to 10 years of teaching experience (0.409), and
fewer having more than 10 years of teaching experience (-2.015). These differences are
corroborated by interviews with the individual teachers, where a higher percentage are
female (25.2 ppts), and have fewer years of overall teaching experience (-12.152) and
teaching experience at their current school (-5.446 years). In addition, these teachers are
younger (-13.987 years), have less education (-0.960 years), and lower salaries (-11,735
rupees per month). Despite these differences in teacher characteristics, there is little
evidence that teachers spend a different number of hours in teaching-related activities, or
that allocate their time differently across tasks, save for an additional hour per week
administering exams.
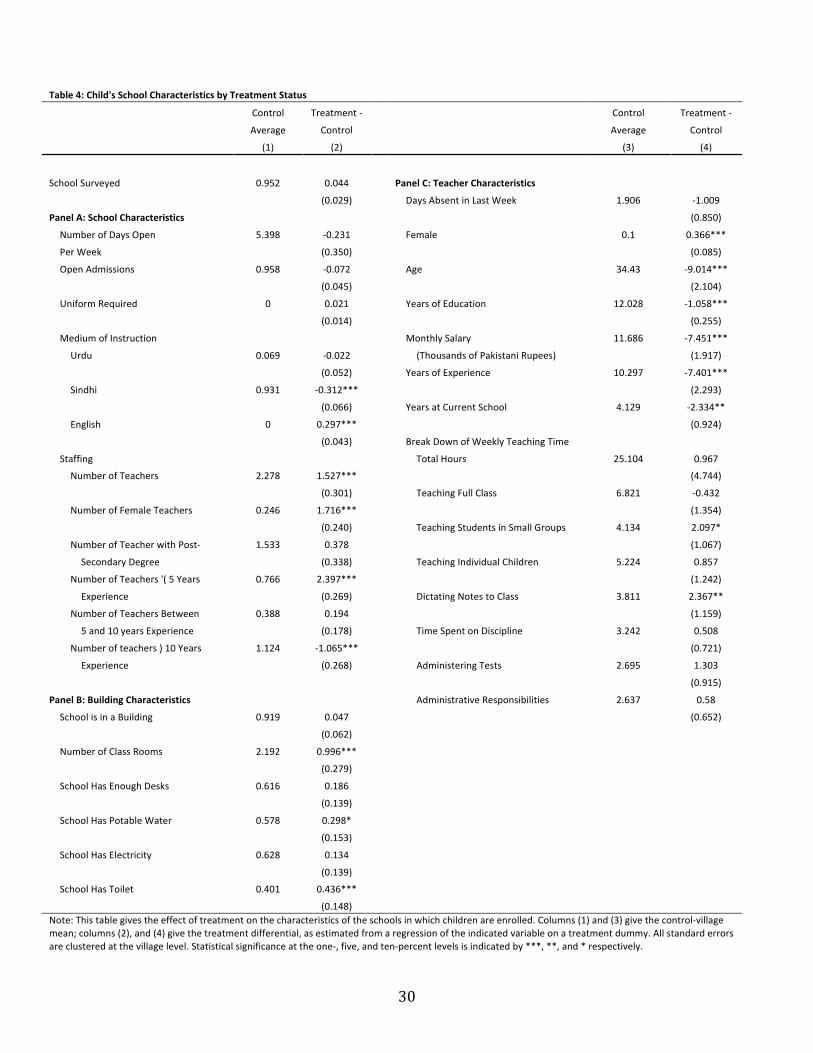
In table 4 we examine the characteristics of schools in which children are enrolled
across treatment and control groups. In columns (1) and (3) are reported the

! 15!
characteristics of schools attended by children in control villages, and in columns (2) and
(4) the treatment-village differential. Treatment-village children are more likely to be
educated with English as the medium of instruction (29.7 ppts), and less likely using
Sindhi (-31.2 ppts). The building in which classes are held have more classrooms (0.996),
and are more likely to have potable water (29.8 ppts) and toilets (43.6 ppts). As reported
by headmasters, there are more teachers (1.527), and more female teachers (1.716); and
more teachers having less than 5 years experience (2.397) and fewer having more than 10
years of experience (-1.065). These differences are verified by teacher interviews:
teachers are more likely to be female (36.6 ppts), are younger (-9.014 years), have fewer
years of education (-1.058), fewer years teaching experience (-7.401), fewer years
teaching at their current school (-2.334), and earn a lower salary (-7,451 rupees). There is
some evidence that treatment-village teachers allocate their class-time differently:
teachers spend more time per week teaching children in small groups (2.097 hours) and
dictating notes or writing notes on the board (2.367 hours).
The change in composition of the teaching staff – with children in treatment villages
attending schools with teachers who are more likely to female, are younger, have fewer
years of teaching experience, and are lower paid – is consistent with the criteria for
participation in the program, with entrepreneurs required to enlist two female teachers in
order to qualify. It is also consistent with research on the cost advantages enjoyed by
private schools in Pakistan, with entrepreneurs able to keep down costs by hiring less-
educated females and paying them a lower salary than in government schools (Andrabi et
al., 2007). There is no evidence that this has resulted in a reduction in the character of the
education imparted, with teachers allocating their time to the different teaching tasks
! 16!
similarly across treatment and control villages. In addition, the quality of infrastructure is
high in treatment-village schools, which is consistent with the infrastructure criteria
employed during vetting.19
V. Results
A. Enrollment Outcomes
School enrollment was determined in two ways: first, the adult respondent for the
household survey was asked whether the child was enrolled during the just concluded
school term; and, second, the attendance of the child was verified using an attendance list
compiled through a headcount conducted during the school survey.20 The self-reported
enrollment was ascertained in both follow-up surveys, while the enrollment verification
was conducted only in the second follow-up survey. In what follows, we will discuss the
results using both enrollment measures; however, because improvements in test scores
are consistent with self-reported enrollment, we view this as the correct measure.
Table 5 shows the effects of the introduction of program schools on enrollment
during the two follow-up surveys, pooling together the two treatment groups. Columns
(1)-(4) have as the outcome variable self-reported enrollment; column (5) the verified
enrollment; and column (6) the highest grade attained. Looking at enrollment effects for
younger children, shown in panel A, the pooled treatment effect was a 49 ppts increase in
self-reported enrollment during the first follow-up survey. This effect drops to 30 ppts in
!!!!!!!!!!!!!!!!!!!!!!!!!!!!!!!!!!!!!!!!!!!!!!!!!!!!!!!!19 During the vetting, criteria were included on infrastructure items such as drinking water, electricity, and toilets. Ultimately, however, the only requirements for qualification were those described in section IIIA above. 20 The school surveys were conducted first, so that the attendance decision would not be influenced by the presence of enumerators. Using the attendance sheets collected during the school survey, the enumerators verified the child’s attendance with the assistance of the respondent.
! 17!
the second follow-up survey. The reason for the decline in the latter is a 20 ppts increase
in enrollment in control villages which occurred between the first and second follow-up
surveys – with a control-group mean of 30% enrollment in 2010 rising to a 50%
enrollment rate in 2011 – which was due to the re-opening of a number of previously
non-operational government schools.21
In panel B, we estimate the treatment effects on enrollment of older children. Despite
the fact that these children were ineligible for enrollment in program schools, we
nonetheless find significant increases in enrollment, with older children in treatment
villages 25.5 and 12.2 ppts more likely to be enrolled in the first and second follow-ups,
respectively. Interestingly, there is no evidence that older children in treatment in villages
have attained a higher grade level; the reason for this is a combination of the smaller
treatment effect on enrollment, as well as the fact that the older children affected by the
treatment are enrolling in the lower grade levels offered in the program schools.22
B. Test Scores
We next estimate the effect of the treatment on test scores. At the time of the second
follow-up, two exams were administered to every child in our sample between the ages 5-
10. The first component was a math exam, which consisted of 24 basic numeracy
questions. The second component was an urdu or sindhi exam (depending on the
language spoken in the village), which consisted of 14 basic literacy questions. The !!!!!!!!!!!!!!!!!!!!!!!!!!!!!!!!!!!!!!!!!!!!!!!!!!!!!!!!21 The government around this time began to re-open non-operational schools, but apparently refrained from doing so in treatment villages. This decision was not due to the intercession of SEF administrators, who were unaware until much later of this discrepancy; but was likely due to the presence of the PPRS schools and their popularity with local communities, coupled with the resource constraints of the provincial government. This finding would indicate some level of support for the program within the Pakistani government, despite the challenge these schools represent to important vested interests. 22 Because attendance was not taken for these older children, verified enrollment is not included as an outcome variable in panel B of table 5.
! 18!
scores were then standardized by subtracting off the mean for control villages and
dividing by the standard deviation.
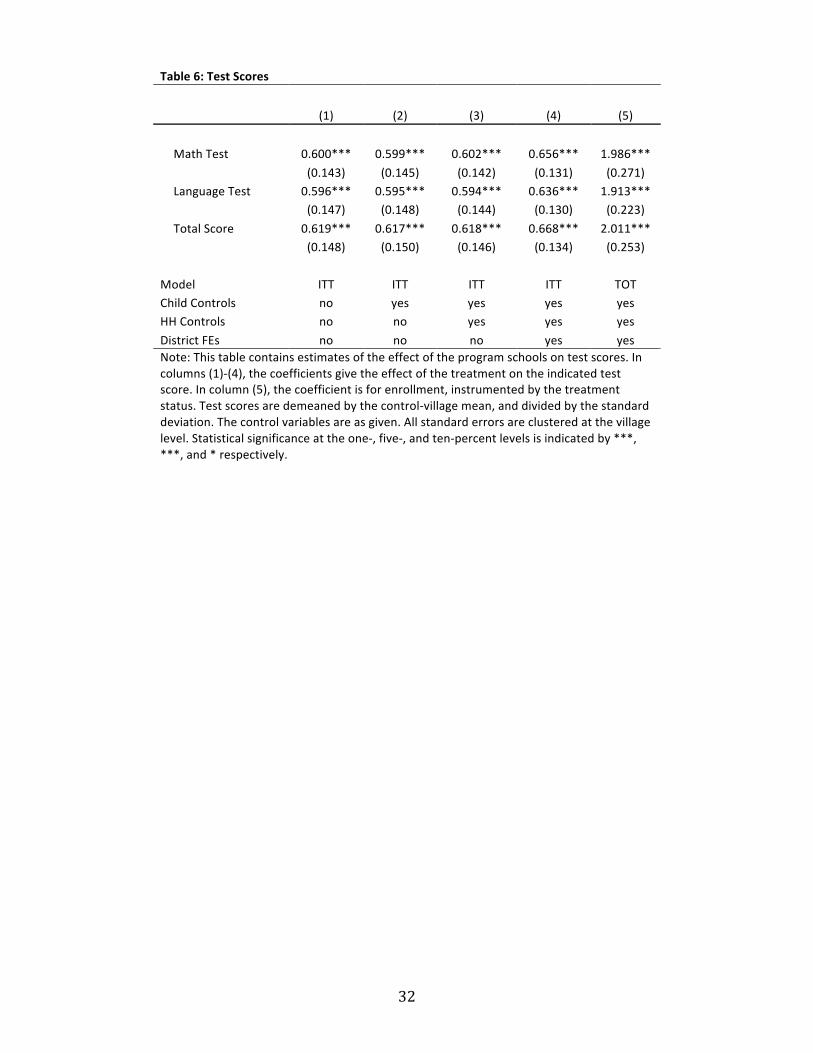
Table 6 presents the results from a regression of test scores on treatment status.
Children in treatment villages show an approximately 0.62 standard deviations
improvement in test scores relative to those in control villages; with the inclusion of a full
vector of child, household, and district controls, the coefficient increases to 0.67. These
effects are similar across the numeracy and literacy exams. In column (5), we estimate
the LATE of child enrollment, with enrollment regressed on the treatment dummy in the
first stage, and test scores then regressed on fitted-enrollment; the coefficients given,
therefore, are for the second-stage predicted enrollment variable. Children enrolled due to
the intervention score 2 stds higher on the exams than the mean of control villages. These
results indicate that the schools have been highly effective in imparting to children a
knowledge of basic math and literacy.
C. Treatment and Gender Disaggregations
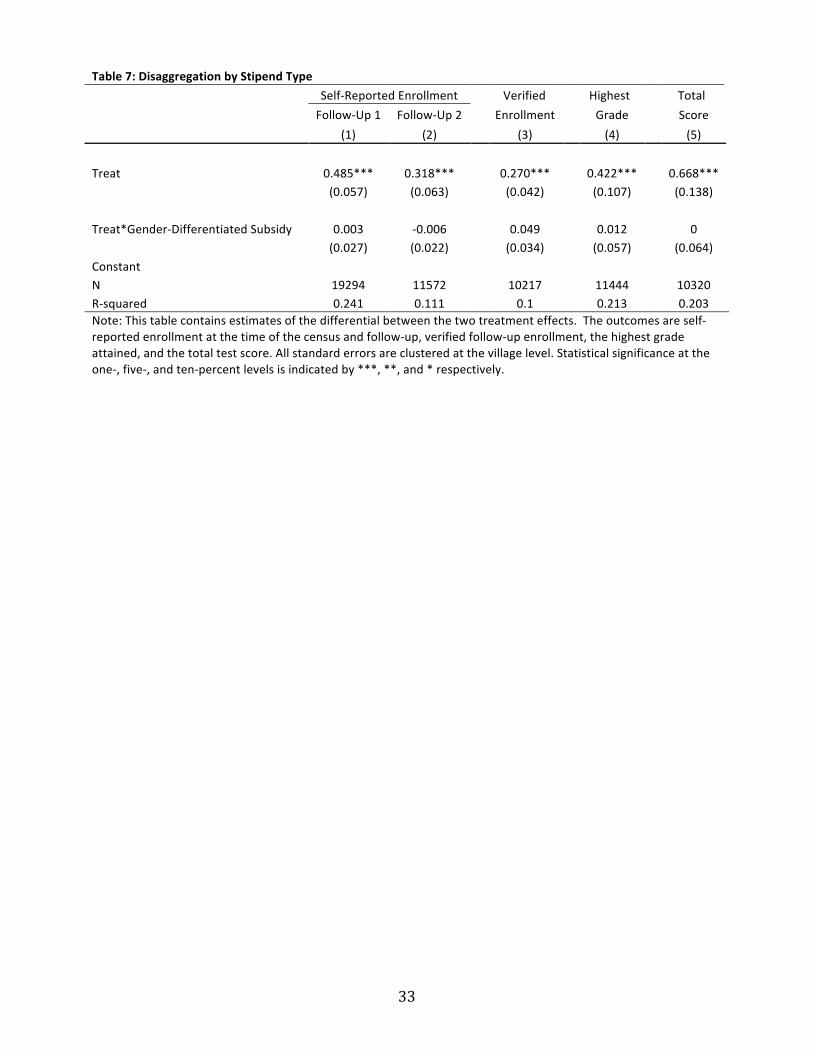
Table 7 shows the differential effects of the two treatments on a variety of education
outcomes. In columns (1) and (2) the outcomes are self-reported enrollment during the
two follow-up surveys, in column (3) verified enrollment during the second follow-up, in
column (4) the highest grade attained, and in column (5) the child test score. The
explanatory variables are a dummy for the pooled treatments, and a dummy for the
Gender-Differentiated subsidy treatment. There is no evidence that the latter has a
differential effect on any of the educational outcomes.

! 19!
Table 8 estimates the differential effect of the treatment according to gender on the
same enrollment outcomes. There is some evidence that the enrollment effect of the
pooled treatment was larger for girls than boys in the first follow-up, with girls seeing a
5.2 ppts larger increase in enrollment relative to boys, effectively wiping out the pre-
existing gender differential. There is no gender differential in the treatment effect on self-
reported follow-up-2 enrollment, verified enrollment, or highest grade.
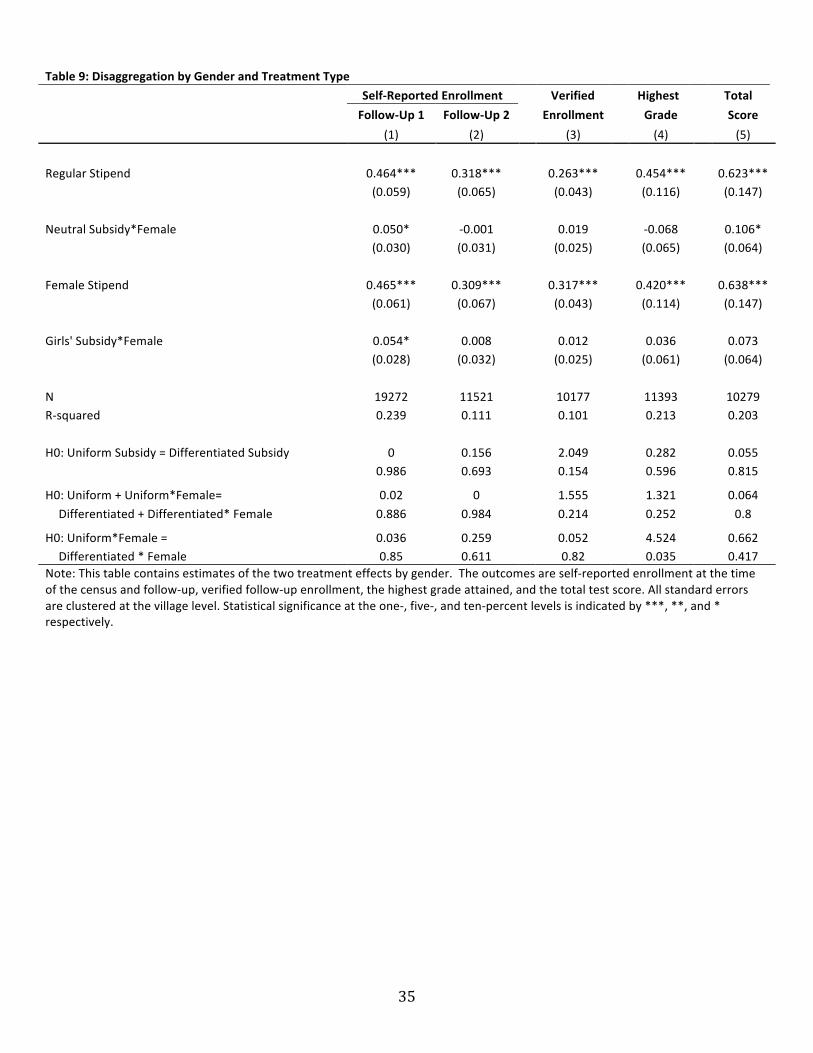
As the Gender-Differentiated subsidy was introduced in order to remedy the
educational gender gap found in the Sindh province, we next turn to assessing the impact
it had on female enrollment. Table 9 gives the disaggregated treatment effects and their
interaction with gender. There is no evidence for a differential across the two treatments;
the difference between coefficients is always small, as are the F-stats.
In sum, our results indicate that the introduction of PPRS schools has had a large
impact on child enrollment in these villages. The effects are the same across the two
treatments, and there are no differentials according to the child’s gender. There is no
evidence for a differential effect across the two treatments, indicating that the Gender-
Differentiated subsidy had no greater effect on female enrollment than the Gender-
Uniform subsidy.
D. Aspirations
We next turn to an analysis of the effect of the treatment on the professional and
educational aspirations of the children. Given the significant improvement in educational
outcomes detailed above, it stands to reason that the careers and educational
accomplishments deemed desirable and viable will have also changed. The data used here
! 20!
is from two sources: In the household survey, there was a module in which the
respondent was asked their preferences for each individual child in terms of ideal
marriage age, ideal level of education, and ideal livelihood. In addition, in the child
surveys, each child was asked their preferred future job and level of education.
Table 10 gives the results. In column (1) is given the mean for control villages, and in
column (2) the treatment-control differential as estimated from a regression of the
indicated variable on the pooled-treatment dummy. Columns (3)-(5) give the coefficients
from a regression of the indicated variable on dummies for girls, pooled treatment, and
the interaction of the two. In column (2), we see that respondents in treatment villages are
more likely to desire that their children become doctors (4.7 ppts) and engineers (2.4
ppts), and less likely to desire they become farmers (-4.4 ppts) and housewives (-4.8 pts).
The ideal level of education increases by 1.532 years.
According to the professed ambitions of the child, the only change is an increase in
the probability that they want to work for government (4.1 ppts), which comes from a
12.2 ppts increase for boys. It is interesting to note that, while children in treatment
villages do not desire a higher level of education than those in control villages, children
in both control and treatment villages desire a significantly higher level of education than
is desired by the parental respondent (11.031 years versus 7.279 years in control
villages).
Looking at the gender disaggregations, we see that both boys and girls see a similar
increase in the professed aspiration that they become doctors and engineers. Girls in
treatment villages are less likely than those in control villages to have housewife reported
as their desired profession (-14.8), and more likely to have teacher given instead (6.7

! 21!
ppts).23 Girls in control villages are desired to receive slightly less education than boys (-
0.835), while boys and girls both see a significant increase in the ideal level of education
in treatment villages (1.456 and 1.705 years, respectively).
VI. Conclusion
The intervention studied here, wherein primary education is provided to marginalized
communities through public-private partnerships, with the government paying private
entrepreneurs a per-child subsidy to operate primary schools, has proven remarkably
effective in increasing self-reported enrollment rates amongst primary-aged children. The
presence of a PPRS school is associated with an approximately 30 percentage points
increase in enrollment. We find no statistically significant differential impact of the
intervention on girls’ enrollment.
The program schools seem to be of high quality, as evidenced by both test scores and
direct observation of school characteristics. Children in treatment villages score 0.67 stds
higher than those in control villages on math and language exams, while children induced
to enroll because of the treatment score 2 stds higher. In addition, information on school
characteristics gathered by enumerators through direct observation and headmaster and
teacher interviews shows program schools to be of similar and sometimes higher quality
than government schools.
!!!!!!!!!!!!!!!!!!!!!!!!!!!!!!!!!!!!!!!!!!!!!!!!!!!!!!!!23 The only changes in aspiration expressed by the children themselves is that boys in treatment villages are more likely to report a desire to become government workers (12.2 ppts), which shift in aspirations is not shared by girls.

! 22!
VII. Bibliography
Alderman, Harold, Peter F. Orazem, and Elizabeth m. Paterno (2001). “School Quality,
School Cost, and the Public/Private School Choices of Low-Income Households in
Pakistan,” Journal of Human Resources, 36(2): 304-26.
Andrabi, Tahir, Jishnu Das, and Asim Ijaz Khwaja (2008). “A Dime a Day: The
Possibilities and Limits of Private Schooling in Pakistan,” Comparative Education
Review, 52(3): 329-355.
Banerjee, Abhijit V., and Esther Duflo (2008). “The Experimental Approach to
Development Economics,” NBER Working Paper 14467.
Barrera-Osorio, Felipe, Marianne Bertrand, Leigh L. Linden, and Francisco Perez-Calle
(2008). “Conditional Cash Transfers in Education Design Features, Peer and Sibling
Effects Evidence from a Randomized Experiment in Colombia,” NBER Working
Papers 13890. [RIGHT CITATION?]
Barrera-Osorio, Felipe, Leigh L. Linden, and Miguel Urquiola (2007). “The Effects of
User Fee Reductions on Enrollment : Evidence from a quasi-experiment,” Working
Paper 2007.
Borkum, Evan (2008). “Geographically targeted user fee elimination: Evidence on
enrollment from South Africa’s no-fee schools,” Columbia University Department of
Economics Mimeo.
Burde, Dana and Leigh L. Linden (2013). “Bringing Education to Afghan Girls: A
Randomized Controlled Trial of Village-Based Schools,” American Economic
Journal: Applied, forthcoming.
! 23!
Cardoso, Eliana and Andre Portela Souza (2004). “The Impact of Cash Transfers on
Child Labor and School Attendance in Brazil,” Vanderbit University Working Paper
No. 04-W07.
Das, Jishnu, Priyanka Pandey, and Tristan Zajonc (2006). “Learning Levels and Gaps in
Pakistan,” World Bank Policy Research Working Paper No. 4067, World Bank,
Washington, DC.
Duflo, Esther (2001) “Schooling and Labor Market Consequences of School
Construction in Indonesia: Evidence from an Unusual policy Experiments,”
American Economic Review, 91(4): 795-813.
Evans, David K. and Arkadipta Ghosh (2008). “Prioritizing Educational Investments in
Children in the Developing World,” RAND Working Paper No. WR-587.
Filmer, Deon (2007). “If You Build It, Will They Come? School Availability and School
Enrollment in 21 Poor Countries,” Journal of Development Studies, 43(5): 901-928.
Filmer, Deon and Norbert Schady (2008). “Getting Girls into School: Evidence from a
Scholarship Program in Cambodia,” Economic Development and Cultural Change,
56(3): 581-617.
Foster, Andrew D., and Mark R. Rosenzweig (1996). "Technical Change and Human-
Capital Returns and Investments: Evidence from the Green Revolution," American
Economic Review, 86(4): 931-953.
Glewwe, Paul and Hanan Jacoby (1994). “Student Achievement and Schooling Choice in
Low-Income Countries: Evidence from Ghana,” The Journal of Human Resources,
29(3): 843-864.
! 24!
Glewwe, Paul and Michael Kremer (2005). “Schools, Teachers, and Education Outcomes
in Developing Countries,” Handbook on the Economics of Education, 2: 945-1017.
Glewwe, Paul, Michael Kremer, and Sylvie Moulin (2009). “Many Children Left
Behind? Textbooks and Test Scores in Kenya,” American Economic Journal:
Applied Economics, 1(1): 112-35.
Glick, Peter and David E. Sahn (2000). “Schooling of girls and boys in a West African
Country: the effects of parental education, income and household structure,”
Economics of Education Review, 19: 63-87.
Government of Pakistan (2007). “Pakistan Social & Living Standards Measurement
Survey,” Federal Bureau of Statistics.
Handa, Sudhanshu (2001). “Raising primary school enrollment in developing countries:
The relative importance of supply and demand,” Journal of Development
Economics, 69: 103-128.
Hausmann, Ricardo, Laura D. Tyson, and Saadia Zahidi (2012). The Global Gender Gap
Report. World Economic Forum. Geneva, Switzerland.
Kazianga, Harounan, Daniel Levy, Leigh Linden, Matthew Sloan (2013). “The Effects of
“Girl-Friendly” Schools: Evidence from the BRIGHT School Construction Program
in Burkina Faso,” forthcoming American Economic Journal: Applied.
Kremer, Michael, and Edward Miguel (2004). “Worms: Identifying Impacts on
Education and Health in the Presence of Treatment Externalities,” Econometrica,
72(1): 159-217.
Holla, Alaka, and Michael Kremer (2008). “Pricing and Access: Lessons from
Randomized Evaluation in Education and Health,” MIMEO, Harvard University.
! 25!
Holla, Alaka, and Michael Kremer (2009). “Improving Education in the Developing
World: What Have We Learned From Randomized Evaluations?” Annual Review of
Economics, 1.: 513-542.
Levy, Dan and Jim Ohls (2006). “Evaluation of Jamaica’s Path Program: Final Report,”
Mathematica.
Lloyd, Cynthia B., Cem Mete, and Zeba A. Sathar (2005). “The Effect of Gender
Differences in Primary School Access, Type, and Quality on the Decision to Enroll
in Rural Pakistan,” Economic Development and Cultural Change, 53(3): 685-710.
Pitt, Mark M., Mark R. Rosenzweig, and Md Nazmul Hassan (1990). “Productivity,
Health, and Inequality in the Intrahousehold Distribution of Food in Low-Income
Countries,” American Economic Review, 80(5): 1139-56.
Ravallion, Martin, and Quentin Wodon (2000). “Does Child Labour Displace Schooling?
Evidence on Behavioural Responses to an Enrollment Subsidy,” The Economic
Journal, 110: C158-C175.
Schultz, Paul T. (2004). “School subsidies for the poor: evaluating the Mexican Progresa
poverty program,” Journal of Development Economics, 74(1): 199-250.
UNESCO (2010). Adult and Youth Literacy. UIS Fact sheet, September. (Available at
http://www.uis.unesco.org/FactSheets/Documents/fs20-literacy-day-2012-en-v3.pdf)
UNICEF (2010). Education For All Global Monitoring Report: Reaching the
Marginalized. Oxford University Press.
United Nations (2008a). Fact Sheet: Goal 2 Achieve Universal Primary Education.
United Nations Department of Public Information, Publication Number DPI/2517H,
September.
! 26!
United Nations (2008b). Fact Sheet: Goal 3 Promote Gender Equality and Empower
Women, United Nations Department of Public Information, Publication Number
DPI/2517I, September.
van der Klaauw, Wilbert (2002). “Estimating the Effect of Financial Aid Offers on
College Enrollment: A Regression-Discontinuity Approach,” International
Economic Review, 43(4): 1249-1287.

! 27!
Table&1:&Sample&Size& !! !! !! !! !! !! !!
! ! ! !Treatment!
!Sample!
! !Control!
!Total! Regular! Incentive!
!Total!
!! !! (1)! !! (2)! (3)! (4)! !! (5)!
! ! ! ! ! ! ! ! !Number!of!Villages! 38!!
161! 82! 79!!
199!
! ! ! ! ! ! ! ! !Baseline!Survey!! ! ! ! ! ! ! !Households!!
434!!
1599! 795! 804!!
2033!Children!
!1141!
!4415! 2261! 2154!
!5556!
! ! ! ! ! ! ! ! !First!FollowMUp!Survey!! ! ! ! ! ! !Households!
!1530!
!7109! 3795! 3314!
!8639!
Children!!
4567!!
20590! 11231! 9359!!
25157!
! ! ! ! ! ! ! ! !Second!FollowMUp!Survey!! ! ! ! ! ! !Households!
!1069!
!4897! 2594! 2303!
!5966!
Children!!
3093!!
14628! 7718! 6910!!
17721!Note:!This!table!contains!the!tabulation!of!the!sample!used!for!the!study,!divided!by!survey!round!and!research!group.!!
!! !

! 28!
Table 2: Internal Validity Baseline First Follow-Up Second Follow-Up
Control Treatment-
Control Treatment-
Control Treatment-
Average Control
Average Control
Average Control
(1) (2) (1) (2) (1) (2)
Panel A: Child Characteristics Age 6.859 -0.023
8.389! 0.112!
9.266! 0.094!
(0.071)
!(0.134)!
!(0.116)!
Girl 0.379 0.041*
0.396! 0.038***!
0.411! 0.027**!
(0.024)
!(0.012)!
!(0.013)!
Enrolled at Baseline 0.261 0.008
0.29 -0.012
0.297 -0.025
(0.046)
(0.079)
(0.081)
Head of Household's Child
0.862! 0.025!
!(0.026)!
Panel B: Household Characteristics Size of Household 9.858 -0.833
9.708! M0.511!
7.437! M0.072!
(0.563)
!(0.439)!
!(0.263)!
Number of Children 3.018 -0.257
4.035! M0.204!
4.932 -0.141
(0.166)
!(0.152)!
(0.158)
Year's of Education for 2.571 0.252
1.895! 0.488!
2.456! 0.191!
Head of Household
(0.398) !
(0.305)! !
(0.344)!
Head of Household is a 0.613 0.03
0.533! M0.068!
0.616! M0.067!
Farmer
(0.062) !
(0.050)! !
(0.059)!
Land Holdings (Acres)
4.808! 0.393!
5.022! 0.25!
!(1.175)!
!(1.235)!
Household Structure ! ! Brick
0.052! 0.002!
0.048 0.013
!(0.022)!
(0.023)
Semi-Brick
0.197! M0.02!
0.166 -0.012
!(0.063)!
(0.046)
Non-Brick
0.476! 0.125*!
0.522 0.095
!(0.076)!
(0.063)
Thatched Hut
0.274! M0.107!
0.264 -0.096
!(0.077)!
(0.064)
Number of Goats
4.401! M0.25!
!(0.950)!
Sunni Muslim
0.9! 0.006!
!(0.047)!
Language Urdu
0.116! 0.039!
!(0.044)!
Sindhi
0.662! 0.062!
!(0.066)!
Panel&C:&Estimated&Bias& Estimate!
0.007
0.021
0.006
pMvalue! 0.481 0.228 0.554 Note: This table contains average demographic characteristics of children and households from the baseline and the two follow-up surveys. Columns (1), (3), and (5) give the mean for control villages; and columns (2), (4), and (6) the treatment-control differential as determined by a regression of the indicated variable on the treatment dummy. Statistical significance at the one-, five-, and ten-percent levels is indicated by ***, **, and * respectively.
!! !

! 29!
Table&3:&School&Characteristics&by&Type&of&School&
! ! ! ! ! ! !!! PPRS! PPRS!M! PPRS!M! !! !! PPRS! PPRS!M! PPRS!M!
!Average! Public! Private!
! !Average! Public! Private!
!! (1)! (2)! (3)! !! !! (4)! (5)! (6)!
! ! ! ! ! ! ! ! !School!Surveyed! 0.956! 0.634***! 0.705***!!
Panel&C:&Teacher&Characteristics&! ! !
! !(0.046)!! (0.085)!!
!Days!Absent!in!Last!Month! 0.838! M0.143! 0.25!
Panel&A:&School&Characteristics&! ! ! ! ! !
(0.314)!! (0.266)!!
Number!of!Days!Open! 5.116! 0.764**! 0.234!!
Female! 0.493! 0.252***! M0.039!
Per!Week!!
(0.319)!! (0.540)!!! ! !
(0.075)!! (0.175)!!
Open!Admissions! 0.88! M0.021! 0.018!!
Age! 25.153! M13.987***! M0.385!
! !(0.048)!! (0.100)!!
! ! !(1.420)!! (1.438)!!
Uniform!Required! 0.027! 0.027! M0.309*!!
Years!of!Education! 10.965! M0.960***! M0.950***!
! !(0.017)!! (0.181)!!
! ! !(0.187)!! (0.276)!!
Medium!of!Instruction!! ! ! !
Monthly!Salary!! 4.069! M11.735***! 0.388!
Urdu! 0.041! 0.024! M0.034!!
(Thousands!of!Pakistani!Rupees)!!
(1.136)!! (0.532)!!
! !(0.023)!! (0.077)!!
!Years!of!Experience! 2.782! M12.152***! M0.568!
Sindhi! 0.609! M0.374***! 0.018!! ! !
(1.472)!! (0.730)!!
! !(0.050)!! (0.179)!!
!Years!at!Current!School! 1.772! M5.446***! M0.876!
English! 0.313! 0.313***! M0.02!! ! !
(1.034)!! (0.682)!!
! !(0.045)!! (0.177)!!
!Break!Down!of!Weekly!Teaching!Time!
! ! !Staffing!! ! ! !
Total!Hours! 25.985! 0.181! M0.753!
Number!of!Teachers! 3.776! 0.939***! M2.486!! ! !
(1.752)!! (1.138)!!
! !(0.318)!! (1.860)!!
!Teaching!Full!Class! 6.495! 0.019! M2.732!
Number!of!Female!Teachers! 1.979! 1.470***! M3.460**!! ! !
(0.815)!! (4.100)!!
! !(0.203)!! (1.529)!!
!Teaching!Students!in!Small!Groups! 6.211! 1.144! M0.72!
Number!of!Teacher!with!PostM! 1.899! M0.461! M1.674**!! ! !
(0.798)!! (2.409)!!
Secondary!Degree!!
(0.461)!! (0.820)!!!
Teaching!Individiual!Children! 5.984! 0.194! M1.177!
Number!of!Teachers!'(!5!Years! 3.128! 2.505***! 0.652!! ! !
(0.881)!! (2.224)!!
Experience!!
(0.176)!! (0.714)!!!
Dictating!Notes!to!Class! 6.212! 1.333! M0.551!
Number!of!Teachers!Between! 0.601! 0.409***! M2.815!! ! !
(0.912)!! (2.992)!!
5!and!10!years!Experience!!
(0.123)!! (2.212)!!!
Time!Spent!on!Discipline! 3.623! M0.329! M0.532!
Number!of!teachers!)!10!Years! 0.047! M2.015***! M0.323!! ! !
(0.728)!! (1.044)!!
Experience!!
(0.301)!! (0.366)!!!
Administering!Tests! 4.031! 1.213*! 1.673***!
! ! ! ! ! ! !(0.619)!! (0.614)!!
Panel&B:&Building&Characteristics&! ! ! !
Administrative!Responsibilities! 3.222! 0.527! 0.107!
School!is!in!a!Building! 0.965! 0.01! M0.035*!! ! !
(0.540)!! (1.527)!!
! !(0.033)!! (0.020)!!
! ! ! ! !Number!of!Class!Rooms! 3.227! 0.462! 0.112!! ! ! ! !
! !(0.349)!! (0.925)!!
! ! ! ! !School!Has!Enough!Desks! 0.802! 0.203**! 0.163!! ! ! ! !
! !(0.098)!! (0.175)!!
! ! ! ! !School!Has!Potable!Water! 0.886! 0.347***! M0.114***!! ! ! ! !
! !(0.104)!! (0.031)!!
! ! ! ! !School!Has!Electricity! 0.768! 0.129*! M0.024!! ! ! ! !
! !(0.068)!! (0.141)!!
! ! ! ! !School!Has!Toilet! 0.846! 0.340***! 0.192!! ! ! ! !!! !! (0.114)!! (0.167)!! !! !! !! !! !!
Note:!This!table!gives!the!characteristics!of!program!schools,!and!the!programMpublic!and!programMprivate!differentials.!In!columns!(1)!and!(4)!are!given!the!mean!levels!for!program!villages.!The!differentials!in!columns!(2)M(3)!and!(5)M(6)!come!from!a!regression!of!the!indicated!variable!on!treatment!dummies,!estimated!individually!for!private!and!government!schools.!The!unit!of!observation!is!the!young!childMschool!level.!Statistical!significance!at!the!oneM,!fiveM,!and!tenMpercent!levels!is!indicated!by!***,!**,!and!*!respectively.!
!
! 30!
!Table&4:&Child's&School&Characteristics&by&Treatment&Status&
! ! ! !!! Control! Treatment!M! !! !! Control! Treatment!M!
!Average! Control!
! !Average! Control!
!! (1)! (2)! !! !! (3)! (4)!
! ! ! ! ! ! !School!Surveyed! 0.952! 0.044!!
Panel&C:&Teacher&Characteristics&! !
! !(0.029)!!
!Days!Absent!in!Last!Week! 1.906! M1.009!
Panel&A:&School&Characteristics&! ! ! ! !
(0.850)!!
Number!of!Days!Open! 5.398! M0.231!!
Female! 0.1! 0.366***!
Per!Week!!
(0.350)!!! ! !
(0.085)!!
Open!Admissions! 0.958! M0.072!!
Age! 34.43! M9.014***!
! !(0.045)!!
! ! !(2.104)!!
Uniform!Required! 0! 0.021!!
Years!of!Education! 12.028! M1.058***!
! !(0.014)!!
! ! !(0.255)!!
Medium!of!Instruction!! ! !
Monthly!Salary!! 11.686! M7.451***!
Urdu! 0.069! M0.022!!
(Thousands!of!Pakistani!Rupees)!!
(1.917)!!
! !(0.052)!!
!Years!of!Experience! 10.297! M7.401***!
Sindhi! 0.931! M0.312***!! ! !
(2.293)!!
! !(0.066)!!
!Years!at!Current!School! 4.129! M2.334**!
English! 0! 0.297***!! ! !
(0.924)!!
! !(0.043)!!
!Break!Down!of!Weekly!Teaching!Time!
! !Staffing!! ! !
Total!Hours! 25.104! 0.967!
Number!of!Teachers! 2.278! 1.527***!! ! !
(4.744)!!
! !(0.301)!!
!Teaching!Full!Class! 6.821! M0.432!
Number!of!Female!Teachers! 0.246! 1.716***!! ! !
(1.354)!!
! !(0.240)!!
!Teaching!Students!in!Small!Groups! 4.134! 2.097*!
Number!of!Teacher!with!PostM! 1.533! 0.378!! ! !
(1.067)!!
Secondary!Degree!!
(0.338)!!!
Teaching!Individual!Children! 5.224! 0.857!
Number!of!Teachers!'(!5!Years! 0.766! 2.397***!! ! !
(1.242)!!
Experience!!
(0.269)!!!
Dictating!Notes!to!Class! 3.811! 2.367**!
Number!of!Teachers!Between! 0.388! 0.194!! ! !
(1.159)!!
5!and!10!years!Experience!!
(0.178)!!!
Time!Spent!on!Discipline! 3.242! 0.508!
Number!of!teachers!)!10!Years! 1.124! M1.065***!! ! !
(0.721)!!
Experience!!
(0.268)!!!
Administering!Tests! 2.695! 1.303!
! ! ! ! ! !(0.915)!!
Panel&B:&Building&Characteristics&! ! !
Administrative!Responsibilities! 2.637! 0.58!
School!is!in!a!Building! 0.919! 0.047!! ! !
(0.652)!!
! !(0.062)!!
! ! ! !Number!of!Class!Rooms! 2.192! 0.996***!! ! ! !
! !(0.279)!!
! ! ! !School!Has!Enough!Desks! 0.616! 0.186!! ! ! !
! !(0.139)!!
! ! ! !School!Has!Potable!Water! 0.578! 0.298*!! ! ! !
! !(0.153)!!
! ! ! !School!Has!Electricity! 0.628! 0.134!! ! ! !
! !(0.139)!!
! ! ! !School!Has!Toilet! 0.401! 0.436***!! ! ! !!! !! (0.148)!! !! !! !! !!
Note:!This!table!gives!the!effect!of!treatment!on!the!characteristics!of!the!schools!in!which!children!are!enrolled.!Columns!(1)!and!(3)!give!the!controlMvillage!mean;!columns!(2),!and!(4)!give!the!treatment!differential,!as!estimated!from!a!regression!of!the!indicated!variable!on!a!treatment!dummy.!All!standard!errors!are!clustered!at!the!village!level.!Statistical!significance!at!the!oneM,!five,!and!tenMpercent!levels!is!indicated!by!***,!**,!and!*!respectively.!
!

! 31!
!Table&5:&Enrollment&
! ! ! ! ! ! ! !!! !! !! !! !! !! Verified& !! Highest&
!SelfEReported&Enrollment&
!Enrollment&
!Grade&
!! (1)! (2)! (3)! (4)! !! (5)! !! (6)!
! ! ! ! ! ! ! ! !Panel&A:&Officially&Eligible&Children&! ! ! ! ! ! !First!FollowMUp! 0.498***! 0.499***! 0.483***! 0.487***!
! ! ! !!
(0.055)! (0.055)! (0.058)! (0.055)!! ! ! !Second!FollowMUp! 0.306***! 0.306***! 0.304***! 0.295***!!
0.296***!!
0.359***!
!(0.060)! (0.060)! (0.059)! (0.060)!
!(0.041)!
!(0.116)!
! ! ! ! ! ! ! ! !Panel&B:&Older&Children&! ! ! ! ! ! ! !First!FollowMUp! 0.259***! 0.262***! 0.247***! 0.255***!
! ! ! !!
(0.063)! (0.065)! (0.068)! (0.062)!! ! ! !Second!FollowMUp! 0.137**! 0.140**! 0.137***! 0.122**!! ! !
M0.023!
!(0.057)! (0.057)! (0.051)! (0.053)!
! ! !(0.312)!
! ! ! ! ! ! ! ! !Child!Controls! no! yes! yes! yes!!
yes!!
yes!HH!Controls! no! no! yes! yes!
!yes!
!yes!
District!FEs! no! no! no! yes! !! yes! !! yes!Note:!This!table!gives!the!treatment!effects!on!selfMreported!enrollment!during!the!census!and!followMup,!verified!enrollment!during!the!followMup,!and!the!highest!grade!attained!at!the!time!of!the!followMup.!The!controls!are!as!indicated.!All!standard!errors!are!clustered!at!the!village!level.!Statistical!significance!at!the!oneM,!fiveM,!and!tenMpercent!levels!is!indicated!by!***,!**,!and!*!respectively.!
!! !
! 32!
Table&6:&Test&Scores&! ! ! ! !!! !! !! !! !! !!
!! (1)! (2)! (3)! (4)! (5)!
! ! ! ! ! !Math!Test! 0.600***! 0.599***! 0.602***! 0.656***! 1.986***!
!(0.143)!! (0.145)!! (0.142)!! (0.131)!! (0.271)!
Language!Test! 0.596***! 0.595***! 0.594***! 0.636***! 1.913***!
!(0.147)!! (0.148)!! (0.144)!! (0.130)!! (0.223)!
Total!Score! 0.619***! 0.617***! 0.618***! 0.668***! 2.011***!
!(0.148)!! (0.150)!! (0.146)!! (0.134)!! (0.253)!
! ! ! ! ! !Model! ITT! ITT! ITT! ITT! TOT!Child!Controls! no! yes! yes! yes! yes!HH!Controls! no! no! yes! yes! yes!
District!FEs! no! no! no! yes! yes!Note:!This!table!contains!estimates!of!the!effect!of!the!program!schools!on!test!scores.!In!columns!(1)M(4),!the!coefficients!give!the!effect!of!the!treatment!on!the!indicated!test!score.!In!column!(5),!the!coefficient!is!for!enrollment,!instrumented!by!the!treatment!status.!Test!scores!are!demeaned!by!the!controlMvillage!mean,!and!divided!by!the!standard!deviation.!The!control!variables!are!as!given.!All!standard!errors!are!clustered!at!the!village!level.!Statistical!significance!at!the!oneM,!fiveM,!and!tenMpercent!levels!is!indicated!by!***,!***,!and!*!respectively.!!
!! !
! 33!
Table&7:&Disaggregation&by&Stipend&Type&! ! ! ! ! ! !!! SelfMReported!Enrollment! !! Verified! !! Highest! !! Total!
!FollowMUp!1! FollowMUp!2!
!Enrollment!
!Grade!
!Score!
!! (1)! (2)! !! (3)! !! (4)! !! (5)!
! ! ! ! ! ! ! ! !Treat! 0.485***! 0.318***!!
0.270***!!
0.422***!!
0.668***!
!(0.057)!! (0.063)!!
!(0.042)!!
!(0.107)!!
!(0.138)!!
! ! ! ! ! ! ! ! !Treat*GenderMDifferentiated!Subsidy! 0.003! M0.006!!
0.049!!
0.012!!
0!
!(0.027)!! (0.022)!!
!(0.034)!!
!(0.057)!!
!(0.064)!!
Constant!! ! ! ! ! ! ! !N! 19294! 11572!
!10217!
!11444!
!10320!
RMsquared! 0.241! 0.111! !! 0.1! !! 0.213! !! 0.203!Note:!This!table!contains!estimates!of!the!differential!between!the!two!treatment!effects.!!The!outcomes!are!selfMreported!enrollment!at!the!time!of!the!census!and!followMup,!verified!followMup!enrollment,!the!highest!grade!attained,!and!the!total!test!score.!All!standard!errors!are!clustered!at!the!village!level.!Statistical!significance!at!the!oneM,!fiveM,!and!tenMpercent!levels!is!indicated!by!***,!**,!and!*!respectively.!!
!! !

! 34!
Table&8:&Disaggregation&by&Gender&! ! ! ! ! !!! SelfEReported&Enrollment& && Verified& && Highest& && Total&
!FollowEUp&1& FollowEUp&2&
&Enrollment&
&Grade&
&Score&
!! (1)! (2)! !! (3)! !! (4)! !! (5)!
! ! ! ! ! ! ! ! !Treat! 0.465***! 0.314***!!
0.289***!!
0.438***!!
0.630***!
!(0.058)!! (0.065)!!
!(0.039)!!
!(0.111)!!
!(0.144)!!
! ! ! ! ! ! ! ! !Treat*Female! 0.052*! 0.003!!
0.016!!
M0.018!!
0.09!
!(0.027)!! (0.030)!!
!(0.020)!!
!(0.059)!!
!(0.061)!!
! ! ! ! ! ! ! ! !N! 19272! 11521!!
10177!!
11393!!
10279!RMsquared! 0.239! 0.111! !! 0.098! !! 0.213! !! 0.203!Note:!This!table!contains!estimates!of!the!effect!of!the!program!schools!by!gender.!The!outcomes!are!selfMreported!enrollment!at!the!time!of!the!census!and!followMup,!verified!followMup!enrollment,!the!highest!grade!attained,!and!the!total!test!score.!All!standard!errors!are!clustered!at!the!village!level.!Statistical!significance!at!the!oneM,!fiveM,!and!tenMpercent!levels!is!indicated!by!***,!**,!and!*!respectively.!!
!!! !
! 35!
Table&9:&Disaggregation&by&Gender&and&Treatment&Type&! ! ! ! ! !!! SelfEReported&Enrollment& && Verified& && Highest& && Total&
!FollowEUp&1& FollowEUp&2&
&Enrollment&
&Grade&
&Score&
!! (1)! (2)! !! (3)! !! (4)! !! (5)!
! ! ! ! ! ! ! ! !Regular!Stipend! 0.464***! 0.318***!!
0.263***!!
0.454***!!
0.623***!
!(0.059)!! (0.065)!!
!(0.043)!!
!(0.116)!!
!(0.147)!!
! ! ! ! ! ! ! ! !Neutral!Subsidy*Female! 0.050*! M0.001!!
0.019!!
M0.068!!
0.106*!
!(0.030)!! (0.031)!!
!(0.025)!!
!(0.065)!!
!(0.064)!!
! ! ! ! ! ! ! ! !Female!Stipend! 0.465***! 0.309***!!
0.317***!!
0.420***!!
0.638***!
!(0.061)!! (0.067)!!
!(0.043)!!
!(0.114)!!
!(0.147)!!
! ! ! ! ! ! ! ! !Girls'!Subsidy*Female! 0.054*! 0.008!!
0.012!!
0.036!!
0.073!
!(0.028)!! (0.032)!!
!(0.025)!!
!(0.061)!!
!(0.064)!!
! ! ! ! ! ! ! ! !N! 19272! 11521!!
10177!!
11393!!
10279!RMsquared! 0.239! 0.111!
!0.101!
!0.213!
!0.203!
! ! ! ! ! ! ! ! !H0:!Uniform!Subsidy!=!Differentiated!Subsidy! 0! 0.156!!
2.049!!
0.282!!
0.055!
!0.986! 0.693!
!0.154!
!0.596!
!0.815!
! ! ! ! ! ! ! ! !H0:!Uniform!+!Uniform*Female=! 0.02! 0!!
1.555!!
1.321!!
0.064!
Differentiated!+!Differentiated*!Female! 0.886! 0.984!!
0.214!!
0.252!!
0.8!
! ! ! ! ! ! ! ! !H0:!Uniform*Female!=! 0.036! 0.259!!
0.052!!
4.524!!
0.662!Differentiated!*!Female! 0.85! 0.611! !! 0.82! !! 0.035! !! 0.417!
Note:!This!table!contains!estimates!of!the!two!treatment!effects!by!gender.!!The!outcomes!are!selfMreported!enrollment!at!the!time!of!the!census!and!followMup,!verified!followMup!enrollment,!the!highest!grade!attained,!and!the!total!test!score.!All!standard!errors!are!clustered!at!the!village!level.!Statistical!significance!at!the!oneM,!fiveM,!and!tenMpercent!levels!is!indicated!by!***,!**,!and!*!respectively.!!
!! !

! 36!
Table&10:&Child&Aspirations&! ! ! !!! !! && TreatE& && && && Treat&X&
! !Control& Control&
&Female& Treatment& Female&
!! !! (1)! (2)! !! (3)! (4)! (5)!
! ! ! ! ! ! ! !married!!
0.014! M0.006!!
M0.001! M0.008! M0.001!
! ! !(0.005)!!
!(0.006)!! (0.006)!! (0.007)!!
ideal!marriage!age! 18.496! 0.256!!
M1.018**! 0.331! M0.154!
! ! !(0.439)!!
!(0.413)!! (0.456)!! (0.448)!!
! ! ! ! ! ! ! !Parental&Preferences&for&Children:&! ! ! ! !
! ! ! ! ! ! ! !Civil!Servant! 0.119! 0.031!!
M0.059! 0.05! M0.027!
! ! !(0.036)!!
!(0.047)!! (0.048)!! (0.049)!!
Doctor!!
0.094! 0.047**!!
M0.006! 0.057***! M0.023!
! ! !(0.018)!!
!(0.022)!! (0.020)!! (0.025)!!
Private!Sector! 0.023! M0.005!!
M0.019**! M0.009! 0.012!
! ! !(0.012)!!
!(0.009)!! (0.015)!! (0.011)!!
Engineer! 0.015! 0.024***!!
M0.014**! 0.026***! 0.004!
! ! !(0.007)!!
!(0.007)!! (0.009)!! (0.011)!!
Farmer!!
0.105! M0.044*!!
M0.144***! M0.06! 0.055!
! ! !(0.025)!!
!(0.031)!! (0.038)!! (0.035)!!
Housewife! 0.187! M0.048**!!
0.409***! M0.002! M0.146***!
! ! !(0.023)!!
!(0.043)!! (0.010)!! (0.049)!!
Laborer!!
0.025! M0.01!!
M0.022**! M0.004! M0.001!
! ! !(0.008)!!
!(0.010)!! (0.010)!! (0.011)!!
Landlord! 0.016! 0.004!!
M0.017*! 0.004! 0!
! ! !(0.006)!!
!(0.009)!! (0.010)!! (0.010)!!
Lawyer!!
0.004! 0.009***!!
M0.007**! 0.009*! 0.002!
! ! !(0.003)!!
!(0.003)!! (0.005)!! (0.005)!!
Police/army/security! 0.084! M0.031!!
M0.100***! M0.050*! 0.041*!
! ! !(0.020)!!
!(0.022)!! (0.026)!! (0.023)!!
Raise!livestock! 0.022! M0.009!!
0.002! M0.007! M0.008!
! ! !(0.011)!!
!(0.012)!! (0.010)!! (0.012)!!
Teacher!!
0.242! 0.027!!
0.026! M0.012! 0.079**!
! ! !(0.028)!!
!(0.029)!! (0.025)!! (0.035)!!
! ! ! ! ! ! ! !Ideal!Education! 7.279! 1.532**!!
M0.835**! 1.456**! 0.249!
! ! !(0.605)!!
!(0.395)!! (0.681)!! (0.458)!!
! ! ! ! ! ! ! !Child's&Preferences&! ! ! ! ! !! ! ! ! ! ! ! !Ideal!Jobs:!
! ! ! ! ! ! !Army!!
0.102! M0.031!!
M0.085! M0.068! 0.054!
! ! !(0.044)!!
!(0.060)!! (0.098)!! (0.066)!!
Doctor!!
0.216! 0.031!!
M0.027! 0.094! 0.066!
! ! !(0.055)!!
!(0.093)!! (0.074)!! (0.108)!!
Farmer!!
0.023! M0.019!!
0.011! M0.032! M0.011!
! ! !(0.013)!!
!(0.054)!! (0.033)!! (0.054)!!
Government! 0.034! 0.041**!!
0! 0.122***! M0.112***!
! ! !(0.021)!!
!(0.000)!! (0.034)!! (0.036)!!
Other!!
0.057! M0.008!!
M0.093! 0.002! 0.064!
! ! !(0.052)!!
!(0.079)!! (0.084)!! (0.084)!!
Private!sector! 0.17! M0.005!!
M0.007! M0.063! 0.083!
! ! !(0.068)!!
!(0.131)!! (0.099)!! (0.146)!!
Teacher!!
0.386! M0.001!!
0.301**! 0.036! M0.241!
! ! !(0.085)!!
!(0.149)!! (0.128)!! (0.165)!!
! ! ! ! ! ! ! !Desired!Education! 11.031! M0.165!!
M0.381! M0.267! 0.5!
! ! !(0.393)!!
!(0.440)!! (0.589)!! (0.514)!!
Note:!This!table!contains!estimates!of!the!effect!of!the!treatment!on!the!aspirations!for!children!within!the!household.!Column!(1)!gives!the!mean!level!in!control!villages,!and!column!(2)!the!treatment!differential.!Columns!(4)M(6)!give!the!gender!differentials!across!control!and!treatment!villages.!All!standard!errors!are!clustered!at!the!village!level.!Statistical!significance!at!the!oneM,!fiveM,!and!tenMpercent!levels!is!indicated!by!***,!**,!and!*!respectively.!

! 37!
!!
Table A1: Internal Validity, Stipend Type Baseline First Follow-Up Second Follow-Up
Uniform Differentiated-
Uniform Differentiated-
Uniform Differentiated-
Average Uniform
Average Uniform
Average Uniform
(1) (2) (3) (4) (5) (6)
Panel A: Child Characteristics Age 6.857 -0.042
8.521 -0.046
9.443 -0.175
(0.062)
(0.116)
(0.113)
Girl 0.413 0.014
0.428 0.011
0.435 0.008
(0.018)
(0.010)
(0.011)
Enrolled at Baseline 0.275 -0.013
0.289 -0.025
0.285 -0.027
(0.042)
(0.059)
(0.058)
Head of Household's Child
0.878 0.019
(0.021)
Panel B: Household Characteristics
Size of Household 9.202 -0.364
9.561 -0.798**
7.382 -0.036
(0.438)
(0.374)
(0.211)
Number of Children 2.76 0.001
3.929 -0.216
4.821 -0.064
(0.133)
(0.135)
(0.132)
Year's of Education for 2.906 -0.169
2.384 -0.001
2.625 0.047 Head of Household
(0.342)
(0.286)
(0.297)
Head of Household is a 0.648 -0.01
0.467 -0.005
0.566 -0.037 Farmer
(0.047)
(0.049)
(0.044)
Land Holdings (Acres)
6.165 -2.068
6.156 -1.871
(1.474)
(1.486)
Household Structure Brick
0.049 0.011
0.057 0.008
(0.023)
(0.028)
Semi-Brick
0.186 -0.018
0.163 -0.018
(0.050)
(0.039)
Non-Brick
0.6 0.002
0.621 -0.01
(0.062)
(0.053)
Thatched Hut
0.165 0.005
0.158 0.02
(0.065)
(0.048)
Number of Goats
4.143 0.019
(0.837)
Sunni Muslim
0.907 -0.003
(0.040)
Language Urdu
0.146 0.018
(0.046)
Sindhi
0.711 0.028
(0.056)
Panel&C:&Estimated&Bias& Estimate!
0.003
0.002
-0.010 pMvalue! 0.777 0.826 0.195
Note: This table contains average demographic characteristics of children and households from the baseline and two follow-ups surveys. Columns (1), (3), and (5) give the mean for the Uniform subsidy villages; and columns (2), (4), and (6) the Uniform-Differentiated differential as determined by a regression of the indicated variable on the Uniform treatment dummy, limiting the sample to treatment villages. Statistical significance at the one-, five-, and ten-percent levels is indicated by ***, **, and * respectively.
!