leveraging utility performance with effective utility management
TRANSCRIPT

Leveraging Utility Performance with Effective Utility Management and Lean/Six Sigma
Diane Taniguchi-Dennis, P.E. Deputy General Manager Clean Water Services Hillsboro, Oregon November 2012

Clean Water Services
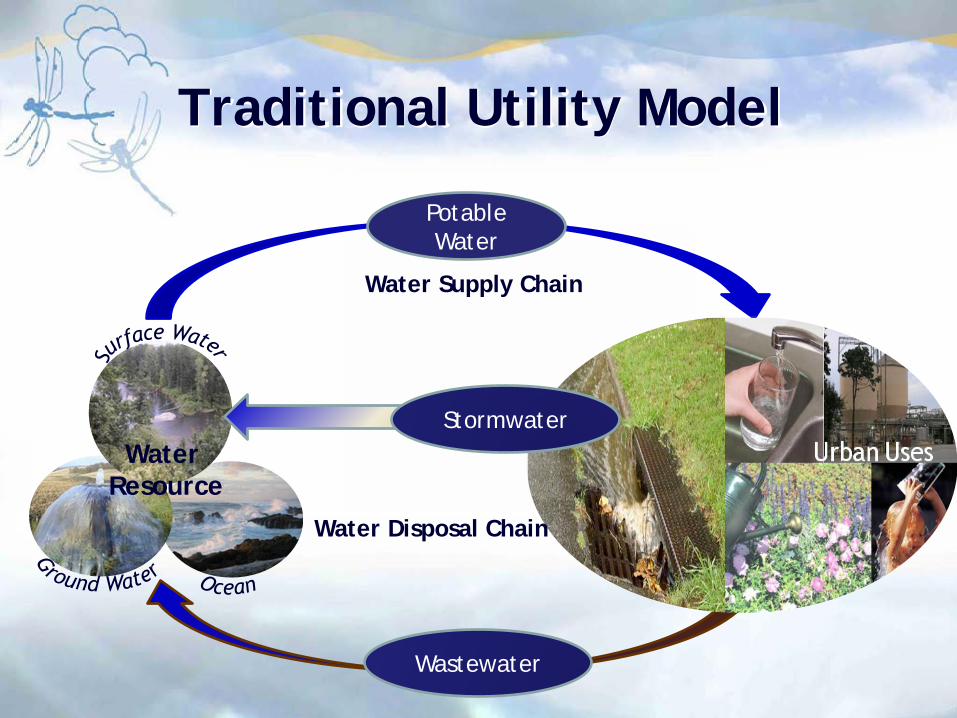
Traditional Utility Model
Water Resource
Potable Water
Wastewater
Stormwater
Water Supply Chain
Water Disposal Chain


Landscape Irrigation
Restore Urban Creeks and Wetlands
Potable Water Supply
Total Water Management
Stormwater Reuse Water Supply
Wastewater
Public Spaces
Emergent Utility Model

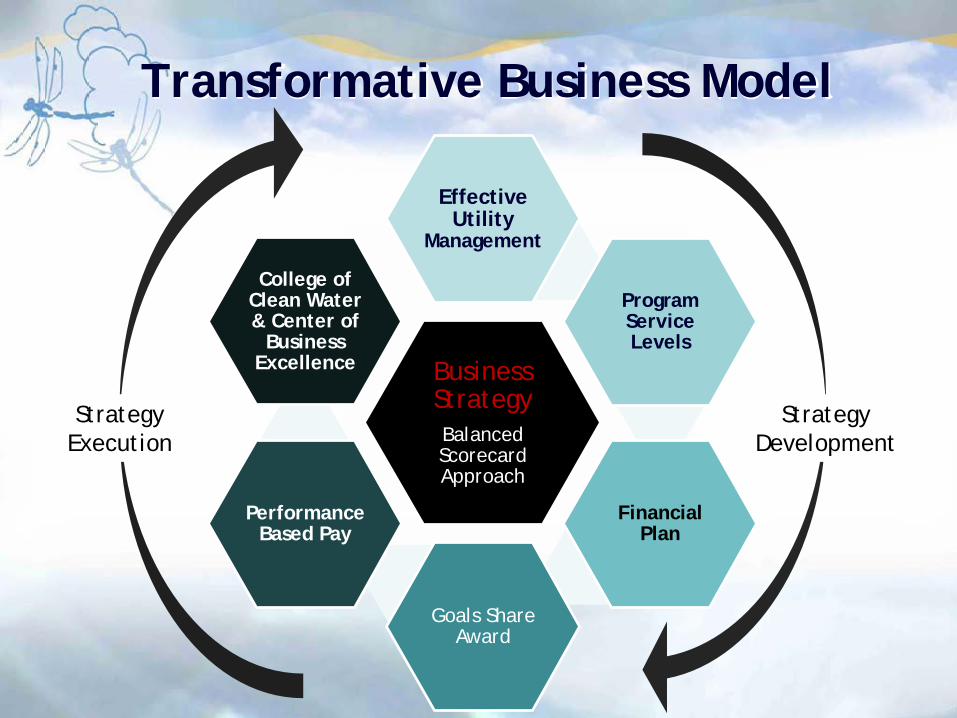
Transformative Business Model
Business Strategy Balanced Scorecard Approach

Transformative Business Model
Strategy Development
Business Strategy Balanced Scorecard Approach
Effective Utility
Management

Where We Started

Where We Are Going
Pumps, Pipes, & Plants
Public & Environmental Health
Resource Recovery

CS Customer Satisfaction OR Operational Resiliency ED Employee & Leadership Development PQ Product Quality FV Financial Viability SS Stakeholder Understanding & Support IS Infrastructure Stability SU Community Sustainability OO Operational Optimization WA Water Resource Adequacy

Transformative Business Model
Strategy Development
Business Strategy Balanced Scorecard Approach
Effective Utility
Management
Program Service Levels

Clean Water Services at a Glance
Wastewater Collection and Treatment
Surface Water Management
Watershed Management
River Flow Management
Program Service Levels

Business Strategy
Voice of the Customer
Partnerships Innovation Resource Recovery
Operational Excellence
Lean Six Sigma
Performance
Visability
Enhanced Technology
College of
Clean Water
Struvite Recovery
Solar
Cogen
FOG
Street
Sweeping Recovery
Vision & Mission
Watershed Based
Trading
Natural Treatment
System
Native Plant
Nursery
Agriculture
Community Programs
Irrigation Districts
Drinking Water
Suppliers

Transformative Business Model
Strategy Development
Business Strategy Balanced Scorecard Approach
Effective Utility
Management
Program Service Levels
Financial Plan

Financial Trend
$0
$10,000
$20,000
$30,000
$40,000
$50,000
$60,000
$70,000
FY '90
FY '91
FY '92
FY '93
FY '94
FY '95
FY '96
FY '97
FY '98
FY '99
FY '00
FY '01
FY '02
FY '03
FY '04
FY '05
FY '06
FY '07
FY '08
FY '09
FY '10
FY '11
FY '12
6.2% Increasing Trend
Actu
al E
xpen
ditu
res
(in 1
,000
’s D
olla
rs)
Fiscal Year
Transformative Business Model
Strategy Development
Strategy Execution
Business Strategy Balanced Scorecard Approach
Effective Utility
Management
Program Service Levels
Financial Plan
Goals Share Award
Performance Based Pay
College of Clean Water & Center of
Business Excellence

Business Strategy
Voice of the Customer
Partnerships Innovation Resource Recovery
Operational Excellence
Lean Six Sigma
Performance
Visability
Enhanced Technology
College of
Clean Water
Struvite Recovery
Solar
Cogen
FOG
Street
Sweeping Recovery
Vision & Mission
Watershed Based
Trading
Natural Treatment
System
Native Plant
Nursery
Agriculture
Community Programs
Irrigation Districts
Drinking Water
Suppliers

Business Process Re-engineering
$0
$10,000
$20,000
$30,000
$40,000
$50,000
$60,000
$70,000
FY '90
FY '91
FY '92
FY '93
FY '94
FY '95
FY '96
FY '97
FY '98
FY '99
FY '00
FY '01
FY '02
FY '03
FY '04
FY '05
FY '06
FY '07
FY '08
FY '09
FY '10
FY '11
FY '12
BPR w/o BPR
First two years saved ratepayers over $13 million

Sustaining Performance Lean/Six Sigma
$0
$10,000
$20,000
$30,000
$40,000
$50,000
$60,000
$70,000
FY '90
FY '91
FY '92
FY '93
FY '94
FY '95
FY '96
FY '97
FY '98
FY '99
FY '00
FY '01
FY '02
FY '03
FY '04
FY '05
FY '06
FY '07
FY '08
FY '09
FY '10
FY '11
FY '12
BPR w/o BPR
Strategic Investments in Watershed Health and Resource Recovery
Addition of Surface Water Programs
BPR
Lean/ Six SIgma

260
285
310
335
360
385
410
435
460
485
510
535
560
1997 1998 1999 2000 2001 2002 2003 2004 2005 2006 2007 2008 2009 2010 2011 2012 2013 est
Washington County Population vs. CWS Staffing Levels
Lean /Six Sigma
Staffing Levels
CWS Staffing
Population (in 1000’s)
Business Process Re-engineering
45 employees per 50,000 residents
(366 FTE’s)
29 employees per 50,000 residents
(311.05 FTE’s)
366.00 Budgeted FTE’s in FY 1996-97 311.05 Budgeted FTE’s in FY 2012-13

Misaligned Metrics, Priorities, and Policies
Waste & Loss
Inefficiency
Defects/Re-do’s
Non-value adding activities or investments
Obstructions to optimal process
Highly variable outcomes
Results

Six Sigma Reduce process variation
Business Improvement Tools
Use the Right Tool for the Right Project

Glitches, Rattles, Gaps, & Giggles
High Impact Projects
Does it have a direct, line of sight connection, to key EUM Attributes?
Idea
Idea Idea Idea Generator
Idea Idea Idea
Idea Filter

Lean Thinking
Reduce Wasted Time or Wasted Materials
Flow-focused
Less wasted time or materials improves efficiency and reduces cost
Many small improvements
Focus on “DOWNTIME”

DOWNTIME
Defects
Over-Production
Waiting
Not Using Tribal Knowledge
Transportation
Inventory
Motion
Extra Processing

Personnel Authorization Process: As-Is

DOWNTIME Category of Waste Definition Example in an office (non-
manufacturing) environment. Personnel Authorization Waste
Eliminated
Defects The effort involved in inspecting for and fixing defects
Errors in data, invoices, customer orders, etc.
Reduced the number of steps (where errors could be introduced) from 15
to 7.
Overproduction Production ahead of demand Printing unneeded paperwork Printing PAs for physical signatures
Waiting Waiting for the next production step
Staff waiting for a resource (e.g. access to a computer application)
to become available.
Payroll waiting for batched folders to be signed and returned
Not fully utilizing tribal knowledge Failing to tap into the knowledge, skills, education and creativity of
employees.
Not involving office staff in an attempt to improve a process.
Staff knew time card double entry of seven types was occurring
Transportation Moving products that are not actually required to perform the
processing
Receiving items in an area not close to where they will actually
be used.
Walking to route batched folders
Inventory All components, work in process and finished product not being
processed
Messages and requests in email in-boxes.
Placing them in batched folders
Motion People or equipment moving or walking more than is required to
perform the processing
Looking for physical documents. Placing paper-based PAs into batched folders
Extra (stupid) Processing Performing unnecessary or incorrect processing.
Over-analyzing data. Reduced the number of reasons for a PA from 13 to 7

Overproduction – Eliminated 46% of Types of PAs
Personal Authorization Type Eliminate Reason
New Hire No Requires Dept. Director Approval
Separation No Requires Dept. Director Approval
Family Medical Leave Yes Captured on Timecards
Promotion No Requires Dept. Director Approval
Leave Without Pay No Tracks Loss of Accruals
Worker’s Comp Paid Time Loss Yes Capture on Timecards
Employer Paid Time Loss Yes Capture on Timecards
Light Duty Yes Capture on Timecards
Return to Regular Duty Yes Capture on Timecards
Suspension Without Pay No Requires Dept. Director Approval
Holiday Without Pay Yes Capture on Timecards
Administrative Absence Without Pay No Requires Dept. Director Approval
Military Leave Yes Capture on Timecards

Personnel Authorization Process: To-Be

Six Sigma
Reduce Process Variation
Problem-focused
People centered process
Based on data
System outputs improved by reducing variability
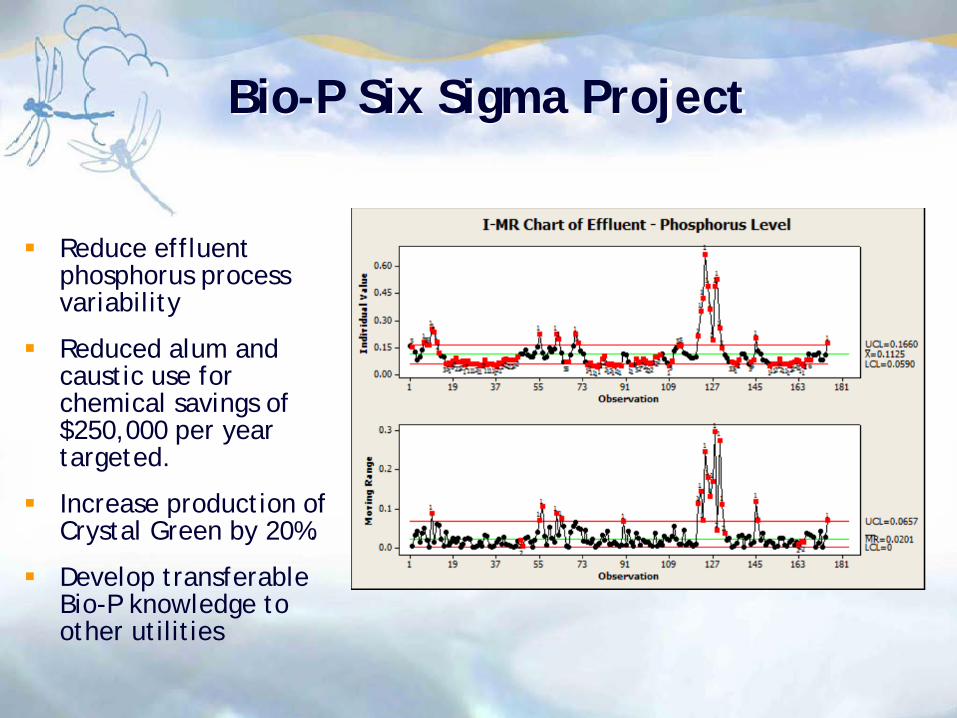
Bio-P Six Sigma Project
Reduce effluent phosphorus process variability
Reduced alum and caustic use for chemical savings of $250,000 per year targeted.
Increase production of Crystal Green by 20%.
Develop transferable Bio-P knowledge to other utilities


Honoring our Past…Charting the Future
Celebrating 40 Years of Clean Water