lgat 2019 community satisfaction survey
TRANSCRIPT
www.lgat.tas.gov.au
LGAT 2019 COMMUNITY SATISFACTION SURVEY
Summary for Decision Makers
21 May 2019
Contact: Dion Lester
Email: [email protected]
Phone: 03 6146 3740
LGAT Submission 21 May 2019, 2
Table of Contents
Introduction ........................................................................................................................................................... 3
Satisfaction with Council’s Overall Performance .................................................................................................... 5
Governance and Leadership................................................................................................................................... 6
Importance of and Satisfaction with Council Services ............................................................................................ 7
Regular garbage collection services .......................................................................................................................... 9
Drains, stormwater maintenance, and repairs .......................................................................................................... 9
The maintenance and cleaning of public areas ......................................................................................................... 9
Emergency and disaster management and recovery................................................................................................. 9
Provision and maintenance of footpaths/pedestrian areas .................................................................................... 10
Regular recycling and green waste recycling services ............................................................................................. 10
Provision and maintenance of public toilets ............................................................................................................ 10
Provision and maintenance of parks, gardens, and playgrounds ............................................................................ 10
Environmental protection ........................................................................................................................................ 11
Provision and maintenance of local roads ............................................................................................................... 11
Customer Service ................................................................................................................................................. 11
Current Issues for Council .................................................................................................................................... 12
Population Growth .............................................................................................................................................. 12
Housing in the Municipality ................................................................................................................................. 12
Safety in Public Areas .......................................................................................................................................... 13
Image of Local Government ................................................................................................................................. 13
Appendix A: Breakdown by Region and Type of Council ...................................................................................... 15
Appendix B: Average Satisfaction with and Importance of Council Services ........................................................ 16
LGAT Submission 21 May 2019, 3
Introduction
Metropolis Research was commissioned by LGAT to conduct primary research of 1,200 residents drawn proportionally from across the state to explore community satisfaction with the performance of local government. This research builds on satisfaction research previously conducted by LGAT and has been conducted using the same methodology as has been employed in previous years. Surveys were conducted as telephone interviews of randomly selected residents across Tasmania during the early months of 2019. The interviews lasted for a duration of roughly twenty minutes and were conducted by trained Metropolis Research staff. The purpose of the interviews was to measure community satisfaction with council’s overall performance, as well as with a range of council provided services and facilities. Satisfaction scores have been categorised accordingly:
• Excellent – scores of 7.75;
• Very Good – scores of 7.25 to less than 7.75;
• Good – scores of 6.5 to less than 7.25;
• Solid – scores of 6 to less than 6.5;
• Poor – scores of 5.5 to less than 6;
• Very Poor – scores of 5 to less than 5.5; and
• Extremely Poor – scores of less than 5.
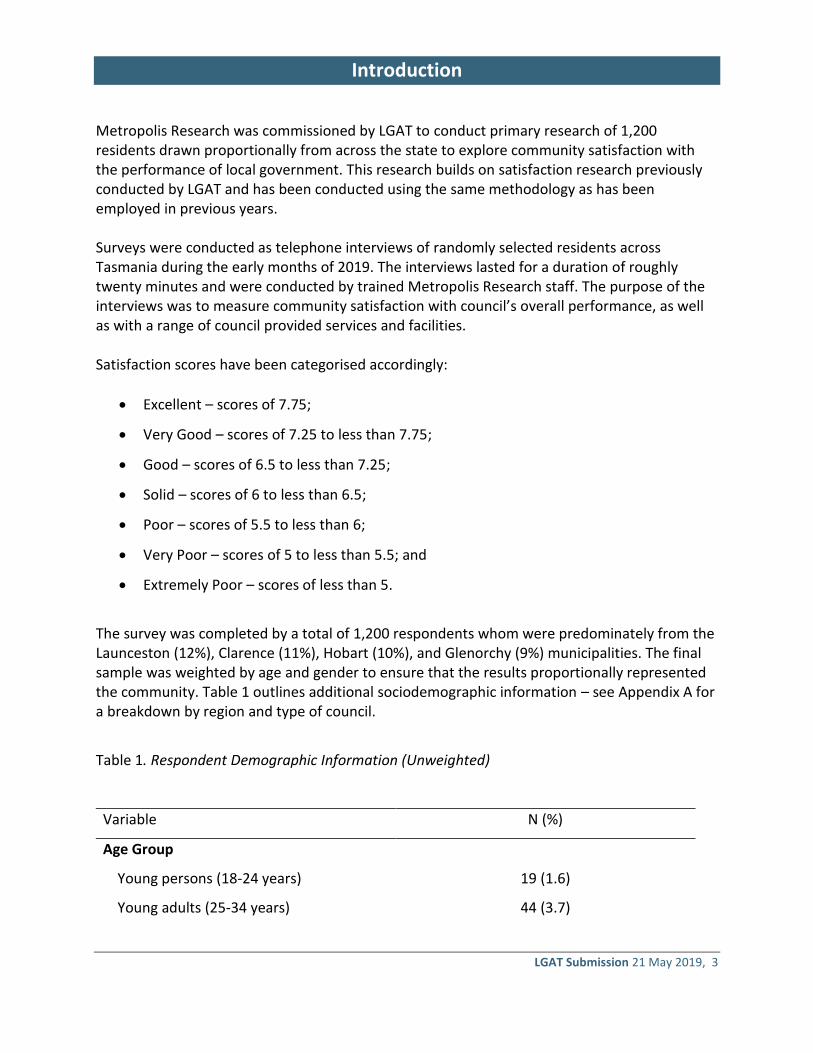
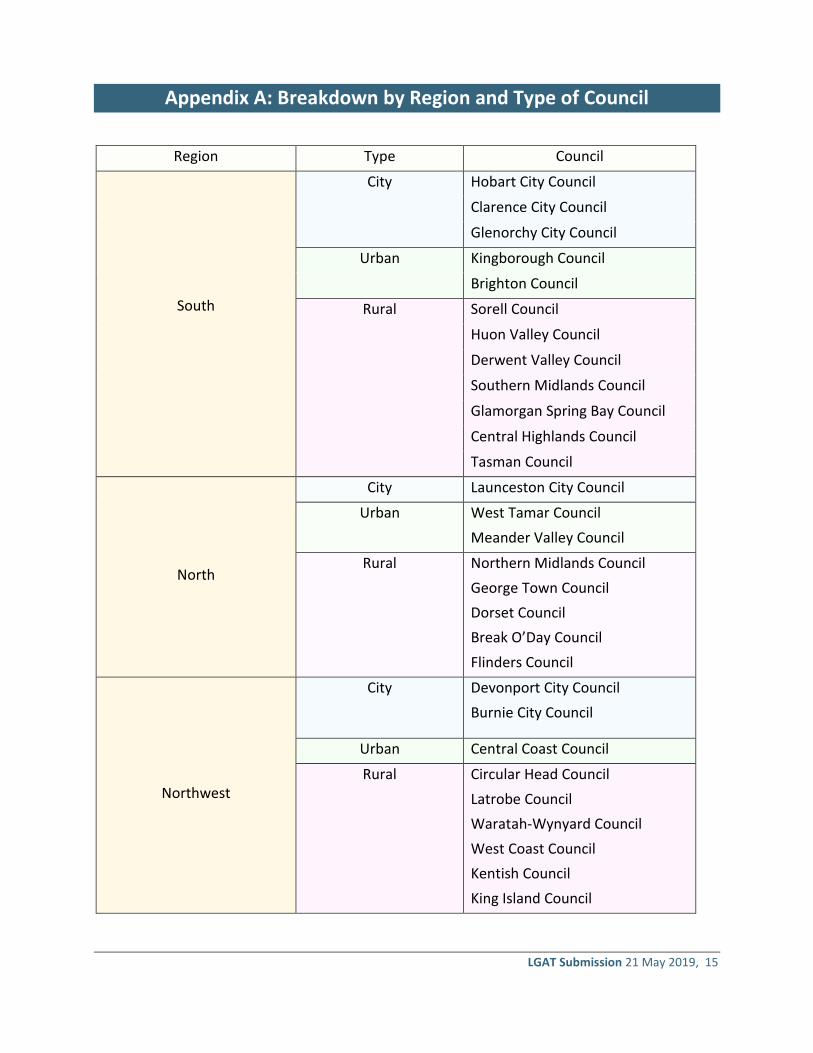
The survey was completed by a total of 1,200 respondents whom were predominately from the Launceston (12%), Clarence (11%), Hobart (10%), and Glenorchy (9%) municipalities. The final sample was weighted by age and gender to ensure that the results proportionally represented the community. Table 1 outlines additional sociodemographic information – see Appendix A for a breakdown by region and type of council.
Table 1. Respondent Demographic Information (Unweighted)
Variable N (%)
Age Group
Young persons (18-24 years) 19 (1.6)
Young adults (25-34 years) 44 (3.7)
LGAT Submission 21 May 2019, 4
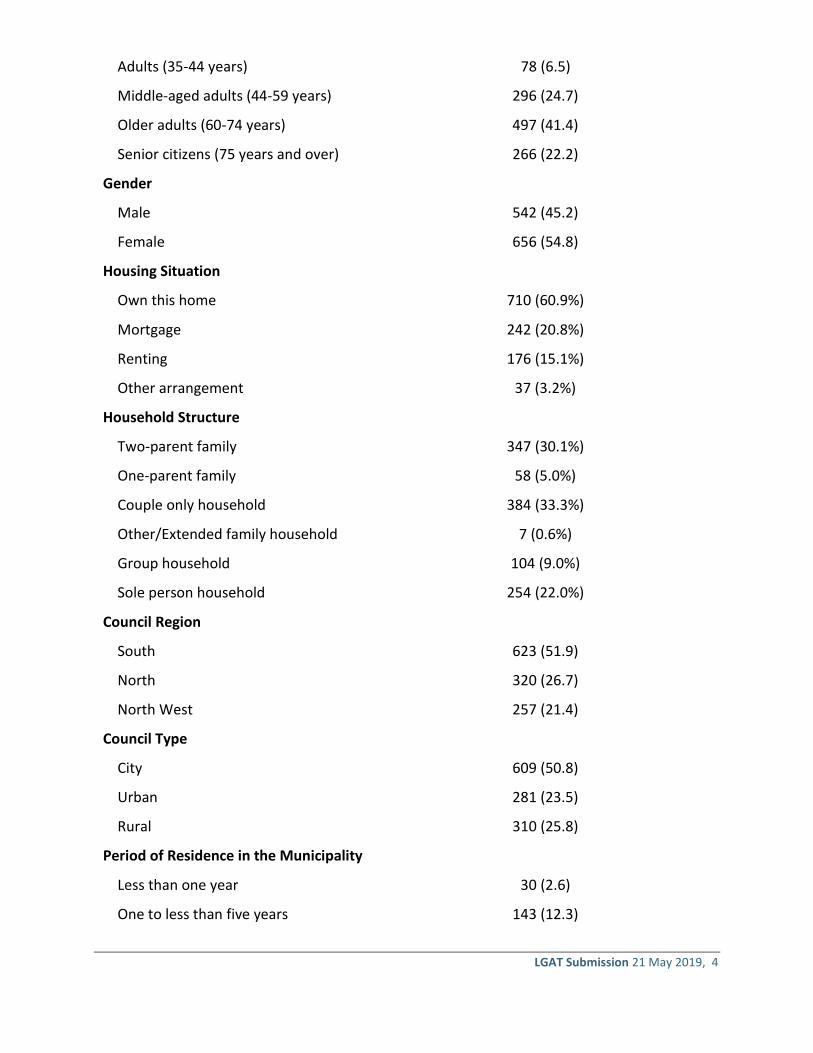
Adults (35-44 years) 78 (6.5)
Middle-aged adults (44-59 years) 296 (24.7)
Older adults (60-74 years) 497 (41.4)
Senior citizens (75 years and over) 266 (22.2)
Gender
Male 542 (45.2)
Female 656 (54.8)
Housing Situation
Own this home 710 (60.9%)
Mortgage 242 (20.8%)
Renting 176 (15.1%)
Other arrangement 37 (3.2%)
Household Structure
Two-parent family 347 (30.1%)
One-parent family 58 (5.0%)
Couple only household 384 (33.3%)
Other/Extended family household 7 (0.6%)
Group household 104 (9.0%)
Sole person household 254 (22.0%)
Council Region
South 623 (51.9)
North 320 (26.7)
North West 257 (21.4)
Council Type
City 609 (50.8)
Urban 281 (23.5)
Rural 310 (25.8)
Period of Residence in the Municipality
Less than one year 30 (2.6)
One to less than five years 143 (12.3)
LGAT Submission 21 May 2019, 5
Five to less than ten years 117 (10.0)
Ten years or more 876 (75.1)
Satisfaction with Council’s Overall Performance
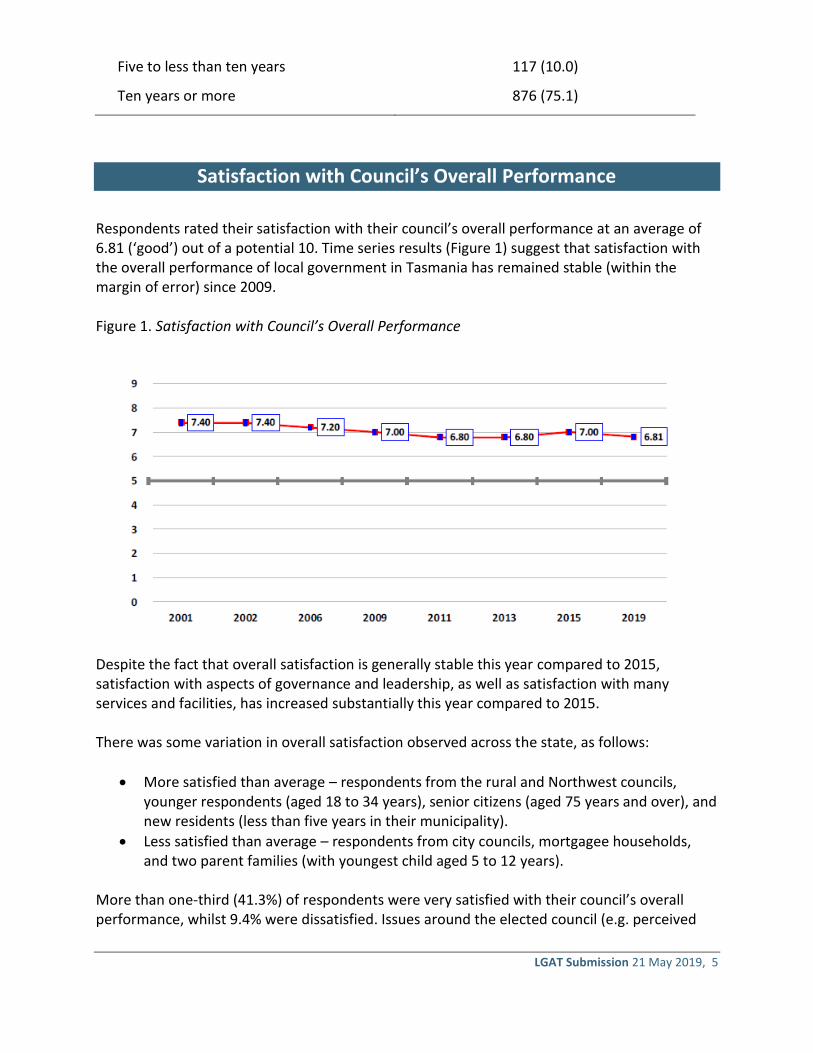
Respondents rated their satisfaction with their council’s overall performance at an average of 6.81 (‘good’) out of a potential 10. Time series results (Figure 1) suggest that satisfaction with the overall performance of local government in Tasmania has remained stable (within the margin of error) since 2009. Figure 1. Satisfaction with Council’s Overall Performance
Despite the fact that overall satisfaction is generally stable this year compared to 2015, satisfaction with aspects of governance and leadership, as well as satisfaction with many services and facilities, has increased substantially this year compared to 2015. There was some variation in overall satisfaction observed across the state, as follows:
• More satisfied than average – respondents from the rural and Northwest councils, younger respondents (aged 18 to 34 years), senior citizens (aged 75 years and over), and new residents (less than five years in their municipality).
• Less satisfied than average – respondents from city councils, mortgagee households, and two parent families (with youngest child aged 5 to 12 years).
More than one-third (41.3%) of respondents were very satisfied with their council’s overall performance, whilst 9.4% were dissatisfied. Issues around the elected council (e.g. perceived
LGAT Submission 21 May 2019, 6
infighting, a lack of transparency and focus on community needs) were most commonly reported by respondents as reasons for dissatisfaction. These results are thought to reflect a focus by many respondents on council as being the individuals on the elected council, sometimes in a very personal and engaged manner, rather than the services provided by the council. This may be due to the relatively small size of many Tasmanian municipalities as well as the greater proportion of rural and semi-rural municipalities, where the community can often have a greater engagement with their elected representatives. The most common thing respondents nominated as the best thing about their local council related to their council being responsive, proactive, engaged, accessible, and consultative (20.0%). Other aspects that were nominated include cleanliness/maintenance of the local area (5.7%), parks, gardens and open spaces (3.0%), library services (1.3%), communication (1.3%), and efficient, reliable or good services (1.2%). Aspects most commonly raised as the most important thing the local council could do to improve its performance were again focused on improvements to the responsive, proactive, engaged, accessible, and consultative nature of the council (10.8%), as well as improvements to the council’s governance, performance, accountability, and reputation (6.1%). Other improvements identified by respondents include road maintenance and repairs (4.8%), communication (4.3%), planning, development and housing (3.3%), and rates (2.5%). Rural council respondents were the most likely to identify responsive, proactive, engaged, accessible, and consultative aspects as the best thing about their local council, and were the least likely to identify these aspects as the most important thing that council could do to improve its performance. The opposite is true in relation to respondents from city councils.
Governance and Leadership
Respondents were asked to rate their satisfaction with five aspects of governance and leadership (Figure 2):
1. Community consultation and engagement;
2. Representation, lobbying, and advocacy;
3. Responsiveness to local community needs;
4. Making decisions in the interests of the community; and
5. Maintaining trust and confidence of local community.
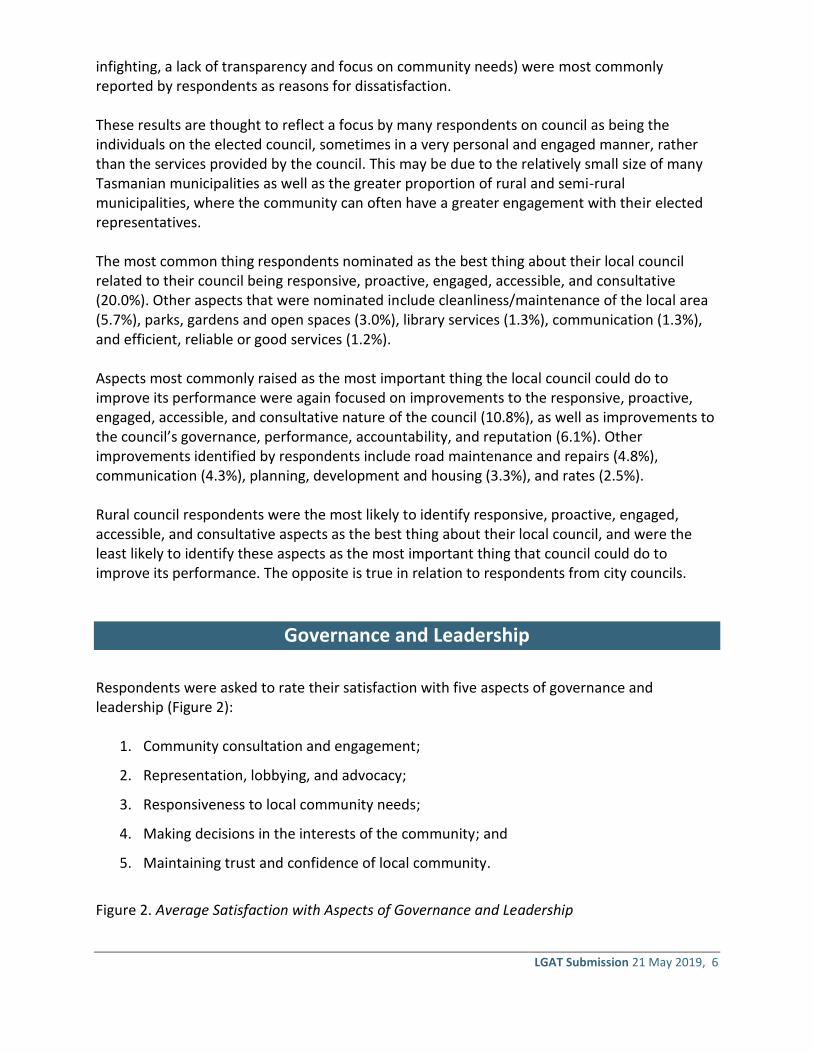
Figure 2. Average Satisfaction with Aspects of Governance and Leadership
LGAT Submission 21 May 2019, 7
The average satisfaction with all five aspects of governance and leadership was 6.56 (‘good’) out of a potential ten. More than forty percent of respondents were very satisfied with each of the five aspects, whilst a little less than one-sixth of respondents were dissatisfied. Respondents from the North West were significantly more satisfied with each of the five aspects than the state average. Only two of these five aspects of governance and leadership were included in the previous research, however both have significantly increased between 2015 and 2019.
Importance of and Satisfaction with Council Services
Respondents were asked to rate the importance to the community, as well as their personal satisfaction with, twenty-three council services and facilities. These services and facilities have been broadly categorised into eight groups, and are as follows:
1. Transport services;
2. Community support services;
3. Infrastructure;
4. Waste, recycling, and cleaning;
5. Communications;
6. Recreation, arts and culture, and open spaces;
7. Economy, environment, and emergency management; and
8. Planning and building.
LGAT Submission 21 May 2019, 8
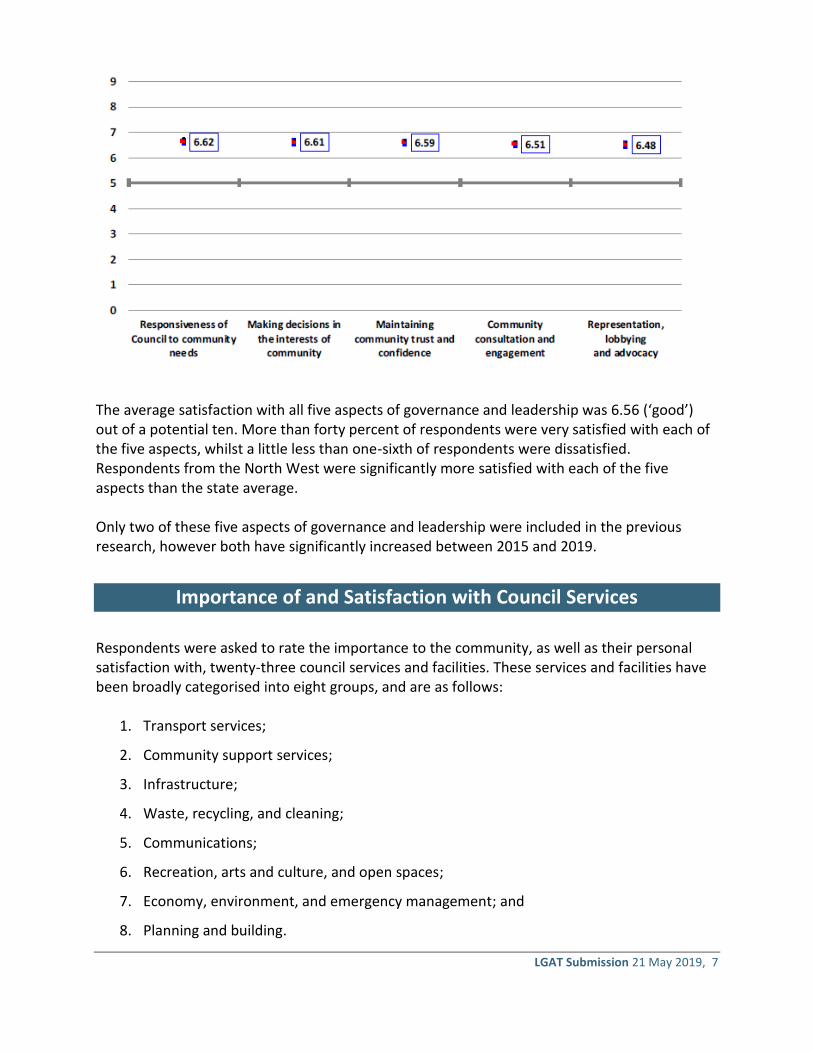
Figure 3 provides a cross-tabulation of the average importance of each of the twenty-three included council services and facilities against the average satisfaction with each service and facility. The large grey cross-hairs represent the average importance (8.87) and the average satisfaction (7.22) across all service areas. Figure 3. Importance and Satisfaction Cross-Tabulation
Services located in the top right-hand quadrant are more important than average and have obtained higher than average satisfaction. Services in the lower right-hand quadrant are those that are more important than average, but with which respondents were less satisfied than average. This quadrant represents the services and facilities of most concern (e.g. local traffic management, local roads, and planning for what buildings are developed where). Services with lower than average importance are typically services which are considered less critical or are used by only a subset of the community (e.g. arts and culture). Services with lower than average satisfaction may be a result, at least in part, of the lower importance respondents place on these services. See Appendix B for a detailed account of the council services’ results.
LGAT Submission 21 May 2019, 9
A summary of the ten most important services are presented below:
Regular garbage collection services
The average importance of regular garbage collection services was 9.50 out of a potential ten. This score ranks the service as the most important service of the 23 included in the survey. There was some variation in this result observed across the state, with respondents from urban councils rating importance measurably lower than the state average. The average satisfaction with regular garbage collection services across Tasmania was 8.15 (“excellent”). This score ranks the service 1st of the 23 services and facilities included in the survey in terms of satisfaction.
Drains, stormwater maintenance, and repairs
The average importance of drains, stormwater maintenance, and repairs was 9.22 out of a potential ten. This ranks the service 2nd of the 23 services and facilities included in the survey in terms of importance. The average satisfaction with drains, stormwater maintenance, and repairs across Tasmania was 6.99 (“good”). This ranks the service 15th of the 23 services and facilities included in the survey in terms of satisfaction.
The maintenance and cleaning of public areas
The average importance of the maintenance and cleaning of public areas was 9.20 out of a potential ten. This ranks the service 3rd of the 23 services and facilities included in the survey in terms of importance. The average satisfaction with the maintenance and cleaning of public areas across Tasmania was 7.30 (“very good”). This ranks the service equal 11th of the 23 services and facilities included in the survey in terms of satisfaction.
Emergency and disaster management and recovery
The average importance of emergency and disaster management and recovery was 9.18 out of a potential ten. This ranks the service 4th of the 23 services and facilities included in the survey in terms of importance.
LGAT Submission 21 May 2019, 10
The average satisfaction with emergency and disaster management and recovery across Tasmania was 7.57 (“very good”). This ranks the service 8th of the 23 services and facilities included in the survey in terms of satisfaction.
Provision and maintenance of footpaths/pedestrian areas
The average importance of the provision and maintenance of footpaths/pedestrian areas was 9.17 out of a potential ten. This ranks the service equal 5th of the 23 services and facilities included in the survey in terms of importance. The average satisfaction with the provision and maintenance of footpaths/pedestrian areas across Tasmania was 7.23 (“good”). This ranks the service 12th of the 23 services and facilities included in the survey in terms of satisfaction.
Regular recycling and green waste recycling services
The average importance of regular recycling/green waste recycling services was 9.17 out of a potential ten. This ranks the service equal 5th of the 23 services and facilities included in the survey in terms of importance. There was some variation in this result observed across the state, with respondents from the North rating importance measurably lower than the state average. The average satisfaction with regular recycling/green waste recycling services across Tasmania was 7.83 (“excellent”). This ranks the service equal 4th of the 23 services and facilities included in the survey in terms of satisfaction. There was some variation in this result observed across the state, with respondents from rural councils rating satisfaction measurably lower than the state average.
Provision and maintenance of public toilets
The average importance of the provision and maintenance of public toilets was 9.16 out of a potential ten. This ranks the service 7th of the 23 services and facilities included in the survey in terms of importance. The average satisfaction with the provision and maintenance of public toilets across Tasmania was 6.86 (“good”). This ranks the service 18th of the 23 services and facilities included in the survey in terms of satisfaction. There was some variation in this result observed across the state, with respondents from rural councils rating satisfaction measurably higher than the state average.
Provision and maintenance of parks, gardens, and playgrounds
LGAT Submission 21 May 2019, 11
The average importance of the provision and maintenance of parks, gardens and playgrounds was 9.15 out of a potential ten. This ranks the service 8th of the 23 services and facilities included in the survey in terms of importance. There was some variation in this result observed across the state, with respondents from the North West region rating importance measurably higher than the state average. The average satisfaction with the provision and maintenance of parks, gardens and playgrounds across Tasmania was 7.83 (“excellent”). This ranks the service equal 4th of the 23 services and facilities included in the survey in terms of satisfaction.
Environmental protection
The average importance of environmental protection was 9.10 out of a potential ten. This ranks the service 9th of the 23 services and facilities included in the survey in terms of importance. There was some variation in this result observed across the state, with respondents from the North West rating importance measurably higher than average. The average satisfaction with environmental protection across Tasmania was 7.19 (“good”). This ranks the service 13th of the 23 services and facilities included in the survey in terms of satisfaction.
Provision and maintenance of local roads
The average importance of the provision and maintenance of local roads was 9.05 out of a potential ten. This ranks the service 10th of the 23 services and facilities included in the survey in terms of importance. The average satisfaction with the provision and maintenance of local roads across Tasmania was 6.49 (“solid”). This ranks the service 21st of the 23 services and facilities included in the survey in terms of satisfaction.
Customer Service
A little more than one-fifth (21.8%) of respondents reported that they had contacted their council in the last twelve months. Respondents from the urban, southern and city councils were somewhat more likely to have contacted their local council in the last twelve months than respondents from rural and North West councils. The two most common methods by which respondents last contacted their local council was via telephone (49.6%) and visits in person (37.6%). Only ten percent (10.5%) of respondents contacted their council via email, the website, or social media.
LGAT Submission 21 May 2019, 12
Respondents contacted their local council for a wide range of issues, which reflect the diversity of services and facilities provided by local government. The most common reasons for contacting council in the last twelve months were enquiries regarding rates (12.2%), animal management issues (9.8%), parking issues (6.9%), and planning related issues (6.6%). The results suggest that respondents were more satisfied with both the courtesy, attitude, and professionalism of staff and the provision of information, than they were with the experience overall. This is thought to reflect the fact that other aspects such as speed of service and the final outcome of the interaction can influence overall satisfaction with the experience.
Current Issues for Council
Road maintenance and repairs (13.8%) and traffic management (10.5%) were the two most commonly nominated issues to address in the local municipality. The respondents who did raise these issues were, on average, significantly less satisfied with their local council’s overall performance than the state-wide average. This result strongly suggests that road and traffic issues are important for some in the community, and that for these respondents, it is a significant influence on their overall satisfaction with local government.
Population Growth
On average, respondents across Tasmania rated satisfaction with the change in population in their municipality at 6.80 (“good”) out of ten, whilst their satisfaction with state and local government planning for population change was rated measurably lower at 6.16 (“solid”). Almost half (45.1%) of the respondents were very satisfied with the change in population in their municipality in the last four years, and one-third (33.4%) were very satisfied with state and local government planning for population change. There was some variation in this result observed across the state in that southern and city council respondents were almost twice as likely to be dissatisfied with planning for population change. These results suggest that the community is less concerned with the change in population, and more concerned with how the change in population is managed, particularly in relation to the provision of services and the development of appropriate infrastructure (e.g. roads and public transport, community and health services).
Housing in the Municipality
LGAT Submission 21 May 2019, 13
Satisfaction with the availability of housing that meets the needs of the community (5.08) and the affordability of housing (5.00) were both rated at very poor levels. This is a very low result and well less than any other area investigated as part of this or past community satisfaction surveys. In addition, less than one-quarter of respondents were very satisfied with these two aspects of housing, whilst more than forty percent were dissatisfied, particularly in the city and southern region councils.
Safety in Public Areas
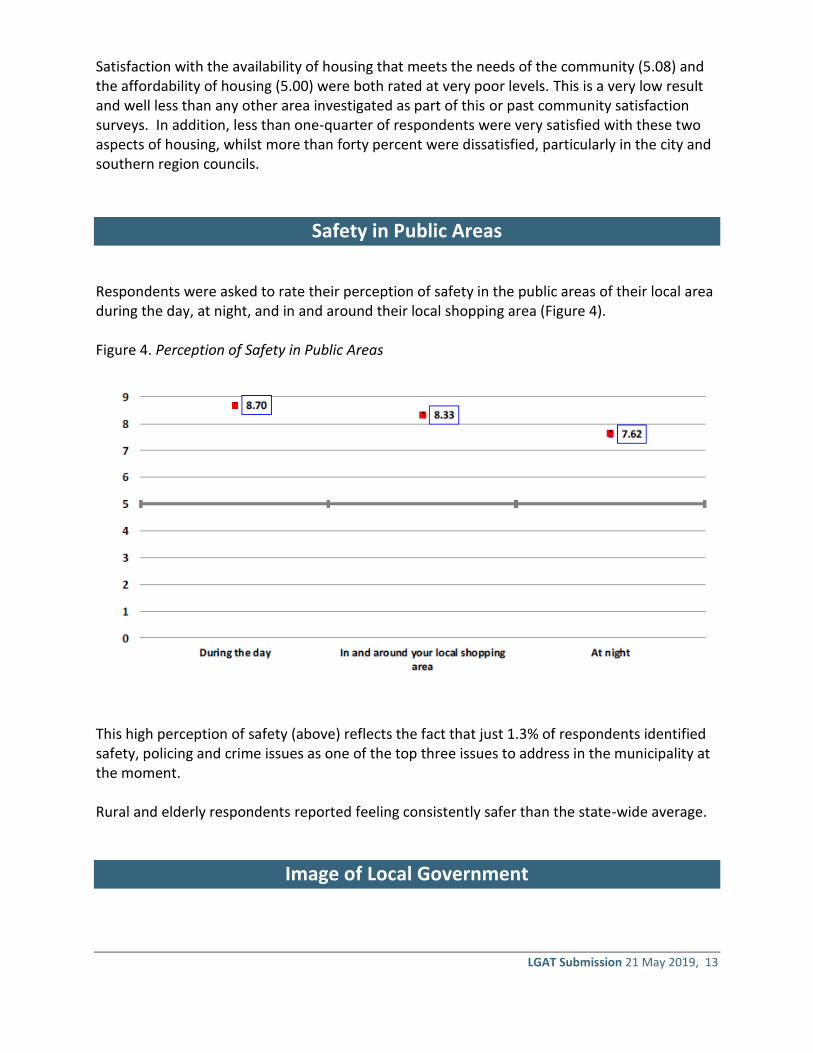
Respondents were asked to rate their perception of safety in the public areas of their local area during the day, at night, and in and around their local shopping area (Figure 4). Figure 4. Perception of Safety in Public Areas
This high perception of safety (above) reflects the fact that just 1.3% of respondents identified safety, policing and crime issues as one of the top three issues to address in the municipality at the moment. Rural and elderly respondents reported feeling consistently safer than the state-wide average.
Image of Local Government

LGAT Submission 21 May 2019, 14
The image of local government was rated at 6.21 (“moderate”) out of a potential ten. Consistent with the increasing satisfaction with the council’s governance and leadership performance in recent years, more respondents considered that the image of local government had improved in the last four years (17.3%), than considered that it had deteriorated (13.7%) The three most common reasons why respondents’ view of the image of local government had improved in the last four years were:
• Good governance and leadership (N = 31)
• Council as responsive, proactive, engaged, accessible, consultative (N = 24)
• Perception that council is doing a good job (N = 22)
The three most common reasons why respondents’ view of the image of local government had deteriorated in the last four years were:
• Poor governance and leadership (N = 89)
• Perception that council is not doing a good job (N = 26)
• Failure to be responsive, proactive, engaged, accessible, consultative (N = 14)
Respondents from all three regions and types of council rated the image of local government across Tasmania significantly lower than satisfaction with their individual council. This result is most prominent in relation to respondents from the city councils, where respondents’ average satisfaction with their local council was 21.7% higher than their average image of local government more broadly. The statewide average for this difference is 11.4%.
LGAT Submission 21 May 2019, 15
Appendix A: Breakdown by Region and Type of Council
Region Type Council
South
City Hobart City Council
Clarence City Council
Glenorchy City Council
Urban Kingborough Council
Brighton Council
Rural Sorell Council
Huon Valley Council
Derwent Valley Council
Southern Midlands Council
Glamorgan Spring Bay Council
Central Highlands Council
Tasman Council
North
City Launceston City Council
Urban West Tamar Council
Meander Valley Council
Rural Northern Midlands Council
George Town Council
Dorset Council
Break O’Day Council
Flinders Council
Northwest
City Devonport City Council
Burnie City Council
Urban Central Coast Council
Rural Circular Head Council
Latrobe Council
Waratah-Wynyard Council
West Coast Council
Kentish Council
King Island Council
www.lgat.tas.gov.au
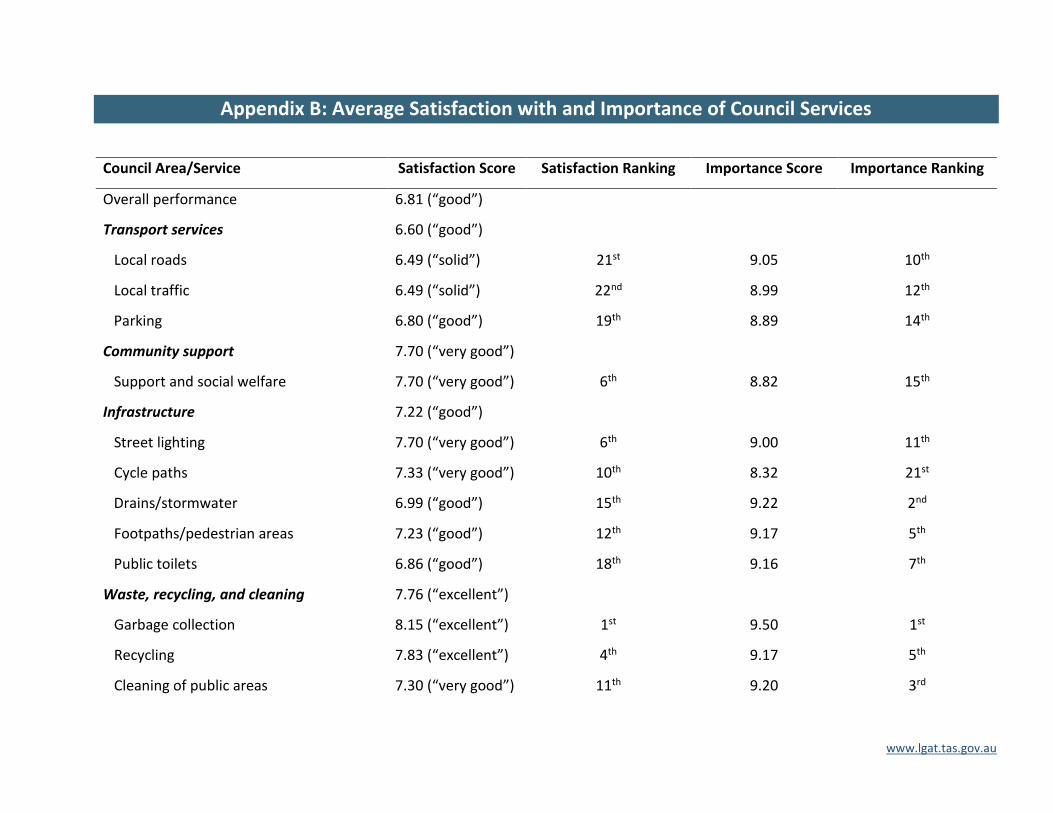
Appendix B: Average Satisfaction with and Importance of Council Services
Council Area/Service Satisfaction Score Satisfaction Ranking Importance Score Importance Ranking
Overall performance 6.81 (“good”)
Transport services 6.60 (“good”)
Local roads 6.49 (“solid”) 21st 9.05 10th
Local traffic 6.49 (“solid”) 22nd 8.99 12th
Parking 6.80 (“good”) 19th 8.89 14th
Community support 7.70 (“very good”)
Support and social welfare 7.70 (“very good”) 6th 8.82 15th
Infrastructure 7.22 (“good”)
Street lighting 7.70 (“very good”) 6th 9.00 11th
Cycle paths 7.33 (“very good”) 10th 8.32 21st
Drains/stormwater 6.99 (“good”) 15th 9.22 2nd
Footpaths/pedestrian areas 7.23 (“good”) 12th 9.17 5th
Public toilets 6.86 (“good”) 18th 9.16 7th
Waste, recycling, and cleaning 7.76 (“excellent”)
Garbage collection 8.15 (“excellent”) 1st 9.50 1st
Recycling 7.83 (“excellent”) 4th 9.17 5th
Cleaning of public areas 7.30 (“very good”) 11th 9.20 3rd
LGAT Submission 21 May 2019, 17
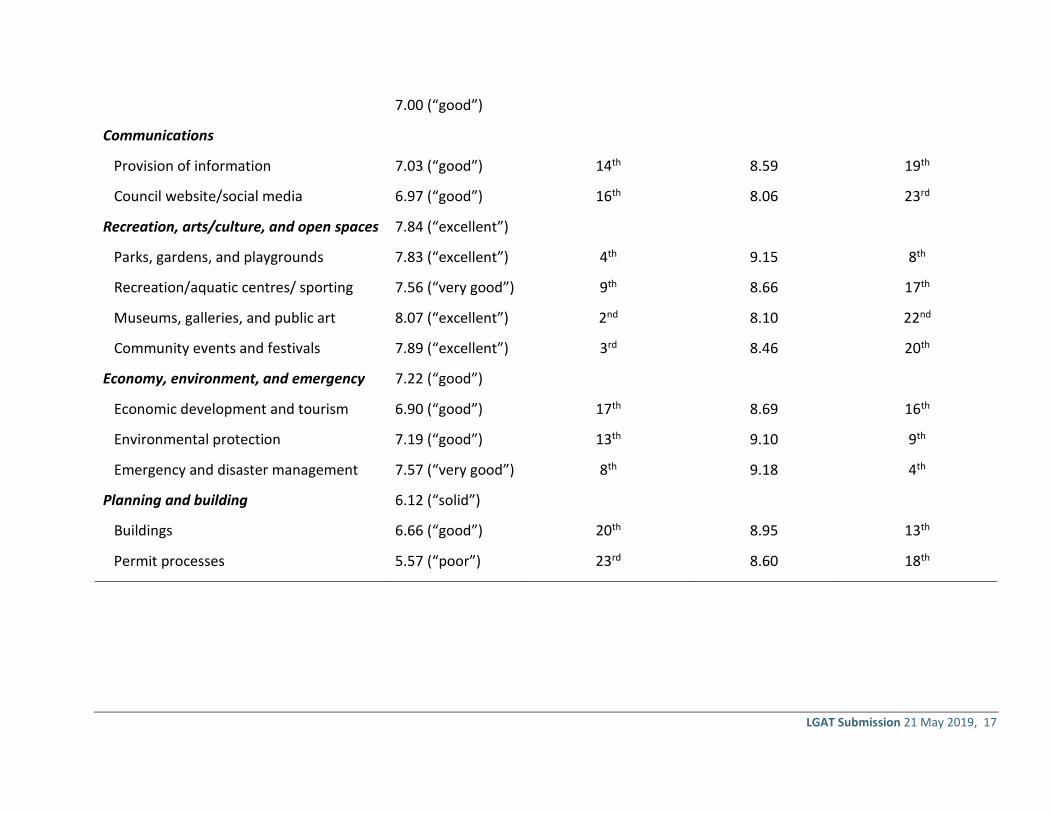
Communications
7.00 (“good”)
Provision of information 7.03 (“good”) 14th 8.59 19th
Council website/social media 6.97 (“good”) 16th 8.06 23rd
Recreation, arts/culture, and open spaces 7.84 (“excellent”)
Parks, gardens, and playgrounds 7.83 (“excellent”) 4th 9.15 8th
Recreation/aquatic centres/ sporting 7.56 (“very good”) 9th 8.66 17th
Museums, galleries, and public art 8.07 (“excellent”) 2nd 8.10 22nd
Community events and festivals 7.89 (“excellent”) 3rd 8.46 20th
Economy, environment, and emergency 7.22 (“good”)
Economic development and tourism 6.90 (“good”) 17th 8.69 16th
Environmental protection 7.19 (“good”) 13th 9.10 9th
Emergency and disaster management 7.57 (“very good”) 8th 9.18 4th
Planning and building 6.12 (“solid”)
Buildings 6.66 (“good”) 20th 8.95 13th
Permit processes 5.57 (“poor”) 23rd 8.60 18th