liberty holdings limited annual financial results 2011 final dividend ... for associated project...
TRANSCRIPT

Annual financialresults
Liberty Holdings Limited
For the year ended 31 December
2011

Financial performance indicators 1
Commentary on results 2
Accounting policies 6
Definitions 6
Statement of financial position 7
Statement of comprehensive income 8
Headline earnings and earnings
per share 9
Condensed statement of changes
in shareholders’ funds 10
Condensed statement of cash flows 10
Condensed segment information 11
Group equity value report 13
Long-term insurance new business 18
Assets under management 19
Long-term insurance net cash flows 20
Short-term insurance net cash flows 21
Asset management net cash flows –
STANLIB and Liberty Africa 21
Capital commitments 22
Retirement benefit obligations 22
Related parties 23
Contents
BEE normalised headline earnings
R2 663 million
long-term insurance cash inflows
R4,2 billion
BEE normalised group equity value
up 10%
return on group equity value
15,3%
long-term insurance indexed new business
up 19%
STANLIB headline earnings
up 15%
value of long-term insurance new business
up 57%
Liberty Group Limited CAR cover
2,9 times
Highlights

Liberty Holdings Limited Annual Results Presentation for the year ended 31 December 2011 1
Financial performance indicatorsfor the year ended 31 December 2011
2011 % change 2010
Liberty Holdings LimitedEarningsBasic earnings per share (cents) 997,6 8,6 918,6
BEE normalised headline earnings per share (cents) 930,8 2,6 907,6
Adjusted core operating earnings 2 636 15,5 2 283
BEE normalised return on equity (%) 19,6 (7,5) 21,2
Group equity valueBEE normalised group equity value per share (R) 100,15 10,0 91,01
BEE normalised return on group equity value (%) 15,3 14,2 13,4
Distributions per share (cents) 259(1) n/a(1) 455
Interim capital reduction 182 11,0 164
Part final dividend (2010: full final dividend) 77(1) n/a(1) 291
Total assets under management (Rbn) 455 2,9 442
Long-term insurance operationsIndexed new business (excluding contractual increases) (Rm) 5 152 19,1 4 327
New business margin (%) 1,4 16,7 1,2
Net customer cash inflows/(outflows) (Rm) 4 230 >100 (287)
Capital adequacy cover of Liberty Group Limited (times covered) 2,89 8,2 2,67
Asset management – STANLIB and Liberty AfricaAssets under management (Rbn) 380 (1,0) 384
Net cash (outflows)/inflows including money market (Rm) (91) (>100) 22 179
Retail and institutional net cash inflows excluding money market (Rm) 13 598 >100 1 323
Money market net cash (outflows)/inflows (Rm) (13 689) (>100) 20 856
(1) Comparison to 2010 is not applicable as the full final distribution is not yet determined.
Preparation and supervision:
This announcement on Liberty Holdings Limited’s annual results for the year ended 31 December 2011 has been prepared and supervised by JC Hubbard (Group Chief Financial Officer) BCom CA(SA) and CG Troskie (Group Financial Director) BCom (Hons) CA(SA).

Liberty Holdings Limited Annual Results Presentation for the year ended 31 December 2011 2
Commentary on resultsfor the year ended 31 December 2011
OverviewIn 2011 the group produced a return on equity of 20%, supported by strong operational earnings, offset by lower returns on available capital invested in the market. In addition, we delivered substantial improvement in persistency, sales and investment performance. A very pleasing aspect of this year’s results is the contribution to earnings achieved by management’s successful implementation of operational strategy in the core South African insurance and asset management businesses.
A key positive feature has been the resolution of the policyholder persistency issue in Retail SA and the substantial improvement in the value of in-force contracts. New long-term insurance business sales were very pleasing across all the operations with indexed new business up 19%. Long-term insurance client net cash flows were positive R4 billion, which is an excellent result considering the current consumer environment.
Our market leading balance sheet management capability continues to ensure shareholder exposures to asset/liability mismatching are well within risk parameters. Fund performance at STANLIB has continued to improve and we are proud of the 6 Raging Bull awards recently received. STANLIB headline earnings improved by 15% over 2010. Our property division produced another solid result and was widely acclaimed on the successful completion of various development projects, including the extension to the premier African Sandton City shopping complex. For a variety of reasons the Growth Initiatives have not performed as well as we would have liked but a number of legacy issues were resolved.
Investment markets extended their volatility largely due to the debt crisis in Europe. However, a strong final quarter local equity performance supported a gross return of 8,1% on the shareholder investment portfolio. This was, however, lower than the 11% achieved in 2010 and largely offset the increase in operational earnings. Group BEE normalised headline earnings ended at R2 663 million, 3% higher than 2010. This converts to a BEE normalised headline earnings per ordinary share of R9,31 (2010: R9,08). Through this result, combined with the effective risk management of the balance sheet, the group has enhanced its capital position with its main life licence entity, Liberty Group Limited, further strengthening its capital adequacy cover ratio. BEE normalised equity value has improved by 10% to more than R100 per share and return on group equity value was 15,3%, which is at the higher end of our stated target range.
Update on strategyOur focus remains on managing the core South African insurance operations within acceptable sustainable long-term assumption sets, whilst profitably capturing greater shares of both the existing and developing markets. The ability of the business to manage within board approved risk appetite limits continues to be enhanced and tightly monitored. The steps taken to improve asset management capability leveraging off the strong property, fixed income and money market franchises are starting to gain traction, with the objective being to capture a larger share of the retail and institutional fund flows. We remain committed to diversifying our earnings stream through achieving the business cases of the recent investments in Growth Initiatives.
We have made good progress towards readiness for the proposed new long-term insurance solvency regime (Solvency Assessment and Management (SAM)) and we have set aside a R165 million reserve for associated project costs. Preliminary assessments through participation in the first South African SAM quantitative impact study indicate that Liberty has a surplus capital position over expected future minimum requirements.
Business unit financial review
2011 % 2010Contributions to earnings by business unit Rm change Rm
South African long-term insuranceRetail SA 1 314 46,2 899Corporate 36 (65,0) 103LibFin 1 124 (22,1) 1 443Asset managementSTANLIB 414 14,7 361Liberty Properties 96 – 96Growth initiativesLiberty Africa 21 >100 10Liberty Health (65) (51,2) (43)Frank (47) (6,8) (44)Central overheads and sundry income (296) 2,3 (303)
Headline earnings 2 597 3,0 2 522BEE preference share adjustment 66 (12,0) 75
BEE normalised headline earnings 2 663 2,5 2 597

Liberty Holdings Limited Annual Results Presentation for the year ended 31 December 2011 3
South African long-term insuranceRetail SAHeadline earnings for the year were R1 314 million, up 46% compared to 2010, reflecting our considerable achievement in improving policyholder persistency. Besides the positive impact of persistency assumption changes, other assumption changes included the positive impact of an improved estimate of the illiquidity premium used in liability valuations, offset by strengthening mortality assumptions on certain annuity books and increased expense reserving to maintain the in-force book. The total impact of all assumption changes was a positive contribution to earnings of R292 million.
The implementation of a new value proposition for financial advisers, which recognises the important balance between persistency, book size and quality of new business has been well received and is producing the ideal balance of selling quality new business and enhancing the value of the existing client base. Various significant developments in the products and distribution area occurred, including the May and October 2011 launches of a revised set of risk products. In addition, Liberty was voted best risk product provider by the Financial Intermediaries Association of Southern Africa in May 2011.
Indexed new business sales (excluding contractual increases) of R4,4 billion have improved by 18% over 2010 (R3,7 billion) despite significantly lower emerging consumer market sales as a consequence of the remedial action taken to remove unprofitable business. Increases in our flagship investment products and the credit life sales under the bancassurance agreement with Standard Bank are particularly pleasing. The new business margin of 1,6% is a good improvement from the 1,3% achieved last year. Acquisition overhead cost efficiency remains a challenge and further improvements to margin through increased volume of quality sales and better cost efficiency are our top priorities.
Net cash flows into our Retail SA insurance operations were excellent at R4,8 billion supported by strong contributions from our sales of single premium investment products and good extensions of maturing policies.
Policy service costs remain well within actuarial assumptions. Certain retention and project capacity costs, which were previously excluded from the maintenance cost assumption, have now been fully capitalised as recurring costs as they are now integrated into operational processes.
CorporateThe past practice of selling employee retirement fund solutions to small and medium enterprises has unfortunately increasingly led to an inefficient business model after the recent introduction of substantial regulatory compliance requirements. Liberty Corporate is effectively in a process of transition, migrating its client base to more cost efficient umbrella funds whilst establishing a service capability to larger corporates and retirement funds.
Corporate headline earnings at R36 million have been impacted by an increase to the retirement fund administration project provision of R60 million. This was due to a scope increase of the project following the adopted strategy of converting small retirement schemes to more efficient umbrella structures. Normalising for the additional provision, earnings at R96 million are marginally lower than the R103 million in 2010. An 18% increase in indexed new business was achieved, including higher enhancement sales to existing umbrella clients.
The business unit still has negative net cash outflows of R661 million for the year, however, these are improved from the equivalent 2010 net outflow of R1 517 million.
LibFinOver the period under review, our low risk balanced shareholder investment portfolio returned 8,1% pre taxation in line with benchmark reflecting the investment return environment.
LibFin Markets continued to manage market risk exposures within a narrow range. Headline earnings of R155 million flowed mainly from improving credit margins on assets backing annuities and guaranteed capital bonds and included certain one off positive items. We continue to seek acceptable illiquidity premium assets using the advantage of our ability to hold longer term assets, with the key objectives of steadily increasing net earnings and improving the competitiveness of our policyholder investment product proposition.
In line with the capacity created by LibFin, several portfolios backing policyholder annuity and guaranteed capital investment products have been moved from STANLIB fund management to LibFin. LibFin now directly manages R25 billion of asset portfolios at 31 December 2011.
Asset management STANLIB Following a sustained period of inflows, STANLIB, as expected due to the increasing risk appetite of investors, experienced net outflows of R13 billion from its money market funds. However, higher margin retail inflows were strong at R10 billion. Total assets under management are R341 billion (2010: R355 billion).
The multi-specialist franchise operating model has now been implemented. The majority of previously underperforming funds under management are now reflecting significantly improved investment performance. STANLIB’s performance in the Alexander Forbes Global Best Investment View Survey for global balanced funds has placed STANLIB in the 1st quartile over 1 and 2 years and 2nd quartile over 3 years.

Liberty Holdings Limited Annual Results Presentation for the year ended 31 December 2011 4
Commentary on results (continued)for the year ended 31 December 2011
STANLIB’s 15% increase in headline earnings to R414 million (2010: R361 million) reflects higher performance fees and a higher weighting to higher margin retail average assets under management. STANLIB will continue to embed investment processes and disciplines to ensure short-term improvements are sustained over the longer term.
Liberty Properties Liberty Properties continues to return excellent investment performance on the policyholder property portfolio, as evidenced by 28 consecutive years of double digit returns.
Liberty Properties’ earnings after taxation of R96 million remained at 2010 levels with development capacity build costs offsetting the improved property portfolio management fees. Liberty Properties successfully completed extensions to the Sandton City complex, as well as the development of a third party property in Zambia. The focus in 2012 is to increase our third party development mandates in the key African market.
Growth initiativesLiberty AfricaThe purchase of a 57% interest in CfC Insurance Holdings Limited (CfC) for R199 million effective 1 April 2011, provides us with significant growth opportunities in the East African region. CfC, which is listed on the Nairobi Stock Exchange, is a leading Kenyan life, health and general insurance group. The deterioration of the Kenyan economic environment in the second half of 2011 has negatively impacted the nine month result, however the medium term prospects in this region remain encouraging.
Liberty Africa’s asset management operations continued to attract very good positive net cash inflows of R5,4 billion for the period (2010: R6,5 billion) bringing assets under management to R38,7 billion. Attributable headline earnings of R21 million are substantially up on 2010, reflecting the CfC contribution as well as a pleasing improvement in earnings from asset management.
Liberty HealthA number of one off costs associated with past operational issues have affected the earnings performance in 2011. Liberty Health has in past reporting periods experienced a loss of customer contracts within the information technology services area. However, the rate of loss has slowed and towards the end of the year a significant client returned, which resulted in an increase of 22 000 lives over the year. Sales of health risk products in the rest of Africa continue to grow, increasing our in-force book to 68 000 lives (December 2010: 33 000). Underwriting losses are being experienced on this book, however remedial action on pricing and risk management has been taken.
The new management team is now able to focus its efforts on sustainability and growth opportunities including achieving acceptable margins on our flagship medical expense risk products.
Direct Financial Services (incorporating Frank)The direct IT platform capability is now being leveraged to support a broader direct strategy, which will be housed under a Direct Financial Services business unit. Besides Frank, this initially includes supporting the transactional opportunity under the Standard Bank bancassurance agreement.
After commencing business in November 2010, Frank, which currently provides simple life cover products through an alternative direct distribution channel, has achieved pleasing brand presence, however, conversion of leads and persistency of business needs to be improved.
BancassuranceThe recently agreed revised terms of the commercial bancassurance joint venture relationship with Standard Bank, which broaden the available distribution channels, product sets and geographies are already starting to bear fruit. Sales on an indexed basis of insurance products from bancassurance channels were 19% higher than 2010. Earnings from credit life were R111 million (2010: R97 million) and STANLIB received net asset management fees of R357 million (2010: R333 million) related to assets acquired by Standard Bank distribution. The total embedded value of in-force contracts sold under the agreement, attributable to Liberty, has grown 11% to R1,1 billion.
Capital adequacy coverThe capital adequacy cover of Liberty Group Limited is strong at 2,89 times the statutory requirement (2010: 2,67 times). All the other group subsidiary life licences are well capitalised.
Part final dividend for the year ended 31 December 2011Due to the changes relating to dividend taxation, the board has decided to declare a part final dividend of 77 cents per ordinary share representing the equivalent value of available STC credits. The board intends to supplement this with a further distribution as soon as possible after 1 April 2012 and shareholders will be advised accordingly, in due course. These combined distributions, along with the previously declared interim capital reduction, will be in accordance with the stated dividend policy. The board will not be adjusting the level of the dividend for the changes in the dividend taxation.
The directors have approved a part final dividend of 77 cents per ordinary share.
Liberty Holdings Limited Annual Results Presentation for the year ended 31 December 2011 5
Commentary on results
The important dates pertaining to the part final dividend are as follows:
Last date to trade cum dividend on the JSE Thursday, 15 March 2012First trading day ex dividend on the JSE Friday, 16 March 2012Record date Friday, 23 March 2012Payment date Monday, 26 March 2012
Share certificates may not be de-materialised or re-materialised between Friday, 16 March 2012 and Friday, 23 March 2012, both days inclusive. Where applicable, in terms of instructions received by the company from certificated shareholders, the payment of the dividend will be made electronically to shareholders’ bank accounts on payment date. In the absence of specific mandates, cheques will be posted to shareholders. Shareholders who have de-materialised their shares will have their accounts with their CSDP or broker credited on Monday, 26 March 2012.
Events after the reporting periodThe South African Minister of Finance has announced as part of the Budget 2012 tax proposals that the effective capital gains tax rates will increase for all disposals of qualifying assets from 1 March 2012. The inclusion rate for individuals and special trusts will increase to 33,3% (previously 25%). In the context of a long-term insurer it means that the effective capital gains tax rate applicable to the individual policyholder fund will increase to 10% (previously 7,5%). The inclusion rate for other entities, which includes the company policyholder fund of a long-term insurer, will increase to 66,6% (previously 50%), raising the effective rate for companies to 18,6% (previously 14%).
The unrealised capital gains tax provision as at 31 December 2011 would have increased by R418 million to R1 669 million, had the group applied the new increased inclusion rates. This increase in taxation liability will largely be absorbed by the group’s policyholders in terms of the provisions of their respective policies and therefore the group’s liability to policyholders at 31 December 2011 would be reduced. The net exposure to shareholders is likely to be less than R100 million in both earnings and shareholders’ funds.
ProspectsThe significant operating improvements in our core insurance and asset management businesses position the group well to manage volatility in investment markets and the anticipated decline in consumer disposable income. The group has a good base off which to drive growth in its traditional markets while leveraging the investments it has made in new markets.
Bruce Hemphill Saki MacozomaChief Executive Chairman
1 March 2012
Sponsor
These results are available at www.liberty.co.za
Liberty Holdings Limited
Incorporated in the Republic of South Africa (Registration number: 1968/002095/06)JSE code: LBHISIN code: ZAE0000127148Telephone +27 11 408 3911
Transfer Secretaries
Computershare Investor Services (Pty) Limited(Registration number: 2004/003647/07)Ground Floor, 70 Marshall Street, Johannesburg 2001PO Box 61051, Marshalltown 2107Telephone +27 11 370 5000

Liberty Holdings Limited Annual Results Presentation for the year ended 31 December 2011 6
Accounting policies
Definitions
The 2011 consolidated financial statements have been prepared in accordance with and containing information required by International Financial Reporting Standards (IFRS) including full compliance with IAS 34 Interim Financial Reporting as well as the AC 500 standards as issued by the Accounting Practices Board or its successor. They are also in compliance with the Listings Requirements of the JSE Limited and the South African Companies Act No. 71 of 2008.
The accounting policies adopted in the preparation of the consolidated financial statements are in terms of IFRS and are consistent with those adopted in the previous year except for the following:
The group has adopted for the first time, effective 1 January 2011, an accounting policy for cash flow hedge accounting. Cash flow hedges are hedges of highly probable future cash flows attributable to a recognised asset or liability or a forecast transaction. The group applies cash flow hedge accounting to match the profit or loss emergence of the hedge instrument and hedged item in respect of changes in future cash flows resulting from the conversion to rand of contracted foreign currency denominated cash flows associated with financial instrument assets.
Several other amendments to IFRS standards or interpretations were made by the International Accounting Standards Board, which are effective for the period under review. These amendments or interpretations are either not significant or not applicable to the 2011 results of the group.
Audit opinion The company’s auditors, PricewaterhouseCoopers Inc., have issued their opinion on the consolidated financial statements and the group equity value report for the year ended 31 December 2011. They have issued unmodified audit opinions. Copies of their audit reports are available for inspection at the company’s registered office.
BEE normalised: headline earnings per share, return on equity, group equity value per share and return on group equity valueThese measures reflect the economic reality of the Black Economic Empowerment (BEE) transaction as opposed to the required technical accounting treatment that reflects the BEE transaction as a share buy-back. Dividends received on the group’s BEE preference shares (which are recognised as an asset for this purpose) are included in income. Shares in issue relating to the transaction are reinstated.
Adjusted core operating earningsThis represents the group’s BEE normalised headline earnings adjusted for the expected long-term rate of return on the shareholder investment portfolio and excludes LibFin Markets portfolio performance.
Capital adequacy requirement (CAR)The capital adequacy requirement is the minimum amount by which the Financial Services Board requires an insurer’s assets to exceed its liabilities. The assets, liabilities and capital adequacy requirement must be calculated using a method which meets the Financial Services Board’s requirements. Capital adequacy cover refers to the amount of capital the insurer has as a multiple of the minimum requirement.
Health lives under administrationThis reflects the number of natural persons covered for medical risk insurance (either through medical aids or directly), for which Liberty Health provides administration services.
Long-term insurance operations – Indexed new businessThis is a measure of new business which is calculated as the sum of twelve months premiums on new recurring premium policies and one tenth of single premium sales.
Long-term insurance operations – New business marginThis is the value of new business as defined below, expressed as a percentage of the present value of future expected premiums at the point of sale.
Long-term insurance operations – Value of new businessThe present value, at point of sale, of the projected stream of after tax profits for new business issued, net of the cost of required capital. The present value is calculated using a risk adjusted discount rate.
FCTR: Foreign Currency Translation Reserve

Liberty Holdings Limited Annual Results Presentation for the year ended 31 December 2011 7
Statement of financial positionas at 31 December 2011
2011 2010
Audited Rm Rm
AssetsEquipment and owner-occupied properties under development 897 957Owner-occupied properties 1 598 1 513Investment properties 23 470 21 521Intangible assets 933 1 046Defined benefit pension fund employer surplus 199 202Deferred acquisition costs 403 364Interests in joint ventures 626 605Reinsurance assets 1 104 847
– long-term 902 847– short-term 202
Operating leases – accrued income 1 085 1 107Derivative assets 3 790 2 659Interests in associates – mutual funds 11 697 5 814Financial investments 197 959 192 317Deferred taxation 183 147Prepayments, insurance and other receivables 2 620 2 884Cash and cash equivalents 6 664 5 858
Total assets 253 228 237 841
LiabilitiesLong-term policyholder liabilities 208 565 197 878
Insurance contracts 145 558 138 873Investment contracts with discretionary participation features 3 447 2 634Financial liabilities under investment contracts 59 560 56 371
Short-term insurance liabilities 466Financial liabilities at amortised cost 2 195 2 143Third party financial liabilities arising on consolidation of mutual funds 11 164 11 000Employee benefits 1 082 830Deferred revenue 159 139Deferred taxation 2 819 2 437Provisions 371 172Operating leases – accrued expense 93 144Derivative liabilities 3 113 1 909Insurance and other payables 6 304 6 070Current taxation 614 740
Total liabilities 236 945 223 462
EquityOrdinary shareholders’ interests 13 211 11 716
Share capital 26 26Share premium 6 133 6 654Retained surplus 7 683 5 842Other reserves (631) (806)
Non-controlling interests 3 072 2 663
Total equity 16 283 14 379
Total equity and liabilities 253 228 237 841

Liberty Holdings Limited Annual Results Presentation for the year ended 31 December 2011 8
Statement of comprehensive incomefor the year ended 31 December 2011
2011 2010Audited Rm Rm
RevenueInsurance premiums 27 302 22 812Reinsurance premiums (909) (699)
Net insurance premiums 26 393 22 113Service fee income from policyholder investment contracts 863 868Investment income 11 079 10 910Hotel operations sales 679 687Investment gains 8 148 15 290Fee revenue and reinsurance commission 1 560 1 487Adjustment to defined benefit pension fund employer surplus (4) 11
Total revenue 48 718 51 366Claims and policyholder benefits under insurance contracts (22 897) (22 096)Insurance claims recovered from reinsurers 627 558Change in long-term policyholder liabilities (6 210) (8 991)
Insurance contracts (6 336) (9 108)Investment contracts with discretionary participation features 73 58Applicable to reinsurers 53 59
Fair value adjustment to policyholder liabilities under investment contracts (4 089) (6 257)Fair value adjustment on third party mutual fund interests (1 230) (549)Acquisition costs (3 268) (2 906)General marketing and administration expenses (6 498) (5 931)Finance costs (271) (265)Profit share allocations under bancassurance and other agreements (628) (504)Goodwill impairment (114)Equity accounted earnings from joint ventures 9 45
Profit before taxation 4 263 4 356Taxation (1 383) (1 717)
Total earnings 2 880 2 639Other comprehensive income/(loss) 158 (96)
Owner-occupied properties – fair value adjustment 115 (99)Net change in fair value on cash flow hedges 14Foreign currency translation 74 (28)Income and capital gains tax relating to: – owner-occupied properties fair value adjustment (41) 31 – net change in fair value on cash flow hedges (4)
Total comprehensive income 3 038 2 543
Total earnings attributable to:Liberty shareholders’ interests 2 599 2 393Non-controlling interests 281 246
2 880 2 639
Total comprehensive income attributable to:Liberty shareholders’ interests 2 736 2 302Non-controlling interests 302 241
3 038 2 543
Cents Cents
Basic earnings per share 997,6 918,6Fully diluted basic earnings per share 954,3 883,3

Liberty Holdings Limited Annual Results Presentation for the year ended 31 December 2011 9
Headline earnings and earnings per sharefor the year ended 31 December 2011
2011 2010
Audited Rm Rm
Reconciliation of total earnings to headline earnings attributable to equity holdersTotal earnings attributable to equity holders 2 599 2 393
Adjustments
Preference share dividend (2) (2)
Basic earnings attributable to ordinary shareholders 2 597 2 391
Goodwill and intangible assets impairments 96
Impairment of investment in joint venture 14
FCTR recycled through profit or loss 21
Headline earnings attributable to ordinary shareholders 2 597 2 522
Net income earned on BEE preference shares 66 75
BEE normalised headline earnings attributable to ordinary shareholders 2 663 2 597
Weighted average number of shares in issue (’000) 260 306 260 196
BEE normalised weighted average number of shares in issue (’000) 286 102 285 992
Fully diluted weighted average number of shares in issue (’000) 272 113 270 589
Cents Cents
Earnings per share attributable to ordinary shareholders Basic 997,6 918,6
Headline 997,6 968,8
BEE normalised headline 930,8 907,6
Fully diluted earnings per share attributable to ordinary equity holders
Basic 954,3 883,3
Headline 954,3 931,6

Liberty Holdings Limited Annual Results Presentation for the year ended 31 December 2011 10
Audited2011
Rm2010
Rm
Balance of ordinary shareholders’ funds at 1 January 11 716 10 515
Dividend/capital reduction(1) (1 353) (1 301)
Total comprehensive income 2 736 2 302
Share buy-back (40) (30)
Subscription for shares 21 20
Black Economic Empowerment transaction 112 117
Share-based payments 55 60
Payment on settlement of share options/rights (2) (2)
Acquisition of additional interests in subsidiaries (3) (2)
Preference dividend (2) (2)
FCTR recycled through profit or loss 21
Profit on partial disposal of a subsidiary 8 18
Acquisition of CfC Insurance Holdings Limited (37)
Ordinary shareholders’ funds 13 211 11 716
Balance on non-controlling interests at 1 January 2 663 2 420
Total comprehensive income 302 241
Unincorporated property partnerships 4 (1)
Non-controlling share of subsidiary dividend (13) (3)
Acquisition of additional interests in subsidiaries (24) (16)
Issue of shares in subsidiary 40
Profit on partial disposal of a subsidiary 10 (18)
Acquisition of CfC Insurance Holdings Limited 130
Non-controlling interests 3 072 2 663
Total shareholders’ funds 16 283 14 379
(1) 31 December 2011: 2010 final dividend of 291 cents per share and 2011 interim capital reduction of 182 cents per share, 31 December 2010: interim and final capital reduction of 455 cents per share.
Audited2011
Rm2010
Rm
Operating activities 5 469 1 632
Investing activities (5 008) (6 480)
Financing activities 148 67
Net increase/(decrease) in cash and cash equivalents 609 (4 781)
Cash and cash equivalents at the beginning of the year 5 858 10 637
Foreign currency translation 29Cash and cash equivalents acquired through business acquisition 168 2
Cash and cash equivalents at the end of the period 6 664 5 858
Condensed statement of changes in shareholders’ fundsfor the year ended 31 December 2011
Condensed statement of cash flowsfor the year ended 31 December 2011
Liberty Holdings Limited Annual Results Presentation for the year ended 31 December 2011 11
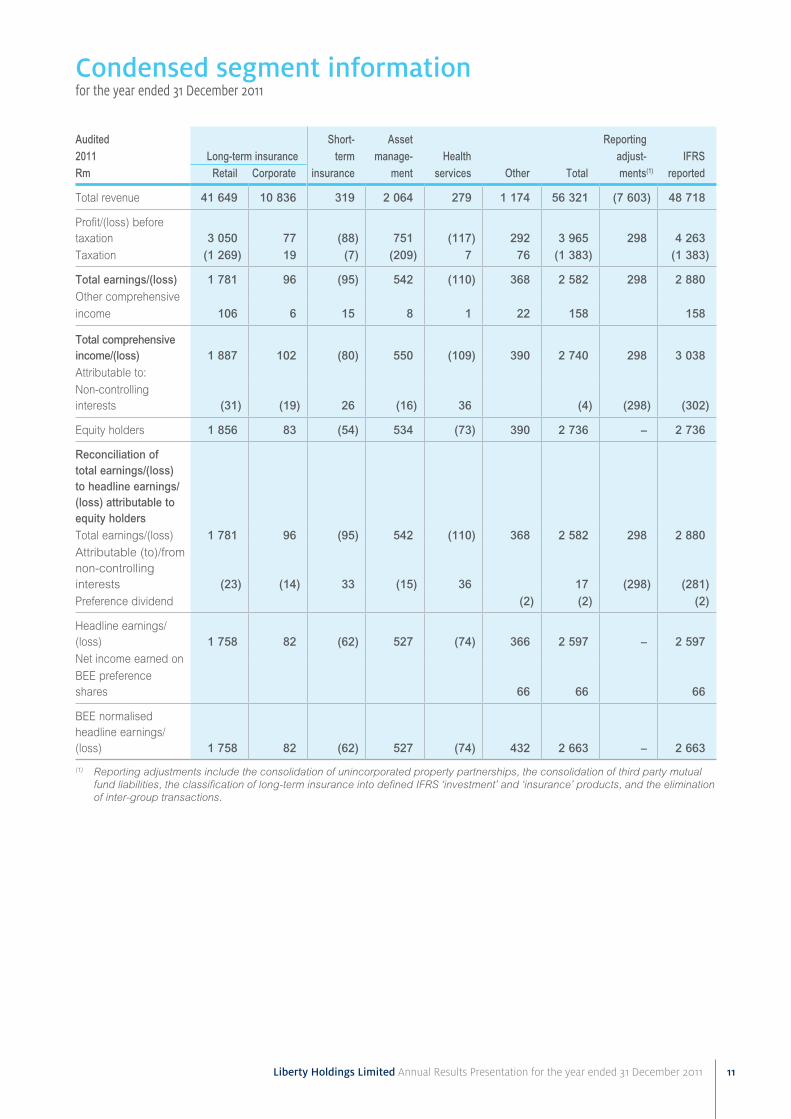
Condensed segment informationfor the year ended 31 December 2011
Audited Short- Asset Reporting2011 Long-term insurance term manage- Health adjust- IFRSRm Retail Corporate insurance ment services Other Total ments(1) reported
Total revenue 41 649 10 836 319 2 064 279 1 174 56 321 (7 603) 48 718
Profit/(loss) before taxation 3 050 77 (88) 751 (117) 292 3 965 298 4 263 Taxation (1 269) 19 (7) (209) 7 76 (1 383) (1 383)
Total earnings/(loss) 1 781 96 (95) 542 (110) 368 2 582 298 2 880 Other comprehensive
income 106 6 15 8 1 22 158 158
Total comprehensive income/(loss) 1 887 102 (80) 550 (109) 390 2 740 298 3 038 Attributable to:
Non-controlling interests (31) (19) 26 (16) 36 (4) (298) (302)
Equity holders 1 856 83 (54) 534 (73) 390 2 736 – 2 736
Reconciliation of total earnings/(loss) to headline earnings/(loss) attributable to equity holdersTotal earnings/(loss) 1 781 96 (95) 542 (110) 368 2 582 298 2 880 Attributable (to)/from non-controlling interests (23) (14) 33 (15) 36 17 (298) (281)Preference dividend (2) (2) (2)
Headline earnings/(loss) 1 758 82 (62) 527 (74) 366 2 597 – 2 597 Net income earned on
BEE preference shares 66 66 66
BEE normalised headline earnings/(loss) 1 758 82 (62) 527 (74) 432 2 663 – 2 663
(1) Reporting adjustments include the consolidation of unincorporated property partnerships, the consolidation of third party mutual fund liabilities, the classification of long-term insurance into defined IFRS ‘investment’ and ‘insurance’ products, and the elimination of inter-group transactions.

Liberty Holdings Limited Annual Results Presentation for the year ended 31 December 2011 12
Condensed segment information (continued)for the year ended 31 December 2011
Audited Asset Reporting
2010 Long-term insurance manage- Health adjust- IFRS
Rm Retail Corporate ment services Other Total ments(1) reported
Total revenue 43 419 11 853 1 834 353 1 194 58 653 (7 287) 51 366
Profit/(loss) before taxation 2 913 240 680 (232) 469 4 070 286 4 356
Taxation (1 380) (61) (187) 10 (99) (1 717) (1 717)
Total earnings/(loss) 1 533 179 493 (222) 370 2 353 286 2 639
Other comprehensive loss (66) (7) (7) (16) (96) (96)
Total comprehensive income/(loss) 1 467 172 486 (222) 354 2 257 286 2 543
Attributable (to)/from
non-controlling interests 5 (10) 51 (1) 45 (286) (241)
Equity holders 1 472 172 476 (171) 353 2 302 – 2 302
Reconciliation of total earnings/(loss) to headline earnings/(loss) attributable to equity holdersTotal earnings/(loss) 1 533 179 493 (222) 370 2 353 286 2 639
Attributable (to)/from non-controlling interests 2 (13) 52 (1) 40 (286) (246)
Preference share dividend (2) (2) (2)
Goodwill and intangible assets impairments 96 96 96
Impairment of investment in joint venture 14 14 14
FCTR recycled through profit or loss 21 21 21
Headline earnings/(loss) 1 535 179 480 (74) 402 2 522 – 2 522
Net income earned on
BEE preference shares 75 75 75
BEE normalised headline earnings/(loss) 1 535 179 480 (74) 477 2 597 – 2 597
(1) Reporting adjustments include the consolidation of unincorporated property partnerships, the consolidation of third party mutual fund liabilities, the classification of long-term insurance into defined IFRS ‘investment’ and ‘insurance’ products, and the elimination of inter-group transactions.
Liberty Holdings Limited Annual Results Presentation for the year ended 31 December 2011 13
Group equity value report
1. Introduction Liberty presents a “group equity value” report to reflect the combined value of the various components of Liberty’s
businesses.
Sections 2 and 3 below describe the valuation bases used for each reported component. It should be noted the
group equity value is presented to provide additional information to shareholders to assess performance of the
group. The total equity value is not intended to be a fair value calculation of the group but should provide indicative
information of the inherent value of the component parts.
2. Component parts of the group equity value and valuation techniques used Group equity value has been calculated as the sum of the various component parts:
2.1 South African covered business: The wholly owned subsidiary, Liberty Group Limited, comprises the cluster of South African long-term insurance
entities and related asset holding entities. The embedded value methodology in terms of Professional Guidance
Note 107 issued by the Actuarial Society of South Africa continues to be used to derive the value of this business
cluster described as “South African covered business”. The embedded value report of the South African covered
business has been reviewed by the group’s statutory actuary and audited by PricewaterhouseCoopers Inc. The
full embedded value report is included in the supplementary information section.
2.2 Other businesses: STANLIB: Valued using a 10 times (2010: 10 times) multiple of estimated sustainable earnings.
Liberty Properties: Valued using a 10 times (2010: 10 times) multiple of estimated sustainable earnings.
Fountainhead: Fountainhead has been valued on an earnings yield basis.
Liberty Health: As Liberty Health has yet to establish a history to support a sustainable earnings calculation, IFRS
net asset value is applied.
Liberty Africa: Liberty Africa is an emerging cluster of wealth businesses located outside South Africa.
A combination of valuation techniques including embedded value, discounted cash flow and earnings multiples
have been applied to value these businesses. The combined value of this cluster is not material relative to
the other components of group equity value and therefore a detailed analysis of this valuation has not been
presented.
2.3 Other adjustments: These comprise the net market value of assets and liabilities held by the Liberty Holdings Limited company
excluding investments in subsidiaries valued separately, the fair value of share options/rights allocated to staff
not employed by the South African covered businesses and allowance for certain shareholder recurring costs
incurred in Liberty Holdings Limited capitalised at a multiple of 9 times (2010: 6 times).

Liberty Holdings Limited Annual Results Presentation for the year ended 31 December 2011 14
Group equity value report (continued)
3. BEE normalised group equity value 3.1 Analysis of BEE normalised group equity value
Audited31 December 2011 (Rm)
SA covered
business
Other busi-
nesses
Group funds
investedAdjust-ments
Net worth(1)
Value of in-force:
SA covered
business Total
SA insurance operations (excluding Frank) 7 227 7 227 (3 857) 3 370 17 789 21 159
Retail SA 16 175 Corporate 1 614
Frank 116 116 (14) 102 38 140 Value of in-force acquired 325 325 (325)Working capital 3 994 3 994 (291) 3 703 3 703
South African insurance operations 11 662 11 662 (4 487) 7 175 17 827 25 002 Other group businesses:STANLIB 234 234 3 566 3 800 3 800 Properties (including Fountainhead) 270 270 684 954 954 Liberty Health (including Total Health Trust) 81 97 178 178 178 Liberty Africa 31 354 385 385 33 418 Liberty Holdings 482 482 54 536 536 Cost of capital (1 167) (1 167)
Net equity as reported under IFRS 11 774 1 437 13 211 (183) 13 028 16 693 29 721 BEE preference funding 1 075 1 075 1 075 1 075 Allowance for future shareholders costs (145) (145) (145) (1 690) (1 835)Allowance for employee share options/rights (180) (142) (322) (322) (322)
BEE normalised equity value 12 669 1 150 13 819 (183) 13 636 15 003 28 639
Summary of adjustments: Negative rand reserves (3 857) (3 857) Deferred acquisition costs (389) (389) Deferred revenue liability 152 152 Internally generated software (54) 54 Frank allowance for future expenses (14) (14) Carrying value of in-force business
acquired (325) (325) Fair value adjustment of
non SA covered business 4 250 4 250
(4 487) 4 304 (183)(1) Reconciliation to SA covered business net
worthNet equity of SA covered business as reported under IFRS 11 774
Adjustments as above (4 487)Allowance for employee share options/rights (180)BEE preference share funding 1 075
Net worth as reported in supplementary information 8 182

Liberty Holdings Limited Annual Results Presentation for the year ended 31 December 2011 15
3. BEE normalised group equity value (continued) 3.1 Analysis of BEE normalised group equity value (continued)
Audited31 December 2010 (Rm)
SA covered business
Other busi-
nesses
Groupfunds
investedAdjust-ments
Networth(1)
Value ofin-force:
SA covered
business Total
SA insurance operations (excluding Frank) 7 043 7 043 (3 125) 3 918 16 522 20 440
Retail SA 14 807 Corporate 1 715
Frank 99 99 (42) 57 57 Value of in-force acquired 440 440 (440)Working capital 2 827 2 827 (244) 2 583 2 583
South African insurance operations 10 409 10 409 (3 851) 6 558 16 522 23 080 Other group businesses:STANLIB 230 230 3 370 3 600 3 600 Properties (including Fountainhead) 152 121 273 671 944 944 Liberty Health (including Total Health Trust) 267 267 267 267 Liberty Africa 42 110 152 22 174 21 195 Liberty Holdings 385 385 50 435 435 Cost of capital (1 433) (1 433)
Net equity as reported under IFRS 10 870 846 11 716 262 11 978 15 110 27 088 BEE preference funding 1 119 1 119 1 119 1 119 Allowance for future shareholders costs (101) (101) (101) (1 561) (1 662)Allowance for STC (257) (257) (257) (257)Allowance for employee share options/rights (183) (75) (258) (258) (258)
BEE normalised equity value 11 806 413 12 219 262 12 481 13 549 26 030
Summary of adjustments: Negative rand reserves (3 125) (3 125) Deferred acquisition costs (364) (364) Deferred revenue liability 139 139 Internally generated software (50) 50 Frank allowance for future expenses (42) (42) Carrying value of in-force business
acquired (440) (440) Fair value adjustment of non SA
covered business 4 063 4 063 Other 31 31
(3 851) 4 113 262
(1) Reconciliation to SA covered business net worthNet equity of SA covered business as reported under IFRS 10 870
Adjustments as above (3 851)Allowance for employee share options/rights (183)BEE preference share funding 1 119
Net worth as reported in supplementary information 7 955

Liberty Holdings Limited Annual Results Presentation for the year ended 31 December 2011 16
Group equity value report (continued)
3. BEE normalised group equity value (continued) 3.2 BEE normalised group equity value earnings and value per share
31 December 2011 31 December 2010
SA Other SA Othercovered busi- covered busi-
business nesses Total business nesses TotalAudited Rm Rm Rm Rm Rm Rm
BEE normalised equity value at end of the year 23 185 5 454 28 639 21 504 4 526 26 030
BEE preference shares 1 075 1 075 1 119 1 119 Equity value at the end of the year 22 110 5 454 27 564 20 385 4 526 24 911
Adjustments from group restructure 15 (15) 3 979 (3 979) Capital transactions 19 19 10 10 Intergroup dividends 1 283 (1 283) 1 092 (1 092) Dividends paid 1 353 1 353 1 301 1 301 BEE normalised equity value at beginning of the year (21 504) (4 526) (26 030) (24 051) (67) (24 118)
Equity value at beginning of the year (20 385) (4 526) (24 911) (22 892) (67) (22 959)BEE preference shares (1 119) (1 119) (1 159) (1 159)
BEE normalised equity value earnings 2 979 1 002 3 981 2 524 699 3 223 BEE normalised return on group equity value 13,9% 22,1% 15,3% 12,6% 17,3% 13,4%BEE normalised number of shares (000’s) 285 961 286 022
Number of shares in issue (000’s) 260 165 260 226 Adjustment for BEE ordinary shares (000’s) 25 796 25 796
BEE normalised group equity value per share (Rand) 100,15 91,01
3.3 Sources of BEE normalised group equity value earnings
31 December 2011 31 December 2010
SA covered business
Otherbusi-
nesses Total
SA covered business
Otherbusi-
nesses TotalAudited Rm Rm Rm Rm Rm Rm
Value of new business 389 21 410 252 9 261 Expected return on value of in-force 1 640 1 640 1 619 1 619 Operating assumptions 949 (55) 894 116 (101) 15
Operating experience variances 286 (11) 275 399 399Operating assumption changes 273 (44) 229 (390) (101) (491)Changes in modelling methodology 390 390 107 107
Headline earnings of other businesses (108) 527 419 (74) 454 380
Operational equity value profits 2 870 493 3 363 1 913 362 2 275Non headline loss of other businesses (110) (110)Development costs (61) (61) (72) (72)Investment return on net worth 458 174 632 573 146 719 Investment variances (279) (279) (41) (41)Changes in economic assumptions (12) (12) 331 331 Increase in fair value adjustments on value of other businesses 145 145 (42) 225 183Change in allowance for share options/rights 3 (67) (64) (28) (2) (30)Change in STC allowance 257 257 (32) (32)
Group equity value earnings 2 979 1 002 3 981 2 524 699 3 223

Liberty Holdings Limited Annual Results Presentation for the year ended 31 December 2011 17
3. BEE normalised group equity value (continued) 3.4 Analysis of value of long-term insurance, new business and margin
Audited 31 Dec 31 Dec
Rm 2011 2010
South African covered business:Retail SA
– Traditional Life 793 663
– Emerging Consumer Markets 111 87
– Credit Life 86 65
Liberty Corporate 95 86
Frank 51
Gross value of new business 1 136 901
Overhead acquisition costs impact on value of new business (687) (616)
Cost of required capital (60) (33)
Net value of South African covered new business 389 252
Present value of future expected premiums 28 329 22 498
Margin 1,4% 1,1%
Liberty Africa:Net value of new business 21 9
Present value of future expected premiums 229 173
Margin 9,2% 5,2%
Total group net value of new business 410 261
Total group margin 1,4% 1,2%
3.5 Notes and definitions BEE normalised:
These measures reflect the economic reality of the Black Economic Empowerment (BEE) transaction as
opposed to the required technical accounting treatment that reflects the BEE transaction as a share buy-back.
Value of new business and margin
Value of new business is the present value, at point of sale, of the projected stream of after tax profits for new
business issued, net of the cost of required capital. The present value is calculated using a risk adjusted
discount rate. Margin is calculated using the value of new business divided by the present value of future
modelled premiums.
Development costs
Represents project costs incurred on developing or enhancing future revenue opportunities.
Negative rand reserves
A portion of expected future management and administration fees are present valued at and recognised at
point of sale. Prospective measurement takes place at each valuation date until received.

Liberty Holdings Limited Annual Results Presentation for the year ended 31 December 2011 18
Long-term insurance new businessfor the year ended 31 December 2011
Unaudited2011
Rm2010
Rm
Retail SA 16 229 12 672
Single 13 171 9 950
Recurring 3 058 2 722
Corporate 1 586 1 488
Single 1 053 1 051
Recurring 533 437
Liberty Africa(1) 140 220
Single 32 169
Recurring 108 51
Frank 28
Recurring 28
Total new business 17 983 14 380
Single 14 256 11 170
Recurring 3 727 3 210
Sources of insurance operations total new business by customer segment:
Retail 16 367 12 722
Single 13 198 9 966
Recurring 3 169 2 756
Corporate 1 616 1 658
Single 1 058 1 204
Recurring 558 454
Total new business 17 983 14 380
Indexed new business 5 152 4 327
(1) Liberty group owns less than 100% of the various entities that make up Liberty Africa. The information is recorded at 100% and is not adjusted for proportional legal ownership.

Liberty Holdings Limited Annual Results Presentation for the year ended 31 December 2011 19
Unaudited2011Rbn
2010 Rbn
Managed by group business units 432 419
STANLIB 341 355
Liberty Africa(2) 39 29
Liberty Properties 27 25
LibFin 25 10
Externally managed 23 23
Total assets under management 455 442
(1) Includes funds under administration.(2) Liberty group owns less than 100% of the various entities that make up Liberty Africa. The information is recorded at 100% and is
not adjusted for proportional legal ownership.
Assets under management(1)
for the year ended 31 December 2011

Liberty Holdings Limited Annual Results Presentation for the year ended 31 December 2011 20
Long-term insurance net cash flowsfor the year ended 31 December 2011
Audited2011
Rm2010
Rm
PremiumsRecurring 20 853 19 473
Retail 14 817 13 719
Corporate 6 036 5 754
Single 14 858 11 382
Retail 8 561 6 098
Corporate 1 629 1 376
Immediate annuities 4 668 3 908
Net premium income from insurance contracts and inflows from investment contracts 35 711 30 855
Claims and policyholders benefitsRetail (23 086) (22 666)
Death and disability claims (4 199) (4 043)
Policy maturity claims (4 717) (4 373)
Policy surrender claims (10 754) (11 054)
Annuity payments (3 416) (3 196)
Corporate (8 395) (8 476)
Death and disability claims (1 745) (1 718)
Scheme terminations and member withdrawals (6 349) (6 478)
Annuity payments (301) (280)
Net claims and policyholders benefits (31 481) (31 142)
Long-term insurance net cash flows 4 230 (287)
Sources of insurance operations cash flows by business unit:
Retail SA 4 767 990
Corporate (661) (1 517)
STANLIB Multi-manager (109) (19)
Frank 17 Liberty Africa(1) 216 259
(1) Liberty group owns less than 100% of the various entities that make up Liberty Africa. The information is recorded at 100% and is not adjusted for proportional legal ownership.

Liberty Holdings Limited Annual Results Presentation for the year ended 31 December 2011 21
Short-term insurance net cash flowsfor the year ended 31 December 2011
Audited2011
Rm2010
Rm
Premiums 343 77
Liberty Health – medical risk 162 77
Liberty Africa – motor, property and other 179– medical risk 2
Claims (235) (63)
Liberty Health – medical risk (144) (63)
Liberty Africa – motor, property and other (85)– medical risk (6)
Net cash inflows from short-term insurance 108 14
Unaudited2011
Rm2010
Rm
STANLIB before money market 7 919 (3 431)
Retail 10 004 5 908
Institutional (2 085) (9 339)
Money market (13 407) 19 130
Retail 1 027 4 840
Institutional (14 434) 14 290
Net STANLIB cash (outflows)/inflows(1) (5 488) 15 699
Liberty Africa before money market 5 679 4 754
Retail 295 318
Institutional 5 384 4 436
Money market (282) 1 726
Net Liberty Africa cash inflows(2) 5 397 6 480
Net cash (outflows)/inflows from asset management (91) 22 179
(1) STANLIB cash flows exclude intergroup life funds.(2) Liberty group owns less than 100% of the various entities that make up Liberty Africa. The information is recorded at 100% and is
not adjusted for proportional legal ownership.
Asset management net cash flows – StAnLib and Liberty Africafor the year ended 31 December 2011

Liberty Holdings Limited Annual Results Presentation for the year ended 31 December 2011 22
Capital commitmentsas at 31 December 2011
Audited2011
Rm2010
Rm
Business acquisitions(1) 57 143
Equipment 300 236
Investment and owner-occupied property 1 486 1 654
Total capital commitments 1 843 2 033
Under contracts 646 458
Authorised by the directors but not contracted 1 182 1 445
Under agreement with material conditions outstanding 15 130
(1) The board has approved an allocated amount towards possible business acquisitions.
The group’s share of commitments of joint ventures amounts to R12 million (2010: R7 million) and is to be financed by the existing facilities in the joint venture operations.
The above 2011 capital commitments will be financed by available bank facilities, existing cash resources, internally generated funds and R122 million (2010: R313 million) from non-controlling interests in unincorporated property partnerships.
Retirement benefit obligationsas at 31 December 2011
Audited
Post-retirement medical benefitThe group operates an unfunded post-retirement medical aid benefit for permanent employees who joined the group prior to 1 February 1999 and agency staff who joined prior to 1 March 2005.
As at 31 December 2011, the Liberty post-retirement medical aid benefit liability was R459 million (2010: R400 million).
Defined benefit retirement fundsThe group operates a number of defined benefit pension schemes on behalf of employees. All these funds are closed to new membership and are well funded with no deficits reported.

Liberty Holdings Limited Annual Results Presentation for the year ended 31 December 2011 23
Related partiesas at 31 December 2011
Audited
The following selected significant related party transactions have occurred in the 31 December 2011 financial period:
1) Summary of movement in investment in ordinary shares held by the group in the group’s holding company is as follows:
NumberFair
value Ownership
’000 Rm %
Standard Bank Group Limited
Balance at 1 January 2011 17 364 1 868 1,10
Purchases 2 500 252
Sales (7 708) (768)
Fair value adjustments (151)
Balance at 31 December 2011 12 156 1 201 0,77
2) Bancassurance Liberty has entered into joint venture bancassurance agreements with the Standard Bank group for the manufacture,
sale and promotion of insurance, investment and health products through Standard Bank’s African distribution capability. New business insurance premium income in respect of this business in 2011 amounted to R5 404 million (2010 full year: R4 407 million). In terms of the agreements, Liberty’s subsidiaries pay joint venture profit shares to various Standard Bank operations. The amounts to be paid are in most cases dependent on source and type of business and are paid along geographical lines. The total net profit share calculated as payable to the Standard Bank group for 2011 is R608 million (2010: R463 million).
During 2010 Liberty and Standard Bank conducted a detailed review of the existing bancassurance agreement and agreed with effect, from 1 January 2011, to expand the scope thereof to include asset management, investment and health products in addition to the insurance products. The agreements are evergreen agreements with a 24-month notice period for termination, but neither party may give notice of termination until February 2013. As the joint venture bancassurance relationship provides commercial benefits to both Liberty and Standard Bank, a governance framework is in place to protect the interests of minority shareholders.
In order to provide enhanced transparency and further detail in respect of Liberty’s joint venture bancassurance arrangements with Standard Bank, a summary document has been published on the investor relations page of Liberty’s website (www.liberty.co.za).
3) Acquisition of CfC Insurance Holdings Limited (CfC) To continue the execution of the group’s strategy to extend its market share of the wealth management business in African countries outside of South Africa, Liberty has acquired a 56,8% controlling stake in CfC. The effective date of the transaction was 1 April 2011.
CfC is a leading Kenyan life, health and general insurance group consisting of CfC Life Assurance and The Heritage Insurance Company in Kenya and Tanzania.
Previously CfC was a directly owned subsidiary of the Standard Bank Group and the transaction is therefore defined as a common control transaction. In terms of the group’s accounting policies Liberty accounts for the respective assets and liabilities acquired at the Standard Bank Group Limited carrying values at the date of the transaction. The excess paid over the net carrying value is accounted for directly in equity.
The purchase price is R199 million consisting of R84 million of new equity capital, a R108 million payment to Standard Bank and an expected additional amount of US$1 million (rand equivalent of R7 million) relating to an earn out based on an asset base improvement impact on net value. The maximum possible amount of the earn out is US$4 million and the latest possible settlement date for the earn out is 31 March 2013.

Liberty Holdings Limited Annual Results Presentation for the year ended 31 December 2011 24
Related partiesas at 31 December 2011
3) Acquisition of CfC Insurance Holdings Limited (CfC) (continued) The assets and liabilities arising from the acquisition are as follows:
2011Rm
Equipment and owner-occupied properties under development 55 Owner-occupied properties 51 Investment properties 43 Goodwill 26 Intangible assets 51 Deferred acquisition costs 13 Deferred taxation asset 5 Reinsurance assets 111 Financial investments 1 340 Prepayments, insurance and other receivables 109 Long-term policyholder liabilities (1 070)Short-term insurance liabilities (339)Financial liabilities at amortised cost (41)Employee benefits (1)Deferred revenue (7)Deferred taxation liability (59)Insurance and other payables (160)Current taxation (3)
Net assets and liabilities assumed 124 Cash acquired 168 Non-controlling interests(1) ( 130)
Net asset value attributable to ordinary shareholders 162 Acquisition price 199
Capital contribution 84 Cash paid to Standard Bank 108 Contingent consideration 7
Excess purchase price accounted for directly in equity (37)
(1) Non controlling interests represent their proportionate share of the assets and liabilities assumed from the Standard Bank Group.
Subsequent to the 30 June 2011 interim disclosures, these items were adjusted to reflect corrections arising from a review of the 31 March 2011 management accounts:
Revised
As reported at
30 June 2011 DifferenceRm Rm Rm
Cash acquired 168 210 (42)Deferred taxation liability (59) (71) 12Non-controlling interests (130) (142) 12
Total (21) (3) (18)
Since acquisition date, CfC has contributed R325 million to the group’s total revenue and R9 million to the group’s total earnings (of which R5 million was Liberty’s share) for the year ended 31 December 2011.

Liberty Holdings Limited Annual Results Presentation for the year ended 31 December 2011 25
Supplementaryinformation
Liberty Holdings Limited
2011For the year ended 31 December

Liberty Holdings Limited Annual Results Presentation for the year ended 31 December 2011 26
ContentsGroupAnalysis of ordinary shareholders’ funds invested 27
Analysis of group earnings – core earnings 28
Reconciliation of business unit earnings to segment result 28
South African covered business embedded value 29
SAM QIS1 results 35
InsuranceLong-term insurance – New business by distribution
channel 36
Total long-term insurance premiums 37
South African insurance distribution headcount 37
Maintenance costs per policy – Retail SA 38
Negative rand reserves – Retail SA 38
LibFin – Shareholders investment portfolio
percentage allocation 38
Long-term policyholder liabilities IFRS reconciliation 39
Asset ManagementSTANLIB net cash flows and AUM by asset category 40
STANLIB AUM breakdown by source and asset type 41
STANLIB retail investment performance 42
STANLIB institutional investment performance 42
Liberty Africa – AUM 42
Liberty Africa – AUM by geographical location 43

Liberty Holdings Limited Annual Results Presentation for the year ended 31 December 2011 27
Group funds invested Contribution to earnings
2011 2010 2011 2010
Rm Rm Rm Rm
South African insurance operations 11 546 10 310 2 443 2 478
Insurance operating surplus 1 876 1 826Secondary tax on companies – bancassurance dividends (57) (42)Present value of in-force business 325 440 (115) (115)Investment portfolios 9 227 9 043 615 698LibFin allocated expenses (32)Fixed assets and working capital(1) 3 994 2 827 335 290Callable capital bonds (2 000) (2 000) (179) (179)
Asset management operations 504 503 510 457
STANLIB 234 230 414 361Liberty Properties 66 79 85 86Fountainhead 204 194 11 10
Business development initiatives 679 518 (91) (77)
Liberty Africa 385 152 19 9Total Health Trust 30 21 2 1Liberty Health 148 246 (65) (43)Frank Financial Services 116 99 (47) (44)
Shareholder expenses and sundry income (263) (334)Liberty Holdings 482 385Preference share dividend (2) (2)
Headline earnings 2 597 2 522Preference share dividend 2 2 Goodwill and intangible assets impairments (96)Impairment of investment in joint venture (14)FCTR recycled through profit or loss (21)
Liberty Holdings shareholders’ funds/total earnings 13 211 11 716 2 599 2 393
BEE normalised:Liberty Holdings shareholders’ funds/headline earnings 13 211 11 716 2 597 2 522BEE preference shares 1 075 1 119 66 75
BEE normalised shareholders’ funds/headline earnings 14 286 12 835 2 663 2 597
(1) With effect from 1 July 2005 Liberty Group Limited established a working capital funding loan between insurance operations and shareholder assets, subsequently supported by the callable capital bonds issue. Inter-divisional interest is charged at 8,77% nacm which is equivalent to the callable capital bond’s interest rate.
Analysis of ordinary shareholders’ funds investedfor the year ended 31 December 2011

Liberty Holdings Limited Annual Results Presentation for the year ended 31 December 2011 28
Analysis of group earnings – core earnings
Reconciliation of business unit earnings to segment result as at 31 December 2011
Segment report
Business unitRetail
RmCorporate
Rm
Short-termRm
Assetmanage-
mentRm
Healthservices
RmOther
RmTotal
Rm
Retail SA 1 369 (55) 1 314 Corporate 36 36 LibFin 363 24 737 1 124 STANLIB 414 414 Liberty Properties 96 96 Liberty Africa 41 22 (36) 35 2 (43) 21 Liberty Health (17) (48) (65) Frank 16 (63) (47) Central overheads and sundry income (31) (9) (18) (28) (208) (294)
Total earnings attributable to equity holders 1 758 82 (62) 527 (74) 368 2 599 Preference share dividend (2) (2) Net income earned on BEE preference shares 66 66
BEE normalised headline earnings 1 758 82 (62) 527 (74) 432 2 663
2011 2010
31 December Rm Rm
Retail SA planned margin release including annual contribution increases 1 451 1 379
Expected long-term rate of return on shareholder investment portfolio 1 097 1 129
BEE preference share income 66 75
Other businesses headline earnings and shareholder net expenses 219 180
Corporate 96 103
STANLIB 414 361
Liberty Properties 96 96
Liberty Africa 21 10
Liberty Health (65) (43)
Frank (47) (44)
Other (296) (303)
Core operating earnings 2 833 2 763
Corporate retirement fund administration project (60)Retail SA new business strain (342) (333)
Retail SA operating variances and assumption changes 205 (147)
Adjusted core operating earnings 2 636 2 283
LibFin Markets portfolio performance 155 269
Variance to long-term rate of return on shareholder investment portfolio (128) 45
BEE normalised headline earnings 2 663 2 597

Liberty Holdings Limited Annual Results Presentation for the year ended 31 December 2011 29
South African covered business embedded valuefor the year ended 31 December 2011
1. Description of embedded value of South African covered businessThe current version of Professional Guidance Note (PGN)107 came into force for all financial years ending on or after
31 December 2008. PGN 107 governs the way in which embedded values of life assurance companies are reported.
The embedded value consists of:
• The net worth; plus
• The value of in-force covered business; less
• The cost of required capital.
The net worth represents the excess of assets over liabilities on the statutory valuation method, adjusted for the
elimination of the carrying value of covered business acquired and for the fair value of share options/rights granted
to Liberty Group Limited employees.
The value of in-force covered business is the discounted value of the projected stream of after tax shareholder profits
arising from existing in-force covered business. These shareholder profits arise from the release of margins under the
statutory basis of valuing liabilities, which differs from the release of profits on the published accounting basis. This
value is reduced by the present value of after tax future shareholder recurring and non-recurring expenses. Covered
business is defined as business regulated by the FSB as long-term insurance business written in Liberty Group
Limited or its subsidiary life companies.
For reversionary and smoothed bonus business, the value of in-force covered business has been calculated
assuming that bonuses are changed over time so that the full amount of the bonus stabilisation reserves is distributed
to policyholders over the lifetime of the in-force policies.
The required capital is defined as the level of capital that is restricted for distribution to shareholders. This comprises
the statutory CAR calculated in accordance with PGN 104 plus any additional capital considered appropriate
by the Board given the risks in the business. For Liberty Group Limited, required capital has been calculated at
1,7 x CAR. For subsidiary life companies a multiple of 1,5 x CAR has been used. The cost of required capital is the
present value, at the risk discount rate, of the projected release of the required capital allowing for investment returns
on the assets supporting the projected required capital.
The value of new business written is the present value at the point of sale of the projected stream of after tax profits
from that business, reduced by the cost of required capital. New business is defined as covered business arising
from the sale of new policies and once off premium increases in respect of in-force covered business during the
reporting period. Risk policies with an inception date prior to the reporting date where no premium has been received
are included in the embedded value and value of new business. The contractual terms of these policies state that
Liberty Group Limited is on risk from the inception date, even though a premium may not have been received. This
definition is consistent with that used in the financial statements.
The value of new business has been calculated on the closing assumptions. Investment yields at the point of sale
have been used for new fixed annuities and Guaranteed Capital Bonds; for all other business the investment yields
at the date of reporting have been used.
No adjustment has been made for the discounting of tax provisions in the embedded value.

Liberty Holdings Limited Annual Results Presentation for the year ended 31 December 2011 30
South African covered business embedded value (continued) for the year ended 31 December 2011
2. BEE normalised embedded value2011 2010
Rm Rm
Risk discount rate(a) 10,95% 11,07%
Net worth 8 182 7 955
Ordinary shareholders’ funds on published basis 12 849 11 989
Adjustment of ordinary shareholders’ funds from published basis(b) (4 162) (3 411)
Adjustment for carrying value of in-force business acquired(c) (325) (440)
Allowance for fair value of share options (180) (183)
Net value of life business in-force 15 003 13 549
Value of life business in-force 16 170 14 982
Cost of required capital (1 167) (1 433)
BEE normalised embedded value 23 185 21 504
3. BEE normalised embedded value earningsEmbedded value at the end of the period 23 185 21 504
Adjustments arising from the group restructure 15 3 979
Intergroup dividends 1 283 1 092
Less embedded value at the beginning of the period (21 504) (24 051)
Embedded value earnings 2 979 2 524
Return on embedded value 13,9% 12,6%
Liberty Holdings Limited Annual Results Presentation for the year ended 31 December 2011 31
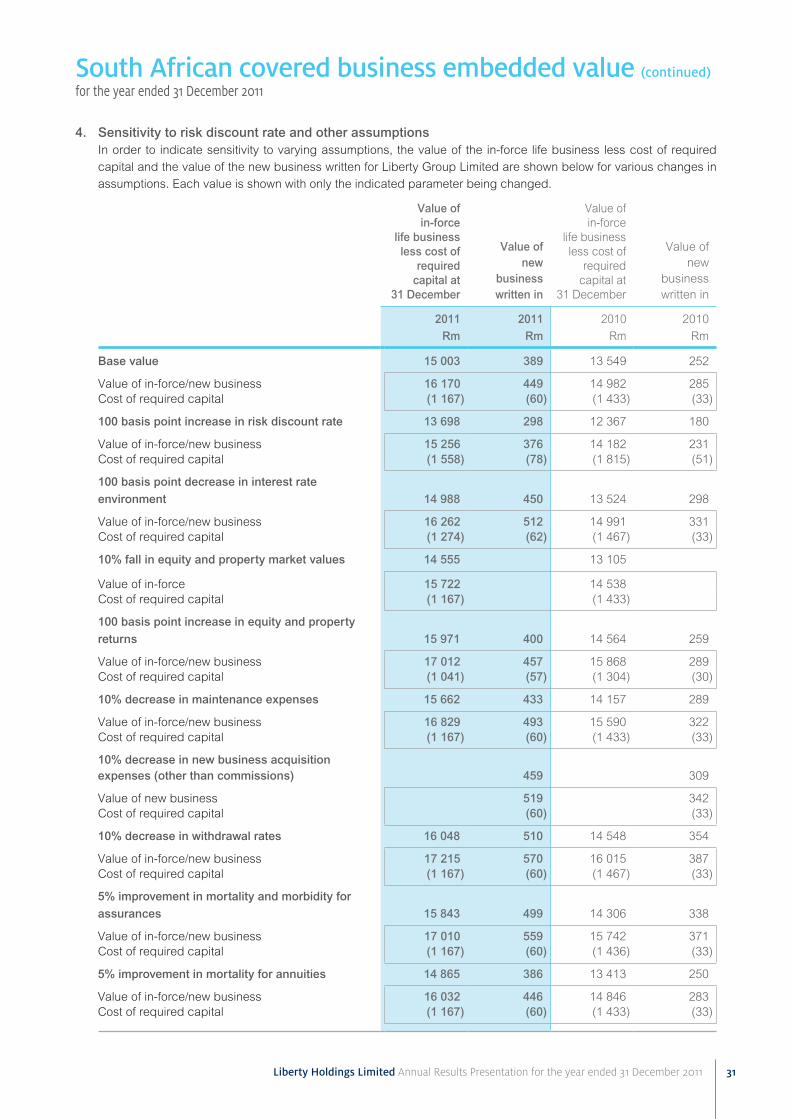
4. Sensitivity to risk discount rate and other assumptions In order to indicate sensitivity to varying assumptions, the value of the in-force life business less cost of required
capital and the value of the new business written for Liberty Group Limited are shown below for various changes in
assumptions. Each value is shown with only the indicated parameter being changed.
Value of in-force
life business less cost of
required capital at
31 December
Value of new
business written in
Value of in-force
life business less cost of
required capital at
31 December
Value of new
business written in
2011 2011 2010 2010
Rm Rm Rm Rm
Base value 15 003 389 13 549 252
Value of in-force/new business 16 170 449 14 982 285Cost of required capital (1 167) (60) (1 433) (33)
100 basis point increase in risk discount rate 13 698 298 12 367 180
Value of in-force/new business 15 256 376 14 182 231Cost of required capital (1 558) (78) (1 815) (51)
100 basis point decrease in interest rate environment 14 988 450 13 524 298
Value of in-force/new business 16 262 512 14 991 331Cost of required capital (1 274) (62) (1 467) (33)
10% fall in equity and property market values 14 555 13 105
Value of in-force 15 722 14 538Cost of required capital (1 167) (1 433)
100 basis point increase in equity and property returns 15 971 400 14 564 259
Value of in-force/new business 17 012 457 15 868 289Cost of required capital (1 041) (57) (1 304) (30)
10% decrease in maintenance expenses 15 662 433 14 157 289
Value of in-force/new business 16 829 493 15 590 322Cost of required capital (1 167) (60) (1 433) (33)
10% decrease in new business acquisition expenses (other than commissions) 459 309
Value of new business 519 342Cost of required capital (60) (33)
10% decrease in withdrawal rates 16 048 510 14 548 354
Value of in-force/new business 17 215 570 16 015 387Cost of required capital (1 167) (60) (1 467) (33)
5% improvement in mortality and morbidity for assurances 15 843 499 14 306 338
Value of in-force/new business 17 010 559 15 742 371Cost of required capital (1 167) (60) (1 436) (33)
5% improvement in mortality for annuities 14 865 386 13 413 250
Value of in-force/new business 16 032 446 14 846 283Cost of required capital (1 167) (60) (1 433) (33)
South African covered business embedded value (continued) for the year ended 31 December 2011

Liberty Holdings Limited Annual Results Presentation for the year ended 31 December 2011 32
South African covered business embedded value (continued) for the year ended 31 December 2011
5. Analysis of BEE normalised embedded value earnings
Net worth
Value of
inforce covered
business
Cost ofrequired
capital
Em-bedded
valueNet
worth
Value of
inforce covered
business
Cost of required
capital
Em-bedded
value
2011 2010
Rm Rm Rm Rm Rm Rm Rm Rm
Embedded value at the end
of the period 8 182 16 170 (1 167) 23 185 7 955 14 982 (1 433) 21 504
Plus dividends paid 1 283 1 283 1 092 1 092
Adjustments arising from
group restructure 8 7 15 4 074 (93) (2) 3 979
Embedded value at the
beginning of the period (7 955) (14 982) 1 433 (21 504) (11 504) (13 957) 1 410 (24 051)
Embedded value earnings 1 518 1 195 266 2 979 1 617 932 (25) 2 524
Components of embedded
value earnings
Value of new business written
in the period (894) 1 343 (60) 389 (936) 1 221 (33) 252
Expected return on value of
life business(d) 1 623 17 1 640 1 611 8 1 619
Expected net of tax profit
transfer to net worth 2 324 (2 324) 2 371 (2 371)
Operating experience
variances(g) 99 252 73 424 64 270 (7) 327
Development expenses (61) (61)Incentive outperformance (138) (138)Operating assumption
changes(h) (275) 548 273 (163) (249) 22 (390)
Embedded value earnings from operations 1 055 1 442 30 2 527 1 336 482 (10) 1 808
Investment return on net worth 350 350 347 347
Investment variances (96) (183) (279) (125) 84 (41)
Changes in economic
assumptions(i) 14 (5) (21) (12) 121 225 (15) 331
Changes in modelling
methodology(j) 192 (59) 257 390 (34) 141 107
Change in allowance for fair
value of share options/rights(k) 3 3 (28) (28)
BEE normalised embedded value earnings 1 518 1 195 266 2 979 1 617 932 (25) 2 524
Liberty Holdings Limited Annual Results Presentation for the year ended 31 December 2011 33
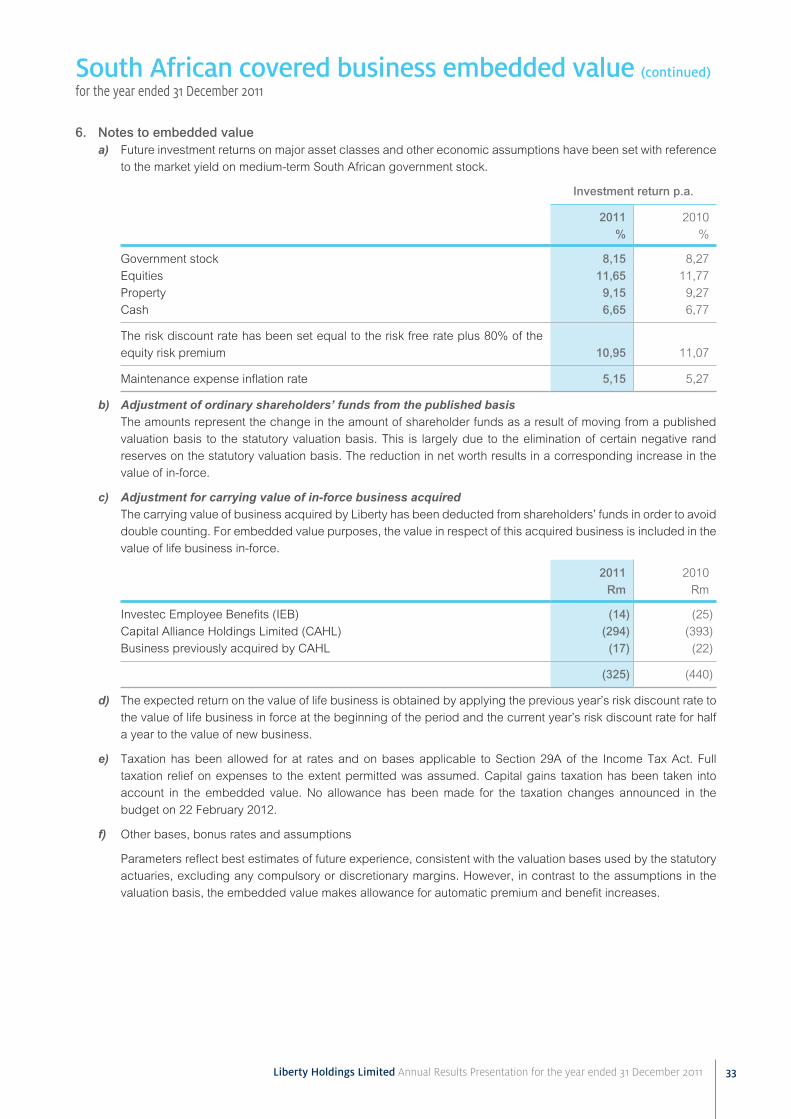
6. Notes to embedded valuea) Future investment returns on major asset classes and other economic assumptions have been set with reference
to the market yield on medium-term South African government stock.
Investment return p.a.
2011 2010
% %
Government stock 8,15 8,27
Equities 11,65 11,77
Property 9,15 9,27
Cash 6,65 6,77
The risk discount rate has been set equal to the risk free rate plus 80% of the
equity risk premium 10,95 11,07
Maintenance expense inflation rate 5,15 5,27
b) Adjustment of ordinary shareholders’ funds from the published basis The amounts represent the change in the amount of shareholder funds as a result of moving from a published
valuation basis to the statutory valuation basis. This is largely due to the elimination of certain negative rand
reserves on the statutory valuation basis. The reduction in net worth results in a corresponding increase in the
value of in-force.
c) Adjustment for carrying value of in-force business acquired The carrying value of business acquired by Liberty has been deducted from shareholders’ funds in order to avoid
double counting. For embedded value purposes, the value in respect of this acquired business is included in the
value of life business in-force.
2011 2010
Rm Rm
Investec Employee Benefits (IEB) (14) (25)
Capital Alliance Holdings Limited (CAHL) (294) (393)
Business previously acquired by CAHL (17) (22)
(325) (440)
d) The expected return on the value of life business is obtained by applying the previous year’s risk discount rate to
the value of life business in force at the beginning of the period and the current year’s risk discount rate for half
a year to the value of new business.
e) Taxation has been allowed for at rates and on bases applicable to Section 29A of the Income Tax Act. Full
taxation relief on expenses to the extent permitted was assumed. Capital gains taxation has been taken into
account in the embedded value. No allowance has been made for the taxation changes announced in the
budget on 22 February 2012.
f) Other bases, bonus rates and assumptions
Parameters reflect best estimates of future experience, consistent with the valuation bases used by the statutory
actuaries, excluding any compulsory or discretionary margins. However, in contrast to the assumptions in the
valuation basis, the embedded value makes allowance for automatic premium and benefit increases.
South African covered business embedded value (continued) for the year ended 31 December 2011

Liberty Holdings Limited Annual Results Presentation for the year ended 31 December 2011 34
6. Notes to embedded value (continued)g) Operating experience variances consist of the combined effect on net worth and value of in-force of operating
experience being different to that anticipated at the prior year end.
The net 31 December 2011 operating experience variance of R424 million comprised:
Net worth
Value of in-force covered
business
Cost of required
capital Embedded
value
Operating experience variances Rm Rm Rm Rm
Expenses (114) (114)Mortality and morbidity 6 46 52Persistency 70 223 293Tax rebates 150 (83) 67Other (13) 66 73 126
Total 99 252 73 424
h) The amount of R273 million operating assumption changes comprises:
Net worth
Value of in-force covered
business
Cost of required
capital Embedded
value
Operating assumption changes Rm Rm Rm Rm
Expenses (28) (312) (340)
Retail SA (28) (31) (59)Corporate (61) (61)Shareholder (220) (220)
Mortality and morbidity (83) (18) (101)Annuitant mortality (313) 12 (301)Persistency 72 940 1 012Other 77 (74) 3
Total (275) 548 273
Other comprises a large number of minor adjustments to assumptions.
i) The amount of negative R12 million (2010: R331 million) relates to changes in economic assumptions as
described in note a.
j) The amount of R257 million for cost of required capital represents a refinement to the modelling methodology
used.
k) The amount of R3 million (2010: negative R28 million) in respect of the change in the fair value of share options/
rights arises from the change in the number of shares under option/share rights for staff employed by Liberty
Group Limited and the increase in the market value of Liberty Holdings Limited share price over the reporting
period.
l) The assets backing the required capital are consistent with the long-term strategic mix of shareholder funds
approved by the Liberty Holdings Board in November 2009.
South African covered business embedded value (continued) for the year ended 31 December 2011
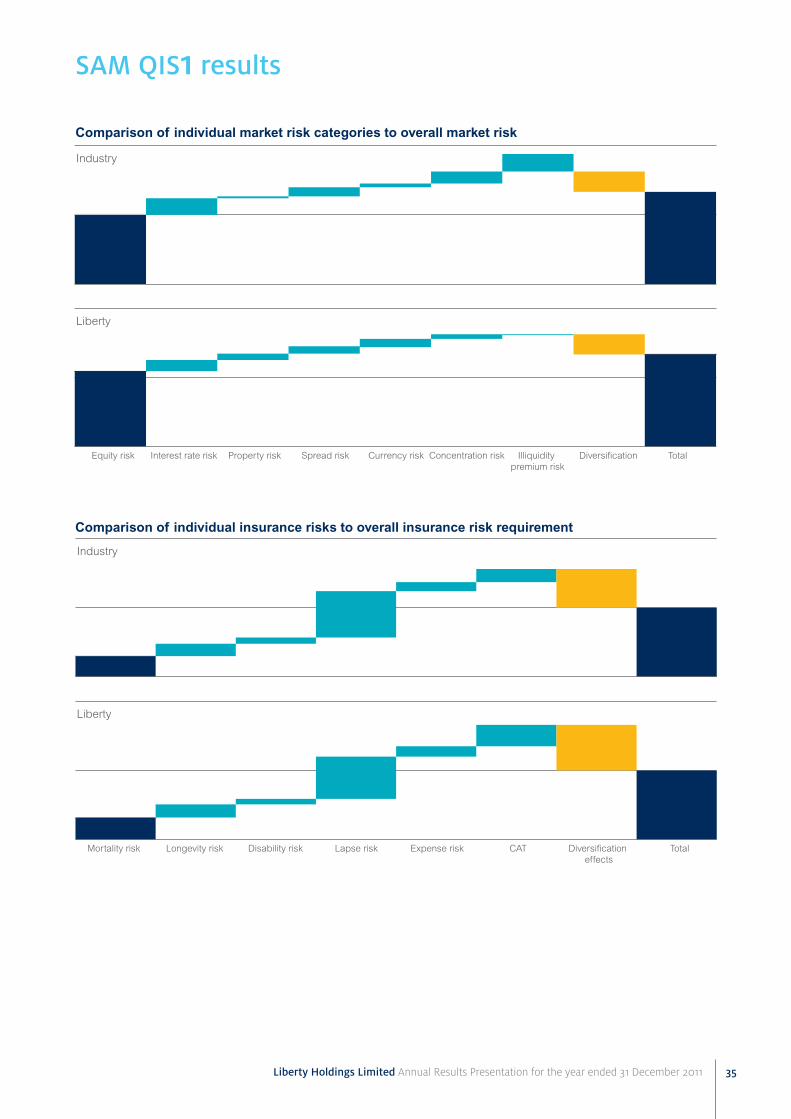
Liberty Holdings Limited Annual Results Presentation for the year ended 31 December 2011 35
Comparison of individual market risk categories to overall market risk
SAM QiS1 results
Equity risk Interest rate risk Property risk Spread risk Currency risk Concentration risk Illiquidity premium risk
Diversification Total
Industry
Liberty
Comparison of individual insurance risks to overall insurance risk requirement
Mortality risk Longevity risk Disability risk Lapse risk Expense risk CAT Diversification effects
Total
Industry
Liberty

Liberty Holdings Limited Annual Results Presentation for the year ended 31 December 2011 36
Long-term insurance – new business by distribution channel(1)
31 DecemberRm
Recurring premiums
Single premiums
Indexed premiums
Total premiums
2011 2010 2011 2010 2011 2010 2011 2010
Retail 4 201 3 770 13 198 9 960 5 521 4 766 17 399 13 730
Broker 1 119 1 043 4 864 3 185 1 605 1 362 5 983 4 228
Bancassurance 1 650 1 421 3 748 2 836 2 025 1 705 5 398 4 257
Tied channels(2) 1 211 991 4 339 3 780 1 645 1 369 5 550 4 771
Other 221 315 247 159 246 331 468 474
Corporate 558 458 1 058 1 209 664 579 1 616 1 667
Broker 317 160 552 543 372 214 869 703
Bancassurance 8 13 8 13 8 13
Tied channels(2) 89 110 281 288 117 139 370 398
Other 144 175 225 378 167 213 369 553
Total new business 4 759 4 228 14 256 11 169 6 185 5 345 19 015 15 397
(1) Includes premium escalation for Retail SA; excludes STANLIB multi-manager.(2) Tied channels include Agency, Franchise and Liberty@work.
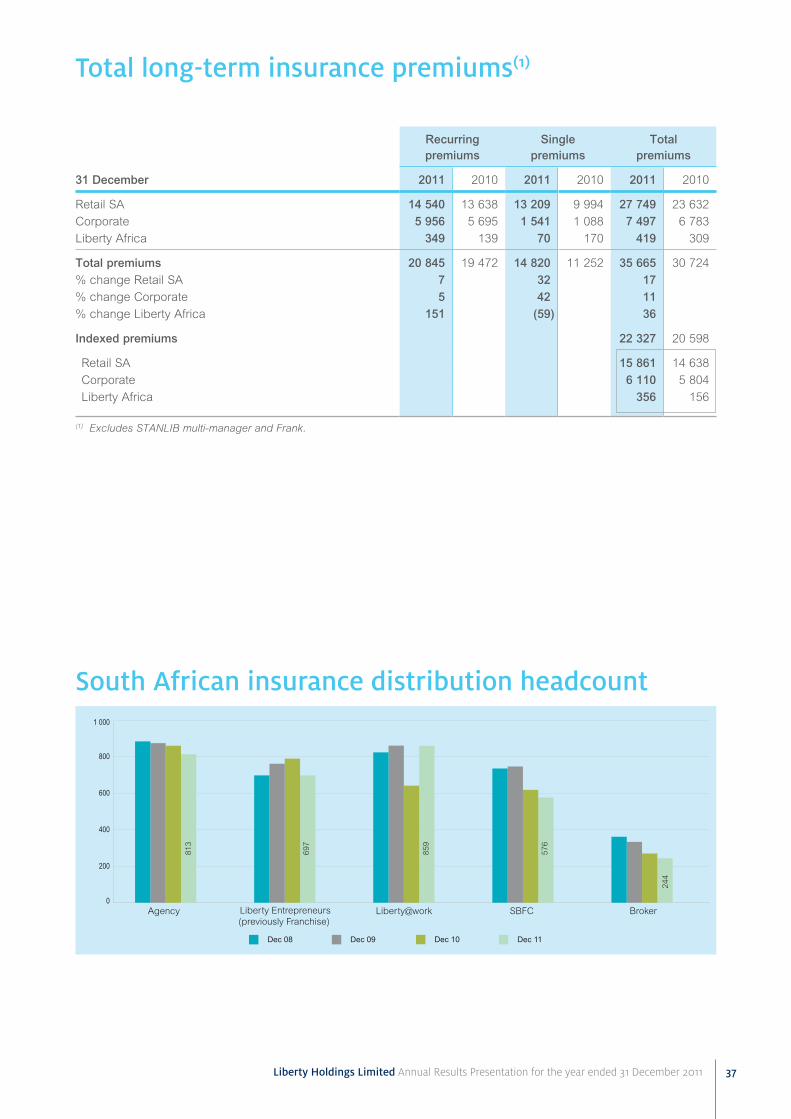
Liberty Holdings Limited Annual Results Presentation for the year ended 31 December 2011 37
total long-term insurance premiums(1)
Recurring premiums
Single premiums
Total premiums
31 December 2011 2010 2011 2010 2011 2010
Retail SA 14 540 13 638 13 209 9 994 27 749 23 632
Corporate 5 956 5 695 1 541 1 088 7 497 6 783
Liberty Africa 349 139 70 170 419 309
Total premiums 20 845 19 472 14 820 11 252 35 665 30 724
% change Retail SA 7 32 17% change Corporate 5 42 11% change Liberty Africa 151 (59) 36
Indexed premiums 22 327 20 598
Retail SA 15 861 14 638
Corporate 6 110 5 804
Liberty Africa 356 156
(1) Excludes STANLIB multi-manager and Frank.
Agency Liberty@workLiberty Entrepreneurs(previously Franchise)
SBFC Broker0
200
400
600
800
1 000
Dec 09Dec 08 Dec 11Dec 10
813
697
859
576
244
South African insurance distribution headcount

Liberty Holdings Limited Annual Results Presentation for the year ended 31 December 2011 38
negative rand reserves(1) – Retail SA
31 December2011
Rm2010
Rm
Published IFRS basis 15 756 14 880
Statutory basis 10 336 10 511
(1) Gross of taxation.
LibFin – Shareholders investment portfolio percentage allocation
31 December 2011 31 December 2010
Assets backing
capital
Assets backing
life funds
90:10exposure Total
Assets backing
capital
Assets backing
life funds
90:10exposure Total
Local equities 2 4 9 15 10 1 12 23Local bonds, cash and property 29 26 5 60 22 25 6 53Local preference shares 7 7 9 9Foreign assets 7 6 5 18 11 4 15
Total 45 36 19 100% 52 26 22 100%
Taxation note:The taxation treatment of income derived from assets backing capital is the normal taxation rules applicable to life investment portfolios. The taxation applicable to income derived from assets backing life funds and the 90:10 exposure is determined by the tax rates pertaining to each life tax fund to which the assets are allocated (I-E tax). In addition there is transfer tax at 28% on the net surplus, after the applicable I-E tax.
Maintenance costs per policy – Retail SA
31 December 2011 2010
Valuation basis – RComplex 400 363
Simplex 200 182
Annuities 200 182
Complex including project capacity 416

Liberty Holdings Limited Annual Results Presentation for the year ended 31 December 2011 39
Long-term policyholder liabilities iFRS reconciliation
31 December2011
Rm2010
Rm
Policyholder liabilities at beginning of the year net of reinsurance(1) 197 031 183 512
Additions through business acquisitions 1 068 3
Transfers to policyholder liabilities 9 399 13 519
Net premium income from insurance contracts 26 050 22 113
Net inflows from investment contracts 9 661 8 819
Net premium income and inflows from investment contracts 35 711 30 932
Investment returns 16 781 24 384
Claims, policyholder benefits and payments (31 721) (31 205)
Acquisition costs (2 902) (2 665)
Management expenses and finance costs (5 343) (4 774)
Taxation (1 250) (1 441)
Operating profit from insurance operations (1 877) (1 712)
Foreign currency translation reserve 165 (3)
Policyholder liabilities at end of period net of reinsurance 207 663 197 031
Reinsurance assets 902 847
Policyholders liabilities at end of period as published 208 565 197 878
(1) 2010 opening balance restated for R756 million deferred tax resulting from the adoption of the IAS 12 Amendment.
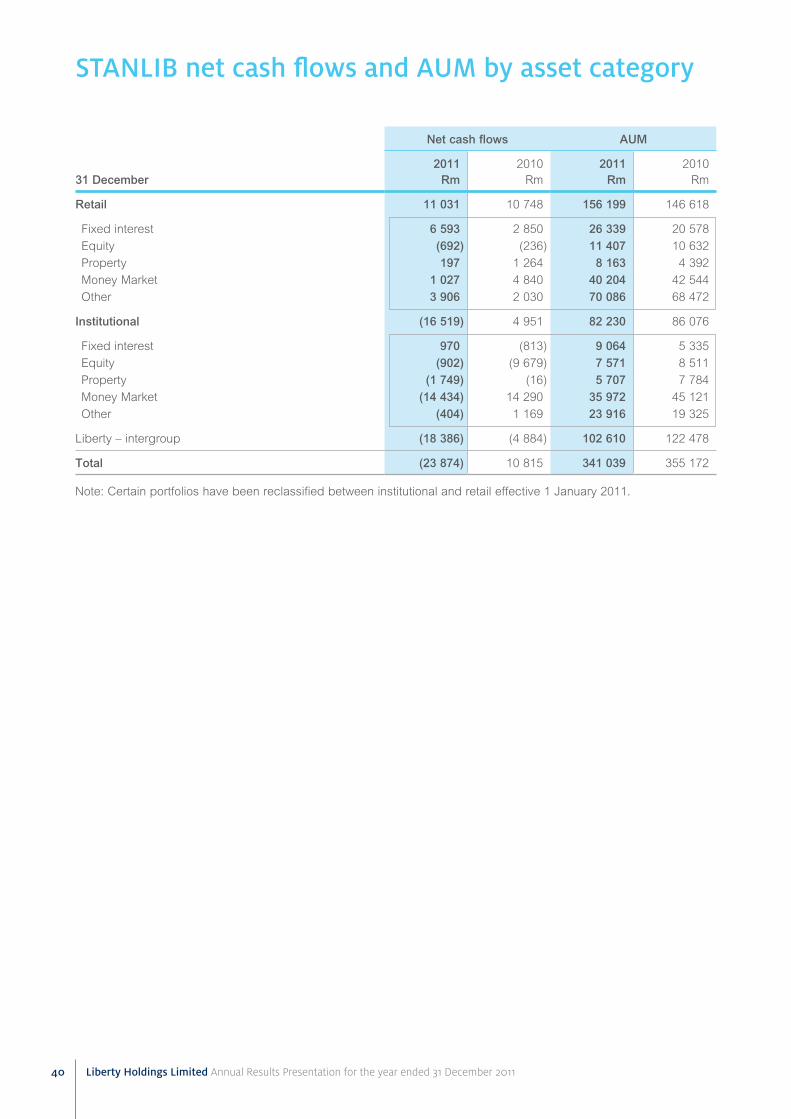
Liberty Holdings Limited Annual Results Presentation for the year ended 31 December 2011 40
StAnLib net cash flows and AUM by asset category
Net cash flows AUM
31 December2011
Rm2010
Rm2011
Rm2010
Rm
Retail 11 031 10 748 156 199 146 618
Fixed interest 6 593 2 850 26 339 20 578
Equity (692) (236) 11 407 10 632
Property 197 1 264 8 163 4 392
Money Market 1 027 4 840 40 204 42 544
Other 3 906 2 030 70 086 68 472
Institutional (16 519) 4 951 82 230 86 076
Fixed interest 970 (813) 9 064 5 335
Equity (902) (9 679) 7 571 8 511
Property (1 749) (16) 5 707 7 784
Money Market (14 434) 14 290 35 972 45 121
Other (404) 1 169 23 916 19 325
Liberty – intergroup (18 386) (4 884) 102 610 122 478
Total (23 874) 10 815 341 039 355 172
Note: Certain portfolios have been reclassified between institutional and retail effective 1 January 2011.

Liberty Holdings Limited Annual Results Presentation for the year ended 31 December 2011 41
StA
nLi
b A
UM
bre
akdo
wn
by s
ourc
e an
d as
set
type
Rm
Mo
ney
mar
ket
(in
cl
cash
)F
ixed
inte
rest
Eq
uity
Pro
per
tyO
ther
Ab
solu
tere
turn
Bal
ance
dIn
ter-
nat
ion
alS
tru
c-tu
red
Ret
ail
life
LIS
PT
ota
l
Dec
emb
er 2
011
Ret
ail
Col
lect
ive
Inve
stm
ents
25
583
9 5
76
4 9
74
1 3
50
8 2
17
3 9
30
53
630
Lin
ked
Inv
estm
ent
and
Str
uctu
red
Pro
duc
ts
5
3 48
6 5
3 48
6 M
oney
mar
ket
40
204
40
204
Mul
ti-m
anag
er C
olle
ctiv
e In
vest
men
ts
7
56
1 8
31
3 1
89
1 2
00
1 9
03
8 8
79
Inst
itutio
nal
Seg
reg
ated
fun
ds
279
9
064
7
571
5
707
1
56
239
7
274
1
360
3
1 65
0 M
ulti-
man
ager
fun
ds
14
608
14
608
Mon
ey m
arke
t 3
5 97
2
3
5 97
2 L
iber
ty –
inte
rgro
up
6 6
72
21
953
40
095
1 3
55
695
7
032
8
295
1
5 00
2 1
511
1
02 6
10
ST
AN
LIB
to
tal
83
127
57
356
59
073
15
225
85
1 9
821
2
5 68
9 2
0 29
2 1
511
1
4 60
8 5
3 48
6 3
41 0
39
Dec
emb
er 2
010
Ret
ail
Col
lect
ive
Inve
stm
ents
20 5
7710
632
4 39
21
816
4 95
14
738
47 1
06
Lin
ked
Inv
estm
ent
and
Str
uctu
red
Pro
duc
ts47
935
47 9
35
Mon
ey m
arke
t42
545
42 5
45
Mul
ti-m
anag
er C
olle
ctiv
e In
vest
men
ts42
22
036
3 08
471
71
949
824
9 03
2
Inst
itutio
nal
Seg
reg
ated
fun
ds
4 91
36
475
4 70
01
186
467
222
2 84
527
387
Mul
ti-m
anag
er f
und
s13
568
13 5
68
Mon
ey m
arke
t45
121
45 1
21
Lib
erty
– in
terg
rou
p5
839
26 1
5345
170
1 32
548
412
889
8 52
911
337
10 7
5212
2 47
8
ST
AN
LIB
to
tal
93 5
0552
065
64 3
1313
501
1 67
015
468
22 6
5119
744
10 7
5213
568
47 9
3535
5 17
2

Liberty Holdings Limited Annual Results Presentation for the year ended 31 December 2011 42
StAnLib retail investment performance
31 December2011
Rm2010
Rm
Opening market value 29 005 22 347Net inflows 5 397 6 480Capital appreciation 4 340 178
Closing market value 38 742 29 005
Segregated funds 27 813 18 409Unit trusts 1 638 1 295Money market 9 291 9 301
Total AUM 38 742 29 005
STANLIB core retail range ranking per quartile(1)Rolling period
31 December 2011Fund name 6 Month 12 Month 3 Year 5 Year
STANLIB SA Equity 2 1 3 4STANLIB Equity 1 1 2 4STANLIB Growth 1 2 4 4STANLIB Value 1 2 3 2STANLIB Balanced 3 1 1 2STANLIB Balanced Cautious 2 1 1 –STANLIB Managed Flexible 2 3 4 4STANLIB Inflation Plus 3% 1 2 4 3STANLIB Bond 1 1 2 2STANLIB Income 1 2 1 1Standard Bank Money Market 3 3 2 3STANLIB Flexible Income 2 1 2 1STANLIB Property Income 1 2 1 1STANLIB Dynamic Return 2 2 2 2STANLIB Aggressive Income 1 1 1 1
(1) Source Morningstar
StAnLib institutional investment performanceRolling period
31 December 2011STANLIB survey funds ranking per quartile(1) 3 Month 12 Month 3 Year 5 Year
Large Manager – Global 2 2 2 3Full Global Mandate 2 1 2 4Large Manager – Domestic 2 1 2 3Domestic Only Mandate 3 2 2 4Money Market 3 3 1 –STANLIB Core Bond 1 1 2 2STANLIB Institutional Property 1 1 1 1Absolute Return 2 4 4 4 Domestic Absolute Returns 1 4 4 4 STANLIB Core Equity 4 1 1 2STANLIB Growth Equity 1 1 4 –STANLIB Enhanced Index 1 4 4 2STANLIB Research 1 3 3 2STANLIB Value 2 2 1 1
(1) Source Alexander Forbes
Liberty Africa – AUM

Liberty Holdings Limited Annual Results Presentation for the year ended 31 December 2011 43
Liberty Africa – AUM by geographical location
31 December2011
Rm2010
Rm
Southern Region(1) 19 024 18 338
Cash 8 908 8 905
Equity 936 893
Income 517 222
Property 175 160
Segregated 8 488 8 158
Eastern Region(2) 19 718 10 667
Cash 383 396
Equity 10 20
Segregated 19 325 10 251
Total AUM 38 742 29 005
CombinedCash 9 291 9 301
Equity 946 913
Income 517 222
Property 175 160
Segregated 27 813 18 409
38 742 29 005
(1) Southern region = Botswana, Swaziland, Lesotho and Namibia.(2) Eastern region = Kenya, Tanzania and Uganda.
