liberty kenya holdings limited kenya... · notice is hereby given that the 10th annual general...
TRANSCRIPT
For the year ended 31 December 2014
Annual Report and Financial Statements
Liberty Kenya Holdings Limited

Notice of annual general meeting 2
Group information 3
Chairman’s statement 4 - 12
Members of the Board of Directors 12 - 14
Corporate Governance Report 15 - 17
Directors’ report 18
Statement of directors’ responsibilities 19
Financial highlights 20 - 21
Report of the independent auditor 22 - 23
Financial Statements
Consolidated and Company statement of profit or loss 24
Consolidated and Company statement of other comprehensive income 25
Consolidated and Company statement of financial position 26
Consolidated statement of changes in equity 27 - 28
Company statement of changes in equity 29
Consolidated and Company statement of cash flows 31 - 101
Shareholding 102
Proxy form 103
Table of Contents
3ANNUAL REPORT & FINANCIAL STATEMENTS 2014

NOTICE OF ANNUAL GENERAL MEETING
Notice is hereby given that the 10th Annual General Meeting of the members of Liberty Kenya Holdings Limited will be held on Thursday 11th June 2015, at The Sarova Stanley Hotel Nairobi, at 11.00 a.m. to transact the following business:
• To table the proxies and note the presence of a quorum.• To read the notice convening the meeting.• To receive, consider and if approved, adopt the Annual Report and the Audited Financial Statements for the year
ended 31st December 2014, together with the Chairman’s, Directors’ and Auditors’ Report thereon.• To declare a dividend of Kenya Shillings forty cents (Kes 0.40/-) per share for the year ended 31st December 2014. • To elect Directors: In accordance with Article 111 of the Company’s Articles of Association, Dr Susan Mboya-Kidero, retires by rotation
and offers herself for re-election. • To approve the Directors’ remuneration for the year ended 31st December 2014 as provided in the Financial
Statements.• To note that Messrs PricewaterhouseCoopers retired from office in November 2014 and to appoint KPMG as the
auditors under Section 159(2) of the Companies Act and to authorise the Directors to fix their remuneration for the ensuing year.
• Any other business of the company of which due notice has been given.
By order of the Board
Caroline KioniCompany SecretaryP O Box 30390-00100NAIROBI
Date: 12th May 2015
NOTE:
1. In accordance with section 136(2) of the Companies Act every member entitled to attend and vote at the above meeting and any adjournment thereof is entitled to appoint a proxy to attend and vote on his/her behalf. A proxy need not be a Member of the Company.
2. A form of proxy may be obtained from the Company’s Share Registrar, Comprite Kenya Limited, Crescent Business Centre, The Crescent off Parklands Road opp. MP Shah Hospital, Nairobi, the Company’s registered office, Liberty House, Processional Way/Mamlaka Road Nairobi or the Company’s website www.libertykenya.co.ke. To be valid, the form of Proxy must be duly completed by the member and returned to the Share Registrar Comprite Kenya Limited, Crescent Business Centre, The Crescent off Parklands Road opp. MP Shah Hospital, Nairobi, not later than 11.00 a.m. Tuesday 9th June 2015. In the case of a body corporate the Proxy must be under its seal.
2 ANNUAL REPORT & FINANCIAL STATEMENTS 2014
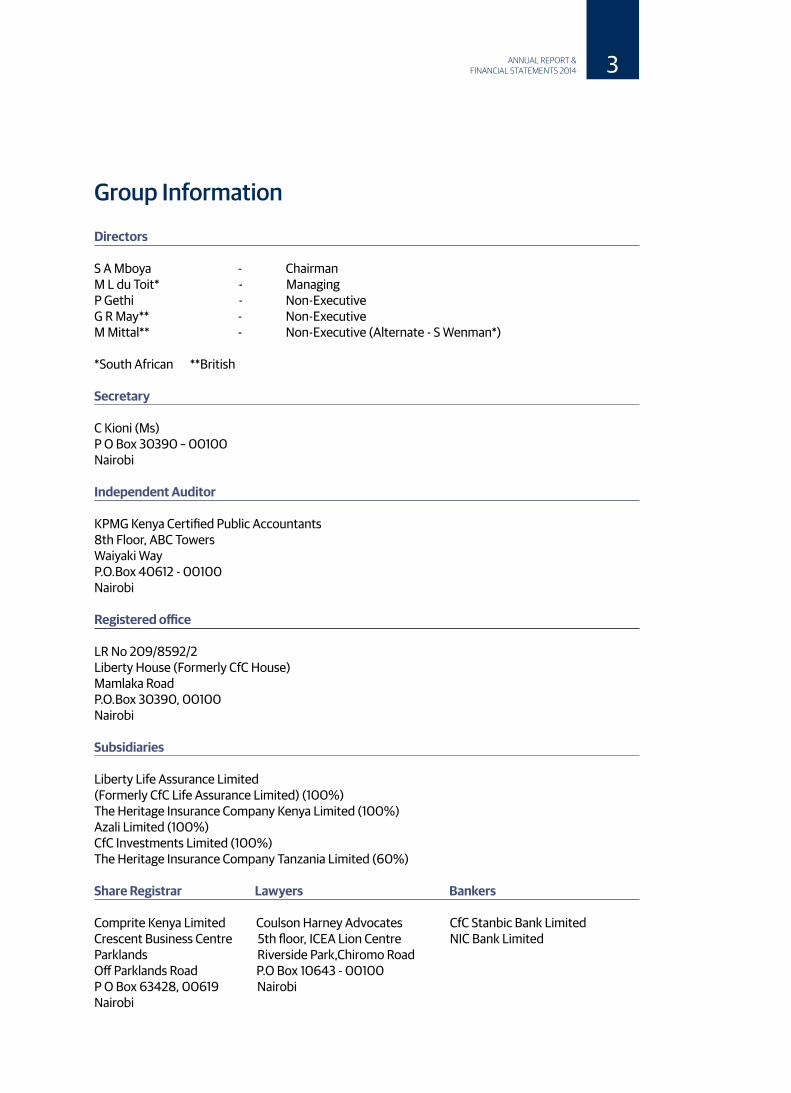
Group Information
Directors
S A Mboya - ChairmanM L du Toit* - ManagingP Gethi - Non-ExecutiveG R May** - Non-Executive M Mittal** - Non-Executive (Alternate - S Wenman*) *South African **British
Secretary
C Kioni (Ms) P O Box 30390 – 00100 Nairobi Independent Auditor
KPMG Kenya Certified Public Accountants8th Floor, ABC TowersWaiyaki WayP.O.Box 40612 - 00100Nairobi
Registered office
LR No 209/8592/2 Liberty House (Formerly CfC House) Mamlaka RoadP.O.Box 30390, 00100Nairobi
Subsidiaries
Liberty Life Assurance Limited (Formerly CfC Life Assurance Limited) (100%) The Heritage Insurance Company Kenya Limited (100%) Azali Limited (100%) CfC Investments Limited (100%) The Heritage Insurance Company Tanzania Limited (60%)
Share Registrar Lawyers Bankers
Comprite Kenya Limited Coulson Harney Advocates CfC Stanbic Bank LimitedCrescent Business Centre 5th floor, ICEA Lion Centre NIC Bank Limited Parklands Riverside Park,Chiromo RoadOff Parklands Road P.O Box 10643 - 00100P O Box 63428, 00619 NairobiNairobi
3ANNUAL REPORT & FINANCIAL STATEMENTS 2014
Chairman’s statement
As we go into the second year of our five-year financial and business target period, we can look back at 2014 as a successful year. It is my pleasure to present the annual report and financial statements for Liberty Kenya Holdings Limited (“Liberty Kenya”) for the year ended 31 December 2014.Our business has never been in a better position to deliver on the promises included in our strategic plans.
Group structure Liberty Kenya is a subsidiary of South African-based Liberty Holdings Limited, which is in turn majority owned by the Standard Bank Group, also of South Africa. Whilst Liberty Kenya is listed on the Nairobi Securities Exchange, both its immediate and ultimate majority shareholders are listed on the Johannesburg Stock Exchange in South Africa.Liberty Kenya owns subsidiaries that engage in both short term and long term insurance business. Through its two operating entities, Liberty Life Assurance Kenya Limited (Liberty Life) and The Heritage Insurance Company Kenya Limited (Heritage), the Group continues to be a key player in the insurance sector, both in Kenya and Tanzania. The Group’s interest in Tanzania is through a 60% shareholding in Heritage Insurance Company Tanzania Limited.
2014 Economic Environment and outlook for 2015
Despite setbacks, an uneven global recovery continues. Largely due to weaker-than-expected global activity in the first half of 2014, the growth forecast for the world economy has been revised downward to 3.3 percent for this year. Downside risks have increased over the latter part of the year. Short-term risks include a worsening of geopolitical tensions and a reversal of recent risk spread and volatility compression in financial markets. Medium-term risks include stagnation and low potential growth in advanced economies and a decline in potential growth in emerging markets.
On the domestic scene, the Kenyan economy remained resilient. Key growth drivers in the year included declining fuel & electricity prices, increased government spending on infrastructure, moderate credit growth as well as a stable macroeconomic environment. Growth was, however, dampened by low tourist numbers due to security lapses and the slow-down in the Euro-zone economy, Ebola threats as well as weak horticultural and tea earnings. The fourth quarter is expected to record higher growth mainly on account of lower oil and power costs, stable macros and increased infrastructure spend. The recovery of the global economy should also lead to more foreign direct investment into the country. The World Bank has projected that Kenya’s economy will expand by 6% in 2015, but sluggish transmission of lower oil prices locally could reduce anticipated growth to 5.6%. Kenya’s economy was rebased in the year. This led to a revision of GDP in 2013 from USD 42.6 billion to USD 53.4 billion.Kenya’s GDP was estimated to be 25 percent bigger after the authorities changed the base calculation year to 2009 from 2001, sending the East African nation into the continent’s top 10 economies.
Headline inflation dropped from 6.6% to 6.02% in the fourth quarter 2014 mainly on account of lowerfood, power and transport prices. Headline inflation averaged 6.9% in 2014, well within the Central Bank of Kenya’s upper target of 7.5%. Non-food, non-fuel inflation remained below 5% in 2014 indicating that the monetary policy was effective in containing demand driven inflation. There has also been a decline in the rate of credit growth in the economy. Global oil prices recorded a steep decline in 2014, dropping by over 50% to touch a 5 year price low. This translated into lower local pump prices. Barring a major global oil prices recovery in 2015, it is estimated that the average inflation will be in the range of 6% – 7%.With respect to interest rates, in the fourth quarter of the year, the 91 day T-Bill marginally went up from 8.3% to 8.5% while the 182 day T-Bill rose by 0.9% to 9.5%. The 364 day T-bill was stable. The Central Bank of Kenya held the Central Bank Rate unchanged, at 8.5% in 2014.
4 ANNUAL REPORT & FINANCIAL STATEMENTS 2014
Chairman’s statement (continued)
The need to support economic growth and a subdued inflationary environment supported its decision. Lower inflationary pressures and high liquidity in the domestic markets following reduced domestic borrowing by Treasury were key drivers of lower interest rates in the second half of the year. The successful issuance of the 175 Billion Eurobond supported a stable environment. The Kenya Bank’s Reference Rate (KBRR) framework was introduced in the year. It is expected to improve transparency on loan pricing and promote full disclosure of bank charges on new loans. KBRR is likely to gradually reduce commercial lending rates in the long term and expand credit growth. Anchored inflation expectations and lower domestic borrowing point to continued stability. Exchange rate depreciation remains a key risk to the outlook. Government bonds recorded positive performance in 2014. The Government bond yield curve corrected downwards by an average of 0.5% across all tenors. Lower inflationary pressures, an accommodative monetary policy stance and less pressure on domestic borrowing supported a moderate downward trend. The expectation is that yields are likely to stabilize in 2015 with a bias for a slight uptick towards the end of the fiscal year. Actual tax revenues and Government spending requirements may influence the quantum of funds Treasury is to raise domestically and thereby dictate the direction of the interest rates.
The equities market held gains made during the year to post a positive performance for the third consecutive year. A positive economic outlook and stable macro-economic variables supported market performance. Sustained global appetite for risk and increased allocation by foreign funds into frontier regions sustained performance. The NASI and NSE 20 indices climbed 19.3% and 4.1% to 162.8 and 5,112.6 points at year end respectively. Market capitalization rose from Shs 1,920.7 Billion to Shs 2,300.05 Billion in 2014. Equity turnover rose by 38.51% to Shs 215 Billion from Shs 155 Billion posted in 2013.The market rally has been driven by positive investor expectations of the medium term economic growth outlook for the Kenyan and East African economies.
The Kenyan Shilling had mixed performance in 2014 against most global currencies. It depreciated by 4.8% in 2014 against the US dollar to close at Shs 90.60 and appreciated by 6.5% and 8% against the Rand and Euro respectively. The currency remains vulnerable given the global strengthening of the dollar, rising import demand especially for infrastructural related expenditures, a decline in tourism revenue and depressed tea prices and widening trade deficit. CBK is expected to remain active in Open Markets Operations to stem currency volatility. Import cover has remained above the 4 months statutory requirement in the quarter. An increase in Diaspora remittances and portfolio flows are likely to support the currency in an environment of a bearish view on shilling. Going into 2015, the Shilling is expected to maintain a bearish trend in the near term based on the current environment.
Group Financial highlights
The Group reported a profit after tax of Shs 1,149 Million for the twelve months ended December 31, 2014, which is an improvement of 4% on the previous year’s Shs 1,106 Million. These satisfactory results were delivered despite volatile market conditions and the significant investment required in our branding activities and distribution networks. We also made significant progress towards our strategic targets. Among the year’s highlights was the rebranding of the life insurance subsidiary from CfC Life Assurance to Liberty Life Assurance Kenya Limited, a change that has been very well received by the our business partners.
Our core business is risk taking. Risk-taking however, requires a solid base of risk capital exactly for the moment when you have to be able to absorb large losses. Our target capital structure is designed to achieve exactly that. we maintained our underwriting discipline and decisively addressed problematic areas in our Life & Health business and took important steps to ensure our future sustainability.
5ANNUAL REPORT & FINANCIAL STATEMENTS 2014

Chairman’s statement (continued)
The combination of our commitment to implementing global principles, discipline in underwriting standards and managing increased capital discipline continues to be key considerations in our business model. Liberty Kenya’s performance in 2014 was reassuringly sound across our main business areas with good underlying momentum in areas of targeted growth and investment. Both Kenyan subsidiaries continued to show strong performance as a consequence of sound underwriting and claims management, improvements to distribution channels, introduction of differentiated products, identification of new alternative distribution channels, process re-engineering, management of costs and use of new and enhanced technology to drive improvements in service delivery and value proposition to our customers and intermediaries. Although the 2014 results were negatively affected by an increased expense base due to the investment the subsidiaries had to make in rebranding, process improvements and enhanced distribution networks, I believe that these were necessary and position the businesses well to take advantage of emerging business opportunities.
The contribution to profits from our asset base remains significant despite the challenging investment environment. We are convinced that a well-diversified asset allocation is the safest way to achieve a good risk /return profile even in those circumstances.
Key Achievements for the year under review are summarised as follows:
• Profit after tax for the year 2014 was Shs 1.15 Billion compared to Shs 1.105 Billion for 2013, a 3.9% increase.
• Gross earned premium revenue at Shs 8.0 Billion up 8.6% from Shs 7.4 Billion.
• Investment income at Shs 2.97 Billion up 12.9% from Shs 2.60 Billion.
• Net insurance benefits and claims at Shs 3.5 Billion up 12.3% from Shs 3.1 Billion.
• The Group maintained a strong statement of financial position increasing its total asset base by 6% from Shs 31.5 Billion to Shs 33.2
Billion.• Both Liberty Life and Heritage show strong
solvency levels at 1.7x and 2.9x respectively
The strengthening of the Group balance sheet over the past few years provides us with an appropriate foundation on which to transition during 2015 to a more robust capital manage-ment model that will ensure efficient utilization of capital with the consequent benefits to all our stakeholders.
Short Term Business – The Heritage Insurance Company Kenya Limited
The Group’s short term business is managed in Kenya through The Heritage Insurance Company Kenya.The Company underwent significant changes on the operational side through the rolling out of a number of strategic projects, which included a strong focus on improving service levels to our intermediary network and our direct business clients. Broadly the Company’s main focus in 2014 was: grow through diversification, manage the risk pool and drive system efficiencies. There is a delicate balance between growing premium income, maintaining margins and retaining clients. This year the Company set some ambitious strategic goals, among them achieving an underwriting margin of 10%. In spite of the challenging business environment, the Company achieved a margin of 9.6% and we are confident that we shall surpass the target ratio in the coming years. As the Liberty Group expands into more African countries, this will present the Group with the ability to tap into market opportunities and growth prospects which arise.
Our challenges as an established industry player are to fight complacency, stay agile and continue improving our efficiencies to compete in an industry where new entrants can start operating in their chosen segments. Therefore, the Company has continued to focus on growth through diversification, managing the risk pool and driving system efficiencies.
6 ANNUAL REPORT & FINANCIAL STATEMENTS 2014
Chairman’s statement (continued)
While the traditional intermediated business through brokers remains the core of our Company, we are taking the necessary actions to grow business from other channels including agents, bancassurance and franchising. With respect to risk management, we continued to refine our risk management processes. On the system’s front, the Company’s focus is geared towards operational efficiency. This reduces claims costs, helps us deliver on our brand promise and creates benefits for our clients and intermediaries. Spending on current projects will continue in 2015 and we anticipate that the full benefits will start to accrue from the latter part of the year. These initiatives will ensure the Company remains relevant and competitive against existing and new market entrants.
The Company achieved positive underwriting results in a financial year characterised by continued pressures on premium rates. Overall profit before tax stood at Shs 702 Million (2013 – Shs 711 Million). The net profit after taxation decreased marginally from Shs. 537 Million in December last year to Shs. 514 Million this year. The decrease from last year was mainly attributed to the slight worsening in the claims experience and increased management expenses arising from the initiatives that the Company has undertaken during the year.
Premium growth continued to build on the solid performance of 2013, with gross written premium for the Company increasing by 13.5% (2013: 4.2%), from Shs 3.55 Billion to Shs 4.027 Billion. Positive growth was achieved across all significant insurance classes. With respect to underwriting margins, the Kenyan short-term insurance market is highly competitive and the relatively soft market conditions contribute to generally poor underwriting margins. The “typical” short-term insurers in Kenya have traditionally generated an average underwriting margin of between 4% and 6% through the cycles. Heritage’s continued focus to optimise our claims processes and our diversified business lines ensured that the Company achieved a 9.6 % net underwriting margin in these challenging underwriting conditions.
With a slightly worsened claims ratio of 40.7% (2013: 37.6%), the Company’s underwriting profit decreased from Shs 310 Million in 2013 to Shs 201 Million in 2014. The Company has put robust measures in place to manage the levels of both the claims costs and management expenses. It should however be noted that the Company’s average claims ratio of 40.7% is well below the industry average of 59.7%.
Investment and other income at Shs.514.2 Million (2013:Shs. 419.3 Million) was 22.7% above the prior year. Investment income comprises interest, dividends, realised and unrealised investment gains and foreign exchange differences. The increase was partly due to higher dividend from the Company’s Tanzanian subsidiary and profit realised on the disposal of Shares in an unquoted company. This disposal was motivated by the fact that the investment was not aligned to the Company’s strategic and capital management objectives.
The Company paid an interim dividend of Shs 230 Million. The Board did not recommended payment of a final dividend in order to preserve capital for business growth and improvement of the robustness of the capital structure. The Company’s Solvency Margin has remained well above the regulatory requirement at 2.9X. This is well within our targeted solvency range and represents a sound capital position given our economic and risk capital requirements
In June 2014 Heritage maintained its A+ (A plus) Claims paying ability Credit Rating from Global Credit Rating Company. The current outlook is stable. The rating is based on Heritage’s position as an established top-tier player in the domestic insurance market, underpinned by its direct affiliation with the Liberty Group which provides operational support on an on-going basis, sound profit retention, adherence to stringent claims management protocols among other factors.
7ANNUAL REPORT & FINANCIAL STATEMENTS 2014

Chairman’s statement (continued)
Long Term Business – Liberty Life Assurance Company Kenya Limited
The operating environment changed for the better with the Company’s efforts shifting to its brand, processes and customer value proposition. The Company’s focus is now on the growth initiatives. As part of these tactical growth plans, new products were introduced during the year whilst efforts to grow profitably in non-traditional market segments were intensified. In a bid to enhance its customer value proposition, the Company launched the triple payment diamond plan, a retail product as well as the unitised “Boresha Maisha” pension plan. These two products signify Liberty Life’s continued responsiveness to the needs of the market.
The Company rebranded and changed its name to Liberty Life Assurance Kenya Limited in October 2014. This marked the culmination of a brand alignment exercise that started in the year 2011 and the Company will use this to reposition itself as the trusted insurance services provider in this market.
Overall, the Company registered a 40% increase in net profit, from Shs. 416.5 Million in 2013 to Shs 584.8. Million in 2014. This was mainly driven by good premium volumes and close management of expenses.
Total premiums at Shs. 4.4 Billion were 4.7% above prior year. New business at Shs. 685 Million was 26% above prior year. Group Life business recorded the highest growth compared to pensions and retail business. Management continues to monitor execution of the pension’s strategy in the New Year with focus on retaining the existing book and growing the new unitized pension product.
The Company made a net investment income of Shs 2.3 Billion, 10% rise compared to similar period last year. The increase is mainly attributed to an increase in fair value gains of Shs 122 Million over prior year and dividend income increase of
Shs 70 Million over prior year as a result of the increase in the equity portfolio.
Policy holder benefits at Shs 4.65 Billion, was 3.9% above prior year. These benefits comprise benefits payable in the year (incurred Claims, surrenders, maturities) as well as actuarial provisions (Funds set aside to secure future policy holder obligations). Actuarial provisions amounted to 42% of the total while the rest was incurred claims. The overall policy holder benefits incurred ratio was 63%, an improvement over the prior year ratio of 67%.
Management and commission expenses for the period to 31 December 2014 stood at Shs 1.32 Billion against prior year’s Shs 1.11Billion. The key driver to the increase compared to prior year was one off costs arising from the rebranding exercise.
Total assets grew to Shs 22.8 Billion from Shs 18.1 Billion in 2013, attributed to the increase in the value of our invested assets. Shareholders’ funds have grown by 26% in 2014 compared to 2013 to hit Shs 1.92 Billion. The growth has resulted from retained earnings.
Given the relatively good performance the statutory solvency position for the Company improved in 2014 to a multiple of 1.73 times the minimum specified by the Insurance Act. The Company’s strong solvency position gives comfort to our existing and potential customers that we are adequately capitalized to weather reasonable market volatility.
8 ANNUAL REPORT & FINANCIAL STATEMENTS 2014
Chairman’s statement (continued)
Business Performance in Tanzania - Heritage Insurance Company Tanzania Limited
Competition in the Tanzanian market continues to intensify as more players set up operations in the country. In spite of this, our subsidiary in Tanzania has remained focused in ensuring that sound underwriting practices are maintained. Consequently it is one of the few companies in the market that consistently reports an underwriting profit.
The Company reported a profit before tax of TShs 3,401 Million compared to Shs 1,690 Million in 2013. The underwriting surplus increased by 142% from TShs 419 Million in 2013 to TShs 1,014 Million in 2014 mainly driven by a good loss ratio and improved management of expenses.
Premiums written during the year decreased by 10% compared to 2013 -TShs 41.4 Billion compared to TShs 45.9 Billion written in 2013. Whilst the Company did not lose any significant accounts, the decrease was mainly attributed to huge reductions in the premium charged on some big accounts due to reductions in sums assured. The Company’s strategic action to protect the treaty results implies that the Company has to be selective in underwriting policies and hence the decline in premium for some classes of business, particularly fire, accident & marine.
The net loss ratio was at 46%, a significant improvement to the ratio recorded in 2013 of 52%. On the other hand the net commission expense was at TShs 1,685 Million, up by TShs 764 Million compared to the same period in 2013. This was mainly due to lower reinsurance commission in the fire class of business. Expenses are down by 1% compared to the same period in 2013 mainly due to robust monitoring.
Investment returns comprise interest & dividend income of TShs 2,169 Million, revaluation gain of TShs 2,108 Million and loss on disposal of shares in an associate, Strategis Insurance Company Tanzania Limited – TShs 1,387 Million. This represents an overall increase of 20% compared to last year excluding the capital loss
and revaluation gains. For strategic reasons, the Company sold its shareholding in an associate, Strategis Insurance Company Tanzania Limited during the course of the year.
The Company’s Solvency Margin at 59% was well above the regulatory requirement of 20% and the margin as at 31 December 2013 of 55%. The Company’s focus in the year 2015 will mainly be to strengthen its distribution networks and improve systems and processes. Compliance & Governance
The Board embraces good governance as a driver of culture and outperformance in the long term. There is increased focus by the Group on strengthening the various governance structures, treating customers fairly, ethical values, and strong capital and risk management. Compliance with best practice and regulatory requirements is enshrined within our value and governance structures in all the subsidiaries. The following are our key regulators:
• The Insurance Regulatory Authority of Kenya
• – the primary regulator of insurance businesses in Kenya
• The Retirement Benefits Authority (Kenya)• The Tanzanian Insurance Regulatory
Authority – the primary regulator of insurance businesses in Tanzania
• The Capital Markets Authority (Kenya).• The Nairobi Securities Exchange.
We have cordial relationships with all our key regulators as well as the respective revenue authorities. This is founded on our endeavor to strictly comply with the guidelines of our industry and regular open communication.
9ANNUAL REPORT & FINANCIAL STATEMENTS 2014

Chairman’s statement (continued)
Directorate
It is critical to all we do that we have the breadth and depth of experience on the Board necessary to provide effective governance and deal with challenges in the business environment. I am hugely encouraged by the quality of individuals we are able to identify and attract. As we continue to refresh the Board to take account of any available vacancy, we shall seek to add skills and experience complementary to those already on the Board in order to strengthen the range of oversight competences within the Board.
Human resources
These results are a reflection of a committed team of staff who believe that in delivering val-ue to our broad range of stakeholders, we will continue to build on the legacy of our Group. We shall continue to raise the skills of our hu-man capital, to empower them and to improve service standards across the Group. The Group’s total staff complement as at 31 December 2014 was 366 compared to 372 in 2013.
Outlook
The year ahead is bound to be equally challenging but the Group is very well placed. In an increasingly global and interconnected environment, we are well positioned to capture opportunities the market offers. We are equally well positioned to rise to meet challenges including the more over-arching challenges of premium undercutting and the insurance penetration gap. Our differentiated position, our strong capitalisation, our disciplined underwriting and, last but far from least, our strong client relationships are all the foundation of Liberty Kenya’s profitability. They are the key to our sustainability. During the first year of its 5-year strategic plan, the Group has put the structures in place to be able to deliver on the ambitious targets set for all its operating entities. We have made good progress in many areas. In particular, the Group expects to increase its retail
sales volumes by tapping into new markets by offering superior services whilst increasing its brand presence in selected Counties. Though primary growth will be realised organically, the Group is actively pursuing viable acquisition leads as a complementary expansion strategy. This notwithstanding, the customer remains central to Liberty Kenya’s customer value proposition - thus enhancing customer experience will remain focal in 2015. Management will expand premium collection through alternative distribution channels, leveraging on mobile technology platforms, product innovation as well as research and development. In addition to increasing the agency reach and deepening our relationship with the broker fraternity, partnerships with the banking sector especially will grow the Bancassurance book which remains very strategic in light of the high penetration levels achieved by the banking sector.
We are also seeking higher returns from our investment portfolio – without compromising investment discipline. We shall continuously review the investment mandates to ensure that the Group takes advantage of the robust investment climate expected to continue in 2015.
The Board of directors and I would like to thank all our employees for giving us the confidence to meet the numerous opportunities and challenges with optimism in 2015.
Dividend
The Directors propose a first and final dividend per share of Shs 0.40 (2013:Shs1).
10 ANNUAL REPORT & FINANCIAL STATEMENTS 2014

Chairman’s statement (continued)
Appreciation
I take this opportunity to express my sincere appreciation to our customers, shareholders, the Government and Regulators, suppliers and fellow board members for their dedicated contribution to the growth of the Group. All the achievements the Group has made would not be possible if we didn’t have the right talent and employees. Please join me in thanking them for their hard work, great engagement and strong 2014 results. Our people are the reason we have a seat at the table with our clients, brokers and business partners. They are also the force for delivering shareholders value.
delivering shareholder value.
S Mboya
Chairman8 April2015
11ANNUAL REPORT & FINANCIAL STATEMENTS 2014

The Board of Directors
From left to right
Mike Du Toit | Peter Gethi | Dr Susan Mboya | Gayling May
Carol Kioni (Company secretary) l Mukesh Mital
12 ANNUAL REPORT & FINANCIAL STATEMENTS 2014

Biographies of the Board of Directors
Susan Mboya
Dr Susan Mboya is the Chairman of the Company and the Group Director, Eurasia, Africa Group (EAG) for Women’s Economic Empowerment at Coca Cola. In this role, Susan is leading the Group’s deploy-ment of an initiative undertaken by the Coca-Cola Company from September 2010 to empower five million women entrepreneurs across the Coca-Cola System by 2020.
In May 2009, Dr Mboya was awarded a honorary Doctorate in Humanities from Lakeland College in Wisconsin, for her work on the Zawadi Africa Educational Fund. In December 2010 she was awarded the Elder of the Burning Spear (EBS), the highest civilian award from the Kenya Government in rec-ognition of her dedication and service to the Country’s youth through the Zawadi Africa Educational Fund. She Joined Liberty Kenya Board in 2012 and was appointed chairman on 29 November 2012.
Mike du Toit
Mr. Mike du Toit is the Company’s Managing Director and Liberty Africa Regional Managing Director for East Africa responsible primarily for strategic growth initiatives. He joined Liberty in 2010. Prior to this he was Managing Director of CfC Stanbic Bank Limited having led the merger of the Stanbic and CfC Groups.
As a career banker, he has extensive experience in the financial services field across sub-Sahara Africa having worked and lived in, amongst others Botswana, Mozambique, South Africa and Uganda.
He also sits on the Boards of Heritage Insurance Company Kenya Limited, Liberty Life Assurance Ken-ya Limited, The Heritage Insurance Company Tanzania Limited, Liberty Life Assurance Uganda Limit-ed and both STANLIB Kenya Limited and STANLIB Uganda Limited.
Gayling May
Mr. Gayling R. May, who was appointed to the Board in December 2009, has an extensive account-ing background having worked for PricewaterhouseCoopers in various countries for 37 years. He is a Fellow of The Institute of Chartered Accounts in England and Wales (FCA), a member of the Institute of Certified Public Accountants of Kenya (CPA) and a member of the Institute of Certified Public Sec-retaries of Kenya (CPS). He holds directorships in Swissport Kenya Limited, British American Tobacco Kenya Limited, Liberty Life Assurance Company Kenya Limited, Heritage Insurance Company Kenya Limited, Liberty Kenya Holdings Limited, CfC Stanbic Bank Limited and CfC Stanbic Holdings Limited.
He is currently the Regional Representative of the Eastern Africa Association, a business information service based in Nairobi, and active throughout East Africa.
13ANNUAL REPORT & FINANCIAL STATEMENTS 2014
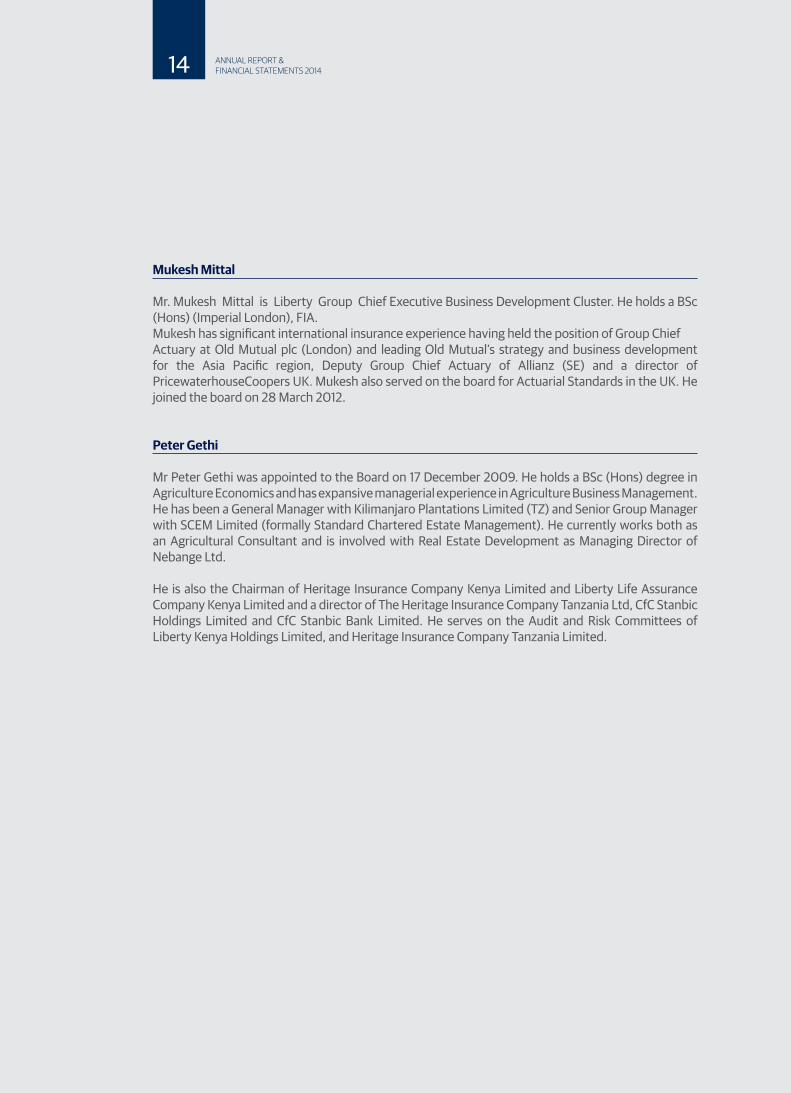
Mukesh Mittal
Mr. Mukesh Mittal is Liberty Group Chief Executive Business Development Cluster. He holds a BSc (Hons) (Imperial London), FIA.Mukesh has significant international insurance experience having held the position of Group Chief Actuary at Old Mutual plc (London) and leading Old Mutual’s strategy and business development for the Asia Pacific region, Deputy Group Chief Actuary of Allianz (SE) and a director of PricewaterhouseCoopers UK. Mukesh also served on the board for Actuarial Standards in the UK. He joined the board on 28 March 2012.
Peter Gethi
Mr Peter Gethi was appointed to the Board on 17 December 2009. He holds a BSc (Hons) degree in Agriculture Economics and has expansive managerial experience in Agriculture Business Management. He has been a General Manager with Kilimanjaro Plantations Limited (TZ) and Senior Group Manager with SCEM Limited (formally Standard Chartered Estate Management). He currently works both as an Agricultural Consultant and is involved with Real Estate Development as Managing Director of Nebange Ltd.
He is also the Chairman of Heritage Insurance Company Kenya Limited and Liberty Life Assurance Company Kenya Limited and a director of The Heritage Insurance Company Tanzania Ltd, CfC Stanbic Holdings Limited and CfC Stanbic Bank Limited. He serves on the Audit and Risk Committees of Liberty Kenya Holdings Limited, and Heritage Insurance Company Tanzania Limited.
14 ANNUAL REPORT & FINANCIAL STATEMENTS 2014
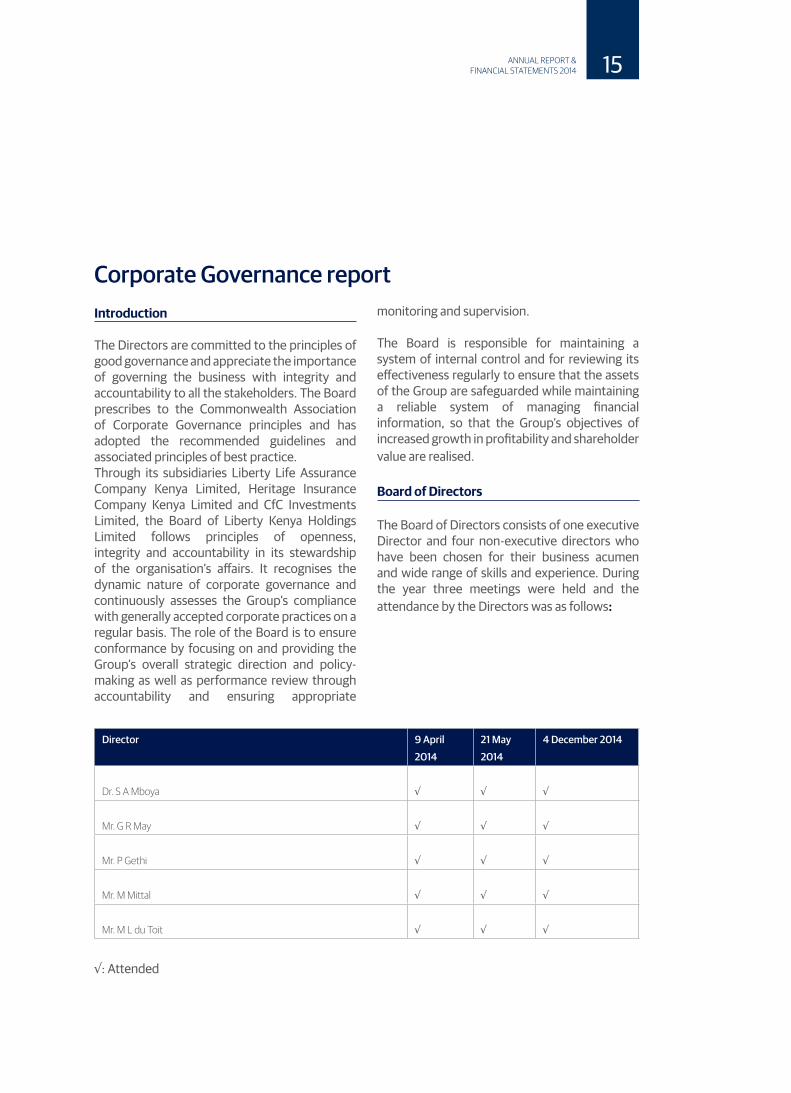
Corporate Governance report Introduction
The Directors are committed to the principles of good governance and appreciate the importance of governing the business with integrity and accountability to all the stakeholders. The Board prescribes to the Commonwealth Association of Corporate Governance principles and has adopted the recommended guidelines and associated principles of best practice.Through its subsidiaries Liberty Life Assurance Company Kenya Limited, Heritage Insurance Company Kenya Limited and CfC Investments Limited, the Board of Liberty Kenya Holdings Limited follows principles of openness, integrity and accountability in its stewardship of the organisation’s affairs. It recognises the dynamic nature of corporate governance and continuously assesses the Group’s compliance with generally accepted corporate practices on a regular basis. The role of the Board is to ensure conformance by focusing on and providing the Group’s overall strategic direction and policy-making as well as performance review through accountability and ensuring appropriate
monitoring and supervision.
The Board is responsible for maintaining a system of internal control and for reviewing its effectiveness regularly to ensure that the assets of the Group are safeguarded while maintaining a reliable system of managing financial information, so that the Group’s objectives of increased growth in profitability and shareholder value are realised.
Board of Directors
The Board of Directors consists of one executive Director and four non-executive directors who have been chosen for their business acumen and wide range of skills and experience. During the year three meetings were held and the attendance by the Directors was as follows:
Director 9 April
2014
21 May
2014
4 December 2014
Dr. S A Mboya √ √ √
Mr. G R May √ √ √
Mr. P Gethi √ √ √
Mr. M Mittal √ √ √
Mr. M L du Toit √ √ √
√: Attended
15ANNUAL REPORT & FINANCIAL STATEMENTS 2014
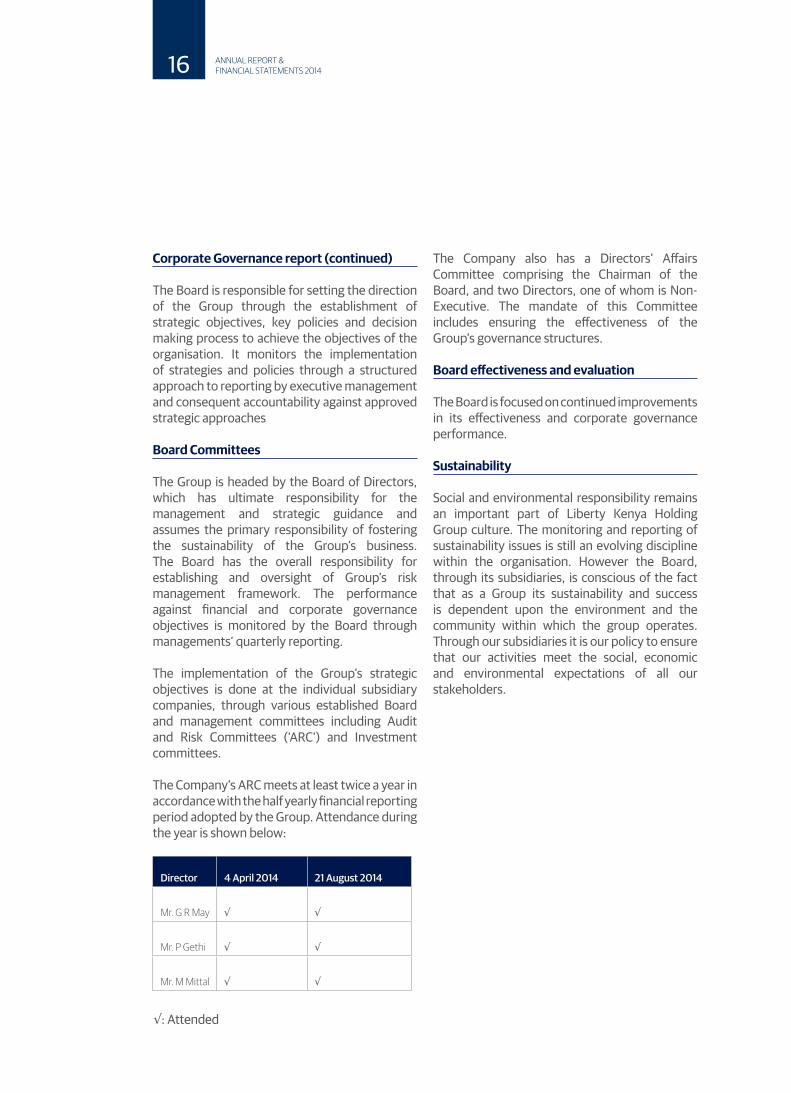
Corporate Governance report (continued)
The Board is responsible for setting the direction of the Group through the establishment of strategic objectives, key policies and decision making process to achieve the objectives of the organisation. It monitors the implementation of strategies and policies through a structured approach to reporting by executive management and consequent accountability against approved strategic approaches
Board Committees
The Group is headed by the Board of Directors, which has ultimate responsibility for the management and strategic guidance and assumes the primary responsibility of fostering the sustainability of the Group’s business. The Board has the overall responsibility for establishing and oversight of Group’s risk management framework. The performance against financial and corporate governance objectives is monitored by the Board through managements’ quarterly reporting.
The implementation of the Group’s strategic objectives is done at the individual subsidiary companies, through various established Board and management committees including Audit and Risk Committees (‘ARC’) and Investment committees.
The Company’s ARC meets at least twice a year in accordance with the half yearly financial reporting period adopted by the Group. Attendance during the year is shown below:
Director 4 April 2014 21 August 2014
Mr. G R May √ √
Mr. P Gethi √ √
Mr. M Mittal √ √
The Company also has a Directors’ Affairs Committee comprising the Chairman of the Board, and two Directors, one of whom is Non-Executive. The mandate of this Committee includes ensuring the effectiveness of the Group’s governance structures.
Board effectiveness and evaluation
The Board is focused on continued improvements in its effectiveness and corporate governance performance.
Sustainability
Social and environmental responsibility remains an important part of Liberty Kenya Holding Group culture. The monitoring and reporting of sustainability issues is still an evolving discipline within the organisation. However the Board, through its subsidiaries, is conscious of the fact that as a Group its sustainability and success is dependent upon the environment and the community within which the group operates. Through our subsidiaries it is our policy to ensure that our activities meet the social, economic and environmental expectations of all our stakeholders.
√: Attended
16 ANNUAL REPORT & FINANCIAL STATEMENTS 2014

Corporate Governance report (continued)
Social responsibility
As a Kenyan business, the Group understands the challenges and benefits of doing business in Kenya, and owes its existence to the people and societies within which it operates. The Group is committed therefore not only to the promotion of the economic development but also to the strengthening of civil society and human well-being. The Group concentrates its social investment expenditure in defined focus areas in order to make the greatest impact. These areas of focus are subject to annual revision as the country’s social-economic needs change. The Group focus is mainly in the area of education and health with a long term view of sustaining the projects at hand.
Going Concern
The Board has reviewed the facts and assumptions, on which it relied and, based on these, will continue to view the Group as a going concern for the foreseeable future.
Remuneration
Liberty Kenya Holdings Limited has a clear policy on remuneration of executive and non-executive directors at levels that are fair and reasonable in a competitive market for the skills, knowledge, experience required, nature and size of the Board.
The non-executive Directors remuneration is reviewed periodically by the Directors’ Affairs Committee.
The amounts paid to directors are included in note 32 which represents the total remuneration paid to executive and non-executive directors for the year under review.
S A Mboya M L du ToitChairman Managing Director
8 April 2015
17ANNUAL REPORT & FINANCIAL STATEMENTS 2014

Directors’ report
The directors submit their report together with the audited financial statements for the year ended 31 December 2014, in accordance with Section 157 of the Kenyan Companies Act, which disclose the state of affairs of Liberty Kenya Holdings Limited and its subsidiaries (together the “Group”) and of Liberty Kenya Holdings Limited (the “Company”).
Principal activities
The Group is engaged in the business of insurance and wealth management through its subsidiaries namely Liberty Life Assurance Kenya Limited and the Heritage Insurance Company Kenya Limited. The Group underwrites classes of long term and general insurance as defined in the Kenyan Insurance Act with the exception of bonds investments. It also issues investment contracts to provide customers with asset management solutions for their savings and retirement needs.
Results and dividend
Profit for the year ended 31 December 2014 of Shs 1,148,985,000 (2013: Shs 1,105,920,000) has been added to retained earnings.
The Directors recommend a dividend per share of Shs 0.40 (2013: Shs 1).
Directors
The names of the directors who held office during the year and to the date of this report are set out on page 3.
Auditor
KPMG Kenya were appointed auditors during the year to fill a casual vacancy following the resignation of Pricewaterhousecoopers and have indicated their willingness to continue in office in accordance with section 159 (2) of the companies Act.
Approval of Financial Statements
The financial statements were approved and authorised for issue by the Board of directors on 8 April 2015.
By order of the Board
C. Kioni
8 April 2015
18 ANNUAL REPORT & FINANCIAL STATEMENTS 2014
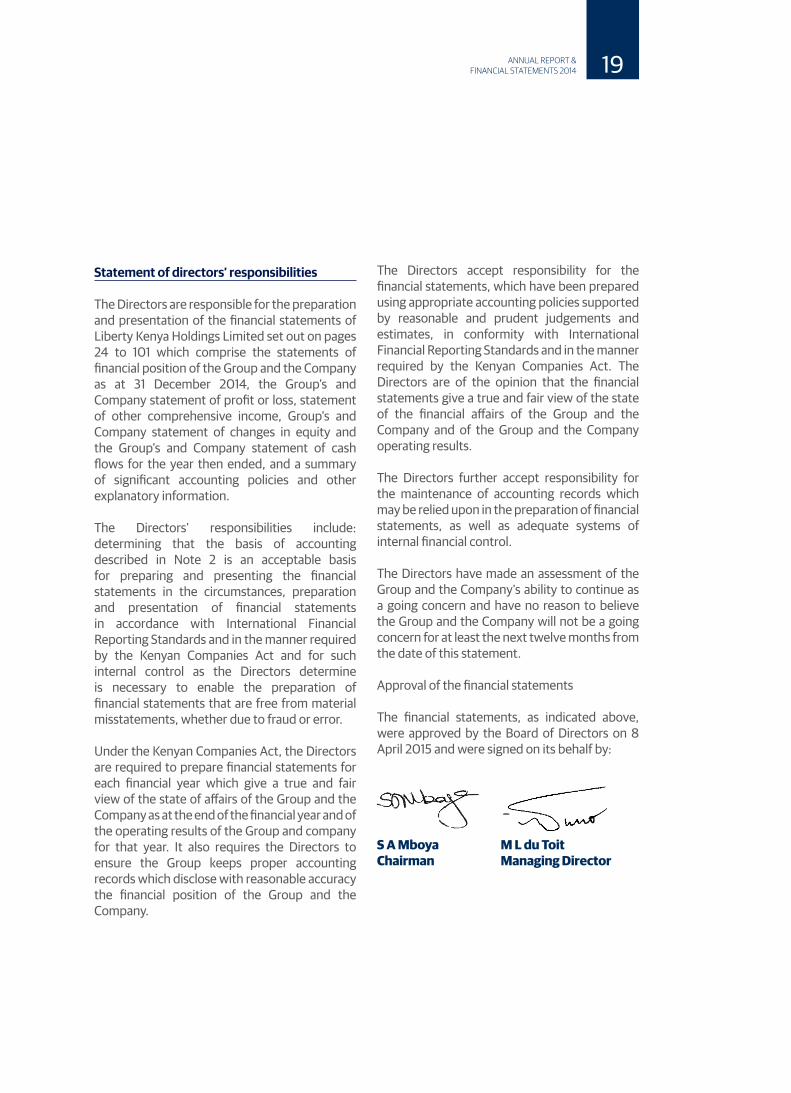
Statement of directors’ responsibilities
The Directors are responsible for the preparation and presentation of the financial statements of Liberty Kenya Holdings Limited set out on pages 24 to 101 which comprise the statements of financial position of the Group and the Company as at 31 December 2014, the Group’s and Company statement of profit or loss, statement of other comprehensive income, Group’s and Company statement of changes in equity and the Group’s and Company statement of cash flows for the year then ended, and a summary of significant accounting policies and other explanatory information.
The Directors’ responsibilities include: determining that the basis of accounting described in Note 2 is an acceptable basis for preparing and presenting the financial statements in the circumstances, preparation and presentation of financial statements in accordance with International Financial Reporting Standards and in the manner required by the Kenyan Companies Act and for such internal control as the Directors determine is necessary to enable the preparation of financial statements that are free from material misstatements, whether due to fraud or error.
Under the Kenyan Companies Act, the Directors are required to prepare financial statements for each financial year which give a true and fair view of the state of affairs of the Group and the Company as at the end of the financial year and of the operating results of the Group and company for that year. It also requires the Directors to ensure the Group keeps proper accounting records which disclose with reasonable accuracy the financial position of the Group and the Company.
The Directors accept responsibility for the financial statements, which have been prepared using appropriate accounting policies supported by reasonable and prudent judgements and estimates, in conformity with International Financial Reporting Standards and in the manner required by the Kenyan Companies Act. The Directors are of the opinion that the financial statements give a true and fair view of the state of the financial affairs of the Group and the Company and of the Group and the Company operating results.
The Directors further accept responsibility for the maintenance of accounting records which may be relied upon in the preparation of financial statements, as well as adequate systems of internal financial control.
The Directors have made an assessment of the Group and the Company’s ability to continue as a going concern and have no reason to believe the Group and the Company will not be a going concern for at least the next twelve months from the date of this statement.
Approval of the financial statements
The financial statements, as indicated above, were approved by the Board of Directors on 8 April 2015 and were signed on its behalf by:
S A Mboya M L du Toit Chairman Managing Director
19ANNUAL REPORT & FINANCIAL STATEMENTS 2014

Financial highlights – Five year consolidated statement of profit or loss
31 December
2010
Shs’000
31 December
2011
Shs’000
31 December
2012
Shs’000
31 December
2013
Shs’000
31 December
2014
Shs’000
Net insurance premium revenue 3,531,909 4,237,933 3,982,386 4,067,128 4,692,485
Investment and other income 1,842,744 2,195,322 4,067,013 3,311,482 3,610,067
Total income 5,374,653 6,433,255 8,049,399 7,378,610 8,302,552
Net insurance benefits and claims (2,714,472) (2,482,494) (3,761,475) (3,076,841) (3,456,461)
Operating expenses and commissions (2,214,028) (2,940,927) (3,137,549) (2,995,520) (3,509,440)
Result of operating activities 446,153 1,009,834 1,150,375 1,306,249 1,336,651
Earnings from associates 36,782 2,381 23,704 (7,387) 9,918
Profit before income tax 482,935 1,012,215 1,174,079 1,298,862 1,346,569
Income tax expense (222,921) (61,797) (316,230) (192,942) (197,584)
Profit for the year 260,014 950,418 857,849 1,105,920 1,148,985
Costs to income 41% 46% 39% 41% 42%
Earnings per share (Shs) 0.50 1.84 1.66 2.15 2.14
20 ANNUAL REPORT & FINANCIAL STATEMENTS 2014

Financial highlights – Five year consolidated financial position
31 December
2010
Shs’000
31 December
2011
Shs’000
31 December
2012
Shs’000
31 December
2013
Shs’000
31 December
2014
Shs’000
Total equity 4,676,659 3,865,638 4,554,231 5,464,882 6,157,189
Assets
Property, equipment and
intangible assets
1,260,013 1,176,517 1,165,093 1,136,877 1,100,816
Investment property 545,000 623,553 710,449 842,200 936,000
Goodwill 1,254,995 1,254,995 1,254,995 1,254,995 1,254,995
Investment in associates 313,180 355,400 61,948 70,041 -
Financial investments 15,084,710 13,956,773 14,083,814 15,949,076 19,098,156
Other assets 2,539,229 3,636,393 4,062,108 5,746,018 4,552,324
Cash and cash equivalents 2,830,202 2,892,146 6,033,693 6,452,983 6,251,762
Total assets 23,827,329 23,895,777 27,372,100 31,452,190 33,194,053
Liabilities
Insurance contract liabilities 6,027,195 6,239,993 7,523,118 10,320,927 9,720,729
Deposit administration liabilities 8,703,273 9,300,122 10,465,499 11,103,757 12,047,554
Other liabilities 3,811,391 3,985,403 4,349,456 4,562,624 5,268,581
Borrowings and bank overdraft 608,811 504,621 479,796 - -
Profit before income tax 19,150,670 20,030,139 22,817,869 25,987,308 27,036,864
Profit for the year 4,676,659 3,865,638 4,554,231 5,464,882 6,157,189
21ANNUAL REPORT & FINANCIAL STATEMENTS 2014

Report of the Independent Auditor to the Members of Liberty Kenya Holdings Limited
We have audited the Group financial statements of Liberty Kenya Holdings Limited set out on pages 24 to 101 which comprise the statements of financial position of the Group and the Company as at 31 December 2014, the Group and Company’s statements of profit or loss, statement of other comprehensive income, Group and Company’s statement of changes in equity and the Group and company’s statement of cash flows for the year then ended, and a summary of significant accounting policies and other explanatory information.
Directors’ responsibility for the financial statements
As stated on page 18, the Company’s Directors are responsible for the preparation and fair presentation of these financial statements in accordance with International Financial Reporting Standards, and in the manner required by the Companies Act of Kenya, and for such internal control as the directors determine is necessary to enable the preparation of financial statements that are free from material misstatement, whether due to fraud or error.
Auditors’ responsibility
Our responsibility is to express an opinion on these financial statements based on our audit. We conducted our audit in accordance with International Standards on Auditing. Those standards require that we comply with relevant ethical requirements and plan and perform the audit to obtain reasonable assurance whether the financial statements are free from material misstatement.
An audit involves performing procedures to obtain audit evidence about the amounts and disclosures in the financial statements. The procedures selected depend on our judgement,
including the assessment of the risks of material misstatement of the financial statements, whether due to fraud or error. In making those risk assessments, we consider internal control relevant to the entity’s preparation and fair presentation of the financial statements in order to design audit procedures that are appropriate in the circumstances, but not for the purpose of expressing an opinion on the effectiveness of the entity’s internal control. An audit also includes evaluating the appropriateness of accounting policies used and the reasonableness of accounting estimates made by management, as well as evaluating the overall presentation of the financial statements.
We believe that the audit evidence we have obtained is sufficient and appropriate to provide a basis for our opinion.
Opinion
In our opinion, the financial statements give a true and fair view of the Group and Company financial position of Liberty Kenya Holdings Limited at 31 December 2014, and the Group and Company financial performance and the Group and Company cash flows for the year then ended in accordance with International Financial Reporting Standards and the Kenyan Companies Act.
22 ANNUAL REPORT & FINANCIAL STATEMENTS 2014

Report on other legal requirements
As required by the Kenyan Companies Act we report to you, based on our audit, that:
• We have obtained all the information and explanations, which to the best of our knowledge and belief were necessary for the purpose of our audit;
• In our opinion, proper books of account have been kept by the Company, so far as appears from our examination of those books; and
• The Company’s statement of financial position, statement of profit or loss and statement of other comprehensive income are in agreement with the books of account.
The Engagement Partner responsible for the audit resulting in this independent auditors’ report is CPA Jacob Gathecha - P/1610.
KPMG Kenya Certified Public Accountants8th floor ABC place waiyaki wayP o Box 40612 – 00100NAIROBI
8 April 2015
23ANNUAL REPORT & FINANCIAL STATEMENTS 2014

Consolidated and Company statement of profit or loss
The notes set out on pages 31 to 101 form an integral part of these financial statements.
24 ANNUAL REPORT & FINANCIAL STATEMENTS 2014

The notes set out on pages 31 to 101 form an integral part of these financial statements.
Consolidated and Company statement of othercomprehensive income
25ANNUAL REPORT & FINANCIAL STATEMENTS 2014

Consolidated and Company statement financialposition
The financial statement set out on pages 24 to 101 were approved for issue by the Board of Directors on 8 April 2015 and signed on its behalf by:
S A MBOYA M L du Toit G R May C Kioni
26 ANNUAL REPORT & FINANCIAL STATEMENTS 2014
The
note
s set
out
on
page
s 31 t
o 10
1 for
m a
n in
tegr
al p
art o
f the
se fi
nanc
ial s
tate
men
ts.
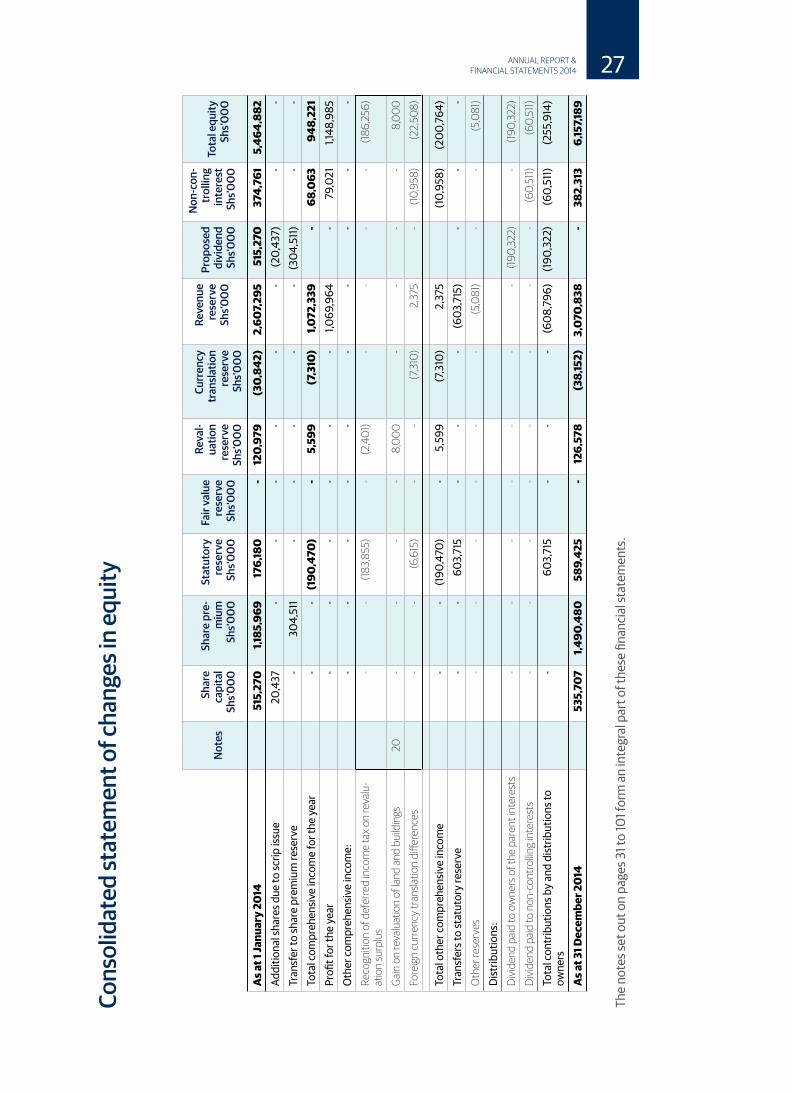
27ANNUAL REPORT & FINANCIAL STATEMENTS 2014

The
note
s set
out
on
page
s 31 t
o 10
1 for
m a
n in
tegr
al p
art o
f the
se fi
nanc
ial s
tate
men
ts.
28 ANNUAL REPORT & FINANCIAL STATEMENTS 2014

Company statement of changes in equity
The notes set out on pages 31 to 101 form an integral part of these financial statements.
29ANNUAL REPORT & FINANCIAL STATEMENTS 2014
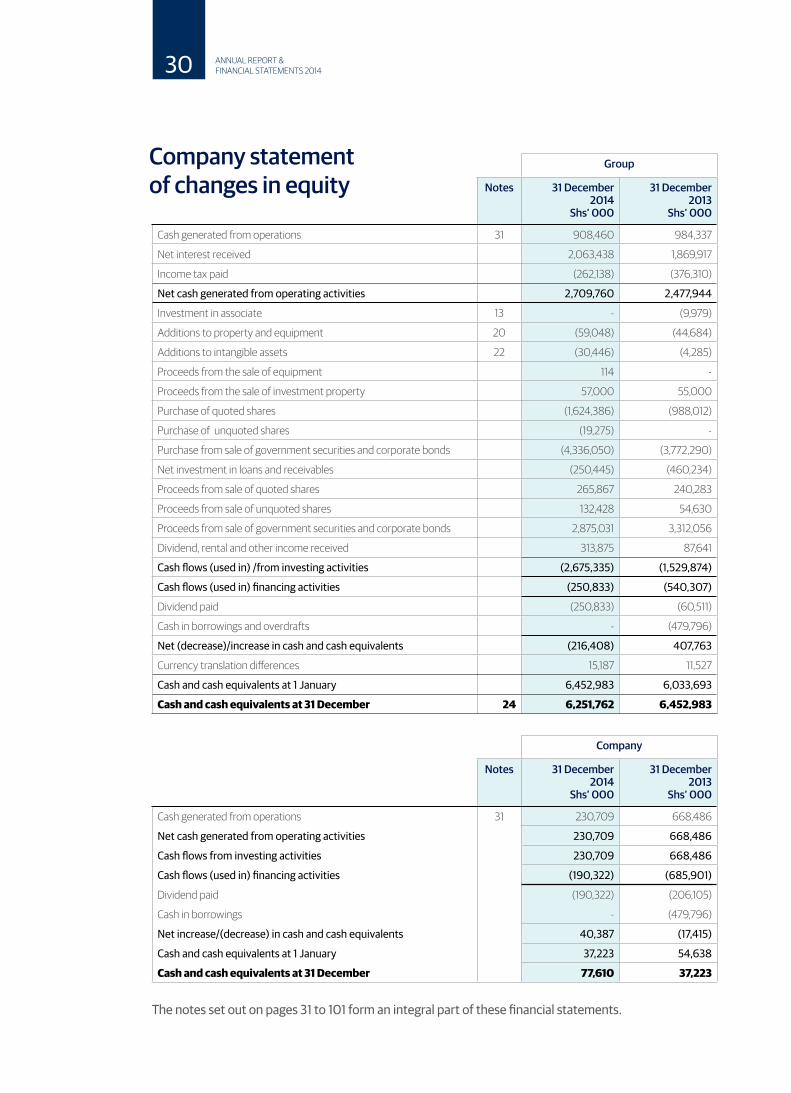
Company statement of changes in equity
The notes set out on pages 31 to 101 form an integral part of these financial statements.
30 ANNUAL REPORT & FINANCIAL STATEMENTS 2014
1. General information
Liberty Kenya Holdings Limited is incorporated in Kenya under the Companies Act as a limited liability Company, and is domiciled in Kenya. The address of its registered office is:
LR No 209/8592/2Liberty House, Mamlaka RoadP.O. Box 30390-00100Nairobi
The Company was listed on the Nairobi Securities Exchange on 21 April 2011. For Kenyan Companies Act reporting purposes, the balance sheet is represented by the statement of financial position and the profit and loss account by the statement of profit or loss in these financial statements.
2. Summary of significant accounting policies
The principal accounting policies adopted in the preparation of these financial statements are set out below and relate to both the Company’s and the Group’s activities. These policies have been consistently applied to all years presented, unless otherwise stated.
(a) Basis of preparation
The financial statements are prepared in accordance with and comply with International Financial Reporting Standards (IFRS). The financial statements are presented in the functional currency, Kenya Shillings (Shs), rounded to the nearest thousand, and prepared under the historical cost convention, as modified by the carrying of investment property and available-for-sale investments at fair value and actuarially determined liabilities at their present value.
The preparation of financial statements in conformity with IFRS requires the use of certain critical accounting estimates. It also requires
management to exercise its judgement in the process of applying the Group’s accounting policies.
(i) New standards, amendment and interpretations New standards, amendments and interpretations effective and adopted during the year are detailed in the following paragraphs:
Amendments to IAS 32: Offsetting Financial Assets and Financial Liabilities (effective for annual periods beginning on or after 1 January 2014).
The amendments to IAS 32 clarify the offsetting criteria in IAS 32 by explaining when an entity currently has a legally enforceable right to set-off and when gross settlement is equivalent to net settlement. The adoption of the amendments did not have a significant impact on the financial statements of the Group.
Amendments to IFRS 10, IFRS 12 and IAS 27: Investment entities (effective for annual periods beginning on or after 1 January 2014) The amendments clarify that a qualifying investment entity is required to account for investments in controlled entities, as well as investments in associates and joint ventures, at fair value through profit or loss; the only exception would be subsidiaries that are considered an extension of the investment entity’s investment activities. The consolidation exemption is mandatory and not optional.
The adoption of the amendments did not have a significant impact on the financial statements of the Group.
31ANNUAL REPORT & FINANCIAL STATEMENTS 2014

2. Summary of significant accounting policies (continued)
Amendments to IAS 36: Recoverable Amount Disclosures for Non-Financial Assets (effective for annual periods beginning on or after 1 January 2014)
The amendments reverse the unintended requirement in IFRS 13 Fair Value Measurement to disclose the recoverable amount of every cash-generating unit to which significant goodwill or indefinite-lived intangible assets have been allocated. Under the amendments, the recoverable amount is required to be disclosed only when an impairment loss has been recognised or reversed.
The adoption of the amendments did not have a significant impact on the financial statements of the Group. Amendments to IAS 39: Novation of Derivatives and Continuation of Hedge Accounting (effective for annual periods beginning on or after 1 January 2014) The amendments permit the continuation of hedge accounting in a situation where a counterparty to a derivative designated as a hedging instrument is replaced by a new central counterparty (known as ‘novation of derivatives’ ), as a consequence of laws or regulations, if specific conditions are met. The adoption of the amendments did not have a significant impact on the financial statements of the Group.
IFRIC 21: Levies (effective for annual periods beginning on or after 1 January 2014). IFRIC 21 defines a levy as an outflow from an entity imposed by a government in accordance with legislation. It confirms that an entity recognises a liability for a levy when – and only when – the triggering event specified in the legislation occurs.
The adoption of the amendments did not have a significant impact on the financial statements of the Group.
Note: In terms of IAS 1:31, when new standards, amendments to standards and interpretations which are effective and these are determined to have no effect, or no material effect on the financial statements, it is not necessary to list them as such a disclosure would not be material.
(ii) New and amended standards and interpretations in issue but not yet effective for the year ended 31 December 2014. All Standards and Interpretations will be adopted at their effective date (except for those Standards and Interpretations that are not applicable to the entity).
Defined benefit plans – Employee contributions (Amendments to IAS 19)
The amendments introduce relief that will reduce the complexity and burden of accounting for certain contributions from employees or third parties. Such contributions are eligible for practical expedient if they are:
• set out in the formal terms of the plan;• linked to service; and• independent of the number of years of
service.When contributions are eligible for the practical expedient, a company is permitted (but not required) to recognise them as a reduction of the service cost in the period in which the related service is rendered. The amendments apply retrospectively for annual periods beginning on or after 1 July 2014 with early adoption permitted.
The adoption of these changes will not affect the amounts and disclosures of the Company’s defined benefits obligations.
32 ANNUAL REPORT & FINANCIAL STATEMENTS 2014

2. Summary of significant accounting policies (continued)
Sale or Contribution of Assets between an Investor and its Associate or Joint Venture (Amendments to IFRS 10 and IAS 28) The amendments require the full gain to be recognised when assets transferred between an investor and its associate or joint venture meet the definition of a ‘business’ under IFRS 3 Business Combinations. Where the assets transferred do not meet the definition of a business, a partial gain to the extent of unrelated investors’ interests in the associate or joint venture is recognised.
The definition of a business is key to determining the extent of the gain to be recognised The amendments will be effective from annual periods commencing on or after 1 January 2016. The adoption of these changes will not affect the amounts and disclosures of the Company’s transactions with associates or joint ventures.
Accounting for Acquisitions of Interests in Joint Operations (Amendments to IFRS 11)
The amendments require business combination accounting to be applied to acquisitions of interests in a joint operation that constitutes a business. Business combination accounting also applies to the acquisition of additional interests in a joint operation while the joint operator retains joint control. The additional interest acquired will be measured at fair value. The previously held interest in the joint operation will not be remeasured.
The amendments apply prospectively for annual periods beginning on or after 1 January 2016 and early adoption is permitted. The adoption of these changes would not affect the amounts and disclosures of the Group’s interests in joint operations.
Amendments to IAS 41- Bearer Plants (Amendments to IAS 16 and IAS 41)
The amendments to IAS 16 Property, Plant and Equipment and IAS 41 Agriculture require a bearer plant (which is a living plant used solely to grow produce over several periods) to be accounted for as property, plant and equipment in accordance with IAS 16 Property, Plant and Equipment instead of IAS 41 Agriculture. The produce growing on bearer plants will remain within the scope of IAS 41.
The new requirements are effective from 1 January 2016, with earlier adoption permitted.
The amendment will not have a significant impact on the Group’s financial statements as the Group does/does not have bearer plants.
Clarification of Acceptable Methods of Depreciation and Amortisation (Amendments to IAS 16 and IAS 38)
The amendments to IAS 16 Property, Plant and Equipment explicitly state that revenue-based methods of depreciation cannot be used for property, plant and equipment.
The amendments to IAS 38 Intangible Assets introduce a rebuttable presumption that the use of revenue-based amortisation methods for intangible assets is inappropriate. The presumption can be overcome only when revenue and the consumption of the economic benefits of the intangible asset are ‘highly correlated’, or when the intangible asset is expressed as a measure of revenue.
The amendments apply prospectively for annual periods beginning on or after 1 January 2016 andearly adoption is permitted. The adoption of these changes will not affect the amounts and disclosures of the Group’s property, plant and equipment and intangible assets.
33ANNUAL REPORT & FINANCIAL STATEMENTS 2014

2. Summary of significant accounting policies (continued)
Equity Method in Separate Financial Statements (Amendments to IAS 27)
The amendments allow the use of the equity method in separate financial statements, and apply to the accounting not only for associates and joint ventures but also for subsidiaries
The amendments apply retrospectively for annual periods beginning on or after 1 January 2016 with early adoption permitted.The adoption of these changes will not affect the amounts and disclosures of the Company’s interests in other entities.
(b) Consolidation
i) Subsidiaries
Subsidiaries are all entities (including structured entities) over which the Group has control. The Group controls an entity when the Group is exposed to, or has rights to, variable returns from its involvement with the entity and has the ability to affect those returns through its power over the entity. Subsidiaries are fully consolidated from the date on which control is transferred to the Group. They are deconsolidated from the date that control ceases.
The Group applies the acquisition method to account for business combinations. The consideration transferred for the acquisition of a subsidiary is the fair values of the assets transferred, the liabilities incurred to the former owners of the acquiree and the equity interests issued by the Group. The consideration transferred includes the fair value of any asset or liability resulting from a contingent consideration arrangement. Identifiable assets acquired and liabilities and contingent liabilities assumed in a business combination are measured initially at their fair values at the acquisition date. The
Group recognises any non-controlling interest in the acquiree on an acquisition-by-acquisition basis at fair value However, non-controlling interest’s that are present ownership interests and entitle their holders to a proportionate share of the entity’s net assets in the event of liquidation are recognised at either fair value or proportionate share of the recognised amounts of acquiree’s identifiable net assets. Acquisition-related costs are expensed as incurred.
If the business combination is achieved in stages, the acquisition date carrying value of the acquirer’s previously held equity interest in the acquiree is re-measured to fair value at the acquisition date; any gains or losses arising from such re-measurement are recognised in profit or loss
The excess of the consideration transferred the amount of any non-controlling interest in the acquiree and the acquisition-date fair value of any previous equity interest in the acquiree over the fair value of the identifiable net assets acquired is recorded as goodwill. If the total of consideration transferred, non-controlling interest recognised and previously held interest measured is less than the fair value of the net assets of the subsidiary acquired in the case of a bargain purchase, the difference is recognised directly in profit or loss.
Inter-company transactions, balances and unrealised gains on transactions between group companies are eliminated. Unrealised losses are also eliminated. When necessary, amounts reported by subsidiaries have been adjusted to conform to the Group’s accounting policies.
The consolidated financial statements incorporate the financial statements of Liberty Kenya Holdings Limited and its subsidiaries, Liberty Life Assurance Company Kenya Limited,
34 ANNUAL REPORT & FINANCIAL STATEMENTS 2014

2. Summary of significant accounting policies (continued)
b) Consolidation (continued)
CfC Investments Limited, The Heritage Insurance Company Kenya Limited, The Heritage Insurance Company Tanzania Limited and Azali Limited. The financial statements have been made up to 31 December 2014
(ii) Changes in ownership interests in subsidiaries without change of control
Transactions with non-controlling interests that do not result in loss of control are accounted for as equity transactions – that is, as transactions with owners in their capacity as owners. The difference between fair value of any consideration paid and the relevant share acquired of the carrying value of net assets of the subsidiary is recorded in equity. Gains or losses on disposals to non-controlling interests are also recorded in equity.
(iii) Disposal of subsidiaries
When the Group ceases to control, any retained interest in the entity is re-measured to its fair value at the date when control is lost, with the change in carrying amount recognised in profit or loss. The fair value is the initial carrying amount for the purposes of subsequently accounting for the retained interest as an associate, joint venture or financial asset. In addition, any amounts previously recognised in other comprehensive income in respect of that entity are accounted for as if the Group had directly disposed of the related assets or liabilities. This may mean that amounts previously recognised in other comprehensive income are reclassified to profit or loss.
(iv) Associates
Associates are all entities over which the Group
has significant influence but not control, generally accompanying a shareholding of between 20% and 50% of the voting rights. Investments in associates are accounted for by the equity method of accounting. Under the equity method, the investments are initially recognised at cost, and the carrying amount is increased or decreased to recognise the investor’s share of the profit or loss of the investee after the date of acquisition. The Group’s investment in associates includes goodwill identified on acquisition.If the ownership interest in an associate is reduced but significant influence is retained, only a proportionate share of the amounts previously recognised in other comprehensive income is reclassified to profit or loss as appropriate. The Group’s share of its associates’ post-acquisition profits or losses is recognised in profit or loss, and its share of post-acquisition movements in other comprehensive income is recognised in other comprehensive income, with a corresponding adjustment to the carrying amount of the investment. When the Group’s share of losses in an associate equals or exceeds its interest in the associate, including any other unsecured receivables, the Group does not recognise further losses, unless it has incurred legal or constructive obligations or made payments on behalf of the associate.
The Group determines at each reporting date whether there is any objective evidence that the investment in the associate is impaired. If this is the case, the Group calculates the amount of impairment as the difference between the recoverable amount of the associate and its carrying value and recognises the amount adjacent to ‘share of profit or loss of an associate’ in the profit or loss.Profits and losses resulting from upstream and downstream transactions between the group and its associate are recognised in the Group’s financial statements only to the extent of unrelated investor’s interests in the associates. Unrealised losses are eliminated unless the transaction provides evidence of an impairment of the asset transferred.
35ANNUAL REPORT & FINANCIAL STATEMENTS 2014

2. Summary of significant accounting policies (continued)
Accounting policies of associates have been changed where necessary to ensure consistency with the policies adopted by the Group. Dilution gains and losses arising from investments in associates are recognised in profit or loss.
(c) Insurance contracts
(i) Classification
The Group issues contracts that transfer insurance risk or financial risk or both. Insurance contracts are those contracts that transfer significant insurance risk. Such contracts may also transfer financial risk.
As a general guideline, the group defines as significant insurance risk, the possibility of having to pay benefits on the occurrence of an insured event that are at least 10% more than the benefits payable if the insured event did not occur.Investment contracts are those contracts that transfer financial risk with no significant insurance risk. See accounting policy for these contracts under 2(f).A number of insurance and investment contracts contain a discretionary participation feature (DPF). This feature entitles the holder to receive, as a supplement to guaranteed benefits, additional benefits or bonuses:
a) that are likely to be a significant portion of the total contractual benefits;
b) whose amount or timing is contractually at the discretion of the Group; and
c) that are contractually based on:• the performance of a specified pool of
contracts or a specified type of contract;• realised and/or unrealised investment
returns on a specified pool of assets held by the Group; or
• The profit or loss of the Company, fund
or other entity that issues the contract.Insurance contracts and investment contracts are classified into two main categories, depending on the duration of risk and as per the provisions of the Insurance Act.
Long term insurance business
Long-term insurance business includes insurance business of all or any of the following classes, namely, life assurance business, superannuation business, industrial life assurance business, bond investment business and business incidental to any such class of business.Life assurance business means the business of, or in relation to, the issuing of, or the undertaking of a liability to pay money on death (not being death by accident or in specified sickness only) or on the happening of any contingency dependent on the termination or continuance of human life (either with or without provision for a benefit under a continuous disability insurance contract, and include a contract which is subject to the payment of premiums for term dependent on the termination or continuance of human life and any contract securing the grant of an annuity for a term dependent upon human life; Superannuation business means life assurance business, being business of, or in relation to, the issuing of or the undertaking of liability under superannuation, group life and permanent health insurance policy.
General insurance business
It is insurance business of any class or classes that is not long term insurance business. Classes of general Insurance include Engineering insurance, Fire insurance – domestic risks, Fire insurance – industrial and commercial risks, Liability insurance, Marine insurance, Motor insurance – private vehicles, Motor insurance – commercial vehicles, Personal accident insurance, Theft insurance, Workmen’s Compensation and Employer’s Liability insurance and Miscellaneous
36 ANNUAL REPORT & FINANCIAL STATEMENTS 2014

2. Summary of significant accounting policies (continued)
(c) Insurance contracts (continued)
insurance (i.e. class of business not included under those listed above).Motor insurance business means the business of affecting and carrying out contracts of insurance against loss of, or damage to, or arising out of or in connection with the use of, motor vehicles, inclusive of third party risks but exclusive of transit risks.Personal Accident insurance business means the business of affecting and carrying out contracts of insurance against risks of the persons insured sustaining injury as the result of an accident or of an accident of a specified class or dying as the result of an accident or of an accident of a specified class or becoming incapacitated in consequence of disease or of disease of a specified class. It also includes business of effecting and carrying out contracts of insurance against risk of persons insured incurring medical expenses.Fire insurance business means the business of affecting and carrying out contracts of insurance, otherwise than incidental to some other class of insurance business against loss or damage to property due to fire, explosion, storm and other occurrences customarily included among the risks insured against in the fire insurance business, damage to property due to fire, explosion, storm and other occurrences customarily included among the risks insured against in the fire insurance business.
(ii) Recognition and measurement
a) Premium income
For long term insurance business, premiums are recognised as revenue when they become payable by the contract holder. Premiums are shown before deduction of commission. For general insurance business, premium income is recognised on assumption of risks, and includes estimates of premiums due but not yet
received, less an allowance for cancellations, and less unearned premium. Unearned premiums represent the proportion of the premiums written in periods up to the accounting date that relates to the un expired terms of policies in force at the financial reporting date, and is computed using the 365ths method. Premiums are shown before deduction of commission and are gross of any taxes or duties levied on premiums.
b) Claims
For long term insurance business, benefits are recorded as an expense when they are incurred. Claims arising on maturing policies are recognised when the claim becomes due for payment. Death claims are accounted for on notification. Surrenders are accounted for on payment.
A liability for contractual benefits that are expected to be incurred in the future is recorded when the premiums are recognised. The liability is determined as the sum of the expected discounted value of the benefit payments and the future administration expenses that are directly related to the contract, less the expected discounted value of the theoretical premiums that would be required to meet the benefits and administration expenses based on the valuation assumptions used (the valuation premiums). The liability is based on assumptions as to mortality, persistency, maintenance expenses and investment income that are established at the time the contract is issued. A margin for adverse deviations is included in the assumptions.
Where insurance contracts have a single premium or a limited number of premium payments due over a significantly shorter period than the period during which benefits are provided, the excess of the premiums payable over the valuation premiums is deferred and recognised as income in line with the decrease of un expired insurance risk of the contracts in-force or, for annuities in force, in line with thedecrease of the amount of
37ANNUAL REPORT & FINANCIAL STATEMENTS 2014

2. Summary of significant accounting policies (continued)
(c) Insurance contracts (continued)
future benefits expected to be paid. The liabilities are recalculated at each financial reporting date using the assumptions established at inception of the contracts.For general insurance business, claims incurred comprise claims paid in the year and changes in the provision for outstanding claims. Claims paid represent all payments made during the year, whether arising from events during that or earlier years. Outstanding claims represent the estimated ultimate cost of settling all claims arising from incidents occurring prior to the financial reporting date, but not settled at that date. Outstanding claims are computed on the basis of the best information available at the time the records for the year are closed, and include provisions for claims incurred but not reported (“IBNR”). Outstanding claims are not discounted.
c) Commissions earned and payable and deferred acquisition costs (“DAC”)
Commissions earned and payable are recognised in the period in which relevant premiums are written. A proportion of commissions’ payable is deferred and amortised over the period in which the related premium is earned. Deferred acquisition costs represent a proportion of acquisition costs that relate to policies that are in force at the year end.
d) Liability adequacy test
At each financial reporting date, liability adequacy tests are performed to ensure the adequacy of the contract liabilities net of related DAC. In performing these tests, current best estimates of future contractual cash flows and claims handling and administration expenses, as well as investment income from the assets backing such liabilities, are used. Any deficiency
is immediately charged to profit or loss as part of claims incurred.Contracts entered into by the Group with reinsurers under which the Group is compensated for losses on one or more contracts issued by the Group and that meet the classification requirements for insurance contracts are classified as reinsurance contracts held. Contracts that do not meet these classification requirements are classified as financial assets. Insurance contracts entered into by the Group under which the contract holder is another insurer (inwards reinsurance) are included with insurance contracts.
e) Reinsurance contracts held
The benefits to which the Group is entitled under its reinsurance contracts held are recognised as reinsurance assets. These assets consist of short-term balances due from reinsures, as well as longer term receivables that are dependent on the expected claims and benefits arising under the related reinsured insurance contracts. Amounts recoverable from or due to reinsures are measured consistently with the amounts associated with the reinsured insurance contracts and in accordance with the terms of each reinsurance contract. Reinsurance liabilities are primarily premiums payable for reinsurance contracts and are recognised as an expense when due.
f) Receivables and payables related to insurance contracts and investment contracts
Receivables and payables are recognised when due. These include amounts due to and from agents, brokers and insurance contract holders. If there is objective evidence that the insurance receivable is impaired, the Group reduces the carrying amount of the insurance receivable accordingly and recognises that impairment loss in the profit or loss. The Group gathers the objective evidence that an insurance receivable
38 ANNUAL REPORT & FINANCIAL STATEMENTS 2014

2. Summary of significant accounting policies (continued)
(c) Insurance contracts (continued)
is impaired using the same process adopted for loans and receivables. The impairment loss is also calculated under the same method used for these financial
g) Salvage and subrogation reimbursements
Some insurance contracts permit the Group to sell (usually damaged) property acquired in settling a claim (for example, salvage). The Group may also have the right to pursue third parties for payment of some or all costs (for example, subrogation).
Estimates of salvage recoveries are included as an allowance in the measurement of the insurance liability for claims, and salvage property is recognised in other assets when the liability is settled. The allowance is the amount that can reasonably be recovered from the disposal of the property.
Subrogation reimbursements are also considered as an allowance in the measurement of the insurance liability for claims and are recognised in other assets when the liability is settled. The allowance is the assessment of the amount that can be recovered from the action against the liable third party.
(d) Functional currency and translation of foreign currencies
(i) Functional and presentation currency
Items included in the financial statements of each of the Group’s entities are measured using the currency of the primary economic environment in which the entity operates (‘the Functional Currency’). The consolidated financial statements are presented in ‘Kenyan Shillings (Shs) rounded to the nearest thousand, which is
the Group’s presentation currency.(ii) Transactions and balances
Foreign currency transactions are translated into the functional currency using exchange rates prevailing at the dates of the transactions or valuation where items are re-measured. Foreign exchange gains and losses resulting from the settlement of such transactions and from the translation at year-end exchange rates of monetary assets and liabilities denominated in foreign currencies are recognised in profit or loss, except when deferred in other comprehensive income.
Foreign exchange gains and losses that relate to borrowings and cash and cash equivalents are presented in profit or loss within ‘finance income or cost’. All other foreign exchange gains and losses are presented in profit or loss within ‘other income’ or ‘other expenses’. Translation differences related to changes in amortised cost are recognised in profit or loss, and other changes in carrying amount are recognised in other comprehensive income.
Translation differences on non-monetary financial assets and liabilities, such as equities held at fair value through profit or loss, are recognised in profit or loss as part of the fair value gain or loss. Translation differences on non-monetary financial assets, such asequities classified as financial assets through other comprehensive income, are included in other comprehensive income.
39ANNUAL REPORT & FINANCIAL STATEMENTS 2014

2. Summary of significant accounting policies (continued)
(d) Functional currency and translation of foreign currencies (continued)
(iii) Group companies
The results and financial position of all the Group entities (none of which has the currency of a hyper-inflationary economy) that have a functional currency different from the presentation currency are translated into the presentation currency as follows:
• assets and liabilities for each statement of financial position presented are translated at the closing rate at the reporting date;
• income and expenses are translated at average exchange rates (unless this average is not a reasonable approximation of the cumulative effect of the rates prevailing on the transaction dates, in which case income and expenses are translated at the rate on the dates of the transactions); and all resulting exchange differences are recognised in other comprehensive income.
Goodwill and fair value adjustments arising on the acquisition of a foreign entity are treated as assets and liabilities of the foreign entity and translated at the closing rate. Exchange differences arising are recognised in other comprehensive income.
(e) Revenue recognition
(i) Insurance premium revenue
The revenue recognition policy relating to insurance contracts is set out under note (c) above
(ii) Commissions
Commissions receivable are recognised as
income in the period in which they are earned.(iii) Rendering of services
Revenue arising from asset management and other related services offered by the Group are recognised in the accounting period in which the services are rendered. Fees consist primarily of investment management fees arising from services rendered in conjunction with the issue and management of investment contracts where the Group actively manages the consideration received from its customers to fund a return that is based on the investment profile that the customer selected on origination of the instrument.
These services comprise the activity of trading financial assets in order to reproduce the contractual returns that the Group’s customers expect to receive from their investments. Such activities generate revenue that is recognised by reference to the stage of completion of the contractual services. In all cases, these services comprise an indeterminate number of acts over the life of the individual contracts. For practical purposes, the Group recognises these fees on a straight-line basis over the estimated life of the contract. Certain upfront payments received for asset management services (‘front-end fees’) are deferred and amortised in proportion to the stage of completion of the service for which they were paid. The Group charges its customers for asset management and other related services using the following different approaches:
Front-end fees are charged to the client on inception. This approach is used particularly for single premium contracts. The consideration received is deferred as a liability and recognised over the life of the contract on a straight-line basis; and
Regular fees are charged to the customer periodically (monthly, quarterly or annually) either directly or by making a deduction from invested funds. Regular charges billed in advance are recognised on a straight-line basis over the
40 ANNUAL REPORT & FINANCIAL STATEMENTS 2014

2. Summary of significant accounting policies (continued)
(e) Revenue recognition (continued)
billing period; fees charged at the end of the period are accrued as a receivable that is offset against the financial liability when charged to the customer.
(iv) Interest income
Interest income for all interest-bearing financial instruments, including financial instruments measured at fair value through profit or loss, is recognised within ‘investment income’ (Note 7) in the profit or loss using the effective interest rate method. When a receivable is impaired, the Group reduces the carrying amount to its recoverable amount, being the estimated future cash flow discounted at the original effective interest rate of the instrument, and continues unwinding the discount as interest income.
(v) Dividend income
Dividend income for equities is recognised when the right to receive payment is established – this is the ex-dividend date for equity securities.
(vi) Rental income
Rental income is recognized as income in the period in which it is earned. All investment income is stated net of investment expenses.
(vii) Realised / unrealised gains and losses
Realised / unrealised gains and losses recorded in the income statement on investments include gains and losses on financial assets and investment properties. Gains and losses on the sale of investments are calculated as the difference between net sales proceeds and the original or amortised cost and are recorded on occurrence of the sale transaction.
(f) Investment contracts
The Group issues investment contracts without fixed terms (unit-linked) and investment contracts with fixed and guaranteed terms (fixed interest rate). The investment contracts include funds administered for a number of retirement benefit schemes
Investment contracts without fixed terms are financial liabilities whose fair value is dependent on the fair value of underlying financial assets (these contracts are also known as unit-linked investment contracts) and are designated at inception as at fair value through profit or loss. The Group designates these investment contracts to be measured at fair value through profit and loss because it eliminates or significantly reduces a measurement or recognition inconsistency (sometimes referred to as ‘an accounting mismatch’) that would otherwise arise from measuring assets or liabilities or recognising the gains and losses on them on different bases.
The best evidence of the fair value of these financial liabilities at initial recognition is the transaction price (i.e. the fair value received) unless the fair value of that instrument is evidenced by comparison with other observable current market transactions in the same instrument or based on a valuation technique whose variables include only data from observable markets. When such evidence exists, the Group recognises profit on day 1. The Group has not recognised any profit on initial measurement of these investment contracts because the difference is attributed to the prepayment liability recognised for the future investment management services that the Group will render to each contract holder.
The Group’s main valuation techniques incorporate all factors that market participants would consider and make maximum use of observable market data.
The fair value of financial liabilities for investment contracts without fixed terms is determined
41ANNUAL REPORT & FINANCIAL STATEMENTS 2014

2. Summary of significant accounting policies (continued)
(f) Investment contracts (continued)using the current unit values in which the contractual benefits are denominated. These unit values reflect the fair values of the financial assets contained within the Group’s unitised investment funds linked to the financial liability. The fair value of the financial liabilities is obtained by multiplying the number of units attributed to each contract holder at the financial reporting date by the unit value for the same date.
When the investment contract has an embedded put or surrender option, the fair value of the financial liability is never less than the amount payable on surrender, discounted for the required notice period, where applicable. For investment contracts with fixed and guaranteed terms, the amortised cost basis is used. In this case, the liability is initially measured at its fair value less transaction costs that are incremental and directly attributable to the acquisition or issue of the contract.
Subsequent measurement of investment contracts at amortised cost uses the effective interest method. This method requires the determination of an interest rate (the effective interest rate) that exactly discounts to the net carrying amount of the financial liability, the estimated future cash payments or receipts through the expected life of the financial instrument or, when appropriate, a shorter period if the holder has the option to redeem the instrument earlier than maturity.
The Group re-estimates at each reporting date the expected future cash flows and recalculates the carrying amount of the financial liability by computing the present value of estimated future cash flows using the financial liability’s original effective interest rate. Any adjustment is immediately recognised as income or expense in the income statement.
(g) Property and equipment
Land and buildings are shown at fair value, based on periodic, but at least triennial, valuations by external independent valuers, less subsequent depreciation for buildings. Any accumulated depreciation at the date of revaluation is eliminated against the gross carrying amount of the asset and the net amount is restated to the revalued amount of the asset. All other property and equipment are stated at historical cost less depreciation. Historical cost includes expenditure that is directly attributable to the acquisition of the items.
Land is not depreciated. Depreciation on other assets is calculated using the straight-line method to allocate their cost or revalued amounts to their residual values over their estimated useful lives, as follows:
Leasehold building The shorter of the lease period or 50 years
Furniture and fitting 10 years
Motor vehicles 3 - 5 yearsComputers and office equipment
4 - 5 years
42 ANNUAL REPORT & FINANCIAL STATEMENTS 2014

2. Summary of significant accounting policies (continued)
(g) Property and equipment (continued)
Subsequent costs are included in the asset’s carrying amount or recognised as a separate asset, as appropriate, only when it is probable that future economic benefits associated with the item will flow to the Group and the cost of the item can be measured reliably. All other repairs and maintenance are charged to the profit or loss during the financial period in which they are incurred.
Property and equipment are reviewed annually for impairment. Where the carrying amount of an asset is greater than its estimated recoverable amount, it is written down immediately to its recoverable amount.Gains and losses on disposal of property and equipment are determined by comparing the proceeds with the carrying amounts and are taken into account in determining operating profit. Buildings are revalued on an annual basis with the change credited/debited to revaluation reserves in equity. Decreases that offset previous increases of the same asset are charged against the revaluation reserves.On disposal of revalued assets, amounts in the revaluation reserve relating to that asset are transferred to retained earnings.
Costs associated with maintaining computer software programmes are recognised as an expense as incurred. Development costs that are directly attributable to the design and testing of identifiable and unique software products controlled by the Group are recognised as intangible assets when the following criteria are met:
• It is technically feasible to complete the software product so that it will be available for use;
• Management intends to complete the software product and use or sell it;
• There is an ability to use or sell the software product
• It can be demonstrated how the software product will generate probable future economic benefits;
• Adequate technical, financial and other resources to complete the development and to use or sell the software product are available; and
• The expenditure attributable to the software product during its development can be reliably measured.
(h) Intangible assets
(i) Computer software
Directly attributable costs that are capitalised as part of the software product include the software development employee costs and an appropriate portion of relevant overheads. Other development expenditures that do not meet these criteria are recognised as an expense as incurred. Development costs previously recognised as an expense are not recognised as an asset in a subsequent period. Computer software development costs recognised as assets are amortised over their estimated useful lives, which does not exceed seven years.
(ii) Goodwill
Goodwill arises on the acquisition of subsidiaries and associates. It represents the excess of the consideration transferred over the Group’s interest in net fair value of the net identifiable assets, liabilities and contingent liabilities of the acquiree and the fair value of the non-controlling interest in the acquiree.
For the purpose of impairment testing, goodwill acquired in a business combination is allocated to each of the cash generating units (CGUs), or
43ANNUAL REPORT & FINANCIAL STATEMENTS 2014

2. Summary of significant accounting policies (continued)
(h) Intangible assets (countinued)
groups of CGUs that is expected to benefit from the synergies of the combination. Each unit or group of units to which the goodwill is allocated represents the lowest level within the entity at which the goodwill is monitored for internal management purposes. Goodwill is monitored at the operating segment level.
Goodwill impairment reviews are undertaken annually or more frequently if events or changes in circumstances indicate a potential impairment. The carrying value of goodwill is compared to the recoverable amount, which is the higher of value in use and the fair value less costs to sell. Any impairment is recognised immediately as an expense and is not subsequently reversed.
(i) Impairment of non-financial assets
Intangible assets that have an indefinite useful life or intangible assets not ready to use are not subject to amortisation and are tested annually for impairment. Assets that are subject to amortisation are reviewed for impairment whenever events or changes in circumstances indicate that the carrying amount may not be recoverable. An impairment loss is recognised for the amount by which the asset’s carrying amount exceeds its recoverable amount. The recoverable amount is the higher of an asset’s fair value less costs of disposal and value in use. For the purposes of assessing impairment, assets are grouped at the lowest levels for which there are largely independent cash inflows (cash-generating units). Prior impairments of non-financial assets (other than goodwill) are reviewed for possible reversal at each reporting date.
( j) Investment property
Buildings, or part of a building (freehold or held under a finance lease) and land (freehold or held under an operating lease) held for long term rental yields and/or capital appreciation and which are not occupied by the Group are classified as investment property. Investment property is treated as a long term investment and is carried at fair value, representing open market value determined annually by external valuers. Changes in fair values are included in investment income in the profit or loss. Land held under operating lease is classified and accounted for as investment property if and only if the property meets the definition of an investment property.
On disposal of an investment property, the difference between the net disposal proceeds and the carrying amount is charged or credited to the profit or loss.
Properties under construction and development sites with projected use as investment properties are valued at projected fair values taking into account current market conditions, outstanding investment costs and a risk loading according to the progress of the project
(k) Financial instruments
The Group classifies its financial assets into the following categories: financial assets at fair valuethrough profit or loss; loans, advances and receivables; held-to-maturity financial assets; and available-for-sale assets. Management determines the appropriate classification of its financial assets at initial recognition. (a) Financial assets at fair value through profit or loss
This category has two sub-categories: financial assets held for trading, and those designated at fair value through profit or loss at inception. A financial asset is classified as held-for-trading if acquired principally for the purpose of selling in
44 ANNUAL REPORT & FINANCIAL STATEMENTS 2014

2. Summary of significant accounting policies (continued)
(k) Financial instruments (continued)
the short term. Derivatives are also categorised as held-for-trading. Financial assets are desig-nated at fair value through profit or loss when:
(i) Doing so significantly reduces or eliminates a measurement inconsistency; or (ii) They form part of a group of financial assets that is managed and evaluated on a fair value basis in accordance with a documented risk management or investment strategy and reported to key management personnel on that basis.
These assets are initially recorded at fair value. Subsequent to initial recognition, these investments are re-measured at fair value. Fair value adjustments and realised gain and loss are recognised in the income statements.
Financial assets at fair value through profit or loss comprise quoted shares, government securities commercial paper and corporate bonds.
(b) Loans, advances and receivables
Loans, advances and receivables are non-derivative financial assets with fixed or determinable payments that are not quoted in an active market, other than: (a) those classified as held for trading and those that the Group on initial recognition designates as at fair value through profit or loss; (b) those that the Group upon initial recognition designates as available-for-sale; or (c) those for which the holder may not recover substantially all of its initial investment, other than because of credit deterioration.
The Group’s receivables out of direct insurance and reinsurance arrangements, mortgage loans, loans to policy holders, deposits with financial institutions under the cash category, reinsurer’s share of insurance liabilities, receivables
from related parties and other receivables are classified in this category. The assets in this category had a total carrying value of Shs 1,686,259,000 as at 31 December 2013.The company’s assets in this category at the end of the year were Shs 1,435,814,000.
(c) Held-to-maturity
Held-to-maturity assets are non-derivative financial assets with fixed or determinable payments and fixed maturities that management has the positive intention and ability to hold to maturity. Were the Group to sell more than an insignificant amount of held-to-maturity assets, the entire category would have to be reclassified as available for sale.
Certain investments in government securities and corporate bonds are classified in this category. The assets in this category had a total carrying value of Shs 6,496,368,000 at the financial reporting date of 31 December 2013. The Company’s assets in this category at the end of the year were Shs 6,494,874,000.
(l) Offsetting financial instruments
Financial assets and liabilities are offset and the net amount reported in the statement of financial position when there is a legally enforceable right to offset the recognised amounts and there is an intention to settle on a net basis or realise the asset and settle the liability simultaneously.
Recognition, de-recognition and measurement
Financial assets are initially recognised at fair value plus, for all financial assets except those carried at fair value through profit or loss, transaction costs. Financial assets are de-recognised when the rights to receive cash flows from the financial assets have expired or where the Company has transferred substantially all risks and rewards of ownership.
45ANNUAL REPORT & FINANCIAL STATEMENTS 2014
2. Summary of significant accounting policies (continued)
(l) Offsetting financial instruments (continued)
Loans, advances and receivables and held to maturity financial assets are carried at amortised cost using the effective interest rate method. Gains and losses arising from changes in the fair value of ‘financial assets at fair value through profit or loss’ are included in the income statement in the period in which they arise. Fair values of quoted investments in active markets are based on current bid prices. Fair values for unlisted equity securities are estimated using valuation techniques. These include the use of recent arm’s length transactions, discounted cash flow analysis and other valuation techniques commonly used by market participants. Equity securities for which fair values cannot be measured reliably are recognised at cost less impairment.
Financial liabilities
All the Group’s financial liabilities are measured at amortised cost. These include payables under deposit administration and creditors arising from reinsurance arrangements. Financial liabilities are initially measured at fair value and subsequently at amortised cost. Financial liabilities are derecognised when extinguished.
(m) Impairment of financial assets
The Group assesses at each financial reporting date whether there is objective evidence that a financial asset or a group of financial assets is impaired. A financial asset or a group of financial assets is impaired and impairment losses are incurred only if there is objective evidence of impairment as a result of one or more events that occurred after initial recognition of the asset (a ‘loss event’) and that loss event (or events) has an impact on the estimated future cash flows of
the financial asset or group of financial assets that can be reliably estimated such as:
(i) significant financial difficulty of the borrower;
(ii) a breach of contract, such as default or delinquency in interest or principal repayments;
(iii) the Group granting to the borrower, for economic or legal reasons relating to the borrower’s financial difficulty, a concession that the Group would not otherwise consider;
(iv) it becoming probable that the borrower will enter bankruptcy or other financial reorganisation;
(v) the disappearance of an active market for that financial asset because of financial difficulties;
(vi) observable data indicating that there is a measurable decrease in the estimated future cash flows from a group of financial assets since the initial recognition of those assets, although the decrease cannot yet be identified with the individual financial assets in the group, including:
• Adverse changes in the payment status of borrowers in the group; or
• National or local economic conditions that correlate with defaults on the assets in the group; or
(vii) Significant or prolonged decline in the fair value of investments in equity instruments below their cost and its identification is determined by management for each identified portfolio.
46 ANNUAL REPORT & FINANCIAL STATEMENTS 2014
2. Summary of significant accounting policies (continued)
(m) Impairment of financial assets (continued)
(i) Assets carried at amortised cost
The Company assesses whether objective evidence of impairment exists for individual financial assets. If there is objective evidence that an impairment loss on financial assets carried at amortised cost has been incurred, the amount of the loss is measured as the difference between the asset’s carrying amount and the present value of estimated future cash flows (excluding future credit losses that have not been incurred) discounted at the financial instrument’s original effective interest rate. The carrying amount of the asset is reduced through the use of an allowance account and the amount of the loss is recognised in the income statement. If a loan or held-to-maturity asset has a variable interest rate, the discount rate for measuring any impairment loss is the current effective interest rate determined under the contract. As a practical expedient, the Company may measure impairment on the basis of an instruments fair value using an observable market price.
The calculation of the present value of the estimated future cash flows of a collateralised financial asset reflects the cash flows that may result from foreclosure less costs for obtaining and selling the collateral, whether or not foreclosure is probable.
(ii) Re-negotiated loans
Loans that are either subject to collective impairment assessment or individually significant and whose terms have been renegotiated are no longer considered to be past due but are treated as new loans. In subsequent years, the renegotiated terms apply in determining whether the asset is considered to be past due.
(iii) Cash and cash equivalents
Cash and cash equivalents are carried in the statement of financial position at amortised cost. For the purposes of the statement of cash flows, cash and cash equivalents comprise cash on hand, deposits held at call with banks, other short-term highly liquid investments with original maturities of three months or less, and bank overdrafts.
(n) Employee benefits
Employee entitlements to long service awards are recognised when they accrue to employees. A provision is made for the estimated liability for such entitlements as a result of services rendered by employees up to the financial reporting date.
The estimated monetary liability for employees’ accrued annual leave entitlement at the financial reporting date is recognised as an expense accrual.
(o) Current and deferred income tax
The tax expense for the period comprises current and deferred income tax. Tax is recognised in the profit or loss except to the extent that it relates to items recognised in other comprehensive income or directly in equity. In this case, the tax is also recognised in other comprehensive income or directly in equity, respectively.
The current income tax charge is calculated on the basis of the tax enacted or substantively enacted at the reporting date. Management periodically evaluates positions taken in tax returns with respect to situations in which applicable tax regulation is subject to interpretation.
It establishes provisions where appropriate on the basis of amounts expected to be paid to the tax authorities.
47ANNUAL REPORT & FINANCIAL STATEMENTS 2014

2. Summary of significant accounting policies (continued)
(o) Current and deferred income tax (continued)
Deferred income tax is recognised, using the liability method, on temporary differences arising between the tax bases of assets and liabilities and their carrying values in the financial statements. However, if the deferred tax liabilities are not recognised if they arise from the initial recognition of goodwill; deferred income tax is not accounted for if it arises from initial recognition of an asset or liability in a transaction other than a business combination that at the time of the transaction affects neither accounting nor taxable profit nor loss. Deferred income tax is determined using tax rates and laws that have been enacted or substantively enacted at the reporting date and are expected to apply when the related deferred income tax liability is settled.
Deferred income tax assets are recognised only to the extent that it is probable that future taxable profits will be available against which the temporary differences can be utilised. Deferred income tax is provided on temporary differences arising on investments in subsidiaries and associates, except where the timing of the reversal of the temporary difference is controlled by the Group and it is probable that the temporary difference will not reverse in the foreseeable future.Deferred income tax assets and liabilities are offset when there is a legally enforceable right to offset current tax assets against current tax liabilities and when the deferred income taxes assets and liabilities relate to income taxes levied by the same taxation authority on either the same taxable entity or different taxable entities where there is an intention to settle the balances on a net basis.
(p) Borrowings
Borrowings are recognised initially at fair value, net of transaction costs incurred. Borrowings
are subsequently stated at amortised cost using the effective interest method; any differences between proceeds (net of transaction costs) and the redemption value is recognised in the profit or loss over the period of the borrowings.General and specific borrowing costs directly attributable to the acquisition, construction or production of qualifying assets, which are assets that necessarily take a substantial period of time to get ready for their intended use or sale, are added to the cost of those assets, until such time as the assets are substantially ready for their intended use or sale. Investment income earned on the temporary investment of specific borrowings pending their expenditure on qualifying assets is deducted from the borrowing costs eligible for capitalisation. All other borrowing costs are recognised in profit or loss in the period in which they are incurred.
(q) Dividends
Dividends payable to the Group’s shareholders are charged to equity in the period in which they are declared. Proposed dividends are shown as a separate component of equity until declared.
(r) Share capital
Ordinary shares are classified as ‘share capital’ in equity. Any premium received over and above the par value of the shares is classified as ‘share premium’ in equity. Incremental costs directly attributable to the issue of new ordinary shares are shown in equity as deduction from the proceeds net of tax.
3. Critical accounting estimates and judgements in applying accounting policies
The Group makes estimates and assumptions that affect the reported amounts of assets and
48 ANNUAL REPORT & FINANCIAL STATEMENTS 2014

3. Critical accounting estimates and judgements in applying accounting policies (continued)
liabilities within the next financial year. Estimates and judgements are continually evaluated and are based on historical experience and other factors, including expectations of future events that are believed to be reasonable under the circumstances.
a) Impairment of goodwill
The Group tests annually whether goodwill has suffered any impairment, in accordance with the accounting policy stated in Note 2 h(ii). The recoverable amounts of cash-generating units have been determined based on value-in-use calculations. The carrying amount of the goodwill and the key assumptions made are set out in Note 18.
b) Fair value estimation
The fair value of financial instruments that are not traded in an active market is determined by using valuation techniques. The Group uses its judgement to select a variety of methods and make assumptions that are mainly based on market conditions existing at the end of each reporting date. The Group has used a discounted cash flow analysis for various financial assets that are not traded in active markets.
c) Income taxes
The Group is subject to income taxes in various jurisdictions. Significant judgment is required in determining the Group’s provision for income taxes. There are many transactions and calculations or which the ultimate tax determination is uncertain during the ordinary course of business. The Group recognises liabilities for anticipated tax audit issues based on estimates of whether additional taxes will be due. Where the final tax outcome of these
matters is different from the amounts that were initially recorded, such differences will impact the income tax and deferred tax provisions in the period in which such determination is made.
d) The classification of financial investments
In applying the Groups accounting policies, management has made judgement in determining the classification of financial investments as held-to-maturity, available for sale and loans and receivables in line with IAS 39. The classifications require judgement of the Group’s ability and intention to hold the investments to maturity.
e) Insurance contract liabilities
It is the statutory requirement in Kenya that the insurance contract liabilities are calculated on the statutory Net Present Valuation (NPV) basis. The NPV is intended to measure the solvency of the life operation on a stable basis and examines the business from the point of view of premiums that are net of standard expense allowances the value of future net premium is compared with the cost of providing contractual policyholder benefits over the duration of the policy. When performing the liability adequacy test, all classes for which undiscounted liabilities were calculated, a discounted cash flow model was created based on the “best estimate” assumptions. Prudent margins are added to these to project cash flows. These are then discounted at the valuation interest rate.
f) MortalityAn appropriate base table of standard mortality is chosen depending on the type of contract and class of business. Industry standard tables are used for smaller classes of business, while Group specific tables are used for larger classes. Estimates are made as to the expected number of deaths for each of the years in which the Group is exposed to risk.
49ANNUAL REPORT & FINANCIAL STATEMENTS 2014

3. Critical accounting estimates and judgements in applying accounting policies (continued)
g) Insurance contract liabilities
The Group bases these estimates on standard mortality tables that reflect historical mortality experience. The estimated number of deaths determines the value of the benefit payments and the value of the valuation premiums. The main source of uncertainty is that epidemics such as AIDS could result in future mortality being significantly worse than in the past for the age Groups in which the Group has significant exposure to mortality risk. However, continuing improvements in medical care and social conditions could result in improvements in longevity in excess of those allowed for in the estimates used to determine the liability for contracts where the Company is exposed to longevity risk. For contracts without fixed terms, it is assumed that the Group will be able to increase mortality risk charges in future years in line with emerging mortality experience.
An investigation into mortality experience is performed annually. The period investigation extends over the latest three full years for larger classes of business. Investigations relating to smaller classes usually extend over five years in order to gain sufficient credibility of the data. The results of the investigation are used to set the valuation assumptions, which are taken as an adjustment to the respective standard table.
In setting the assumptions, provision is made for the expected increase in AIDS-related claims. In general, Actuarial Society of South Africa (ASSA) models are used to allow AIDS-related claims. The practice differs by class of business, however for major classes of business, a basic allowance for AIDS related deaths is included in the base mortality rates against which annual mortality investigations are conducted. A further discretionary margin is then held using the ASSA2000 lie model.
(i) MorbidityThe incidence of disability claims is derived from industry experience studies, adjusted where appropriate for Group Companies own experience. The same is true for the incidence of recovery from disability.
(ii) MedicalThe incidence of medical claims is derived from the risk premium rates determined from annual investigations. This is adjusted where appropriate to allow for the future expected experience.
(iii) WithdrawalThe withdrawal assumptions are based on the most recent withdrawal investigations taking into account past as well as expected future trends. The withdrawal rates are analysed by product type and policy duration. These withdrawal rates vary considerably by duration and policy term. Typically the rates are higher for risk type products versus investment type products, and are higher at early durations.
(iv) CorrelationNo correlations between assumptions are allowed for.
4. Segmental reporting
The Group is currently organised in line with the Insurance Act which classifies insurance and investment contracts into two main categories (long-term and general) depending on the duration of risk. The results of the business units are reviewed regularly by management in order to make decisions about resources to be allocated to segments and assessing segment performance. The Group is required to produce segmented financial statements i.e. profit or loss and statement of financial position in compliance with IFRS 8.
50 ANNUAL REPORT & FINANCIAL STATEMENTS 2014

4. Segmental reporting (continued)
An operating segment is a component of the Group engaged in business activities, whose operating results are reviewed regularly by management in order to make decisions about resources to be allocated to segments and assessing segment performance. Identification of segments and the measurement of segment result is based on the Group’s internal reporting to management. The geographical spread (across borders) is also used as a part of performance analysis.
a) Long term business
Includes insurance business of all or any of the following classes, namely, life assurance business, superannuation business, industrial life assurance business and bond investment business and business incidental to any such class of business;
Life assurance business means the business of, or in relation to, the issuing of, or the undertaking of liability to pay money on death (not being death by accident or in specified sickness only) or on the happening of any contingency dependent on the termination or continuance of human life (either with or without provision for a benefit under a continuous disability insurance contract), and include a contract which is subject to the payment of premiums for term dependent on the termination or continuance of human life and any contract securing the grant of an annuity for a term dependent upon human life;
Superannuation business means life assurance business, being business of, or in relation to, the issuing of or the undertaking of liability under superannuation, Group life and permanent health insurance policy.
b) General insurance business
Includes insurance business of any class or classes not being long term insurance business. Classes of General Insurance include Aviation
insurance, Engineering insurance, Fire insurance - domestic risks, Fire insurance - industrial and commercial risks, Liability insurance, Marine Insurance, Motor insurance - private vehicles, Motor insurance - commercial vehicles, Personal accident insurance, Theft insurance, Workmen’s Compensation and Employer’s Liability insurance and Miscellaneous insurance (i.e. class of business not included under those listed above)
Motor insurance business means the business of affecting and carrying out contracts of insurance against loss of, or damage to, or arising out of or in connection with the use of, motor vehicles, inclusive of third party risks but exclusive of transit risks.
Personal Accident insurance business means the business of affecting and carrying out contracts of insurance against risks of the persons insured sustaining injury as the result of an accident or of an accident of a specified class or dying as the result of an accident or of an accident of a specified class or becoming incapacitated in consequence of disease or of disease of a specified class.
Fire insurance business means the business of affecting and carrying out contracts of insurance, otherwise than incidental to some other class of insurance business against loss or damage to property due to fire, explosion, storm and other occurrences customarily included among the risks insured against in the fire insurance business.
a) Major Customers
The Group does not have any one major customer that contributes more than 10 percent of its revenues.
51ANNUAL REPORT & FINANCIAL STATEMENTS 2014

4. Segmental reporting (continued)
Results by business units (continued)
52 ANNUAL REPORT & FINANCIAL STATEMENTS 2014

4.Segmental reporting
Results by business units (continued)
53ANNUAL REPORT & FINANCIAL STATEMENTS 2014

4. Segmental reporting (continued)Results by geographical spread
The Tanzania subsidiary contributed approximately 17.2% of the Group’s 2014 consolidated income
54 ANNUAL REPORT & FINANCIAL STATEMENTS 2014

4. Segmental reporting (continued)Results by geographical spread (continued)
The Tanzania subsidiary contributed approximately 18.3% of the Group’s 2013 consolidated income
55ANNUAL REPORT & FINANCIAL STATEMENTS 2014

5. Management of insurance and financial risk policies
Liberty Kenya Holdings Limited (the Group) offers a comprehensive range of financial products and services to the retail and corporate markets, distributing tailored risk, insurance, investment, retirement and health products through its network. The Group is committed to increasing shareholder value through the prudent management of risks inherent in the production, distribution and maintenance of these products and services. The Group is mindful of achieving this objective in the interests of all stakeholders. The Group continues to explore opportunities to develop and grow its business organically, with strategic plans being subject to careful consideration of the trade-off between risk and reward, taking into account the risk appetite limits approved by the board.
The Group’s main value creation activities can be summarised into the following categories:
1. Providing risk cover – Liberty Kenya Holdings Limited’s core competency is to understand the life, health and asset related risk needs of individuals and Groups, and design sustainable products that provide financial security to policyholders and their families in times of death, sickness or ill health, disability and other losses.
2. Providing asset management services – primarily through its subsidiaries, the Group uses its financial skills to provide competitive investment products and investment advice to a broad range of customers.
3. Assuming market risk – through the management of assets backing shareholder funds and of exposures arising from asset-liability mismatches which the Group wishes to retain.
Ultimate responsibility for risk management resides with the Board which ensures that all business unit executives are responsible and are held accountable for risk management within the subsidiaries. Risks are controlled at the level of individual exposures and at portfolio level, as well as in aggregate across all businesses and risk types.
a) Risk management objectives
The Group’s key risk management objectives are to:
• Grow shareholder value by generating a long-term sustainable return on capital;
• Ensure the protection of policyholder and investor interests by maintaining adequate solvency levels;
• Meet the statutory requirements of the Kenyan Insurance Act, and other regulators; and
• Ensure that capital and resources are strategically focused on activities that generate the greatest value on a risk adjusted basis.
The management of risks is currently focused on managing shareholder exposures within strategic limits whilst ensuring sufficient allocation of capital on both a regulatory and economic capital basis given the limits in place.
56 ANNUAL REPORT & FINANCIAL STATEMENTS 2014

5. Management of insurance and financial risk policies (continued)
b) Capital management
The capital management strategy seeks to ensure that the Group is adequately capitalised to support the risks assumed by the Group in accordance with the Group’s risk appetite. It further seeks to fund working capital and strategic requirements, thereby protecting policyholder and customer interests while optimising shareholder risk adjusted returns and delivering in accordance with the Group’s dividend policy.
Due to varying requirements of different stakeholders, the Group reports and manages capital on a number of different bases. The capital management process ensures that the Group’s available capital exceeds the capital required both currently and going forward and to ensure that the Group has unfettered access to its capital at all times to meet its requirements.
(i) Company
The Company’s objective in capital management is to safeguard the Company’s ability to continue as going concern in order to provide returns for shareholders and to maintain an optimal capital structure to reduce the cost of capital. In order to maintain or adjust the capital structure, the Company may limit the amount of dividends paid to shareholders, issue new shares or sell assets to reduce debt.
The Company monitors capital on the basis of the gearing ratio. This ratio is calculated as net debt divided by total capital. Net debt is calculated as total borrowings less cash and cash equivalents.
Total capital is calculated as equity plus net debt.
Company2014
Shs’0002013
Shs’000
Total borrowings (Note 28) 231,852 170,535
Due from group companies (Note 32) (163,918) (115,389)
Net borrowings 67,934 55,146
Less: cash and cash equivalents (Note 24) (77,610) (37,223)
Net debt (9,676) 17,923
Total equity 3,048,091 3,069,021
Gearing ratio -0.32% 0.58%
57ANNUAL REPORT & FINANCIAL STATEMENTS 2014
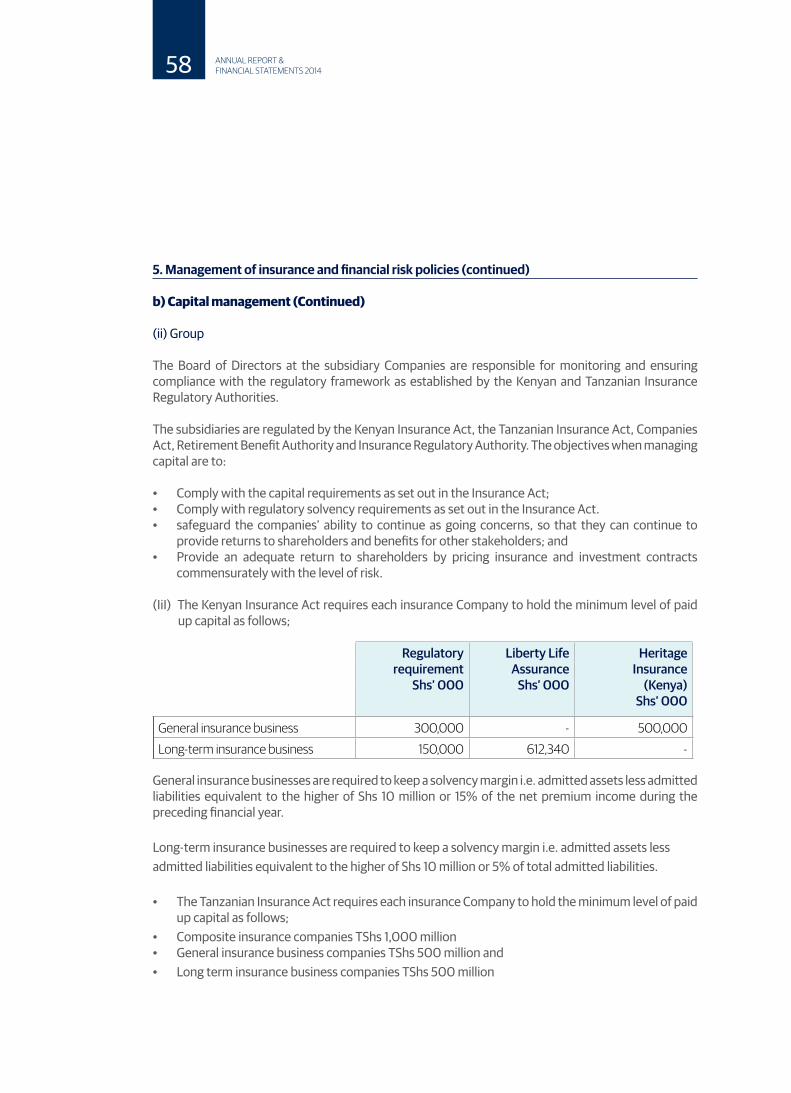
5. Management of insurance and financial risk policies (continued)
b) Capital management (Continued)
(ii) Group
The Board of Directors at the subsidiary Companies are responsible for monitoring and ensuring compliance with the regulatory framework as established by the Kenyan and Tanzanian Insurance Regulatory Authorities.
The subsidiaries are regulated by the Kenyan Insurance Act, the Tanzanian Insurance Act, Companies Act, Retirement Benefit Authority and Insurance Regulatory Authority. The objectives when managing capital are to:
• Comply with the capital requirements as set out in the Insurance Act;• Comply with regulatory solvency requirements as set out in the Insurance Act.• safeguard the companies’ ability to continue as going concerns, so that they can continue to
provide returns to shareholders and benefits for other stakeholders; and• Provide an adequate return to shareholders by pricing insurance and investment contracts
commensurately with the level of risk.
(IiI) The Kenyan Insurance Act requires each insurance Company to hold the minimum level of paid up capital as follows;
General insurance businesses are required to keep a solvency margin i.e. admitted assets less admitted liabilities equivalent to the higher of Shs 10 million or 15% of the net premium income during the preceding financial year.
Long-term insurance businesses are required to keep a solvency margin i.e. admitted assets less admitted liabilities equivalent to the higher of Shs 10 million or 5% of total admitted liabilities.
• The Tanzanian Insurance Act requires each insurance Company to hold the minimum level of paid up capital as follows;
• Composite insurance companies TShs 1,000 million • General insurance business companies TShs 500 million and • Long term insurance business companies TShs 500 million
Regulatoryrequirement
Shs’ 000
Liberty LifeAssurance
Shs’ 000
HeritageInsurance
(Kenya)Shs’ 000
General insurance business 300,000 - 500,000
Long-term insurance business 150,000 612,340 -
58 ANNUAL REPORT & FINANCIAL STATEMENTS 2014

5. Management of insurance and financial risk policies (continued)
b) Capital management (Continued)
As at year end, the Heritage Insurance Company (T) Limited had a total of 100,000 ordinary shares with a par value of Tsh. 100,000 of which 60,000 share capital were issued and fully paid. (2013: 60,000 with a par value of Tshs 100,000 each) This was in excess of the minimum requirement.
(iv) Solvency margin
The solvency margins of the subsidiaries as at 31 December 2014 and 31 December 2013 are set out below:
59ANNUAL REPORT & FINANCIAL STATEMENTS 2014
5. Management of insurance and financial risk policies (continued)
c) Credit risk
Definition
Credit risk refers to the risk of loss or of adverse change in the financial position resulting, directly or indirectly from fluctuations in the credit standing of counterparties and any debtors to which shareholders and policyholders are exposed. Credit risk is a function of exposure at default and probability of default and comprises default, settlement and spread risk.
• Default risk is the risk of credit loss as a result of failure by counterparty to meet its financial and/or contractual obligations. It has three components:
Issuer risk: the exposure at default (EAD) arising from traded credit products.
Primary credit risk: the EAD arising from lending and related product activities. Primary credit risk generally refers to non-tradable, illiquid or hold-to-maturity credit risk.
Settlement risk: is the risk of loss from a transaction settlement, where value is exchanged, failing which the counter value is not received in whole or part.
• Spread risk (also known as credit migration risk) is the result of changes to spreads due to changing circumstances (micro and macro). It is the risk that a portfolio or counterparty’s credit quality will materially deteriorate over time without allowing for a reprising of the exposure to compensate for the higher probability of default risk being carried.
Key activities that result in the origination of credit risk are:
• financial asset instruments including debt instruments (including bonds, loans and term deposits and investment policies);
• reinsurance assets including amounts due from reinsurers in respect of claims already paid;
• certain debtor accounts within the financial position categories of prepayments, insurance and other receivables;
• rental due where tenants have signed lease contracts for space within the Group’s investment properties;
• Cash and cash equivalents.
Counterparty types to which the Group is exposed to credit risk include sovereigns (governments), state owned enterprises, financial institutions and corporate entities. In addition, the Group is also exposed to credit risk through investment in securitisation issuance, mutual funds and investment policies.
Reinsurance assets
Reinsurance is used to manage insurance risk and consequently, in the liability valuation process, reinsurance assets are raised for expected recoveries on projected claims. This does not, however, discharge the Group’s liability as primary insurer. In addition, reinsurance debtors are raised for specific recoveries on claims recognised.Creditworthiness is assessed when appointing reinsurers. Financial position strength, performance, track record, relative size and ranking within the industry and credit ratings of reinsurers are taken into account when determining the allocation of business to reinsurers. Credit exposure to reinsurers is also limited through the use of several reinsurers. A review of these reinsurers is continuously done.Furthermore, to mitigate credit exposures to reinsurers, reassurance management performs the following annual checks on reinsurers:
60 ANNUAL REPORT & FINANCIAL STATEMENTS 2014

5. Management of insurance and financial risk policies (continued)
c) Credit risk (Continued)
• Copies of reinsurers’ claim paying abilities, as assessed by reputable rating agencies, and copies of valuators’ certificates are obtained and analysed;
• Meetings and administration process audits are conducted with reinsurers with whom the Group has larger exposures; and
• Reinsurance agreements are reviewed and amended as appropriate with accurate and complete records kept up to date.
Insurance and other receivables
The Group has formalised procedures in place to collect or recover amounts receivable. In the event of default, these procedures include industry supported lists that help to prevent rogue agents, brokers and intermediaries from conducting further business with Liberty Kenya Holdings Limited. Full impairment is made for non-recoverability as soon as management is uncertain as to the recovery.
Credit assessment changes recognised in the income statement
Fair value instruments
The Group invests in both listed and unlisted debt instruments. Changes to credit spreads for listed instruments are based on available market information and/or a proxy (where appropriate), combined with management input and override depending on the liquidity of the listed asset. Unlisted financial assets are generally not actively traded and changes to the credit spread for these instruments are fair valued with reference to proxy listed assets (where appropriate), combined with management input and override, market research and other compelling evidence which is all collated to form a view on current value.
Mortgages and loans, comprising policy loans, are impaired when the amount of the loan exceeds the policyholder’s investment balance. The mortgages and loans are recoverable through offset against their respective liabilities (policy benefits) at policy maturity date.
The impairment loss is determined on an incurred loss approach as the difference between the instrument’s carrying value and the present value of the asset’s estimated future cash flows, including any recoverable collateral, discounted at the instrument’s original effective interest rate. To provide for latent losses in a portfolio of loans where the loans have not yet been individually identified as impaired, impairment for incurred but not reported losses is recognised based on historic loss patterns and estimated emergence periods.
The amount that best represents the Group’s maximum exposure to credit risk at 31 December 2014 is made up as follows:
61ANNUAL REPORT & FINANCIAL STATEMENTS 2014

Maximum exposure to credit risk before collateral held
Group Company
2014Shs’ 000
2013Shs’ 000
2014Shs’ 000
2013Shs’ 000
Financial investments 19,098,156 15,949,076 - -Receivable arising from reinsurance 489,991 439,166 - -Receivablearising fromdirect insurance 1,324,014 775,189 - -Reinsurers’ share of insurance liabilities 2,103,145 3,822,104 - -Other receivables 335,574 461,873 - -Cash and bank balances 6,251,762 6,452,983 77,610 37,223
29,602,642 27,900,391 77,610 37,223
None of the above assets are past due or impaired except for insurance receivables (which are due upon invoicing):
Group
2014Shs’ 000
2013Shs’ 000
Neither past due nor impaired 1,030,163 457,151Past due but not impaired 293,851 256,054Impaired 215,967 205,230Gross 1,539,981 918,435Less: allowance for impairment (215,967) (205,230)Net 1,324,014 713,205
62 ANNUAL REPORT & FINANCIAL STATEMENTS 2014

5. Management of insurance and financial risk policies (continued)
c) Credit risk (Continued)
Group
2014 2013
Shs’ 000 Shs’ 000Past due but not impaired:-by up to 30 days 58,097 55,207-by 31 to 60 days 90,288 54,505-by 61 to 150 days 131,437 130,362-by 151 to 360 days 14,029 15,980
Total past due but not impaired 293,851 256,054
All receivables past due by more than 360 days are considered to be impaired, and are carried at their estimated recoverable value.
Consideration of own credit risk for financial liabilities measured at fair value through profit or lossLiberty Kenya Holdings Limited has considered the impact of changes in credit risk in the fair value measurement of its policyholder investment contract liabilities. Credit risk changes will only have a significant impact in extreme circumstances, when the Group’s ability to fulfil the contract terms is considered to be under threat. The Group remains well capitalised and accordingly no adjustment to the valuation for credit risk has been made for the years under review.
d) Operational risk
Definition
Operational risk is the risk of loss caused by inadequate or failed internal processes, people and systems, or from external events. Operational risk is therefore pervasive across all financial institutions and all other operational companies.
Operational risk is recognized as a distinct risk category which the Group strives to manage within acceptable levels through sound operational risk management practices. The Group’s approach to managing operational risk is to adopt practices that are fit for purpose to suit the organizational maturity and particular business environments.
Executive management defines the operational risk appetite at a Group and subsidiary level. This operational risk appetite supports effective decision-making and is central to embedding effective risk management. The objective in managing operational risk is to increase the efficiency and effectiveness of the Group’s resources, minimize losses and utilize opportunities.
63ANNUAL REPORT & FINANCIAL STATEMENTS 2014

5. Management of insurance and financial risk policies (continued)
d) Operational risk (Continued)
Ownership and accountability
Management and staff at every level of the business are accountable for the day-to-day identification and management of operational risks. It is also management’s responsibility to report any material operational risks, risk events and issues identified to senior management through certain pre-defined escalation procedures.
Risk identification, assessment and measurement
The process of operational risk management starts with the operational risk assessment of identified areas. Consideration is then given to the need for a Group or business unit policy to define the approach to mitigating this risk.
Risk and compliance policies are developed where necessary to:• ensure compliance with internal principles
and with legal and regulatory requirements;
• address associated risks in the business, define roles, responsibilities and expectations at all levels;
• guide staff at all levels on how to conduct Group’s business;
• ensure that staff apply consistent processes throughout the Group; and
• help management to develop operating processes.
Policies are approved at the appropriate governance level subject to compliance with Group policy principles. Once identified, operational risks are assessed to determine the potential impact to the Group should the risk
events occur, and reviewed against the Group’s risk appetite. Mitigating actions are developed for any operational risks that fall outside of management’s assessment of risk appetite.
Risk management activities in relation to operational risks include but are not limited to:
Information technology (IT) risk: The Group is highly dependent on and constantly increasing its use of information technology to ensure improved operations and customer service. The Group’s IT systems enable it to take its products to markets across the East African Region and so carry out its expansion strategy.The Group is, therefore, exposed to various IT risks which include the disruption of transaction processing, information loss and/or malicious attacks from third parties.
Maintaining technological advantage requires a strong IT risk management culture and function that allows the Group to identify and manage IT risks effectively. In order to prevent potential risk eventsand ensure best practice levels of continuous IT service and security, management review and ensure compliance with relevant IT policies and procedures, conduct control and risk self-assessments and are subject to internal and external audits.
Process risk: The Group’s approach to process improvement focuses on process efficiency and work quality. The processes undergoing improvement incorporate input from risk and compliance specialists, as well as other generic process stakeholders and Group finance.
Regulatory risk: The regulatory environment is monitored closely to ensure that the Group implements new or amended legislation requirements promptly to ensure compliance and avoid unnecessary fines and penalties or the revocation of any business license.
64 ANNUAL REPORT & FINANCIAL STATEMENTS 2014
5. Management of insurance and financial risk policies (continued)
d) Operational risk (Continued)
Compliance risk: The risk of regulatory sanctions, financial loss or damage to reputation as a result of not complying with legislation, regulation or internal policies is managed through the established compliance functions within the Group and a compliance policy. The policy ensures that compliance requirement are identified and implemented through the development of approriate policies and procedures and that regular monitoring and reporting of breaches is carried out within the business and at the center to provide teh board with assurance on the status of compliance within the organization
Human resources: The Group remains concerned about the availability of specialist technical skills available in East Africa to provide first world financial services. It focuses on recruitment, development and retention through a number of Group-wide initiatives.
Business continuity management (BCM): BCM is implemented to reduce the risk of not continuing normal business activities should a crisis occur. BCM is an integral component of the Group’s risk management framework. The various subsidiaries are regularly exposed to deployment of updated methodologies, testing and training to ensure increased capability to deal with interruptions to business. The Group’s has established a BCM site at Mlolongo along Mombasa road where critical staff and core services can be relocated incase of disruptions to business at the usual business premises.
Internal and external fraud: The Group adopts a ‘zero-tolerance’ approach to fraud. The Group internal audit function supports management in meeting their objective of minimising fraud risk. In terms of the Group’s anti- fraud policy, line management is responsible for ensuring
that controls at all stages of a business process are adequate for the prevention and detection of fraud. Prevention and detection measures are periodically rolled out by forensic services to support management.
e) Liquidity risk
Definition
Liquidity risk is the risk that the Group, although solvent, is not able to settle its obligations as they fall due because of insufficient cash in the Group. This might arise in circumstances where the Group’s assets are not marketable, or can only be realised at excessive cost. The principal risk relating to liquidity comprises the Group’s exposure to policyholder behaviour.
Ownership and accountabilityThe ownership and accountability for liquidity risk is the same as for market risk. Liquidity requirements are reviewed on an ongoing basis as part of the Group’s normal operating activities at the subsidiary level.
Liquidity profile of assetsThe Group’s assets are liquid however given the quantum of investments held relative to the volumes of trading a substantial short-term liquidation may result in current values not being realised due to demand-supply principles. It is considered highly unlikely, however, that a short-term realisation of that magnitude would occur.
Liquidity risks arising out of obligations to policyholdersOn unit-linked business, liquidity risk and asset-liability matching risk arising as a result of changes in lapse and withdrawal experience is limited through policy terms and conditions that restrict claims to the value at which assets are realised. Similarly the liquidity and asset-liability matching risk arising from a change in withdrawal experience on business with DPF is limited through policy terms and conditions that permit withdrawal benefits to be altered in the event of falling asset prices.
65ANNUAL REPORT & FINANCIAL STATEMENTS 2014

5. Management of insurance and financial risk policies (continued)
e) Liquidity risk (Continued)
The table below presents the cash flows receivable and payable by the Group under financial assets and liabilities by remaining expected maturities at the reporting date.
66 ANNUAL REPORT & FINANCIAL STATEMENTS 2014

5. Management of insurance and financial risk policies (continued)
e) Liquidity risk (Continued)
Long term insurance and deposit administration contracts can be surrendered before maturity for a cash surrender value specified in the contractual terms and conditions. Prudent liquidity risk management includes maintaining sufficient cash balances to cover anticipated surrenders before the contractual maturity dates. In addition, the Group invests only a limited proportion of its assets in investments that are not actively traded. The Group’s listed securities are considered readily realisable, as they are actively traded on the Nairobi Stock Exchange.
Liquidity risk – Company
Ultimate responsibility for liquidity risk management rests with the Board of Directors, which has built an appropriate liquidity risk management framework for the management of the Company’s short, medium and long-term funding and liquidity management requirements. The Company manages liquidity risk by continuous monitoring of banking facilities, cash flow forecast and actual cash flows.
The table below analyses the Company’s financial liabilities that will be settled on a net basis into relevant maturity Groupings based on the remaining period at the balance sheet date to the contractual maturity date.
The amounts disclosed in the table below are the contractual undiscounted cash flows:
67ANNUAL REPORT & FINANCIAL STATEMENTS 2014
5. Management of insurance and financial risk policies (continued)
e) Liquidity risk (Continued)
At 31 December 2014 Less than 1year
Shs’000
Over 1year
Shs’000
TotalShs’000
Due to group companies (note 32)Borrowings
163,918 - 163,918 - - -
163,918 - 163,918
At 31 December 2013 Less than 1year
Shs’000
Over 1year
Shs’000
TotalShs’000
Due to group companies (note 32)Borrowings
115,389 - 115,389 - - -
115,389 - 115,389
Capital requirementsThe Group’s view is that liquidity risk has to be managed by means other than capital. If assets and liabilities are not well matched by term, even a large amount of capital may provide only a small buffer in an extreme liquidity event.
Liquidity risk is most likely to arise due to a sharp increase in benefit withdrawals or risk-related claims. The liquidity risk arising from withdrawals is largely managed by policy terms and conditions in the contract that enable the Group to reduce withdrawal benefits in the event that asset prices fall. The liquidity risk arising from risk-related claims is managed by having reinsurance arrangements in place for catastrophic events. Liquidity risks arising on maturity benefits are managed by closely monitoring the expected future maturities and realising assets in advance if large outflows are expected.
Liquidity risk is also managed by matching liabilities with backing assets that are of similar maturity, duration and risk nature. The liquidity profile of the total financial position is reviewed on a regular basis to ensure that the cash flow profile of liabilities can be met as they fall due.
As a result of the liquidity risk mitigation measures in place, the Group’s exposure to liquidity risk is expected to be small and no allowance is currently made for liquidity risk.
68 ANNUAL REPORT & FINANCIAL STATEMENTS 2014

5. Management of insurance and financial risk policies (continued)
f) Market risk
DefinitionMarket risk is the risk of adverse financial impact due to changes in fair values or future cash flows of financial instruments from fluctuations in equity prices, interest rates and foreign currency exchange rates (as well as their associated volatilities). In addition, in light of the Group’s significant investment in investment properties, there is exposure to fluctuation in property values.
The Group’s shareholders are exposed to market risk arising from policyholder asset-liability mismatch risk. This is where the Group’s property and financial assets do not move in the same direction and magnitude as the obligations arising under its insurance and investment contracts.
The key components of market risk are as follows:
• Price risk: is the risk arising from a change in the value and/or future cash flows of an asset or liability, as a result of securities price and/or dividend changes;
• Interest rate risk: is the risk arising from a change in the value and/or future cash flows of an asset or liability, as a result of interest rate changes;
• Currency risk: is the risk arising from a change in the value and/or future cash flows of an asset or liability as a result of changes in exchange rates. This can either be in the form of a mismatch between currencies of assets and liabilities, or on assets supporting capital, or the functional currency of the local entity being different to the reporting currency of the Group; and
• Property market risk: is the risk arising from a change in the value and/or future cash flows of an asset or liability, as a result of changes in property market prices and/or rental income.
Risk identification, assessment and measurement
In the case of market risks which arise from shareholder funds, the risk can be identified, assessed and measured by considering the market risks that apply to the assets in which these funds have been invested.
In the case of asset-liability mismatches, risks both to the assets and corresponding liabilities need to be assessed together. The Group is exposed to market risk to the extent that these exposures may result in a loss due to the assets increasing by less than the liabilities or the assets falling by more than the liabilities.
The Group assesses its asset-liability mismatch exposures with respect to the key components of market risk at subsidiary level.
i) Price risk
The Group is exposed to equity securities price risk because of investments in quoted and unquoted shares classified as available-for-sale. The Group is not exposed to commodity price risk. To manage its price risk arising from investments in equity and debt securities, the Group diversifies its portfolio. Diversification of the portfolio is done in accordance with limits set by the Group in the Investment Policy. All quoted shares held by the Group are traded on the Stock Exchange.
69ANNUAL REPORT & FINANCIAL STATEMENTS 2014

5. Management of insurance and financial risk policies (continued)
f) Market risk (continued)
ii) Interest rate risk
Fixed interest rate financial instruments expose the Group to fair value interest rate risk. Variable interest rate financial instruments expose the Group to cash flow interest rate risk. The Group’s fixed interest rate financial instruments are government securities and deposits with financial institutions. The Group’s variable interest rate financial instruments are quoted corporate bonds.
No limits are placed on the ratio of variable rate financial instruments to fixed rate financial instruments. The Group manages its cash flow interest rate risk by diversification of its portfolio. The sensitivity analysis for interest rate risk illustrates how changes in the fair value or future cash flows of a financial instrument will fluctuate because of changes in market interest rates at the reporting date.
For liabilities under long-term insurance contracts with fixed and guaranteed terms, changes in interest rate will not cause a change to the amount of the liability, unless the change is severe enough to trigger a liability adequacy test adjustment. The level of the reduction of the level of interest rate that will trigger an adjustment is an interest rate of 1 % (2013: 1 %). Investment contracts with fixed and guaranteed terms, government securities and deposits with financial institutions held to maturity are accounted for at amortised cost and their carrying amounts are not sensitive to changes in the level of interest rates.
At 31 December 2014, if interest rates on quoted corporate bonds at that date had been 50 basis points higher/lower with all other variables held constant, post-tax profit for the period would
have been Shs1,379,330 (2013:Shs.991,021) lower/higher, mainly as a result of higher/lower interest income on floating rate quoted corporate bonds.
iii) Currency risk
The Group operates regionally and is exposed to foreign exchange risk arising from various foreign currency transactions, primarily with respect to the US dollar. Foreign exchange risk arises from reinsurance transactions with foreign reinsurance brokers. This risk is not significant and is mitigated through the use of dollar-denominated accounts. In the year ending 31 December 2014, the Group had an equivalent of Shs 7.7 Million (2013: Shs. 10.2 Million) in reinsurance balances denominated in foreign currency and foreign currency deposit accounts. The impact of normal exchange fluctuations in the Kenya and Tanzania shilling against the US dollar would not have a material effect on Groups results.
iv) Property market risk
The Group is exposed to tenant default and unlet space within its investment property portfolio affecting property values and rental income. This risk is mainly attributable to the matching policyholder liability and the shareholder exposure is mainly limited to management fees and profit margins. The managed diversity of the property portfolio and the existence of multi-tenanted buildings significantly reduce the exposure to this risk.
g) Insurance risk
DefinitionInsurance risk from management’s perspective is the risk that future claims (in relation to death, disability, ill health and withdrawal) and expenses will exceed the allowance for expected claims and expenses in the measurement of
70 ANNUAL REPORT & FINANCIAL STATEMENTS 2014

Management of insurance and financial risk policies (continued)
g) Insurance risk (Continued)
policyholder liabilities and in product pricing. In addition to these insurance risks, the Group assumes further risks in relation to policyholder behaviour (including lapses and converting recurring premium policies to paid up) and tax which could have adverse impacts on the Group’s earnings and capital if different from that assumed in the measurement of policyholder liabilities. From a risk management perspective, management Groups these risks under insurance risk.
Ownership and accountabilityThe management and staff in all subsidiaries taking on insurance risk are responsible for the day-to-day identification, management and monitoring of insurance risk. It is also management’s responsibility to report any material insurance risks, risk events and issues identified to senior management through certain pre-defined escalation procedures.
The statutory actuaries and the heads of risk in the subsidiaries provide independent oversight of the compliance with the Group’s risk management policies and procedures and the effectiveness of the Group’s insurance risk management processes.
Risk identification, assessment and measurementInsurance risks arise due to the uncertainty of the timing and amount of future cash flows arising under insurance contracts. The timing is specifically influenced by future mortality, longevity, morbidity, withdrawal and expenses about which assumptions are made in the measurement of policyholder liabilities and in product pricing. Deviations from assumptions will result in actual cash flows being different from those expected. As such, each assumption represents a source of uncertainty.
Experience investigations are conducted at least annually on all insurance risks to ascertain the reasons for deviations from assumptions and their financial impacts. If the investigations indicate that these deviations are likely to persist in future, the assumptions will be adjusted accordingly in the subsequent measurement of policyholder liabilities.Insurance risks are assessed and reviewed against the risk appetite. Mitigating actions are developed for any risks that fall outside of management’s assessment of risk appetite in order to reduce the level of risk to within the approved tolerance limits.
Risk managementThe management of insurance risk is effectively the management of deviations of actual experience from the assumed best estimate of future experience. On the published reporting basis, earnings are expected as a result of the release of margins that have been added to the best estimate assumptions. The risk is that these earnings are less than expected due to adverse actual experience.
The statutory actuaries provide oversight of the insurance risks undertaken by the Group in that they are required to:
• report at least annually on the financial soundness of the life companies within the Group; approve policy for assumptions used to provide best estimates plus compulsory and discretionary margins
• oversee the setting of these assumptions; and
• report on the actuarial soundness of premium rates in use for new business, and the profitability of the business, taking into consideration the reasonable benefit expectations of policyholders and the associated insurance and market risks.
71ANNUAL REPORT & FINANCIAL STATEMENTS 2014

5. Management of insurance and financial risk policies (continued)
g) Insurance risk (Continued)
The Group makes use of reinsurance to reduce its exposures to some insurance risks.
i) Policyholder behaviour risk
Policyholder behaviour risk is the risk of loss arising due to actual policyholder behaviour being different from expected.
The primary policyholder behaviour risk is persistency risk. This arises due to policyholders discontinuing or reducing contributions or withdrawing benefits partially or in total when this is not in line with expectations. This behaviour results in a loss of future charges that are designed to recoup expenses and commission incurred early in the life of the contract and to provide a profit margin or return on capital.Deterioration in persistency generally gives rise to a loss as the loss of these future charges generally exceeds the charges that the Group applies to the policyholder benefits in these events.
ii) Mortality and morbidity risk
Mortality risk is the risk of loss arising due to actual death rates on life assurance business being higher than expected. Morbidity risk is the risk of loss arising due to policyholder health-related claims being higher than expected. The Group has the following processes and procedures in place to manage mortality and morbidity risk:
• Premium rates are differentiated by factors which historical experience has shown are significant determinants of mortality and morbidity claim experience.
• Terms are built into the policy contracts that permit risk premiums to be reviewed on expiry of a guarantee period. Delays in implementing increases in premiums, and market or regulatory restraints over the extent of the increases may reduce their mitigating effects. Furthermore, charges can only be increased to the extent that they can be supported by gross premiums, although this is not relevant on contracts where gross premiums can be reviewed.
• Underwriting guidelines concerning authority limits and procedures to be followed are in place.
• All retail business applications for risk cover are underwritten. For smaller sums assured this process is largely automated. For retail and corporate business, larger sums assured in excess of specified limits are reviewed by experienced underwriters and evaluated against established processes. For corporate risk business, these specified limits are scheme specific based on the size of the scheme and distribution of sums assured.
• Part of the underwriting process involves assessing the health condition and family medical history of applicants. Terms and conditions are varied accordingly.
• The policy terms and conditions contain exclusions for non-standard and unpredictable risks that may result in
• severe financial loss (e.g. on life policies, a suicide exclusion applies to the sum assured for death within two years from the date of issue).
• The actual claims experience is monitored on a regular basis so that deteriorating experience can be timeously identified. Product pricing and the measurement of
72 ANNUAL REPORT & FINANCIAL STATEMENTS 2014

5. Management of insurance and financial risk policies (continued)
g) Insurance risk (Continued)
• the liabilities is changed if the deteriorating experience is expected to continue and cannot be mitigated. Detailed mortality and morbidity investigations are conducted on a bi-annual basis, but mortality claim ratios are reviewed monthly.
• For morbidity, experienced claims assessors determine the merits of the claim in relation to the policy terms and conditions. In the case of disability annuitants, claim management ensures the continued eligibility for monthly income and includes interventions that may result in the full or partial medical recovery of the claimant. The actual disability experience is highly dependent on the quality of the claim assessments.
• Reinsurance arrangements are put in place to reduce the mortality and morbidity exposure per individual and provide cover in catastrophic events.
The Group views mortality and morbidity risks as risks that are core to the business.
iii) Longevity risk
Longevity risk is the risk of loss arising due to annuitants living longer than expected. For lifeannuities, the loss arises as a result of the Group having undertaken to make regular payments to policyholders for their remaining lives, andpossibly to the policyholders’ spouses for their remaining lives. The most significant risk on these liabilities is continued medical advances and improvement in social conditions that lead to longevity improvements being better than expected.The group manages longevity risk by:
• Annually monitoring the actual longevity experience and identifying trends over time; and
• Making allowance for future mortality improvements in the pricing of new business and the measurement of policyholder liabilities – this allowance will be based on the trends identified in experience investigations and external data.
iv) Expense risk
Expense risk is the risk of loss arising due to expenses incurred in the administration of policies being higher than expected. Allowance is made for expected future expenses in the measurement of policyholder liabilities. These expected expenses are dependent on estimates of the number of in-force and new business policies. As a result, the risk of expense loss arises due to expenses increasing by more than expected as well as the number of in-force and/or new business policies being less than expected.
The group manages the expense risk by:
• regularly monitoring actual expenses against the budgeted expenses;
• regularly monitoring new business;• regularly monitoring withdrawal rates
including lapses; and• Implementing cost control measures in the
event of expenses exceeding budget or of significant unplanned reductions in in-force policies.
73ANNUAL REPORT & FINANCIAL STATEMENTS 2014

5. Management of insurance and financial risk policies (continued)
g) Insurance risk (Continued)
v) Tax riskTax risk is the risk of loss arising due to the actual tax assessed being more than the tax expected.
Allowance for tax is made in the measurement of policyholder liabilities at the rates applicable at the financial reporting date. Adjustments may be made for known future changes in the tax regime.
Experience shows that the larger the portfolio of similar insurance contracts, the smaller the relative variability about the expected outcome will be. In addition, a more diversified portfolio is less likely to be affected across the board by a change in any subset of the portfolio. The
Group has developed its insurance underwriting strategy to diversify the type of insurance risks accepted and within each of these categories to achieve a sufficiently large population of risks to reduce the variability of the expected outcome. Factors that aggravate insurance risk include lack of risk diversification in terms of type and amount of risk, geographical location and type of industry covered.
The following tables disclose the concentration of insurance liabilities by the class of business in which the contract holder operates and by the maximum insured loss limit included in the terms of the policy:
74 ANNUAL REPORT & FINANCIAL STATEMENTS 2014
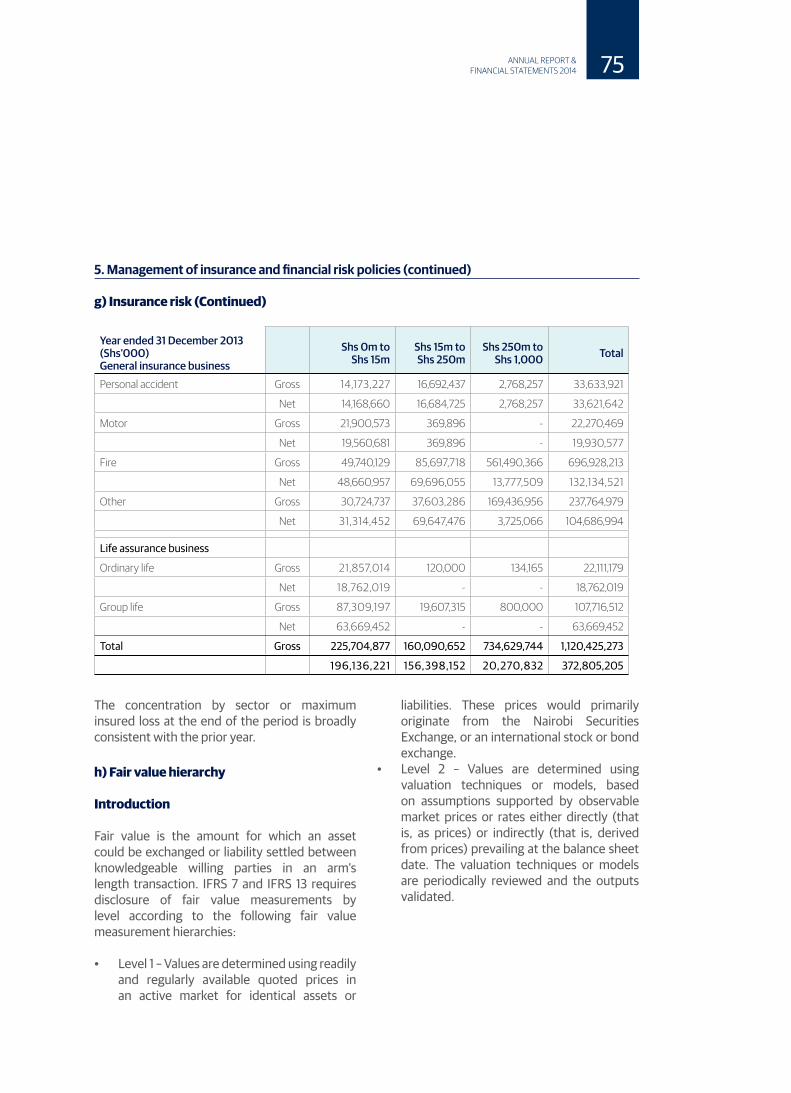
The concentration by sector or maximum insured loss at the end of the period is broadly consistent with the prior year.
h) Fair value hierarchy
Introduction
Fair value is the amount for which an asset could be exchanged or liability settled between knowledgeable willing parties in an arm’s length transaction. IFRS 7 and IFRS 13 requires disclosure of fair value measurements by level according to the following fair value measurement hierarchies:
• Level 1 – Values are determined using readily and regularly available quoted prices in an active market for identical assets or
liabilities. These prices would primarily originate from the Nairobi Securities Exchange, or an international stock or bond exchange.
• Level 2 – Values are determined using valuation techniques or models, based on assumptions supported by observable market prices or rates either directly (that is, as prices) or indirectly (that is, derived from prices) prevailing at the balance sheet date. The valuation techniques or models are periodically reviewed and the outputs validated.
5. Management of insurance and financial risk policies (continued)
g) Insurance risk (Continued)
75ANNUAL REPORT & FINANCIAL STATEMENTS 2014

5. Management of insurance and financial risk policies (continued)
h) Fair value hierarchy (continued)
• Level 3 – Values are estimated indirectly using valuation techniques or models for which one or more of the significant inputs are reasonable assumptions (that is unobservable inputs), based on market conditions.
The following table presents the Group’s assets and liabilities that are measured at fair value at 31 December 2014.
76 ANNUAL REPORT & FINANCIAL STATEMENTS 2014
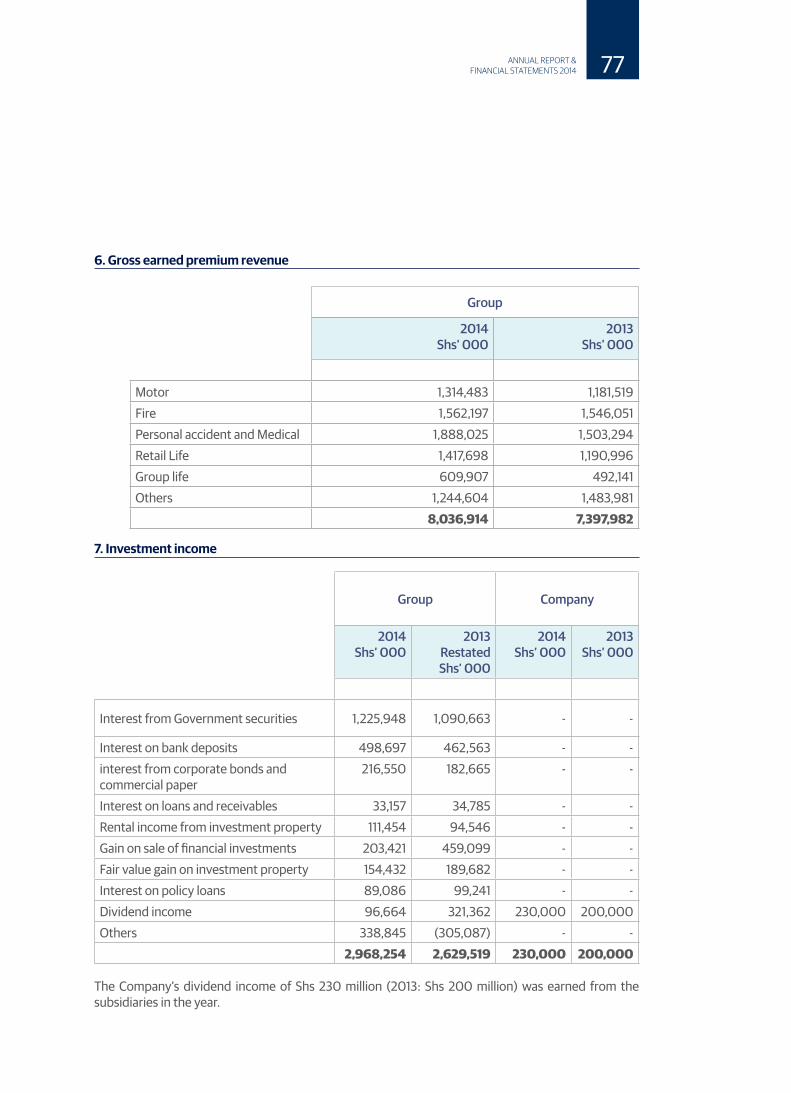
6. Gross earned premium revenue
Group
2014Shs’ 000
2013Shs’ 000
Motor 1,314,483 1,181,519 Fire 1,562,197 1,546,051 Personal accident and Medical 1,888,025 1,503,294 Retail Life 1,417,698 1,190,996 Group life 609,907 492,141 Others 1,244,604 1,483,981
8,036,914 7,397,982
7. Investment income
Group
Company
2014Shs’ 000
2013 Restated Shs’ 000
2014Shs’ 000
2013Shs’ 000
Interest from Government securities 1,225,948 1,090,663 - -
Interest on bank deposits 498,697 462,563 - -interest from corporate bonds and commercial paper
216,550 182,665 - -
Interest on loans and receivables 33,157 34,785 - -Rental income from investment property 111,454 94,546 - -Gain on sale of financial investments 203,421 459,099 - -Fair value gain on investment property 154,432 189,682 - -Interest on policy loans 89,086 99,241 - -Dividend income 96,664 321,362 230,000 200,000 Others 338,845 (305,087) - -
2,968,254 2,629,519 230,000 200,000
The Company’s dividend income of Shs 230 million (2013: Shs 200 million) was earned from the subsidiaries in the year.
77ANNUAL REPORT & FINANCIAL STATEMENTS 2014
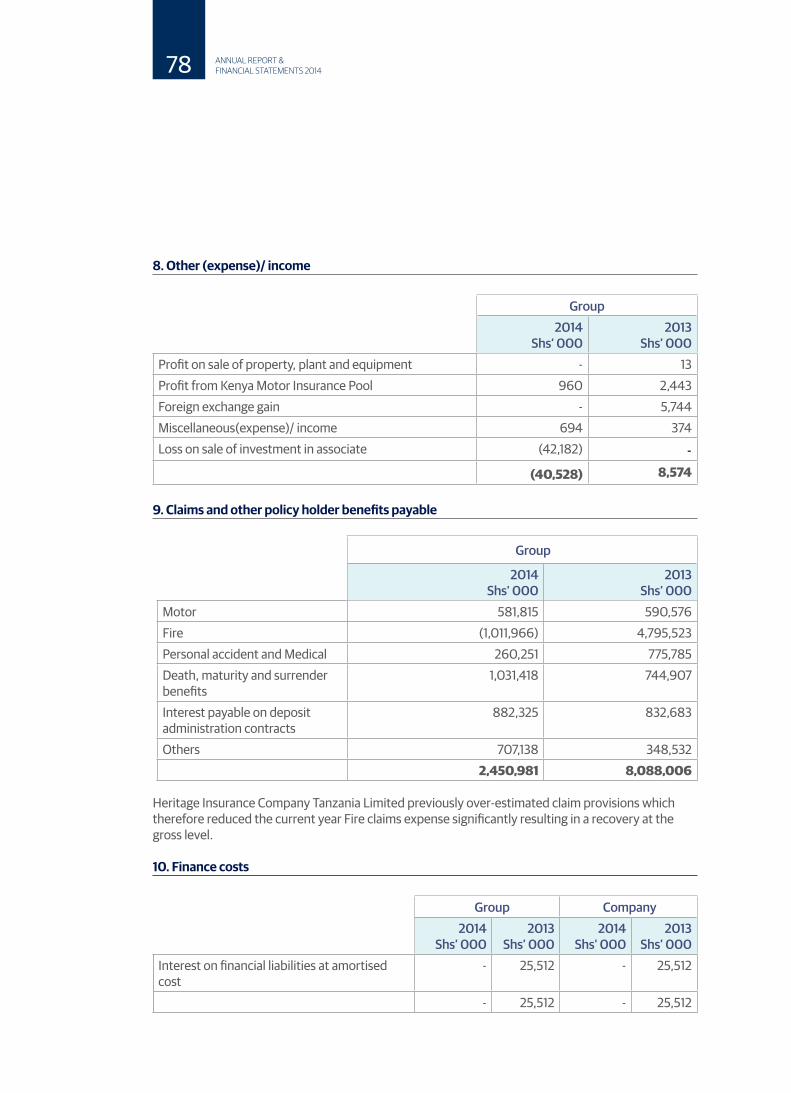
8. Other (expense)/ income
Group2014
Shs’ 0002013
Shs’ 000Profit on sale of property, plant and equipment - 13Profit from Kenya Motor Insurance Pool 960 2,443Foreign exchange gain - 5,744Miscellaneous(expense)/ income 694 374Loss on sale of investment in associate (42,182) -
(40,528) 8,574
9. Claims and other policy holder benefits payable
Group
2014Shs’ 000
2013Shs’ 000
Motor 581,815 590,576 Fire (1,011,966) 4,795,523 Personal accident and Medical 260,251 775,785 Death, maturity and surrender benefits
1,031,418 744,907
Interest payable on deposit administration contracts
882,325 832,683
Others 707,138 348,532 2,450,981 8,088,006
Heritage Insurance Company Tanzania Limited previously over-estimated claim provisions which therefore reduced the current year Fire claims expense significantly resulting in a recovery at the gross level.
10. Finance costs
Group Company2014
Shs’ 0002013
Shs’ 0002014
Shs’ 0002013
Shs’ 000Interest on financial liabilities at amortised cost
- 25,512 - 25,512
- 25,512 - 25,512
78 ANNUAL REPORT & FINANCIAL STATEMENTS 2014

11. Other operating expenses
Group Company2014
Shs’ 0002013
Shs’ 0002014
Shs’ 0002013
Shs’ 000
Staff costs (Note 12) 1,038,321 1,014,408 - -Auditor’s remuneration 16,500 16,156 2,200 2,447Depreciation (Note 20) 92,174 100,400 - -Amortisation of intagible assets (Note 22)
11,211 19,803 - -
Impairment charge for doubtful receivables
67,514 9,646 - -
Operating lease rental - land and buildings
164,957 82,203 - -
Directors’ fees 18,066 17,882 2,714 4,352Repairs and maintenance 31,599 26,259 - -Advertising 115,436 127,157 - -Legal and other professional fees 72,424 57,893 8,852 2,643Others 959,935 664,316 46,842 9,444
2,588,137 2,136,123 60,608 18,886
12. Staff cost
Group
2014Shs’ 000
2013Shs’ 000
Employee benefits expense includes the following:
Salaries and wages 744,594 778,145 Social security benefit costs 47,559 36,610 Retirement benefit cost 9,985 20,090 Other 236,183 179,563
1,038,321 1,014,408
The number of persons employed by the Group at the end of the year was 366 (2013: 372).
79ANNUAL REPORT & FINANCIAL STATEMENTS 2014

13. Investment in subsidiaries and associates
Group2014
Shs’ 0002013
Shs’ 000As at 1January 70,041 61,948Additions to Strategis Insurance (Tanzania) Limited shares - 9,979Share of profit/(loss) after tax 9,918 (7,387)Share of Fair Value Reserve - 5,528Disposal of investments in Strategis Insurance (Tanzania) Limited.
(80,069) -
Currency adjustment 110 (27)As at 31 December - 70,041
The disposal of the Group’s interest in Strategis Insurance (Tanzania) Limited in 2014 realised a loss of Shs. 80,069,000.
The summarised financial information of the Associates is as follows:
31 December 2014 TotalAssets
Shs’000
TotalLiabilitiesShs’000
RevenueShs’000
Loss aftertax
Shs’000
% interestHeld
Shs’000Strategis Insurance (Tanzania) Limited
- - - - -
31 December 2013 TotalAssets
Shs’000
TotalLiabilitiesShs’000
RevenueShs’000
Loss aftertax
Shs’000
% interestHeld
Shs’000Strategis Insurance (Tanzania) Limited
197,674 96,668 179,664 (17,163) 43.04%
Subsidiaries
The Company’s interest in its subsidiaries, all of which are unlisted and all of which have the same year end as the Company, were as follows:
80 ANNUAL REPORT & FINANCIAL STATEMENTS 2014

13. Investment in subsidiaries and associates (continued)
Company
Beneficial Ownership
Country ofIncorporation
2014Shs’000
2013Shs’000
Liberty Life Assurance Kenya Limited
100% Kenya 1,826,254 1,826,254
The Heritage Insurance Company (K) Limited
100% Kenya 741,287 741,287
The Heritage Insurance Company (T) Limited
60% Tanzania - -
Azali Limited 100% Kenya - -CfC Investments Limited 100% Kenya 634,792 634,792
3,202,333 3,202,333
14. Income tax expense
The Group’s current tax charge is computed in accordance with income tax rules applicable to insurance companies. A reconciliation of the tax charge is shown below:
Group
2014Shs’ 000
2013Shs’ 000
Current income tax 262,538 189,080Over-provision of deferred tax in prior years (25,332) -Deferred income tax (note 30) (39,622) 3,862
197,584 192,942
The tax on the Group’s profit before tax differs from the theoretical amount that would arise using the statutory tax rate as follows:
81ANNUAL REPORT & FINANCIAL STATEMENTS 2014

14. Income tax expense (continued)
Reconciliation of income tax expense to tax based on accounting profit
Group2014
Shs’ 0002013
Shs’ 000Profit before income tax 1,346,568 1,298,862Tax at statutory tax rate of 30% (2013- 30%) 403,970 389,659Tax effect of:Income not subjected to tax (227,487) (237,930)Prior year tax under/(over) provision (25,332) -Expenses not deductible for tax purposes 56,351 38,997Income from associates (9,918) 2,216Income tax expense 197,584 192,942
There was no tax charge relating to components of other comprehensive income.
15. Earnings per share
Basic earnings per share have been calculated by dividing the net profit for the year by the weighted average number of ordinary shares in issue during the year.
Group Company2014
Shs’ 0002013
Shs’ 0002014
Shs’ 0002013
Shs’ 000Earnings for the purpose of basic earnings per share
1,148,985 1,105,920 169,392 155,602
Number of sharesWeighted average number of ordinary shares for the purpose of basic earnings per share (in thousands) 535,707 515,270 535,707 515,270 Earnings per share (Shs) basic and diluted 2.14 2.15 0.32 0.30
There were no potentially dilutive shares outstanding as at 31 December 2014 or 2013. Diluted earnings per share are therefore the same as basic earnings per share.
82 ANNUAL REPORT & FINANCIAL STATEMENTS 2014

16. Ordinary share capital and share premium
Ordinary share capital
Authorisednumber of
shares
Issuednumber of
shares
Ordinary share capital
Shs.
Nominal value per
share (Shs)As at 1 January 2014 515,270,364 515,270,364 515,270,364 1Additional shares due to scrip issue 20,437,135 20,437,135 20,437,135As at 31 December 2014 535,707,499 535,707,499 535,707,499 1
Share premium
Group 2014
Shs’ 000
Company2013
Shs’ 000As at 1 January 1,185,969 1,701,239Proposed dividend - (515,270)Share Capital bonus Issue 304,511 -As at 31 December 1,490,480 1,185,969
17. Revenue and other reserves
Group Company2014
Shs’ 0002013
Shs’ 0002014
Shs’ 0002013
Shs’ 000Statutory reserve 589,425 176,180 - -Revaluation reserve 126,578 120,979 - -Currency translation reserve (38,152) (30,842) - -Total other reserves 677,851 266,317 - -
Revenue reserve 3,070,838 2,607,295 1,021,904 852,512Proposed dividend - - - -At end of year 3,748,689 2,873,612 1,021,904 852,512
83ANNUAL REPORT & FINANCIAL STATEMENTS 2014

17. Revenue and other reserves (continued)
Other reserves include fair value reserve arising from revaluation surplus on buildings and freehold land, which is a non-distributable reserve, and statutory reserve. Currency translation reserve represents exchange rate differences arising on the translation of the foreign subsidiary. Statutory reserve represents:a) Accumulated surpluses from the life fund whose distribution is subject to the restrictions imposed
by the Kenyan Insurance Act. The Insurance Act limits the amounts of surpluses of the life business available for distribution to shareholders to 30% of the accumulated surplus of the life business. A transfer to or from retained earnings is recorded each year to ensure that only amounts available for distribution to shareholders are held in the retained earnings.
b) A contingency reserve is maintained by the Tanzania subsidiary as required by the Tanzania Insurance Act. The reserve is calculated annually as the greater of 3% of net written premium or 20% of the net profit. This reserve shall accumulate until it reaches the minimum paid-up share capital or 50% of the net premiums, whichever is greater.
Proposed dividends
The Directors recommend a dividend per share of Shs 0.40 (2013: Shs 1).
18. Goodwill
Group2014
Shs’ 0002013
Shs’ 000CostAs at 1 January 1,254,995 1,254,995As at 31 December 1,254,995 1,254,995
During the year, the Group assessed the recoverable amount of goodwill and determined that goodwill associated with the life and general insurance businesses was not impaired. The recoverable amount of the businesses was assessed by reference to the Cash Generating units’ value in use which takes into account projected cash flows for the Group entities which are referenced to the respective entities’ budgets. A discount factor of 17.6% (estimate of parent company’s cost of capital) was applied in the valuation.
84 ANNUAL REPORT & FINANCIAL STATEMENTS 2014

19. Financial investments
85ANNUAL REPORT & FINANCIAL STATEMENTS 2014

19. Financial investments (continued)
b) Financial assets at fair value through profit or loss
Group 2014
Shs’ 000 2013
Shs’ 000
i) Quoted shares 3,830,414 2,290,494ii) Unquoted shares 42,341 156,697iii) Government securities 7,092,774 5,571,197
10,965,529 8,018,388
i) Quoted shares
Group 2014
Shs’ 0002013
Shs’ 000
As at start of year 2,290,494 1,130,472Additions 1,624,386 988,012Disposals (265,867) (240,283)Net fair value gains 192,572 411,335Currency translation (11,171) 958As at end of year 3,830,414 2,290,494
ii) Unquoted shares
Group2014
Shs’ 0002013
Shs’ 000As at start of year 156,697 212,172Additions 19,275 -Disposals (132,428) (54,630)Net fair value losses (1,203) (1,113)Currency translation - 268As at end of year 42,341 156,697
86 ANNUAL REPORT & FINANCIAL STATEMENTS 2014

19. Financial investments (continued)
iii) Government securities
Group2014
Shs’ 0002013
Shs’ 000
As at start of year 5,571,197 3,826,544Additions 3,280,718 3,712,290Disposals (1,771,193) (2,007,336)Fair value gains 12,052 39,699As at end of year 7,092,774 5,571,197
As at 31 December 2014, Liberty Life Assurance Limited had a total of Shs 1,077,413,066 (2013: Shs. 1,533,427,507) of government securities classified as held-to-maturity held under lien by the Central Bank of Kenya.
As at 31 December 2014, Heritage Insurance Kenya Company Limited had a total of Shs 300 million (2013: Shs 250 million) of government securities held under lien with the Insurance Regulatory Authority.
c) Loans and receivables
Group2014
Shs’ 0002013
Shs’ 000
Mortgage loans 674,797 565,352Policy loans 876,943 754,199Other loans and deposits maturing after 90 days
134,519 116,263
1,686,259 1,435,814
87ANNUAL REPORT & FINANCIAL STATEMENTS 2014
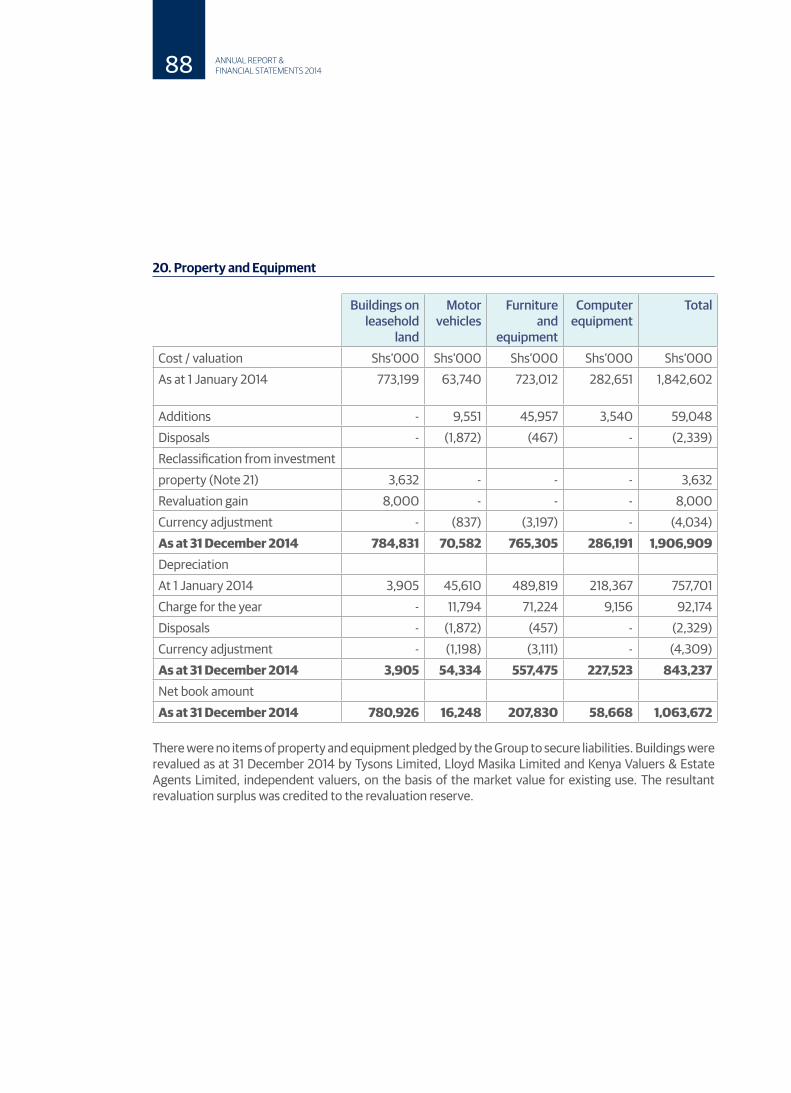
20. Property and Equipment
Buildings on leasehold
land
Motorvehicles
Furnitureand
equipment
Computer equipment
Total
Cost / valuation Shs’000 Shs’000 Shs’000 Shs’000 Shs’000As at 1 January 2014 773,199 63,740 723,012 282,651 1,842,602
Additions - 9,551 45,957 3,540 59,048Disposals - (1,872) (467) - (2,339)Reclassification from investmentproperty (Note 21) 3,632 - - - 3,632Revaluation gain 8,000 - - - 8,000Currency adjustment - (837) (3,197) - (4,034)As at 31 December 2014 784,831 70,582 765,305 286,191 1,906,909DepreciationAt 1 January 2014 3,905 45,610 489,819 218,367 757,701Charge for the year - 11,794 71,224 9,156 92,174Disposals - (1,872) (457) - (2,329)Currency adjustment - (1,198) (3,111) - (4,309)As at 31 December 2014 3,905 54,334 557,475 227,523 843,237Net book amountAs at 31 December 2014 780,926 16,248 207,830 58,668 1,063,672
There were no items of property and equipment pledged by the Group to secure liabilities. Buildings were revalued as at 31 December 2014 by Tysons Limited, Lloyd Masika Limited and Kenya Valuers & Estate Agents Limited, independent valuers, on the basis of the market value for existing use. The resultant revaluation surplus was credited to the revaluation reserve.
88 ANNUAL REPORT & FINANCIAL STATEMENTS 2014

20. Property and Equipment (continued)
Buildings on leasehold
land
Motorvehicles
Furnitureand
equipment
Computer equipment
Total
Cost / valuation Shs’000 Shs’000 Shs’000 Shs’000 Shs’000As at 1 January 2013 725,732 69,099 695,642 274,287 1,764,760Additions 8,045 - 28,411 8,228 44,684Disposals (1,769) (5,396)) (2,949) (164) (10,278)Reclassification from investmentproperty (Note 21) 2,931 - - - 2,931Revaluation gain 38,260 - - - 38,260Currency adjustment - 37 1,908 300 2,245Other transfers - - - - -As at 31 December 2013 773,199 63,740 723,012 282,651 1,842,602DepreciationAs at 1 January 2013 946 37,818 419,197 209,200 667,161Charge for the year 4,595 13,161 73,324 9,320 100,400Disposals (1,636) (5,395) (2,828) (153) (10,012)Currency adjustment - 26 126 - 152As at 31 December 2013 3,905 45,610 489,819 218,367 757,701Net book amountAs at 31 December 2013 769,294 18,130 233,193 64,284 1,084,901
89ANNUAL REPORT & FINANCIAL STATEMENTS 2014
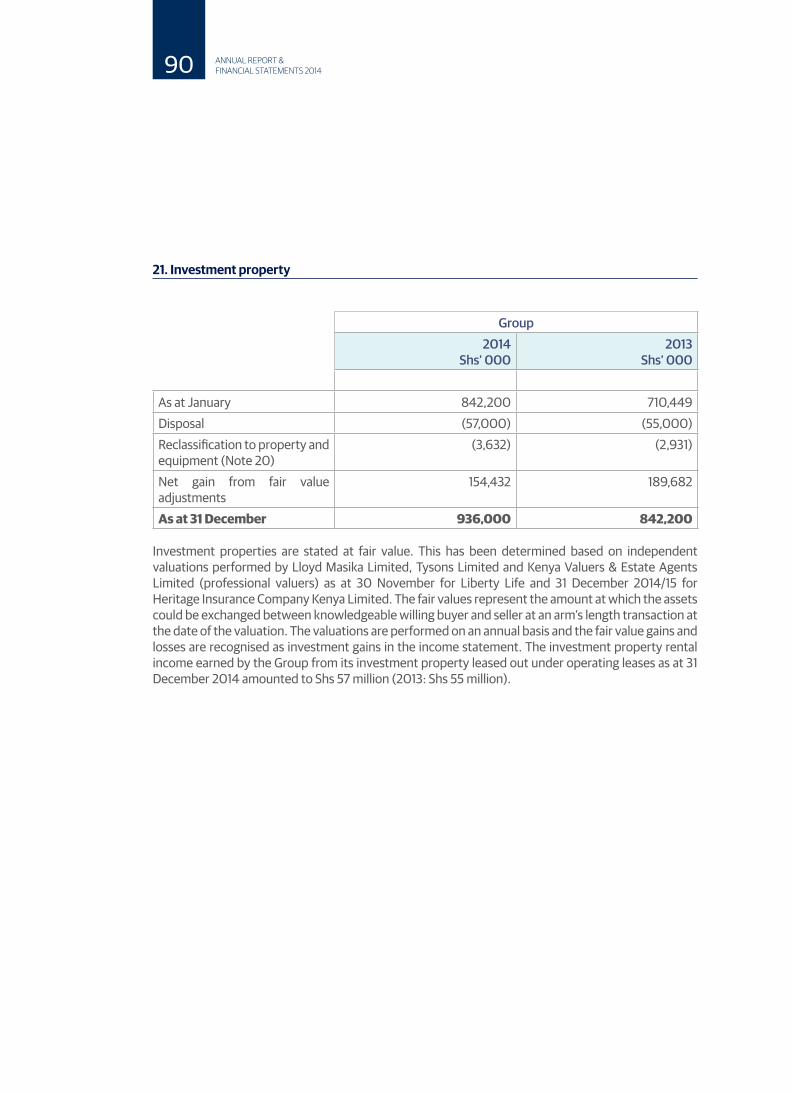
21. Investment property
Group2014
Shs’ 0002013
Shs’ 000
As at January 842,200 710,449Disposal (57,000) (55,000)Reclassification to property and equipment (Note 20)
(3,632) (2,931)
Net gain from fair value adjustments
154,432 189,682
As at 31 December 936,000 842,200
Investment properties are stated at fair value. This has been determined based on independent valuations performed by Lloyd Masika Limited, Tysons Limited and Kenya Valuers & Estate Agents Limited (professional valuers) as at 30 November for Liberty Life and 31 December 2014/15 for Heritage Insurance Company Kenya Limited. The fair values represent the amount at which the assets could be exchanged between knowledgeable willing buyer and seller at an arm’s length transaction at the date of the valuation. The valuations are performed on an annual basis and the fair value gains and losses are recognised as investment gains in the income statement. The investment property rental income earned by the Group from its investment property leased out under operating leases as at 31 December 2014 amounted to Shs 57 million (2013: Shs 55 million).
90 ANNUAL REPORT & FINANCIAL STATEMENTS 2014
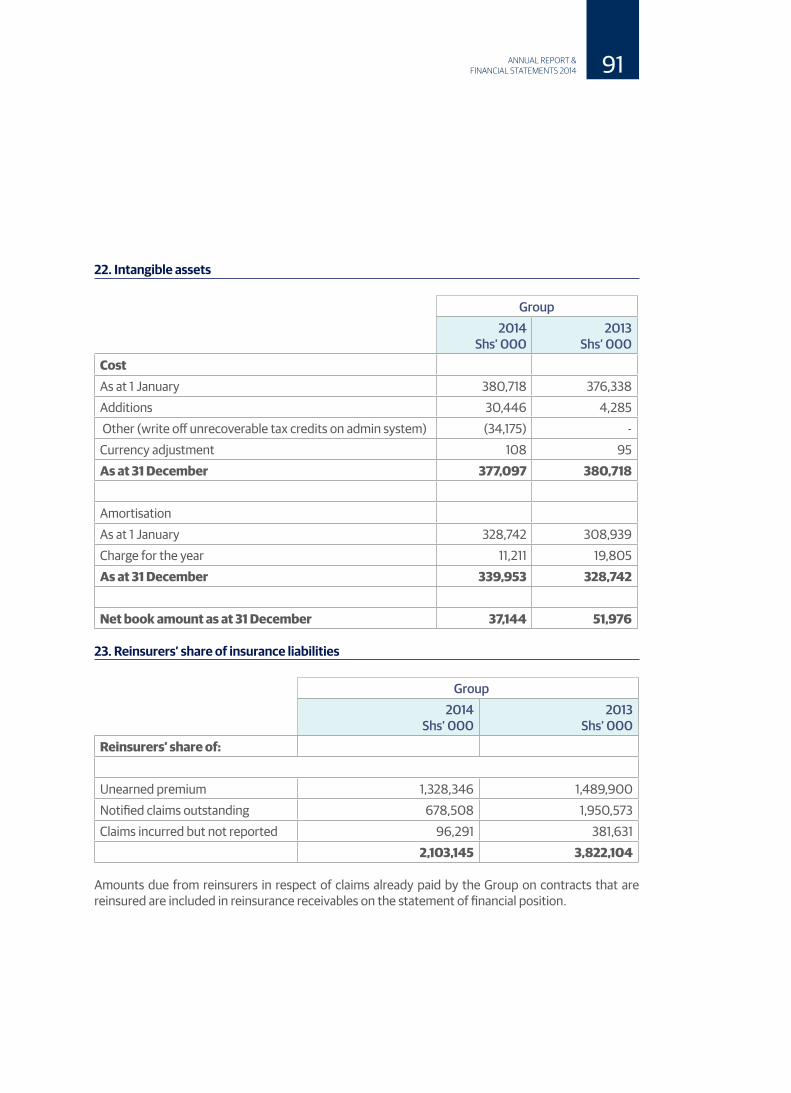
22. Intangible assets
Group2014
Shs’ 0002013
Shs’ 000CostAs at 1 January 380,718 376,338Additions 30,446 4,285 Other (write off unrecoverable tax credits on admin system) (34,175) -Currency adjustment 108 95As at 31 December 377,097 380,718
AmortisationAs at 1 January 328,742 308,939Charge for the year 11,211 19,805As at 31 December 339,953 328,742
Net book amount as at 31 December 37,144 51,976
23. Reinsurers’ share of insurance liabilities
Group2014
Shs’ 0002013
Shs’ 000Reinsurers’ share of:
Unearned premium 1,328,346 1,489,900Notified claims outstanding 678,508 1,950,573Claims incurred but not reported 96,291 381,631
2,103,145 3,822,104
Amounts due from reinsurers in respect of claims already paid by the Group on contracts that are reinsured are included in reinsurance receivables on the statement of financial position.
91ANNUAL REPORT & FINANCIAL STATEMENTS 2014

24. Cash and cash equivalents
2014Shs’ 000
2013Shs’ 000
2014Shs’ 000
2013Shs’ 000
Cash at bank and in hand 494,552 438,641 77,610 37,223Short term bank deposits (maturing within 90 days)
5,757,210 6,014,342 - -
Cash and cash equivalents 6,251,762 6,452,983 77,610 37,223
25. Insurance contract liabilities
Group2014
Shs’ 0002013
Shs’ 000Short-term (non-life) insurance contractsReported claims and claims handling expenses 1,879,275 3,140,701Claims incurred but not reported 241,774 621,705Long term insurance contractsReported claims and claims handling expenses 227,918 192,056Actuarial value of long term liabilities 7,371,762 6,366,465
9,720,729 10,320,927
Short term insurance contracts
The Group uses Bornehuetter Fergusson (BF) technique to estimate the ultimate cost of claims for the Incurred But Not Reported (IBNR) provision. The BF method recognizes the occasional limitation of the Chain Ladder in using the actual claims paid or reported only but also takes into account the loss ratios of the business classes to provide an additional indication of the expected ultimate claims.As the data is still sparse and not fully matured for the various classes of business, basic Chain Ladder will be rather volatile. BF was therefore recommended to provide a more stable statistical estimate of the liabilities for the IBNR provisions.
The latest valuation of IBNR was carried out by Ernst & Young as at 31 December 2014.
92 ANNUAL REPORT & FINANCIAL STATEMENTS 2014
25.Insurance contract liabilities (continued)
(ii) Long term insurance contracts
The Group determines its liabilities on the long-term insurance contracts on a realistic basis, namely the Gross Premium Valuation (GPV) method.
The GPV method makes explicit assumptions on expected future deaths, investment returns, lapses, expenses and bonuses as well as margins for uncertainty on these assumptions. Assumptions used are based on recent experience investigations conducted by the company while taking into consideration prior year assumptions and the outlook of future experience.
The liabilities are determined by the Group on the advice of the consulting actuary and actuarial valuations are carried out on an annual basis. The latest actuarial valuation of the Group’s life fund was undertaken as at 31 December 2014 by the consulting actuaries – QED Actuaries and Consultants (Pty) Limited.
Valuation assumptions:
The significant valuation assumptions for the actuarial valuation as at 31 December 2014 are summarised below.
i) Mortality
The GPV basis uses 100% of the SA85/90 ultimate mortality table plus an AIDS allowance of 100% of the AB1 Select and Ultimate tables (2008 ASSA model). Mortality assumption is based on recent mortality investigation conducted by the company while taking into consideration prior year assumptions and the outlook of future experience.For Group Life contracts which are only valued as an IBNR, there is a mitigating effect of changing premium rates on an annual basis as contracts are
reviewed annually and no mortality guarantees are offered.
ii) Investment returns
The GPV actuarial valuation as at 31 December 2014 used an expected future investment return of 12.7% compounded annually for individual long term insurance contracts and annuity business. On the GPV basis the valuation interest rate assumption allows for a margin over the expected future investment return, hence strengthening the prudence in the GPV valuation basis.
The weighted average rate of return on a Fair Value basis as earned by the assets backing the life fund for the year ended 31 December 2014 was 12.28% p.a. (2013: 10.62% p.a.) and the average over the last three years was 9.06% p.a
iii) Expenses and expense inflation
The current level of management expenses is taken to be an appropriate expense base for the GPV basis. The expense assumption is derived from the recent expense investigation. The purpose of the investigation was to split of expenses between initial and renewal expenses. The result of the investigation showed that the initial and renewal expenses decreased in real terms comparative to prior year. For the GPV basis an appropriate assumption is made on the increase of renewal expenses. An expense inflation of 9.0% (2013: 9.2%) is assumed..iv) Withdrawals
The GPV method allows assumptions to be set on the rate of termination of an insurance contract following a failure to pay premiums (lapse) or the voluntarily termination before the insurance contract maturity (surrender) per policy year.
93ANNUAL REPORT & FINANCIAL STATEMENTS 2014

25.Insurance contract liabilities (continued)
The withdrawal assumption is derived from recent withdrawal experience investigation conducted by the company while taking into consideration prior year assumptions and the outlook of future experience.
(v) Sensitivity analysis
The sensitivity of the GPV results has been tested to certain key assumptions by calculating the effect of assumptions not being met. The results of the sensitivity analysis (in KShs’000) can be summarized as follows:
Kshs’000 % ChangeMain basis 19,419,317 -Expenses plus 10% 19,568,021 0.8%Mortality and other claim experience plus 10%
19,436,391 0.1%
Interest rate less 1% 19,558,204 0.7%Expense inflation plus 1% 19,472,375 0.3%Withdrawals plus 10% 19,369,817 (0.3%)
As can be seen from the above table, the valuation results depend on the assumptions made. If these assumptions are not realized in practice, then the surplus in the Life Fund would differ from that expected.
It should be noted that the sensitivity calculations have been done independently. This means that interactions between various factors have not been considered. For instance, in the event of withdrawals increasing, it is likely that per policy expenses will also increase. Thus, when considering various scenarios, one needs to use an interplay of the above figures. This has not been allowed for in the above analysis.
94 ANNUAL REPORT & FINANCIAL STATEMENTS 2014

26. Amounts payable under deposit administration contracts
27. Unearned premiums reserve
28. Other liabilities
This reserves represents the liability for short term business contracts where the Group’s obligations are not expired at the year end. Movement in the reserve are shown below:
95ANNUAL REPORT & FINANCIAL STATEMENTS 2014
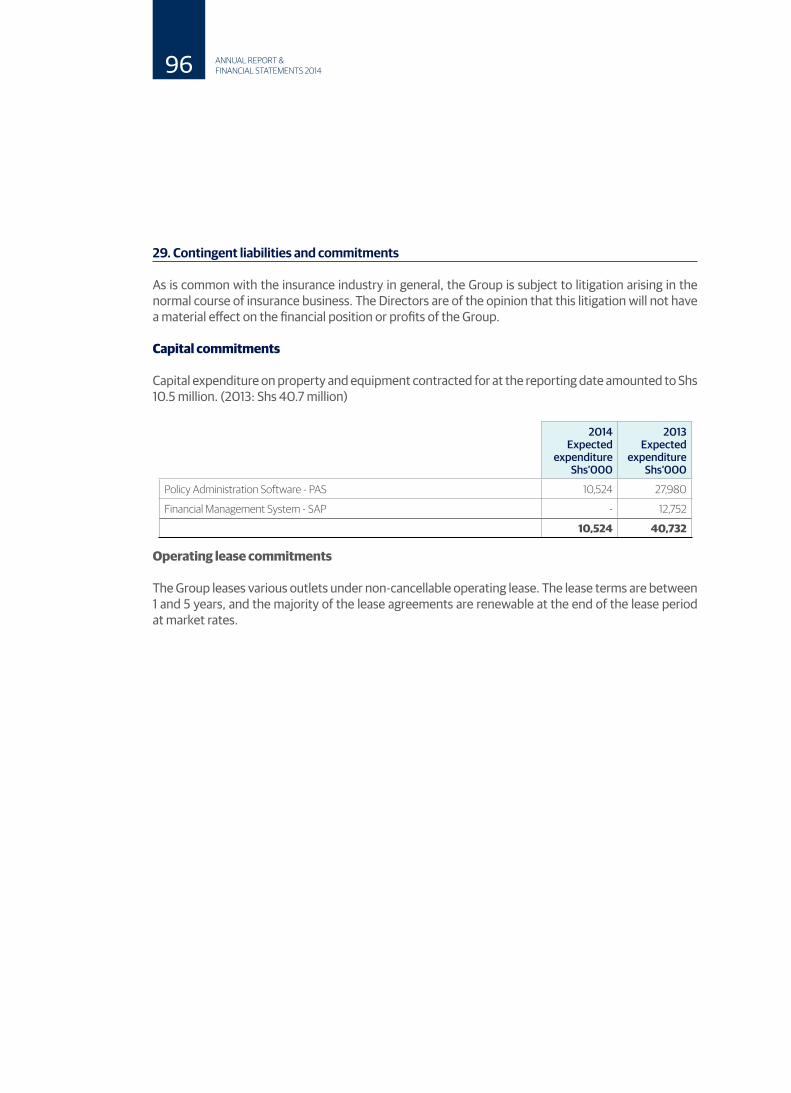
29. Contingent liabilities and commitments
As is common with the insurance industry in general, the Group is subject to litigation arising in the normal course of insurance business. The Directors are of the opinion that this litigation will not have a material effect on the financial position or profits of the Group.
Capital commitments
Capital expenditure on property and equipment contracted for at the reporting date amounted to Shs 10.5 million. (2013: Shs 40.7 million)
Operating lease commitments
The Group leases various outlets under non-cancellable operating lease. The lease terms are between 1 and 5 years, and the majority of the lease agreements are renewable at the end of the lease period at market rates.
96 ANNUAL REPORT & FINANCIAL STATEMENTS 2014
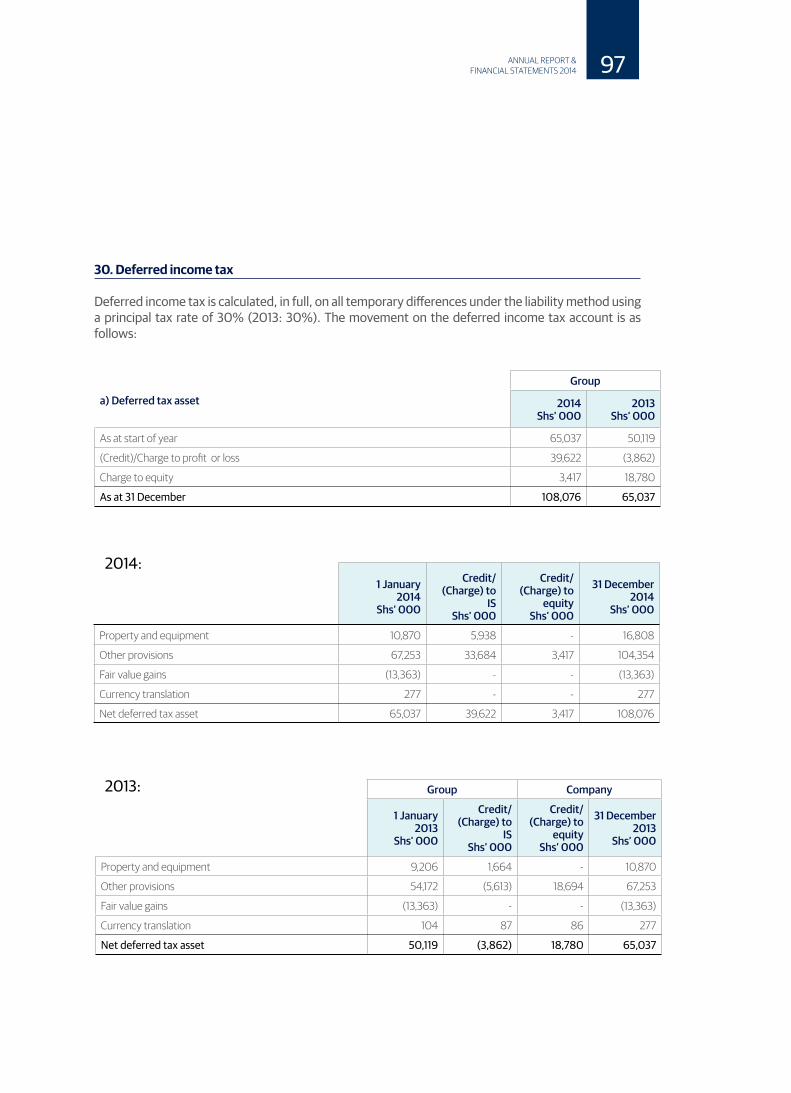
30. Deferred income tax
Deferred income tax is calculated, in full, on all temporary differences under the liability method using a principal tax rate of 30% (2013: 30%). The movement on the deferred income tax account is as follows:
2014:
2013:
97ANNUAL REPORT & FINANCIAL STATEMENTS 2014

30. Deferred income tax (continued)
31. Cash generated from operations
Reconciliation of profit before tax to cash generated from operation:
98 ANNUAL REPORT & FINANCIAL STATEMENTS 2014

31. Cash generated from operations (continued)
32. Related party transactions
The Group is controlled by Liberty Holdings Limited incorporated in the Republic of South Africa. The ultimate parent of Liberty Holdings Limited is Standard Bank Group Limited, which is incorporated in South Africa. There are other companies which are related to Liberty Kenya Holdings Limited through common shareholdings or common directorships.
The following transactions were carried out with related parties:
99ANNUAL REPORT & FINANCIAL STATEMENTS 2014

32. Related party transactions (continued)
100 ANNUAL REPORT & FINANCIAL STATEMENTS 2014

32. Related party transactions (continued)
These amounts are unsecured and have no specific repayment period
101ANNUAL REPORT & FINANCIAL STATEMENTS 2014

Shareholding
102 ANNUAL REPORT & FINANCIAL STATEMENTS 2014

To: The company secretary Liberty Kenya Holdings Limited P.O. Box 30390 - 00100 Nairobi
PROXY FORM
I/We
of P O BOX
being a member of LIBRTY KENYA HOLDING LIMITED here by appoint
of
of failing him
of
as my/ our proxy to vote on my/ our behalf at the Annual General Meeting of the Company to be held on Thursday 11th June 2015 and at any adjourment thereof.
Date this day of 2015
Signed
Name
NOTE: The Proxy form should be completed and returned to the Company Secretary not later than 48 hours before the meeting or any adjournment thereof.
103ANNUAL REPORT & FINANCIAL STATEMENTS 2014

Notes
104 ANNUAL REPORT & FINANCIAL STATEMENTS 2014

Notes
105ANNUAL REPORT & FINANCIAL STATEMENTS 2014

Notes
106 ANNUAL REPORT & FINANCIAL STATEMENTS 2014

