library search-based drug analysis in forensic toxicology...
TRANSCRIPT

Helsinki University of Technology Department of Chemical Technology
Laboratory of Organic Chemistry
Espoo 2004
LIBRARY SEARCH-BASED DRUG ANALYSIS
IN FORENSIC TOXICOLOGY
BY LIQUID CHROMATOGRAPHY–MASS SPECTROMETRY
Merja Gergov

Helsinki University of Technology Department of Chemical Technology
Laboratory of Organic Chemistry
Espoo 2004
LIBRARY SEARCH-BASED DRUG ANALYSIS
IN FORENSIC TOXICOLOGY
BY LIQUID CHROMATOGRAPHY–MASS SPECTROMETRY
Merja Gergov
Dissertation for the degree of Doctor of Science in Technology to be presented with due permission of
the Department of Chemical Technology for public examination and debate in Auditorium KE 2
(Komppa Auditorium) at Helsinki University of Technology (Espoo, Finland) on the 29th of October,
2004, at 12 o'clock noon.
Helsinki University of Technology University of Helsinki Department of Chemical Technology Department of Forensic Medicine Laboratory of Organic Chemistry Forensic Chemistry Division Teknillinen korkeakoulu Helsingin yliopisto Kemian tekniikan osasto Oikeuslääketieteen laitos Orgaanisen kemian laboratorio Oikeuskemian osasto

Distributor:
Helsinki University of Technology
P.O. Box 6100
FIN-02015 HUT
© Merja Gergov
ISBN 951-22-7278-4 (print)
ISBN 951-22-7279-2 (pdf)
Picaset Oy
Helsinki 2004

This study was carried out at the Department of Forensic Medicine, University of Helsinki, Finland.
Supervisors
Dr. John Robson
Perkin-Elmer SCIEX
Canada
Dr. Ilkka Ojanperä
University of Helsinki
Department of Forensic Medicine
Reviewers
Professor Risto Kostiainen
University of Helsinki
Faculty of Pharmacy
Dr. Tiia Kuuranne
United Laboratories Ltd.
Helsinki
Opponent
Professor Aldo Polettini
University of Pavia
Department of Legal Medicine & Public Health
Italy


Gergov, Merja. Library Search-Based Drug Analysis in Forensic Toxicology by Liquid Chromatography–Mass Spectrometry. Keywords: liquid chromatography–mass spectrometry, screening, library search, drugs, forensic toxicology ABSTRACT Liquid chromatography–mass spectrometry (LC–MS) with electrospray (ES) ionization in the positive ion mode was applied to drug analysis in forensic toxicology. Several types of screening and confirmation strategies were developed, based essentially on searching of comprehensive MS libraries and databases that were created in-house for the purpose. Two spectral libraries, both containing spectra for approximately 400 drugs, were created. Spectra for the LC–MS/in-source collision-induced dissociation (CID) library were acquired by continuously switching between low (25 V) and high (90 V) orifice voltages during the run, and the summed mass spectra were added to the library. A library for liquid chromatography–triple quadrupole mass spectrometry (LC–MS/MS) was created by obtaining product ion spectra at a collision energy of 35 eV, and additionally at 20 eV or 50 eV, if the latter were more informative. The product ion spectra were reproducible in the long-term, based on a four-year experiment. Comparison of two libraries, independently created with similar instruments in different laboratories, showed that the libraries were fully compatible. Comparison of spectra obtained with different manufacturers’ instruments suggested that after standardization of collision energy and gas pressure, LC–MS/MS spectral libraries are suitable for interlaboratory use. The libraries were utilized in two fully automated methods for selected drug groups, comprising screening and confirmation. Analysis of 16 β-blocking drugs in urine involved two-step MS analysis, including a screening step based on monitoring of protonated molecules and a confirmation step based on LC–MS/MS product ion spectra. A method for simultaneous screening and quantitation of 18 antihistamine drugs in blood involved multiple-reaction monitoring (MRM) for screening and quantitation and product ion spectra for confirmation of the drugs. The antihistamines were identified and quantified at concentrations ranging from subtherapeutic to toxic in blood. A data-dependent experiment (DDE) was utilized for automation of both procedures, from starting the sample batch to printing of the library search results. Two different approaches for comprehensive screening of drugs were developed. A method for simultaneous screening of 238 drugs in blood was developed using LC–MS/MS with multiple-reaction monitoring. Identification was based on RT and the presence of protonated molecule and one representative fragment ion. The method was shown to be sufficiently selective and sensitive to allow the majority of the drugs to be detected at therapeutic concentrations. Another approach was based on accurate mass determination with liquid chromatography–time-of-flight mass spectrometry (LC–MS/TOF), using a target database of monoisotopic masses for 433 drugs. The method was tentatively suitable for rapid screening of drugs in urine even without referral to primary reference standards.

6
ABBREVIATIONS
APCI Atmospheric pressure chemical ionization
CE Collision energy
CID Collision-induced dissociation
DAD Diode array detection
DDE Data-dependent experiment
DLI Direct liquid introduction
EI Electron impact
ES Electrospray
GC Gas chromatography
GC–MS Gas chromatography–mass spectrometry
IDA Information dependent acquisition
LC Liquid chromatography (high performance)
LC–MS Liquid chromatography–mass spectrometry
LC–MS/MS Liquid chromatography–tandem mass spectrometry
LLE Liquid-liquid extraction
LOD Limit of detection
LOI Limit of identification
LOQ Limit of quantitation
MRM Multiple-reaction monitoring
MS Mass spectrometry
OPLC Overpressured layer chromatography
Q-TOF Quadrupole-time-of-flight instrument
Q-trap Quadrupole-ion trap instrument
RP Reversed phase
RSD Relative standard deviation
RT Retention time
SPE Solid-phase extraction
SIM Selected ion monitoring
TIC Total ion chromatogram
TLC Thin-layer chromatography
TOF Time-of-flight
TS Thermospray
UV Ultraviolet (spectrometry)

7
LIST OF ORIGINAL PUBLICATIONS
This thesis is based on the following five articles, which in the text are referred to as I-V:
I Gergov M., Robson J.N., Duchoslav E., Ojanperä I., Automated liquid
chromatographic/tandem mass spectrometric method for screening β-blocking drugs in urine,
J. Mass Spectrom. 35 (2000) 912-918.
II Gergov M., Robson J.N., Ojanperä I., Heinonen O.P., Vuori E., Simultaneous screening and
quantitation of 18 antihistamine drugs in blood by liquid chromatography ionspray tandem
mass spectrometry, Forensic Sci. Int. 121 (2001) 108-115.
III Gergov M., Weinmann W., Meriluoto J., Uusitalo J., Ojanperä I., Comparison of product ion
spectra obtained by liquid chromatography/triple quadrupole mass spectrometry for library
search, Rapid Commun. Mass Spectrom. 18 (2004) 1039-1046.
IV Gergov M., Ojanperä I., Vuori E., Simultaneous screening for 238 drugs in blood by liquid
chromatography–ionspray tandem mass spectrometry with multiple-reaction monitoring, J.
Chromatogr. B 795 (2003) 41-53.
V Gergov M., Boucher B., Ojanperä I., Vuori E., Toxicological screening of urine for drugs by
liquid chromatography/time-of-flight mass spectrometry with automated target library search
based on elemental formulas, Rapid Commun. Mass Spectrom. 15 (2001) 521-526.
The articles are referred to in the text by their Roman numerals. Data published and discussed here for
the first time are referred to as VI.

8
The author’s contribution to the publications
I The author was the main contributor in defining the research plan. The author carried out
experiments and interpreted the analysis results. The author carried out all library runs for the
400 drug substances and created the libraries. The author wrote the manuscript.
II The author defined the research plan together with the coauthors. The author carried out the
experiments, interpreted the results, and wrote the manuscript.
III The author defined the research plan for all the participating laboratories, carried out the
experiments of the University of Helsinki, interpreted the results of all laboratories, and wrote
the manuscript.
IV The author defined the research plan, carried out the experiments, and wrote the manuscript.
V The author defined the research plan together with the coauthors. The author participated in
the development of the software and in carrying out the experiments in USA. The author was
the main contributor in the interpretation of the results and wrote the manuscript.

9
Table of Contents Page
ABSTRACT
ABBREVIATIONS
LIST OF ORIGINAL PUBLICATIONS
1. INTRODUCTION 11
2. REVIEW OF THE LITERATURE 13
2.1 Sample preparation 13
2.2 Liquid chromatography prior to mass spectrometry 14
2.3 Ionization by electrospray 14
2.4 LC–MS/in-source CID spectral libraries 15
2.5 LC–MS/MS product ion spectral libraries 17
2.6 Methods in toxicological screening 19
2.7 Quantitation in LC–MS/MS/MRM 22
3. AIMS OF THE STUDY 24
4. EXPERIMENTAL 25
4.1 Standards and reagents 25
4.2 Samples 25
4.3 Instrumentation 25
4.4 Methods 26
4.4.1 Extraction 26
4.4.2 Liquid chromatography 26
4.4.3 Mass spectrometry 27
5. RESULTS 29
5.1 Automated screening and confirmation 29
5.2 Quantitative analysis 32
5.3 Reproducibility of MS/MS spectral library search 33
5.4 Comprehensive screening by multiple-reaction monitoring 35
5.5 Comprehensive screening by accurate mass measurement 35

10
6. DISCUSSION 40
7. CONCLUSIONS 45
ACKNOWLEDGEMENTS 47
REFERENCES 48

11
1. INTRODUCTION
In forensic and clinical toxicology, demands for analytical laboratories are growing along with the
rapidly changing drug scene. The toxicologist must be able to detect and identify drugs and poisons
that could be abused or cause intoxication and to quantitate them at concentration levels that may vary
tremendously. In these types of examination, comprehensiveness and positive identification are of
primary importance. Screening methods are needed in toxicology, including areas such as homicides,
suicidal deaths, traffic accidents, drugs and driving monitoring, work place drug testing, doping
control, date-rape drugs, poisoned patients etc.
Screening routines should be designed to detect as many drugs as possible within relevant drug classes,
e.g. antidepressants, neuroleptics, benzodiazepines, analgesics, anaesthetics, β-blockers, antihistamines
and drugs of abuse. After therapeutic doses, drugs may be found at low concentrations, from a few
micrograms to several milligrams per litre in the blood, with lethal concentrations being 10 to 100
times higher. Some drugs are metabolized very quickly (e.g. heroin) and are not detectable at all in the
blood. Metabolites of the parent drugs may, however, persist for longer periods of time in the urine,
and therefore urine samples are usually also screened for metabolites. Most of the toxicologically
relevant drugs are small stable organic compounds, ranging from 100 to 700 in molecular weight, the
majority of which are basic, fairly hydrophobic and contain nitrogen. Various polar (e.g. atenolol),
nonvolatile (digoxin) and thermally labile (zopiclone) substances require special attention.
Standards for the reliability and accuracy of analytical methods are very high, because the results may
be used in courts as evidence. To obtain results with a high level of confidence, the entire procedure
from sample treatment to detection methods should be sensitive and rugged at the same time.
Ruggedness is essential, because of the inconstant quality and inestimable contents of post mortem
samples. Sensitivity becomes critical not only because the concentration of toxicants may be very low,
but also because sample volume may often be very limited.
A successful analytical method is a seamless combination of extraction, separation, detection and
reporting. The conventional approach has been to extract small groups of compounds separately and
then to analyse the extracts by target methods dedicated to each compound group. This is a time-
consuming and tedious procedure. Therefore, the trend has been towards using universal multistep
extraction methods that would cover different categories of drugs. Once such combined extracts with
chemically different compounds are available, it leads to the next challenge of how to separate and

12
detect them in a single method. No single technique or instrument is yet available that would cover all
chemically different drugs specifically, selectively, sensitively, reliably and preferably also
automatically.
Techniques that are currently used in forensic and clinical toxicology include immunoassays, thin-
layer chromatography (TLC), overpressured layer chromatography (OPLC), liquid chromatography
with ultraviolet or diode-array detection (LC–UV or LC–DAD) and gas chromatography (GC) with
different detectors. Immunoassays are feasible for preliminary screening, but the positive results must
be confirmed using other techniques. The benefit of classical TLC is simple and inexpensive
instrumentation and suitability for many types of compounds, but it lacks specificity, even when
corrected Rf values, in situ UV spectra and colour reactions are used for identification. GC has been
the method of choice, especially for screening basic drugs using nitrogen-selective detection. GC
coupled with mass spectrometry (GC–MS) has been given the status of gold standard in confirmation
analysis after different screening procedures. Its high separation power and commercially available
huge electron impact (EI) spectral libraries are the unquestionable benefits of GC–MS; however, its
suitability for polar, thermolabile or high-mass molecules is restricted. Moreover, sample preparation
often requires complex and time–consuming extraction procedures including derivatization, and
sensitive screening in the selected ion monitoring (SIM) mode is only possible for 30-40 compounds
per method. LC has the benefit of being suitable for several types of compounds, because basically the
compounds only have to be dissolvable in a suitable solvent. However, the separation power of LC is
limited, and a detection method more specific than UV or DAD is needed for reliable identification.
Since the early 1990s, coupling of LC with MS became common in forensic toxicology, but only
recently has the scope of LC–MS been widened from target analysis to comprehensive screening and
confirmation.
13
2. REVIEW OF THE LITERATURE
2.1 Sample preparation
Drugs are present in blood plasma and inside the haemic cells and should be released before
extraction. Hydrophilic drugs are usually free in solution, whereas lipophilic drugs are noncovalently
bound to proteins or particles. Noncovalent bonds can be broken by dilution, pH change or organic
solvents. Blood analysis is very important in forensic toxicology, because drug concentrations in
blood represent an acute drug effect and can be used to estimate the probability of intoxication.
Conversely, many drugs and metabolites are present in urine as conjugates covalently bound to
glucuronic acid, sulphate or glycine, and must be released prior to extraction, e.g. by enzymatic
hydrolysis.
The literature available since 1990 concerning the extraction techniques suitable for systematic
toxicological analysis was reviewed by Drummer1 and Polettini.2 Three different methods have
commonly been used to isolate drugs from biological material: liquid-liquid extraction (LLE), solid-
phase extraction (SPE) and protein precipitation/dilution. Precipitation of whole blood or dilution of
urine e.g. with acetonitrile or methanol, are rapid and simple procedures, but large amounts of matrix
material are co-extracted and may interfere with the analysis. Additionally, the analytes may stick into
the surface of particles during precipitation, which lowers the recovery. SPE is a commonly used
extraction method that enables sample preparation in batches and automation of the extraction
procedure, and generally provides good selectivity and clean extracts.3 Mixed-mode columns
(reversed phase (RP) + ion exchange) are especially feasible for extraction of a broad range of
chemically different compounds. SPE is very suitable for urine samples, which are homogeneous and
thereby do not cause blockage of the extraction columns. It can also be used for autopsy blood;4,5
however, the material may be lumpy and sometimes even decayed, causing blockage of the SPE
column, which can be decreased by sonication before SPE.6-8 Plasma would be a less complicated
matrix, but in postmortem samples it cannot be separated from whole blood due to haemolysis.
Therefore, LLE is more generally suitable for autopsy blood samples.9 In screening methods,
compounds with different polarities are analysed, and reasonable coverage with LLE can only be
obtained through separate extraction of acidic and basic compounds. To shorten the total analysis
time, the acidic and basic extracts can be combined and subjected simultaneously to MS detection.

14
2.2 Liquid chromatography prior to mass spectrometry
The status of LC–MS was reviewed by several authors.10-16 Due to its universality, LC is a very
suitable separation technique for multicomponent analysis. The benefit of using LC instead of GC is
the feasibility of analysing also thermolabile, polar and volatile compounds without time-consuming
extraction and derivatization procedures. On the other hand, the separation efficiency is not as good as
in GC, however, this disadvantage is not critical because MS provides good specificity and selectivity.
The only special demands are the use of volatile buffers (e.g. ammonium acetate) and low flow rates
(< 300 µl/min in an ion spray), which allows the liquid to be evaporated in the ion source. In contrast
to the first estimations, the chromatographic separation step is important even when a mass
spectrometer is used as a detector. Typically, a slow gradient (10 - 30 minutes) and reversed phase
column (10 to 15 cm) have been used to obtain acceptable separation of various types of compounds in
a reasonable total analysis time.
2.3 Ionization by electrospray
The first scientific report of charged aerosols generated by electrospray (ES) at atmospheric pressure
was described by Zeleny in 1917.17 During the 1960s and 1970s, several research groups worked on
early models of ES and chemical ionization (CI) interfaces for MS, e.g. Dole et al.,18 Tal’Rose et al.,19
Horning et al.,20 Arpino et al.,21,22 and Iribarne and Thomson.23 One of the earliest combinations of ES
with MS was introduced by Yamashita and Fenn in 1984.24 Twenty years later, LC–MS techniques
also became popular in forensic toxicology. In an overview on interfacing LC with MS, van Bocxlaer
et al.14 distinguished between three principally different approaches: 1) removal of the mobile phase
followed by vaporization and ionization of the analytes, 2) direct ionization from the effluent stream
and 3) nebulization of the effluent followed by chemical ionization or ion evaporation. For
nebulization, four different techniques are used: DLI (direct liquid introduction), TS (thermospray), ES
(electrospray) and APCI (atmospheric pressure chemical ionization). Recently, APPI (atmospheric
pressure photoionization) has also been used for ionization.25 Instrumentation for ES and APCI is
commercially available, and the majority of recent papers concerning practical applications of LC–MS
in forensic toxicology deal with ES or APCI. Moreover, ES and APCI were predicted to be of major
future interest.13,14 In APCI, a discharge electrode is used to ionize solvent molecules, which after
several ion-molecule reactions, transfer a charge to the analytes.

15
The ES ion source consists of a capillary nebulizer tube to which a voltage is applied. The sample
solution is introduced via a syringe pump or LC pump. When LC is used, the flow rate is usually tens
or hundreds of microlitres per minute in a normal column (i.d. 1-5 mm), thus requiring splitting of the
flow down to less than 10 µl/min. In 1987, Bruins et al.26 described a pneumatically assisted ES, in
which a drying gas (e.g. nitrogen) is applied to assist droplet formation and evaporation, and splitting
is not needed. This type of ES is called ionspray, and has been used in most modern toxicological
applications as well as in the present study.
In an ES ion source, molecules are ionized in the liquid phase and evaporated to the gas phase under
atmospheric pressure, then introduced into a mass spectrometer. The formation of gas-phase ions is
assumed to occur by direct emission of ions from microdroplets during ion evaporation23 or by
coulombic fission27 or by both ways simultaneously. According to the ion evaporation theory, solvent
evaporates from the charged droplets and consequently the droplets diminish in size until finally, at the
Rayleigh limit, the formation of gas-phase ions occurs directly from the small droplets. In the
coulombic fission theory, evaporation of the solvent causes an increase in charge repulsion at the
surface of the droplets, and the coulombic strain is released by droplet fission.
The response in ES is concentration-sensitive and not mass flow-sensitive, and favours low flow
rates,28 which enables the use of small-bore columns with high resolution. ES is also a soft ionization
technique, and therefore molecules are only slightly, or not at all, fragmented. Protonated [M+H]+ or
deprotonated [M-H]- molecules are mainly observed, depending on the polarity of the electric field
applied to the tip of the capillary needle. However, some structural information can be obtained, e.g.
using the so-called in-source collision-induced dissociation (in-source CID) techniques, in which
molecules are fragmented inside the ion source using increased voltage of the declustering potential
lens (orifice voltage) (Figure 1).
2.4 LC–MS/in-source CID spectral libraries
GC–MS libraries have been used for the identification of unknown compounds for years. This has
been possible because EI spectra are very reproducible, and therefore several huge commercial spectral
libraries are available that include as many as several hundred thousand compounds. For example, the
NIST 02 (National Institute of Standards and Technology, http://sisweb.com) contains EI spectra for
approximately 147 000 compounds. The situation is different with single-quadrupole LC–MS, in
which fragmentation is affected by several parameters because it occurs inside the ion source; thus,

16
common LC–MS libraries have not been established until recently. Several groups29-34 investigated the
effect of different variables, such as mobile phase composition, pH, flow rate, analyte concentration,
Clustered Ion
Declustering and fragmentation
Gas for
Nebulization
Curtain Gas
Figure 1. In-source CID fragmentation in an electrospray ion source.
heater gas temperature, ion source dirtiness and needle position. In addition to the most important
variable (declustering potential), needle position and heater gas temperature also significantly affect
the appearance of the spectra, while the other variables have more effect on the intensity of mass
signals. The settings of these parameters are not always reproducible, and it has been demonstrated
that comparison of in-source CID spectra between instruments demands effective tuning of the
instruments. Glafenine and haloperidol were suggested as tuning compounds.29-31,35-36 The
reproducibility of spectra has also been questionable; indeed, poor reproducibility was reported even
within a single instrument.32
Declustering potential (the difference between voltages at the orifice plate and skimmer, Figure 2),
which mainly affects in-source CID spectra, can be very effectively used to obtain fragmentation, and
several spectral libraries have been created based on summarizing spectra obtained with and without
fragmentation (Table 1). These summarized spectra contain both the protonated molecule [M+H]+ and
its main fragments, and thus a lot of information. However, in practical work with real samples a
problem arises from co-eluting compounds, which leads to a summary spectrum of all these
compounds. This type of unknown multicomponent spectrum cannot be resolved from any library.
Comparisons of spectra between different quadrupole mass spectrometers have been reported both
with in-source CID spectra and with MS/MS product ion spectra. In-source CID spectra were shown

17
to contain the same fragments, but significant differences in their relative ion ratios were noted even
after tuning of the instruments.32-37
2.5 LC–MS/MS product ion spectral libraries
A triple-quadrupole instrument (Figure 2) consists of three quadrupoles in sequence. A selected mass
range can be scanned with the identical mass filter quadrupoles Q1 and Q3. The center quadrupole
(Q2) is used for fragmentation and is referred to as the collision cell. The collision energy (CE) is the
difference in voltages between the collision cell offset and entrance rod (Q0) potential.
Collision cell
Q1 Q2 Q3
Figure 2. Schematic structure of a triple-quadrupole mass spectrometer (Sciex).
The appearance of an MS/MS spectrum in triple-quadrupole instruments is not dependent on the
design of the ion source, because fragmentation occurs after it inside the second quadrupole, i.e. in the
collision cell (Figure 3, Q2), but the efficiency of ionization and the transfer of ions into the gas phase
affects the intensity of the entire spectrum. Once a precursor ion is selected in the first quadrupole
(Q1) and introduced into the collision cell, the fragmentation is affected by CE and collision gas
pressure. Both these parameters can be exactly and reproducibly adjusted. The earliest standard
operation protocols for acquiring MS/MS spectra with triple quadrupoles were established twenty
years ago,38 and later it was shown that with fixed settings it is possible to create spectral libraries that
are instrument-independent.34 Recently, this was also shown to be possible with modern LC–MS/MS
triple-quadrupole instruments.40
The question of using peak intensity ratios as an identification criterion has been under discussion
among research groups developing spectral libraries. While ion ratios vary depending on the
ionization and fragmentation techniques used, a new approach was developed to ignore their effect on

18
library search results: a library was created by putting the m/z values of the fragments in the library at
100% or 50% intensity only, which was chosen depending on the signal peak area counts. Using this
simplified procedure, MS/MS spectra obtained with different triple-quadrupole instruments and with
an ion trap mass spectrometer, were fully comparable.41,42
Q1 Q2 Q3
Precursor ion Fragmentation Product ion scan filtering Figure 3. Acquisition of an MS/MS product ion spectrum in a triple-quadrupole mass spectrometer.
Several laboratories have developed LC–MS/in-source CID and LC–MS/MS spectral libraries with
quadrupole instruments for in-house use, but few of these have been published although some are
currently available on the Internet. Some of the first published spectral libraries are summarized and
described briefly in Table 1.
Table 1. Some of the first published LC–MS spectral libraries. The number of compounds may have been updated since establishment of the library. Instrument Fragmentation Compound Approx. number Reference Type Type Type of Compounds
Single quadrupole In-source CID Drugs Not available Josephs, 1995 43
Single quadrupole In-source CID Drugs, toxicants 600 Marquet, 1998 44
Single quadrupole In-source CID Pesticides,explosives 90 Schreiber, 2000 31
Single quadrupole In-source CID Drugs 400 Weinmann, 1999 29
Single quadrupole In-source CID Pesticides, drugs 38 Hough, 2000 34
Triple quadrupole MS/MS Pesticides 73 Slobodnik, 1996 45
Triple quadrupole MS/MS Pesticides 115 Kienhuis, 2000 41
Triple quadrupole MS/MS Drugs 400 Weinmann, 2000 40
Ion trap MS/MS Miscellaneous Not available Sander, 200046
Ion trap MS/MS Drugs Not available Fitzgerald, 1999 47
Ion trap MS/MS Natural products Not available Sanders, 200048
Ion trap MS/MS Miscellaneous 600 Baumann, 2000 49

19
The number of compounds mentioned in Table 1 are those originally reported and have probably
increased, since these libraries are updated continuously. As can be concluded from the variety of
libraries, cooperation in combining existing libraries or creating new and comprehensive ones will not
be easy, but would be beneficial for all laboratories. Quadrupole-ion trap (Q-trap) libraries have also
been created, and recently it was shown that a library, set up with a triple quadrupole instrument, can
be transferred to a linear Q-trap mass spectrometer.50
Long-term reproducibility of spectra is a critical issue, because continuity and high confidence level
are demanded in the identification of unknowns in forensic cases. With the exception of one study,32
good reproducibility over three to eight months was reported for LC–MS/in-source CID spectra33,34
and over 30 months for LC–MS/MS spectra.40 However, taking into account the huge amount of
labour needed to create a large spectral library, reproducibility should be ensured for years, as has been
established for GC–MS spectral libraries.
2.6 Methods in toxicological screening
Several strategies for screening drugs from forensic samples with LC–MS have been proposed in the
literature. Identification has been based on single quadrupole, triple quadrupole, TOF, Q-TOF or Q-
trap techniques. Prescreening (or survey scanning) is a critical step. With single quadrupoles, full
scan or SIM can be used, and with triple quadrupoles multiple-reaction monitoring (MRM) is also
possible. The various modes of operation of quadrupole instruments are illustrated in Figures 4-6.
Q1
Figure 4. Full scan mode of a single quadrupole mass spectrometer.
Q1
Figure 5. Selected ion monitoring mode of a single quadrupole mass spectrometer.

20
Q1 Q2 Q3
Figure 6. Multiple-reaction monitoring mode of a triple-quadrupole mass spectrometer.
The first “general unknown” procedure using LC–MS/in-source CID was presented by Marquet et al.
1998,44 and was later developed further by the same authors.16,30,51 The method included LC-reversed
phase chromatographic separation and detection by a single mass spectrometer with ionspray interface
and using the in-source CID fragmentation mode. Four separate spectra were generated simultaneously,
two positive and two negative spectra at low (weak fragmentation) and at high (extensive
fragmentation) orifice voltage. After acquisition, the low- and high-energy spectra were summed at
both polarities, and these two reconstructed spectra were searched against positive and negative mass
spectral libraries. Similar type of methods were also presented by others.29,52,53 The benefit of using
in-source CID is that while acquisition is performed in full-scan mode, it is not restricted to previously
selected compounds. The moderate price of single mass spectrometers makes them an attractive choice
for routine laboratories. The disadvantage, however, is that co-eluting compounds result in interfering
spectra, making them unsearchable from the libraries of pure compounds. It has also not been possible
to reproduce these spectra without extensive tuning of the instrument, and differences in fragmentation
degree between separate instruments were reported.35 One additional difficulty has been the detection
of small peaks from the background; however, a new data-handling procedure was recently developed
to overcome this problem.51
Another screening strategy, based on monitoring of selected ions in a broad scope, was first presented
by Fillion et al. 1995.54 The method was developed for 189 pesticide residue compounds from foods
using GC–MS/SIM, but this strategy was also applicable to LC–MS/MS/MRM with certain
modifications. Two injections in selective-ion mode were needed to cover all compounds, and the
criteria for a positive identification were correct retention time (RT) and ion ratio of the target ion to at
least one qualifier ion. During the first injection, the chromatographic run was split into 35 time
windows and the second injection into 20 time windows. Several authors applied this method to LC–
MS/MS to analyse a limited number of drugs from biological samples,55-58 but the results of only one
broad screening method have been so far published.59 There are several benefits of using MS/MS

21
instead of single MS/in-source CID in screening: higher sensitivity, better specificity because the
fragments originate only from the selected precursor ion, possibility of linking product ion scanning and
library searching for confirmation of the identity of the drugs and the option of including quantification
in the automatic procedure. On the other hand, one weak point is that no matter how many compounds
the MRM procedure covers, it never constitutes “general unknown” screening because the compounds
monitored are selected in advance. Moreover, the scanning speed of the instrument may set a limitation
on the number of compounds that can be included in the method. The high price of instrumentation
may also restrict its applicability. Very recently it was reported that specificity of a triple quadrupole
can be remarkably increased using enhanced resolution, with the mass peak full width at half maximum
height (fwhm) set at 0.1 Da, which improves mass accuracy from the conventional 0.7 Da to as high as
0.003 Da.60 This feature has so far been applied only in metabolite identification, but it would be an
attractive enhancement for broad screening of drugs with LC–MS/MS/MRM.
Time-of-flight (TOF) mass spectrometry is an alternative choice for multicomponent drug analysis of
biological samples. In single-MS time-of flight instruments (LC–MS/TOF) (Figure 7), quadrupoles
focus the ion beam on the TOF analyser, which is positioned perpendicularly, and ions are pulsed into
the flight tube by applying voltage. The ions separate according to their m/z values, high-mass ions
having longer flight times.
Figure 7. Schematic structure of a single-MS time-of-flight mass spectrometer (Applied Biosystems).
LC–MS/TOF provides relatively high mass accuracy (~5 ppm) and reasonable resolution (5000-10000
fwhm) at moderate cost, and has been used in combinatorial chemistry and in analysis of drugs and their
metabolites.61-63 An obvious benefit of TOF mass spectrometers is that they acquire the entire mass
spectrum simultaneously instead of scanning at preset steps. Any compound of interest can be extracted

22
after acquisition from the original run without the need for re-extracting and reinjecting the sample.
This is beneficial when the sample amount is limited or when there is no sample left for further studies.
Acquiring the entire mass spectrum is an important feature when very large numbers of compounds are
screened. In such applications, maintaining hundreds of reference compounds is very expensive and
laborious. Even though LC–MS/TOF instruments provide accurate molecular weight, screening
methods using LC–MS/TOF instruments need very good chromatographic separation, because co-
eluting peaks, as well as unintentional in-source CID fragmentation, lead to a mixture of mass peaks of
unknown origin because the precursor ion cannot be specifically selected. Another drawback of TOF
instruments is that they are not as reliable in quantification as quadrupole instruments.
Techniques involving tandem-MS quadrupole-time-of-flight (LC–MS/MS/Q-TOF) also provide
structural information. Few studies are available that describe broad screening procedures performed
with an LC–MS/MS/Q-TOF instrument64-66 although sophisticated methods including screening and
confirmation in a single run, can be developed. In one of these methods,65 the first step was a survey
scan of the desired mass range with single MS. All masses exceeding the preset threshold of intensity
were then automatically selected for precursor ions to acquire the product ion scan with LC–MS/MS/Q-
TOF. The product ion scan was then acquired with different collision energies, because the most
favourable fragmentation conditions are not known in advance. Based on these accurate masses, the
elemental composition of specific peaks was calculated and searched against the Merck Index or
laboratory’s own list of relevant compounds and their accurate masses. Finally, the product ion spectra
obtained were searched against an in-house spectral library. It was also possible to include automatic
quantitation in the procedure, based on the accurate mass of the precursor ion.65 LC–MS/MS/Q-TOF
screening methods have higher selectivity, sensitivity and reliability compared with the traditional GC–
MS and LC–MS methods. However, one limiting factor is still the ion source, because none of the
available sources is universal. From the practical point of view, maintaining mass accuracy at high
level demands continuous calibration and stable external temperature conditions. The high price of
instrumentation and complexity of the method can also be obstacles preventing this technique from
becoming a routine application in forensic laboratories.
Liquid chromatography coupled with ion trap mass spectrometry (LC–MS/Q-trap) was used in forensic
toxicology to identify a wide range of basic drugs from urine samples by Fitzgerald et al. in 199947 and
was recently also applied to broad screening of drugs.50,68 The mass accuracy in an LC–MS/Q-trap
instrument (~20 ppm for pure compounds at m/z < 500 Da) is much better than in conventional triple
quadrupoles (fwhm = 0.7 Da), but not as good as that of LC–MS/TOF and LC–MS/MS/Q-TOF (~5

23
ppm). In these two LC–MS/Q-trap screening methods,50,68 the survey scan is performed in MRM mode
or in enhanced-resolution SIM mode followed by the product ion scan automatically started by
information dependent acquisition (IDA). Product ion spectra were acquired at three preselected
collision energies in positive mode50 or at two energies in positive and negative ion mode.68 The spectra
were then searched against a correspondingly created mass spectral library. Both of these preliminary
methods showed a high potential for use of ion traps in analytical toxicology. The enhanced mass
accuracy and better sensitivity obtained at no increase in cost compared with quadrupoles makes LC–
MS/Q-trap an interesting new alternative for forensic screening.
2.7 Quantitation in LC–MS/MS/MRM
LC–MS provides the specificity and sensitivity demanded for an accurate quantitation method for a
wide range of compounds. LC–MS/MS with multiple-reaction monitoring (MRM) also provides
quantitation of such substances that are not chromatographically separated, because it can be used to
filter the interfering ions twice, both in the first and in the third quadrupole. The procedure very
effectively cleans the chromatogram, and therefore integration of peak areas is accurate. However, the
co-eluting interfering substances from the matrix do not exit the system but become “invisible”.
Therefore, ion suppression may occur even though it is not seen in any way in the chromatograms. Ion
suppression is caused by compounds in the sample matrix that prevent analytes from reaching the
surface of the droplets during the ion-evaporation process. On the other hand, part of the analytes may
also precipitate during solvent evaporation or remain unevaporated and thereby never reach the mass
spectrometer. In addition, if the protons in the eluent are more attracted by the matrix, then some of the
analytes will not be ionized and will be drawn out of the interface by the vacuum.67 In these situations,
suppression of the analytes leads to too low concentrations. Errors in the results caused by ion
suppression are sample-dependent and incidental, and quantitation becomes unreliable. However, the
standard addition procedure in calibration would diminish the problem, but this is not possible during
screening. It also requires substantial amounts of sample, which is often a limitation in forensic cases.
Therefore, in applications for biological matrices, thorough validation should contain spike tests for a
wide variety of authentic samples, including high and low spike levels to estimate the extent of
suppression. In several applications for combinatorial chemistry, fast chromatography (“high
throughput”) has been suggested, but this includes the obvious risk of ion suppression, which has been
demonstrated to appear mostly during the LC-front peak. Therefore, using an efficient LC gradient
reduces suppression by separating the analytes from the LC-front peak and from other matrix-related
peaks, which may cause suppression later during the run.69

24
3. AIMS OF THE STUDY
The purpose of the present study was to develop library search-based LC–MS techniques for drug
screening and confirmation in forensic toxicology. The specific aims were the following:
- to create LC–MS/in-source CID and LC–MS/MS spectral libraries for toxicologically relevant drugs
(I)
- to test the suitability of different modes of operation for screening and confirmation of drugs from
urine samples, using β-blocking drugs as a sample drug group (I)
- to combine screening and quantification of drugs in blood in a simultaneous and automated procedure,
using antihistamines as a sample drug group (II)
- to evaluate the long-term reproducibility of MS/MS product ion spectra and to investigate the
universal applicability of MS/MS spectral libraries obtained with the same and with different
manufacturers’ triple-quadrupole instruments (III)
- to develop a broad-scale MRM screening method for drugs in blood samples (IV)
- to investigate a screening approach for drugs and their metabolites in urine by accurate mass without
the use of reference compounds (V)

25
4. EXPERIMENTAL
Only the major experimental features are described in this section. More detailed descriptions can be
found in the original publications I – V.
4.1 Standards and reagents
The test substances obtained from various pharmaceutical companies were of pharmaceutical purity. All
solvents were of HPLC grade. Acetonitrile and methanol were purchased from Rathburn (Walkerburn,
UK), ammonium acetate (p.a.), formic acid (p.a.), dichloromethane, isopropanol and
tris(hydroxymethyl)-aminomethane (Tris, p.a.) from Merck (Darmstadt, Germany), and butyl acetate
from Aldrich (Steimheim, Germany). Purified water was generated with an Alpha-Q water purification
system from Millipore (Bedford, MA, USA).
For comparison of LC–MS/MS product ion spectra, 30 test substances were selected based on their
ability to produce several fragments at collision energies of 20, 35 or 50 eV. Amitriptyline was used for
standardization of the MS/MS fragmentation conditions, due to its extensive fragmentation pattern at all
three collision energy levels (III). Accurate mass calibration of the TOF instrument was performed
with Jeffamine D-230® (V), which was obtained from Fluka (Buchs, Switzerland).
4.2 Samples
Bovine blood (II, IV) or urine from laboratory personnel (I, V) were used for standard spikes.
Authentic autopsy samples were used for testing the applicability of methods, e.g. sample behaviour
during extraction steps, matrix effects and repeatability.
4.3 Instrumentation
LC separation was carried out with Perkin-Elmer Series 200 LC–MS pumps and autosampler using a
vacuum degasser (I, II, IV). A Genesis C18 column (100 mm x 2.1 mm i.d., particle size 4 µm; Jones
Chromatography, Hengoed, UK) was used for separation, and a Purospher RP-18 LiChroCart 4-4 (40
mm, particle size 4 µm; Merck) was employed as a guard column. LC separation in the LC–MS/TOF

26
experiments was performed with an Agilent HP1100 binary pump system and autosampler, equipped
with a 10-port switching valve for introducing the calibration standard (V). The separation column was
a Luna C18 (50 x 2.0 mm i.d., particle size 5 µm; Phenomenex, Torrance, CA, USA).
Mass spectrometry was performed using a PE Sciex API 365 triple stage quadrupole instrument (MSD-
Sciex; Concord, ON, Canada) equipped with a PE Sciex Turbo Ion Spray ion source (I, II, IV). Three
other triple quadrupoles were also used in the mass spectral library comparisons; one was an identical
API 365 from Sciex and the other two were both Micromass Quattro triple quadrupoles (Manchester,
UK) equipped with ion spray interfaces (III). Mariner API-TOF mass spectrometer (Applied
Biosystems, Framingham, MA, USA) equipped with a PE Sciex Turbo Ion Spray interface was used
(V) in the LC-MS/TOF measurements.
4.4 Methods
4.4.1 Extraction
Diverse extraction methods were used for the urine and blood samples. The urine samples were
extracted using SPE with C18 mixed-mode separation columns (Isolute Confirm HCX mixed mode,
International Sorbent Technology (IST), Hengoed, UK). For blood samples, two-step LLE was used in
which the basic drugs were first extracted at pH 11 with butyl acetate, followed by a second extraction
of the acidic compounds at pH 3 with dichloromethane:isopropanol (95:5). Finally, the two extracts
were combined prior to LC separation. Detailed descriptions for SPE and LLE are given elsewhere (I,
II).
4.4.2 Liquid chromatography
In all studies, chromatographic separation was performed using a gradient run. The mobile phase
consisted of acetonitrile as the organic solvent and an aqueous solution of ammonium acetate (10 mmol,
0.1% formic acid, pH 3.2) as a buffer, and the total flow was 200 µl/min. In studies in which only a
limited number of compounds (16 (I) and 18 (II)) were analysed, the gradient was adjusted to resolve
most of the compounds from each other.

27
Separation of all components was not possible in screening methods in which hundreds of different
compounds were analysed, and the main objects were to obtain reasonable retention and as good a peak
shape as possible for all compounds (IV, V). As a compromise, the following linear gradient was used
with the Genesis C18 column: CH3CN from 20% to 100% in 10 min with a flow rate of 200 µl/min (IV).
The total run time was 18 min including a 5-min equilibrium time at the beginning and 3 min for
cleaning of the column with 100% CH3CN at the end. The gradient was also linear with the Luna C18
column, and the CH3CN level rose from 5% to 95% in 10 min, but with a flow rate of 400 µl/min (V).
4.4.3 Mass spectrometry
MS was used in I and V, and MS/MS in II, III, and IV. In the MS/MS mode, a protonated molecule
was selected as the precursor ion. For the halogenated compounds, the most abundant isotope (the
monoisotopic mass) was selected. All mass spectrometric experiments were performed only in the
positive ionization mode.
SIM was used for prescreening of β-blocking drugs (I). The declustering potential (orifice) was set at
40 V, and the protonated molecules [M+H]+ were monitored with dwell times of 250 ms. Any matches
to previously defined RTs and masses of the β-blocking drugs were then subjected to confirmation
analyses in an automatic data-dependent experiment (DDE). Confirmation was performed in an
automatic library search of the resulting product ion spectra against a previously created LC–MS/MS
spectral library containing 400 compounds.
MRM was applied for prescreening and quantification of antihistamines (II); the ion transitions were
monitored at a 200-ms dwell time. The MRM survey scan was automatically followed by a
confirmation analysis that was initiated with DDE in a manner similar to that used in the method for β-
blocking drugs. Identification was based on the LC–MS/MS product ion spectra obtained at a collision
energy of 35 eV and searched against the MS/MS spectral library (II).
In the multicomponent screening method for drugs in blood (IV), all 238 transitions were monitored
during a single chromatographic time period, but in three consecutive experiments with different
collision energies (20, 35 and 50 eV). The appropriate collision energy and monitored ions were
individually selected for all compounds to achieve the best obtainable specificity and sensitivity.
However, the choice of collision energy was limited to 20, 35 or 50 eV, because the MS/MS spectral

28
library was created using these values. The shortest reasonable dwell time (25 ms) and total cycle time
(6 s) were used. The positive result was based on correct precursor ion, specific fragment ion and RT of
the analyte.
LC–MS/TOF was used in the broad screening of drugs from urine samples (V). Resolution (at least
5000) and mass accuracy (5 ppm) were optimized daily with three masses of the polymeric material
Jeffamine D-230®. Jeffamine was also used for exact mass calibration of each sample by injecting it
through a switching valve just before each sample injection. The entire mass spectrum from m/z 100-
750 was acquired and stored with acquisition time of 2 s per spectrum. The compounds were identified
without reference compounds by comparing the accurate mass of the peaks with the previously compiled
list of exact masses of toxicologically interesting compounds and their metabolites and also by the
metabolic pattern found in the urine samples.
Studies of long-term reproducibility of LC–MS/MS product ion spectra and compatibility of spectra
obtained with different manufacturers’ instruments (III) were performed by acquiring product ion
spectra of 30 test substances at low (20 or 15 eV), medium (35 or 30 eV) and high (50 or 45 eV)
collision energies, depending on the instrument. Standardization of the fragmentation conditions
(collision energy and collision gas pressure) of different instruments was performed by visual
comparison of the spectra obtained for amitriptyline, which produced extensive fragmentation patterns
at all three collision energy levels.

29
5. RESULTS
5.1 Automated screening and confirmation
In routine forensic analysis, all positive findings from screening procedures must be confirmed. With
quadrupole mass spectrometers, this can be based on library searching of LC–MS/in-source CID or LC–
MS/MS spectra. This presumes the existence of spectral libraries, although no commercial libraries are
currently available for LC–MS spectra. Therefore, two in-house libraries were created, for LC–MS/in-
source CID and LC–MS/MS spectra, each containing 400 compounds (I). The in-source CID spectra
were acquired by switching between low (25 V) and high (90 V) orifice voltages, and these two spectra
were summed. While the low-voltage spectrum was dominated by the protonated molecule [M+H]+ and
the high-voltage spectrum by fragment ions, their summed spectrum was very informative. The LC–
MS/MS product ion spectra were obtained at three different collision energies (20, 35 and 50 eV). For
many compounds, spectra obtained with 20 eV contained only the protonated molecule, and even
though it was very intensive the spectrum was not specific enough for identification. On the other hand,
at 50 eV many compounds were too extensively fragmented and contained many small fragments at low
intensity, and these spectra likewise were not suitable for identification. Therefore, the 35-eV spectra
were added to the library of all compounds, as were the 20-eV or 50-eV spectra for those compounds
for which the 35-eV spectra did not contain enough fragments at adequate intensity. The LC–MS/MS
spectral library thus contains approximately 530 spectra. The difference between in-source CID and
MS/MS spectra is demonstrated in Figure 8. The MS/MS spectra were more reliable in cases of co-
eluting compounds, because co-elution resulted in mixed spectra that were not recognized in the LC–
MS/in-source CID spectral library.
A fully automatic screening and confirmation procedure was developed for 16 β-blocking drugs in urine
samples (I). SPE followed by a 2-step gradient run was used for extraction and chromatographic
separation. The survey scan was performed using LC/MS/SIM, and a positive result was based on the
correct protonated molecule and RT. The confirmation step was carried out in an automatic second
injection during which the product ion spectra for all findings were acquired in the MS/MS mode. An
application program was used to create the acquisition methods for the confirmation run. This program
automatically split the chromatographic run into time periods corresponding to the RTs of the findings.
A maximum of five product ion spectra were monitored during the same time period, otherwise a third
injection was done for the other compounds appearing at the same time window; this procedure ensured

30
sufficient sensitivity. The spectra obtained were then automatically searched against the in-house
spectral library, and the search results were also reported automatically. The method developed was
Figure 8. Comparison of the mass spectra for propranolol. Upper trace: LC–MS/in-source CID spectra (summed spectra acquired at 25- and 90-V orifice voltages). Lower traces: LC–MS/MS spectra at three collision energy levels. sufficiently sensitive to identify β-blocking drugs in urine at the levels expected after therapeutic doses,
except for pindolol, for which the limit of identification (LOI) based on the product ion spectra (1.2
mg/l) remained 10 times higher than the therapeutic range in blood (0.02 – 0.15 mg/l). Application of
DDE for automation of the screening and confirmation procedure, from the start of the sample batch to
the summary report of the library search results, was the main target of the study. In this method,
automation was carried out with an Apple Scripting application program (Auto MS/MS Builder, Perkin-
Elmer Sciex).
Another application of the DDE was developed for screening and quantitation of 18 antihistamines from
blood (II). LLE was applied because whole-blood samples may cause blockage of SPE columns. The
antihistamines are a group of chemically different compounds, and therefore both basic and acidic
extraction steps were included. Mass spectrometric analysis was performed using MRM for the survey
scan, and any matches to a previously defined list of RTs, protonated molecules and major fragment

31
ions were confirmed using product ion spectra in an automatically initiated second run. Quantitation
was based on the MRM data obtained during the survey scan.
The extraction recovery varied widely between compounds: for basic drugs from 43% to 137%, and for
acidic drugs from 23% to 66%. However, the recovery percentage itself is not essential, but in practical
work good repeatability and high sensitivity are. For all antihistamines, the intra-assay precision varied
from 3% to 9%, and the limits of quantification (LOQs) were between 0.0005 and 0.01 mg/l, far below
the average maximum concentrations occurring after therapeutic doses of these drugs. The results
indicated that the method is sufficiently reproducible and sensitive to be used for quantitation of
antihistamines. Identification by product ion spectra was included in the method by DDE and the
automatic library search application script. The identity of a drug was considered confirmed when the
spectral fit was 70% or higher. The LOIs were not as low as the LOQs (mainly between 0.001 and 0.07
mg/l), but were low enough to confirm the drugs at higher therapeutic ranges in blood, except for
clemastine. The validation results of the method are summarized in Table 2. Inaccuracy was expressed
as the maximum bias of the results when two persons performed the analysis on different days during a
single week.
Table 2. Validation data for the identification and quantitation of antihistamine drugs in blood samples using LC–MS/MS. LOQ = limit of quantitation, LOI = limit of identification Compound LOQ, mg/l
by MRM LOI, mg/l
by MS/MS spectra Precision
% Inaccuracy
% Recovery
% Acrivastine 0.001 0.005 7 29 35 Astemizole 0.002 0.001 3 20 39 Brompheniramin 0.0005 0.007 3 12 43 Carbinoxamine 0.002 0.002 3 6 37 Cetirizine 0.001 0.005 9 35 24 Chlorpheniramin 0.001 0.002 3 8 38 Cinnarizine 0.005 0.003 6 16 85 Clemastine 0.0005 0.015 6 15 91 Cyclizine 0.005 0.005 5 5 137 Diphenhydramin 0.005 0.015 4 12 65 Ebastine 0.01 0.001 5 20 62 Fexofenadine 0.0005 0.005 8 15 NE Hydroxyzine 0.001 0.001 3 8 53 Levocabastine 0.0005 0.003 6 39 66 Loratadine 0.002 0.001 3 10 91 Mizolastine 0.002 0.002 3 10 43 Prometazin 0.008 0.007 3 8 32 Terfenadine 0.003 0.001 7 12 65
NE = not examined

32
5.2 Quantitative analysis
The calibration curves of the antihistamines were nonlinear along a broad concentration range. Various
regressions for the same calibration points were tested, and the effect on correlation is illustrated in
Figures 9-11 (VI). The best accuracy was achieved for low concentration points by excluding the
highest calibration points and using linear regression forced through zero (Figure 10). Quadratic
regression including all calibration points was applied only when a broad concentration range was
needed (Figure 10).
Figure 9. Linear calibration curve of carbinoxamine at concentration range 0.001-0.1 mg/l. Correlation coefficient = 0.9847.
Figure 10. Linear calibration curve of carbinoxamine at concentration range 0.001-0.1 mg/l. The highest calibration point is excluded and the curve is forced through zero. Correlation coefficient = 0.9993.
Figure 11. Quadratic calibration curve of carbinoxamine at concentration range 0.001-0.1 mg/l. Correlation coefficient = 0.9996.
33
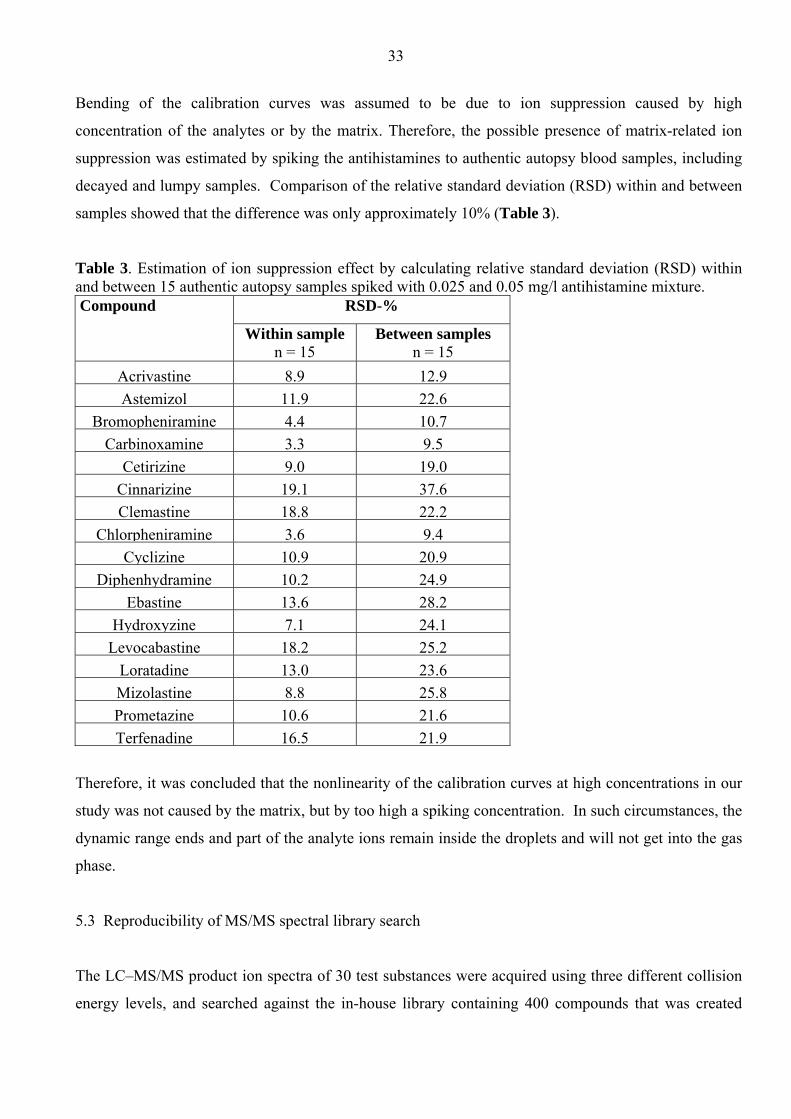
Bending of the calibration curves was assumed to be due to ion suppression caused by high
concentration of the analytes or by the matrix. Therefore, the possible presence of matrix-related ion
suppression was estimated by spiking the antihistamines to authentic autopsy blood samples, including
decayed and lumpy samples. Comparison of the relative standard deviation (RSD) within and between
samples showed that the difference was only approximately 10% (Table 3).
Table 3. Estimation of ion suppression effect by calculating relative standard deviation (RSD) within and between 15 authentic autopsy samples spiked with 0.025 and 0.05 mg/l antihistamine mixture. Compound RSD-%
Within sample
n = 15 Between samples
n = 15 Acrivastine 8.9 12.9Astemizol 11.9 22.6
Bromopheniramine 4.4 10.7Carbinoxamine 3.3 9.5
Cetirizine 9.0 19.0Cinnarizine 19.1 37.6Clemastine 18.8 22.2
Chlorpheniramine 3.6 9.4Cyclizine 10.9 20.9
Diphenhydramine 10.2 24.9Ebastine 13.6 28.2
Hydroxyzine 7.1 24.1Levocabastine 18.2 25.2
Loratadine 13.0 23.6Mizolastine 8.8 25.8Prometazine 10.6 21.6Terfenadine 16.5 21.9
Therefore, it was concluded that the nonlinearity of the calibration curves at high concentrations in our
study was not caused by the matrix, but by too high a spiking concentration. In such circumstances, the
dynamic range ends and part of the analyte ions remain inside the droplets and will not get into the gas
phase.
5.3 Reproducibility of MS/MS spectral library search
The LC–MS/MS product ion spectra of 30 test substances were acquired using three different collision
energy levels, and searched against the in-house library containing 400 compounds that was created

34
four years earlier. Very good Fit percentages (86-98%) were obtained for the newly acquired spectra of
all compounds at all tested fragmentation conditions, demonstrating good long-term reproducibility.
To examine the interlaboratory reproducibility, comparison of spectra between two similar instruments
from the same manufacturer was carried out. The libraries were independently created and both
contained spectra of approximately 400 drugs. In these libraries, the spectra were acquired at three or
four collision energy levels, two of which were the same (20 eV and 50 eV), and could be compared
directly. Thirty test substances were selected from one library and searched against the other. The Fit
percentages varied between 93% and 95%. At medium energy, one library had spectra at 35 eV and the
other at 30 and 40 eV. Comparison showed that the spectra at 35 eV were closer to those at 30 eV than
at 40 eV. Even though the collision energies were not exactly the same, Fit percentages were as good
as 82–89%.
To examine the reproducibility of spectra acquired with different manufacturers’ triple-quadrupole
instruments, standardization of fragmentation conditions was needed prior to spectral comparison.
Amitriptyline was suitable for this purpose, because it produced product ion spectra with several
fragments at all applied CEs. After standardization, 30 test substances were acquired with two
instruments from two manufacturers, and the product ion spectra obtained were searched against the
reference library. A graphic presentation of the results is shown in Figure 12.
60
70
80
90
100
fenf
lura
min
e
fluvo
xam
ine
min
oxid
il
nico
tine
nife
dipi
ne
nort
ripty
line
piro
xyca
m
proc
aine
prom
etaz
in
venl
afax
ine
amin
ophe
nazo
ne
aten
olol
atro
pine
diaz
epam
enal
april
med
azep
am
met
opro
lol
prop
yphe
nazo
ne
theo
brom
ine
trim
etho
prim
carb
amaz
epin
e
chlo
rpro
thix
ene
dipy
ridam
ole
doxe
pine
fleca
inid
e
lam
otrig
ine
papa
verin
e
perp
hena
zine
praz
epam
zucl
open
thix
ol
Sciex B Micromass C Micromass D
Fit-%
Figure 12. Comparison of spectra obtained with different manufacturers’ triple quadrupoles. Similarity is expressed as Fit percentage against the reference library of the Sciex A instrument.

35
As can be seen, the similarity of spectra obtained with different manufacturers’ instruments, was
generally very good (Fit between 80% and 85%). The only obtrusively low value for dipyridamole
(45%) was regarded as random error occurring during handling or processing of the sample, because no
special difficulties have been encountered during previous use of this compound.
5.4 Comprehensive screening by multiple-reaction monitoring
A comprehensive screening for drugs in blood was developed for LC–MS/MS operating in the MRM
mode. This approach was successfully enlarged to include 238 drugs. It was demonstrated that as
short a dwell time as 25 ms was sufficient to obtain an adequate signal-to-noise ratio for reliable
detection of compounds at their therapeutic levels. The short dwell time enabled monitoring of a large
number of compounds during a single chromatographic run without splitting it into time periods.
Positive identification was based on three criteria: correct precursor ion, fragment ion and RT.
Additionally, the signal-to-noise ratio at the limit of detection (LOD) was required to be at least three,
data points across the chromatographic peak at least four and areas for internal standards above the
limits given to show that extraction was successful. The LOD values were determined for all 238 drugs
and were within the therapeutic ranges of these drugs (Table 4), including such acidic/neutral
compounds (e.g. paracetamol and theophylline) that are not very sensitive in positive ion mode.
The suitability and coverage of the method can be seen from Table 4, which presents typical
therapeutic ranges, LODs, RTs, monitored fragment ions and collision energies for 80 drugs commonly
found in autopsy cases in Finland between 2000 and 2003. Screening for only these compounds would
cover 87% of all findings obtained with all other methods during these years (GC, GC–MS, TLC and
OPLC). Comparison of 71 authentic autopsy blood samples revealed that 92% of the findings were
consistent with those obtained with GC, GC–MS or TLC/OPLC. Of a total of 256 positive findings,
only 18 could not be verified by any other method or from other sample material. The explanation for
these findings remains obscure; however, none of the other methods contained the same compounds or
was as sensitive as MRM.
5.5 Comprehensive screening by accurate mass measurement
To be able to identify even those compounds for which primary reference standards are not readily
available, a screening approach based on accurate mass measurement was developed. A method for

36
Table 4. Characteristics of the MRM screening method. Data for 80 drugs commonly found in Finland during 2000-2003. Therapeutic concentration ranges were collected from references 70-79. Therap. conc. LOD RT [M+H]+ Fragment CE Compound mg/l blood mg/l min. eV Caffeine 8 – 15 1.00 2.77 195.0 138.0 35 Temazepam 0.4 - 0.9 0.02 7.18 301.0 255.0 35 Oxazepam 0.1 - 1.4 0.02 6.33 287.0 269.0 20 Diazepam, desmet- 0.1 -1.7 0.05 7.18 271.0 208.0 35 Diazepam 0.1 - 2.5 0.02 8.08 285.0 222.0 35 Paracetamol 10 – 25 5.00 2.49 152.0 110.0 20 Citalopram 0.06 – 0.4 0.02 5.71 325.0 109.0 35 Nicotine 0.01 - 0.04 0.05 2.15 163.2 132.0 20 Zopiclone ad 0.1 0.10 3.96 389.0 245.0 20 Codeine 0.03 – 0.1 0.10 2.54 300.2 215.0 35 Levomepromazine 0.05 - 0.14 0.02 6.50 329.0 247.0 35 Carbamazepine 5 – 10 0.02 6.10 237.0 194.0 20 Lidocaine 2 – 5 0.05 3.73 235.2 86.0 20 Mirtazapine (ad 0.2) 0.02 4.35 266.2 195.0 35 Amitriptyline 0.04 - 0.2 0.02 6.56 278.0 233.0 20 Tramadol ad 0.6 0.02 4.18 264.0 58.0 20 Chlordiazepoxide 1- 3 0.02 5.71 300.2 282.0 35 Demoxepam 0.02 5.82 287.0 269.0 35 Morphine 0.08 - 0.12 0.10 1.97 286.0 201.0 35 Citalopram, desmet- 0.02 5.53 311.2 262.0 20 Metoprolol 0.1 - 0.6 0.02 4.07 268.2 191.0 20 Promazine 0.1 - 0.4 0.02 6.22 285.0 86.0 20 Doxepine 0.03 - 0.15 0.02 5.88 280.2 235.0 20 Nortriptyline 0.05 - 0.25 0.02 6.44 264.2 233.3 20 Fluoxetine 0.09 - 0.5 0.10 6.78 310.2 148.0 20 Chlorprothixene 0.04 - 0.3 0.02 6.95 316.0 231.0 35 Propranolol 0.03 - 0.25 0.02 5.37 260.2 155.0 35 Oxycone 0.01 - 0.1 0.05 2.83 316.2 298.3 20 Theophylline 8 – 20 5.00 2.37 181.2 124.2 20 Olanzapine ad 0.2 0.05 2.99 313.2 256.0 35 Warfarin 1.0 - 3.0 0.02 7.90 309.2 251.0 20 Trimethoprim 1.5 - 2.5 0.05 3.11 291.2 230.0 35 Thioridazine 0.2 - 1.0 0.02 7.51 371.0 126.0 35 Diltiazem 0.05 - 0.3 0.02 5.82 415.0 178.0 35 Venlafaxine 0.07 - 0.3 0.02 4.86 278.2 260.3 20 Lorazepam 0.05 - 0.24 0.02 6.56 321.2 303.0 20 Phenytoin 10 – 20 0.05 6.10 253.2 182.3 20 Alprazolam 0.01 - 0.02 0.02 6.05 325.2 297.0 35 Mianserine 0.03 - 0.12 0.02 5.65 265.2 208.0 20 Dextropropoxyphen 0.1 - 0.75 0.05 6.56 340.0 266.0 20

37
Table 4 (cont.). Characteristics of the MRM screening method. Data for 80 drugs commonly found in Finland during 2000-2003. Therapeutic concentration ranges were collected from references 70-79. Therap. conc LOD RT [M+H]+ Fragment CE Compound mg/l blood mg/l min. eV Metoclopramide 0.04 - 0.1 0.02 3.84 300.2 227.0 20 Atenolol 0.2 - 0.6 0.30 1.70 267.2 225.0 20 Clozapine 0.1 - 1.0 0.02 5.59 327.2 270.3 35 Ketoprofen 6.0 – 14 0.10 7.28 255.0 209.0 35 Risperidone 0.004 - 0.027 0.02 4.90 411.2 191.0 35 Chlorpromazine 0.05 - 0.3 0.02 6.95 319.0 246.0 35 Verapamil 0.07 - 0.35 0.02 6.50 455.2 165.0 35 Orphenadrine 0.03 - 0.85 0.02 6.10 270.4 181.2 20 Trimipramine 0.01 - 0.3 0.02 6.67 295.2 100.0 20 Carbamazepine, 10-OH 2 – 30 0.10 4.52 255.2 237.0 20 Amiloride approx. 0.04 0.10 2.03 230.2 171.0 20 Perphenazine 0.0004 – 0.03 0.00 6.93 404.2 171.3 35 Buprenorphine 0.5 - 10 µg/l 0.01 5.87 468.2 396.3 50 Sertraline 0.05 - 0.25 0.02 6.78 306.0 275.2 20 Quinine 2-8 0.02 4.24 325.2 307.0 35 Oxcarbazepine < 1 0.02 5.31 253.2 236.0 20 Melperone 0.04 - 0.06 0.02 5.03 264.0 165.0 35 Moclobemide 1.5 - 2.5 0.05 3.73 269.2 182.0 20 Triamteren 0.01 - 0.2 0.10 3.22 253.8 237.0 35 Ranitidine 0.15 - 0.25 0.10 1.80 315.2 176.0 20 Bisoprolol 0.01 - 0.1 0.02 4.97 326.2 116.0 20 Tetrahydrocannabinol 0.05 12.25 315.2 193.2 20 Indomethacine 0.7 – 4 0.05 8.58 358.0 138.8 20 Sotalol 0.5 – 4 0.10 2.13 273.2 255.0 20 Morphine, 6-monoacetyl- 0.10 2.65 328.2 211.0 35 Zolpidem 0.08 - 0.15 0.02 4.69 308.2 235.3 35 Lamotrigine 0.5 - 4.5 0.10 4.01 256.0 211.0 35 Hydroxyzine 0.05 - 0.1 0.02 6.27 375.2 201.0 35 Midazolam 0.08 - 0.2 0.02 5.93 326.0 291.0 35 Paroxetine 0.008 - 0.05 0.02 6.15 330.2 192.0 35 Fluvoxamine 0.05 - 0.25 0.02 6.33 319.2 259.0 20 Hydroxychloroquine 0.1 - 1.0 <0.3 2.43 336.2 247.0 35 Aminophenazone, 4-met- approx. 10 5.00 2.60 218.2 187.0 20 Clonazepam, 7-amino- 0.02 4.35 286.2 222.0 35 MDMA 0.02 3.28 194.2 163.0 20 Chloroquine 0.02 - 0.5 0.02 2.65 320.0 247.0 35 Midazolam, 1-hydroxy- 0.02 6.16 347.2 324.0 35 Mesoridazine 0.2 - 1.6 0.02 5.37 387.2 372.3 35 Amiodarone 0.8 - 2.8 0.05 10.22 646.0 100.3 35 Sulpride 0.03 - 0.6 0.10 1.85 347.2 214.0 35

38
433 drugs and metabolites in urine was developed with LC–MS/TOF (V). The mass accuracy of 5 - 10
ppm was obtained for the majority of these drugs in authentic samples, using internal mass calibration
with each sample. The major effort in this study was to develop postrun software to search for the
selected masses in the total ion chromatogram (TIC), acquired as a full mass spectrum from m/z 100-
750. For this purpose, a list of the 433 drugs selected was stored, containing the theoretical
monoisotopic mass, RT (if known), compound name and formula, and a compound code. Using a
preselected mass window, this list was used for automatic generation of extracted ion chromatograms
from the spectrum acquired, and to arrange the results so that the parent drug and its metabolites were
reported together, which made interpretation of the results easier. Table 5 presents an example of the
automatic report of the results (see details in V). Comparison of this screening method with the
established TLC and GC methods with authentic urine samples indicated good agreement.

39
Table 5. An example of a screening report of the results obtained with the LC–MS/TOF screening method.
Code* Compound** Mass Found
Reference Mass
Ppm Error
Retention Time
Reference Retention Time***
Retention Time Error
Peak Area
0153 DEMOXEPAM 287.0584 287.0582 -0.6 6.53 6.6 -0.07 87530154.1347 NORDIAZEPAM 271.0641 271.0633 -3 6.96 6.9 0.06 19680155.1344.2822 OXAZEPAM 287.0584 287.0582 -0.6 6.53 6.9 -0.37 87530471 FLUOXETINE 310.141 310.1408 -0.6 6.46 6.4 0.06 6836
0847 PROMAZINE SULFOXIDE 301.1398 301.1369 -9.5 10.44 0 547
1666
O-DEMETHYL DEACETYL NORDILTIAZEM 345.1223 345.1267 12.8 0.46 0 562
1666
O-DEMETHYL DEACETYL NORDILTIAZEM 345.1227 345.1267 11.7 4.57 0 30779
1831 CODEINE 300.1601 300.1598 -1 4.89 1.3 3.59 13942141 PROPRANOLOL 260.162 260.1647 10.6 5.50 0 20129
2255 10-OH-NORTRIPTYLINE 280.1714 280.1696 -6.4 5.67 6 -0.33 474080
2431 DOXEPIN 280.1714 280.1696 -6.3 5.67 5.7 -0.03 4740802432 NORDOXEPIN 266.1536 266.1539 1.1 5.07 5.6 -0.53 26462432 NORDOXEPIN 266.1547 266.1539 -2.9 5.60 5.6 0 2883472433 DOXEPIN-N-OXIDE 296.1633 296.1645 4.1 5.18 5.2 -0.02 397202433 DOXEPIN-N-OXIDE 296.1639 296.1645 2 5.96 5.2 0.76 1010142731 ZOPICLONE 389.111 389.1127 4.2 0.46 4.6 -4.14 9832731 ZOPICLONE 389.1105 389.1127 5.6 4.57 4.6 -0.03 501332732 NORZOPICLONE 375.0964 375.0967 0.8 0.46 4.5 -4.04 6782732 NORZOPICLONE 375.0981 375.0967 -3.9 4.50 4.5 0 9075
2733ZOPICLONE- N-OXIDE 405.1069 405.1073 0.9 4.89 4.9 -0.01 8774
2931 HYDROCODONE 300.1601 300.1598 -1 4.89 3.1 1.79 13943021 NALORPHINE 312.1572 312.1596 7.5 5.35 0 96313131 ETHYLMORPHINE 314.1749 314.1746 -0.8 4.96 0 38583131 ETHYLMORPHINE 314.1686 314.1746 19.4 5.32 0 8563441 REMOXIPRIDE 371.1008 371.0961 -12.6 11.47 0 5563822 NORCLOBAZAM 287.0584 287.0582 -0.6 6.53 0 8753 * Compound Code xxyz: xx = parent drug group, y = number of compounds in the group, z = ordinal number of the drug in the group ** Correct findings underlined *** For those compounds without a RT in the library, a value of 0 was given.

40
6. DISCUSSION
In the present study, the scope of LC–MS was widened from target analysis to comprehensive screening
and confirmation utilizing a library search. In forensic toxicology, however, extraction of drugs from
biological material is a critical step related to comprehensiveness. Other issues that may limit the
coverage of a screening method are chromatography, ionization, prescreening strategy, sensitivity and
reliability of identification.
Relatively good separation is needed even when MS/MS is used for detection. Separation of analytes
from each other and from the biological material reduces the probability of ion suppression in an ES ion
source. RT time was also seen to be very useful as one criterion for identification of unknowns in the
methods developed (I, II, IV). Detailed optimization of LC conditions and eluent composition was not
regarded as necessary, since several studies showed that LC composition does not affect the appearance
of MS/MS spectra.29-31,33,34 Therefore, attention was focused only on separation of analytes from the
LC-front peak and on obtaining a reasonable compromise of total analysis time, reasonable peak shape
and separation. Separation of all analytes would probably not have been even possible in methods
containing several hundreds of compounds, and therefore we attempted to use LC procedures as simple
and general as possible. Keeping these practical aspects in mind, we chose a commonly used column
(RP C-18), solvent (acetonitrile) and buffer (ammonium acetate), and used a simple linear gradient
(acetonitrile from 20% to 100% in 10 min). The total flow was maintained at 200 µl/min to ensure
evaporation of the eluent throughout the gradient. Otherwise, the analytes would have remained inside
the droplets and exited the ion source through the exhaust outlet, thereby decreasing the sensitivity. As
was seen in the MRM screening of 238 drugs (IV), sufficient separation was achieved under these
general LC conditions, and the analytes were eluted quite evenly along the gradient.
For the survey scan, both the SIM and MRM modes were tested and found suitable (I). In the SIM
mode, all compounds having the same m/z value passed the survey scan and therefore more precursor
ions were included in the following confirmation step than in the MRM mode, in which the fragment
ions were also defined in advance. Preselection of the precursor and fragment ions limits the coverage
of the survey scan, but on the other hand makes the survey scan much more selective and sensitive than
using the full scan. As a new point of view, it could be possible to perform the survey scan with a step
size of 1.0 Da instead of the commonly used 0.1 Da, and thereby select all total mass values within the
mass range of interest, e.g. m/z 150-700 for toxicologically relevant drugs and by that means cover the
entire mass range. This approach has not been studied in practice, but it could be as “general” as using

41
a full scan for the screening step44 and probably would be more sensitive. Whatever survey scan is
used, the confirmation step should be based on product ion spectra searched against a spectral library.
For β-blocking drugs, the survey scan with SIM was selected due to its simplicity, whereas MRM
provided the simultaneous quantitation needed in the antihistamine analysis. Currently however, MRM
is applied to all LC-MS screening and quantitation analyses, due to its better selectivity and sensitivity.
The methods for antihistamine and β-blocking drugs are in routine use with the exception that the
confirmation step could not yet be automated after the change in software from the MacIntosh-based
Multiview 1.4 to MS Windows-based Analyst 1.3.
Triple-quadrupole mass spectrometers have widely been used for quantitative analysis because of their
high selectivity and sensitivity combined with good reproducibility. The special challenge for
quantitation of drugs in forensic samples is that the difference between low therapeutic and lethal
concentrations can be as much as 1000-fold. During validation of the antihistamine method (II), it was
noted that the calibration curves were not linear over a very broad range of concentrations (0.05-500
µg/l. This is typically encountered in quantitation with LC–MS/MS/MRM and was also reported by
others.59 Therefore, the calibration points and regression were chosen according to relevant
concentration ranges. Bending of the calibration curves was first suspected to be due to ion suppression
caused by the matrix, which was claimed to be a serious problem in LC–MS for quantitation of drugs in
forensic samples where the matrix varies remarkably from one sample to another.80 However, our
spiking tests of antihistamines in several autopsy samples revealed only slightly higher RSDs between
samples than within samples, which in our opinion showed that matrix-related ion suppression did not
affect this analysis. However, the limited dynamic range was more likely due to suppression of the
analyte itself in high concentrations. Our observations were in agreement with other ion-suppression
studies,69,81 which demonstrated that matrix-related ion suppression is more pronounced in the LC-front
peak than in the rest of the gradient, where the analytes are separated from the polar and unretained
components of the matrix.
Various strategies for combined screening and confirmation of drugs were examined: single-MS using
SIM for the survey scan and in-source CID spectra or MS/MS product ion spectra for confirmation,
MS/MS using MRM for the survey scan and MS/MS product ion spectra for confirmation, and LC–
MS/TOF using accurate masses for the survey scan and confirmation. The single quadrupole
instrument is a suitable and nonexpensive choice for screening. Moreover, the LC–MS/in-source CID
spectra, being summed low- (+25 V) and high-orifice voltage (+90 V) spectra, contained both fragment

42
ions and an intensive protonated molecule, which was usually weak or totally missing from the LC–
MS/MS product ion spectra at medium or high collision energy levels. Various combinations of low
and high voltages were used by others, e.g. +20, +50 and +80 V,29 ± 20 V and ± 80 V,30 ± 10 V, ± 50 V
and ±100 V,31 or even linear ramping of the voltage,33 but in general, for relevant information only two
different levels are needed. The presence of the protonated molecule in the spectrum is an undeniable
benefit against LC–MS/MS spectra, which were more specific because the only origin of the fragments
was the precursor ion chosen. More harmony has been shown in the selection of collision energies in
MS/MS. In addition to our choice of using 20, 35 or 50 eV, only a combination of 20, 30, 40 and 50 eV
was applied.40 We observed that still higher or lower collision energies added no new information to
the product ion spectra. As can be concluded from the diversity of the applications, it is reasonable and
indispensable to standardize the fragmentation conditions if library searches are commonly and
routinely to be used for identification. In contrast, it is always beneficial to optimize relevant
fragmentation conditions to obtain the highest sensitivity for quantitation purposes.
The possibility of creating and using universal LC–MS/MS spectral libraries was evaluated. Before
universal LC–MS/in-source CID and LC–MS/MS spectral libraries can be created and used, agreement
should be reached on the fragmentation conditions to be employed, but to date this has not been done,
as previously discussed. To determine whether there is a basis at all to usage of spectral libraries,
reproducibility of LC–MS/MS product ion spectra within one and between separate triple-quadrupole
mass spectrometers was examined. Long-term reproducibility within instruments was excellent and in
agreement with previous studies,40 which encouraged further testing for similarity of spectra obtained
with similar instruments from the same and from different manufacturers. The results showed that LC–
MS/MS spectra, acquired with one instrument, can successfully be searched against a library created
with another instrument of the same type. This is a promising finding for future efforts to develop
generally available LC–MS/MS spectral libraries, and warrants further comparison with other
instruments and manufacturers.
Comparison between spectra is difficult when instruments use different software programs that are not
compatible. We also observed that algorithms for data processing prior to the library search were not
similar and altered the data in different ways, leading to unacceptable library search results. For
instance, one software used centroiding parameters that deleted important small peaks, such as those for
the protonated molecules. During the library search process itself, the intensity factor was also seen to
affect the search results. In contrast to previous opinions,30,35 judgment on similarity should include
tight criteria for peak intensity ratios, at least when conclusions are drawn on the performance of

43
instruments. Mass spectra are generally used for identification of unknown compounds, and the criteria
for positive identification have been discussed in many contexts. However, there still is no common
agreement on the acceptance criteria for a reliable match, although suggestions of approximately 70-
80% were presented for a fair or good match.33,34 According to studies on the subject and our previous
experience with actual samples, we suggest that a Fit of approximately 70% or higher would result in a
satisfactory confidence level, presuming that the peak intensity would allow the entire spectrum to be
detected.
Comprehensive screening with MRM (IV) was also tested and was found to be sensitive and reliable for
a large number of compounds. Some important factors demanded special attention: cross-talk, which
may occur if two compounds co-elute and have the same fragment ions, instrument scanning speed,
which limited the number of compounds that were detected during a single chromatographic run and
dwell time, which effected sensitivity and also limited the number of compounds. Cross-talk is a
known feature of older triple-quadrupole models, but can be avoided by careful planning of the order of
MRM transitions, as was demonstrated earlier.56 Scanning speed and the applied dwell time together
contributed to the sensitivity. Increasing the dwell time to promote sensitivity led to fewer data points
across the chromatographic peak and thereby made detection insecure. However, instrumental
technology has improved rapidly, and at present dwell times as low as 5 ms can be used. According to
the generally accepted rules for reliable identification,82 the number of MRM transitions should be at
least two, providing a total of three diagnostic ions. With the additional criterion for RT, these
parameters provide a high confidence level in both screening and quantitation. The method developed
could easily have been expanded to also include confirmatory ions, but the available instrument
scanning speed was decisive and determined the number of transitions that could be monitored during a
single run. However, the method developed with 238 transitions is the broadest published screening
application of MRM available.
One way to enlarge the coverage of the method is to split the chromatographic run into time windows,
as was proposed for multicomponent screening with GC.54 By this means, fewer transitions are
monitored at the same time, and therefore higher dwell times can be used to improve sensitivity or the
number of compounds searched can be increased. Sensitivity can also be improved by optimizing the
collision energy for every compound individually.59 Optimization was not performed for the 238
compounds in our method, because the intention was to use standard operating conditions in all LC–
MS/MS work in the laboratory. Even so, the sensitivity obtained in the MRM screening method
developed was sufficiently high for routine studies of forensic samples.

44
In the comprehensive screening method using LC–MS/TOF (V), no separate prescreening step was
needed, while during acquisition the instrument recorded all masses at the selected mass range. Using
this feature, TOF instruments enable a basically unlimited number of toxicants to be screened during a
single injection without sacrificing the sensitivity or selectivity. One limitation, set by the user, was the
selection of compounds on the target list, which was limited to 433 common drugs and their
metabolites. Some complexity in interpretation of the results was also caused by the fact that two or
even more drugs were obtained for the same molecular formula. The number of candidates differing by
formula can be further decreased by using an instrument with higher mass accuracy, or using RT as an
identification criterion. RTs were not used in the automatic procedure, because they were not known
for most of the metabolites. However, the metabolic pattern was an efficient tool for ruling out apparent
false-positive findings. Automatic processing was absolutely necessary in this method, because
substantial information was extracted from huge amounts of data. Nonautomatic methods cannot be
accepted for routine analysis when large numbers of samples are to be analysed daily. Automation also
decreases the possibility of human errors. Special programs were also needed for the other methods
developed, because the original software did not contain the necessary options for data handling and
convenient reporting.
RTs of metabolites can be collected from routine samples containing parent drugs and their metabolites,
and these data were later added to the identification criteria in the improved version of the method,83
which has been taken into routine use and accredited by the Finnish Accreditation Service (FINAS) in
June 2004. The possibility of detecting toxicants without reference compounds is a major advantage of
this approach. In forensic toxicology, maintaining a large selection of reference compounds is very
expensive and even impossible, because most of the metabolites are not commercially available.
Therefore, LC–MS/TOF appears to be very suitable for this type of application, and this technique was
considered as the closest approach to the so-called “general unknown screening”, especially if high-
resolution instruments were used.
Both screening methods, LC-MS/MS/MRM (IV) and LC-MS/TOF (V), are suitable for routine use in
forensic studies. Screening of real unknowns is not possible with the MRM technique, but from the
practical point of view, the selection of compounds routinely found in post mortem forensic
toxicological cases may not be very wide. For example, in the Forensic Toxicology Laboratory of the
University of Helsinki between 2000 and 2003, approximately 90 of 300 compounds found covered
95% of all findings. Therefore, the choice of method can be done according to the instrumentation
available and screening strategy preferred.

45
7. CONCLUSIONS
This dissertation described novel approaches for expanding the limits of LC–MS from conventional
target analysis of a few compounds to comprehensive analysis based on large spectral libraries. The
challenges originated from drug screening and confirmation problems encountered in forensic and
clinical toxicology. The strengths of LC–MS over other techniques were the broad range of compounds
that could be analysed and the ruggedness of instrumentation against difficult sample matrices.
Triple-quadrupole MS/MS proved to be a selective and sensitive technique for identification based on
library searching of product ion spectra. Two automated procedures demonstrated the advantages of the
technique. SIM and MRM were applied to the qualitative analysis of β-blocking drugs in urine and
quantitative analysis of antihistamines in blood, respectively, with confirmation by product ion spectra
against an in-house library of 400 drugs. The quantitation method of antihistamines also showed that
with MRM techniques, compounds at very low concentration can be quantitated accurately from
forensic samples containing high background.
The in-house library of product ion spectra of 400 drugs was shown to be reproducible in the long term.
Moreover, spectral libraries created with identical instruments from the same manufacturer, were fully
compatible. The finding that the spectra obtained using a different manufacturer’s instruments under
standardized conditions could also be successfully searched against the in-house library widens the
prospect for the generation of universal spectral libraries. The future of LC-MS/MS libraries will be
dependent not only on the activity of LC-MS/MS users but also on that of the manufacturers, who play
an important role in developing the instrument software. To date, there has been little interest among
manufacturers to develop or financially support work on universal LC-MS/MS spectral libraries;
however, this may well change along with the novel studies.
The largest target-screening method published using MRM included transitions for 238 drugs, and the
method was also amenable to simultaneous quantification. The LODs in blood were generally at
therapeutic levels, suggesting the method was sufficiently sensitive for use in forensic contexts.
LC–MS/TOF provided a screening method for drugs and metabolites without reference standards, and a
target database for 433 compounds was created. A mass accuracy of 20 ppm obtained in real urine

46
samples together with the metabolic pattern obtained were suggested to be sufficient to detect the
correct findings and to rule out apparent false-positive findings, with the use of dedicated software.
The methods described persuaded us that LC-MS is very suitable for a variety of applications in
forensic toxicology, in which high reliability of results is categorical. Screening of a wide variety of
compounds and quantitation of a wide range of concentrations from a diverse matrix is a demanding
task, but LC-MS proved to be amenable to such applications. However, no single technique alone is
sufficient to attain the expected confidence level and therefore LC-MS, adequate as it is, cannot replace
all other techniques, but will be used together with those recognized to be useful and effective.

47
AKNOWLEDGEMENTS
This study was carried out at the Department of Forensic Medicine, University of Helsinki, during the
years 1999-2004.
I especially acknowledge Prof. Erkki Vuori, Head of the Forensic Chemistry Division, for his firm
support and his willingness to offer a stimulating environment and equipment for my studies. I also
appreciate his encouraging comments and the great interest he has shown in my work during these
years. I also recognize the importance of the support and encouragement offered by Prof. Reija Jokela,
Professor of Organic Chemistry in the Helsinki University of Technology, not only during the process
of this thesis but also during my previous studies at the University of Technology.
I am very grateful to my first supervisor Dr. John Robson, who initially guided my enthusiasm to work
with LC–MS and provided his expertise for realizing the broad range of new ideas, and who also
managed the cooperation with the instrument manufacturer. I also greatly appreciate my second
supervisor Docent Ilkka Ojanperä for stimulating discussions and his patience in helping me to
transform my tangled manuscripts into scientific articles. My special thanks to Pirjo Tiainen for her
skilful laboratory assistance during the experimental work. The entire staff of the Laboratory of
Forensic Toxicology deserves my warmest compliments by being most helpful and cooperative, and by
providing educated guesses for solving a few of the so-called ‘challenges’.
I also thank my good friends, who have been my cheerleaders, always encouraging me without second
thoughts (even when they should have) in whatever I have done in my life - and especially in the last
few months during those desperate moments when I was just about ready to give up on this thesis.
Finally, and most warmly, I thank my family for their never-ending belief in me.
Financial support from Consolidated Research Incorporated (Los Angeles, CA, USA) is gratefully
acknowledged.

48
REFERENCES
1. Drummer, O.H., Chromatographic screening techniques in systematic toxicological analysis, J.
Chromatogr. B 733 (1999) 27-45.
2. Polettini, A., Systematic toxicological analysis of drugs and poisons in biosamples by hyphenated
chromatographic and spectroscopic techniques, J. Chromatogr. B 733 (1999) 47-63.
3. deZeeuw, R.A., Franke, J.P., “General unknown” analysis, in Handbook of Analytical
Separations, ed. Smith, R.M., Elsevier, Amsterdam 2000, 567-599.
4. Cosbey, S.H., Craig, I., Gill, R., Novel solid-phase extraction strategy for the isolation of basic
drugs from whole blood. Preliminary study using commercially available extraction cartridges, J.
Chromatogr. B: Biomedical Applications 669 (1995) 229-235.
5. Yawney, J., Treacy, S., Hindmarsh, K.W., Burczynski, F.J., A general screening method for
acidic, neutral, and basic drugs in whole blood using the Oasis MCX column, J. Anal. Toxicol. 26
(2002) 325-332.
6. Chen, X.-H., Franke, J.P., Wijspeek, J., deZeeuw, R.A., Isolation of acidic, neutral and basic
drugs from whole blood using a single mixed mode solid-phase extraction column, J. Anal.
Toxicol. 16 (1992) 351-355.
7. Chen, X.H., Franke, J.P., Ensing, K., Wijsbeek, J., deZeeuw, R.A., Pitfals and solutions in the
development of a fully automated solid-phase extraction method for drug screening purposes in
plasma and whole blood, J. Anal. Toxicol. 17 (1993) 471-476.
8. Chen, X.H., Franke, J.P., Ensing, K., deZeeuw, R.A., Study of lot-to-lot reproducibilities of Bond
Elute Certify and Clean Screen DAU mixed-mode solid-phase extraction columns in the
extraction of drugs from whole blood, J. Chromatogr. B: Biomedical Applications 617 (1993)
147-51.
9. Cox, R.A., Crifasi, J.A., Dickey, R.E., Ketzler, S.C., Pshak, G.L., A single-step extraction for
screening whole blood for basic drugs by capillary GC/NPD, J. Anal. Toxicol. 13 (1989) 224-228.

49
10. Hoja, H., Marquet, P., Verneuil, B., Lotfi, H., Pénicaut, B., Lachâtre, G., Applications of liquid
chromatography–mass spectrometry in analytical toxicology: A review, J. Anal. Toxicol. 21
(1997) 116–124.
11. Maurer, H.H., Liquid chromatography–mass spectrometry in forensic and clinical toxicology, J.
Chromatogr. B 713 (1998) 3-25.
12. Marquet, P., Lachâtre, G., Liquid chromatography–mass spectrometry: potential in forensic and
clinical toxicology, J. Chromatogr. B 733 (1999) 93-118.
13. Bogusz, M.J., Hyphenated liquid chromatographic techniques in forensic toxicology, J.
Chromatogr. B 733 (1999) 65-91.
14. Van Bocxlaer, J.F., Clauwaert, K.M., Lambert, W.E., Deforce, D.L., Van den Eeckhout, E.G., De
Leenheer, A.P., Liquid chromatography–mass spectrometry in forensic toxicology, Mass
Spectrometry Reviews 19 (2000) 165-214.
15. Marquet, P., Is LC–MS suitable for a comprehensive screening of drugs and poisons in clinical
toxicology, Therapeutic Drug Monitoring, 24 (2002) 125-133.
16. Marquet, P., Progress of liquid chromatography–mass spectrometry in clinical and forensic
toxicology, Therapeutic Drug Monitoring, 24 (2002) 255-276.
17. Zeleny, J., Instability of electrified liquid surfaces, Phys. Rev. 10 (1917) 1-6.
18. Dole, M., Mack, L.L., Hines, R.L., Mobley, R.C., Ferguson, L.D., Alice, M.B., Molecular beams
of macroions, J. Chem. Phys. 49 (1968) 2240-2249.
19. Tal’Rose, V.L., Grishen, V.D., Skurat, V.E., Tantsyrev, G.D., Recent developments in mass
spectroscopy, Ed. Ogata, K., Hayakawa T., University Park Press, Baltimore 1970.
20. Horning, E.C., Horning, M.G., Carroll, D.I., Dzidic, I., Stillwell, R.N., New pictogram detection
system based on a mass spectrometer with an external ionization source at atmospheric pressure,
Anal. Chem. 45 (1973) 936-943.

50
21. Arpino, P.J., Baldwin, M.A., McLafferty, F.W., Liquid chromatography–mass spectrometry. II.
Continuous monitoring, Biomed. Mass Spectrom 1 (1974) 80-82.
22. Arpino, P.J., Dawkins, B.G., McLafferty, F.W., A liquid chromatography/mass spectrometry
system providing continuous monitoring with nanogram sensitivity, J. Chromatogr. Sci 12 (1974)
574-578.
23. Iribarne, I.V., Thomson, B.A., On the evaporation of small ions from charged droplets, J. Chem.
Phys. 64 (1976) 2287-2294.
24. Yamashita, M., Fenn, J.B., Electrospray ion source. Another variation on the free-jet theme, Phys.
Chem. 88 (1984) 4451-4459.
25. Robb, D.B., Covey, T.R., Bruins, A.P., Atmospheric pressure photoionization: an ionization
method for liquid chromatography–mass spectrometry, Anal. Chem. 72 (2000) 3653-3659.
26. Bruins, A.P., Covey T.R., Henion, J.D., Ion spray interface for combined liquid
chromatography/atmospheric pressure ionization mass spectrometry, Anal. Chem. 58 (1987) 2647-
2646.
27. Schmelzeisen-Redeker, G., Bütfering, L., Röllgen, F.W., Desolvation of ions and molecules in
thermospray mass spectrometry, Int. J. Mass Spectrom. Ion Processes 90 (1989) 139-150.
28. Hopfgartner, G., Bean, K., Henion, J., Henry, R., Ion spray mass spectrometric detection for liquid
chromatography: a concentration- or a mass-flow-sensitive device?, J. Chromatogr. 647 (1993)
51-61.
29. Weinmann, W., Wiedemann, A., Eppinger, B., Renz, M., Svoboda, M., Screening for drugs in
serum by electrospray ionization/collision-induced dissociation and library searching, J. Am. Soc.
Mass Spectrom. 10 (1999) 1028-1037.
30. Marquet, P., Venisse, N., Lacassie, N., Lachâtre, G., In-source CID mass spectral libraries for the
“general unknown” screening of drugs and toxicants, Analusis 28 (2000) 925-937.

51
31. Schreiber, A., Efer, J., Engewald, W., Application of spectral libraries for high-performance liquid
chromatography–atmospheric pressure ionisation mass spectrometry to the analysis of pesticide
and explosive residues in environmental samples, J. Chromatogr. A 869 (2000) 411-475.
32. Bogusz, M.J., Maier, R-D., Krüger, K.D., Webb, K.S., Romeril, J., Miller, M.L., Poor
reproducibility of in-source collisional atmospheric pressure ionization mass spectra of
toxicologically relevant drugs, J. Chromatogr. A 844 (1999) 409-418.
33. Lips, A.G.A.M., Lameier, W., Fokkens, R.H., Nibbering, N.M.M., Methodology for the
development of a drug library based upon collision-induced fragmentation for the identification of
toxicologically relevant drugs in plasma samples, J. Chromatogr. B 759 (2001) 191-207.
34. Hough, J.M., Haney, C.A., Voyksner, R.D., Bereman, R.D., Evaluation of electrospray transport
CID for the generation of searchable libraries, Anal. Chem. 72 (2000) 2265-2270.
35. Weinmann, W., Stoertzel, M., Vogt, S., Wendt, J., Tune compounds for electrospray ionisation/in-
source collision-induced dissociation with mass spectral library searching, J. Chromatogr. A 926
(2001) 199-209.
36. Weinmann, W., Stoertzel, M., Vogt, S., Svoboda, M., Schreiber, A., Tuning compounds for
electrospray ionization/in-source collision-induced dissociation and mass spectral library
searching, J. Mass Spectrom. 36 (2001) 1013-1023.
37. Bristow, A.W.T., Nichols, W.F., Webb, K.S., Conway, B., Evaluation of protocols for
reproducible electrospray in-source collisionally induced dissociation on various liquid
chromatography/mass spectrometry instruments and the development of spectral libraries, Rapid
Commun. Mass Spectrom. 16 (2002) 2374-2386.
38. Dawson, P.H., Sun, W-F., A Round Robin on the reproducibility of standard operation conditions
for the acquisition of library MS/MS spectra using triple quadrupoles, Int. J. Mass Spectrom. Ion
Processes 55 (1983/1984) 155-170.

52
39. Martinez, R.I., Standard reference spectra for tandem mass spectrometry quality assurance,
performance evaluation and proficiency testing: tandem mass spectrometers which use RF-only
multipole collision cells, Rapid Commun. Mass Spectrom. 5 (1991) 245-248.
40. Weinmann, W., Gergov, M., Goerner, M., MS/MS libraries with triple quadrupole-tandem mass
spectrometers for drug identification and drug screening, Analusis 28 (2000) 934-941.
41. Kienhuis, P.G.M., Geerdink, R.B., Liquid chromatography–tandem mass spectrometric analysis of
surface and waste water with atmospheric pressure chemical ionization. II. Applications. Trends
Anal. Chem. 19 (2000) 460-474.
42. Kienhuis, P.G.M., Geerdink, R.B., A mass spectral library based on chemical ionization and
collision-induced dissociation, J. Chromatogr. A 974 (2002) 161-168.
43. Josephs, J.L., Characterization of over-the-counter cough/cold medications by liquid
chromatography/electrospray mass spectrometry, Rapid Commun. Mass Spectrom. 9 (1995) 1270-
1274.
44. Marquet, P., Dupyi J.L., Lachâtre, G., Shushan, B., Duchoslav, E., Monasterios, C., Ilisieu, P.,
Anacleto, J., Development of a “General Unknown” screening procedure using liquid
chromatography–electrospray-mass spectrometry (LC–EC-MS), in: Proc. 46th ASMS Conference
on Mass Spectrometry and Allied Topics 1998, Orlando, FL, 1998.
45. Slobodnik, J., Hogenboom, A.C., Vreuls, J.J., Rontree, J.A., van Baar, B.L.M., Niessen, W.M.A.,
Brinkman, U.A.Th., Trace-level determination of pesticide residues using on-line solid-phase
extraction-column liquid chromatography with atmospheric pressure ionization mass
spectrometric and tandem mass spectrometric detection, J. Chromatogr. A 741(1996) 59-74.
46. Sander, P., Substance identification of ion trap MS/MS spectra in a MS/MS library, in: Proc. 47th
ASMS Conference on Mass Spectrometry and Allied Topics 1999, Dallas, TX, 2000.
47. Fitzgerald, R.L., Rivera, J.D., Herold, D.A., Broad spectrum drug identification directly from
urine, using liquid chromatography–tandem mass spectrometry, Clinical Chemistry 45 (1999)
1224-1234.

53
48. Sanders, M., Josephs, J., Schwartz, J., Tymiak, A., DiDonato, G., Rapid identification of natural
products using a modified ion trap mass spectrometer and MS/MS spectral library searching, in:
Proc. 47th ASMS Conference on Mass Spectrometry and Allied Topics 1999, Dallas, TX, 2000.
49. Baumann, C., Cintore, M.A., Eichler, M., Lifante, E., Cooke, M., Przyborowska, A., Halket, J.M.,
A library of atmospheric pressure ionization daughter ion mass spectra based on wideband
excitation in an ion trap mass spectrometer, Rapid Commun. Mass Spectrom. 14 (2000) 349-356.
50. Schreiber A., Gergov, M., Weinmann, W., Transfer of existing forensic LC/MS and LC/MS/MS
mass spectral libraries to linear ion trap instrumentation, in: Poster 52th ASMS Conference on
Mass Spectrometry and Allied Topics 2004, Nashville, TN, 2004.
51. Saint-Marcoux, F., Lachâtre, G., Marquet, P., Evaluation of an improved general unknown
screening procedure using liquid chromatography–electrospray-mass spectrometry by comparison
with gas chromatography and high-performance liquid chromatography-diode array detection, J.
Am. Soc. Mass Spectrom. 14 (2003) 14-22.
52. Rittner, M., Pragst, F., Bork, W.-R., Neumann, J., Screening method for seventy psychoactive
drugs or drug metabolites in serum based on high-performance liquid chromatography–
electrospray ionization mass spectrometry, J. Anal. Toxicol. 25 (2001) 115-124.
53. Venisse, N., Marquet, P., Duchoslav, E., Dupuy, J.L., Lachâtre, G., A general unknown screening
procedure for drugs and toxic compounds in serum using liquid chromatography–electrospray-
single quadrupole mass spectrometry, J. Anal. Toxicol. 27 (2003) 7-14.
54. Fillion, J., Hindle, R., Lacroix, M., Selwyn, J., Multiresidue determination of pesticides in fruit
and vegetables by gas chromatography–mass selective detection and liquid chromatography with
fluorescence detection, J. AOAC Int.78 (1995) 1252-1266.
55. Heinig, K., Henion J., Fast liquid chromatographic–mass spectrometric determination of
pharmaceutical compounds, J. Chromatogr. B 732 (1999) 445-458.

54
56. Tong, X., Ita, I.E., Wang, J., Pivnichny, J.V., Characterization of a technique for rapid
pharmacokinetic studies on multiple co-eluting compounds by LC/MS/MS, J. Pharm. Biomed.
Anal. 20 (1999) 773–784.
57. Thieme, D., Grosse, J., Lang, R., Mueller, R.K., Wahl, A., Screening, confirmation and
quantitation of diuretics in urine for doping control analyses by high-performance liquid
chromatography–atmospheric pressure ionization tandem mass spectrometry, J. Chromatogr. B
757 (2001) 49–57.
58. Thieme, D., Sachs, H., Improved screening capabilities in forensic toxicology by application of
liquid chromatography–tandem mass spectrometry, Anal. Chim. Acta 492 (2003) 171-186.
59. Josefsson, M., Kronstrand, R., Andersson, J., Romas, M., Evaluation of electrospray ionization
liquid chromatography–tandem mass spectrometry for rational determination of a number of
neuroleptics and their metabolites in human body fluids and tissues, J. Chromatogr. B 789 (2003)
151-167.
60. Jemal, M., Ouyang, Z., Zhao, W., Zhu, M., Wu, W.W., A strategy for metabolite identification
using triple-quadrupole mass spectrometry with enhanced resolution and accurate mass capability,
Rapid Commun. Mass Spectrom. 17 (2003) 2732–2740.
61. Zhang, N., Fountain, S.T., Bi, H., Rossi, D.T., Quantification and rapid metabolite identification
in drug discovery using API time-of-flight LC/MS, Anal. Chem. 72 (2000) 800-806.
62. Zhang, H., Henion, J., Yang, Y., Spooner, N., Application of atmospheric pressure ionization
time-of-flight mass spectrometry coupled with liquid chromatography for the characterization of
in vitro drug metabolites, Anal. Chem. 72 (2000) 3347-3348.
63. Zhang, H., Heinig, K., Henion, J., Atmospheric pressure ionization time-of-flight mass
spectrometry coupled with fast liquid chromatography for quantitation and accurate mass
measurement of five pharmaceutical drugs in human plasma, J. Mass Spectrom. 35 (2000) 473-
431.

55
64. Hopfgartner, G., Chernushevich, I.V., Covey, T., Plomley, B., Bonner, R., Exact mass
measurement of product ions for the structural elucidation of drug metabolites with a tandem
quadrupole orthogonal-acceleration time-of-flight mass spectrometer, J. Am. Soc. Mass Spectrom.
10 (1999) 1305-1314.
65. Decaestecker, T.N., Clauwaert, K.M., Van Bocxlaer, J.F., Lambert, W.E., Van den Eeckhout,
E.G., Van Peteghem C.H., De Leenheer, A.P., Evaluation of automated single mass spectrometry
to tandem mass spectrometry function switching for comprehensive drug profiling analysis using
a quadrupole time-of-flight mass spectrometer, Rapid Commun. Mass Spectrom. 14 (2000) 1787-
1792.
66. Bobeldijk, I., Vissers, J.P.C., Kearney, G., Major, H., van Leerdam, J.A., Screening and
identification of unknown contaminants in water with liquid chromatography and quadrupole-
orthogonal acceleration-time-of-flight tandem mass spectrometry, J. Chromatogr. A 929 (2001)
63-74.
67. King, R., Bonfiglio, R., Fernandez-Mezler, C., Miller-Stein, C., Olah, T., Mechanistic
investigation of ionization suppression in electrospray ionization, J. Am. Soc. Spectrom. 11 (2000)
947-950.
68. Marquet, P., Saint-Marcoux, F., Camble, T.N., Leblanc J.C.Y., Comparison of preliminary
procedure for the general unknown screening of drugs and toxic compounds using quadrupole-
linear ion-trap mass spectrometer with liquid chromatography–mass spectrometry reference
technique, J. Chromatogr. B 789 (2003) 9-18.
69. Müller, C., Schäfer, P., Störtzel, M., Vogt, S., Weinmann, W., Ion suppression effects in liquid
chromatography–electrospray ionization transport-region collision induced dissociation mass
spectrometry with different extraction methods for systematic toxicological analysis with mass
spectral libraries, J. Chromatogr. B 733 (2002) 47-52.
70. Clarke's Isolation and Identification of Drugs, 2.p., Ed. Moffat, A.C., The Pharmaceutical Press,
London 1986.

56
71. Osselton, M.D., Toxicological tables: a compendium of pharmacological, therapeutic and
toxicological data on 136 drugs and chemicals on humans, Bull. Int. Assoc. Forens. Toxicol. 17
(1983) 16-33.
72. Stead, A.H., Moffat, A.C., A collection of therapeutic, toxic and fatal blood drug concentrations in
man, Human Toxicol. 3 (1983) 437-464.
73. Pandurangi, A.K., Narasimhachari, N., Blackard, W.G., Landa, B.S., Relation of serum molindone
levels to serum prolactin levels and antipsychotic response, J. Clin. Psych. 50 (1989) 379-381.
74. Jack, D.B., Handbook of Clinical Pharmacokinetic Data. Macmillan, Hants 1992.
75. Klamerus, K.J., Maloney, K., Rudolph, R.L., Sisenwine, S.F., Jusko, W.J., Chiang, S.T.,
Introduction of a composite parameter to the pharmacokinetics of venlafaxine and its active O-
desmethyl metabolite, J. Clin. Pharmacol. 32 (1992) 716-724.
76. Meyer, F.P., Indicative therapeutic and toxic drug concentrations in plasma: a tabulation, Int. J.
Clin. Pharm. Ther. 32 (1994) 71-81.
77. Uges, D.R.A., Therapeutic and toxic drug concentrations, Bull. Int. Assoc. Forens. Toxicol. 26
(1996) (1 supplement) 1-34.
78. Schulz, M., Schmoldt, A., Therapeutic and toxic blood concentrations of more than 500 drugs,
Pharmazie 52 (1997) 895-911.
79. Winek, C.L., Wahba, W.W., Winek Jr., C.L., Winek-Balzer, T., Drug and chemical blood-level
data 2001, Forensic Sci. Int. 122 (2001) 107-123.
80. Maurer, H.H., Schmitt, C.J., Weber, A.A., Kraemer, T., Validated electrospray liquid
chromatographic–mass spectrometric assay for the determination of the mushroom toxins alpha-
and beta-amanitin in urine after immunoaffinity extraction. J. Chromatogr. B 748 (2000) 125-
135.

57
81. Matuszewski, B.K., Constanzer, M.L., Chavez-Eng, C.M., Matrix effects in quantitative
LC/MS/MS analyses of biological fluids: A method for determination of finasteride in human
plasma at picogram per milliliter concentrations, Anal. Chem. 70 (1998) 882-889.
82. Rivier, L., Criteria for the identification of compounds by liquid chromatography–mass
spectrometry and liquid chromatography–multiple mass spectrometry in forensic toxicology and
doping analysis, Anal. Chim. Acta 492 (2003) 69-82.
83. Pelander, A., Ojanperä, I., Laks, S., Rasanen, I., Vuori, E., Toxicological screening with formula-
based metabolite identification by liquid chromatography/time-of-flight mass spectrometry, Anal.
Chem. 75 (2003) 5710-5718.