library statistical spotlight - europa
TRANSCRIPT
Further information on page 5
Library statistical spotlightLibrary of the European Parliament 20/02/2013
Author: Giulio Sabbati Contact: [email protected] 130445REV1 Page 1 of 6
EU-ASEAN trade relations0
1
2
3
4
5
6
0 20000 40000 60000 80000 100000 120000
Laos
Brunei
Cambodia
Myanmar
Philippines
Vietnam
Malaysia
Indonesia
Thailand
Singapore
NAFTA
EU27
China
Import of ASEAN countries to China, EU27 and NAFTA (in Billion Euro)
33 13 9 14 6 3
31 11 10 14 4 5
27 22 19 18 18 4 4
0 20000 40000 60000 80000 100000 120000
Cambodia
Brunei
Laos
Myanmar
Philippines
Vietnam
Indonesia
Thailand
Malaysia
Singapore
NAFTA
EU27
China
Export of ASEAN countries to China, EU27 and NAFTA (in Billion Euro)
31 22 19 16 8 4
28 17 17 15 12 4
19 15 18 13 13 6
Rest of the worldNAFTAEuropean UnionChina, P.R.: Mainland
Import of nine selected countries in percenatage of total export
€ 835 billion
13.7%
9.4%
8.8%
Rest of the world
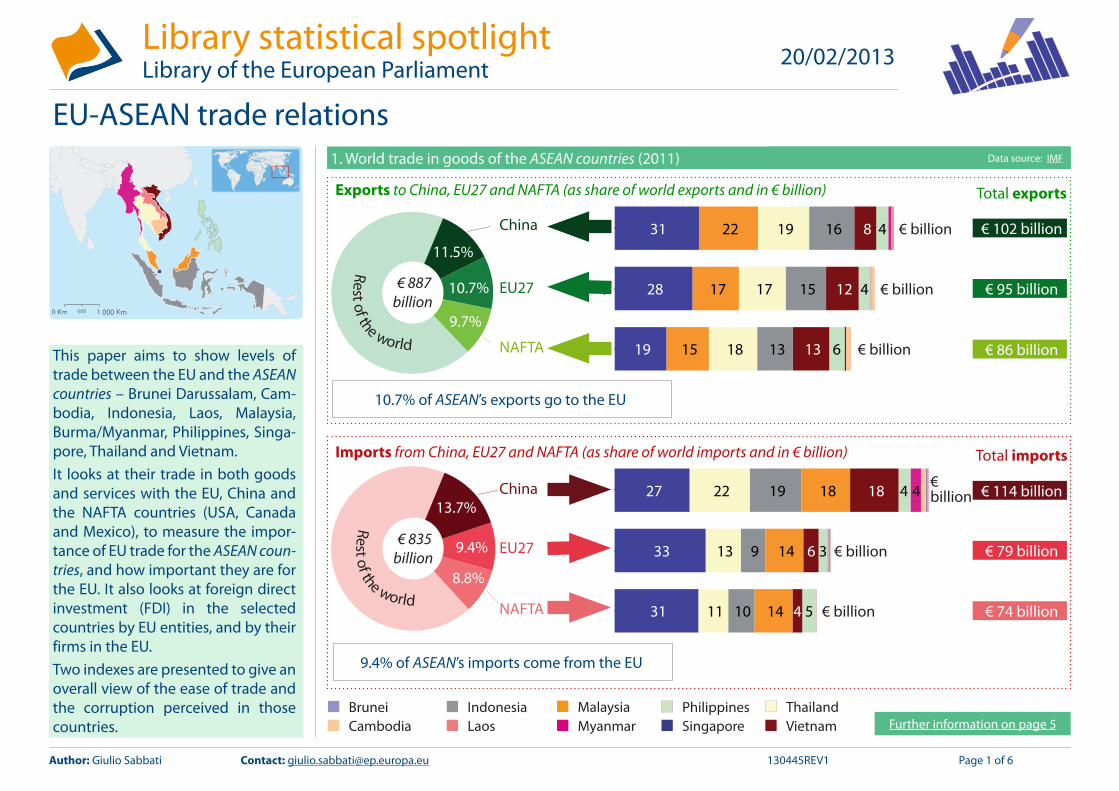
1. World trade in goods of the ASEAN countries (2011)
China
EU27
NAFTA
Imports from China, EU27 and NAFTA (as share of world imports and in € billion)
Exports to China, EU27 and NAFTA (as share of world exports and in € billion)
€ 102 billion
€ 95 billion
€ 86 billion
€ 114 billion
€ 79 billion
€ 74 billion
China
EU27
NAFTA
10.7% of ASEAN’s exports go to the EU
9.4% of ASEAN’s imports come from the EU
Total exports
Total imports
€ billion
€ billion
€ billion
€ billion
€billion
Data source: IMF
Rest of the worldNAFTAEuropean UnionChina, P.R.: Mainland
Export of Asean countries in percentage of total export
€ 887 billion
11.5%
10.7%
9.7%
Rest of the world
CambodiaBrunei Thailand
VietnamLaosPhilippines
Myanmar SingaporeMalaysiaIndonesia
€ billion
This paper aims to show levels of trade between the EU and the ASEAN countries – Brunei Darussalam, Cam-bodia, Indonesia, Laos, Malaysia, Burma/Myanmar, Philippines, Singa-pore, Thailand and Vietnam.It looks at their trade in both goods and services with the EU, China and the NAFTA countries (USA, Canada and Mexico), to measure the impor-tance of EU trade for the ASEAN coun-tries, and how important they are for the EU. It also looks at foreign direct investment (FDI) in the selected countries by EU entities, and by their firms in the EU. Two indexes are presented to give an overall view of the ease of trade and the corruption perceived in those countries.
0 Km 1 000 Km5000 Km 1 000 Km500
Further information on page 5
Library statistical spotlight EU-ASEAN trade relations
Author: Giulio Sabbati Contact: [email protected] 130445REV1 Page 2 of 6
0
1
2
3
4
5
6
EU27EU27
Data source: DG MOVE
EU27 exports to the ASEAN countries
€ 69 billionRepresenting 4.4% of total EU exports
EU27 imports from the ASEAN countries
€ 96 billionRepresenting 5.5% of total EU imports
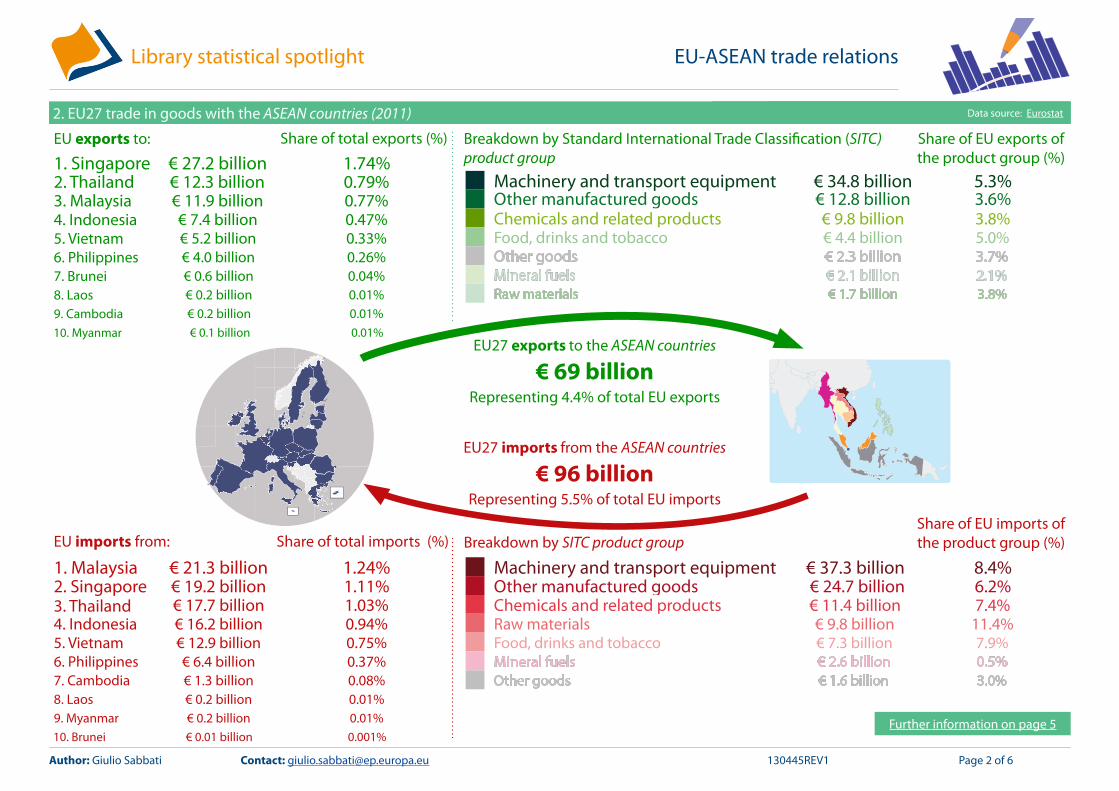
2. EU27 trade in goods with the ASEAN countries (2011) Data source: Eurostat
Other manufactured goodsChemicals and related productsFood, drinks and tobacco
Machinery and transport equipment
Raw materials
Other goodsMineral fuels
€ 12.8 billion€ 9.8 billion€ 4.4 billion
€ 34.8 billion
€ 1.7 billion
€ 2.3 billion€ 2.1 billion
3.6%3.8%5.0%
3.8%
3.7%2.1%
5.3%
EU exports to: Breakdown by Standard International Trade Classification (SITC)product group
EU imports from:
Share of total exports (%)
Share of total imports (%)
Share of EU exports of the product group (%)
2. Thailand3. Malaysia4. Indonesia5. Vietnam6. Philippines7. Brunei8. Laos9. Cambodia
1. Singapore
10. Myanmar0.01%
0.79%0.77%0.47%0.33%0.26%0.04%0.01%
1.74%
0.01%€ 0.2 billion
€ 12.3 billion€ 11.9 billion€ 7.4 billion€ 5.2 billion€ 4.0 billion€ 0.6 billion€ 0.2 billion
€ 27.2 billion
€ 0.1 billion
2. Singapore1. Malaysia
3. Thailand4. Indonesia5. Vietnam6. Philippines7. Cambodia8. Laos9. Myanmar10. Brunei
1.11%1.24%
1.03%0.94%0.75%0.37%0.08%0.01%0.01%0.001%
€ 19.2 billion€ 21.3 billion
€ 17.7 billion€ 16.2 billion€ 12.9 billion€ 6.4 billion€ 1.3 billion
€ 0.2 billion€ 0.2 billion
€ 0.01 billion
Other manufactured goodsChemicals and related productsRaw materialsFood, drinks and tobaccoMineral fuelsOther goods
Machinery and transport equipment6.2%7.4%
11.4%7.9%0.5%3.0%
8.4% € 24.7 billion€ 11.4 billion€ 9.8 billion€ 7.3 billion€ 2.6 billion€ 1.6 billion
€ 37.3 billionBreakdown by SITC product group
Share of EU imports of the product group (%)
Further information on page 5
Library statistical spotlight EU-ASEAN trade relations
Author: Giulio Sabbati Contact: [email protected] 130445REV1 Page 3 of 6
0
1
2
3
4
5
6
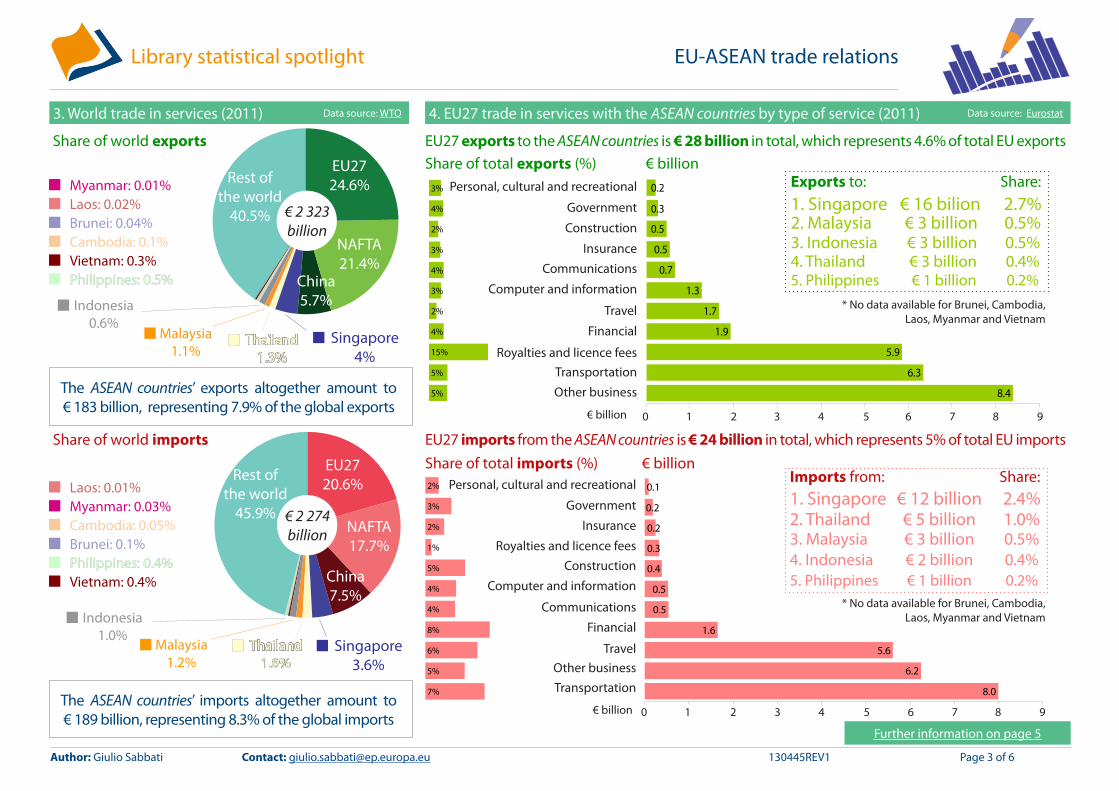
4. EU27 trade in services with the ASEAN countries by type of service (2011) Data source: Eurostat
EU27 imports from the ASEAN countries is € 24 billion in total, which represents 5% of total EU imports
EU27 exports to the ASEAN countries is € 28 billion in total, which represents 4.6% of total EU exports
Share of total imports (%)
Share of total exports (%) € billion
€ billion
€ billionImport of services, 2011 , in billion €
7%
5%
6%
8%
4%
4%
5%
1%
2%
3%
2%
0% 1% 2% 3% 4% 5% 6% 7% 8%
T r anspor tat i on
Other busi ness ser vi ces
T r avel
Fi nanci al ser vi ces
Communi cat i ons
ser vi ces
Computer and
i nf or mat i on ser vi ces
Const r uct i on ser vi ces
Royal t i es and l i cense
f ees
Insur ance ser vi ces
Gover nment ser vi ces,
n. i .e.
Per sonal , cul tur al and
r ecr eat i onal ser vi ces
€ billion
import of services, 2011 , in billion €
8.0
6.2
5.6
1.6
0.5
0.5
0.4
0.3
0.2
0.2
0.1
0 1 2 3 4 5 6 7 8 9
Transportation
Other business services
Travel
Financial services
Communications services
Computer and information services
Construction services
Royalties and license fees
Insurance services
Government services, n.i.e.
Personal, cultural and recreational services
Government
TransportationOther business
Royalties and licence fees
Travel
Financial
Computer and information
Insurance
Construction
Communications
Personal, cultural and recreational
0 1 2 3 4 5 6 7 8 9
1. Singapore
5. Philippines
2.4%
0.2%
Imports from: Share:€ 12 billion
2. Thailand 1.0%€ 5 billion
4. Indonesia 0.4%€ 2 billion€ 1 billion
3. Malaysia 0.5%€ 3 billion
0 1 2 3 4 5 6 7 8 9
Export of services, 2011 , in billion €
5%
5%
15%
4%
2%
3%
4%
3%
2%
4%
3%
0.0% 2.0% 4.0% 6.0% 8.0% 10.0% 12.0% 14.0% 16.0%
Other busi ness
ser vi ces
T r anspor tat i on
Royal t i es and l i cense
f ees
Fi nanci al ser vi ces
T r avel
Computer and
i nf or mat i on ser vi ces
Communi cat i ons
ser vi ces
Insur ance ser vi ces
Const r uct i on ser vi ces
Gover nment ser vi ces,
n. i .e.
Per sonal , cul tur al and
r ecr eat i onal ser vi ces
Government
Transportation
Other business
Royalties and licence fees
Travel
Financial
Computer and information
Insurance
Construction
Communications
Personal, cultural and recreational
import of services, 2011 , in billion €
8.4
6.3
5.9
1.9
1.7
1.3
0.7
0.5
0.5
0.2
0.3
0 1 2 3 4 5 6 7 8 9
Other business services
Transportation
Royalties and license fees
Financial services
Travel
Computer and information services
Communications services
Insurance services
Construction services
Government services, n.i.e.
Personal, cultural and recreational services
2. Malaysia3. Indonesia4. Thailand5. Philippines
1. Singapore€ 3 billion€ 3 billion€ 3 billion€ 1 billion
€ 16 bilion0.5%0.5%0.4%0.2%
2.7%Exports to: Share:
* No data available for Brunei, Cambodia, Laos, Myanmar and Vietnam
* No data available for Brunei, Cambodia, Laos, Myanmar and Vietnam
3. World trade in services (2011) Data source: WTO
Share of world exports
Share of world imports
The ASEAN countries’ exports altogether amount to € 183 billion, representing 7.9% of the global exports
The ASEAN countries’ imports altogether amount to € 189 billion, representing 8.3% of the global imports
Malaysia1.1%
Indonesia0.6%
Thailand1.3%
Singapore4%
Other countries
Other asean countries
Viet Nam
Philippines
Indonesia
Malaysia
Thailand
Singapore
China
NAFTA
EU27
€ 2 323billion
EU2724.6%Rest of
the world40.5%
NAFTA21.4%
China5.7%
Singapore3.6%
Thailand1.6%
Malaysia1.2%
Indonesia1.0%
Vietnam: 0.3%Philippines: 0.5%
Cambodia: 0.1%Brunei: 0.04%Laos: 0.02%Myanmar: 0.01%
Other countries
Other asean countries
Philippines
Viet Nam
Indonesia
Malaysia
Thailand
Singapore
China
NAFTA
EU27
€ 2 274billion
EU2720.6%
NAFTA17.7%
China7.5%
Rest ofthe world
45.9%
Vietnam: 0.4%Philippines: 0.4%Brunei: 0.1%Cambodia: 0.05%Myanmar: 0.03%Laos: 0.01%
Further information on page 6
Library statistical spotlight EU-ASEAN trade relations
Author: Giulio Sabbati Contact: [email protected] 130445REV1 Page 4 of 6
0
1
2
3
4
5
6
Rank(out of
176 countries)
China
USA
7. Corruption perception index (2012)Data source: Transparency International
Very clean
Highly corrupt
Cambodia
Vietnam
Indonesia
Philippines
Thailand
Malaysia
Brunei
Singapore5
46
54
88
105
118
123
157
Laos
Myanmar
160
172
19
80
Easiest
Most difficult
Country
6. “Trading across borders” index (2012)Data source: The World Bank
Rank(out of
185 countries)
Country
Whe
re is
trad
ing
acro
ss b
orde
rs e
asy?
Malaysia
Thailand
Indonesia
Brunei
Philippines
Vietnam
Cambodia
Singapore
Laos
1
11
20
37
40
53
74
118
160
USA22
China68
* No data available for Myanmar
8142427123
2.5%
0.5% 0.5%0.3%
0.2%
0
20
40
60
80
100
120
140
Singapore Indonesia Malaysia Thailand Philippines
0.0%
0.5%
1.0%
1.5%
2.0%
2.5%
3.0%
3.5%
467
1.8%
0.1% 0.03% 0.01%0
20
40
60
80
100
120
140
Singapore Malaysia Philippines Thailand
0.0%
0.5%
1.0%
1.5%
2.0%
2.5%
3.0%
3.5%
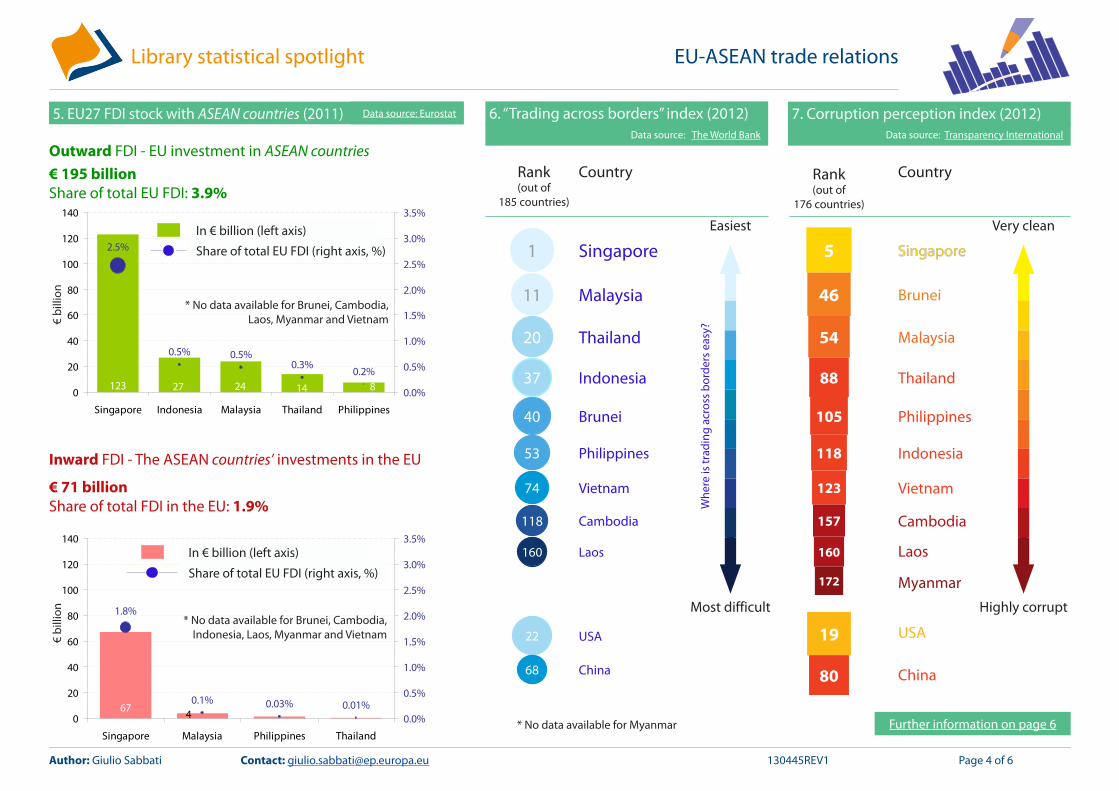
5. EU27 FDI stock with ASEAN countries (2011) Data source: Eurostat
Outward FDI - EU investment in ASEAN countries
Inward FDI - The ASEAN countries’ investments in the EU
€ 195 billionShare of total EU FDI: 3.9%
€ 71 billionShare of total FDI in the EU: 1.9%
€ bi
llion
€ bi
llion
In € billion (left axis)
Share of total EU FDI (right axis, %)
In € billion (left axis)
Share of total EU FDI (right axis, %)
* No data available for Brunei, Cambodia, Laos, Myanmar and Vietnam
* No data available for Brunei, Cambodia, Indonesia, Laos, Myanmar and Vietnam
Library statistical spotlight EU-ASEAN trade relations
Author: Giulio Sabbati Contact: [email protected] 130445REV1 Page 5 of 6
0
1
2
3
4
5
6
Further information
The graphic represents the exports/imports of EU27 countries to/from each of the ASEAN countries, with a breakdown by SITC (Standard Interna-tional Trade Classification) product group.
SITC 0, 1: food, drink and tobacco SITC 6, 8: other manufactured goodsSITC 2, 4: raw materials SITC 7: machinery and transport
equipmentSITC 3: mineral fuelsSITC 5: chemical and related products SITC 9: other goods
The green part represents exports and the red imports. For both sections the units used are billion euros, shares of the total of the ASEAN country, and shares of the ASEAN countries in the total trade of the specific SITC product. The share has been calculated based on extra-EU trade, i.e. excluding trade between Member States.
The graphics show the trade in goods of the ASEAN countries with the world, and in particular with China, EU27 and the NAFTA countries (USA, Canada and Mexico). The green section above refers to exports and the red part, below, to imports. Data are presented in euros after conversion from dollars using the annual average conversion rate from Eurostat.The pie chart shows the share that China, EU and NAFTA countries repre-sent for the ASEAN countries in terms of exports/imports of goods. For ex-ample, the ASEAN countries export merchandise to the world worth €887 billion. The part that goes to the EU represents 10.7% of their total exports, with a value of €95 billion.The bar chart represents the total value of exports/imports from/to the ASEAN countries to/from China, EU and NAFTA in billion euros, with a breakdown for each of the ASEAN countries. For instance, the value of ex-ports from Singapore to the EU27 was €28 billion, while Singapore’s im-ports from the EU amounted to €33 billion.
2. EU27 trade in goods with the ASEAN countries (2011)
1. World trade in goods of the ASEAN countries (2011)
The two pie charts represent in percentage the role that the ASEAN coun-tries, the EU, NAFTA countries and China play in global trade of services. The upper one refers to exports, and the lower one to imports. In other words, of worldwide export of services (€2 323 billion in total), 24.6% is performed by the EU27, while the ASEAN countries together represent 7.9%. Regarding imports, the global value is €2 274 billion and the ASEAN countries’ cumulative share is 8.3% of the total. The share has been calcu-lated taking account only of extra-EU trade.
4. EU27 trade in services with the ASEAN countries (2011)
The graphics represent EU exports (in green) and imports (in red) of serv-ices to/from the ASEAN countries by type of service. The first bar chart (on the left) shows the percentage of total EU exports/imports represented by each type of service exported/imported to/from the ASEAN countries. The second bar chart shows in billion euros the services exported/imported to/from the ASEAN countries. The box gives the overall value of EU exports/imports to/from each of the ASEAN countries in billion euros and as a share of the EU’s exports/imports of services.In practice, the EU exports “Transportation services” worth about €6.3 bil-
3. World trade in services (2011)
As an example, total EU exports to the ASEAN countries amounted to €69 billion. €27.2 billion of merchandise has been exported to Singapore, with this amount representing 1.74% of total EU exports. In terms of product group, the EU exported €34.8 billion of “machinery and transport equip-ment” to the ASEAN countries, which represents 5.3% of all EU exports of this product category to the world. The sum of the SITC product categories are less than the total due to con-fidentiality reason.NB Variations between figure 1 and 2 are due to the data coming from dif-ferent sources and currency conversion.
Library statistical spotlight EU-ASEAN trade relations
Author: Giulio Sabbati Contact: [email protected] Page 6 of 6
Extraction date: data have been extracted in January 2013. This document provides a general statistical overview: Members requiring more detailed statistical information or a more in-depth analysis are welcome to contact the Library.Disclaimer and Copyright: This document is a summary of published information and does not necessarily represent the views of the author or the European Parliament. The document is exclusively addressed to the Members and staff of the European Parliament for their parliamentary work. Links to information sources within this document may be inaccessible from locations outside the European Parliament network. Copyright © European Parliament, 2013. All rights reserved. http://www.library.ep.ec; http://libraryeuroparl.wordpress.com
0
1
2
3
4
5
6
The corruption perception index (CPI) is prepared by Transparency Inter-national (TI) a global network organisation; it includes relevant players from government, civil society, business and the media, and aims to pro-mote transparency, for instance in elections and public administration.The CPI index measures perceived levels of public-sector corruption in 176 countries around the world. It is an aggregate indicator using data from a number of different sources provided by different institutions. All sources measure the overall extent of corruption (frequency and/or size of bribes) in the public and political sectors. Countries are ranked based on the index that ranges between 0 (highly corrupt) and 100 (very clean). The infographic presents the ranking of the ASEAN countries ordered from the most clean to the highly corrupt.For comparison reason the top three countries in the EU27 are Denmark, Finland (ranked first equal) and Sweden (rank 4). The worst three are Italy, Bulgaria and Greece (72nd, 75th and 94th rank respectively).
7. Corruption perception index (2012)
6. “Trading across borders” index (2012)
The “Trading across borders” index is created and published by the World Bank. The index is part of the Doing Business Project and refers to the year 2012. It ranks the countries of the world based on the ease of exporting and importing merchandise. The index measures the time and costs as-sociated with importing and exporting a standardised cargo of goods, as well as the number of documents necessary to complete the transaction.
The two bar charts represent the stock of foreign direct investment (FDI) of the EU with the ASEAN countries. FDI stocks (or positions) denote the value of investment at the end of the year. Outward FDI (or FDI abroad) are investments by EU resident entities in affiliated enterprises abroad. Inward FDI (or FDI in the reporting economy) are investments by foreigners in en-terprises resident in the reporting economy.Both graphs show FDI in billion euros (on the left-hand axis) and as a share of the EU total (on the right-hand axis).As an example, the EU had invested €123 billion in Singapore at end 2011, and this represents 2.5% of all EU investment abroad. Data for Brunei, Cambodia, Laos, Myanmar and Vietnam are not available for FDI in either direction while data for Indonesia are not available for inward FDI.
5. EU27 FDI stock with ASEAN countries (2011)
lion to the ASEAN countries; this represents 5% of all EU exports of “Trans-portation services”. At country level, the EU exports €16 billion of services to Singapore, and this represents 2.7% of total EU exports of services.The share has been calculated based on extra-EU trade, i.e. excluding trade between Member States.
The infographic presents the ranking of the index from the easiest to the most difficult. In more detail, in Singapore, first in the overall ranking, for a standardised 20-foot container weighing 10 tonnes and valued at US$20 000, a local business can expect to wait five days and spend US$456 to export it. In Laos, the lowest-ranked of the ASEAN countries, it needs 26 days and US$2 140 to export it. No data are available for Myanmar.For comparison, the top three EU Member States are Denmark - rank number 4 -, Finland - number 6 - and Estonia - number 7. The worst three are Hungary, Bulgaria and Slovak Republic - 73rd, 93rd and 98th positions respectively -.