lies, damn lies, and big data
TRANSCRIPT

Lies, Damn Lies, and Big Data
Applications, Limitations, Misconceptions
Brian BissettSenior MemberInstitute of Electrical and Electronics Engineers (IEEE)
04/15/20231

04/15/20232
Overview
What is Big Data
Common Attributes of Big Data
Challenges of Working with Big Data
Validity Space
Outliers
Variance
Correlation and Causality
Summary
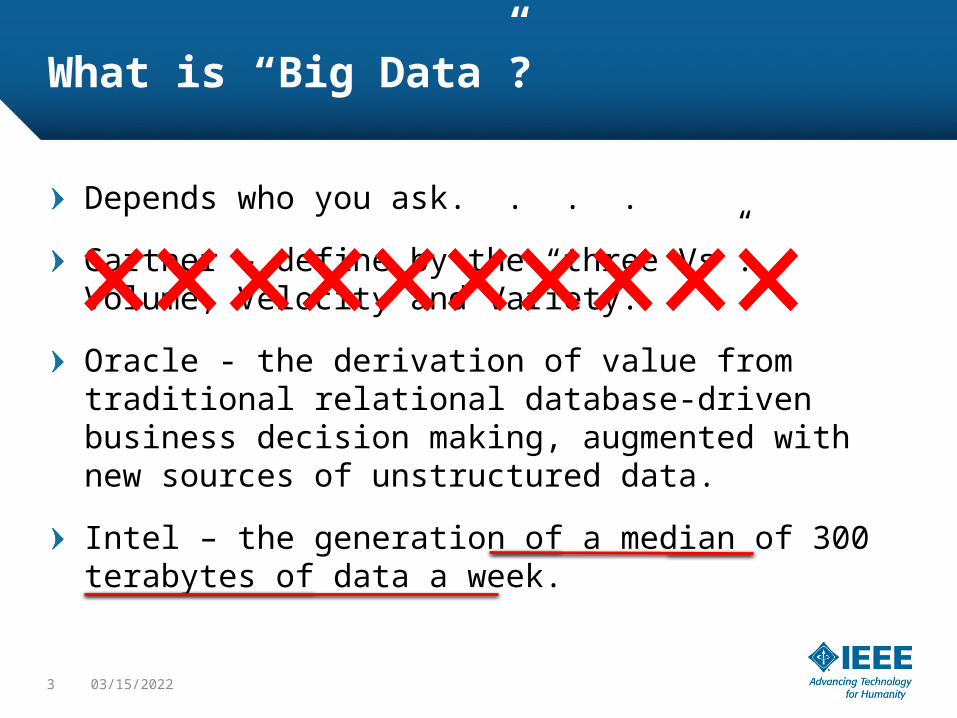
What is “Big Data”?
Depends who you ask. . . .
Gartner – define by the “three Vs”: Volume, Velocity and Variety.
Oracle - the derivation of value from traditional relational database-driven business decision making, augmented with new sources of unstructured data.
Intel – the generation of a median of 300 terabytes of data a week.
3 04/15/2023

What is “Big Data”?
Microsoft - the process of applying serious computing power—the latest in machine learning and artificial intelligence—to seriously massive and often highly complex sets of information.
The Method for an Integrated Knowledge Environment (MIKE) project argues that big data is not a function of the size but of complexity. (A high degree of permutations and interactions within a data set defines big data.)
National Institute of Standards and Technology (NIST) - big data “exceed(s) the capacity or capability of current methods and systems.”
4 04/15/2023

The Current 8 V’s of Big Data
Volume
Velocity
Variety
Value – is this worth something to someone?
Validity – is this correct?
Viability – can this stand independently?
Variability – is the same result reported consistently?
Verifiability – do we know where this came from?
5 04/15/2023
The Original Three V’sDefine “Big” Data
Not Actionable

The 5 P’s for Biomedical Big Data
Evidence Based, Outcome Driven, and Affordable Health Care will Require the Five P’s:
Predictive
Precise
Preventive
Personalized
Patient-Centric
The Cancer Genome Atlas (TCGA)
6 04/15/2023

Challenges of Dealing with Big Data
Management – In 10 Years at Zettabyte Levels!
Infrastructure
Performance Analytics – TBD.
Unstructured – Lacks any Meaningful Standards.
Data Visualization – Humans see in 3D Only.
Navigation – Siloed Data is Difficult to Access.
Missing Data – Average of 30% from HIT Data.
Incorrect Data – Average of 25% - 30%.7 04/15/2023

The Three C’s (Challenges)
Collection– is it worth saving?– Value = Actionable
Consolidation – Clean it up! "Not Collected Here"
Consumption – Easy to Add Processors– Difficult to move Data.
8 04/15/2023

Transactions: Real Time & Queued
Real Time – must be done ASAP– Retail: Credit Card Transactions
– Security: Is Passenger on the “no fly list”
– NICS Checks for Firearms Purchases
– Stock Purchases
Queued – Everything else that can wait– Traffic Data, process images from Traffic Cameras to
determine speed and volume.
– Daily Customer Counts
– Daily or Monthly Volume for Stock Transactions
9 04/15/2023
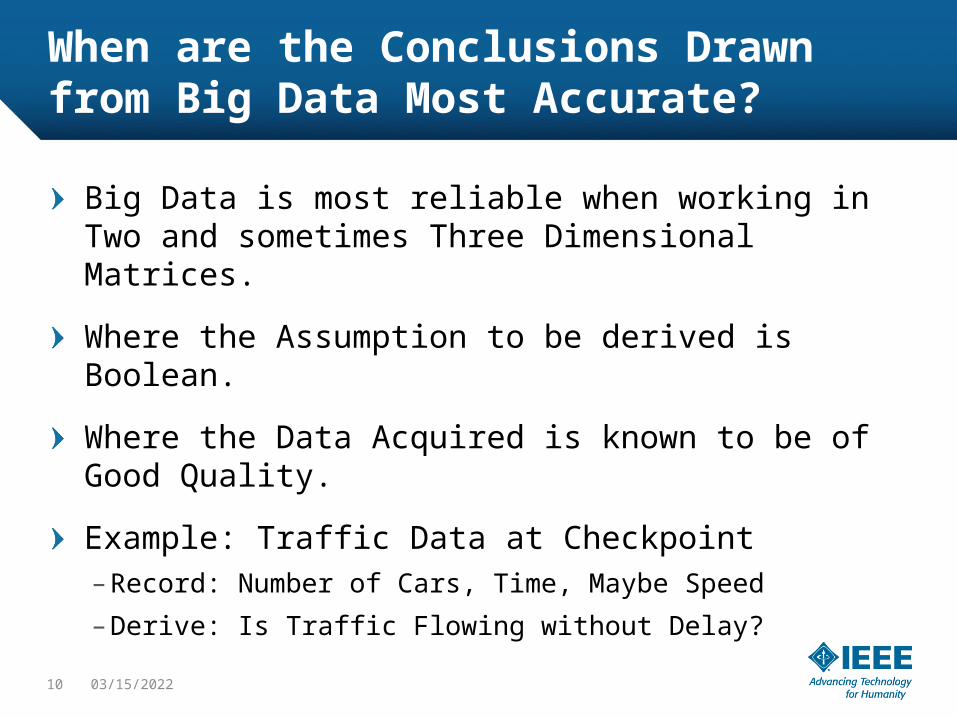
When are the Conclusions Drawn from Big Data Most Accurate?
Big Data is most reliable when working in Two and sometimes Three Dimensional Matrices.
Where the Assumption to be derived is Boolean.
Where the Data Acquired is known to be of Good Quality.
Example: Traffic Data at Checkpoint– Record: Number of Cars, Time, Maybe Speed
– Derive: Is Traffic Flowing without Delay?
10 04/15/2023

Big Data = Big Problems
More Excess Data as Compared to Real Signals = More Spurious Relationships.
11 04/15/2023
Source: N.N. Taleb

Outliers: Goldmine or Nuisance
An Outlier can either be a Goldmine (the needle in the haystack sought) or a Nuisance (an artifact to be ignored)
Example: Lipinski’s Rule of 5 (Ro5)
16% of oral drugs violate at least one of the criteria, and 6% fail two or more.
Billion Dollar Drugs that have failed the Ro5 criteria:
Lipitor, Singulair
12 04/15/2023

Outliers: Goldmine or Nuisance
Example: Nuisance Outlier
The speed of the Motorcycle in no way reflects the true speed of the Traffic.
13 04/15/2023
No rigid mathematical definition exists of what constitutes an outlier, or when an Outlier may be omitted from an analysis.
Mahalanobis Distance - distance between data point and a multivariate space's centroid (overall mean). (Commonly used in Linear Regression)

Outliers – Bonedigger and Milo
Bonedigger the lion and Milo the sausage dog are inseparable. The friendship between an 11-pound wiener dog and a 500-pound lion is the only one ever seen in the world.
14 04/15/2023

Melanoma ExampleDealing with Variance
Impossible to Positively Discern without Biopsy15 04/15/2023
MELANOMA
BENIGN
RE
AL WORLD
TEST CASE
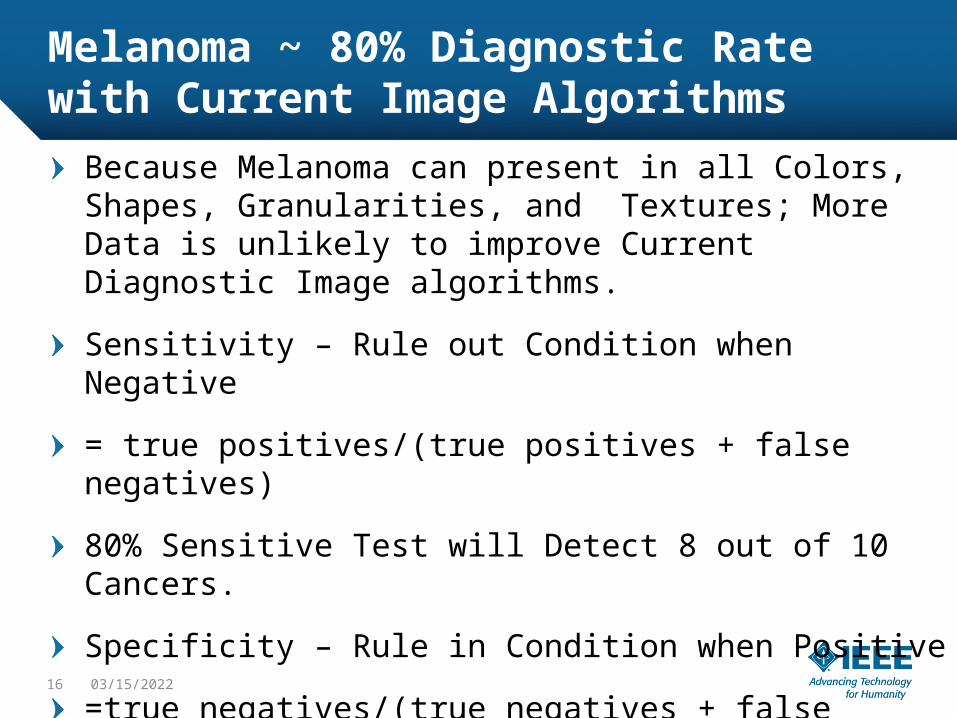
Melanoma ~ 80% Diagnostic Rate with Current Image Algorithms
Because Melanoma can present in all Colors, Shapes, Granularities, and Textures; More Data is unlikely to improve Current Diagnostic Image algorithms.
Sensitivity – Rule out Condition when Negative
= true positives/(true positives + false negatives)
80% Sensitive Test will Detect 8 out of 10 Cancers.
Specificity – Rule in Condition when Positive
=true negatives/(true negatives + false positives)
95% Specific Test -> False Positive rate of 5%
Sensitivity and specificity are inversely proportional16 04/15/2023

Variance – The Batch Effect
High-throughput technologies.
Batch Effects when measurements are affected by laboratory conditions, reagent lots, and personnel differences.
Pharmaceutical Mergers - Particularly troubling when merging data sets from different labs.
Normalization for Batch Effects is extremely difficult.
“What level is your pain on a scale from 1 to 10?”
17 04/15/2023

Qualitative Variance
Massachusetts General Hospital Harvard Medical School investigated discrepancy rates for the interpretation of Radiology Films.
60 examinations - 30 previously interpreted by themselves and 30 interpreted by their peers.
Interobserver Disagreement Rate = 26%.
Intraobserver Disagreement Rate = 32%.
Radiologists agreed with other Radiologists more than themselves.
18 04/15/2023

Correlation vs. Causation
Correlation is easy to prove.
How much of a Correlation is Easy to Prove.
R2 = 1.0 – Perfect Correlation.
R2 = 0.0 – No Correlation.
Causation is nearly Impossible to Prove.
US Spending on Science, Space, and Technology correlates Nearly Perfectly (R2 = 0.99208) with Suicides by Hanging, Strangulation and Suffocation.
19 04/15/2023

Bradford Hill Causality Proof
Strong – Five or Ten Fold Increase
Consistent – Populations or Time does not Effect
Specific – A Link (a location, mechanism, etc.)
Temporal - Association Increases with Duration
Gradient - Association Increases with Exposure
Plausible – Association Easily Seen
Coherent – Experimental Evidence Supports
Similar Behavior in Analogous Situations
20 04/15/2023

Big Data Governance Does not Exist
No laws exist to address the utilization of big data.
Concerns about citizen privacy and business liability have yet to be addressed.
Critical Challenge to the Federal Government.
Federal Agencies that Utilize Big Data do so on an ad-hoc basis.
Little guidance exists on using petabyte sizes of private citizen data for predictive analytics.– Privacy Act of 1974 and HIPAA 1996.
21 04/15/2023

Hierarchy of Evidence
22 04/15/2023

Big Data = Observational Study
Data is not Collected to Examine a Specific Problem using a Protocol.
The Treatment Group and the Control Group are outside the control of the Investigator.
Groups Differing in Outcome are identified and compared on the basis of a supposed causal attribute.
Longitudinal - repeated observations of the same variables over long periods of time.
23 04/15/2023

Summary
The World is Accumulating a Lot of Data.
Nobody Agrees on What “Big” is.
On Average, 30% of the Data is Incorrect.
On Average, 30% of the Data is Missing.
Correlation is the Easy Part.
Bradford Hill gives Guidance on Proving Causation.
There is a Hierarchy of Evidence and Expert Opinion and Big Data are at the bottom of it.
24 04/15/2023
Selected Publications
Automated Data Analysis with Excel – Softcover: 442 Pages
– Chapman & Hall (June 2007)
– Second Edition Coming in 2016
– ISBN: 1-58488-885-7
Practical Pharmaceutical Laboratory Automation– Hardcover: 464 pages
– Publisher: CRC Press (May 2003)
– ISBN: 0849318149
25 04/15/2023

References
Bickerton GR, Paolini GV, Besnard J, Muresan S, Hopkins AL. Quantifying the chemical beauty of drugs. Nat Chem. 2012;4:90–98. doi: 10.1038/nchem.1243. http://www.ncbi.nlm.nih.gov/pmc/articles/PMC3524573/
The Big Data Conundrum: How to Define It? http://www.technologyreview.com/view/519851/the-big-data-conundrum-how-to-define-it/
Abujudeh, HH, Boland, GW, Kaewalai, R, et al. Abdominal and Pelvic Computed Tomography (CT) Interpretation: discrepancy rates among experienced radiologists. Eur Radiol.2010;20(8): 1952-7.
Maryam Ramezani, Alireza Karimian, and Payman Moallem. Automatic Detection of Malignant Melanoma using Macroscopic Images. J Med Signals Sens. 2014 Oct-Dec; 4(4): 281–290. PMCID: PMC4236807
26 04/15/2023