life cycle assessment of a brick bearing wall · life cycle assessment of a brick bearing wall...
TRANSCRIPT
LIFE CYCLE ASSESSMENT of a BRICK BEARING WALLUsing Longworth Hall, Cincinnati, Ohio, as a point of departure
Carl S. Sterner, LEED AP1
December 2010
1 Introduction & LCA Goals2 Material Flow Diagram3 LCA Scope
4 Phase 1: Extraction5 Phase 2: Manufacturing6 Phase 3: Construction7 Phase 4: Operation & Maintenance8 Phase 5: End of Life9 Transportation
10 Overall Metrics by Life Cycle Phase12 Comparison to EIOLCA13 Conclusions & Recommendations
14 Bibliography16 Appendix: Data & Sources
Life Cycle Assessment (LCA) is becoming an increasingly important meth-odology for assessing building materials. It is particularly useful for under-standing the production-related impacts of materials, as well as the poten-tial trade-offs between life cycle stages.
This analysis of a brick bearing wall is both quantitative (tracking a series of economic, environmental, and ethical metrics across all life cycle stages) and qualitative (describing each life cycle stage and its impacts). In order to make this LCA as specific as possible, Longworth Hall in Cincinnati, Ohio, is used as a point of departure; however, industry-wide data also has been tracked whenever possible. Although Longworth Hall was constructed in 1904, present-day data has been used—effectively calculating the impacts of building Longworth Hall today.
Because of brick’s durability, the costs and benefits of a brick wall are in-curred over a long period of time and over many life cycle stages, making it difficult to assess through traditional means. LCA is uniquely poised to clar-ify these costs and benefits. Perhaps more fundamentally, the author was
CONTENTS INTRODUCTION & LCA GOALS
curious about the sustainability of brick. Conventional wisdom holds that bearing walls are impractically expensive and have high embodied energy. But brick is also extremely durable, as well as beautiful, and its construction celebrates craftsmanship and human labor. This assessment, therefore, was in part a test of conventional wisdom.
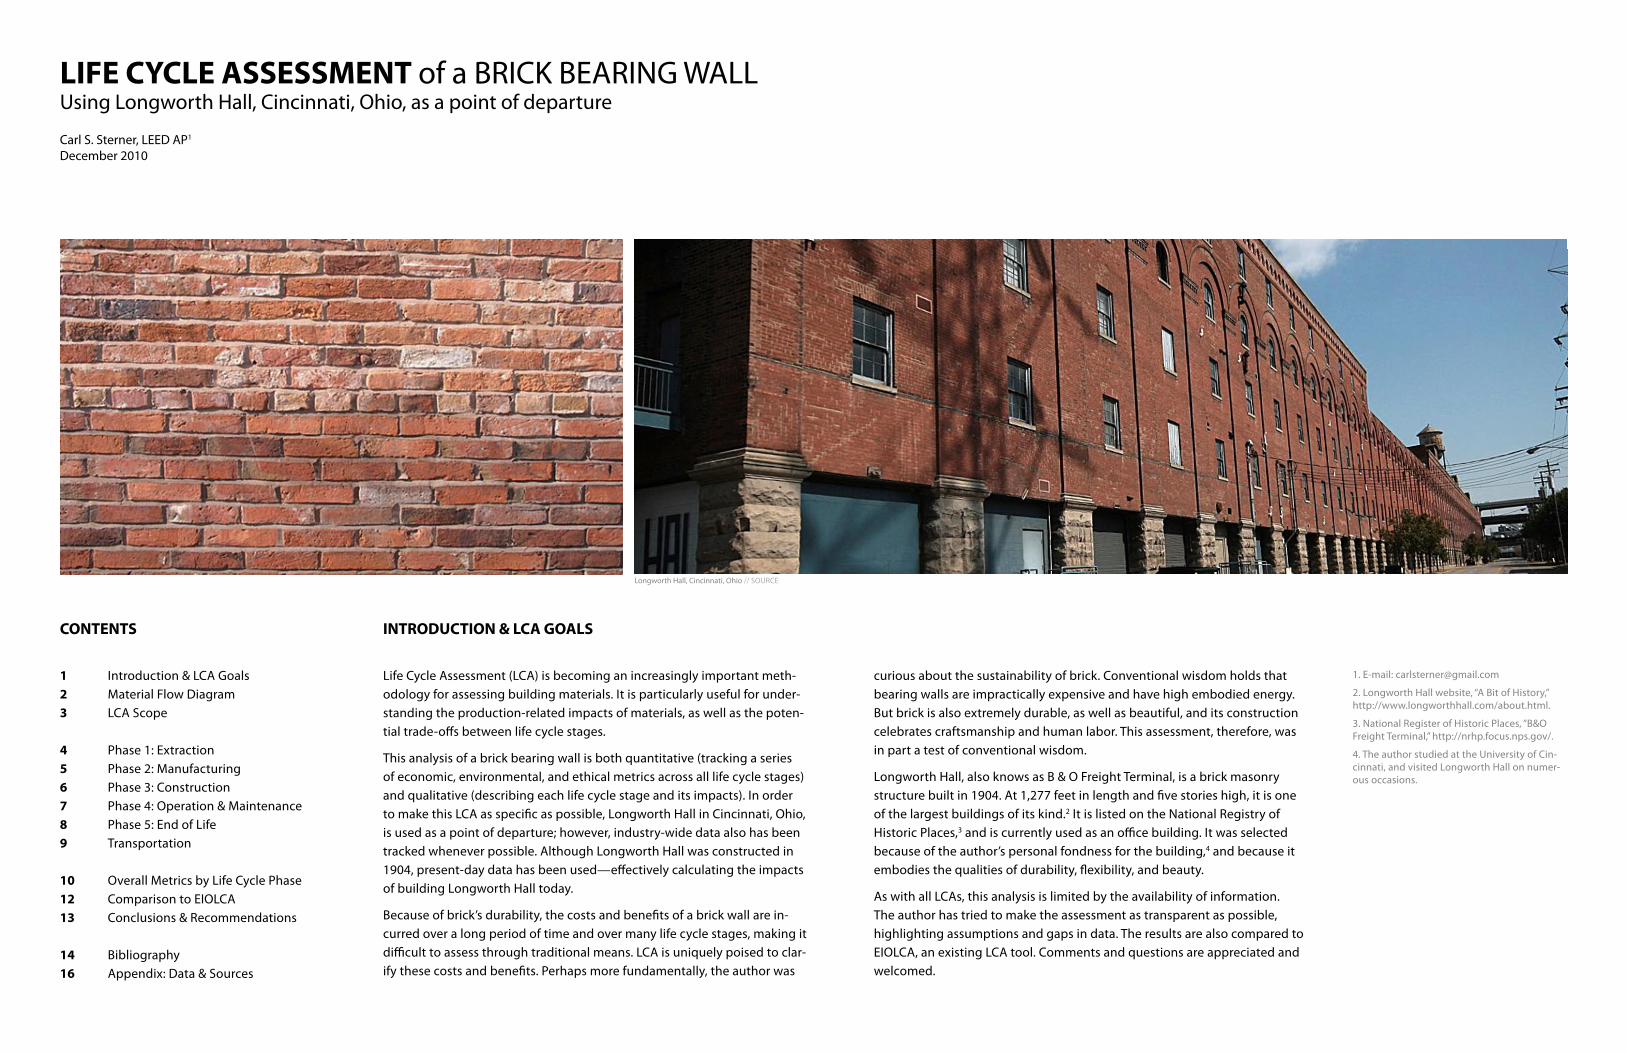
Longworth Hall, also knows as B & O Freight Terminal, is a brick masonry structure built in 1904. At 1,277 feet in length and five stories high, it is one of the largest buildings of its kind.2 It is listed on the National Registry of Historic Places,3 and is currently used as an office building. It was selected because of the author’s personal fondness for the building,4 and because it embodies the qualities of durability, flexibility, and beauty.
As with all LCAs, this analysis is limited by the availability of information. The author has tried to make the assessment as transparent as possible, highlighting assumptions and gaps in data. The results are also compared to EIOLCA, an existing LCA tool. Comments and questions are appreciated and welcomed.
1. E-mail: [email protected]
2. Longworth Hall website, “A Bit of History,” http://www.longworthhall.com/about.html.
3. National Register of Historic Places, “B&O Freight Terminal,” http://nrhp.focus.nps.gov/.
4. The author studied at the University of Cin-cinnati, and visited Longworth Hall on numer-ous occasions.
Longworth Hall, Cincinnati, Ohio // SOURCE

BRICK LCA MATERIAL FLOW DIAGRAM
packedextruded& cut
pug mill(mixing)
crushing,griding,
screening
clay(80-85%)
mining
mining
mining
mining
mining
mining
mining
water(15-20%)
limestone crusher
silicasand
clay,chalk, marl
Ironore
gypsum
metals & other
additivesBRICK MANUFACTURING BUILDING SITE
CEMENT MANUFACTURING
dried,�red,
cooled
bricks
mortarwater
sandprocess-ing
mining
Portland cement
packaged (opt)
clinker cooling & grinding
preheat& kiln
blendingsilos
decon-struction
demo-lition
crushed & ground
storage reuse as aggre-
gate
brick bearing wall DOWNCYCLING
C&D land�ll
LANDFILLING
reuse store
reuse as brick
REUSE
BRICK LCA MATERIAL FLOW DIAGRAM
E X T R A C T I O N M A N U F A C T U R I N G C O N S T R U C T I O N E N D O F L I F E
U S E / O P E R AT I O N
This analysis looks at the economic, environmental, and ethical impacts of the life cycle of a brick bearing wall -- from the extraction of raw materials through the end of its useful life. It speci�cally uses as its point of departure Longworth Hall, a brick structure constructed in 1904 in Cincinnati, Ohio. Mapped here are all of the materials and transportation that go into the production of a brick wall. Also included are three potential end of life pathways: reuse, downcycling, and land�lling.
Carl S. SternerOctober 2010
This analysis looks at the economic, environmental, and ethical impacts of a brick bearing wall throughout its entire lifecycle—from the extraction of raw materials through the end of its useful life. Mapped here are the major materials and points of transportation in-cluded in the lifecycle of a brick wall. Also included are three potential end of life pathways: reuse, downcycling, and landfilling. Not included in this diagram is the supply chain of power generation (e.g., the total supply chain for electricity used in brick manufacturing). Also absent are the “accessories” of a brick bearing wall: metal coping, flashing, etc., as well as the supply chain of the equipment and tools required for manufacturing and construction (e.g., mixers, scaffolding, trowel, etc.).
2

BRICK LCA SCOPE OF ANALYSIS
packedextruded& cut
pug mill(mixing)
crushing,griding,
screening
clay(80-85%)
mining
mining
mining
mining
mining
mining
mining
water(15-20%)
limestone crusher
silicasand
clay,chalk, marl
Ironore
gypsum
metals & other
additivesBRICK MANUFACTURING BUILDING SITE
CEMENT MANUFACTURING
dried,�red,
cooled
bricks
mortarwater
sandprocess-ing
mining
Portland cement
packaged (opt)
clinker cooling & grinding
preheat& kiln
blendingsilos
decon-struction
demo-lition
crushed & ground
storage reuse as aggre-
gate
brick bearing wall DOWNCYCLING
C&D land�ll
LANDFILLING
reuse store
reuse as brick
REUSE
BRICK LCA SCOPE OF ANALYSIS
E X T R A C T I O N M A N U F A C T U R I N G C O N S T R U C T I O N E N D O F L I F E
U S E / O P E R AT I O N
This analysis focuses primarily on clay. A brick bearing wall is composed of 71% brick by volume. Brick, in turn, is composed of 80-85% clay. Clay therefore accounts for 57-60% of a wall by volume. In addition, this analysis assumes land�lling as the end of life pathway (both because it is common practice and because data is readily available), and assumes that all transportation occurs by truck (also common practice). Finally, this analysis tracks six quantitative metrics throughout all life cycle stages (see following pages).
Carl S. SternerOctober 2010
This analysis focuses primarily on clay. A brick bearing wall is composed of 71% brick by volume. Brick, in turn, is composed of 80-85% clay. Clay therefore accounts for 57-60% of a brick bearing wall by volume. A more complete Life Cycle Assessment, however, would include all of the constituents shown on the prior page. In addition, this analysis assumes downcycling as the end of life pathway, both because it is common practice and because data is readily available. It further assumes that all transportation is by truck (also com-mon practice). Finally, this analysis tracks six quantitative metrics through all lifecycle stages: cost, greenhouse gas (GHG) emissions, water use, injury / illness rate, fatality rate, and mean annual wage.
3

BRICK LCA PHASE 1: EXTRACTION
In general, common clay consumed domestically is produced do-mestically. Imports and exports of common clay are not significant; the U.S. Geological Survey does not track common clay as its own category.1 According to Calkins (2010), clay quarries are typically “located adjacent to or within a few miles of the brick manufactur-ing facility […].”2 Research suggests that quarries are often owned and operated by the same companies that manufacture the brick.3
In 2008, the top four states producing clay for use in brick produc-tion were, in descending order, North Carolina, Georgia, Alabama, and Texas, which together accounted for 40% of production.4
In states that account for a high percentage of domestic clay pro-duction, mining often plays a significant role in the local economy. In North Carolina, for instance, brick manufacturing is the third larg-est mining industry,5 and the annual production value of common clay is $12.9 million.6
The primary environmental impacts of clay mining are: land and habitat disturbance; soil erosion; and increasing turbidity of local waterways. However, clay mines are not as deep as other types of mines; former clay mines are often reclaimed and the end of their useful lives; and clay mining produces far less waste than other types of mining.7
Mining also comes with energy and water use, and emissions to air and water. Emissions to air are primarily from the combustion of fossil fuels. Data for clay mines was unavailable. Limestone mining was used as a proxy, which produces 5.11E-05 kg emissions per kg;8 clay likely emits less given the processes involved.
Water is used both for controlling dust at mines and for processing clay prior to shipping (which can include slurrying). Dust control measures use about 1-6 gallons of water per ton. Processing varies depending upon end use, but a rough figure is ~2,000 gallons per ton of finished product.9 It is not clear whether this water is reused.
Mining is a high-risk occupation, with an average fatality rate of 12.7 per 100,000 workers per year (384.8% of the average of 3.3 across all sectors).10 This figure is likely lower for clay mining because the mines are relatively shallow and the material does not have to be blasted. The average injury / illness rate for mining is 3.4 per 100 employees—91.9% of the average of 3.78 across all sectors. Dust and particulates from clay mining can pose a risk if inhaled.11
Miners appear to be paid a fair wage. In the Cincinnati area, the average salary is $41,922—99% of the local average salary.12 (This is an industry-wide average, including all of the workers in the “Non-metallic Mineral Mining and Quarrying” sector.) However, the wages are not proportional to the risk, suggesting that the occupation is at least somewhat exploitative.
1. USGS, “Mineral Commodity Summary: Clays,” 44-45.
2. Calkins, Materials for Sustainable Sites, 181.
3. For example, brick manufacturers Pine Hall Brick Company, Hanson Brick East, and General Shale Brick together account for more than half of the clay mines in North Carolina (the largest clay-producing state). See NC Dept. of Environ-ment and Natural Resources, “Permitted Mines in North Carolina.”
4. USGS, 2008 Minerals Yearbook, 18.21.
5. NCGS, “Mineral Resources.”
6. National Mining Association, “Mining in North Carolina, 2004.”
7. Calkins, Materials for Sustainable Sites, 182.
8. NREL, U.S. Life-Cycle Inventory Database, “Limestone, at mine.”
9. Mavis, “Water Use in Industries,” 50.
10. U.S. BLS, “2009 CFOI.”
11. Calkins, Materials for Sustainable Sites, 182.
12. See Appendix A for calculations & sources.
Stancills Clay Mine, Maryland // http://catherinewhite.com/rough-ideas/pottery/2008/10/ U.S. Clay Production by State // data from U.S. Geological Survey (USGS 2010)clay mining // www.nylstene.co.za/Gallery/body_gallery.htmlPrinceton Quarry, North Carolina // Google Maps, www.google.com/maps
ECONOMIC ENVIRONMENTAL ETHICAL
4

BRICK LCA PHASE 2: MANUFACTURING
The economic and environmental portions of the manufacturing analysis utilize data from the Department of Energy’s Industrial Technologies Program (ITP), which (among other things) performs assessments of manufacturing facilities and makes suggestions for efficiency improvements. This analysis averages data from three facility assessments completed in 2010.1
Greater accuracy could be achieved by (1) including a larger num-ber of assessments, and/or (2) using a weighted average where ap-propriate. (For example, revenue per unit varied widely across the three facilities, and appeared to correlate with total output—i.e., those facilities with higher output had a far lower per unit revenue.)
Finally, it is not clear that the facilities assessed by ITP are represen-tative of brick manufacturing facilities as a whole—there may be self-selection effects or other biases. Comparisons with other data sets could help to answer this question.
Brick production is incredibly energy-intensive. Brick kilns are typically heated to 350-400 degree Fahrenheit, and are normally powered by natural gas.2 In the three facilities studied, the manu-facturing process consumed an average of 3,776 Btu per brick, of which 78% was natural gas and 22% was electricity.3 This translates to 1.67 MMBtu per ton of bricks.4
Greenhouse gas emissions averaged 786.07 lbs CO2e per ton brick, of which electricity production was responsible for 633.53 lbs and natural gas was responsible for 152.54 lbs.5 Despite only accounting for 22% of energy use, electricity production accounts for nearly 81% of emissions. This discrepancy warrants further investigation. One explanation could be that electricity generation in Ohio is primarily coal-fired, which is far dirtier than natural gas.
The three manufacturing facilities sampled took in anywhere be-tween $0.05 and $0.52 per unit brick; this wide variance warrants further investigation.6
Brick manufacturing has a high injury / illness rate, a relatively low fatality rate, and appears to pay a below-average salary. It therefore appears to be at least slightly exploitative based upon wages and risk. Given high injury and illness rates, health coverage for workers is an important factor in this equation, but has not been evaluated here.
The illness / injury rate for brick and structural clay tile manufactur-ing is 7.0 per 100 employees, which is well above the average of 3.7 across all industries.7 A specific fatality rate for brick manufactur-ing was unavailable; the fatality rate for the manufacturing sector overall is 2.2 per 100,000 employees, which is 66.7% of the average of 3.3 across all industries.8
In Cincinnati, brick manufacturing employees earn approximately 75% of the local average wage across all industries, but 96% of the local median wage across all industries.9
METHODOLOGY ENVIRONMENTAL & ECONOMIC ETHICAL
Images 1, 2, 3 and 4 from: http://catherinewhite.com/rough-ideas/pottery/2008/10. // Images 1, 2b, 5, 6, 7 and 8 from www.glengerybrick.com. // Images 2a, 3 and 4 from www.umich.edu/~bricks/brickwebsite
1. U.S. DOE, Industrial Assessment Centers Database (assessments UA0022, NC0352, and CO0578).
2. Amato, et al., “Brick Manufacturing Process.”
3. U.S. DOE, Industrial Assessment Centers Database.
4. For calculations, see Appendix A.
5. Natural gas emission data from U.S. DOE, “Fuel Emission Coefficients.” Electricity emission data from U.S. EPA, “Greenhouse Gas Emission Factors.”
6. U.S. DOE, Industrial Assessment Centers Database.
7. U.S. BLS, “Incidence Rates of Nonfatal Occu-pational Injuries and Illnesses, 2008.”
8. U.S. BLS, “2009 CFOI.”
9. Wage data from the U.S. Bureau of Labor Statistics. See Appendix A for calculations & sources.
1. Pug mill mixes raw materials 2. Extruded by an auger through a die 3. Cut by wires into bricks 4. Sanded / scraped / textured
5. Dried with excess heat from kilns6. Fired at 300-400 degrees F (typ.)7. Packaged into cubes of about 500 bricks8. Inventory
5

BRICK LCA PHASE 3: CONSTRUCTION / ASSEMBLY
Although Longworth Hall was built in 1904, the figures below reflect present-day (2010) costs—what it would cost if Longworth Hall were constructed today.
ItemCost pers.f. wall1
Cost perton brick2
Bare material cost (brick & mortar, including waste)
$2.90 $123.82
Labor cost $6.08 $259.60
Total bare cost $8.98 $383.42
Total cost (including overhead& profit)
$12.34 $526.88
While the material itself is relatively inexpensive, the labor costs make this type of construction relatively expensive, as a team of skilled brickmasons are required. However, this expense can be viewed as spending money on jobs and a long-lasting material.
ECONOMIC ENVIRONMENTAL ETHICAL
Bricks are installed by a team consisting of (3) bricklayers and (2) bricklayer helpers.4 According to the U.S. Department of Labor Statistics, Brickmasons in Cincinnati earn approximately $50,110 annually—118% of the local average of $42,340.5 The illness / injury rate is 4.6 cases per 100 employees (124.3% of the average across all industries),6 and fatality rates are 18.3 per 100,000 employees (554.5% of average).7 Fatality data is for all “construction workers;” it is assumed that this figure is representative of bricklayers.
According to Calkins (2009), health risks for bricklayers are relatively minimal: dust from cutting bricks can irritate lungs and eyes, and prolonged exposure can cause serious respiratory problems.8 These risks, however, can largely be avoided by using proper protection.
Though the compensation is good, the high injury and fatality rates make the job at least slightly exploitative. As with other life cycle stages, health benefits are an important factor that have not been explored here.
The actual construction of a brick bearing wall incurs little environ-mental impact. Waste is minimal, and little equipment is required.
The waste factor for bricks is 5% and 25% for mortar.3 Construc-tion wastes are often landfilled, although brick waste can also be recycled or reused (see “End of Life” for more).
Necessary equipment includes hand trowels, scaffolding, and pos-sibly mechanical equipment for mixing mortar. Both of the former are people-powered, will be reused when construction is over, and are not associated with any on-site emissions. The latter (equipment for mixing mortar) likely has some CO2 emissions associated with it, but data was not found at the time of this writing. (The emissions would not likely have a large impact on the overall Life Cycle As-sessment figures.)
1. RSMeans, “Reference Tables: Crews,” Crew D-8, 685.
2. Calculated. For calculations, see Appendix A.
3. RSMeans, “Reference Tables: Clay Unit Ma-sonry,” 772.
4. RSMeans, “Reference Tables: Crews,” Crew D-8, 685.
5. U.S. BLS, “Occupational Employment and Wages, May 2009.”
6. U.S. BLS, “Incidence Rates of Nonfatal Occu-pational Injuries and Illnesses, 2008.”
7. U.S. BLS, “2009 CFOI.”
8. Calkins, Materials for Sustainable Sites, 186; citing others (ATSDR 2003b, and Demkin 1998b).
Longworth Hall, Cincinnati, Ohio // Google Maps, www.google.com/maps Longworth Hall under construction // all construction photos from www.longworthhall.com/about
6

BRICK LCA OPERATION & MAINTENANCE
In general, brick bearing walls are very durable and require little maintenance. Most maintenance is preventative: checking for hairline cracks, deterioration of mortar, plant growth on the wall, or other factors that could signal problems or lead to eventual dam-age. Non-brick components (such as coping) need to be replaced at the end of their lifespan.3
Perhaps the most arduous task is repointing—the process of replac-ing mortar that has deteriorated and/or reached the end of its use-ful life. Repointing is typically required every 25 to 50 years. Mortar is removed to a uniform depth, and new mortar is applied. Like the construction of a brick wall, repointing is labor-intensive and requires stilled craftsmen. As a result, it bears similar liabilities, and has similar environmental and ethical merits, as brick construction.
Damaged bricks may occasionally need to be replaced. Like re-pointing, this requires a skilled craftsman, but requires little in the way of materials.4
MAINTENANCE BUILDING OPERATIONLIFESPAN OF BUILDING MATERIALS
While brick has a high embodied energy, it is an extremely durable material, particularly when used in a bearing wall application. Ac-cording to Joseph Lstiburek of the Building Science Corporation, brick has an expected lifespan of 100 years or more.1 Longworth Hall, built in 1904, is 106 years old at the time of this writing, and will likely be in service for at least several more decades. This gives brick an advantage when compared to other, less durable, materi-als. As Lstiburek notes, “If you double the life of a building and you use the same amount of resources to construct it, the building is twice as resource efficient. Therefore durability is a key component of sustainability.”2
However, not all of the components of a brick wall have the same lifespan. Metal coping and flashing lasts 25 to 75 years; mortar lasts 25 to 50 years; and some more modern additions to brick walls, such as sealants and brick ties, only last 5 to 20 years. In many cases, the lifespan of the assembly is limited by the lifespan of the least durable component.
Because this analysis is focused on a material, brick, rather than a building, the energy used for building operation is beyond its scope. Operating energy is, however, significant over the life of a building. In some contexts, brick may contribute to the energy performance of a building through its thermal mass effects. Brick, like concrete, stone, and other massive materials, is highly effective at storing heat energy. This “thermal lag” can mitigate diurnal tem-perature swings, and can be used to capture and store solar heat energy in winter months.5
Longworth Hall is uninsulated, and Cincinnati’s weather covers a large range between hot and cold. As a result, the contribution of brick to the performance of the building is unclear, and requires further investigation. A more robust life cycle assessment would take building operation into account in an effort to understand trade-offs between lifecycle phases.6
1. Joseph Lstiburek, “Increasing the Durability of Building Constructions.”
2. Ibid.
3. Brick Industry Association. “Maintenance of Brick Masonry.”
4. Ibid.
5. Brick Industry Association. “Passive Solar Heating with Brick Masonry.”
6. A 2009 study of historic buildings by the Ath-ena Sustainable Materials Institute found that, property renovated, historic structures could perform as well as (or even better than) new buildings. They attribute this in part to thermal mass benefits and low window-to-wall ratios. Athena Sustainable Materials Institute, “A Life Cycle Assessment Study of Embodied Effects for Existing Historic Buildings,” 21.
Longworth Hall, ca. 1904 // www.longworthhall.com Longworth Hall, Cincinnati, present day // www.longworthhall.com Longworth Hall, “Eddy’s Belgian Bistro” // photo by Eleanor Howell, http://www.flickr.com/photos/eleanorh/2748911948/
7

BRICK LCA END OF LIFE
The nearest construction and demolition waste (C&D) landfill to Longworth Hall is H. Hafner & Sons, Inc., which provides both landfilling and recycling services. This facility was used for landfill-ing and recycling data. Further research is needed to understand whether this case is representative of C&D landfills in general.
H. Hafner & Sons charges for construction waste by the container. Price depends on whether the container contains “clean fill, brush, construction / demolition debris,” or “solid / sanitary waste.” The former is substantially cheaper: $325 vs. $500, respectively, for a 20-yard container.1 Presumably this is due to the economic advantage of clean debris, which can be recycled into salable products.
“Solid waste landfills” have an injury / illness rate 148.6% above the average across all industries,2 and a fatality rate 763.6% above the average.3 However, the mean annual wages for “waste treatment and disposal” were only 88% of the average salary in Ohio.4 As a result, landfilling appears to be at least moderately exploitative.
LANDFILL RECYCLING REUSE
Brick walls can be “deconstructed” rather than “demolished.” This al-lows the material to be reused as brick, rather than downcycled.
There are several resources for building reuse in Cincinnati. Build-ing Value is a building re-use store that accepts brick for reuse. In addition, Building Value provides “on-the-job training […] to move people with workforce disadvantages into construction and retail careers.”6 Similarly, Covington Reuse Center accepts brick, and hires and trains people with “workplace disadvantages.”7 Both provide building deconstruction services, as well as storing and selling salvaged materials.
Building deconstruction is much more labor-intensive (and there-fore expensive) than demolition; however, because reuse opera-tions tend to use a non-profit model, the precise cost difference is difficult to ascertain. While no figures are available regarding illness / injury / fatality rates, the explicit social mission of many building reuse operations suggests strong ethical performance.
H. Hafner & Sons downcycles approximately 65% of its daily infeed into landscape supplies such as gravel, aggregate, and mulch. Ac-cording to Justin Cooper, operations manager, “From the landfill, we receive all of the materials that we need to support our landscape material supply business.”4 Non-treated wood is ground for mulch; cardboard is composted with yard waste; concrete and brick are crushed for recycled aggregate; and metals are sorted and sold for scrap. While recycling confers an economic advantage, its environ-mental impacts are unclear—particularly since it is being down-cycled into a lower-grade material rather than being truly recycled.
Separate ethical indicators for recycling services are not available from the Bureau of Labor Statistics. More fine-grained information is needed to determine whether recycling facilities differ markedly from other waste facilities.
C&D Landfill // http://ze-gen.com/rethink/harnessing-the-energy-of-your-home%E2%80%99s-renovation-debris H. Hafner & Sons, Inc., Cincinnati, Ohio // Google Maps, www.google.com/maps Building Value retail outlet // www.soapboxmedia.com/devnews/1117buildingvalue.aspx
1. H. Hafner & Sons, Inc., “Cincinnati Dumpster Rental.”
2. U.S. BLS, “Incidence Rates of Nonfatal Occu-pational Injuries and Illnesses, 2008.”
3. U.S. BLS, “2009 CFOI.”
4. U.S. BLS, “Occupational Employment and Wages, May 2009.”
5. Quarry News, “Cincinnati Recycler Prefers Keestrack Destroyer.”
6. Building Value, “Job Training.”
7. Covington Re-Use Center website.
8
100 mi.
200 mi.
OHIO
INDIANAILLINOIS
KENTUCKY
WESTVIRGINIA
BRICK LCA TRANSPORTATION
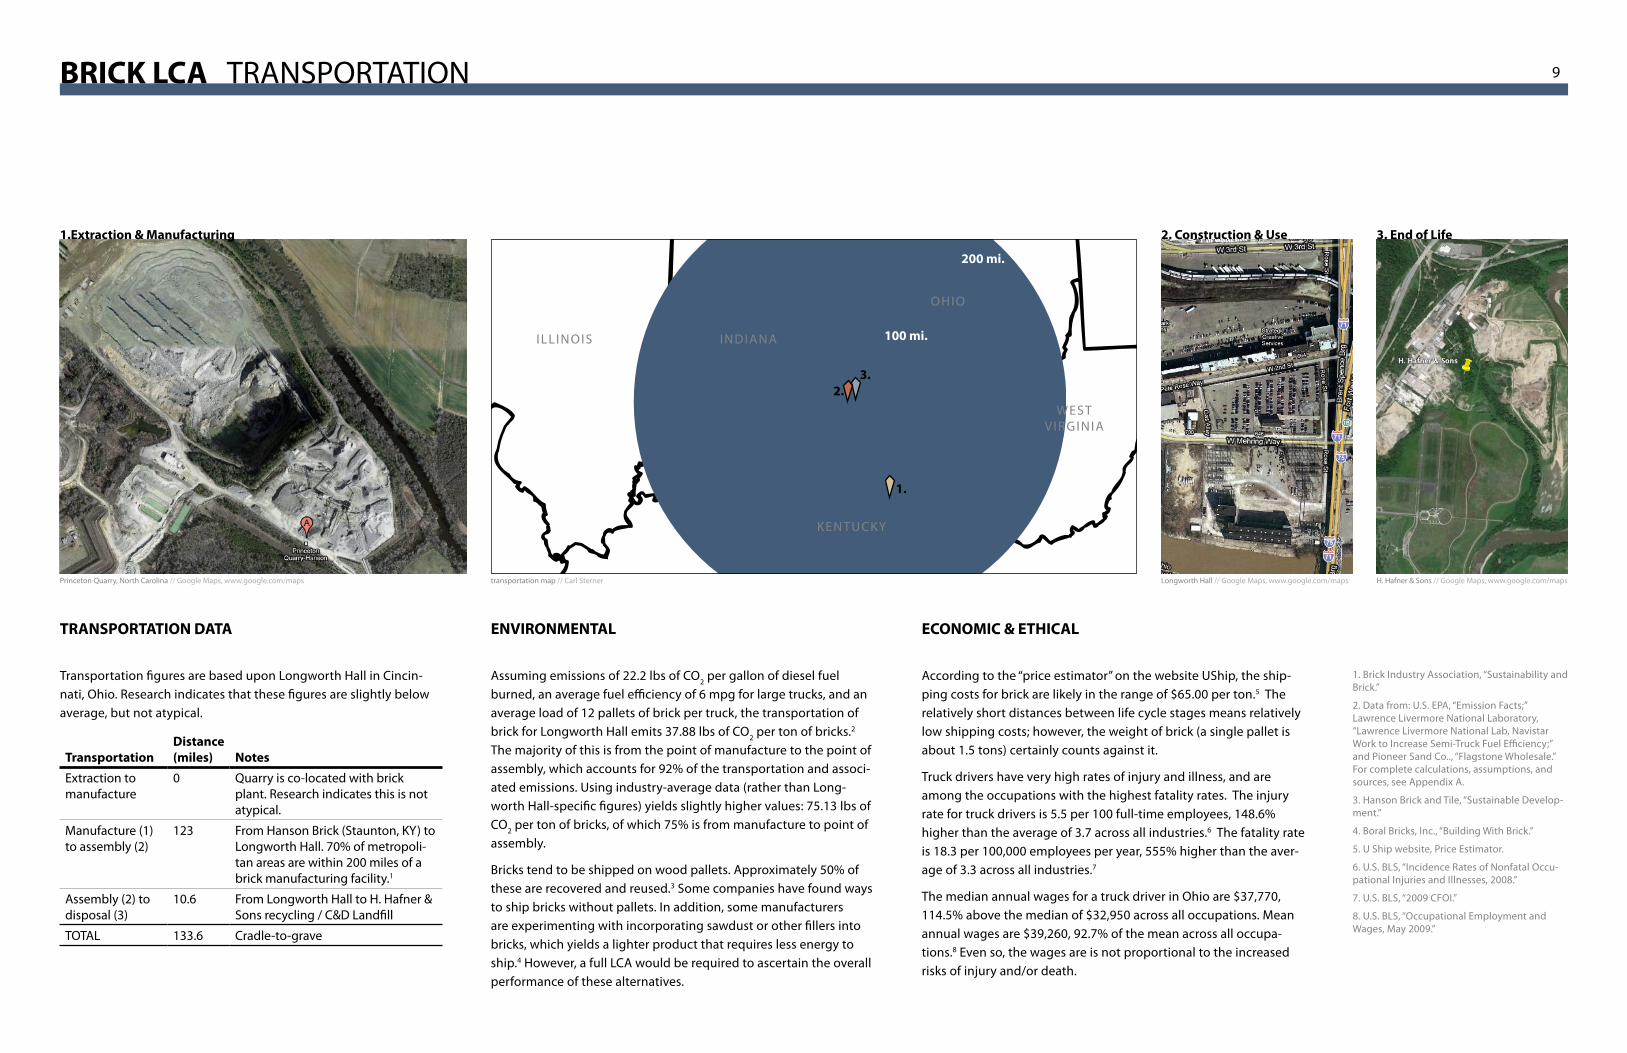
Transportation figures are based upon Longworth Hall in Cincin-nati, Ohio. Research indicates that these figures are slightly below average, but not atypical.
TransportationDistance (miles) Notes
Extraction to manufacture
0 Quarry is co-located with brick plant. Research indicates this is not atypical.
Manufacture (1) to assembly (2)
123 From Hanson Brick (Staunton, KY) to Longworth Hall. 70% of metropoli-tan areas are within 200 miles of a brick manufacturing facility.1
Assembly (2) to disposal (3)
10.6 From Longworth Hall to H. Hafner & Sons recycling / C&D Landfill
TOTAL 133.6 Cradle-to-grave
Assuming emissions of 22.2 lbs of CO2 per gallon of diesel fuel burned, an average fuel efficiency of 6 mpg for large trucks, and an average load of 12 pallets of brick per truck, the transportation of brick for Longworth Hall emits 37.88 lbs of CO2 per ton of bricks.2 The majority of this is from the point of manufacture to the point of assembly, which accounts for 92% of the transportation and associ-ated emissions. Using industry-average data (rather than Long-worth Hall-specific figures) yields slightly higher values: 75.13 lbs of CO2 per ton of bricks, of which 75% is from manufacture to point of assembly.
Bricks tend to be shipped on wood pallets. Approximately 50% of these are recovered and reused.3 Some companies have found ways to ship bricks without pallets. In addition, some manufacturers are experimenting with incorporating sawdust or other fillers into bricks, which yields a lighter product that requires less energy to ship.4 However, a full LCA would be required to ascertain the overall performance of these alternatives.
According to the “price estimator” on the website UShip, the ship-ping costs for brick are likely in the range of $65.00 per ton.5 The relatively short distances between life cycle stages means relatively low shipping costs; however, the weight of brick (a single pallet is about 1.5 tons) certainly counts against it.
Truck drivers have very high rates of injury and illness, and are among the occupations with the highest fatality rates. The injury rate for truck drivers is 5.5 per 100 full-time employees, 148.6% higher than the average of 3.7 across all industries.6 The fatality rate is 18.3 per 100,000 employees per year, 555% higher than the aver-age of 3.3 across all industries.7
The median annual wages for a truck driver in Ohio are $37,770, 114.5% above the median of $32,950 across all occupations. Mean annual wages are $39,260, 92.7% of the mean across all occupa-tions.8 Even so, the wages are is not proportional to the increased risks of injury and/or death.
TRANSPORTATION DATA ENVIRONMENTAL ECONOMIC & ETHICAL
1.Extraction & Manufacturing 2. Construction & Use 3. End of Life
1.
2.3.
1. Brick Industry Association, “Sustainability and Brick.”
2. Data from: U.S. EPA, “Emission Facts;” Lawrence Livermore National Laboratory, “Lawrence Livermore National Lab, Navistar Work to Increase Semi-Truck Fuel Efficiency;” and Pioneer Sand Co.., “Flagstone Wholesale.” For complete calculations, assumptions, and sources, see Appendix A.
3. Hanson Brick and Tile, “Sustainable Develop-ment.”
4. Boral Bricks, Inc., “Building With Brick.”
5. U Ship website, Price Estimator.
6. U.S. BLS, “Incidence Rates of Nonfatal Occu-pational Injuries and Illnesses, 2008.”
7. U.S. BLS, “2009 CFOI.”
8. U.S. BLS, “Occupational Employment and Wages, May 2009.”
H. Hafner & Sons // Google Maps, www.google.com/mapsLongworth Hall // Google Maps, www.google.com/mapsPrinceton Quarry, North Carolina // Google Maps, www.google.com/maps transportation map // Carl Sterner
9

BRICK LCA METRICS BY LIFE CYCLE STAGE
extraction
manufacturing
construction
operations
end of life
transportation
COST (U.S. dollars per ton of brick) GREENHOUSE GAS EMISSIONS(lbs CO2-e per ton of brick)
WATER USE (gallons per ton of brick)
BRICK LCA METRICS BY LIFE CYCLE STAGE
E C O N O M I C I N D I C A T O R S E N V I R O N M E N T A L I N D I C A T O R S
The construction of a brick bearing wall is by far the most expensive stage in its life cycle. Brick is labor-intensive, requiring a team of skilled brickmasons to hand-lay the structure.
From an economic perspective, brick is a costly material. But from an ethical and environmental perspective, paying for human labor (as opposed to paying for energy or material use) is perhaps the more sustainable option. Brickmasons are well-paid (see next page), and construction comes with relatively few environmental costs. Equip-ment is largely people-powered, is reused when construction is over, and is not associated with any on-site emissions (with the possible exception of equipment for mixing mortar, which have not been quanti�ed here).
Finally, clay is produced domestically, often within 200 miles of a project site. Buying local can help strengthen a local economy by increasing the multiplier e�ect -- the impact of a dollar spent.
The manufacturing of brick is an energy-intensive process typically powered by natural gas. Brick kilns heat the brick to 350-400 degrees Fahrenheit (and sometimes as high as 2000 degrees F). Transportation �gures are relatively low (824 lbs CO2-e per ton over the entire life cycle). Clay extraction is often co-located with brick manufacturing facilities, which in turn are typically within 200 miles of a project site.
Not considered here are the impacts of brick construction on the operation and maintenance of the building of which it is part. Brick can provide thermal mass in the building, which could contribute toward improved energy performance.
The lifespan of a brick wall is approximately 75-100 years (although many brick bearing wall structures clearly last longer than this). Thus the high embodied energy of brick should be weighed against its durability.
Most water is used during extraction, both for dust control at the quarry and for processing prior to manufacturing.
Additional environmental impacts not quanti�ed above include the following:
Land use impacts. Quarrying clay and construction of a building can disrupt habitat and contribute to soil erosion. However, clay mines are relatively shallow and are often reclaimed after use.
Material use / waste. Wasted material accumulates at each stage of the life cycle. However, clay mines produce less waste than other types of mining, and scrap produced during manufacturing is often collected and reincoporated into subsequent batches. During construction, a waste factor of 5% for brick and 25% for mortar is typical. Finally, while land�lling has been assumed here, many oppor-tunities exist for reuse or recycling of brick.
To see the data & sources behind these charts, see Appendix A.
Carl S. SternerOctober 2010
$527(70%)
$106(14%)
786.0(95%)
2000(95%)
100(5%)
$45(6%)
$12 (2%)
$65(9%)
37.9(5%)
0.1 (0%)
The construction of a brick bearing wall is by far the most expensive stage of its life cycle. Brick is labor-intensive, requiring a team of skilled brickmasons to assemble the structure by hand.
From an economic perspective, brick is a costly material. But from an ethical and environmental perspective, paying for human labor (as opposed to paying for energy or material use) is perhaps the more sustainable option. Brickmasons are well-paid (see next page), and construction comes with relatively few environmental costs. Equipment is largely people-powered, is reused when construction is over, and is not associated with any on-site emissions (with the possible exception of equipment for mixing mortar, which have not been quantified here).
Finally, clay is produced domestically, often within 200 miles of a project site. Buying local can help strengthen a local economy by increasing the multiplier effect—the impact of a dollar spent.
The manufacturing of brick is an energy-intensive process typi-cally powered by natural gas. Brick kilns heat the brick to 350-400 degrees Fahrenheit (and sometimes as high as 2000 degrees F). Transportation figures are relatively low (824 lbs CO2-e per ton over the entire life cycle). Clay extraction is often co-located with brick manufacturing facilities, which in turn are typically within 200 miles of a project site.
Not considered here are the impacts of brick construction on the operation and maintenance of the building of which it is part. Also not considered are the supply-chain impacts of energy production, or supply-chain impacts of equipment.
The lifespan of a brick wall is approximately 100 years (although many brick structures clearly last longer than this). Thus the high embodied energy of brick should be weighed against its durability when comparing to other materials.
Most water is used during extraction, primarily for processing prior to manufacturing. More research is needed to verify these rough figures, to establish whether any water is reused, and to understand the quality of any water released.
Additional environmental impacts not quantified in this study include the following:
Land use impacts. Quarrying clay and construction of a building can disrupt habitat and contribute to soil erosion. However, clay mines are relatively shallow and are often reclaimed after use.
Material use / waste. Wasted material accumulates at each stage of the life cycle. However, clay mines produce less waste than other types of mining, and scrap produced during manufacturing is often collected and reincorporated into subsequent batches. During construction, a waste factor of 5% for brick and 25% for mortar is typical. Finally, while landfilling has been assumed here, many op-portunities exist for reuse or recycling of brick.
COST (US dollars per ton brick) GREENHOUSE GAS EMISSIONS (lbs CO2-e per ton brick) WATER USE (gallons per ton brick)
10
Note: percentages may not sum to 100% due to independent rounding.
This data is available in table form on page 17. For complete calculations, see Appendix A.

BRICK LCA METRICS BY LIFE CYCLE STAGE
extraction
manufacturing
construction
operations
end of life
transportation
INJURY / ILLNESS RATE (cases per 100 employees) FATALITY RATE (fatalities per 100,000 employees) MEAN ANNUAL WAGE (U.S. dollars per year)
BRICK LCA METRICS BY LIFE CYCLE STAGE
E T H I C A L I N D I C A T O R S
Many of the lifecycle stages have above-average injury & illness rates, compared to the average of 3.7 across all sectors (represented by the dashed line above). The surprising exception is clay mining.
The data has been made as speci�c as possible. The following are the categories / sectors from which the data was drawn:
• Extraction: Clay and ceramic and refractory minerals mining.• Manufacturing: Brick and structural clay tile manufacturing.• Construction: Masonry contractors.• Operations: N/A• End of life: Solid waste land�ll workers.• Transportation: General freight trucking, long distance.
All of the life cycle stages have fatality rates that are substantially higher than the average of 3.3 across all sectors. Indeed, a number of the occupations appear on the U.S. Bureau of Labor Statistics’ list of “Selected Occupations with High Fatal Injury Rates, 2009.”
However, the analysis here is far less speci�c than the injury / illness analysis. The following are the (more general) categories / secors from which the data was drawn:
• Extraction: Mining.• Manufacturing: Manufacturing sector.• Construction: Construction laborers.• Operations: N/A• End of life: Refuse & recyclable material collectors.• Transportation: Driver/sales workers and truck drivers.
Extraction and construction workers are paid higher than the average annual salary of $42,340 in Ohio. Relative to the injury/illness rates, the pay appears fair (or even generous). However, compared to the fatality rates, the pay is not proportional to the increased risk. Overall, and given the uncertainty of the fatality rate data, the analysis suggests that these jobs are reasonably fair and equitable.
Transportation and waste management workers, on the other hand, earn less than the average annual salary and yet bear substantially higher rates of both injury/illness and fatality. This suggests that these jobs are exploitative.
To see the data & sources behind these charts, see Appendix A.
Carl S. SternerOctober 2010
0
1
2
3
4
5
6
7
8
0
5
10
15
20
25
30
0
10000
20000
30000
40000
50000
60000
NO
DA
TA A
VA
ILA
BLE
µ x̃ µ x̃ µ x̃ µ x̃ µ
µ
x̃
x̃
Many of the lifecycle stages have above-average injury & illness rates, compared to the average of 3.7 across all sectors (represented by the dashed line above). The surprising exception is clay mining.
The data has been made as specific as possible; however, different lifecycle stages have varying levels of specificity. The following are the categories / sectors from which the data was drawn:
• Extraction: Clay and ceramic and refractory minerals mining (NAICS 212325). • Manufacturing: Brick and structural clay tile manufacturing (NAICS 327121). • Construction: Masonry contractors (NAICS 23814). • Operations: N/A • End of life: Solid waste landfill workers (NAICS 562212). • Transportation: General freight trucking, long distance (NAICS 48412).
All but one of the life cycle stages have fatality rates that are sub-stantially higher than the average of 3.3 across all sectors. Indeed, several occupations appear on the U.S. Bureau of Labor Statistics’ list of “Selected Occupations with High Fatal Injury Rates, 2009.”
However, is data is far less specific than the injury / illness data. The following are the (more general) categories / sectors from which the data was drawn:
• Extraction: Mining. • Manufacturing: Manufacturing sector. • Construction: Construction laborers. • Operations: N/A • End of life: Refuse & recyclable material collectors. • Transportation: Driver/sales workers and truck drivers.
Ideally all three ethical indicators should use the same (and very specific) categories. Such data may be available from the U.S. Bu-reau of Labor Statistics.
Extraction and construction workers are paid close to or higher than the average annual salary of $42,340 in Ohio. Relative to the injury/illness rates, the pay appears fair (or even generous). How-ever, compared to the fatality rates, the pay is not proportional to the increased risk. Overall, and given the uncertainty of the fatality rate data, the analysis suggests that these jobs are reasonably fair and equitable.
Transportation, manufacturing, and waste management workers, on the other hand, earn less than the average annual salary and yet bear substantially higher rates of both injury/illness and fatality. This suggests that these jobs are exploitative.
Mean and median annual wages do not appear to differ markedly in the sectors for which data was available.
INJURY / ILLNESS RATE (cases per 100 employees) FATALITY RATE (cases per 100,000 employees) MEAN (µ) AND MEDIAN (x̃ ) ANNUAL WAGE ($ per year)
11
This data is available in table form on page 17. For complete calculations, see Appendix A.

BRICK LCA COMPARISON TO EIOLCA
Sector #32712A: Brick, tile, and other structural clay product manufacturingEconomic Activity: $1 Million DollarsDisplaying: Economic ActivityNumber of Sectors: Top 10
Change Inputs (Click here to view greenhouse gases, air pollutants, etc...)
Documentation:The environmental, energy, and other data used and their sources.Frequently asked questions about EIO-LCA.
This sector list was contributed by Green Design Institute.
Sector Total
Economic$mill
Total ValueAdded$mill
Employee CompVA
$mill
Net TaxVA
$mill
ProfitsVA
$mill
DirectEconomic
$mill
DirectEconomic
%
Total for all sectors 1.83 0.994 0.526 0.034 0.433 1.42 77.6
32712ABrick, tile, and other structural clay productmanufacturing
0.992 0.580 0.294 0.005 0.282 0.992 100.0
550000 Management of companies and enterprises 0.080 0.050 0.042 0.001 0.006 0.058 72.0
221200 Natural gas distribution 0.050 0.017 0.004 0.003 0.009 0.046 92.8
420000 Wholesale trade 0.047 0.033 0.018 0.008 0.007 0.028 58.6
221100 Power generation and supply 0.040 0.027 0.008 0.005 0.014 0.032 80.0
211000 Oil and gas extraction 0.037 0.019 0.002 0.003 0.013 0.000 1.35
33299C Other fabricated metal manufacturing 0.024 0.011 0.007 0.000 0.004 0.023 95.3
531000 Real estate 0.017 0.013 0.001 0.002 0.010 0.004 24.6
324110 Petroleum refineries 0.017 0.001 0.000 0.000 0.000 0.006 36.1
325190 Other basic organic chemical manufacturing 0.017 0.003 0.002 0.000 0.000 0.010 60.3
$ Millions used in : Brick, tile, and other structural clay product manufacturing
Hide Graph
If you are using this output as part of a project or paper, please cite appropriately.
Carnegie Mellon University Green Design Institute. (2010) Economic Input-Output Life Cycle Assessment (EIO-LCA) US 2002 (428) model [Internet], Available from:<http://www.eiolca.net/> [Accessed 24 Oct, 2010]
© Green Design Institute, Carnegie Mellon University, 2010.
Sector #32712A: Brick, tile, and other structural clay product manufacturingEconomic Activity: $1 Million DollarsDisplaying: EnergyNumber of Sectors: Top 10
Change Inputs (Click here to view greenhouse gases, air pollutants, etc...)
Documentation:The environmental, energy, and other data used and their sources.Frequently asked questions about EIO-LCA.
This sector list was contributed by Green Design Institute.
Sector Total Energy
TJ CoalTJ
NatGasTJ
PetrolTJ
Bio/WasteTJ
NonFossElecTJ
Total for all sectors 31.4 7.52 17.0 4.14 0.589 2.15
32712A Brick, tile, and other structural clay product manufacturing 23.3 4.07 14.6 3.02 0.114 1.50
221100 Power generation and supply 4.34 3.16 0.925 0.154 0 0.102
325190 Other basic organic chemical manufacturing 0.407 0.051 0.156 0.056 0.123 0.022
211000 Oil and gas extraction 0.347 0 0.283 0.029 0 0.034
486000 Pipeline transportation 0.296 0 0.225 0 0 0.071
324110 Petroleum refineries 0.286 0.000 0.076 0.185 0.014 0.010
322130 Paperboard Mills 0.227 0.021 0.047 0.010 0.134 0.016
331110 Iron and steel mills 0.182 0.108 0.050 0.002 0.000 0.022
484000 Truck transportation 0.140 0 0 0.138 0 0.001
482000 Rail transportation 0.112 0 0 0.110 0 0.002
Millions of kilowatt-hours (MkWh) used in : Brick, tile, and other structural clay product manufacturing
Hide Graph
If you are using this output as part of a project or paper, please cite appropriately.
Carnegie Mellon University Green Design Institute. (2010) Economic Input-Output Life Cycle Assessment (EIO-LCA) US 2002 (428) model [Internet], Available from:<http://www.eiolca.net/> [Accessed 24 Oct, 2010]
© Green Design Institute, Carnegie Mellon University, 2010.
Sector #32712A: Brick, tile, and other structural clay product manufacturingEconomic Activity: $1 Million DollarsDisplaying: Greenhouse GasesNumber of Sectors: Top 10
Change Inputs (Click here to view greenhouse gases, air pollutants, etc...)
Documentation:The environmental, energy, and other data used and their sources.Frequently asked questions about EIO-LCA.
This sector list was contributed by Green Design Institute.
Sector Total
t CO2e CO2 Fossil
t CO2e CO2 Process
t CO2e CH4
t CO2e N2O
t CO2e HFC/PFCst CO2e
Total for all sectors 2010 1860 30.2 108. 9.89 8.74
32712A Brick, tile, and other structural clay product manufacturing 1350 1350 0 0 0 0
221100 Power generation and supply 356.0 351.0 0 0.965 2.18 2.26
211000 Oil and gas extraction 57.9 16.3 10.6 31.0 0 0
212100 Coal mining 43.8 4.94 0 38.9 0 0
486000 Pipeline transportation 24.7 11.3 0.031 13.4 0 0
221200 Natural gas distribution 18.4 1.66 0 16.7 0 0
325190 Other basic organic chemical manufacturing 17.8 15.9 0 0 1.83 0
324110 Petroleum refineries 17.1 17.0 0 0.053 0 0
331110 Iron and steel mills 15.7 5.94 9.69 0.096 0 0
484000 Truck transportation 10.3 10.3 0 0 0 0
Metric Tons of CO2 Equivalent (MTCO2E) used in : Brick, tile, and other structural clay product manufacturing
Hide Graph
If you are using this output as part of a project or paper, please cite appropriately.
Carnegie Mellon University Green Design Institute. (2010) Economic Input-Output Life Cycle Assessment (EIO-LCA) US 2002 (428) model [Internet], Available from:<http://www.eiolca.net/> [Accessed 24 Oct, 2010]
© Green Design Institute, Carnegie Mellon University, 2010.
Sector #32712A: Brick, tile, and other structural clay product manufacturingEconomic Activity: $1 Million DollarsDisplaying: Toxic ReleasesNumber of Sectors: Top 10
Change Inputs (Click here to view greenhouse gases, air pollutants, etc...)
Documentation:The environmental, energy, and other data used and their sources.Frequently asked questions about EIO-LCA.
This sector list was contributed by Green Design Institute.
Sector CarcinogensMg C2H3Cl
eq
Non-carcinogensMg C2H3Cl eq
Respiratoryinorganicskg PM2.5
eq
OzoneDepkg
CFC-11eq
Respiratoryorganics
kg C2H4 eq
Aquaticecotoxicity
Gg TEGwater
Terrestrialecotoxicity
Gg TEGsoil
Terrestrialacid/nutrikg SO2 eq
Aquaticacidif
kg SO2eq
Aquaticeutro
kg PO4P-lim
Total for all sectors 165. 1700 0.828 0.363 14.0 468. 387. 102. 817. 0.010
2122A0Gold, silver, andother metal oremining
147.0 1530 0.009 0 0.000 14.3 49.0 1.10 0.317 0
221100Power generationand supply
6.36 67.8 0.032 0 0.007 26.3 22.2 3.90 41.2 0
32712A
Brick, tile, andother structuralclay productmanufacturing
3.42 1.07 0 0 0.269 2.26 6.74 0 739.0 0
212230Copper, nickel,lead, and zincmining
3.15 49.7 0.000 0 0.002 351.0 248.0 0.018 0.019 0
331411Primary smeltingand refining ofcopper
2.74 29.8 0.000 0 0.000 55.7 28.2 0.000 0.007 0
212100 Coal mining 0.635 6.92 0.021 0 0.000 2.59 3.19 2.58 0.892 0
562000Waste managementand remediationservices
0.507 4.96 0.000 0.000 0.002 5.11 8.18 0.000 0.008 0.010
33299COther fabricatedmetalmanufacturing
0.221 0.007 0.003 0.062 0.936 0.102 0.076 0.359 0.267 0
325188All other basicinorganic chemicalmanufacturing
0.094 2.32 0.040 0.077 0.038 0.633 2.11 4.96 1.70 0.000
33131A
Alumina refiningand primaryaluminumproduction
0.082 0.645 0.011 0.021 0.013 0.302 0.644 1.36 1.06 0.000
Kilograms (kg) used in : Brick, tile, and other structural clay product manufacturing
Hide Graph
If you are using this output as part of a project or paper, please cite appropriately.
Carnegie Mellon University Green Design Institute. (2010) Economic Input-Output Life Cycle Assessment (EIO-LCA) US 2002 (428) model [Internet], Available from:<http://www.eiolca.net/> [Accessed 24 Oct, 2010]
© Green Design Institute, Carnegie Mellon University, 2010.
Why compare? Performing an LCA entails making numerous assumptions and utilizing data that is not always perfectly up-to-date, represen-tative, or complete. By comparing the findings of this study to findings from other sources utilizing other methodologies, we can see whether the findings match or whether there are major discrepancies. Future research could compare to product-orient-ed LCA tools such as BEES or the Athena Impact Estimator.1
What is EIOLCA? EIOLCA stands for Economic Input Output Life Cycle Assessment. It is a macro-scale LCA tool first proposed by economist Wassily Leontief, and operationalized by researchers at Carnegie Melon University. It uses industry-wide data to estimate materials and energy resources required for, and the environmental emissions resulting from, the activities of specific economic sectors: “The method uses information about industry transactions—purchas-es of materials by one industry from other industries, and the information about direct environmental emissions of industries, to estimate the total emissions throughout the supply chain.”2
Comparison of Scope The analysis performed here was cradle-to-grave: from extraction of raw materials through the end of the product’s life. EIOLCA’s assessment is cradle-to-gate: from the extraction of raw materials to the gate of the manufacturing facility. Therefore, EIOLCA does not take into account impacts from transportation to the site, construction, or end of life. Within its cradle-to-gate scope, how-ever, EIOLCA is extremely comprehensive, including all transac-tions through the entire supply chain.3 Whereas the scope of this assessment did not even include all of the components of brick
(metals and other additives)—let alone the life-cycle impacts of the machinery required to manufacture brick or the supply chain of power generation (oil and gas extraction, coal mining, pipeline transportation, etc.)—EIOLCA includes all of this and more. A final difference is EIOLCA’s uses industry-wide averages rather than site-specific values. My analysis used a combination of the two, favoring site-specific data where available.
Comparison of Data Two metrics that appear in both assessments—economic activity and GHG emissions—are compared in the table below.4 There are two primary discrepancies. First, EIOLCA allocates a much smaller percentage of economic activity to extraction (even adjusting for differences in scope): 2.5% vs. 29.8%. This may be the result of mismatched metrics that are not tracking comparable data. Nonetheless, the cost data used in this analysis should be verified.
Second, EIOLCA shows a large portion of GHG emissions result-ing from power generation and its supply chain, which were not included in this analysis. When the scopes are properly matched (including revising the transportation figure to reflect only indus-try average cradle-to-gate data), the allocation of GHG emissions across life cycle stages are nearly identical. Therefore, if one accounts for the differences in scope and data, the two analyses appear to agree, particularly regarding the large energy and GHG implications of brick manufacturing.
Finally, EIOLCA reveals that there are toxic releases associated with many of the brick additives—the small amounts of metals added to brick (primarily for coloring). How many of these materi-als are unnecessary and could be avoided? (“No artificial colors”?)
ECONOMIC ACTIVITY (millions of dollars)
ENERGY USE (millions of kWh)
GHG EMISSIONS (metric tons CO2e)
TOXIC RELEASES (kilograms)
1. For more on BEES, see the National Institute of Standards and Technology (NIST), http://www.nist.gov/el/economics/BEESSoftware.cfm. For more on the Athena Impact Estimator, see the Athena Sustainable Materials Institute, http://www.athenasmi.org/tools/impactEstima-tor/.
2. Carnegie Mellon University, “About the EIO-LCA Method.”
3. Carnegie Mellon University, “Approaches to Life Cycle Assessment.”
4. For complete EIOLCA data, and a larger ver-sion of the comparison table, see page 28.
12
Summary Table (Source for Charts)
ECONOMIC ENVIRONMENTAL ETHICAL
Injury / Illness rate
Fatality Rate
Mean Annual Wage
Median Annual Wage
US $ per ton) % of totallbs CO2-e per ton % of total
gallons per ton % of total
Cases per 100 emp.
Per 100,000 emp.
Cincinnati; 2010 US $
Cincinnati; 2010 US $
Extraction $45 6% 0.10 0% 2000 95% 3.4 12.7 $41,922 $39,977Manufacturing $106 14% 786.07 95% 0 0% 7.0 2.2 $31,677 $31,483Construction $527 70% 0.00 0% 100 5% 4.6 18.3 $50,110 $51,070OperationEnd of Life $12 2% 0.04 0% 0 0% 5.5 25.2 $37,290Transportation $65 9% 37.88 5% 0 0% 5.5 18.3 $39,180 $37,770TOTAL / AVG. $754 100% 824.10 100% 2100 100% 3.7 3.3 $42,340 $32,950
Comparison to EIOLCA: Economic Activity & GHG Emissions
ECONOMIC ACTIVITY GREENHOUSE GAS EMISSIONS
This Analysis EIOLCA This Analysis EIOLCA
Cost (US $ per ton) % of total
Cost without Const., EOL, or Transp.
% without Const., EOL, or Transp.
Economic Activity (millions of $) % of total
GHG Emissions (lbs CO2-e per ton) % of total
GHG Emissions (metric tons CO2-e) % of total
GHG Emissions without Power Gen.
% without Power Gen.
Extraction $44.81 5.9% $44.81 29.8% 0.037 2.8% 0.10 0.0% 0.0 0.0% 0.0 0.0%Manufacturing $105.62 14.0% $105.62 70.2% 1.033 78.2% 786.07 95.4% 1350.0 70.6% 1350.0 96.9%Construction $526.88 69.8% 0.00 0.0%End of Life $11.84 1.6% 0.04 0.0%Transportation $65.16 8.6% 37.88 4.6% 10.3 0.5% 10.3 0.7%Power Generation & Supply Chain
0.04 3.0% 517.9 27.1%
Other 0.211 16.0% 33.5 1.8% 33.5 2.4%TOTALS $754.31 100.0% $150.43 100.0% 1.321 100.0% 824.10 100.0% 1911.7 100.0% 1393.8 100.0%
Cost GHG Emissions Water Use
BRICK LCA CONCLUSIONS & RECOMMENDATIONS
Summary
Brick is expensive, but a large part of this expense is paying for human labor (craftsmanship) rather than material or energy use. Whether this trade-off is “worth it” financially depends upon the values and goals of the designer and/or client. Brick bearing wall structures are very durable, so the high initial cost may be offset by its long lifespan.
Recommendations for Designers
Because of its high up-front costs and long life, brick may make the most financial sense for government and institutional clients who are invested in the life of the building and may be more willing to pay for long-term durability. Life cycle cost assessment may help to quantify the long-term benefits of durability (although the value of future benefits depends heavily on the discount rate used). Detail-ing and mortar specifications that reduce the frequency of repoint-ing may reduce the life cycle cost.
Recommendations for Manufacturers
Reducing energy use and improving material efficiency may help to reduce the cost of brick; however, as noted above, the primary cost is incurred during construction rather than manufacturing. Innova-tions in pre-manufactured brick walls could reduce cost, but should be evaluated for effects on durability and life-cycle cost.
Note: This analysis has focused on monolithic brick bearing walls rather than brick veneer, which typically has a much shorter lifespan (40-60 years, rather than 100+). Further research could focus on comparing the life cycle cost (LCC) of the two.
13
ECONOMICS ENVIRONMENT ETHICS
Summary
The primary environmental concern with brick is the energy used in manufacturing. While brick does, indeed, have high embodied energy, this cost must be divided by its lifespan, and compared in equivalent terms to any alternatives.
Recommendations for Designers
Because of brick’s high embodied energy, durability is a primary concern. Designers should focus on creating a building that is highly flexible and adaptable to many future uses, as well as em-phasizing careful detailing to extend the wall’s life.1
In addition, designers should look for manufacturers that (1) use renewable energy and/or actively seek to reduce brick’s embodied energy, and (2) extract and manufacture the product locally (to minimize transportation impacts).
Finally, designers should take advantage of brick’s thermal mass ef-fects in order to reduce the building’s operating energy use.
Recommendations for Manufacturers
Manufacturers must focus on reducing the energy impact of brick in ways that do not compromise its durability. This could be done by using renewable energy, including carbon-neutral sources of natural gas (e.g., biogas). Longer pre-trying times may reduce the energy required to fire bricks. Lighter-weight bricks may reduce the energy used in transportation (although this is a not a primary concern, as transportation energy was not found to be significant).
In addition, manufacturers should focus on brick’s end-of-life trajectory. Following William McDonough and Michael Braungart’s “cradle-to-cradle” philosophy,2 manufacturers should look carefully at the material chemistry of bricks in order to create a product that can be safely returned to the biosphere at the end of its life. EIOLCA shows that there are currently toxic outputs resulting from metal additives—manufacturers should work to eliminate such toxins.
Finally, manufacturers could find ways to take back bricks and/or incorporate additional recycled material (mindful of any effects on durability).
Summary
Based upon injury, fatality, and wage data, brick bearing walls ap-pear to be at least slightly exploitative throughout their life cycle, although likely less so than other building materials. The fatality rate is unacceptably high for several of its life cycle stages.
Recommendations for Designers
First, designers should work with clients to prioritize ethical impacts of buildings (in addition to environmental and economic impacts). Second, designers should seek out manufacturers who prioritize worker safety, pay fair wages, and provide good health benefits. Similarly, designers should look for contractors who emphasize safety, fair pay, and good benefits. These criteria could go a long way toward improving the ethical impacts of brick walls specifically, and construction more generally.
Recommendations for Manufacturers
Manufacturers must focus on improving worker safety—specifically on reducing injuries during brick manufacturing and fatalities during clay extraction. Manufacturers should also favor forms of transportation that reduce illness, injury, and fatality.
1. The Building Science Corporation (www.buildingscience.com) and the Brick Industry Association (www.gobrick.com) both provide excellent resources on detailing for durability.
2. See McDonough and Braungart, Cradle to Cradle.
BRICK LCA BIBLIOGRAPHY 14
Amato, Rosa, et al. “Brick Manufacturing Process: Setting and Drying.” Part of a website created for senior year architecture studio, University of Michigan, Winter 2003. http://www.umich.edu/~bricks/brickwebsite/setting_drying/setting_drying_page4.htm (accessed 19 September 2010).
Answers.com. “What is the Weight of a Red Clay Brick in Kilograms?” http://wiki.answers.com/Q/What_is_the_weight_of_a_red_clay_brick_in_Kilograms (accessed 24 October 2010).
Ask.com. “How Much Does a Pallet of Bricks Cost?” http://answers.ask.com/Business/Other/how_much_does_a_pallet_of_bricks_cost (accessed 26 September 2010).
Athena Sustainable Materials Institute. “The Impact Estimator for Buildings.” http://www.athenasmi.org/tools/impactEstimator/ (accessed 2 December 2010).
Athena Sustainable Materials Institute, with Morrison Hershfield Limited. “A Life Cycle Assessment Study of Embodied Effects for Existing Historic Buildings.” A report prepared for Parks Canada (July 14, 2009). http://www.athenasmi.org/publications/docs/Athena_LCA_for_Existing_Historic_Buildings.pdf (accessed 2 December 2010).
Bajpai, Atish, et al. “A Comparative Life Cycle Assessment of a Wooden House and a Brick House.” Royal Institute of Technol-ogy, Stockholm. http://www.infra.kth.se/fms/utbildning/lca/project%20reports/Group%206%20-%20House.pdf (accessed 26 September 2010).
BEES. See National Institute of Standards and Technology.
Boral Bricks, Inc. “Building with Brick: Sustainable and Energy Ef-ficient.” White paper, December 2009. http://boralbricks.com/images/Users/1/PastelCote/News/WhitePaperSustainable_Bo-ralLetterhead.pdf (accessed 12 October 2010).
Brick Industry Association. “Maintenance of Brick Masonry.” Techni-cal Notes on Brick Construction 46 (December 2005). http://www.bia.org/bia/technotes/TN46.pdf (accessed 2 December 2010).
———. “Passive Solar Heating with Brick Masonry.” http://www.go-brick.com/html/frmset_thnt.htm (accessed 2 December 2010).
———. “Sustainability and Brick.” Technical Notes on Brick Con-struction 48 (June 2009). http://www.gobrick.com/BIA/tech-notes/TN48.pdf (accessed 12 October 2010).
Brick Industry Association website. http://www.gobrick.com/ (ac-cessed 2 December 2010).
Building Science Corporate website. http://www.buildingscience.com/ (accessed 2 December 2010).
Building Value. “Job Training.” http://www.buildingvalue-cincy.org/Job_Training (accessed 2 October 2010).
Calkins, Meg. Materials for Sustainable Sites. Hoboken, NJ: Wiley, 2009.
Carnegie Mellon University, Green Design Institute. “About the EIO-LCA Method.” http://www.eiolca.net/Method/index.html (accessed 12 December 2010).
———. “Approaches to Life Cycle Assessment.” http://www.eiolca.net/Method/LCAapproaches.html (accessed 12 December 2010).
———. Economic Input-Output Life Cycle Assessment [EIOLCA] website. http://www.eiolca.net/index.html (accessed 24 Octo-ber 2010).
Covington Re-Use Center website. http://www.covingtonreusecen-ter.org/index.php (accessed 2 October 2010).
CSGNetwork.com. “Brick Construction Calculator.” http://www.csgnetwork.com/brickgeninfocalc.html (accessed 24 October 2010).
EIOLCA. See Carnegie Mellon University, Green Design Institute.
EnergyVortex.com. “Energy Dictionary: BTU, MBTU, MMBTU.” http://www.energyvortex.com/energydictionary/british_thermal_unit_(btu)__mbtu__mmbtu.html (accessed 24 October 2010).
Engineering.com Library. http://www.engineering.com/Library/ta-bid/78/Default.aspx.
Google Maps. http://www.google.com/maps.
H. Hafner & Sons, Inc. “Cincinnati Dumpster Rental.” http://www.hafners.com/cincinnati-landscape-services/dumpster-rental.html (accessed 2 October 2010).
Hanson Brick and Tile. “Sustainable Development.” http://www.hansonbrick.com/en/pdf/green/Sustainable-Development.pdf (accessed 12 October 2010).
Howtopedia.org. “How to Measure the Energy Used to Fire Clay Bricks: Practical Guide for Brickmakers, Field-Workers and Researchers—Technical Brief.” http://en.howtopedia.org/wiki/How_to_Measure_the_Energy_Used_to_Fire_Clay_Bricks (ac-cessed 24 October 2010).
Lawrence Livermore National Laboratory. “Lawrence Livermore Na-tional Lab, Navistar Work to Increase Semi-Truck Fuel Efficiency.” Press release, February 2010. https://www.llnl.gov/news/news-releases/2010/NR-10-02-08.html (accessed 12 October 2010).
Longworth Hall website. “A Bit of History.” http://www.longworth-hall.com/about.html (accessed 10 September 2010).
Lstiburek, Joseph. “Increasing the Durability of Building Construc-tions.” Building Science Digest 144, Building Science Corpo-ration (December 2006). http://www.buildingscience.com/documents/digests/bsd-144-increasing-the-durability-of-build-ing-constructions/files/bsd-144_increasing-the-durability-of-building-constructions.pdf (accessed 2 December 2010).
Management Computer Controls, Inc. (MC2). “Estimators’ Reference: Mortar Mixes.” http://www.mc2-ice.com/support/estref/popu-lar_conversion_files/masonry/mortar.htm (accessed 2 October 2010).
Mavis, Jim. “Water Use in Industries of the Future: Mining Industry.” Prepared under contract to Center for Waste Reduction Tech-nologies for the U.S. Department of Energy, Office of Energy Efficiency and Renewable Energy, Industrial Technologies Pro-gram (July 2003). http://www1.eere.energy.gov/industry/min-ing/pdfs/water_use_mining.pdf (accessed 26 September 2010).
McDonough, William, and Michael Braungart. Cradle to Cradle: Remaking the Way we Make Things. New York: North Point Press, 2002.
National Institute of Standards and Technology [NIST]. “BEES (Build-ing for Environmental and Economic Sustainability.” http://www.nist.gov/el/economics/BEESSoftware.cfm (accessed 2 December 2010).
———. BEES 4.0 Software documentation. “Generic Brick and Mor-tar.”
———. BEES 4.0 Software documentation. “Generic Concrete Prod-ucts with Portland Cement.”

BRICK LCA BIBLIOGRAPHY (continued) 15
National Mining Association (NMA). “Mining in North Carolina, 2004.” http://www.nma.org/pdf/states/nc2004.pdf (accessed 26 September 2010).
———. “Mining in North Carolina, 2007.” http://www.nma.org/pdf/states/econ/nc.pdf (accessed 26 September 2010).
National Register of Historic Places. “B&O Freight Terminal.” http://nrhp.focus.nps.gov/ (accessed 10 September 2010).
North Carolina Department of Environment and National Resourc-es. The Division of Land Resources. “Permitted Mines in North Carolina as of 27 August 2010.” http://www.dlr.enr.state.nc.us/pages/Permitted%20mines%2020100827/Permited%20ac-tive%20and%20inactive%20mines%2020100827.xls (accessed 25 September 2010).
North Carolina Geological Survey [NCGS]. “Mineral Resources.” http://www.geology.enr.state.nc.us/Mineral%20resources/min-eralresources.html (accessed 25 September 2010).
National Renewable Energy Laboratory [NREL]. U.S. Life-Cycle Inventory Database. http://www.nrel.gov/lci/database/default.asp (for module “Limestone, at mine;” accessed 26 September 2010).
Pioneer Sand Company. “Flagstone Wholesale.” http://www.pio-neersand.com/wholesale/flagstone/flagstone.htm (accessed 12 October 2010).
Quarry News. “Cincinnati Recycler Prefers Keestrack Destroyer.” October 2009. http://www.quarrynews.com/ME2/Audiences/dirmod.asp?sid=&nm=&type=Publishing&mod=Publications::Article&mid=8F3A7027421841978F18BE895F87F791&id=DE90552AB49642A595B5AB4F4AE6CDFD&tier=4 (accessed 2 October 2010).
Reade Advanced Materials. “Weight Per Cubit Foot and Specific Gravity.” http://www.reade.com/Particle_Briefings/spec_gra2.html (accessed 2 October 2010).
Rodrigue, Jean-Paul, Claude Comtois and Brian Slack. “Freight Transport Costs in Cents per Ton-Mile.” From The Geography of Transportation Systems website. Hofstra University, Department of Global Studies & Geography (2009). http://people.hofstra.edu/geotrans/eng/ch3en/conc3en/modaltransportcostton-mile.html (accessed 2 October 2010).
RSMeans CostWorks. Construction Estimate. http://www.means-costworks.com/ (data for 0421 Brick Masonry, Structural Brick C652, Grade SW, incl. mortar; accessed 12 September 2010).
———. “Reference Tables: Clay Unit Masonry: Brick, Block & Mortar Quantities.” http://www.meanscostworks.com/MyEstimate/..%5CReferences%5CUNIT%5CREFPDF%5CR04211050.pdf (ac-cessed 12 September 2010).
———. “Reference Tables: Crews.” http://www.meanscostworks.com/References/Unit/RefPDF/crewstd.pdf (accessed 12 Sep-tember 2010).
U.S. Bureau of Labor Statistics [U.S. BLS]. “2009 Census of Fatal Oc-cupational Injuries (CFOI) Charts.” Preliminary data. http://www.bls.gov/iif/oshwc/cfoi/cfch0008.pdf (accessed 18 September 2010).
———. “Incidence Rates of Nonfatal Occupational Injuries and Ill-nesses by Industry and Case Types, 2008.” http://www.bls.gov/iif/oshwc/osh/os/ostb2071.pdf (accessed 26 September 2010).
———. “Incidence Rate and Number of Nonfatal Occupational Inju-ries by Industry and Ownership, 2008.” http://www.bls.gov/iif/oshwc/osh/os/ostb2063.pdf (accessed 12 October 2010).
———. May 2009 Occupational Employment and Wage Estimates: Metropolitan Area Cross-Industry Estimates. ftp://ftp.bls.gov/pub/special.requests/oes/oesm09ma.zip (accessed 2 December 2010).
———. “Occupational Employment and Wages, May 2009.” http://bls.gov/ (accessed 12 September 2010).
U.S. Department of Energy [U.S. DOE]. Office of Energy Efficiency and Renewable Energy. Industrial Technologies Program. Industrial Assessment Centers Database. http://iac.rutgers.edu/database/ (assessments #UA0022 [http://iac.rutgers.edu/database/assessment/UA0022], #NC0352 [http://iac.rutgers.edu/database/assessment/NC0352], and #CO0578 [http://iac.rutgers.edu/database/assessment/CO0578]; accessed 26 Sep-tember 2010).
———. U.S. Energy Information Administration. “Fuel Emission Co-efficients.” http://www.eia.doe.gov/oiaf/1605/coefficients.html (accessed 19 September 2010).
U.S. Environmental Protection Agency [U.S. EPA]. “GHG Emission Factors: eGRID2007 Version 1.1 Year 2005 GHG Annual Output Emission Rates.” http://cfpub.epa.gov/egridweb/ghg.cfm (ac-cessed 19 September 2010).
———. “Emission Facts: Calculating Emissions of Greenhouse Gases: Key Facts and Figures.” February 2005. http://www.epa.gov/otaq/climate/420f05003.htm (accessed 12 October 2010).
———. “Mobile Source Air Toxics.” http://www.epa.gov/otaq/toxics.htm (accessed 2 October 2010).
———. “Waste Reduction Model (WARM) Calculator.” http://www.epa.gov/climatechange/wycd/waste/calculators/Warm_home.html (accessed 2 October 2010).
U.S. Geological Survey [USGS]. Mineral Commodity Summary: Clays (January 2010). Prepared by Robert L. Virta. http://minerals.usgs.gov/minerals/pubs/commodity/clays/mcs-2010-clays.pdf (accessed 25 September 2010).
———. 2008 Minerals Yearbook: Clay and Shale [Advance Release], by Robert L. Virta. September 2010. http://minerals.usgs.gov/minerals/pubs/commodity/clays/myb1-2008-clays.pdf (ac-cessed 25 September 2010).
U Ship website. Price Estimator. http://www.uship.com/price_esti-mator.aspx (accessed 12 October 2010).
Virta, Robert L. See U.S. Geological Survey.

BRICK LCA APPENDIX A: DATA & SOURCES Overall LCA Data 16
Life Cycle Assessment: Brick Bearing Wall, Longworth Hall, Cincinnati, OhioCarl S. Sterner
TOTALS
Metric Units Quantity Source Quantity Source Quantity Source Quantity Source Quantity Source Quantity Source Quantity
ECONOMICMaterial cost $ / sq. ft. wall NO DATA NO DATA NO DATA $2.90 [1] NO DATA
$ / ton NO DATA NO DATA NO DATA $123.82 calc. NO DATALabor cost $ / sq. ft. wall NO DATA NO DATA NO DATA $6.08 [1] NO DATA
$ / ton NO DATA NO DATA NO DATA $259.60 calc. NO DATATotal cost $ / sq. ft. wall $1.05 calc. $2.47 calc. $1.53 calc. $12.34 [1] $0.28 calc. $17.67
$ / ton $44.81 [14] $105.62 calc. $65.16 [24,25] $526.88 calc. $11.84 [32] $754.31
ENVIRONMENTALEmissions to air Total GHG emissions lbs CO2e / ton 0.1022 [18] 786.07 calc. 37.88 [26,27,28] NO DATA 0.0441 [33] 824.10 GHG emissions from electricity lbs CO2e / ton 633.53 [22] NO DATA NO DATA GHG emissions from nat. gas lbs CO2e / ton 152.54 [23] NO DATA NO DATAEnergy use MMBTU / ton NO DATA 1.6667 [20] NO DATA NO DATA NO DATA Electricity MMBTU / ton NO DATA 0.1207 [20] NO DATA NO DATA NO DATA Natural gas MMBTU / ton NO DATA 1.3040 [20] NO DATA NO DATA NO DATAWater use gal / ton 2000 [19] NO DATA NO DATA 100 est. NO DATA 2100
ETHICAL AveragesInjury / illness rate cases per 100 employees 3.4 [16] 7.0 [16] 5.5 [16] 4.6 [16] 5.5 [16] 5.2 relative to all occupations % 91.9% [16] 189.2% [16] 148.6% [16] 124.3% [16] 148.6% [16] 140.5%Fatality rate per 100,000 employees 12.7 [17] 2.2 [31] 18.3 [31] 18.3 [2] 25.2 [2] 15.34 relative to all occupations % 384.8% [2] 66.7% [31] 554.5% [31] 554.5% [2] 763.6% 464.8%Annual wage (Cincinnati) Mean $ / yr $41,922 calc. $31,677 calc. $39,180 [29] $50,110 [2] $37,290 [2] $40,036 Median $ / yr $39,977 calc. $31,483 calc. $37,770 [29] $51,070 [2] NO DATA $40,075% of local avg. wage Mean % 99% calc. 75% calc. 97.2% [29] 118% [2] 88.1% [2] 95.5% Median % 121% calc. 96% calc. 118.7% [29] 155% [2] NO DATA 122.6%
Sources Conversions Source[1] R.S. Means (www.meanscostworks.com) 1 sq. ft. wall = 6.27 bricks (waste not included) [8][2] U.S. Bureau of Labor Statistics (www.bls.gov) [cfch0008.pdf] 1 sq. ft. wall = 7.09 bricks (including waste) [1][3] Meg Calkins, Materials for Sustainable Sites (Hoboken, NJ: John Wiley & Sons, 2009), 186. 1 brick = 0.03776042 c.f. brick calculated[4] http://www.longworthhall.com/about.html 1 sq. ft. wall = 0.26772135 c.f. bricks calculated[5] http://wiki.answers.com/Q/What_is_the_weight_of_a_red_clay_brick_in_Kilograms 1 c.f. wall = 18.81 bricks calculated[6] http://en.howtopedia.org/wiki/How_to_Measure_the_Energy_Used_to_Fire_Clay_Bricks 1 c.f. brick (no mortar) = 26.48 bricks calculated[7] http://www.reade.com/Particle_Briefings/spec_gra2.html 1 brick = 3 kg [5],[6][8] http://www.csgnetwork.com/brickgeninfocalc.html 1 c.f. bricks = 120 lbs [7][9] http://www.mc2-ice.com/support/estref/popular_conversion_files/masonry/mortar.htm 1 short ton = 2000 lbs given[10] http://www.umich.edu/~bricks/brickwebsite/setting_drying/setting_drying_page3.htm 1 ton = 16.67 c.f. brick calculated[11] http://www.engineering.com/content/ContentDisplay?contentId=41005029; as quoted in Atish Bajpai, et al., "A Comparative Life Cycle Assessment of a Wooden House and a Brick House" (Royal Institute of Technology, Stockholm) 1 ton brick = 62.25 s.f. wall calculated[12] http://wiki.answers.com/Q/How_many_bricks_in_a_pallet_of_brick 1 ton = 441.38 bricks calculated[13] http://answers.ask.com/Business/Other/how_much_does_a_pallet_of_bricks_cost
1000 bricks = 10.3 c.f. mortar (waste included) [1] 1 sq. ft. wall = 7.09 bricks (including waste) [1]
[15] National Mining Association (NMA), "Mining in North Carolina, 2007" (http://www.nma.org/pdf/states/econ/nc.pdf) 1 sq. ft. wall = 0.109 c.f. mortar calculated1 c.f. mortar = 135 lbs [7]
1 m3 mortar = 1860 kg [11][17] U.S. Bureau of Labor Statistics (www.bls.gov) [cfch0008.pdf]
1 ton = 14.81 c.f. mortar calculated 1 ton mortar = 135.92 s.f. wall calculated
1 ton = 42.70 s.f. wall (brick + mortar) calculated 1 kWh = 3412.14 BTUs [21]
1 MMBTU = 1,000,000 BTUs [21][20] U.S. Dept of Energy, Energy Efficiency and Renewable Energy, Industrial Technologies Program, "IAC Assessment Statistics" (2010) (http://iac.rutgers.edu/database/statistics/?STATE=&CENTER=&YEAR_limit=%3C%3D&YEAR=2010&SIC=&NAICS=327121&search=Search)
[14] Robert L. Vitra, "2008 Minerals Yearbook: Clay and Shale [Advance Release]" (U.S. Geological Survey, September 2010), http://minerals.usgs.gov/minerals/pubs/commodity/clays/myb1-2008-clays.pdf
[16] U.S. Bureau of Labor Statistics, "Incidence rates of nonfatal occupational injuries and illnesses by industry and case types, 2008" (http://www.bls.gov/iif/oshwc/osh/os/ostb2071.pdf)
[18] U.S. Life-Cycle Inventory Database, “Limestone, at mine,” http://www.nrel.gov/lci/database/default.asp (accessed 26 September 2010)[19] Jim Mavis, “Water Use in Industries of the Future,” (U.S. Dept of Energy Office of Energy Efficiency and Renewable Energy, Industrial Technologies Program, July 2003), http://www1.eere.energy.gov/industry/mining/pdfs/water_use_mining.pdf.
Operations End of Life (Landfill)Extraction / Harvest Manufacturing ConstructionShipping / Transport

BRICK LCA APPENDIX A: DATA & SOURCES Overall LCA Data (continued) 17
1 metric ton = 1.1023113 tons given[21] http://www.energyvortex.com/energydictionary/british_thermal_unit_(btu)__mbtu__mmbtu.html [22] U.S. EPA, http://cfpub.epa.gov/egridweb/ghg.cfm Longworth Hall = 4,250,000 bricks [4][23] U.S. Energy Information Administration, http://www.eia.doe.gov/oiaf/1605/coefficients.html Longworth Hall = 160481.77 c.f. bricks calculated[24] http://people.hofstra.edu/geotrans/eng/ch3en/conc3en/modaltransportcosttonmile.html Longworth Hall = 9628.91 tons brick calculated[25] U Ship Price Estimator, http://www.uship.com/price_estimator.aspx?v=0&z1=40380&z2=45220&w=12000&c=417&s=150 Longworth Hall = 4410.35 tons mortar calculated[26] U.S. EPA, http://www.epa.gov/otaq/climate/420f05003.htm[27] Lawrence Livermore National Laboratory, https://www.llnl.gov/news/newsreleases/2010/NR-10-02-08.html[28] http://www.pioneersand.com/wholesale/flagstone/flagstone.htm 1 s.f. wall = 0.109 c.f. mortar 28.93% mortar by volume[29] U.S. Bureau of Labor Statistics, http://data.bls.gov:8080/oes/datatype.do 1 s.f. wall = 0.26772135 c.f. brick 71.07% brick by volume[30] U.S. Bureau of Labor Statistics, http://www.bls.gov/iif/oshwc/osh/os/ostb2063.pdf TOTAL = 0.37672135 100.00%
1 s.f. wall = 0.0073575 tons mortar 31.41% mortar by weight[32] H. Hafner & Sons, http://www.hafners.com/cincinnati-landscape-services/dumpster-rental.html 1 s.f. wall = 0.01606328 tons brick 68.59% brick by weight[33] U.S. EPA WARM calculator TOTAL = 0.02342078 tons
[20] U.S. Dept of Energy, Energy Efficiency and Renewable Energy, Industrial Technologies Program, "IAC Assessment Statistics" (2010) (http://iac.rutgers.edu/database/statistics/?STATE=&CENTER=&YEAR_limit=%3C%3D&YEAR=2010&SIC=&NAICS=327121&search=Search)
[31] U.S. Bureau of Labor Statistics, "Census of Fatal Occupational Injuries Charts, 1992-2009," http://www.bls.gov/iif/oshwc/cfoi/cfch0008.pdf
Life Cycle Assessment: Brick Bearing Wall, Longworth Hall, Cincinnati, OhioCarl S. Sterner
TOTALS
Metric Units Quantity Source Quantity Source Quantity Source Quantity Source Quantity Source Quantity Source Quantity
ECONOMICMaterial cost $ / sq. ft. wall NO DATA NO DATA NO DATA $2.90 [1] NO DATA
$ / ton NO DATA NO DATA NO DATA $123.82 calc. NO DATALabor cost $ / sq. ft. wall NO DATA NO DATA NO DATA $6.08 [1] NO DATA
$ / ton NO DATA NO DATA NO DATA $259.60 calc. NO DATATotal cost $ / sq. ft. wall $1.05 calc. $2.47 calc. $1.53 calc. $12.34 [1] $0.28 calc. $17.67
$ / ton $44.81 [14] $105.62 calc. $65.16 [24,25] $526.88 calc. $11.84 [32] $754.31
ENVIRONMENTALEmissions to air Total GHG emissions lbs CO2e / ton 0.1022 [18] 786.07 calc. 37.88 [26,27,28] NO DATA 0.0441 [33] 824.10 GHG emissions from electricity lbs CO2e / ton 633.53 [22] NO DATA NO DATA GHG emissions from nat. gas lbs CO2e / ton 152.54 [23] NO DATA NO DATAEnergy use MMBTU / ton NO DATA 1.6667 [20] NO DATA NO DATA NO DATA Electricity MMBTU / ton NO DATA 0.1207 [20] NO DATA NO DATA NO DATA Natural gas MMBTU / ton NO DATA 1.3040 [20] NO DATA NO DATA NO DATAWater use gal / ton 2000 [19] NO DATA NO DATA 100 est. NO DATA 2100
ETHICAL AveragesInjury / illness rate cases per 100 employees 3.4 [16] 7.0 [16] 5.5 [16] 4.6 [16] 5.5 [16] 5.2 relative to all occupations % 91.9% [16] 189.2% [16] 148.6% [16] 124.3% [16] 148.6% [16] 140.5%Fatality rate per 100,000 employees 12.7 [17] 2.2 [31] 18.3 [31] 18.3 [2] 25.2 [2] 15.34 relative to all occupations % 384.8% [2] 66.7% [31] 554.5% [31] 554.5% [2] 763.6% 464.8%Annual wage (Cincinnati) Mean $ / yr $41,922 calc. $31,677 calc. $39,180 [29] $50,110 [2] $37,290 [2] $40,036 Median $ / yr $39,977 calc. $31,483 calc. $37,770 [29] $51,070 [2] NO DATA $40,075% of local avg. wage Mean % 99% calc. 75% calc. 97.2% [29] 118% [2] 88.1% [2] 95.5% Median % 121% calc. 96% calc. 118.7% [29] 155% [2] NO DATA 122.6%
Sources Conversions Source[1] R.S. Means (www.meanscostworks.com) 1 sq. ft. wall = 6.27 bricks (waste not included) [8][2] U.S. Bureau of Labor Statistics (www.bls.gov) [cfch0008.pdf] 1 sq. ft. wall = 7.09 bricks (including waste) [1][3] Meg Calkins, Materials for Sustainable Sites (Hoboken, NJ: John Wiley & Sons, 2009), 186. 1 brick = 0.03776042 c.f. brick calculated[4] http://www.longworthhall.com/about.html 1 sq. ft. wall = 0.26772135 c.f. bricks calculated[5] http://wiki.answers.com/Q/What_is_the_weight_of_a_red_clay_brick_in_Kilograms 1 c.f. wall = 18.81 bricks calculated[6] http://en.howtopedia.org/wiki/How_to_Measure_the_Energy_Used_to_Fire_Clay_Bricks 1 c.f. brick (no mortar) = 26.48 bricks calculated[7] http://www.reade.com/Particle_Briefings/spec_gra2.html 1 brick = 3 kg [5],[6][8] http://www.csgnetwork.com/brickgeninfocalc.html 1 c.f. bricks = 120 lbs [7][9] http://www.mc2-ice.com/support/estref/popular_conversion_files/masonry/mortar.htm 1 short ton = 2000 lbs given[10] http://www.umich.edu/~bricks/brickwebsite/setting_drying/setting_drying_page3.htm 1 ton = 16.67 c.f. brick calculated[11] http://www.engineering.com/content/ContentDisplay?contentId=41005029; as quoted in Atish Bajpai, et al., "A Comparative Life Cycle Assessment of a Wooden House and a Brick House" (Royal Institute of Technology, Stockholm) 1 ton brick = 62.25 s.f. wall calculated[12] http://wiki.answers.com/Q/How_many_bricks_in_a_pallet_of_brick 1 ton = 441.38 bricks calculated[13] http://answers.ask.com/Business/Other/how_much_does_a_pallet_of_bricks_cost
1000 bricks = 10.3 c.f. mortar (waste included) [1] 1 sq. ft. wall = 7.09 bricks (including waste) [1]
[15] National Mining Association (NMA), "Mining in North Carolina, 2007" (http://www.nma.org/pdf/states/econ/nc.pdf) 1 sq. ft. wall = 0.109 c.f. mortar calculated1 c.f. mortar = 135 lbs [7]
1 m3 mortar = 1860 kg [11][17] U.S. Bureau of Labor Statistics (www.bls.gov) [cfch0008.pdf]
1 ton = 14.81 c.f. mortar calculated 1 ton mortar = 135.92 s.f. wall calculated
1 ton = 42.70 s.f. wall (brick + mortar) calculated 1 kWh = 3412.14 BTUs [21]
1 MMBTU = 1,000,000 BTUs [21][20] U.S. Dept of Energy, Energy Efficiency and Renewable Energy, Industrial Technologies Program, "IAC Assessment Statistics" (2010) (http://iac.rutgers.edu/database/statistics/?STATE=&CENTER=&YEAR_limit=%3C%3D&YEAR=2010&SIC=&NAICS=327121&search=Search)
[14] Robert L. Vitra, "2008 Minerals Yearbook: Clay and Shale [Advance Release]" (U.S. Geological Survey, September 2010), http://minerals.usgs.gov/minerals/pubs/commodity/clays/myb1-2008-clays.pdf
[16] U.S. Bureau of Labor Statistics, "Incidence rates of nonfatal occupational injuries and illnesses by industry and case types, 2008" (http://www.bls.gov/iif/oshwc/osh/os/ostb2071.pdf)
[18] U.S. Life-Cycle Inventory Database, “Limestone, at mine,” http://www.nrel.gov/lci/database/default.asp (accessed 26 September 2010)[19] Jim Mavis, “Water Use in Industries of the Future,” (U.S. Dept of Energy Office of Energy Efficiency and Renewable Energy, Industrial Technologies Program, July 2003), http://www1.eere.energy.gov/industry/mining/pdfs/water_use_mining.pdf.
Operations End of Life (Landfill)Extraction / Harvest Manufacturing ConstructionShipping / Transport
Summary Table (Source for Charts)
ECONOMIC ENVIRONMENTAL ETHICAL
Injury / Illness rate
Fatality Rate
Mean Annual Wage
Median Annual Wage
US $ per ton) % of totallbs CO2-e per ton % of total
gallons per ton % of total
Cases per 100 emp.
Per 100,000 emp.
Cincinnati; 2010 US $
Cincinnati; 2010 US $
Extraction $45 6% 0.10 0% 2000 95% 3.4 12.7 $41,922 $39,977Manufacturing $106 14% 786.07 95% 0 0% 7.0 2.2 $31,677 $31,483Construction $527 70% 0.00 0% 100 5% 4.6 18.3 $50,110 $51,070OperationEnd of Life $12 2% 0.04 0% 0 0% 5.5 25.2 $37,290Transportation $65 9% 37.88 5% 0 0% 5.5 18.3 $39,180 $37,770TOTAL / AVG. $754 100% 824.10 100% 2100 100% 3.7 3.3 $42,340 $32,950
Comparison to EIOLCA: Economic Activity & GHG Emissions
ECONOMIC ACTIVITY GREENHOUSE GAS EMISSIONS
This Analysis EIOLCA This Analysis EIOLCA
Cost (US $ per ton) % of total
Cost without Const., EOL, or Transp.
% without Const., EOL, or Transp.
Economic Activity (millions of $) % of total
GHG Emissions (lbs CO2-e per ton) % of total
GHG Emissions (metric tons CO2-e) % of total
GHG Emissions without Power Gen.
% without Power Gen.
Extraction $44.81 5.9% $44.81 29.8% 0.037 2.8% 0.10 0.0% 0.0 0.0% 0.0 0.0%Manufacturing $105.62 14.0% $105.62 70.2% 1.033 78.2% 786.07 95.4% 1350.0 70.6% 1350.0 96.9%Construction $526.88 69.8% 0.00 0.0%End of Life $11.84 1.6% 0.04 0.0%Transportation $65.16 8.6% 37.88 4.6% 10.3 0.5% 10.3 0.7%Power Generation & Supply Chain
0.04 3.0% 517.9 27.1%
Other 0.211 16.0% 33.5 1.8% 33.5 2.4%TOTALS $754.31 100.0% $150.43 100.0% 1.321 100.0% 824.10 100.0% 1911.7 100.0% 1393.8 100.0%
Cost GHG Emissions Water Use

BRICK LCA APPENDIX A: DATA & SOURCES Extraction Data 18
Extraction of Common Clay
Metric Units Quantity Source
ECONOMICMaterial cost $ / tonLabor cost $ / tonTotal cost $ / tonTotal revenue $ / ton $44.81 [f]
ENVIRONMENTALEmissions to air Tons / ton Total GHG emissions lbs CO2e / ton 0.1022 [g]Energy use MMBTU / ton Electrical MMBTU / ton Natural Gas MMBTU / tonWater use gal / ton 2000 [h]
ETHICALInjury / illness rate cases per 100 employees 3.4 [a] relative to all occupations % 91.9%Fatality rate per 100,000 / yr 12.7 [e] relative to all occupations % 384.8%Annual wage (Cincinnati) Mean $ / yr $41,922 calc. Median $ / yr $39,977 calc.% of local avg. wage Mean % 99% calc. Median % 121% calc.
Sources
[b] NOT USED
Overall Industry Data
Economic data from USGS (see reference [f] below), based on all domestic clay manufacturing (including non-brick uses, which account for roughly 54% of clay produced). Emission data uses limestone extraction as an approximation (clay data was unavailable; data from the U.S. LCI database. Water use is a rough estimate for clay mining, from a report to the Dept. of Energy by CH2M Hill (see reference [h] below). Ethical data from the U.S. Bureau of Labor Statistics, as follows: wage data based upon "Nonmetallic Mineral Mining and Quarrying," NAICS code 212300; fatality data based upon general "mining" sector data (see reference [e] below); injury/illness data based upon "Clay and ceramic and refractory minerals mining" (see reference [a] below).
[a] U.S. Bureau of Labor Statistics, "Incidence rates of nonfatal occupational injuries and illnesses by industry and case types, 2008" (http://www.bls.gov/iif/oshwc/osh/os/ostb2071.pdf)
[d] NOT USED[e] U.S. Bureau of Labor Statistics (www.bls.gov) [cfch0008.pdf]
[i] U.S. Bureau of Labor Statistics, http://www.bls.gov/oes/current/naics4_327100.htm
TOTAL COST - EXTRACTIONUnits 2006 2008 Source
Quantity metric tons 36,700,000 33,200,000 [f]Value dollars $1,750,000,000 $1,640,000,000 [f]Unit Value per metric ton $47.68 $49.40 calculationUnit Value per short ton $43.26 $44.81 calculation
Conversions1 metric ton = 1.1023113 short tons1 kg = 0.001 metric tons1 kg = 2.2046226 lbs
GHG EMISSIONS / CONVERSIONSUnits Source
1kg limestone = 0.0000511 kg CO2-e [g]1 metric ton = 0.0511 kg CO2-e calculation1 short ton = 0.046357141 kg CO2-e calculation1 short ton = 0.1022 lbs CO2-e calculation
[f] Robert L. Vitra, "2008 Minerals Yearbook: Clay and Shale [Advance Release]" (U.S. Geological Survey, September 2010), http://minerals.usgs.gov/minerals/pubs/commodity/clays/myb1-2008-clays.pdf[g] U.S. Life-Cycle Inventory Database, “Limestone, at mine,” http://www.nrel.gov/lci/database/default.asp (accessed 26 September 2010)[h] Jim Mavis, “Water Use in Industries of the Future,” (U.S. Dept of Energy Office of Energy Efficiency and Renewable Energy, Industrial Technologies Program, July 2003),
[j] U.S. Bureau of Labor Statistics, May 2009 Occupational Employment and Wage Estimates: Metropolitan Area Cross-Industry Estimates, ftp://ftp.bls.gov/pub/special.requests/oes/oesm09ma.zip
[c] National Mining Association (NMA), "Mining in North Carolina, 2007" (http://www.nma.org/pdf/states/econ/nc.pdf)

BRICK LCA APPENDIX A: DATA & SOURCES Extraction Data (continued) 19
AVERAGE WAGES - EXTRACTION
SOC Code Number Occupation # (source [i])
% of Total Industry (Nonmetallic
Mineral Mining and Quarrying, NAICS 212300) (source
[i])
Mean Annual Wage
(national) (source [i])
Weighted Mean Annual Wage
(national) (calculated)
Mean Annual Wage (Cincinnati) (source
[j])
Weighted Mean Annual Wage
(Cincinnati) (calculated)
Median Annual Wage (Cincinnati) (source
[j])
Weighted Median Annual Wage
(Cincinnati) (calculated)
MANAGEMENT OCCUPATIONS11-1011 Chief Executives 210 0.21% $176,130 $36,987,300 $172,730 $36,273,300 $172,730 $36,273,30011-1021 General and Operations Managers 1,910 1.95% $99,940 $190,885,400 $111,400 $212,774,000 $101,980 $194,781,80011-2022 Sales Managers 140 0.14% $99,650 $13,951,000 $114,620 $16,046,800 $101,390 $14,194,60011-3031 Financial Managers 180 0.18% $93,620 $16,851,600 $109,240 $19,663,200 $99,890 $17,980,20011-3051 Industrial Production Managers 550 0.56% $86,150 $47,382,500 $96,290 $52,959,500 $88,020 $48,411,00011-3061 Purchasing Managers 40 0.04% $80,390 $3,215,600 $91,560 $3,662,400 $87,490 $3,499,60011-3071 Transportation, Storage, and Distribution Managers50 0.05% $96,810 $4,840,500 $81,940 $4,097,000 $77,560 $3,878,00011-9021 Construction Managers 200 0.20% $93,910 $18,782,000 $98,260 $19,652,000 $85,600 $17,120,00011-9041 Engineering Managers 100 0.10% $110,090 $11,009,000 $122,700 $12,270,000 $114,330 $11,433,00011-9199 Managers, All Other 130 0.13% $78,890 $10,255,700 $108,120 $14,055,600 $102,910 $13,378,300
BUSINESS AND FINANCIAL OCCUPATIONS13-1023 Purchasing Agents, Except Wholesale, Retail, and Farm Products250 0.26% $51,300 $12,825,000 $56,340 $14,085,000 $53,680 $13,420,00013-1041 Compliance Officers, Except Agriculture, Construction, Health and Safety, and Transportation70 0.07% $55,430 $3,880,100 $54,970 $3,847,900 $50,410 $3,528,70013-1051 Cost Estimators 90 0.09% $53,560 $4,820,400 $63,440 $5,709,600 $59,780 $5,380,20013-1073 Training and Development Specialists 40 0.04% $60,570 $2,422,800 $53,060 $2,122,400 $50,050 $2,002,00013-1079 Human Resources, Training, and Labor Relations Specialists, All Other60 0.06% $53,040 $3,182,400 $52,440 $3,146,400 $49,580 $2,974,80013-1199 Business Operations Specialists, All Other 80 0.08% $54,280 $4,342,400 $61,170 $4,893,600 $57,050 $4,564,00013-2011 Accountants and Auditors 410 0.42% $68,290 $27,998,900 $63,950 $26,219,500 $57,530 $23,587,300
COMPUTER AND MATHEMATICAL SCIENCE OCCUPATIONS15-1041 Computer Support Specialists 30 0.03% $48,140 $1,444,200 $44,780 $1,343,400 $42,240 $1,267,20015-1071 Network and Computer Systems Administrators40 0.04% $62,930 $2,517,200 $64,650 $2,586,000 $63,940 $2,557,600
ARCHITECTURE AND ENGINEERING OCCUPATIONS17-1022 Surveyors 40 0.04% $52,400 $2,096,000 $55,770 $2,230,800 $53,640 $2,145,60017-2041 Chemical Engineers 30 0.03% $92,910 $2,787,300 $89,800 $2,694,000 $81,210 $2,436,30017-2051 Civil Engineers 40 0.04% $66,580 $2,663,200 $76,940 $3,077,600 $74,130 $2,965,20017-2081 Environmental Engineers 60 0.06% $74,700 $4,482,000 $89,480 $5,368,800 $84,560 $5,073,60017-2111 Health and Safety Engineers, Except Mining Safety Engineers and Inspectors40 0.04% $79,600 $3,184,000 $74,580 $2,983,200 $70,820 $2,832,80017-2112 Industrial Engineers 210 0.21% $71,350 $14,983,500 $76,380 $16,039,800 $73,660 $15,468,60017-2141 Mechanical Engineers 40 0.04% $72,770 $2,910,800 $76,120 $3,044,800 $69,850 $2,794,00017-2151 Mining and Geological Engineers, Including Mining Safety Engineers310 0.32% $72,040 $22,332,400 $78,510 $24,338,100 $76,070 $23,581,70017-2199 Engineers, All Other 40 0.04% $57,240 $2,289,600 $78,510 $3,140,400 $76,070 $3,042,80017-3026 Industrial Engineering Technicians 50 0.05% $48,700 $2,435,000 $48,230 $2,411,500 $47,900 $2,395,000
LIFE, PHYSICAL SCIENCE, AND SOCIAL SCIENCE OCCUPATIONS19-4031 Chemical Technicians 570 0.58% $45,460 $25,912,200 $42,330 $24,128,100 $41,000 $23,370,00019-4099 Life, Physical, and Social Science Technicians, All Other40 0.04% $42,270 $1,690,800 $42,990 $1,719,600 $39,430 $1,577,200
HEALTHCARE PRACTITIONER AND TECHNICAL OCCUPATIONS29-9011 Occupational Health and Safety Specialists 130 0.13% $60,620 $7,880,600 $68,190 $8,864,700 $66,410 $8,633,300
PROTECTIVE SERVICE OCCUPATIONS33-9032 Security Guards 70 0.07% $23,170 $1,621,900 $26,520 $1,856,400 $23,120 $1,618,400
BUILDING AND GROUNDS CLEANING AND MAINTENANCE OCCUPATIONS37-2011 Janitors and Cleaners, Except Maids and Housekeeping Cleaners190 0.19% $26,310 $4,998,900 $24,140 $4,586,600 $22,260 $4,229,40037-3011 Landscaping and Groundskeeping Workers 110 0.11% $24,500 $2,695,000 $24,170 $2,658,700 $21,980 $2,417,800
SALES AND RELATED OCCUPATIONS41-2031 Retail Salespersons $26,070 $24,700 $0 $19,640 $0

BRICK LCA APPENDIX A: DATA & SOURCES Extraction Data (continued) 20
41-3099 Sales Representatives, Services, All Other 100 0.10% $63,880 $6,388,000 $54,080 $5,408,000 $46,060 $4,606,00041-4012 Sales Representatives, Wholesale and Manufacturing, Except Technical and Scientific Products1,150 1.17% $57,440 $66,056,000 $67,140 $77,211,000 $55,850 $64,227,500
OFFICE AND ADMINISTRATIVE SUPPORT OCCUPATIONS43-1011 First-Line Supervisors/Managers of Office and Administrative Support Workers610 0.62% $48,290 $29,456,900 $48,990 $29,883,900 $46,050 $28,090,50043-3021 Billing and Posting Clerks and Machine Operators80 0.08% $28,320 $2,265,600 $32,370 $2,589,600 $31,620 $2,529,60043-3031 Bookkeeping, Accounting, and Auditing Clerks1,390 1.42% $33,810 $46,995,900 $34,730 $48,274,700 $33,810 $46,995,90043-3051 Payroll and Timekeeping Clerks 190 0.19% $35,120 $6,672,800 $36,360 $6,908,400 $36,040 $6,847,60043-4051 Customer Service Representatives 230 0.23% $35,900 $8,257,000 $31,380 $7,217,400 $29,450 $6,773,50043-4151 Order Clerks 50 0.05% $28,260 $1,413,000 $31,220 $1,561,000 $30,080 $1,504,00043-4161 Human Resources Assistants, Except Payroll and Timekeeping60 0.06% $40,510 $2,430,600 $37,530 $2,251,800 $36,100 $2,166,00043-4171 Receptionists and Information Clerks 190 0.19% $25,530 $4,850,700 $23,820 $4,525,800 $23,320 $4,430,80043-5032 Dispatchers, Except Police, Fire, and Ambulance660 0.67% $37,430 $24,703,800 $38,260 $25,251,600 $35,830 $23,647,80043-5061 Production, Planning, and Expediting Clerks 100 0.10% $45,040 $4,504,000 $40,700 $4,070,000 $38,540 $3,854,00043-5071 Shipping, Receiving, and Traffic Clerks 270 0.28% $32,900 $8,883,000 $29,990 $8,097,300 $28,990 $7,827,30043-5081 Stock Clerks and Order Fillers 140 0.14% $35,180 $4,925,200 $24,250 $3,395,000 $21,330 $2,986,20043-5111 Weighers, Measurers, Checkers, and Samplers, Recordkeeping1,260 1.29% $29,990 $37,787,400 $28,220 $35,557,200 $27,580 $34,750,80043-6011 Executive Secretaries and Administrative Assistants490 0.50% $39,970 $19,585,300 $41,900 $20,531,000 $40,090 $19,644,10043-6014 Secretaries, Except Legal, Medical, and Executive1,070 1.09% $28,400 $30,388,000 $31,670 $33,886,900 $30,820 $32,977,40043-9061 Office Clerks, General 2,050 2.09% $26,940 $55,227,000 $27,990 $57,379,500 $26,910 $55,165,500
CONSTRUCTION AND EXTRACION OCCUPATIONS47-1011 First-Line Supervisors/Managers of Construction Trades and Extraction Workers2,980 3.04% $58,900 $175,522,000 $57,920 $172,601,600 $56,560 $168,548,80047-2061 Construction Laborers 2,390 2.44% $32,680 $78,105,200 $35,940 $85,896,600 $33,810 $80,805,90047-2071 Paving, Surfacing, and Tamping Equipment Operators200 0.20% $43,280 $8,656,000 $35,910 $7,182,000 $34,260 $6,852,00047-2073 Operating Engineers and Other Construction Equipment Operators10,090 10.30% $38,490 $388,364,100 $47,270 $476,954,300 $45,710 $461,213,90047-2111 Electricians 910 0.93% $53,240 $48,448,400 $46,070 $41,923,700 $48,210 $43,871,10047-5021 Earth Drillers, Except Oil and Gas 950 0.97% $37,070 $35,216,500 $29,550 $28,072,500 $27,370 $26,001,50047-5031 Explosives Workers, Ordnance Handling Experts, and Blasters370 0.38% $42,780 $15,828,600 $29,550 $10,933,500 $27,370 $10,126,90047-5041 Continuous Mining Machine Operators 2,040 2.08% $43,170 $88,066,800 $29,550 $60,282,000 $27,370 $55,834,80047-5042 Mine Cutting and Channeling Machine Operators1,970 2.01% $37,660 $74,190,200 $29,550 $58,213,500 $27,370 $53,918,90047-5049 Mining Machine Operators, All Other 1,210 1.24% $37,450 $45,314,500 $29,550 $35,755,500 $27,370 $33,117,70047-5051 Rock Splitters, Quarry 2,650 2.71% $29,670 $78,625,500 $29,550 $78,307,500 $27,370 $72,530,50047-5061 Roof Bolters, Mining $55,750 $29,550 $27,37047-5081 Helpers--Extraction Workers 1,250 1.28% $29,990 $37,487,500 $29,550 $36,937,500 $27,370 $34,212,50047-5099 Extraction Workers, All Other 950 0.97% $36,200 $34,390,000 $29,550 $28,072,500 $27,370 $26,001,500
INSTALLATION, MAINTENANCE, AND REPAIR OCCUPATIONS49-1011 First-Line Supervisors/Managers of Mechanics, Installers, and Repairers810 0.83% $62,870 $50,924,700 $60,020 $48,616,200 $58,940 $47,741,40049-3031 Bus and Truck Mechanics and Diesel Engine Specialists970 0.99% $40,700 $39,479,000 $40,710 $39,488,700 $39,700 $38,509,00049-3042 Mobile Heavy Equipment Mechanics, Except Engines2,610 2.66% $41,820 $109,150,200 $42,900 $111,969,000 $42,360 $110,559,60049-9041 Industrial Machinery Mechanics 1,520 1.55% $46,480 $70,649,600 $45,980 $69,889,600 $46,090 $70,056,80049-9042 Maintenance and Repair Workers, General 2,770 2.83% $40,330 $111,714,100 $38,740 $107,309,800 $38,110 $105,564,70049-9043 Maintenance Workers, Machinery 870 0.89% $36,500 $31,755,000 $37,910 $32,981,700 $36,430 $31,694,10049-9044 Millwrights 490 0.50% $49,940 $24,470,600 $49,980 $24,490,200 $48,650 $23,838,50049-9069 Precision Instrument and Equipment Repairers, All Other40 0.04% $49,700 $1,988,000 $50,850 $2,034,000 $50,900 $2,036,00049-9098 Helpers--Installation, Maintenance, and Repair Workers380 0.39% $33,220 $12,623,600 $23,970 $9,108,600 $22,550 $8,569,000
PRODUCTION OPERATIONS51-1011 First-Line Supervisors/Managers of Production and Operating Workers1,390 1.42% $56,530 $78,576,700 $56,680 $78,785,200 $55,430 $77,047,70051-4035 Milling and Planing Machine Setters, Operators, and Tenders, Metal and Plastic90 0.09% $36,000 $3,240,000 $36,810 $3,312,900 $36,870 $3,318,30051-4041 Machinists 200 0.20% $48,350 $9,670,000 $38,700 $7,740,000 $37,130 $7,426,00051-4121 Welders, Cutters, Solderers, and Brazers 900 0.92% $37,410 $33,669,000 $36,770 $33,093,000 $36,550 $32,895,00051-8021 Stationary Engineers and Boiler Operators 60 0.06% $55,910 $3,354,600 $51,390 $3,083,400 $51,410 $3,084,60051-8099 Plant and System Operators, All Other 480 0.49% $43,090 $20,683,200 $61,660 $29,596,800 $65,180 $31,286,40051-9012 Separating, Filtering, Clarifying, Precipitating, and Still Machine Setters, Operators, and Tenders760 0.78% $37,190 $28,264,400 $38,420 $29,199,200 $38,820 $29,503,20051-9021 Crushing, Grinding, and Polishing Machine Setters, Operators, and Tenders3,540 3.61% $34,990 $123,864,600 $30,100 $106,554,000 $29,570 $104,677,80051-9023 Mixing and Blending Machine Setters, Operators, and Tenders490 0.50% $37,290 $18,272,100 $40,390 $19,791,100 $41,380 $20,276,20051-9032 Cutting and Slicing Machine Setters, Operators, and Tenders540 0.55% $30,370 $16,399,800 $32,210 $17,393,400 $32,480 $17,539,20051-9051 Furnace, Kiln, Oven, Drier, and Kettle Operators and Tenders450 0.46% $38,870 $17,491,500 $31,310 $14,089,500 $30,650 $13,792,50051-9061 Inspectors, Testers, Sorters, Samplers, and Weighers1,150 1.17% $35,510 $40,836,500 $35,520 $40,848,000 $34,290 $39,433,50051-9111 Packaging and Filling Machine Operators and Tenders1,120 1.14% $32,800 $36,736,000 $31,390 $35,156,800 $29,550 $33,096,000

BRICK LCA APPENDIX A: DATA & SOURCES Extraction Data (continued) 21
51-9195 Molders, Shapers, and Casters, Except Metal and Plastic $35,670 $27,010 $24,91051-9198 Helpers--Production Workers 980 1.00% $27,640 $27,087,200 $26,030 $25,509,400 $24,710 $24,215,80051-9199 Production Workers, All Other 460 0.47% $41,480 $19,080,800 $29,280 $13,468,800 $26,450 $12,167,000
TRANSPORTATION AND MATERIAL MOVING OPERATIONS53-1021 First-Line Supervisors/Managers of Helpers, Laborers, and Material Movers, Hand410 0.42% $48,310 $19,807,100 $47,200 $19,352,000 $44,890 $18,404,90053-1031 First-Line Supervisors/Managers of Transportation and Material-Moving Machine and Vehicle Operators1,200 1.23% $54,820 $65,784,000 $53,570 $64,284,000 $51,230 $61,476,00053-3032 Truck Drivers, Heavy and Tractor-Trailer 9,600 9.80% $35,310 $338,976,000 $39,480 $379,008,000 $37,480 $359,808,00053-3033 Truck Drivers, Light or Delivery Services 440 0.45% $31,690 $13,943,600 $31,970 $14,066,800 $28,610 $12,588,40053-4013 Rail Yard Engineers, Dinkey Operators, and Hostlers50 0.05% $39,870 $1,993,500 $39,870 $1,993,500 $39,870 $1,993,50053-7011 Conveyor Operators and Tenders 950 0.97% $36,260 $34,447,000 $31,980 $30,381,000 $33,690 $32,005,50053-7021 Crane and Tower Operators 200 0.20% $39,010 $7,802,000 $38,710 $7,742,000 $36,360 $7,272,00053-7031 Dredge Operators 1,030 1.05% $35,040 $36,091,200 $40,760 $41,982,800 $37,800 $38,934,00053-7032 Excavating and Loading Machine and Dragline Operators7,390 7.55% $34,410 $254,289,900 $40,760 $301,216,400 $37,800 $279,342,00053-7033 Loading Machine Operators, Underground Mining700 0.71% $37,330 $26,131,000 $40,760 $28,532,000 $37,800 $26,460,00053-7041 Hoist and Winch Operators 30 0.03% $44,060 $1,321,800 $44,060 $1,321,800 $44,060 $1,321,80053-7051 Industrial Truck and Tractor Operators 2,150 2.20% $32,890 $70,713,500 $30,560 $65,704,000 $30,230 $64,994,50053-7061 Cleaners of Vehicles and Equipment 50 0.05% $31,510 $1,575,500 $23,290 $1,164,500 $21,210 $1,060,50053-7062 Laborers and Freight, Stock, and Material Movers, Hand3,660 3.74% $27,140 $99,332,400 $25,190 $92,195,400 $23,400 $85,644,00053-7063 Machine Feeders and Offbearers 310 0.32% $27,610 $8,559,100 $29,480 $9,138,800 $26,130 $8,100,30053-7064 Packers and Packagers, Hand 90 0.09% $23,920 $2,152,800 $21,600 $1,944,000 $20,450 $1,840,50053-7072 Pump Operators, Except Wellhead Pumpers 110 0.11% $33,240 $3,656,400 $33,240 $3,656,400 $33,240 $3,656,40053-7111 Shuttle Car Operators 100 0.10% $49,970 $4,997,000 $39,780 $3,978,000 $37,790 $3,779,00053-7121 Tank Car, Truck, and Ship Loaders 140 0.14% $41,520 $5,812,800 $39,780 $5,569,200 $37,790 $5,290,60053-7199 Material Moving Workers, All Other 70 0.07% $30,730 $2,151,100 $39,780 $2,784,600 $37,790 $2,645,300
96350 98.28% $3,921,081,600 $4,039,208,000 $3,851,819,30098.38% $40,696 $41,922.24 $39,977.37
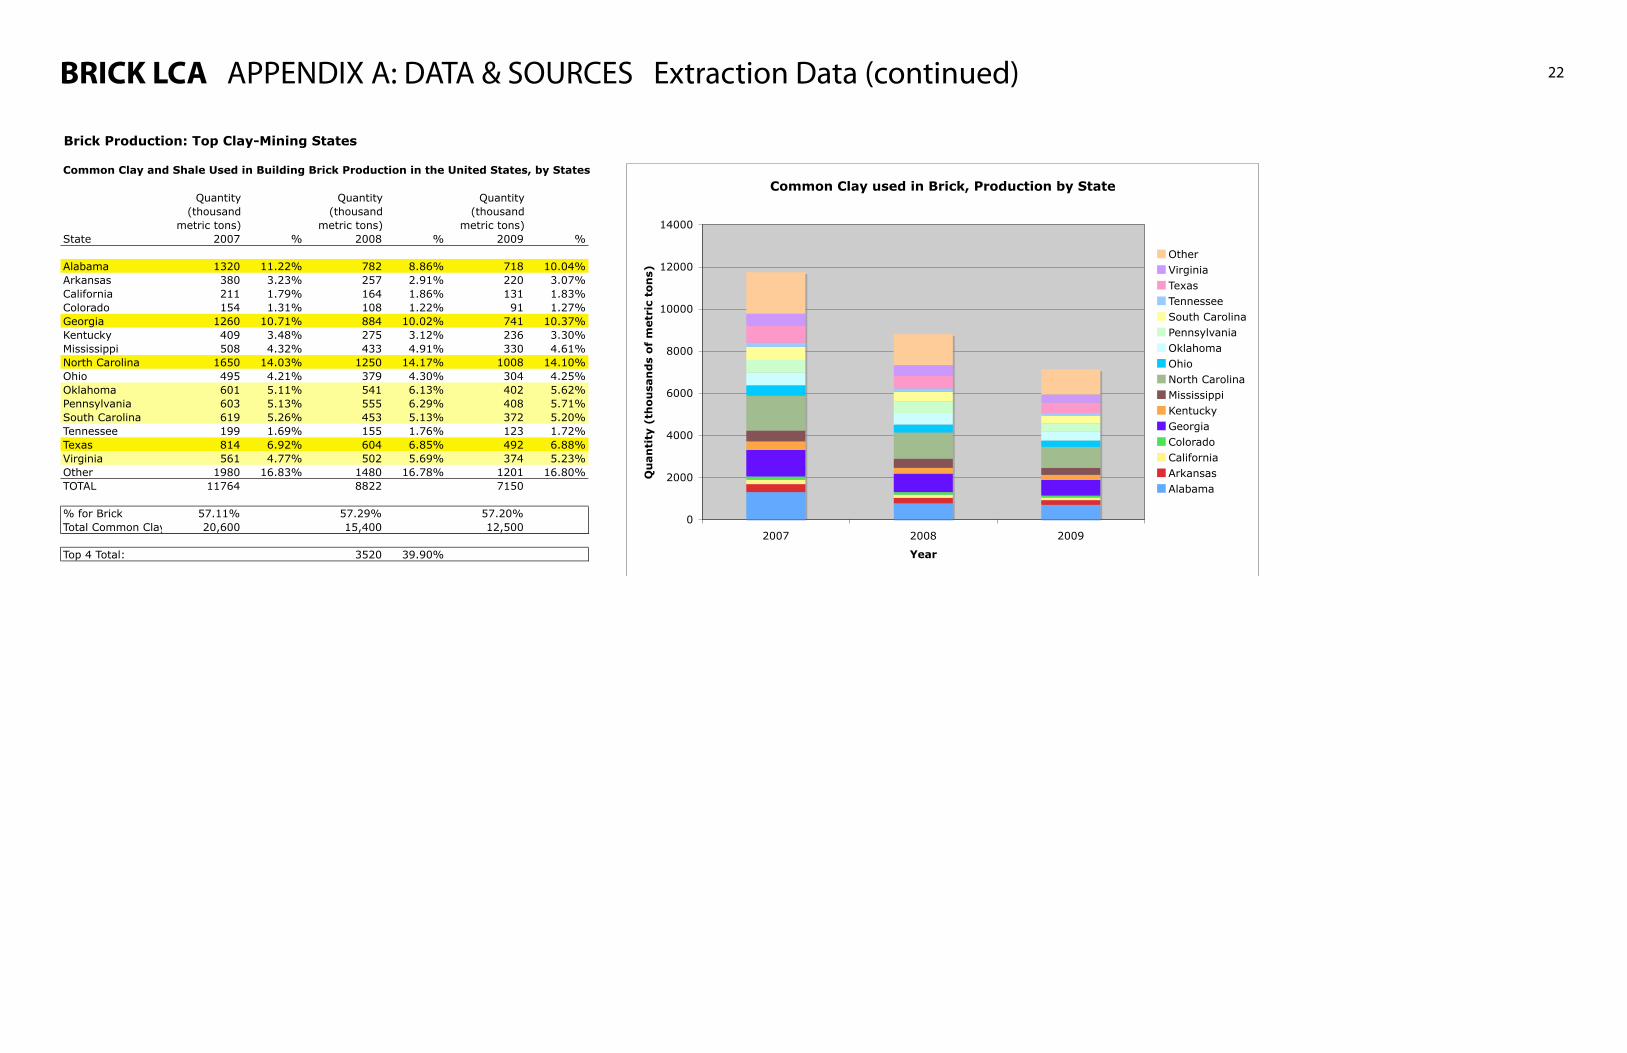
BRICK LCA APPENDIX A: DATA & SOURCES Extraction Data (continued) 22
Brick Production: Top Clay-Mining States
Common Clay and Shale Used in Building Brick Production in the United States, by States
Quantity (thousand
metric tons)
Quantity (thousand
metric tons)
Quantity (thousand
metric tons)State 2007 % 2008 % 2009 %
Alabama 1320 11.22% 782 8.86% 718 10.04%Arkansas 380 3.23% 257 2.91% 220 3.07%California 211 1.79% 164 1.86% 131 1.83%Colorado 154 1.31% 108 1.22% 91 1.27%Georgia 1260 10.71% 884 10.02% 741 10.37%Kentucky 409 3.48% 275 3.12% 236 3.30%Mississippi 508 4.32% 433 4.91% 330 4.61%North Carolina 1650 14.03% 1250 14.17% 1008 14.10%Ohio 495 4.21% 379 4.30% 304 4.25%Oklahoma 601 5.11% 541 6.13% 402 5.62%Pennsylvania 603 5.13% 555 6.29% 408 5.71%South Carolina 619 5.26% 453 5.13% 372 5.20%Tennessee 199 1.69% 155 1.76% 123 1.72%Texas 814 6.92% 604 6.85% 492 6.88%Virginia 561 4.77% 502 5.69% 374 5.23%Other 1980 16.83% 1480 16.78% 1201 16.80%TOTAL 11764 8822 7150
% for Brick 57.11% 57.29% 57.20%Total Common Clay Production20,600 15,400 12,500
Top 4 Total: 3520 39.90%
Common Clay used in Brick, Production by State
0
2000
4000
6000
8000
10000
12000
14000
2007 2008 2009
Year
Qu
an
tity
(th
ou
san
ds
of
metr
ic t
on
s)
OtherVirginiaTexasTennesseeSouth CarolinaPennsylvaniaOklahomaOhioNorth CarolinaMississippiKentuckyGeorgiaColoradoCaliforniaArkansasAlabama

BRICK LCA APPENDIX A: DATA & SOURCES Manufacturing Data 23
Manufacturing of Standard Bricks
Assessment #UA0022 Assessment #NC0352 Assessment #CO0578 Average / Overall Industry
Metric Units Quantity Source Quantity Source Quantity Source Quantity Source
ECONOMICMaterial cost $ / tonLabor cost $ / tonTotal cost $ / tonTotal sales dollars $17,000,000 [d] $8,000,000 [d] $22,000,000 [d]Total output bricks 118,000,000 [d] 160,000,000 [d] 42,000,000 [d]Total output tons 267,344 calc. 362,500 calc. 95,156 calc.Revenue per unit $ / brick $0.14 calc. $0.05 calc. $0.52 calc. $0.24 calculatedRevenue per ton $ / ton $63.59 calc. $22.07 calc. $231.20 calc. $105.62 calculated
ENVIRONMENTALEmissions to air GHG emissions lbs CO2e / ton 786.07 calculated GHG emissions from electricity lbs CO2e / ton 633.53 calculated GHG emissions from nat. gas lbs CO2e / ton 152.54 calculatedEnergy use MMBtu 454,973 [d] 575,030 [d] 162,902 [d] Electricity kWh 9,164,168 [d] 11,078,300 [d] 3,931,200 [d] Electricity % of total % 20.65% calc. 19.75% calc. 24.74% calc. 22% calculated Natural Gas MMBtu 361,040 [d] 461,477 [d] 122,607 [d] Nat. Gas % of total % 79.35% calc. 80.25% calc. 75.26% calc. 78% calculatedEnergy use per ton MMBtu / ton 1.67 calculated Electricity MMBtu / ton 0.12 calculated Natural Gas MMBtu / ton 1.30 calculatedEnergy use per unit Btu / brick 3855.70 calc. 3593.94 calc. 3878.62 calc. 3,776.09 calculated Electricity kWh / brick 0.0777 calc. 0.0692 calc. 0.0936 calc. 0.08 calculated Natural Gas Btu / brick 3059.66 calc. 2884.23 calc. 2919.21 calc. 2,954.37 calculatedWater use gal / ton
ETHICALInjury / illness rate cases per 100 employees 7.0 [a] relative to all occupations % 189.2% [a]Fatality rate per 100,000 / yr 2.2 [e] relative to all occupations % 66.7% [e]Annual wage (Cincinnati) Mean $ / yr $31,677 calculated Median $ / yr $31,483 calculated% of local avg. wage Mean % 75% calculated Median % 96% calculated
Sources
[b] National Mining Association (NMA), "Mining in North Carolina, 2004" (http://www.nma.org/pdf/states/nc2004.pdf)[c] National Mining Association (NMA), "Mining in North Carolina, 2007" (http://www.nma.org/pdf/states/econ/nc.pdf)
[e] U.S. Bureau of Labor Statistics (www.bls.gov) [cfch0008.pdf]
[g] U.S. Life-Cycle Inventory Database, “Limestone, at mine,” http://www.nrel.gov/lci/database/default.asp (accessed 26 September 2010)
Economic & environmental data from three US Dept. of Energy ITP Assessments. Ethical data from the US Bureau of Labor Statistics, as follows: wage data based upon "Clay Product & Refractory Manufacturing," NAICS code 327100; fatality data based upon the "Manufacturing" sector (see reference [e] below); injury/illness data based upon "Brick and structural clay tile manufacturing," NAICS code 327121.
[d] U.S. Dept of Energy, Energy Efficiency and Renewable Energy, Industrial Technologies Program, "IAC Assessment Statistics" (2010) (http://iac.rutgers.edu/database/statistics/?STATE=&CENTER=&YEAR_limit=%3C%3D&YEAR=2010&SIC=&NAICS=327121&search=Search)
[f] Robert L. Vitra, "2008 Minerals Yearbook: Clay and Shale [Advance Release]" (U.S. Geological Survey, September 2010), http://minerals.usgs.gov/minerals/pubs/commodity/clays/myb1-2008-clays.pdf
[h] Jim Mavis, “Water Use in Industries of the Future,” (U.S. Dept of Energy Office of Energy Efficiency and Renewable Energy, Industrial Technologies Program, July 2003), http://www1.eere.energy.gov/industry/mining/pdfs/water_use_mining.pdf
[a] U.S. Bureau of Labor Statistics, "Incidence rates of nonfatal occupational injuries and illnesses by industry and case types, 2008" (http://www.bls.gov/iif/oshwc/osh/os/ostb2071.pdf)

BRICK LCA APPENDIX A: DATA & SOURCES Manufacturing Data (continued) 24
[i] U.S. Energy Information Administration, http://www.eia.doe.gov/oiaf/1605/coefficients.html[j] U.S. EPA, http://cfpub.epa.gov/egridweb/ghg.cfm[m] U.S. Bureau of Labor Statistics, http://www.bls.gov/oes/current/naics4_327100.htm
EMISSION FACTORS Units Source
1 MMBTU natural gas = 53.06 kgCO2 [i]1 MWh electricity in Ohio = 1,538 lbsCO2 [j]1 MWh = 3412141.63 BTU [k]1 MMBTU = 1,000,000 BTU given1 MMBTU electricity in Ohio = 5247.26 lbsCO2 calculated1 kg = 2.2046226 lbs given1 MMBTU natural gas = 116.98 lbsCO2 calculated
[n] U.S. Bureau of Labor Statistics, May 2009 Occupational Employment and Wage Estimates: Metropolitan Area Cross-Industry Estimates, ftp://ftp.bls.gov/pub/special.requests/oes/oesm09ma.zip
Manufacturing of Standard Bricks
Assessment #UA0022 Assessment #NC0352 Assessment #CO0578 Average / Overall Industry
Metric Units Quantity Source Quantity Source Quantity Source Quantity Source
ECONOMICMaterial cost $ / tonLabor cost $ / tonTotal cost $ / tonTotal sales dollars $17,000,000 [d] $8,000,000 [d] $22,000,000 [d]Total output bricks 118,000,000 [d] 160,000,000 [d] 42,000,000 [d]Total output tons 267,344 calc. 362,500 calc. 95,156 calc.Revenue per unit $ / brick $0.14 calc. $0.05 calc. $0.52 calc. $0.24 calculatedRevenue per ton $ / ton $63.59 calc. $22.07 calc. $231.20 calc. $105.62 calculated
ENVIRONMENTALEmissions to air GHG emissions lbs CO2e / ton 786.07 calculated GHG emissions from electricity lbs CO2e / ton 633.53 calculated GHG emissions from nat. gas lbs CO2e / ton 152.54 calculatedEnergy use MMBtu 454,973 [d] 575,030 [d] 162,902 [d] Electricity kWh 9,164,168 [d] 11,078,300 [d] 3,931,200 [d] Electricity % of total % 20.65% calc. 19.75% calc. 24.74% calc. 22% calculated Natural Gas MMBtu 361,040 [d] 461,477 [d] 122,607 [d] Nat. Gas % of total % 79.35% calc. 80.25% calc. 75.26% calc. 78% calculatedEnergy use per ton MMBtu / ton 1.67 calculated Electricity MMBtu / ton 0.12 calculated Natural Gas MMBtu / ton 1.30 calculatedEnergy use per unit Btu / brick 3855.70 calc. 3593.94 calc. 3878.62 calc. 3,776.09 calculated Electricity kWh / brick 0.0777 calc. 0.0692 calc. 0.0936 calc. 0.08 calculated Natural Gas Btu / brick 3059.66 calc. 2884.23 calc. 2919.21 calc. 2,954.37 calculatedWater use gal / ton
ETHICALInjury / illness rate cases per 100 employees 7.0 [a] relative to all occupations % 189.2% [a]Fatality rate per 100,000 / yr 2.2 [e] relative to all occupations % 66.7% [e]Annual wage (Cincinnati) Mean $ / yr $31,677 calculated Median $ / yr $31,483 calculated% of local avg. wage Mean % 75% calculated Median % 96% calculated
Sources
[b] National Mining Association (NMA), "Mining in North Carolina, 2004" (http://www.nma.org/pdf/states/nc2004.pdf)[c] National Mining Association (NMA), "Mining in North Carolina, 2007" (http://www.nma.org/pdf/states/econ/nc.pdf)
[e] U.S. Bureau of Labor Statistics (www.bls.gov) [cfch0008.pdf]
[g] U.S. Life-Cycle Inventory Database, “Limestone, at mine,” http://www.nrel.gov/lci/database/default.asp (accessed 26 September 2010)
Economic & environmental data from three US Dept. of Energy ITP Assessments. Ethical data from the US Bureau of Labor Statistics, as follows: wage data based upon "Clay Product & Refractory Manufacturing," NAICS code 327100; fatality data based upon the "Manufacturing" sector (see reference [e] below); injury/illness data based upon "Brick and structural clay tile manufacturing," NAICS code 327121.
[d] U.S. Dept of Energy, Energy Efficiency and Renewable Energy, Industrial Technologies Program, "IAC Assessment Statistics" (2010) (http://iac.rutgers.edu/database/statistics/?STATE=&CENTER=&YEAR_limit=%3C%3D&YEAR=2010&SIC=&NAICS=327121&search=Search)
[f] Robert L. Vitra, "2008 Minerals Yearbook: Clay and Shale [Advance Release]" (U.S. Geological Survey, September 2010), http://minerals.usgs.gov/minerals/pubs/commodity/clays/myb1-2008-clays.pdf
[h] Jim Mavis, “Water Use in Industries of the Future,” (U.S. Dept of Energy Office of Energy Efficiency and Renewable Energy, Industrial Technologies Program, July 2003), http://www1.eere.energy.gov/industry/mining/pdfs/water_use_mining.pdf
[a] U.S. Bureau of Labor Statistics, "Incidence rates of nonfatal occupational injuries and illnesses by industry and case types, 2008" (http://www.bls.gov/iif/oshwc/osh/os/ostb2071.pdf)
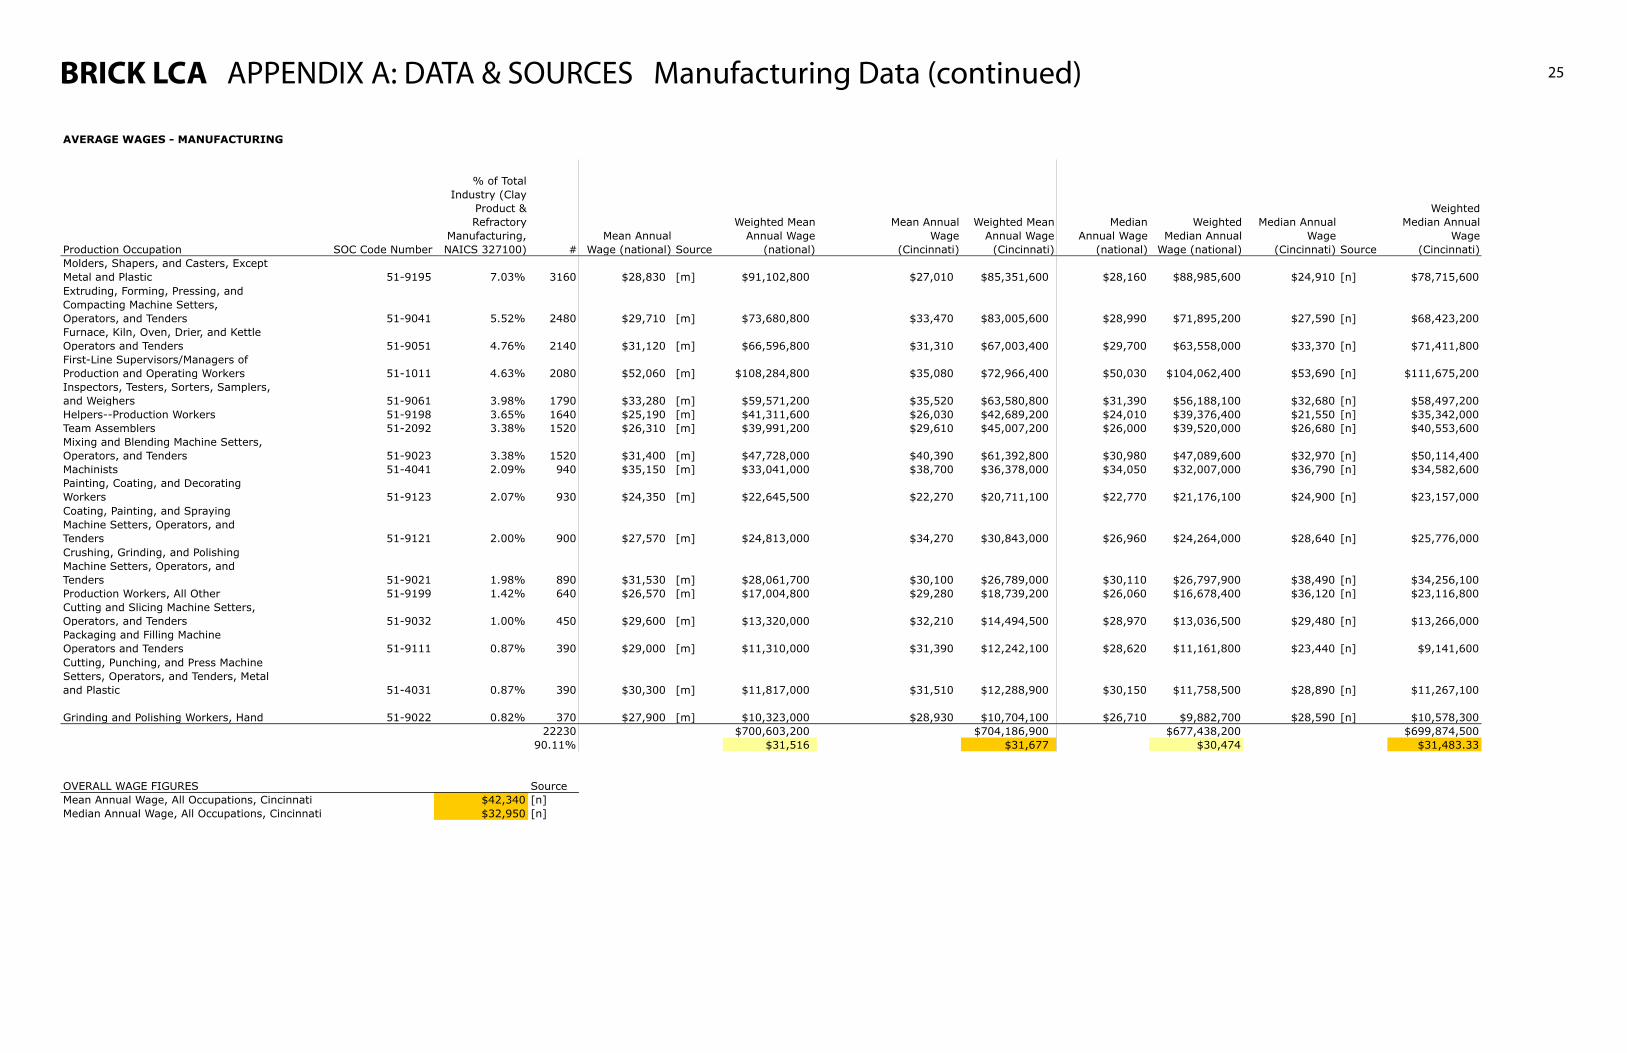
BRICK LCA APPENDIX A: DATA & SOURCES Manufacturing Data (continued) 25
AVERAGE WAGES - MANUFACTURING
Production Occupation SOC Code Number
% of Total Industry (Clay
Product & Refractory
Manufacturing, NAICS 327100) #
Mean Annual Wage (national) Source
Weighted Mean Annual Wage
(national)
Mean Annual Wage
(Cincinnati)
Weighted Mean Annual Wage
(Cincinnati)
Median Annual Wage
(national)
Weighted Median Annual
Wage (national)
Median Annual Wage
(Cincinnati) Source
Weighted Median Annual
Wage (Cincinnati)
Molders, Shapers, and Casters, Except Metal and Plastic 51-9195 7.03% 3160 $28,830 [m] $91,102,800 $27,010 $85,351,600 $28,160 $88,985,600 $24,910 [n] $78,715,600Extruding, Forming, Pressing, and Compacting Machine Setters, Operators, and Tenders 51-9041 5.52% 2480 $29,710 [m] $73,680,800 $33,470 $83,005,600 $28,990 $71,895,200 $27,590 [n] $68,423,200Furnace, Kiln, Oven, Drier, and Kettle Operators and Tenders 51-9051 4.76% 2140 $31,120 [m] $66,596,800 $31,310 $67,003,400 $29,700 $63,558,000 $33,370 [n] $71,411,800First-Line Supervisors/Managers of Production and Operating Workers 51-1011 4.63% 2080 $52,060 [m] $108,284,800 $35,080 $72,966,400 $50,030 $104,062,400 $53,690 [n] $111,675,200Inspectors, Testers, Sorters, Samplers, and Weighers 51-9061 3.98% 1790 $33,280 [m] $59,571,200 $35,520 $63,580,800 $31,390 $56,188,100 $32,680 [n] $58,497,200Helpers--Production Workers 51-9198 3.65% 1640 $25,190 [m] $41,311,600 $26,030 $42,689,200 $24,010 $39,376,400 $21,550 [n] $35,342,000Team Assemblers 51-2092 3.38% 1520 $26,310 [m] $39,991,200 $29,610 $45,007,200 $26,000 $39,520,000 $26,680 [n] $40,553,600Mixing and Blending Machine Setters, Operators, and Tenders 51-9023 3.38% 1520 $31,400 [m] $47,728,000 $40,390 $61,392,800 $30,980 $47,089,600 $32,970 [n] $50,114,400Machinists 51-4041 2.09% 940 $35,150 [m] $33,041,000 $38,700 $36,378,000 $34,050 $32,007,000 $36,790 [n] $34,582,600Painting, Coating, and Decorating Workers 51-9123 2.07% 930 $24,350 [m] $22,645,500 $22,270 $20,711,100 $22,770 $21,176,100 $24,900 [n] $23,157,000Coating, Painting, and Spraying Machine Setters, Operators, and Tenders 51-9121 2.00% 900 $27,570 [m] $24,813,000 $34,270 $30,843,000 $26,960 $24,264,000 $28,640 [n] $25,776,000Crushing, Grinding, and Polishing Machine Setters, Operators, and Tenders 51-9021 1.98% 890 $31,530 [m] $28,061,700 $30,100 $26,789,000 $30,110 $26,797,900 $38,490 [n] $34,256,100Production Workers, All Other 51-9199 1.42% 640 $26,570 [m] $17,004,800 $29,280 $18,739,200 $26,060 $16,678,400 $36,120 [n] $23,116,800Cutting and Slicing Machine Setters, Operators, and Tenders 51-9032 1.00% 450 $29,600 [m] $13,320,000 $32,210 $14,494,500 $28,970 $13,036,500 $29,480 [n] $13,266,000Packaging and Filling Machine Operators and Tenders 51-9111 0.87% 390 $29,000 [m] $11,310,000 $31,390 $12,242,100 $28,620 $11,161,800 $23,440 [n] $9,141,600Cutting, Punching, and Press Machine Setters, Operators, and Tenders, Metal and Plastic 51-4031 0.87% 390 $30,300 [m] $11,817,000 $31,510 $12,288,900 $30,150 $11,758,500 $28,890 [n] $11,267,100
Grinding and Polishing Workers, Hand 51-9022 0.82% 370 $27,900 [m] $10,323,000 $28,930 $10,704,100 $26,710 $9,882,700 $28,590 [n] $10,578,30022230 $700,603,200 $704,186,900 $677,438,200 $699,874,500
90.11% $31,516 $31,677 $30,474 $31,483.33
OVERALL WAGE FIGURES SourceMean Annual Wage, All Occupations, Cincinnati $42,340 [n]Median Annual Wage, All Occupations, Cincinnati $32,950 [n]

BRICK LCA APPENDIX A: DATA & SOURCES Transportation Data 26
Transportation (Common Clay)
Units Q Source Q Source Q Source Q Source Q Source Q Source Q Source Q Source
TRANSPORT INFODistance traveled miles 0 [3] 123 [2] 10.6 [2] 133.6 calc. 15 [4] 200 [5] 50 est. 265 calc.Type of transport N/A N/A road [3] road est. road road [4] road [4] road est. road
ECONOMICPer unit cost $ / ton-mile $0.251 [1] $0.251 [1] $0.251 [1] $0.251 [1] $0.251 [1] $0.251 [1]Total cost - source 1 $ / ton $0.00 $30.87 calc. $2.66 calc. $33.53 calc. $3.77 calc. $50.20 calc. $12.55 calc. $66.52 calc.Total cost - source 2 $ / ton N/A $62.50 [8] N/A $65.16 [8] N/A N/A N/A N/A
ENVIRONMENTALEmissions to air
GHG emissions lbs CO2-e / full truck load 0 [6,7] 455.1 [6,7] 39.22 [6,7] 494.32 55.5 [6,7] 740 [6,7] 185 [6,7] 980.5 calc.GHG emissions lbs CO2-e / ton 0 [14] 34.87 [14] 3.01 [14] 37.88 4.25 [14] 56.70 [14] 14.18 [14] 75.13 calc.
Energy use MMBTU / ton NO DATA NO DATA NO DATA NO DATA NO DATA NO DATA NO DATA NO DATAWater use gal / ton NO DATA NO DATA NO DATA NO DATA NO DATA NO DATA NO DATA NO DATA
ETHICALInjury / illness rate cases per 100 employees NO DATA 5.5 [11]
relative to all occupations % NO DATA 148.6% [11]Fatalities per 100,000 employees NO DATA 18.3 [12]
relative to all occupations % NO DATA 554.5% [12]Annual wage (Cincinnati)
Mean $ / yr $39,180 [10] $39,260 [9]Median $ / yr $37,770 [10] $37,730 [9]
% local avg. wageMean % 97.2% calc. 92.7% calc.Median % 118.7% calc. 114.5% calc.
Sources Transit type Cost Units Source[1] http://people.hofstra.edu/geotrans/eng/ch3en/conc3en/modaltransportcosttonmile.html Water 0.007 $/ton-mile[1][2] Google Maps (www.google.com/maps) Rail 0.025 $/ton-mile[1][3] http://www.hansonbrick.com/en/builder/green_leed.php Road 0.251 $/ton-mile[1]
Air 0.588 $/ton-mile[1]
[5] Brick Industry Association, "Sustainability and Brick," June 2009, http://www.gobrick.com/BIA/technotes/TN48.pdf[6] U.S. EPA, http://www.epa.gov/otaq/climate/420f05003.htm Environmental Impacts - Diesel Fuel[7] Lawrence Livermore National Laboratory, https://www.llnl.gov/news/newsreleases/2010/NR-10-02-08.html Diesel 22.2 lbs CO2 per gal[6][8] U Ship Price Estimator, http://www.uship.com/price_estimator.aspx?v=0&z1=40380&z2=45220&w=12000&c=417&s=150 Gasoline 19.4 lbs CO2 per gal[6][9] U.S. Bureau of Labor Statistics, http://www.bls.gov/oes/current/oes533032.htm Semi truck efficiency 6 mpg [7][10] U.S. Bureau of Labor Statistics, http://data.bls.gov:8080/oes/datatype.do CO2 per mile 3.7 lbs CO2 per mile
Conversions[13] U.S. EPA, http://www.epa.gov/otaq/toxics.htm 1 semi = 12 pallets brick[14] http://www.pioneersand.com/wholesale/flagstone/flagstone.htm 1 pallet brick = 480 bricks
1 brick = 4.5313 lbs1 pallet bricks = 2175 lbs1 pallet brick = 1.0875 tons1 semi = 13.05 tons
[4] Brick Institute of America, as cited in "Building With Brick," Boral Bricks, Inc., December 2009, http://boralbricks.com/images/Users/1/PastelCote/News/WhitePaperSustainable_BoralLetterhead.pdf
[12] U.S. Bureau of Labor Statistics, "Census of Fatal Occupational Injuries Charts, 1992-2009," http://www.bls.gov/iif/oshwc/cfoi/cfch0008.pdf
Transportation distances from calculations (in the case of site-specific data) and general industry sources (in the case of general industry data). Economic data from "The Geography of Transportation Systems" (see source [1] below) and the "U Ship Price Estimator" (see source [8] below). Environmental (emission) data calculated based upon vehicle miles traveled and emission factors from the EPA, assuming a fuel efficiency of 6mpg for a laden semi truck. Ethical data from the U.S. Bureau of Labor Statistics, as follows: wage data based upon "Truck Drivers, Heavy and Tractor-Trailer" (see references [9, 10] below); injury/illness and fatality data based upon "General Freight Trucking, Long Distance" (see references [11, 12] below).
Manufacture to assembly
Assembly to disposal
General Industry Data (Brick in the U.S.)Site-Specific Data (Brick to Cincinnati, Ohio)Extraction to manufacture
Manufacture to assembly
[11] U.S. Bureau of Labor Statistics, "Incidence rates of nonfatal occupational injuries and illnesses by industry and case types, 2008" (http://www.bls.gov/iif/oshwc/osh/os/ostb2071.pdf)
Assembly to disposal
Extraction to manufactureTOTAL TOTAL

BRICK LCA APPENDIX A: DATA & SOURCES Composition of a Brick Wall 27
Composition of a Brick Wall
Component % Source Quantity Units Source
Composition of Brick WallBy VolumeStandard brick 71.07% [d] 0.2677 c.f. brick [d]Mortar (type N) 28.93% [d] 0.1090 c.f. mortar [d]By WeightStandard brick 68.59% [e] 0.0161 tons / s.f. wall [e]Mortar (type N) 31.41% [e] 0.0074 tons / s.f. wall [e]
per tonBy Material Used in ProductionClay & bottom ash 85% [a] 1700 lbs / ton calc.Water 15% [b] 300 lbs / ton calc.Manganese negligible [a, b] 0 lbs / ton calc.By MassClay 99.2% [f] 1984 lbs / ton calc.Bottom ash 0.08% [f] 1.6 lbs / ton calc.
Composition of Type N Mortar by VolumePortland cement 9.4% calc. 3.375 c.f. [c]Hydrated lime 9.4% calc. 3.375 c.f. [c]Sand 56.3% calc. 20.25 c.f. [c]Water 25.0% [f] 9.00 c.f. calc.TOTAL 100.0% calc. 36.00 c.f. calc.
Composition of Portland CementLimestone 71.7% calc. 1.17 kg [g]Cement rock / marl 12.9% calc. 0.21 kg [g]Clay 3.7% calc. 0.06 kg [g]Shale 3.1% calc. 0.05 kg [g]Sand 2.5% calc. 0.04 kg [g]Slag 1.2% calc. 0.02 kg [g]Iron / iron ore 0.6% calc. 0.01 kg [g]Fly ash 0.6% calc. 0.01 kg [g]Bottom ash 0.6% calc. 0.01 kg [g]Foundry sand 0.2% calc. 0.004 kg [g]Slate 0.1% calc. 0.001 kg [g]Gypsum 2.9% calc. 0.048 kg [g]TOTAL 100.0% calc. 1.633 kg calc.
Reuse 25% [f] 500 lbs / ton calc.Recycle 49% [f, h] 975 lbs / ton calc.Landfill 26% [f, h] 525 lbs / ton calc.TOTAL 100% calc.
Sources
[d] calculated based upon data from R.S. Means (www.meanscostworks.com)
[f] BEES 4.0, "Generic Brick and Mortar"[g] BEES 4.0, "Generic Concrete Products with Portland Cement"
[a] http://www.mc2-ice.com/support/estref/popular_conversion_files/ masonry/mortar.htm[b] http://www.umich.edu/~bricks/brickwebsite/setting_drying/ setting_drying_page3.htm[c] http://www.mc2-ice.com/support/estref/popular_conversion_files/ masonry/mortar.htm
[e] calculated based upon data from R.S. Means (www.meanscostworks.com) and http://www.reade.com/Particle_Briefings/spec_gra2.html
End of Life Trajectories
Composition of Brick
[h] utilizes a 65% recovery rate of daily infeed, based upon data from H. Hafner & Sons, http://www.hafners.com. Further research is needed to determine in this rate is typical.

Sector #32712A: Brick, tile, and other structural clay product manufacturingEconomic Activity: $1 Million DollarsDisplaying: Economic ActivityNumber of Sectors: Top 10
Change Inputs (Click here to view greenhouse gases, air pollutants, etc...)
Documentation:The environmental, energy, and other data used and their sources.Frequently asked questions about EIO-LCA.
This sector list was contributed by Green Design Institute.
Sector Total
Economic$mill
Total ValueAdded$mill
Employee CompVA
$mill
Net TaxVA
$mill
ProfitsVA
$mill
DirectEconomic
$mill
DirectEconomic
%
Total for all sectors 1.83 0.994 0.526 0.034 0.433 1.42 77.6
32712ABrick, tile, and other structural clay productmanufacturing
0.992 0.580 0.294 0.005 0.282 0.992 100.0
550000 Management of companies and enterprises 0.080 0.050 0.042 0.001 0.006 0.058 72.0
221200 Natural gas distribution 0.050 0.017 0.004 0.003 0.009 0.046 92.8
420000 Wholesale trade 0.047 0.033 0.018 0.008 0.007 0.028 58.6
221100 Power generation and supply 0.040 0.027 0.008 0.005 0.014 0.032 80.0
211000 Oil and gas extraction 0.037 0.019 0.002 0.003 0.013 0.000 1.35
33299C Other fabricated metal manufacturing 0.024 0.011 0.007 0.000 0.004 0.023 95.3
531000 Real estate 0.017 0.013 0.001 0.002 0.010 0.004 24.6
324110 Petroleum refineries 0.017 0.001 0.000 0.000 0.000 0.006 36.1
325190 Other basic organic chemical manufacturing 0.017 0.003 0.002 0.000 0.000 0.010 60.3
$ Millions used in : Brick, tile, and other structural clay product manufacturing
Hide Graph
If you are using this output as part of a project or paper, please cite appropriately.
Carnegie Mellon University Green Design Institute. (2010) Economic Input-Output Life Cycle Assessment (EIO-LCA) US 2002 (428) model [Internet], Available from:<http://www.eiolca.net/> [Accessed 24 Oct, 2010]
© Green Design Institute, Carnegie Mellon University, 2010.
Sector #32712A: Brick, tile, and other structural clay product manufacturingEconomic Activity: $1 Million DollarsDisplaying: EnergyNumber of Sectors: Top 10
Change Inputs (Click here to view greenhouse gases, air pollutants, etc...)
Documentation:The environmental, energy, and other data used and their sources.Frequently asked questions about EIO-LCA.
This sector list was contributed by Green Design Institute.
Sector Total Energy
TJ CoalTJ
NatGasTJ
PetrolTJ
Bio/WasteTJ
NonFossElecTJ
Total for all sectors 31.4 7.52 17.0 4.14 0.589 2.15
32712A Brick, tile, and other structural clay product manufacturing 23.3 4.07 14.6 3.02 0.114 1.50
221100 Power generation and supply 4.34 3.16 0.925 0.154 0 0.102
325190 Other basic organic chemical manufacturing 0.407 0.051 0.156 0.056 0.123 0.022
211000 Oil and gas extraction 0.347 0 0.283 0.029 0 0.034
486000 Pipeline transportation 0.296 0 0.225 0 0 0.071
324110 Petroleum refineries 0.286 0.000 0.076 0.185 0.014 0.010
322130 Paperboard Mills 0.227 0.021 0.047 0.010 0.134 0.016
331110 Iron and steel mills 0.182 0.108 0.050 0.002 0.000 0.022
484000 Truck transportation 0.140 0 0 0.138 0 0.001
482000 Rail transportation 0.112 0 0 0.110 0 0.002
Millions of kilowatt-hours (MkWh) used in : Brick, tile, and other structural clay product manufacturing
Hide Graph
If you are using this output as part of a project or paper, please cite appropriately.
Carnegie Mellon University Green Design Institute. (2010) Economic Input-Output Life Cycle Assessment (EIO-LCA) US 2002 (428) model [Internet], Available from:<http://www.eiolca.net/> [Accessed 24 Oct, 2010]
© Green Design Institute, Carnegie Mellon University, 2010.
Sector #32712A: Brick, tile, and other structural clay product manufacturingEconomic Activity: $1 Million DollarsDisplaying: Greenhouse GasesNumber of Sectors: Top 10
Change Inputs (Click here to view greenhouse gases, air pollutants, etc...)
Documentation:The environmental, energy, and other data used and their sources.Frequently asked questions about EIO-LCA.
This sector list was contributed by Green Design Institute.
Sector Total
t CO2e CO2 Fossil
t CO2e CO2 Process
t CO2e CH4
t CO2e N2O
t CO2e HFC/PFCst CO2e
Total for all sectors 2010 1860 30.2 108. 9.89 8.74
32712A Brick, tile, and other structural clay product manufacturing 1350 1350 0 0 0 0
221100 Power generation and supply 356.0 351.0 0 0.965 2.18 2.26
211000 Oil and gas extraction 57.9 16.3 10.6 31.0 0 0
212100 Coal mining 43.8 4.94 0 38.9 0 0
486000 Pipeline transportation 24.7 11.3 0.031 13.4 0 0
221200 Natural gas distribution 18.4 1.66 0 16.7 0 0
325190 Other basic organic chemical manufacturing 17.8 15.9 0 0 1.83 0
324110 Petroleum refineries 17.1 17.0 0 0.053 0 0
331110 Iron and steel mills 15.7 5.94 9.69 0.096 0 0
484000 Truck transportation 10.3 10.3 0 0 0 0
Metric Tons of CO2 Equivalent (MTCO2E) used in : Brick, tile, and other structural clay product manufacturing
Hide Graph
If you are using this output as part of a project or paper, please cite appropriately.
Carnegie Mellon University Green Design Institute. (2010) Economic Input-Output Life Cycle Assessment (EIO-LCA) US 2002 (428) model [Internet], Available from:<http://www.eiolca.net/> [Accessed 24 Oct, 2010]
© Green Design Institute, Carnegie Mellon University, 2010.
Sector #32712A: Brick, tile, and other structural clay product manufacturingEconomic Activity: $1 Million DollarsDisplaying: Toxic ReleasesNumber of Sectors: Top 10
Change Inputs (Click here to view greenhouse gases, air pollutants, etc...)
Documentation:The environmental, energy, and other data used and their sources.Frequently asked questions about EIO-LCA.
This sector list was contributed by Green Design Institute.
Sector CarcinogensMg C2H3Cl
eq
Non-carcinogensMg C2H3Cl eq
Respiratoryinorganicskg PM2.5
eq
OzoneDepkg
CFC-11eq
Respiratoryorganics
kg C2H4 eq
Aquaticecotoxicity
Gg TEGwater
Terrestrialecotoxicity
Gg TEGsoil
Terrestrialacid/nutrikg SO2 eq
Aquaticacidif
kg SO2eq
Aquaticeutro
kg PO4P-lim
Total for all sectors 165. 1700 0.828 0.363 14.0 468. 387. 102. 817. 0.010
2122A0Gold, silver, andother metal oremining
147.0 1530 0.009 0 0.000 14.3 49.0 1.10 0.317 0
221100Power generationand supply
6.36 67.8 0.032 0 0.007 26.3 22.2 3.90 41.2 0
32712A
Brick, tile, andother structuralclay productmanufacturing
3.42 1.07 0 0 0.269 2.26 6.74 0 739.0 0
212230Copper, nickel,lead, and zincmining
3.15 49.7 0.000 0 0.002 351.0 248.0 0.018 0.019 0
331411Primary smeltingand refining ofcopper
2.74 29.8 0.000 0 0.000 55.7 28.2 0.000 0.007 0
212100 Coal mining 0.635 6.92 0.021 0 0.000 2.59 3.19 2.58 0.892 0
562000Waste managementand remediationservices
0.507 4.96 0.000 0.000 0.002 5.11 8.18 0.000 0.008 0.010
33299COther fabricatedmetalmanufacturing
0.221 0.007 0.003 0.062 0.936 0.102 0.076 0.359 0.267 0
325188All other basicinorganic chemicalmanufacturing
0.094 2.32 0.040 0.077 0.038 0.633 2.11 4.96 1.70 0.000
33131A
Alumina refiningand primaryaluminumproduction
0.082 0.645 0.011 0.021 0.013 0.302 0.644 1.36 1.06 0.000
Kilograms (kg) used in : Brick, tile, and other structural clay product manufacturing
Hide Graph
If you are using this output as part of a project or paper, please cite appropriately.
Carnegie Mellon University Green Design Institute. (2010) Economic Input-Output Life Cycle Assessment (EIO-LCA) US 2002 (428) model [Internet], Available from:<http://www.eiolca.net/> [Accessed 24 Oct, 2010]
© Green Design Institute, Carnegie Mellon University, 2010.
BRICK LCA APPENDIX A: DATA & SOURCES EIOLCA Data & Comparison 28
Summary Table (Source for Charts)
ECONOMIC ENVIRONMENTAL ETHICAL
Injury / Illness rate
Fatality Rate
Mean Annual Wage
Median Annual Wage
US $ per ton) % of totallbs CO2-e per ton % of total
gallons per ton % of total
Cases per 100 emp.
Per 100,000 emp.
Cincinnati; 2010 US $
Cincinnati; 2010 US $
Extraction $45 6% 0.10 0% 2000 95% 3.4 12.7 $41,922 $39,977Manufacturing $106 14% 786.07 95% 0 0% 7.0 2.2 $31,677 $31,483Construction $527 70% 0.00 0% 100 5% 4.6 18.3 $50,110 $51,070OperationEnd of Life $12 2% 0.04 0% 0 0% 5.5 25.2 $37,290Transportation $65 9% 37.88 5% 0 0% 5.5 18.3 $39,180 $37,770TOTAL / AVG. $754 100% 824.10 100% 2100 100% 3.7 3.3 $42,340 $32,950
Comparison to EIOLCA: Economic Activity & GHG Emissions
ECONOMIC ACTIVITY GREENHOUSE GAS EMISSIONS
This Analysis EIOLCA This Analysis EIOLCA
Cost (US $ per ton) % of total
Cost without Const., EOL, or Transp.
% without Const., EOL, or Transp.
Economic Activity (millions of $) % of total
GHG Emissions (lbs CO2-e per ton) % of total
GHG Emissions (metric tons CO2-e) % of total
GHG Emissions without Power Gen.
% without Power Gen.
Extraction $44.81 5.9% $44.81 29.8% 0.037 2.8% 0.10 0.0% 0.0 0.0% 0.0 0.0%Manufacturing $105.62 14.0% $105.62 70.2% 1.033 78.2% 786.07 95.4% 1350.0 70.6% 1350.0 96.9%Construction $526.88 69.8% 0.00 0.0%End of Life $11.84 1.6% 0.04 0.0%Transportation $65.16 8.6% 37.88 4.6% 10.3 0.5% 10.3 0.7%Power Generation & Supply Chain
0.04 3.0% 517.9 27.1%
Other 0.211 16.0% 33.5 1.8% 33.5 2.4%TOTALS $754.31 100.0% $150.43 100.0% 1.321 100.0% 824.10 100.0% 1911.7 100.0% 1393.8 100.0%
Cost GHG Emissions Water Use