life cycle assessment of lawnmowers
TRANSCRIPT

Life Cycle Assessment of Lawnmowers
- Two Mowers’ Case Studies
Master’s Thesis in Environmental Measurements and Assessments
XING LAN
YU LIU
Department of Energy and Environment
Division of Environmental System Analysis
CHALMERS UNIVERSITY OF TECHNOLOGY
Göteborg, Sweden 2010
Report No. 2010:11


MASTER’S THESIS (2010:11)
Life Cycle Assessment of Lawnmowers
Master’s Thesis in the Master Programme of Environmental Measurements and Assessments
XING LAN
YU LIU
Department of Energy and Environment
Division of Environmental System Analysis
CHALMERS UNIVERSITY OF TECHNOLOGY
Göteborg, Sweden 2010


Life Cycle Assessment of Lawnmowers
-Two Mowers’ Case Studies
Master’s Thesis in the Environmental Measurements and Assessments
XING LAN
YU LIU
© XING LAN & YU LIU, 2010
ISSN 1404-8167
Master’s Thesis 2010:11
Department of Energy and Environment
Division of Environmental System Analysis
Chalmers University of Technology
SE-412 96 Göteborg
Sweden
Telephone: + 46 (0)31-772 1000


i
Preface
This Master thesis has been conducted in collaboration with Husqvarna AB and Center for
environmental assessment and material systems (CPM) in Gothenburg, Sweden. During the
period between September 2009 and April 2010, the project was performed in the division of
Environmental Systems Analysis (ESA) at Chalmers University of Technology, with a pause
during 2009’s Christmas.
The work has been supervised and guided by Emma Rex in CPM and Professor Anne-Marie
Tillman in ESA has been responsible for the examination process. We would like to take this
opportunity to show our deepest appreciation for the help they have given us throughout this
project. Although the processes were not so easy, we did enjoy the meetings and discussions
with Emma, and nice weather as well.
The participating personnel in Husqvarna AB and Husqvarna UK should be also
acknowledged. Without their help, data collection would not be possible. Besides, people in
ESA gave us really valuable suggestions and sometimes they were really inspiring. We would
say thanks to all, including the coffer machine.
Last but certainly not least, we both would like to thank each other, our loving family and
friends for their support.
Göteborg, May 2010
Xing Lan
Yu Liu

ii

iii
Life Cycle Assessment of Lawnmowers
-Two Mowers’ Case Studies
Master’s Thesis in the Environmental Measurements and Assessments
XING LAN
YU LIU
Department of Energy and Environment
Division of Environmental System Analysis
Chalmers University of Technology
Abstract Husqvarna AB, as a leading outdoor power company, has chosen two typical lawnmowers to
analyse their environmental impacts from lawnmower branch. These two, one is the
traditional walk-behind lawnmower LC48VE and the other one is named Automower 220AC.
The distinct characteristic between these two is that the former one is petrol-driven while the
latter is electricity-driven. Besides, the traditional one needs people’s control while the other
can be programmed and work without external manpower. Due to the highly different
working patterns and market consideration, the results for two cases will not be compared.
The main reason for putting them together is for further product development and internal life
cycle thinking auxiliary. Life cycle assessment was used to evaluate the environmental
impacts of these two chosen products from production, use and maintenance and end-of-life
phases.
Data collection was the most time consuming part of the whole procedures and database in
SimaPro were widely used but some processing data were still missing. The result shows that
production phase which is also covering raw material extraction and use phase together
contribute dominant environmental impacts. The characterisation and weighting methods as
EPS2000 and Eco-indicator 99 were applied and shown difference in final results because of
the different emphasis of each method. Sensitivity analysis showed that increasing the share
of recycled metals could make better environmental performances of both mowers while
electricity productions in different countries have obvious impacts on Automower’s impacts.
In terms of product development, the most common way of using life cycle perspectives is
through life cycle thinking (LCT) in design chain, in this case, which could mean increase of
the ratio of recycled materials and improvement of products’ durability.

iv

v
Table of Contents
MASTER’S THESIS IN ENVIRONMENTAL MEASUREMENTS AND ASSESSMENTS .................................... I
1. INTRODUCTION ......................................................................................................................... 1
1.1 BACKGROUND ............................................................................................................................. 1
1.2 LCA IN GENERAL .......................................................................................................................... 1
2. GOAL AND SCOPE DEFINITION ................................................................................................... 3
2.1 GOAL ......................................................................................................................................... 3
2.2 SCOPE ........................................................................................................................................ 3
2.2.1 Options................................................................................................................................ 3
2.2.2 Initial flowchart ................................................................................................................... 4
2.2.3 Functional unit .................................................................................................................... 4
2.2.4 Impact assessment ............................................................................................................. 4
2.2.5 System boundaries .............................................................................................................. 5
3. CASE OF LAWNMOWER LC48VE ................................................................................................. 7
3.1 INVENTORY ANALYSIS .................................................................................................................... 7
3.1.1 Flowchart ............................................................................................................................ 7
3.1.2 General data ....................................................................................................................... 7
3.1.3 Production......................................................................................................................... 12
3.1.4 Transport........................................................................................................................... 19
3.1.5 Use and maintenance ....................................................................................................... 19
3.1.6 End-of-life ......................................................................................................................... 21
3.2 IMPACT ASSESSMENT .................................................................................................................. 22
3.2.1 Characterisation ............................................................................................................... 22
3.2.2 Weighting ......................................................................................................................... 23
3.3 SENSITIVITY ANALYSIS .................................................................................................................. 26
3.4 DISCUSSION .............................................................................................................................. 27
3.5 CONCLUSION ............................................................................................................................. 27
4. CASE OF AUTOMOWER 220AC ................................................................................................. 29
4.1 INVENTORY ANALYSIS .................................................................................................................. 29
4.1.1 Flowchart .......................................................................................................................... 29
4.1.2 General data ..................................................................................................................... 30
4.1.3 Production......................................................................................................................... 31
4.1.4 Transport........................................................................................................................... 37
4.1.5 Use .................................................................................................................................... 37
4.1.6 End-of-life ......................................................................................................................... 37
4.2 IMPACT ASSESSMENT .................................................................................................................. 38
4.2.1 Characterisation ............................................................................................................... 38
4.2.2 Weighting ......................................................................................................................... 40
4.3 SENSITIVITY ANALYSIS .................................................................................................................. 41
4.4 DISCUSSION .............................................................................................................................. 44

vi
4.5 CONCLUSION ............................................................................................................................. 45
5. DISCUSSION ............................................................................................................................. 46
6. LCA APPLICATION..................................................................................................................... 48
6.1 METHODOLOGY APPLICATION ....................................................................................................... 48
6.2 DATA COLLECTION STRATEGY ......................................................................................................... 49
6.3 RECOMMENDATION .................................................................................................................... 50
7. CONCLUSIONS ......................................................................................................................... 51
REFERENCE....................................................................................................................................... 52

1
1. Introduction
1.1 Background
Husqvarna AB is the world’s largest outdoor power products production company, the major
products including lawn mowers, chainsaws, garden tractors, trimmers and blowers. It is one
of the leaders in construction and stone industries in the world. It is also the leader of
consumer European irrigation equipments. The products are distributed and sold in more than
100 countries (Husqvarna AB, 2009).
Husqvarna is actively engaged in being part of the environmental solutions by its products and
processes’ development. Since environmental awareness is increasingly important in the
manufacturing industry and also for consumers.
The company has expressed their environmental concerns in several aspects. For example,
they have already issued Eco-Smart TM
technology on several products which were assessed as
aspects of materials, fuel consumption, fuel type, lubricant, emissions, vibrations, packaging,
recyclability and noise and Eco-Smart approach has been applied on current 10 products by far.
For example X-TORQ is one of these solutions which have less fuel consumption and low
emissions.
As the commitment of its environmental responsibility, the company considers starting up
systematic LCA work in the organization. Experimental assessment had been made on
chainsaws ten years ago. Besides the company also wants to keep on its leader position, since
the industrial competitions are making efforts on the improvement of environmental
performance of products and the legislation. Marketing also needs the focus about the
environmental performance of products and could be supported by the LCA.
1.2 LCA in general
Life cycle assessment, the abbreviation of which is LCA, is defined as the “compilation and
evaluation of inputs, outputs and potential environmental impacts of a product system
throughout its life cycle” in ISO14040. The life cycle includes the extraction of resources,
processing of materials and product parts, manufacturing of products, use of products and the
waste management with all the transports involved in the system, therefore, well known as
“cradle to grave” (Baumann & Tillman, 2004).
In Figure 1 the boxes illustrate the procedural steps and the black arrows shows the order while
the white for the possible iterations. The first step is to identify the objective and determine the
work plan of LCA study. After flowchart designing, data collection, multifunctional processes
allocation and final calculation, the main result is an inventory about the “quantified inputs and
outputs in terms of per functional unit”. And the life cycle impact assessment (LCIA) refers to

2
define a list of impact categories and select “models for relating the environmental
interventions to suitable category indicators for these impact categories”. Then the modeling
results are calculated in the characterisation step which is a compulsory step in ISO14040 while
the followings including weighting are optional processing ways for inventory, and “there is no
best available method”. (Guinée, 2002). In this case weighting is used to get a dimensional
index to give a direct view of the product’s environmental performance while the aggregation
will sacrifice the details and competence of environmental information. Finally, in
interpretation phase all the choices, assumptions and analytical results will be evaluated “in
terms of soundness and robustness” and then drawn the “overall conclusion”, while the
interactions between each steps make the LCA procedures as a whole.
Figure 1 The LCA procedures (Baumann & Tillman, 2004).
Figure 2 gives illustration on how to aggregate inventory input (resources, energy, etc.) and
output (emissions, etc.) data into defined impact categories and further to one single index.
Figure 2 The life cycle impact assessment illustration (Baumann & Tillman, 2004).
For companies, the fundamental characteristic of LCA as analytical tool is to provide
information for decision making, to identify the improvement possibilities, and to
communicate for marketing reasons.
Goal and scope definition
Inventory analysis
Impact assessmentCharactersation
Weighting
Interpretation
Inventory Charactersation Weighting
CO2 Global warming weighting index
CH4
NOX Acidification
SO2
HCl …
…

3
2. Goal and scope definition
2.1 Goal
The goal of this LCA study was to evaluate the environmental performances of two chosen
products: lawn mowers running on petrol and automowers using electricity power, and to give
recommendations for making LCA studies in Husqvarna, including discussion about its
applicability in the company.
Two tasks have been done in this report:
Investigation of the environmental impacts of these two products;
Suggestions of improvement in internal LCA implementation and application.
The main intended audiences of the report are personnel in Husqvarna including the product
designers and the decision makers. In the long run, LCA studies can also be used for
communication with consumers and research and development (R&D) phase to improve
environmental performance of products.
Since this company is at the beginner level on LCA study, its environmental manager firstly
wants to have a report about the environmental impacts of products and bring more focus on
environmental management at company level as well as consideration at product development
phase. Therefore, it’s not comparison work which is called as “change-oriented LCA” but an
accounting task based on the purpose of the commissioner.
2.2 Scope
2.2.1 Options
Two products have been selected according to the consideration of Husqvarna. And pictures of
these two products are shown in Figure 3.
Lawnmower LC 48VE with petrol engine which is assembled in Höör, Sweden
Automower 220 AC which is assembled in Newton Aycliffe, UK.
Figure 3 Pictures of lawnmower LC48VE and Automower 220 AC.

4
2.2.2 Initial flowchart
Figure 4 Rough flow chart of the products.
2.2.3 Functional unit
The functional unit is used to link the input and output during the quantum of the products’
environmental performance. In this case, mowing 1000 m2 lawn (Swedish lawn in south of
Sweden) for 10 years was defined as functional unit. The important concerns are energy usage
and environmental impact. And in the following context, the f.u. is the abbreviation for
functional unit.
2.2.4 Impact assessment
Characterisation
Impact categories were used in the characterisation phase and the data from the inventory are
aggregated into a number of impact categories. To quantify the environmental impact in each
category, equivalency factor which has been defined after cause-effect chain modeling is used.
(Baumann & Tillman, 2004). For example, as many emissions could contribute to
acidification and the acidification potential (AP) of 1 kg SO2 can be set as baseline, while
5
others like 1kg NOX and 1kg HCl has the same AP as 0.7kg and 0.88kg SO2, respectively.
Thus, the result of acidification category should be the sum of the quantity of SO2 equivalents,
SO2 inclusive. In later characterisation sections, the abbreviated unit- “kg eqv/f.u” means kg
specific equivalent per functional unit in each category.
In ISO standard, the equivalency factors were named as category indicators and in this case
the impact categories are selected according to the SETAC-WTA2 list (SETAC-Europe, 1996):
Depletion of abiotic resources
Global warming
Ozone depletion potential
Human toxicity
Ecotoxicity
Photochemical ozone creation potential (POCP)
Acidification
Eutrophication
In this case, the data for land use category are not collected directly but from the background
data in the database.
Microsofte Office EXCEL has been used as the data store and basis for calculations.
Foreground data have been collected from Husqvarna, suppliers and waste management
company, while the background dataset available are from professional software, LCA
database, and previous LCA studies.
Weighting
CML, Eco-indicator 99, EDIP and EPS2000 are some of the most popular LCIA methods today.
In this case, EPS2000 and Eco-indicator 99 were chosen for the weighting.
EPS2000, developed by CPM (center for environmental assessment of product and material
system) was chosen because the EPS system is aimed to be a tool for a company’s internal
product development process. It may be used externally and for other purposes, like for
environmental declarations, for purchasing decisions, for education or for environmental
accounting, but in those cases, the knowledge of the EPS system and its features and limitations
is crucial (CPM, 2010). EPS is based on willingness-to-pay to avoid environmental damages
(Baumann & Tillman, 2004) and impact is expressed in a monetary value called “ELU”
(Environmental load units).
Eco-indictor 99 is also a widely used method and the purpose of using two methods is to let the
company to see the different result with different analysis ways. Eco-indicator 99 is based on
distance-to-target principle.
2.2.5 System boundaries
The whole life cycle of lawnmowers, namely from raw material extraction to waste

6
management, was covered. The LCA studies included accounting environmental performances,
“hot-spot” analysis, and sensitivity analyses.
Transports from the central warehouses to retailers, from retailers to consumers and from
consumers to waste treatment plants were not included. The recycling data have been
discussed in the study. Environmental impacts from the capital goods manufacturing, such as
machines used in the manufacturing of the vehicles, were not considered, nor were impacts
from activities of employees.
Geographical and time boundary
The Automower 220 AC is assembled in Newton Aycliffe, UK while Lawnmower LC 48VE is
in Höör, Sweden. However, most parts of the product are purchased globally and the products
would be retailed by Husqvarna’s wholesale network. Therefore the geographical boundary
was defined as global. But the use site point is set to be in south Sweden. And for transport, the
NTM data have been selected to evaluate the environmental impacts (NTM, 2009).
According to the company, regarding the use phase of the product, the life span of Automower
220 AC is 10 years (Gustvasson, 2009) and for LC 48 VE is 250 hours (Edman, 2009). Since
the site is south Sweden where the grass growth period is from May to September, 5 months per
year and working time per month is 5 hours, the life span of LC 48 VE in this case is also 10
year. Therefore the time boundary is 10 years covering the use phase.
Data collection and quality
Data collection is one of the most time consuming activities in LCA (Baumann & Tillman,
2004). There is no one universal principle for it yet. However, some planning suggestions were
followed:
For most of raw materials production phase, general data were used. For processing phase, data
were as far as possible obtained from Husqvarna and first tier suppliers by personal
communication and internal documents, some general data were used as well. Regarding
end-of-life treatment, data were collected from Renova AB (Renova AB, 2010).
Result interpretation
Sensitivity analysis aims to find the theoretical sensitivity for indicators which could identify
the specific potential of improvement. In dominance analysis phase, “hot-spot” will be found
to investigate what parts of the life cycle take the dominant environmental impacts.
Normalization and weighting both are optional in LCA; however in this case weighting was
chosen because the final single index will help the decision maker to have a complementary
view of the environmental performance of products as integrated “result”.

7
3. Case of lawnmower LC48VE
3.1 Inventory analysis
The life cycle of the lawnmower LC48VE was divided into these phases:
Production: components production and assembly in Höör
Transport involved in purchase and wholesale
Use and maintenance
End-of-life (EOL)
Detail descriptions for these phases are in the following Flowchart part.
3.1.1 Flowchart
Figure 5 shows the simplified flowchart of lawnmower LC48VE. The production phase
includes the processes that happened before all the components and materials arriving at Höör,
as well as the steel components manufacturing processes in Höör. Raw material extraction,
transport and other processing procedures were included. The production process would be
divided into several modules according to Husqvarna’s internal Alpha modular system and
each module includes several components. The grey box represents processes occurring in
Höör, where the main steel components were produced and assembly happened, and the
powdering process was included in the assembly part.
Transport phase covers the processes in both components purchase and products wholesale, but
excluded transports happened in retail processes. Besides, the transport happened in raw
material extraction, purchased by suppliers can be only approached in data base, which were
defined as background transport and were accounted to each module’s environmental impacts
in this case. And the process in dotted box indicates the processe which has been omitted.
Use and maintenance statics data were from Husqvarna, while end-of-life data were base on
telephone interview with Kurtl Lindman in Renova, a Swedish waste treatment company and
assumptions.
3.1.2 General data
Raw material
For LC48VE, Husqvarna purchased many components while only manufactured main steel
parts and assembled both in Höör. The data collection processes mainly focused on the direct
supplied components’ raw material origins, processing impacts and transport from suppliers to
Husqvarna and from Husqvarna to different central warehouse. In this case, average data, not
the site-specific of raw material production were adopted. Thus the technological differences
existed in different sites were omitted due to the data completeness limitation.

8
Figure 5 Flowchart of lawnmower LC48V (processes in dotted boxes excluded)
Raw material production processes in this case were divided into 2 categories; one is labeled
with lower case letter “r” as r1 and the other with capitalized letter “R” as R1, R2 and so on.
Take steel alloy production R1 for example:
Steel alloy: Husqvarna bought different kinds of steel alloy components or as raw material, and
most are steel alloy sheet. The steel alloy A517b with zinc electroplated in SimaPro 7.1
database was selects as reprehensive for all kinds of steel alloy being used since the dominant
steel alloys from SSAB are with the most similar chemical compositions, seen in Table 1 and
Table 2, while steel wire and stainless steel were exceptions and would be discusses later
separately.
Table 1 Chemical compositions of steel sheet Dogal Form 36.
Steel grade C max Si Max Mn max P max S max Cr max Altot max
Dogal Form 36 (%) 0.004 0.030 0.20 0.020 0.015 0.050 0.020
(SSAB,Swedish Steel, 2008)
Raw material
production
Raw material
production
Raw material
production
Raw material
production
Raw material
production
Raw material
production
Raw material
production
Raw material
production
Transport Transport Transport Transport Transport Transport Transport Transport
Steel
production
Chassis
module
components
Handle module
components
Power module
components
Axle &
suspension
components
Branding
components
Fasteners
manufacturin
g
Packaging
components
Transport Transport Transport Transport Transport Transport Transport Transport Transport
Transport
Raw material
productionWholesale
Raw material
production
Transport Transport Transport
Petrol and
lubricant
production
Retail
Extra Blades
manufacturin
g
Transport Transport Transport
Use
Transport
Landfil l Incineration Recycling
AssemblyComponents
manufacturing
Production
End of Life
Transport
Use
Production
(in Höör)

9
Table 2 Chemical compositions of steel sheet A517b.
Material content in 1kg A517b
Steel 0.9797 kg
Manganese 0.01 kg
Silicon 0.003 kg
Molybdenum 0.002 kg
Chromium 0.005 kg
Vanadium 0.0003 kg
Titanium 0.0001 kg
Table 2 is from SimaPro database, but only the compositions of steel A517b were given based
on average statics data from all suppliers in Western Europe for 1995-1999 with transport data
not included. This simplified list could not be used directly in inventory. Thus, in this case, the
way adopted was to trace back each kind of material or substance to find detailed input and
output of each material and substance. The impact of A517b was assumed the sum of the
environmental impacts to produce these materials and substances. Data were still Western
Europe average data between 1995 and 1999 covering ore extraction, processing and transport
processes.
The flowchart of steel alloy production R1 was assumed as Figure 6 according to its
compositions and processing step, electroplating labeled with zinc electroplating (P3). The
lower case letter “r” processes generally include each material or substances’ extraction,
processing and what was called background transport as before.
Figure 6 Flowchart of R1 steel alloy production.
Steel wire: Beside steel alloy sheet, steel wire components were also used in LC48VE and the
data from Gabi 4 Education were used as world average. For steel wire production R2, steel
billet production were the major material need to trace back and the processing included ore
extraction, transport, heating and rolling and drawing.
r1 r5 r6 r7 r8 r9 r10 r11
p3
Electroplating
R1
Steel alloy
Steel
production
Mn
production
Si
production
Mo
production
Cr
production
V
production
Ti
production
Zn
production
Transport

10
Figure 7 Flowchart of R2 steel wire production.
Stainless steel: The same method was used for stainless steel production R16 as steel alloy R1,
while with different chemical compositions approached from SimaPro database. Transport and
processing data were omitted due to lack of data.
Figure 8 Flowchart of R16 stainless steel production.
Aluminum alloy: The material analysis report for lawnmowers in Husqvarna (Husqvarna,
2009)shows that there exist two kinds of Al alloy, ADC12 and EN46000. ADC12 is the
material no. from Japanese Industrial Standards (JIS) system and as equivalent of EN
AC-46100 in European Standard system. Its EN denomination is G-AlSi12Cu (Misumi Europe),
while EN46000 is G-AlSi9Cu3 (Fe)(Ericsson). The chosen average LCA data for these two
different alloys were G-Al12Cu and G-Al8Cu3 from SimaPro database, respectively, while data
in Table 3 and
Table 4 are based on average data from all suppliers in Western Europe for 1990-1994, and
transport data are not included. Meanwhile, the material and substances traced back data
covered ore extraction, processing and transport processes.
Ore extraction
Transportation
Heating and rolling
Drawing
r2
R2
Steel wire
Steel billet production
Transport
Processing
r1 r4 r5 r6 r14 r15
R16
Stainless
steel
Steel
production
Stainless steel
scrap production
Transport
Processing
Mn
productio
Ni
production
Si
production
Ferrochromium
production

11
Table 3 Chemical compositions of Al ADC12.
Material content in 1 kg Al ADC12
Aluminum ingots 0.706 kg
Aluminum recycled 0.15 kg
Silicon 0.12 kg
Copper 0.01 kg
Steel 0.008 kg
Manganese 0.003 kg
Magnesium 0.003 kg
Table 4 Chemical compositions of Al EN46000.
Material content in 1 kg Al ADC12
Aluminum ingots 0.714 kg
Aluminum recycled 0.15 kg
Silicon 0.08 kg
Copper 0.03 kg
Zinc 0.012 kg
Steel 0.008 kg
Manganese 0.004 kg
Magnesium 0.002 kg
Figure 9 Flowchart of R3-Al ADC12 production.
r3 r4 r5 r6 r12 r13 r1
R3
Al ADC12
production
Mn
production
Si
production
Cu
production
Al ingots
production
Recycled Al
production
Steel
production
Transport
Processing
Mg
production

12
Figure 10 Flowchart of R4-Al EN46000 production.
Plastic: R5-Polypropylene (PP) granulate, R6-Acrylonitrile butadiene styrene (ABS)
granulate R7-Polyvinyl chloride (PVC) granulate R8-Polyamide 6 (PA6) granulate and R9-PA6
30GF. All of these data were obtained from SimaPro 7.1, and inventory data of R4-R9
production are based on average Western Europe data for 1995 to 1999, transport data are not
included.
Others: R10-Rubber, R11-Zinc, R12-Copper, R13-Crude iron steel, R1-sulfuric acid and
R15-Lead.
Electricity production
Electricity production in different countries and regions are based on different energy sources.
In this study electricity consumption was considered in Sweden. Swedish sources is considered
as nuclear (46.5%), oil (2.06%) and hydro electricity (51.44%)(Baumann & Tillman, 2004)
3.1.3 Production
Chassis module
The lawnmower chassis module consists of several materials, mainly steel and plastic while the
detailed weights of each component were listed in Table 5, and Figure 11 shows the specific
flowchart for chassis module. The processes in the grey box, in terms of what happened in
Höör, were included in assembly part and the same for all the following modules.
Table 5 Material compositions of chassis module per functional unit.
Materials Weight(kg)
Steel alloy 13.182
Steel wire 0.628
Aluminum 0.291
Plastic-PP 4.17
Plastic-ABS 0.545
Plastic-PVC 0.159
r3 r4 r5 r6 r11 r12 r13 r1
R4
Al EN46000
production
Al ingots
production
Recycled Al
production
Steel
production
Transport
Processing
Mn
productio
Si
production
Zn
production
Cu
production
Mg
production

13
Chassis, the main part of this module was made from steel EN 10327 or DX54D Z100 (Dogal
Form 36 with zinc coating thickness 7um at per side) and manufactured in Höör. In sheet
production phase, 1% loss was assumed mainly due to cold forming and electroplating zinc
processes.
For the rest steel wire components: grass bag frame, axle rear discharge and spring, while
processes include iron mining, steel billets making and heating and rolling for wires, 5% loss
was assumed for the components processing.
Plastic components PP, PVC and ABS were made from each specific granulate with injection
mould processes P1which was assumed to be the same for all the plastic components. While
the losses of granulate production were excluded, the loss during the injection processes were
assumed as 3%. This loss rate was based on the interview with (Foster, 2010) in Husqvarna
UK, which produced most of the plastic components for their products.
Then for Aluminum components, from Huqavarna internal material report (Husqvarna, 2009),
the Al used in chassis module is EN46000. The major process P2 being considered in this case
is alloy forging. 1% loss was assumed as happened in forging process and the alloy production
loss was not taken into consideration.
And the loss ratio settings were the same for all the modules as followed in production phase.
Figure 11 Specific flowchart of chassis module.
Handle module
The lawnmower handle module also consists of mainly steel alloy, steel wire, aluminum and
plastics while the detailed weights of each material are listed in Table 6, and Figure 12 shows
the specific flowchart for handle module. P2 represents the aluminum forging process and is
R1 R2 R4 R5 R6 R7
Transport Transport Transport Transport Transport Transport
P2 P1 P1 P1
Transport Transport Transport Transport Transport Transport
Powdering
Processing
blade
Chassis
production
Injection
moulding
Injection
moulding
Injection
moulding
Chassis module
Processing Aluminum
forging
Steel alloy
production
Steel wire
production
PP granulate
production
ABS granulate
production
PVC granulate
production
Al EN46000
production

14
about the energy used to transform materials as both ADC12 and EN46000. And the data is
also average data and from a project named IDEMAT2001 from Delft University of
Technology. And the data been used for the plastics processing was still P1 injection mould.
Table 6 Material compositions of handle module per functional unit.
Materials Weight(kg)
Steel alloy 4.957
Steel wire 0.594
Aluminum 0.279
Plastic-PP 0.055
Plastic-PA+PA30GF 0.11
Rubber 0.04
Figure 12 Specific flowchart of handle module.
Axle and suspension module
Plastics components were still processed from granulate and the mould injection (P1) and Al
EN46000 were forged from other substances and materials as P2 showed. The impacts here
for steel alloy components and steel wire components basically were assumed from raw
material production impacts due to lack of processing data and major transport data from raw
material suppliers. Figure 13 shows the specific flowchart for axle and suspension module.
R1 R2 R4 R5 R8 R9 R10
Transport Transport Transport Transport Transport Transport Transport
P2 P1 P1 P1
Transport Transport Transport Transport Transport Transport
powdering
Rubber
production
Processing
PA6 granulate
production
Injection
moulding
PA30GF granulate
production
Injection moulding
Processing
handel assy
collect
Processing
handel support
Handle module
Injection
moulding
PP granulate
production
Steel wire
production
Al EN46000
production
Aluminum
forging
Steel alloy
production
Processing

15
Figure 13 Specific flowchart of axle and suspension module.
Power module
The major parts of power module are engine, gearbox and starter battery. All the data
available from suppliers are only the chemical composition of these components, which could
be seen in Table 7 and
Table 8. The battery is lead-acid battery, and manufacturing data is based on one battery life
cycle study (Rantik, 1999).
Table 7 Material compositions of engine per functional unit.
Material Weight(kg)
Aluminum-ADC12 5.453
Steel
2.1411
Iron
1.6412
Plastic
1.1902
Copper
0.1138
Zinc
0.0096
Rubber
0.0362
Miscellaneous 0.2944
Table 8 Material compositions of battery per functional unit.
Material Weight(kg)
Grease
0.035
H2SO4
0.15
Other
0.1255
Pb
0.55
PbO2 0.2
R1 R2 R4 R5 R8 R9
Transport Transport Transport Transport Transport Transport
P2 P1 P1 P1
Transport Transport Transport Transport Transport
Processing Processing
powdering
Axle & suspension module
Processing Aluminum
forging
Injection
moulding
Injection
moulding
Injection
moulding
Steel alloy
production
Steel wire
production
Al EN46000
production
PP granulate
production
PA granulate
production
PA30GF
granulate
production

16
Figure 14 Specific flowchart of power module.
R1
R9
R5
R3
R12
R13
R14
R10
R11
R15
R16
R12
R7
Transport
Transport
Transport
Transport
Transport
Transport
Transport
Transport
Transport
Transport
Transport
Transport
Transport
P1
P1
P2
Transport
Transport
Transport
Transport
Transport
Transport
Transport
Transport
Transport
Transport
Transport
Transport
Transport
Transport
Transport
Processing
Crude iron
production
Processing
Processing
belt guide
Processing
battery
Injection
moulding
Injection
moulding
Alum
inum
forging
Steel alloy
production
PP
granulate
production
PA
30GF
granulate
production
Al A
DC
12
productionC
u production
Processing
engine
po
we
r mo
du
le
PV
C granulate
production
H2 S
O4
production
Processing
Cu
production
P3
PV
C extrusion
Steel E
TH
S
production
Processing
Zn
production
Processing
Lead
production
Processing
Rubber
production
Processing
17
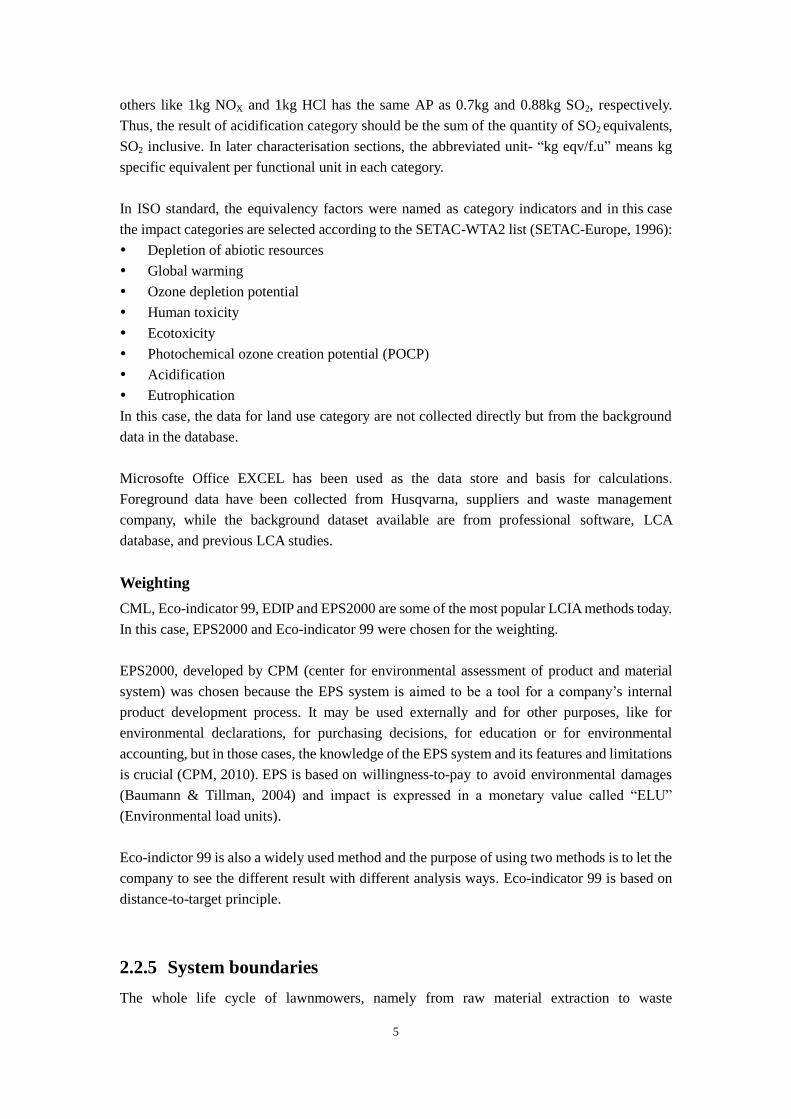
Branding module
In this module, 3 groups can be divided: plastic components, stainless steel skid plate and the
wheel. Processing of rubber and steel was omitted since the weights are too small compared
with the total weight of the lawnmower.
Figure 15 Specific flowchart of branding module.
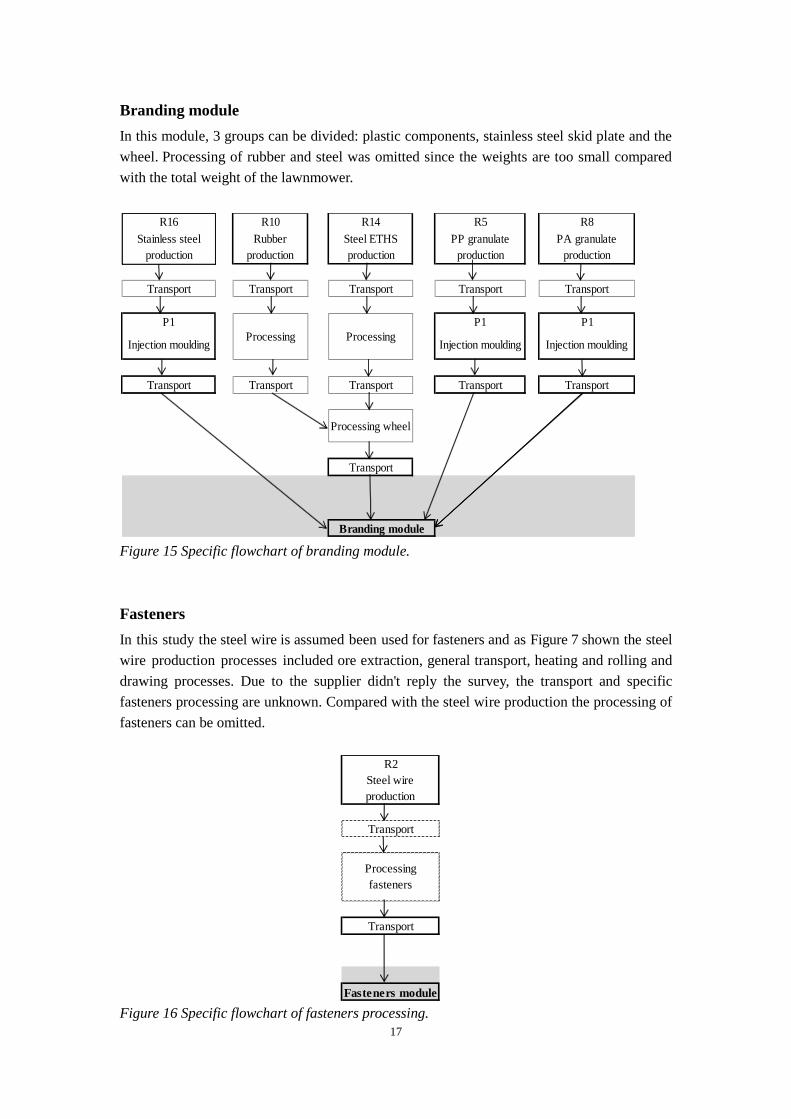
Fasteners
In this study the steel wire is assumed been used for fasteners and as Figure 7 shown the steel
wire production processes included ore extraction, general transport, heating and rolling and
drawing processes. Due to the supplier didn't reply the survey, the transport and specific
fasteners processing are unknown. Compared with the steel wire production the processing of
fasteners can be omitted.
Figure 16 Specific flowchart of fasteners processing.
R16 R10 R14 R5 R8
Transport Transport Transport Transport Transport
P1 P1 P1
Transport Transport Transport Transport Transport
Processing wheel
Transport
Stainless steel
production
Injection moulding
Branding module
Processing Processing
PA granulate
production
Injection moulding
PP granulate
production
Injection moulding
Steel ETHS
production
Rubber
production
R2
Transport
Transport
Fasteners module
Steel wire
production
Processing
fasteners

18
Packaging
Table 9 Material compositions of packaging module per functional unit.
Parts name Material composition Weight(kg)
Carton Corrugated cardboard 5.50
Manual Virgin material paper 0.20
Production of wood containing uncoated paper (94% dry matter) mainly from thermo
mechanically produced wood pulp with some bleached sulphate cellulose in one factory in
Switzerland .This kind of paper is mainly used in printing industry.
Assembly
As the assembly work is finished in Höör, it was accompanied with the main steel components
processed as well as the powdering process. The capital goods and human resources were not
taken into considerations.
Figure 17 Specific flowchart of assembly.
Energy, as electricity, has been already allocated in Höör: 4.32 kWh for each piece of product
which covers steel processing, powdering and assembly (Johan, 2010). Electricity use is the
Swedish average data from the IEA statistics (Baumann & Tillman, 2004).
The powder in use is named phosphate zinc and for each unit 0.13kg was used (Edman, 2009).
The specific powder production data have not been found, then the reaction between Zn and
phosphate acid is assumed as:
Zn+H3PO4→H2+ Zn3(PO4)2
In this case, zinc production (R11) represented world average data and background transport
covering delivery to Rotterdam with technology in 2000. R31 phosphoric acid production was
Transport Transport Transport Transport
Transport Transport
Use
Modules
components
Components
processingAssemblyPowdering
Electricity
production
Wasted
material
R1
Steel alloy
production
R31
Phosphoric acid
production
R11
Zinc production

19
on German total aggregated system inventory covering production from calcium phosphate
and sulfuric acid. No land use and capital equipments were accounted.
3.1.4 Transport
Transport phase calculations were based on communication with Monica Arvidsson and Carl
Risholm in Husqvarna AB. Only first tier suppliers were taken into considerations in this
phase and the basic assumptions for procurement were that transport in Europe were with
truck while outside of Europe were with ship (Risholm, 2009). While for wholesale, external
logistic companies were used to distribute the mowers from the factory in Höör to different
locations in Europe in 2009 and trucks of 13.6 loading meter were assumed to use (Arvidsson,
2009). All the goods are transported by truck with semi-trailer (13.6 loading meter included in
this category), long distance transport based on the assumption that 70% load capacity is used
which included empty return transports (NTM, 2002).
The aggregated data of input and output of transport phase are given in Table 10. The data
include the fuel consumption and major emissions from the vehicles, and also energy
requirements and emissions from production and distribution of the fuel. This fuel gives Euro 3
emission which is significantly lower than standard fuel, and components or products with
oversea transport are transported by medium sized ship (NTM, 2002). The environment impact
of construction of vehicles, roads, or other infrastructure is not included. The data is based on
fuel of environmental class 1 (more than 90% of the fuel sold in Sweden is of this type).
Table 10 Inventory of the transport per functional unit.
Wholesale Suppliers Total Unit
INPUT
Diesel 0.884 1.376 2.260 l/f.u.
OUTPUT
Energy 31.654 49.257 80.911 MJ/f.u.
CO2 2286.120 360.196 2646.316 g/f.u.
NOX 14.508 70.955 85.463 g/f.u.
HC 2.066 3.033 5.099 g/f.u.
Particulate matter 0.251 2.509 2.760 g/f.u.
CO 2.022 3.856 5.878 g/f.u.
SO2 0.572 43.498 44.070 g/f.u.
3.1.5 Use and maintenance
Use phase description
In the goal and scope definition phase, the functional unit and the system boundaries have been
decided, which are maintenance of 1000 m2 lawn in Sweden during 10 years. And the

20
maximum working hours for LC48VE is 250 hours (Ahlund, 2009), while the grass growth
period in Sweden is 5 months, the working hours for LC48VE per week is:
t =(250ℎ/10𝑦𝑒𝑎𝑟)/(12𝑚𝑜𝑛𝑡ℎ𝑠/𝑦𝑒𝑎𝑟)
4𝑤𝑒𝑒𝑘𝑠/𝑚𝑜𝑛𝑡ℎ= 1.25ℎ/𝑚𝑜𝑛𝑡ℎ𝑠
Besides, the cutting length for LC48VE is 48cm, which means the velocity is:
μ=(1000𝑚2
0.48𝑚/1.25ℎ) = 1.67𝑘𝑚/ℎ
And which would not exceed the engine’s maximum velocity 5.4 km/h.
Emissions and fuel consumption
When fuel consumption calculated, the data was based on the scenario that the engine worked
under half of maximum load with intermediate 3060 revolution per minute (Edman, 2009) .
And the emission data was from environmental approval of Brigg & Statton Corporations.
Table 11 Input and output of LC48VE’use during the whole life cycle per functional unit.
The basic maintenance for LC48VE includes the lubricant usage and blade replacement (Johan,
2010), and during the 250 hours life time, one LC48VE needs 4.2l engine oil as well as 2 pieces
of extra blades. Figure 18 illustrates the use phase of LC48VE. P25 petrol production is about
the unleaded petrol in Europe stock (ETH-ESU, 1996). P26 lubricant production is found in
CPM database which was one study on rapeseed oil for use as hydraulic oil in forest machines
in Sweden (Marby, 1999). P27 HDPE bottles production includes blow mounding process,
production of PE resin, transport of the resin to the converter, the conversion process itself
and packaging of the finished product for onward dispatch (Plastics Europe, 2005).
INPUT Unit
Petrol 219.75 l
Engine oil 4.2 l
Blade 2 pieces
OUTPUT
CO2 173.08 kg
HC 3.07 kg
NOX 0.77 kg

21
Figure 18 Flowchart of use phase.
3.1.6 End-of-life
There is no data availiable for how waste companies treat the old lawnmowers. So based on
literature research and telephone interview with Lindman in Renova, the local waste treatment
company. Figure 19 shows the flowchart for end-of-life phase and scenario is as following:
For plastics, all the plastics can be assumed to be incineranated (Lindman, 2010). All the metal
would went through scrappers being separated as well as the metal in batteries, and they can be
recycled (Lindman, 2010). Since in one previous end-of-life study about vehicles the recycling
rate is calculated as 97%, the same rate is used in this situation. In this case the metals
considered as recyclable included Al, steel and lead in the mower. Recycling of lead-acid
batteries is done by the blust-furnace process. Inventory data bout the incineration and
recycling processes were taken as European average level.
Figure 19 Flowchart of end-of-life phase.
Transport Transport Transport Transport Transport
Transport Transport Transport Transport
Transport
Use
R1
Steel alloy
production
P2
Petrol production
R26
Lubricant
production
RetailExtra blade
processing
Raw material
production
P27
HDPE bottles
production
Raw material
productionWholesale
Use
Transport
P6 Plastic &
P8 Paper
Incineration
Landfill
P5 Plastics, P7 Paper
P9 Battery, P10 Steel &
P11 Al Recycling

22
3.2 Impact assessment
3.2.1 Characterisation
Table 12 shows the total result covering production, transport, use and maintenance and end
of life phases. Potential contributions to environment in the chosen categories are shown in
Figure 20. Generally the production and use phase together always have dominant impacts on
the environment compared with the others. The negative value for photochemical ozone
creation potential (POCP) mainly comes from the use phase. The reason for this is because of
the NOX emission from the lawnmowers, since NO has obvious positive performance in this
impact. That means NO will decrease the potential of photochemical ozone creation. As can be
seen, transport part also shows negative value in POCP column due to NO emissions from fuel
consumption.
Table 12 Life cycle impacts of lawnmower LC48VE per functional unit.
Category Unit Weight
Depletion of abiotic resources kg Sb eqv 5.07
Acidification kg SO2 eqv 2.49
Global warming kg CO2 eqv 321
Eutrophication kg PO43-
eqv 0.884
POCP kg ethylene eqv 0.0291
Human toxicity kg 1,4-DCB eqv 1280
Ecotoxicity kg 1,4-DCB eqv 19.2
Ozone depletion potential kg CFC-11 eqv 0.000913
Figure 20 Characterisation results from the whole life cycle of Lawnmower LC48VE.
-20%
0%
20%
40%
60%
80%
100%
End of life
Use
Transport
Production

23
If traced back in the production phase, the main contributors of the environment impacts could
be found as power module and chassis module.
Figure 21 Characterisation results from the production phase of Lawnmower LC48VE.
3.2.2 Weighting
The results of two weighting methods are shown in Table 13, and one thing needs to be noted is
that Eco-indicator 99 and EPS2000 are based on different principles and weighting factors.
Thus the values of the results can not be compared in absolute number. But EPS2000 and
Eco-indicator 99 both represented the same as the characterisation result illustrated: use and
production take dominant impacts. Graphic illustrations can be seen in Figure 22.
Table 13 Results according to different weighting methods.
Total Production Transport Use End-of-life Unit
EPS 2000 297.7 139.9 1.5 145.3 11 ELU
Eco-indicator 99 37.6 7.5 0.3 28.2 1.6
-20%
0%
20%
40%
60%
80%
100%Assembly
Power module
Packaging
Handel module
Fasteners
Chassis module
Branding module
Axle &Suspension module

24
Figure 22 Weighting results of LC48VE’s life cycle impacts according to EPS2000 and
Eco-indictor 99.
The chassis and power module together take the overwhelming majority of total environmental
impacts, while Figure 23 illustrates the contribution of each source in production phase and use
phase. The power module in production phase contributes 43% of total impacts in this phase,
followed by chassis module as almost 40%. And in use phase, due to continuous petrol
consumption the crude oil needed majorly for petrol consumption took more than 60% of total
and followed by CO2 emissions, 15%. One thing needs to be mentioned is that noise can be
taken into calculation in EPS2000 and the noise factor for each vehicle is 0.00253 (ELU/
kilometres). In this case, only the noise generated during use phase. For LC48VE in 10 years
life time span, the velocity as calculated in use phase is 1.67km/h, so the environment impacts
can be evaluated as:
Noise =1.67𝑘𝑚
ℎ× 250ℎ × 2.53 × 10−3𝑘𝑚 = 1.056
And the impact of the noise as can be seen in Figure 23 is insignificant.
Figure 23 Weighting results of production phase and use phase according to EPS2000.
product-
ion
47%
Transpo
-rtation
0.513%
Use
49%
End of
life
4%
EPS2000
product
i-on
20%
Transp
o-rt
1%
Use
75%
End of
life
4%
Eco-indicator 99
0%
20%
40%
60%
80%
100%
Production phase
Assembly
Power module
Packaging
Handel module
Fasteners
Chassis module
Branding module
Axle &Suspension module
0%
20%
40%
60%
80%
100%
Use phase
Nosie
CO2 Emission
Water ConsumptionOil consumptionIron ore
Cu ore
Others

25
Digging into the impacts sources of power module and chassis module in production phase,
copper consumption and iron ore consumption were the major contributors respectively. Due to
the weighting factor differences (for copper ore is 208ELU/kg and for bauxite is 0.449 ELU/kg)
the copper with smaller weight than Al have bigger impacts although. For the chassis
production large amount of steel have been used, and that could explain why iron ore
consumption contributed more than 40% of chassis module’s total impact with iron
consumption’s weighting factor 1.23 ELU/kg. EPS2000 emphasized the depletion of resources
and the other is that huge gaps between the weighting factors could explain had larger
percentage of chassis module’s impacts and also 5.45 kg Aluminum-ADC12 had much smaller
influence than 0.114kg copper, and even 1.64kg iron.
Figure 24 Impacts sources for power module and chassis module according to EPS2000.
Huge differences existed in the relation of different phases when different weighting methods
were used. As EPS2000 and Eco-indicator 99 being used, similar trends the results showed as
Figure 24 and Figure 25. That chassis and power module together are dominant in production
phase as oil consumption in the same situation to use phase.
Figure 25 Weighting results of production phase and use phase according to Eco-indicator
99.
0%
20%
40%
60%
80%
100%
Power module
PAH emissions
Cu ore consumption
Iron ore
Bauxite
Others 0%
20%
40%
60%
80%
100%
Chassis module
Iron ore
Oil
CO2 emission
Natural gas
Cu ore
Others
SO2 emissions
0%
20%
40%
60%
80%
100%
Production phase
Assembly
Power module
Packaging
Handel module
Fasteners
Chassis module
Branding module
Axle &Suspension module
0%
20%
40%
60%
80%
100%
Use phase
Others
Oil consumption
PAH
CO2emissions

26
3.3 Sensitivity analysis
Sensitivity analysis can be used to identify the sensitivity of critical data. Because metals
show to have a large impact of the result, and the recycling rate was uncertain, recycling has
being considered in sensitivity analysis.
Figure 26 shows the characterisation results from variations of recycling rate, metals have been
recycled in end-of-life phase are steel alloy, aluminum, crude iron and copper, the percentages
indicate that how many percentage of the recycled metals go back to system, and 0 is the base
case which shown in Figure 10. It is obviously that increasing the share of recycled metals
makes better environmental performances of Lawnmower LC48VE. POCP and acidification
categories are the most influenced factor by variation of recycling rate.
The weighting results from variations of recycling rate are presented in Figure 27 and Figure 28,
ELU value decreased 35% if all the recycled metals go back to the system compared to the base
case, however only 17% impact is decreased according to Eco-indicator 99.
Figure 26 Characterisation results variations with different recycling rate.
0%
20%
40%
60%
80%
100%
100% recycled
70% recycled
50% recycled
30% recycled
0% recycled

27
Figure 27 Weighting results variations with different recycling rate according to EPS2000.
Figure 28 Weighting results variations with different recycling rate according to
Eco-indicator 99.
3.4 Discussion
In use phase, impacts of Lawnmower LC48VE vary due to user habits and results are based on
average using time in this study. Recycling of batteries is not included, if all the batteries are
recycled, there would be a better environmental performance of Lawnmower LC48VE.
One limitation of this case study is that data cannot be found in most production processes.
Material losses were only calculated in plastic parts injection, losses during transport and other
processes were not considered.
3.5 Conclusion
Production phase and use phase together contribute dominant impacts after
characerisition impacts of each environment categories, especially major impacts in
Human toxicity.
Weighting methods as EPS2000 and Eco-indicator 99 being applied show difference in
0
50
100
150
200
250
300
350
400
Recycling rate
Un
it (
ELU
)
100% recycled
70% recycled
50% recycled
30% recycled
0% recycled
0
5
10
15
20
25
30
35
40
Recycling rate
100% recycled
70% recycled
50% recycled
30% recycled
0% recycled

28
final result which is because different emphasis of each method, while in EPS2000,
production contributed the major impact 47% and use phase for 49% of final and for
Eco-indicator 99 use phase took 75% in total.
In production phase, the major impacts contribution was from chassis module and power
module due to the large metal demand in these two modules. In use phase, no matter
which weighting method used, oil consumption contributes dominant impacts, both more
than 60% of total.
Increasing the share of recycled metals could make better environmental performances of
Lawnmower LC48VE.
The assembly in Höör only contributes a very small part of the environmental impact.

29
4. Case of Automower 220AC
4.1 Inventory analysis
The inventory analysis of Automower 220 AC consists of an analysis of following phases in the
lifecycle:
Production (including raw materials, components and assembly)
Transport
Use
End-of-life
Data were collected and results are presented for each of these phases. These phases are
described in the following subsection.
4.1.1 Flowchart
Figure 29 shows the simplified flowchart of Automower 220 AC.
Figure 29 Simplified flowchart of Automower 220AC (dotted boxes was not considered in this
study since lack of data).

30
An initial flowchart has been constructed, depicting all the different data needed to succeed in
making of this LCA. The activities with dotted line are not considered in this study since lack of
data, and not considered having a major impact on the result based on the scope of the study.
The production phase includes the processes that happened before all the components and
materials arriving at Newton Aycliffe, UK, as well as the plastic components manufacturing
processes in Newton Aycliffe. Raw material extraction, transport and other processing
procedures were included. The production process would be divided into several modules and
each module includes several components. Transport phase covers the processes in both
components purchase and products wholesale, but excluded transports happened in retail
processes. Besides, the transport happened in raw material extraction, purchased by suppliers
can be only approached in data base, were defined as background transport and were
accounted to each module’s environmental impacts in this case. Use and maintenance statics
data were from Husqvarna, while end-of-life data were based on assumptions and telephone
interview from Renova AB, which is a Swedish waste treatment company.
4.1.2 General data
Raw material
For Automower 220AC, Husqvarna purchased many components while only manufactured
main plastic parts and assembled them in Newton Aycliffe, UK. The data collection processes
mainly focused on the direct supplied components’ raw material origins, processing impacts
and transport form suppliers to Husqvarna and from Husqvarna to different central warehouse.
In this case, average data of raw material production were adopted.
Acrylonitrile-Butadiene-Styrene (ABS) mainly used as covers of Automower and inventory
data of ABS granulate production (R17) is from SimaPro database. Data based on average data
from all suppliers in Western Europe for 1995-1999, and transport data are not included. The
inventory data for acrylonitrile-styrene-arcylate (ASA) production (R16) is assumed to be the
same as R17 since lack of data for ASA.
Data of Polyamide 66 (PA 66) production R18 were obtained from SimaPro database, PA66
GF30. PA 66 is the product of polyamide 30% glass fibre production. Inventory data of PA66
production are based on average Western Europe data for 1995 to 1999, transport data are not
included and no applicable allocations.
Raw materials R19 to R24 are:
R19-propylene (PP),
R20-polymethyl methacrylate (PMMA),
R21-poly-formaldehyde (POM),
R22-ethylene-propylene-diene monomer (EPDM),
R23-Polyamide 6 (PA6),
and R24-polythene (PE).

31
Data of R19–R24 were obtained from SimaPro database, and inventory data of R19 to R24
production are based on average Western Europe data for 1995 to 1999, transport data are not
included.
Inventory data of R27 steel production is from SimaPro database, “steel ETH”. Data based on
average Western Europe data for 1990-1994, transport from mine to factory is not included.
Aluminum production (R28) data from SimaPro database, Aluminum ingot were used. Data
based on average data from all suppliers in Western Europe for 1990-1994, transport data are
not included.
LCI data for R29 copper production is based on world average data for 1993, (Simonson,
Andersson, & Rosell, 2001). It is assumed as a mix product of 80% virgin and 20% recycled
copper. Data include transport from mine to factory gate.
Electricity production
Electricity production in different countries and regions are based on different energy sources.
In this study electricity consumption was considered in Sweden and United Kingdom. Energy
sources of English electricity production mainly consist of hard coal (35.5%), nuclear (28.08%)
and fuel gas (36.42%), and Swedish sources are considered as nuclear (46.5%), oil (2.06%) and
hydro electricity (51.44%)(Baumann & Tillman, 2004).
4.1.3 Production
The Automower consists of motor module, cable module, electronic module, fastener module,
packaging module and plastic components module. Data were collected and results are
presented for each module in this section.
Plastic components module
The plastic components of Automower are mainly produced by Husqvarna, rest parts are
purchased from different suppliers. Total weight of plastic components per functional unit is
8.45 kg and contains several materials (Automower BOM, 2009). Detailed flow chart of plastic
components is shown in Figure 30.

32
Figure 30 Flowchart of plastic components module. Processes occurring in Husqvarna
factory are marked with grey shade.
Resources use and environmental impacts of raw material production R16-R24 were calculated
by using general raw material inventory data (Section 4.1.2 Raw material). After aggregated
same material, the material composition and their weights are given in Table 14.
Table 14 Material and weight for plastic components (Automower BOM, 2009) .
Material Weight (kg/f.u.)
ABS 2.682
ASA 3.252
EPDM 0.137
PA 6 0.029
PA66 0.417
PE 0.002
PMMA 0.155
POM 0.08
PP 1.696
Raw materials of components which are made by Husqvarna UK are produced and transported
to Husqvarna, then moulded by injection machines. P13 is injection moulding in Husqvarna
and electricity use for P13 is 6.924 kWh per functional unit (Coates, 2010). Geographical
region of Electricity production was defined as UK and emissions and resources use during
electricity production were calculated by using average British electricity production
(International Energy Agency, 2000).
Production data for PP components which are not made by Husqvarna was obtained from
SimaPro database, PP injection. All the production data for P14 were assumed to be the same as
R16
ABS granule
production
R22
EPDM granule
production
R23
PA 6 granule
production
R21
POM granule
production
R19
PP granule
production
R24
PE granule
production
Transport Transport Transport Transport Transport Transport
P14
Injection
moulding
P14
Injection
moulding
P14
Injection
moulding
P14
Injection
moulding
P14
Injection
moulding
P14
Injection
moulding
R16
ASA granule
production
R17
ABS granule
production
R18
PA 66 granule
production
R19
PP granule
production
R20
PMMA granule
production
R21
POM granule
production
Transport Transport Transport Transport Transport Transport
P13
Injection
moulding
P13
Injection
moulding
P13
Injection
moulding
P13
Injection
moulding
P13
Injection
moulding
P13
Injection
moulding
Transport
A1
Assembly

33
for PP injection.
Raw materials losses caused by warming up and cleaning machine were assumed as 3% (Foster,
2010). Transports (with dot line) and weight losses during plastic granule production were not
concerned since lack of data. Assembly A1 and transport with solid line will be discussed in
section 4.1.3 and section 4.1.4 respectively.
Electronic module
Electronic components include batteries, printed circuit boards (PCBs) and other small
electronic parts. Battery is used for provide energy for Automower. Automower used a pack of
15 cells which also includes tags, solder and other packaging material, the total weight for one
cell is 49.68 g (GP Battery, 2009), the battery is delivered to Husqvarna UK from GP Battery
Company, Hong Kong, raw materials and their weights in R25 are shown in Table 15, the data
for producing raw materials in R25 were obtained from a previous LCA study about batteries of
electric vehicles (Jose, Maria; Garcia, Acevedo, 1996). Energy consumption during battery
production P15 is 0.2kWh/PCS (Leon, 2009); emissions and resources use during electricity
production were calculated by using average British electricity production (International
Energy Agency, 2000), emission data for P15 were not available from suppliers and thus not
included in this study.
Figure 31 Flowchart of electronic module.
Table 15 Material content in one cell of NiMH battery (GP Battery, 2009).
Material content in NiMH battery
Nickel 34.22%
Iron 26.55%
Nickel hydroxide 22.06%
Water 7.75%
Polypropylene 4.53%
potassium hydroxide 3.10%
Other Compound 1.79%
R25
Raw material production
R30
Rawmaterial production
Transport Transport
P15
Battery production
P16
PCB production
Transport Transport
A1
Assembly

34
PCB is a very complicated electronic unit, and inventory data for PCB were assumed to be the
same as for Printed board (SimaPro database), both raw material production R25 and PCB
processing P16 are included in this data set, data based on modern technology during
1995-1999 in Western Europe. Total weight of PCB per functional unit is 0.636kg.
Fastener module
Figure 32 shows three main parts of fastener module, screws, blades and Al plate.
Environmental impacts from raw material production R27 and R28 were calculated by using
general material production inventory (Section 4.1.2 Raw material).
Figure 32 Flowchart of fastener module.
Activities with dot line were not counted in the inventory of fasteners module due to lack of
data, but is not assumed to be major impact on the result since fastens only take a small weight
percent of the whole product. Transport and assembly process Al are discussed in subsection
“Assembly”.
Motor module
An Automower includes 3 motor parts, which were made by different suppliers and delivered to
Husqvarna. Figure 33 shows the flowchart of Motor module, resources use and emissions from
raw material production R16, R26, R27, R28 and R29 were calculated by using general
material production inventory (Section 4.1.2 Raw material). Due to lack of processing data,
inventory of Motor module were calculated by material composition only. Material
composition of these components is shown in Table 16.
Screw Blade Al plate
R27
Steel production
TransportR27
Steel production
R28
Aluminum production
Cold heading Transport Transport
Thread rolling blade production Al plate production
Transport Transport Transport
A1
Assembly

35
Figure 33 Flowchart of Motor module.
Table 16 Material composition of Motor module (Foster, 2010).
Parts name Material composition Weight (kg/f.u.)
Motor Cutting System 10.5%Cu+17.9%Al + 71.6% steel 0.400
Euro Transformer 32%Cu + 22% Oil + 46% steel 1.470
Dunkermotor Drive Assy 80% steel +20% ABS 2.000
Packaging
Carton is produced from 100% new fibers (Saica Packaging, 2009). Inventory data of carton is
from SimaPro database, new carton, based on average technology during 1990-1994 in Western
Europe, system boundaries were defined as from forest to carton. The weights of packaging
materials are given in Table 17.
Figure 34 Flowchart of Packaging module.
Fitting is made from PE, and the PE production R9 has been defined in section 4.1.2. However
processing data of fitting are not available since lack of data.
R29
Copper production
R28
Alumium
production
R27
Steel
production
R29
Copper
production
R26
Oil
production
R27
Steel
production
R27
Steel
production
R16
ABS granule
production
Transport Transport Transport Transport Transport Transport Transport Transport
Cutting motor
production
Transformer
production
Dunkermotor
production
Transport Transport Transport
A1
Assembly
Carton Manual Fitting
P18
Paper production
R24
PE granule
production
Transport Transport
P17
Carton production
P19
Printing
fitting
production
Transport Transport Transport
A1 Assembly

36
Table 17 Weights of packaging materials per functional unit (Gilmore, 2009).
Material Weight(kg)
Carton 1.542
Paper 0.234
PE(fitting) 2.018
Paper of manual was defined as uncoated paper, production of this paper (94% dry matter)
mainly from mechanical wood pulp with some bleached sulphate cellulose and latex coating in
a factory in Switzerland for 1994, paper are delivered to printing plant to get print and then
transported to Husqvarna UK, the inventory data of P18 paper production and P19 printing
process were obtained from SimaPro database (Pre Consultants BV, 2008).
Cable Module
Cable Modules consists of cables, wires and looms. They are assumed have the same material
composition and production process. Figure 35 shows the life cycle of cable module.
Total weight of cable is 3.467kg per functional unit, and 67.5% copper and 23.5% PE was
defined as cable constitutes (Margaret, 2001). LCI data for R29 (Copper production) and R24
(PE granule production) have been state in section 4.1.3. Processes with dot line were not count
into the cable inventory data since they are not available, transport with solid line is discussed
in section 4.1.4. Data for P24 was obtained from CPM database, “Copper extrusion and
drawing to profiles”, which was based on average German industry data of 1995.
Figure 35 Flowchart of Cable module.
Assembly
Automower is assembled (A1) in Husqvarna UK, all the parts are transported along the
assembly line, and then assembled manually. One electricity meter record total electricity for 14
assembly lines in the assembly factory. Electricity consumption for one Automower is
R24
PE granule
production
R29
Copper production
Transport Transport
Eventually mixing of
plastic materials
P24
Drawing of copper wire
to specified diameter
Extrusion of
cables
Transport
A1
Assembly

37
2.61kWh, which energy consumption was allocated by pieces. Geographical region of
electricity production was defined as in UK, while emissions and resources use during
electricity production were calculated by using average British electricity production data
(International Energy Agency, 2000).
4.1.4 Transport
Only transports from first tier parts suppliers to Husqvarna Aycliffe factory and transports from
Aycliffe to wholesales were calculated in this part. All the goods are transported by truck with
semi-trailer, long distance transport, Euro 3 standard, and based on the assumption that 70%
load capacity is used (NTM, 2002). Products for Mexico and Canada are transported by
medium sized ship (NTM, 2002). The aggregation data of means of transport and their loads
are given in Table 18.
Table 18 Means of transport and load.
Direction Truck Ship Unit (/f.u.)
Suppliers to Husqvarna 23.0455
Tonne*km
Husqvarna to Wholesales 35.4347 140.3968 Tonne*km
4.1.5 Use
Three packs of batteries (one pack per 2.5 years) and 81 blades (9 blades per year) are needed to
be replaced during a life time of 10 years (Gustvasson, 2009) has been assumed. It is assumed
that to mow 1000m2 lawns, Automower is used as 12 hours (6 charges) per day, 3days per week,
namely 396 charges per year (Gustvasson, 2009). Energy efficiency for charging was
calculated as 52% (Jose, Garcia, & Schluter, 1996), electricity use for charging is 1069.2 kWh
per functional unit. Geographical region of electricity production was defined as in Sweden
while emissions and resources use during electricity production were calculated by using
average Swedish electricity production data (International Energy Agency, 2000).
4.1.6 End-of-life
When mowers are out of use, they are sent to recycle company nearby, metals and papers are
recycled and plastic parts are incinerated, others were assumed to go to land fill(Renova AB,
2010).

38
Figure 36 Flowchart of end-of-life.
Inventory data of recycling metals are based on previous LCA study of vehicles and only 97%
(Boss, 2005) weight of metals could be obtained after recycled since there would be some
losses when recycling. Environmental impacts were allocated by weight. Products of recycling
metals are 5.4kg steel, 2.77kg copper and 0.16kg Aluminum. Data of incineration P21 was
obtained from SimaPro database, plastics to municipal waste incinerator. Plastics were defined
as long life plastic. Inventory data of P21 include the environmental impacts of transport to the
Municipal Waste Incinerator (on average 10 km), treatment of flue gas, and further waste
treatment of slags and ashes. Data were based on average Europe situation of 1995. Emissions
of landfill P20 were not traced. For recycling, data was calculated by using the data of a
previous LCA report (Boss, 2005), which included the inventory data for metal recycling. P23
is the scrap based metal production; data for this activity was obtained from CPM database
(CPM, 2010).
4.2 Impact assessment
In this section the impact assessment of Automower 220AC is presented, the calculation based
on a comprehensive coverage of production, transport, use phase and end-of-life, as well as
electricity generation. The recycled metals were considered as not go back to the system, but
the emissions and inputs needed in recycling were take account into the impact assessment.
Impacts of production phase was further analyzed and discussed in order to get a deep
understanding and facilitate product development of Automower.
4.2.1 Characterisation
Table 19 list the total life cycle impacts according to defined characterisation of Automower.
Generally, production and use phase always have larger environmental impacts compare to the
others. As shown in Figure 37, in the categories global warming, acidification, eutrophication,
ecotoxicity, POCP (photochemical ozone creation potential) and ozone depletion, production
phase account for more than 60% of the total impact. Use phase takes 80% of total impact in
resource depletion category due to crude oil consumption in electricity production, which is
used for battery charging.
Use
Transport
P20
Landfill
P21
Incineration
P22
Recycling
P23
Scrap-based metal
production
Others
Plastics
Metal scrap go back
to Production phase
Paper,Metal

39
Table 19 Life cycle impacts of Automower per functional unit.
Category Unit Weight
Global warming kg CO2 eqv/f.u. 273
Acidification kg SO2 eqv/f.u. 9.54
Eutrophication kg PO43-
eqv/f.u. 0.137
Resource depletion kg reservebase-1/
f.u. 0.450
Human toxicity kg 1,4-DCB eqv/f.u. 52.1
Ecotoxicity kg 1,4-DCB eqv/f.u. 6.65
POPC kg ethylene eqv/f.u. 0.367
Ozone depletion kg CFC-11 eqv/f.u. 5.83E-06
Figure 37 Contribution to the characterisation results from the entire life cycle of Automower.
The results of further analyzed from production perspective are shown in Figure 38. Electronic
module contributes approximately half to all impact categories except resource depletion and
ozone depletion. This is mainly caused by toxic and chemical substances which have large
consumption in PCB and battery production. Plastic components module shares approximately
40% impacts in resource depletion and ozone depletion category. That’s due to the crude oil
consumption in plastic production. Cable module gives 40% acidification and POCP impacts;
the reason for this is because of the sulfur dioxide emissions in copper ore extraction.
Packaging, fastener and motor module take relative lower impacts in production phase.
-20%
0%
20%
40%
60%
80%
100%
End of life
Use
Transport
Production

40
Figure 38 Contribution to the characterisation results from the production phase of
Automower.
From a life cycle perspective, most influencing substances and phases for each category are
summarized in Table 20.
Table 20 Most influencing substances and phases for each category.
Category Substances Phases
Global warming CO2 Electronic module production (PCB production)
Acidification SO2 Cable module production
Electronic module production
Use
Eutrophication NOx Electronic module production
Resource
depletion
Crude oil Use
Human toxicity Cadmium End of life
Ecotoxicity Nickel Electronic module production
POCP SO2 Cable module production
Electronic module production
Use
Ozone depletion Halon 1301 All the production
4.2.2 Weighting
Table 21 shows the results of two different weighting methods, these two methods were
described in section 3.1.1. Both of the two methods were dominated by the production phase
which is further analyzed in Figure 39. Transport, use and end of life phases take slight impact
in the life cycle of Automower.
-20%
0%
20%
40%
60%
80%
100%
Plastic
Packaging
Motor
Fastener
Electronic
Cable
Assembly

41
Table 21 Results according to different weighting methods.
Total Production Transport Use End-of-life Unit
EPS 2000 624.55 594.41 1.10 23.99 5.04 ELU
Eco-indicator99 14.25 9.60 0.19 3.26 1.19
Results of different module productions according to EPS and Eco-indicator vary considerably.
For example, cable module occupied 68% impact of production phase according to EPS
weighting, but only 19% in Eco-indicator weighting, the reason for this is EPS weights copper
ore consumption much higher than Eco-indicator weights, and cable production shares more
than 80% in the total copper consumption. Use of resource is considered as an important factor
in EPS weighting method. Electronic module contributes 7% impact of production phase by
using EPS weighting, however it is the dominate contributor according to Eco-indicator
weighting. This is due to coal consumption and CO2 emissions from electronic components
production.
Figure 39 Weighting of production phase according to EPS 2000 and Eco-indicator 99.
4.3 Sensitivity analysis
Some parameters will be varied in different conditions. One thing that might have a large
impact is where the automower is used. Figure 40 shows the characterisation results for
Automower which is used in UK. Compared to Figure 37, if the use place is changed to UK, the
proportion of impact in use phase has a large increase in global warming, acidification, resource
depletion as well as eutrophication categories, and become dominated in the whole life cycle.
Assembly0%
Cable68%
Electronic7%
Fastener1%
Motor16%
Packaging0%
Plastic8%
EPS 2000
Assembly0%
Cable19%
Electronic59%
Fastener2%
Motor7%
Packaging1% Plastic
12%
Eco-indicator 99

42
Figure 40 Contribution to the characterisation results for Automower using in UK.
Results of different use places according to EPS and Eco-indicator weighting method are
shown in Figure 41 and Figure 42 respectively. ELU value of Automower used in Sweden is
624 and 153ELU will be added if it is using in UK. Eco-indicator results change from 14.25 to
34.75 when Automower uses in UK instead of uses in Sweden. In general, to use an
Automower in UK has larger environmental impacts than use in Sweden. The main reason for
this is electricity production in UK and in Sweden based on different energy sources. Energy
sources in UK are mainly based on hard coal, natural gas and nuclear, while Swedish electricity
production are based on nuclear energy and hydro energy.
Figure 41 Comparison of weighting results according to EPS 2000, use phase in UK and
Sweden.
-20%
0%
20%
40%
60%
80%
100%
End of life
Use
Transport
Production
0
100
200
300
400
500
600
700
800
UK Sweden
ELU
EPS 2000
End of life
Use
Transport
Production

43
Figure 42 Comparison of weighting results according to Eco-indicator 99, use phase in UK
and Sweden.
Figure 43 shows the characterisation results from variations of recycling rate, metals have been
recycled in end-of-life phase are steel, aluminum and copper, the percentages indicate how
many percentage of the recycled metals go back to system, and 0 is the base case which shown
in Figure 37. It is obvious that increasing the share of recycled metals makes better
environmental performances of Automower. POCP and acidification categories are the most
influenced factor by variation of recycling rate.
The weighting results from variations of recycling rate are presented in Figure 44 and Figure 45.
ELU value decreased 78% if all the recycled metals go back to the system compare to the base
case, however only 17% impact decreases according to Eco-indicator 99.
Figure 43 Characterisation results from variations of recycling rate.
0
5
10
15
20
25
30
35
40
UK Sweden
.
Eco-indicator 99
End of life
Use
Transport
Production
0%
20%
40%
60%
80%
100%
100%
70%
50%
30%
0

44
Figure 44 Weighting results variations with different recycling rate according to EPS2000.
Figure 45 Weighting results variations with different recycling rate according to
Eco-indicator 99.
4.4 Discussion
Specific uncertainties of this Automower case study are discussed in this section. Uncertainties
and limitations for the whole study are discussed in Section 5.
In reality, environmental impacts in use phase of Automower are various due to different user
habits and the size of mowing area. Charging frequency and total electric power consumption
lead to variation of environmental performance. In this study, calculations are based on average
using time.
Another important parameter could be the energy sources for electricity production. The use of
fossil fuel based electricity is obvious has heavier environmental load than the electricity which
produced based on clean energy sources. That is to say, using Automower in other countries
could give different environmental impacts.
139.37
284.92
381.96
479.00
624.55
0
100
200
300
400
500
600
700
Total
100% 70% 50% 30% 0%
11.8412.56 13.04 13.52
14.25
0
2
4
6
8
10
12
14
16
Total
100% 70% 50% 30% 0%

45
Recycling of batteries was not included, if all the batteries are recycled and the materials are
reused, there could be a better environmental performance of Automower.
One limitation of this case study is that data cannot be found for most production processes.
Material losses were only calculated in plastic parts injection. Spoilage, losses during transport
and other production losses were not considered.
4.5 Conclusion
Production phase including raw material extraction contributes 60% impacts of each
environment category, exclude resource depletion and human toxicity.
Cable (Cu) production occupied more than half EPS indices.
Electronic module production dominant environmental impacts according to
Eco-indicator 99.
Using Automower in Sweden has better environmental performance than using in UK due
to different sources of electricity production.
Assembly in Husqvarna’s factory only takes a minor part of total impacts.
Increasing the share of recycled metals could make considerably better environmental
performances of Automower.

46
5. Discussion
Uncertainties and limitations, as well as their effects are discussed in this section.
In this study, the functional unit was defined as mowing Swedish lawn for 10 years as the same
as lifetime assumed. However, in reality the lifetime of lawnmowers (both traditional mowers
and automowers) varies very much which will affect the final result. For instance, if the real
lifetime is longer than 10 years, which is very probably in automower case, the environmental
impacts for producing per piece of mower will differ from per functional unit. And extended
lifetime will decrease environmental impacts in production phase compared to former one
which could lead to a better environmental performance of the products.
Users always mow lawns on their own ways; variations between users’ habits leading to
different amount of energy consumptions, namely the frequency of petrol filling or battery
charging are undertrained. Besides, aesthetic matters and fertilization use for the lawn
maintenance have not been taken into account.
Treatment of old mowers depends on waste management companies and their locations, in
Sweden, all the metals and papers of an old mower are recycled while all the plastic parts are
incinerated, and these could be changed in diffident locations. The recycling rate depending on
techniques and scales of the recycling companies, generally, larger companies could have new
techniques which leading to a relevant higher recycling rate. Recycling rate also depends on the
recyclability of materials and how the product is designed (the recyclability). As analyzed in
section4.3, different recycling rate could vary the results rather much.
The noise of lawnmower was analyzed by using a method for auto cars; the suitability of this
could be discussed. For the working environment, the Automower obviously has lower noise
than other lawnmowers; however, the noise of Automower was not account into the impacts,
comparison in this category is not feasible.
Raw material production data from database is called general data; these data usually based the
average technology in relative large area (e.g. Western Europe). The use of these data is hard to
apply in material selection and green purchasing, if the company wants to focus on these
aspects, more site-specific data are needed.
Most processing data for components missing is one of the significant limitations in this study,
for example, the processing data for engine production was missing, as well as the chemicals
used for battery production. Material losses and spoilage during processing and transport were
normally not accounted for.
Apart from some data missing, the timeliness of these data is still partly sensitive as some
“green” technologies have been improved and others were already mature then. Some of the
uncertainty based on technology can be referred in different industrial annual report. Although

47
this would be time consuming and the usual way is to compromise the system boundary.
Allocations existed in resource consumptions, emissions and energy consumptions were
allocated by weight in this study, and therefore components made from the same material with
heavier weight took relative larger impacts than the lighter ones. Sometimes, the environment
impacts can be also allocated by pieces, normally in energy consumptions.
Transport data mentioned in this study only include first tier suppliers, namely the transport
from first tier suppliers to factories and the transport from factories to wholesales. Transport
data in production phase are considered as background data, most of which are included in
production inventory data. However, compared to production and use, transport phase, this is
only a minor part. Due to the limitations of weighting methods, not all the inventory parameters
were taken account into impact category.

48
6. LCA application
6.1 Methodology application
ISO (the International Organization for Standardization) has contributed the 9000 series
of standards for integration of products quality(Guinée, 2002). And recently the 14000
series has been more and more focused, and in which, 14001 on Environmental
Management has been already implemented in Huqvarna. Furthermore, the 14040 series
are related with LCA. Compared to 14001 with attention at organizational level, the ISO
LCA standards also cover the technical aspects of an LCA projects(Guinée, 2002).
ISO 14040 (2006): About the principles and framework for life cycle assessment (LCA),
technique detail is not included in this standard, nor does it specify methodologies for the
individual phases of the LCA (ISO, 2006).
ISO 14041 (1998): A standard on goal and scope definition and inventory analysis
(Guinée, 2002).
ISO14042 (2000): A standard on life cycle impact assessment (Guinée, 2002).
ISO14043 (2000): A standard on life cycle interpretation (Guinée, 2002).
ISO14044 (2006): About requirements and guidelines for life cycle assessment (ISO,
2006).
ISO/CD 14045 (under development) : About Principles, requirements and guidelines
of Eco-efficiency assessment of product systems (ISO, 2010).
ISO/TR 14047 (2003): Technical report “provides examples to illustrate current
practice in carrying out a life cycle impact assessment in accordance with ISO
14042.” They highlight the key issues when implementing the life cycle impact
assessment (ISO, 2003).
ISO/TS 14048 (2002): Technical specification provides “the requirements and a
structure for a data documentation format” in consideration of transparency,
precision and flexibility of inventory data, “thus permitting consistent documentation
of data, reporting of data collection, data calculation and data quality, by specifying
and structuring relevant information” (ISO, 2002). This can be applied to design
“questionnaire forms and information systems” (ISO, 2002)..
ISO/TR 14049 (2000): Technical report provides “examples of application of ISO
14041 to goal and scope definition and inventory analysis” (ISO, 2000).
Besides, another application of LCA is to communicate, covering the business to business
(B2B) and business to consumer (B2C), which also can be called as “green procurement” and
“green marketing”. “To ensure comparability” Type III environmental declaration

49
programmes and Type III environmental declarations have been applied with more highly
standardised LCA methodology (Baumann & Tillman, 2004).
ISO 14025 (2006): About principles and specific procedures for developing Type III
environmental declarations (ISO, 2006).
6.2 Data collection strategy
It’s a long lasting discussion about how to improve the effectiveness of data collection, and
there needs compromise in system boundary and accuracy of data. Following experiences and
suggestion were based on the Husqvanar’s cases studies.
Raw materials
Raw materials data are difficult to obtain from suppliers, therefore different types of databases
are recommended for company internal study including industrial life cycle inventory (LCI)
reports from specialized associations (Plastic - Plastic Europe, Steel - World Steel and
Aluminum - European Aluminum Association) and research institute or software – SimaPro,
Gabi and Ecoinvent).
Processing
In this case, processing mainly means the activities which transform raw materials to
components. On-site investigation is direct but may not be as useful as expected since the
level of details requirements. The suppliers’ sustainability reports could be helpful as suppliers’
average data for electricity consumption, main resources depletion and focused emissions as
CO2, NOX and SO2. Questionnaire way is operable but low efficient.
Transport
Energy consumptions and emission factors were from the network for transport and
environment (NTM, 2009) and distances was obtained based on electronic maps.
Use
In this case testing data about the engine working were from supplier while the petrol and
lubricant consumption were from internal study. Although feedbacks from consumers are ideal,
for instance, use pattern covering the frequency of use.
End-of-life
General data for waste treatment could be found from local waste management companies but
for lawnmowers there still lack of specific data. Information on what is actually happening with
old lawnmowers would be better choice compared to average data.
Data management
More specific material data of assembly parts are needed and internal data management needs
improvement, e.g. periodic update and review of an internal database. Inquiring material and
processing information from suppliers when purchasing is a more efficient way to obtain data

50
systematically.
6.3 Recommendation
Figure 46 shows the level of detail when applying life cycle perspective in companies. The
general Life Cycle Thinking is the idea of always considering the impacts from the product’s
whole life cycle. The most detailed perspective is performing an LCA study where the detailed
data is generated into an estimation of the environmental impact. The life cycle perspectives
when analyzing, evaluating and improving an organization or a specific product, prevents
problem shifting that can occur when focusing on a division or level in an organization or one
phase of the products life cycle. The most common way of using life cycle perspectives is
through life cycle thinking, LCT. Considerations are made on a very general and qualitative
level (Frankle & Rubik, 2000). However more specific approaches to incorporate life cycle
perspectives are available.
Figure 46 Levels of life cycle perspective(Frankle & Rubik, 2000).
A full LCA for a product is comprehensive and detailed; using professional LCA software is a
good choice to facilitate data management. However, it’s not recommended Husqvarna do LCA
for all the products since it’s time and labor consuming, therefore, doing LCA of typical
products and using life cycle thinking during product design (e.g. increasing recyclability of the
product ) are more recommended.

51
7. Conclusions
This report presented LCA studies of the two products Lawnmower LC 48 VE and
Automower 220AC. For both cases, production phase and use phase contributed dominant
impacts of all impact categories exclude human toxicity, EPS2000 showed production phases
including raw material as the most critical and Eco-indicator 99 illustrated use phases are
more important for the two cases.
Assembly in Husqvarna factories and transports had little impact in most cases. Different
emphasis in the two weighting methods caused this result and comparison will help decision
maker have multi-view of different phase’s impacts in life cycle.
For both mowers recycling rate of metal can influence different categories to different extends
in characterisation part, and since EPS2000 emphasized the resources depletion, better
environmental performance can be achieved if more recycled metals are used in product
system. What’s more, according to the discussion, to improve the durability of mowers will
have positive impacts of the products’ environmental performance.
For company, improvement of internal database management is needed, and doing LCA of
typical products and using life cycle thinking during product design are recommended.
52
Reference
About Husqvarna. (2009, 09). Retrieved 04 12, 2010, from
http://corporate.husqvarna.com/index.php?p=about&afw_lang=en.
Baumann, H., & Tillman, A.-M. (2004). The Hitch Hiker's Guide to LCA (Vol.
Studentlitterarur). Lund, Sweden: Studentlitteratur.
Boss, A. (2005). Life Cycle Assessment of a Gas-Electric Hybrid Waste Collection Vehicle.
Göteborg, Sweden.
BUWAL 250. Life cycle inventory for packagings. Berne, Switzerland: Swiss Agency for the
Environment, Forest and Landscape (SAEFL); 1998.
CPM. (2010). Impact assessment methods. Retrieved 02 20, 2010, from CPM:
http://www.cpm.chalmers.se/CPMDatabase/StartIA.asp
CPM. (2008). SPINE LCI dataset: Copper extrusion and drawing to profiles. Retrieved 01 21,
2010, from CPM:
http://www.cpm.chalmers.se/CPMDatabase/Scripts/sheet.asp?ActId=Designer1997-12-08834
CPM. (2010). SPINE LCI dataset: Scrap-based steel production. Retrieved 04 14, 2010, from
CPM:
http://www.cpm.chalmers.se/CPMDatabase/Scripts/sheet.asp?ActId=CPMCTHXXX1998-04-
08837
Ericsson. (n.d.). Material data. Retrieved 12 2, 2009, from Materials list:
http://materialsdata.ericsson.net/materials_list.htm
Frankle, & Rubik. (2000). Life cycle assesment in industry and business: Adoption patterns,
applications and implications. The International Journal of Life Cycle Assessment , 133.
GP Battery. (2009). Supplier BOS 220SCH for customer.
Guinée, J. B. (2002). Handbook on Life Cycle Assessment. Kluwer Academic Publisheds.
Husqvarna. (2009). Material Analysis Report 966975401.
International Energy Agency. (2000). Electricity production based on different energy
sources,during 1998.
IDEMAT 2001, Database, Faculty of Industrial Design Engineering of Delft University of
Technology, The Netherlands (2001).
ISO (International Orgnaztion for Standarzation), http://www.iso.org.
Johan, N. (2010, 1 21). Questions about LC48VE. (X. Lan, Interviewer) Husqvarna.
Jose, M., Garcia, A., & Schluter, F. (1996). Life-Cycle Assessment for Batteries of Electric
Vehicles. Goteborg.

53
Jose, Maria; Garcia, Acevedo. (1996). Life-cycle Assessment for batteries for electric vehicles.
Marby, A. (1999). Livscykelanalys . KTH Ingenjörsskolan .
Misumi Europe. (n.d.). Technical data. Retrieved 11 22, 2009, from
www.misumi-europe.com/www/pdf/eng/.../2863_2864.pdf
NTM. (2002). Retrieved 2002, from www.ntm.se
NTM. (2009). Retrieved November 22, 2009, from NTM:
http://www.ntm.a.se/english/eng-index.asp
Pre Consultants BV. (2008). SimaPro 7.1. Software and database manual. Amersfoort ,The
Netherland.
Rantik, M. (1999). Life Cycle Assessment of Five Batteries for Electric Vehicles under different
charing regimes. CTH.
Renova AB. (2010, January).
Saica Packaging. (2009).
SETAC-Europe. (1996). Towards a methodology for life cycle impact assessment. Reprot from
the SETAC-Europe working group on impact assessment.
Simonson, M., Andersson, P., & Rosell, L. (2001). Fire-LCA model:Cable case study. Sweden.
SSAB,Swedish Steel. (2008). Dogal 200 and Dogal Form Mild Steels for Drawing. DOGAL.
SimaPro 7. Software and database manual. Amersfoort, The Netherlands: Pre Consultants BV;
ETH-ESU 96. Ökoinventare von Energiesystemen. ESU Group, (both unit and system
processes), ETH Technical University of Zürich, 1996.
Personal communication
Bengt Ahlund. Husqvarna AB (2009, October).
Carl Risholm. Purchasing and Supply manager. Husqvarna AB (2009, October).
Coates, P. Project Engineer,Reserch and Development. Husqvarna AB (2010, January 26).
Jonas, Edman. Project Manager Petrol Wheeled dep. Husqvarna AB (2009, September 07).
Foster, P. Buyer, Materials Management. (2010, January 26).
Gilmore, D. (2009, December 03).
Gustvasson, C. Product Development Manager, Robotic Mowers. (2009, September 07).

54
Johan, Nilsson. Husqvarna Manufacturing Sweden AB. (2010, January 21).
Lindman, K. Recycling of lawnmowe. Renova. (2010, January 31).
Monica, F. Purchase Department, Husqvarna Manufacturing Sweden AB. (2009, September,
17).
Monica Arvidsson Business Administrator, Husqvarna AB. (2009, November, 23)