life cycle assessment of waste car tyres at...
TRANSCRIPT
Life Cycle Assessment of Waste Car Tyres at
Scandinavian Enviro Systems
Master of Science Thesis in Chemical and Biological Engineering
RAJA MUHAMMAD USMAN RAFIQUE DEPARTMENT OF CHEMICAL AND BIOLOGICAL ENGINEERING
CHALMERS UNIVERSITY OF TECHNOLOGY
Göteborg, Sweden, December, 2012

Life Cycle Assessment of Waste Car Tyres
Master’s Thesis in Innovative and Sustainable Chemical Engineering
RAJA MUHAMMAD USMAN RAFIQUE
Department of Chemical and Biological Engineering
CHALMERS UNIVERSITY OF TECHNOLOGY
Göteborg, Sweden, December, 2012

The Author grants to Chalmers University of Technology the non-exclusive right to publish
the Work electronically and in a non-commercial purpose make it accessible on the Internet.
The Author warrants that he/she is the author to the Work, and warrants that the Work does
not contain text, pictures or other material that violates copyright law.
The Author shall, when transferring the rights of the Work to a third party (for example a
publisher or a company), acknowledge the third party about this agreement. If the Author has
signed a copyright agreement with a third party regarding the Work, the Author warrants
hereby that he has obtained any necessary permission from this third party to let Chalmers
University of Technology store the Work electronically and make it accessible on the
Internet.
Life Cycle Assessment of Car Tyres at Scandinavian Enviro Systems, Göteborg
Raja Muhammad Usman Rafique
© Raja Muhammad Usman Rafique December, 2012.
Examiner: Hans Theliender
Supervisor: Gregory Peters
Nick Rafey
Chalmers University of Technology
Department of Chemical and Biological Engineering
SE-412 96 Göteborg
Sweden
Telephone +46 (0) 738790005
Department of Chemical and Biological Engineering
Göteborg, Sweden, December, 2012.
i
Abstract:
The aim of this thesis is to compare end of life tyre (ELT) treatment technologies. The
environmental impacts of the newly developed technique for recycling of tyres are calculated
and compared with the traditional pyrolysis process.
Life cycle assessment (LCA) is applied to calculate the environmental impacts of newly
developed CFC (carbonized by forced convection) process. The impacts calculated are based
on the Eco-indicator 99 (Hierarchist approach) method provided by Gabi 4 software. The
final results show that CFC is better option for the recycling of waste tyres and has less
environmental impacts.

ii
Acknowledgements: After the several months of work it took to produce the few pages before you, a few people
who provided support to this project need to be thanked. I am heartily thankful to my
supervisor Dr. Gregory Peters, whose encouragement, guidance and support from the initial
to the final level enabled me to develop an understanding of the subject.
Secondly, my contact persons at Scandinavian Envirosystems, Nick Rafey, Olov Ershag,
Bengt-Sture Ershag and Ola Ekman who always helped and guided me in understanding the
CFC process.
I would like to thank my parents, elder sister, and brothers. They were always supporting me
and encouraging me with their best wishes.
Special thanks to my friends, Usman and Mehboob for motivating me and always helping me
in any kind of problem.
Göteborg, December, 2012
Raja Usman

iii
Abbreviations:
BR: Poly butadiene rubber.
CB: Carbon Black.
CI: Cast Iron.
CFC: Carbonized by force convection.
DALY: Disability adjusted life years.
ELT: End of life tyres.
ETRMA: European tyre and rubber manufacturing association.
LCI: Life cycle Inventory.
LCIA: Life cycle impact analysis.
NMVOC: non-methane volatile organic compounds.
PAH: Polycyclic aromatic hydrocarbons.
PG: Power Generation.
SBR: Styrene butadiene rubber.
TCR: Trelleborg cold reclaiming.
TDA: Tyre derived aggregate.
TDF: Tyre derived fuel.
TP: Treatment Process.

iv
Table of Contents Acknowledgements: ................................................................................................................................ ii
Abbreviations: ........................................................................................................................................ iii
List of Tables: ........................................................................................................................................ vi
List of Figures: ...................................................................................................................................... vii
1 Introduction ...................................................................................................................................... 1
1.1 Background: .................................................................................................................................. 1
1.1.1 Producer responsibility: ......................................................................................................... 2
1.1.2 Tax system: ............................................................................................................................ 2
1.1.3 Free market system: ............................................................................................................... 2
1.2 Overview of waste tyre problem: .................................................................................................. 2
1.2.1 Collection and handling waste tyres: ..................................................................................... 3
1.2.2 Fire hazards: ........................................................................................................................... 3
1.2.3 Environmental hazards: .......................................................................................................... 3
1.3 Sustainable Process: ...................................................................................................................... 3
1.4 Overview of the report: ................................................................................................................. 4
2 Literature review .................................................................................................................................. 5
2.1 Life Cycle Assessment (LCA): ..................................................................................................... 5
2.2 Recycling of Waste Tyres: ............................................................................................................ 7
2.2.1 Retreading: ............................................................................................................................. 7
2.2.2 Shredding: .............................................................................................................................. 7
2.2.3 Cryogenic Shredding: ............................................................................................................ 8
2.2.4 Uses of Crumb Rubber:........................................................................................................ 10
2.2.5 Reclaiming of crumb rubber: ............................................................................................... 10
2.2.6 Used as Tyre Derived Fuel (TDF): ...................................................................................... 11
2.2.7 Used for civil engineering purposes:.................................................................................... 11
2.2.8 Used for sports turf and different surfaces: .......................................................................... 12
2.2.9 Pyrolysis of waste tyres: ...................................................................................................... 12
2.3 Goal and Scope: .......................................................................................................................... 14
2.3.1Goal: ...................................................................................................................................... 14
2.3.2 Scope: ................................................................................................................................... 14
2.5 Allocation:................................................................................................................................... 14
2.6 Data Collection: .......................................................................................................................... 14
2.7 Avoided product from valuable products: .................................................................................. 15
2.8 Impact Assessment Methodology: .............................................................................................. 15

v
2.9 GaBi Software: ............................................................................................................................ 15
2.10 Limitations: ............................................................................................................................... 16
3 Life cycle Inventory: .......................................................................................................................... 18
3.1Power supply:............................................................................................................................... 18
3.2 Composition of new tyres: .......................................................................................................... 18
3.3 CFC Technology: ........................................................................................................................ 18
3.3.1 Carbon Black: ...................................................................................................................... 19
3.3.2 Oil: ....................................................................................................................................... 19
3.3.3 Gas: ...................................................................................................................................... 19
3.3.4 Steel: .................................................................................................................................... 19
3.4 Pre-process: ................................................................................................................................. 19
3.4.1 Optional pre-process: ........................................................................................................... 19
3.4.2 Start up: ................................................................................................................................ 20
3.4.3 Heating Unit: ........................................................................................................................ 20
3.4.4 Reactor Unit: ........................................................................................................................ 20
3.4.5 Cooling Process: .................................................................................................................. 20
3.5 Post Process: ............................................................................................................................... 21
3.5.1 Magnetic Separator: ............................................................................................................. 21
3.5.2 Milling Process: ................................................................................................................... 21
3.5.3 Granulation (Pelletizing): ..................................................................................................... 21
3.5.4 Drying: ................................................................................................................................. 21
3.5.4 Packaging Process: ............................................................................................................... 21
4. Life cycle Impact Assessment (LCIA) .............................................................................................. 24
4.1 Impact Categories: ...................................................................................................................... 24
4.1.1 Climate Change: ................................................................................................................... 24
4.1.2 Respiratory (Inorganic): ....................................................................................................... 25
4.1.3 Respiratory (Organic): ......................................................................................................... 26
4.1.4 Carcinogenic: ....................................................................................................................... 26
4.1.5 Acidification/Nutrification: .................................................................................................. 27
4.1.6 Ecotoxicity: .......................................................................................................................... 27
4.1.7 Fossil Fuels: ......................................................................................................................... 28
4.2 Normalized and weighted results: ........................................................................................... 28
4.3: Discussion: ................................................................................................................................. 29
4.4 Conclusion and Recommendations: ............................................................................................ 30
Appendices:........................................................................................................................................... 32
Bibliography ......................................................................................................................................... 35

vi
List of Tables:
Table 1: Pyrolysis Yield (wt %) (19) .................................................................................................... 13
Table 2: Elemental composition wt. %. (20) ........................................................................................ 13
Table 3: End products after Pyrolysis of waste Tyres........................................................................... 13
Table 4: Avoided product from valuable products ............................................................................... 15
Table 5: weight percentage of different component of waste tyres (22) ............................................... 18
Table 6: rubber vulcanization test results with carbon black from SES. .............................................. 19
Table 7: Input and output of CFC process (7 metric tonnes of waste tires) .......................................... 22
Table 8: Electricity Requirement and Emissions (For 1 metric tonne of waste tires) .......................... 22
Table 9: Input and Output of Conventional Pyrolysis Process (7 metric tonnes) ................................. 22
Table 10: Composition of Pyrolysis gas ............................................................................................... 24
Table 11: Normalization and weighted values from Eco-Indicator 99 (Hierarchist) (21) .................... 28
Table 12: Comparison between different Pyrolysis process and CFC process ..................................... 31
Table 13: Combustion Analysis of Pyrolysis gas ................................................................................. 32
Table 14: Properties of Carbon Black N330 and N550 ........................................................................ 34
vii
List of Figures:
Figure 1: ELT recovery route (3) ............................................................................................................ 1
Figure 2: Life Cycle Stages (9) ............................................................................................................... 5
Figure 3: LCA Procedure base on Bauman and Tillman (10) ................................................................ 6
Figure 4: average price of crumb rubber vs. size (13) ............................................................................ 8
Figure 5: Shredding Process (14) ............................................................................................................ 9
Figure 6: Waste tyre life cycle Hierarchy ............................................................................................. 17
Figure 7: Products % after recycling by CFC Technology (24; 25) ..................................................... 18
Figure 8: Process description CFC Plan ............................................................................................... 23
Figure 9: Climate Change ..................................................................................................................... 25
Figure 10: Respiratory (Inorganic) ....................................................................................................... 25
Figure 11: Respiratory (Organic) .......................................................................................................... 26
Figure 12: Carcinogenic ........................................................................................................................ 26
Figure 13: Acidification/Nutrification .................................................................................................. 27
Figure 14: Ecotoxicity ........................................................................................................................... 27
Figure 15: Fossil Fuel ........................................................................................................................... 28
Figure 16: Comparison of total impacts of Pyrolysis and CFC process ............................................... 29
Figure 17: GaBi Model for CFC process. ............................................................................................. 33

Chapter 1: Introduction
1
1 Introduction:
1.1 Background: It is estimated that around 3.5 million tonnes of waste tyres are generated per year in Europe.
The largest contributors to these waste tyres are Germany, France Italy, Spain and Poland.
Over the years waste tyre disposal has been a major environmental problem arising from both
economical and technical issues. Since the adoption of the Landfill Directive in 1999 (1) by
the European Union, tyres are in that category which should not be landfilled at any cost, so
an environmentally sustainable method is required to handle a large amount of tyres produced
every year. According to this directive, tyres were banned from landfill in whole form and
this directive has been also applicable to shredded tyres from July 2003. Before this tyres
were stockpiled and dumped (2). According to ETRMA (European Tyre and Rubber
Manufacturing Association) report 2010 (3), a positive trend is seen in the management of
ELT (End of Life Tyres). The tyre recycling rate reached almost 96 % and shows a positive
trend in recycling tyres in EU. This achievement also promotes Europe as one of the most
advanced regions in the world in the recycling and recovery of tyres. The cement industry is
making a major contribution by using tyres as fuel because tyres have high energy content
while steel is used as a secondary raw material. According to the ETRMA report the annual
cost for handling the ELT is around 600 million Euros.
Before the landfill directive a large proportion of the waste tyre flow in the EU were
landfilled, but after that rate of recycling of the tyres increased rapidly and landfilling
decreased from 32% to 4 % in 2009. Figure 1 shows how efficiently the recycling of used
tyres is taken place in European Union since after the landfill directive. The major markets
are for energy recovery (45%) and material recovery (41%).
Figure 1: ELT recovery route (3)

Chapter 1: Introduction
2
The rate of recycling of tyres is due to management systems developed by EU countries, and
they vary from country to country:
Producer responsibility
Tax System
Free market system
1.1.1 Producer responsibility:
In EU there are three systems working for the managing the waste tires. The first system is
producer responsibility. In this system the tire manufacturer and importer are responsible for
organising and setting up a framework for end of life tires. The tire manufacturing companies
finance collaboration with non-profit companies for collection and recovery of end of life
tires through most economical way. This system is most economical suitable in a long run for
resolving end of life tire arising and also to achieve 100% recycling (3).
1.1.2 Tax system:
The second system for managing the waste tires is to use the tax system. In this system every
country is responsible for implementing the tax on tire manufacturers. It is financed by a tax
levied on (tyre) production and subsequently passed on to the customer. This is an
intermediate system and tax is collected by state and hence state is responsible for
collaborating with the non-profit organizations for recovery of end of life tires (3).
1.1.3 Free market system:
The third system for managing the waste tires is free market system. In this system the
legislation sets the objectives to be met but does not designate those responsible. In this way
all the operators in the recovery chain contract under free market conditions and act in
compliance with legislation. This may be backed up by voluntary cooperation between
companies to promote best practices. The countries which are already operating under free
market system are Austria, Bulgaria, Croatia, Germany, Ireland and Switzerland.
Recycling tyres is gaining wider acceptance due to the increase in raw material prices and
growing environmental awareness among governments, manufacturers and consumers. Now
after achieving 96% ELT recycling, the tyres associations are looking for environmentally
friendly and economical options for tyre recycling (3).
1.2 Overview of waste tyre problem: The generation of waste tyres is major environmental concern for because of fire hazards,
environmental hazards, land usage etc. Now after the legislation implemented in EU
stockpiling is banned, but still there are many illegal stockpiles present in the EU. According
to the ETRMA report 2010 current estimate for these historic stockpiles throughout the EU
stands at 5.5 million tonnes (1.73 times the tyres produced in 2009 mass of waste 2009) (3).

Chapter 1: Introduction
3
1.2.1 Collection and handling waste tyres:
As a large number of used tyres are produced every year it is very difficult to handle this
much waste. The major problems with dumping tyres are:
Large space is required.
The large sites for stockpiling the waste tyres are often hazardous for health and they
spread diseases by holding water for a longer period of time and providing sites for
breeding of mosquitoes.
Tyres tend to float and come up to the surface after dumping.
The above problems can be solved by shredding the tyres but shredding
cost is high.
1.2.2 Fire hazards:
Tyres contain flammable and toxic materials, like carbon, sulphur, rubber,
oil, and benzene. The potential for tyre stockpile ignition is due to the 75%
void space in scrap tyres stockpiles. If they catch fire they are hard to
extinguish because tyres have high fuel contents: 9.02 to 9.6 KW/hr versus
5.15 to 7.73 KW/hr. per Kg for coal (4). Water on tyres increase the
production of pyrolytic oil and provide the mode of transportation oil and
hazardous chemicals off site and contaminating soil and ground water.
1.2.3 Environmental hazards:
Open burning of tyres produces many toxic gases which are extremely harmful for
environment and human health. The burning of tyres releases benzene, lead, polycyclic
aromatic hydrocarbons (PAH), dioxins and furans. (5). The PAHs are fat soluble and not
easily degradable in environment and may to accumulate in living organisms. (6) Burning of
tyres also pollutes the soil and ground water. The tyre stockpiles are also ideal breeding place
for mosquitoes and pests and they causes harmful diseases like LaCrosse encephalitis and
West Nile virus which can be fatal to humans (7)
1.3 Sustainable Process: After collecting the waste tyres there are different ways to treat them depending upon the end
use. Tyres are now considered a resource instead of waste because of their different
applications and high value relative to the recovery cost. ELT can be used as fuel in cement
kilns or can be recycled into different useful components. These methods are an option for
handling the huge amount of waste tyres; however a major goal is to look for sustainable and
profitable method for recycling waste tyres and also process as with lower environmental
impacts.

Chapter 1: Introduction
4
1.4 Overview of the report: This report includes a review of the existing processes for the treatment of waste tyres the
structure of the report is based on the international standard for LCA. The main stages for
LCA are:
1. Aim and scope
2. Inventory analysis
3. Life cycle impact assessment (LCIA)
4. Results interpretation
The introductory chapter includes the introduction and background of the problems due to the
tyre waste. The second chapter contains the literature review about different tyre recycling
processes, and goal and scope of the thesis. This part also includes system boundaries,
allocations, impact assessment methodology and limitations. The third part includes Life
cycle inventory (LCI) data compilation and analysis. In this part the whole CFC process is
described and also the material and energy balance of the process is described. The fourth
chapter includes Life Cycle Impact Analysis (LCIA). In this part different impact categories
are discussed and impacts are calculated using software Gabi 4. The fifth chapter includes the
Life cycle interpretation; in this part the results of different impact categories are interpreted.
After Life cycle interpretation the next parts includes the conclusion and then the
recommendations to make the process better and to reduce the impacts of the process on the
environment.

Chapter 2: Literature Review
5
2 Literature review
2.1 Life Cycle Assessment (LCA): Life cycle assessment (LCA) is process analysis method and is cradle-to-grave approach for
analyzing industrial systems. Cradle-to-grave method begins with the raw material for the
production of a specified product, the usage of that product and after usage the recycling of
that product till all the material returns to earth. LCA enables the estimation of the cumulative
environmental impacts resulting from all stages in the product life cycle. (8)
LCA of the system relates to the different processes through the life span of the product. In
these process the raw material acquisition, manufacturing, use and reuse of the product and
recycling (waste management) of the product. During these processes the inputs and outputs
of the process are measured for calculating the impacts of the process. Figure – shows
different stages of LCA.
Figure 2: Life Cycle Stages (9)
Life cycle process is a systematic approach, consist of four steps. According to ISO 14044
life cycle assessment includes four steps. The four main steps for LCA are:
1. Goal and scope definition.
2. Inventory analysis.
3. Impact Assessment.
4. Interpretation.
Chapter 2: Literature Review
6
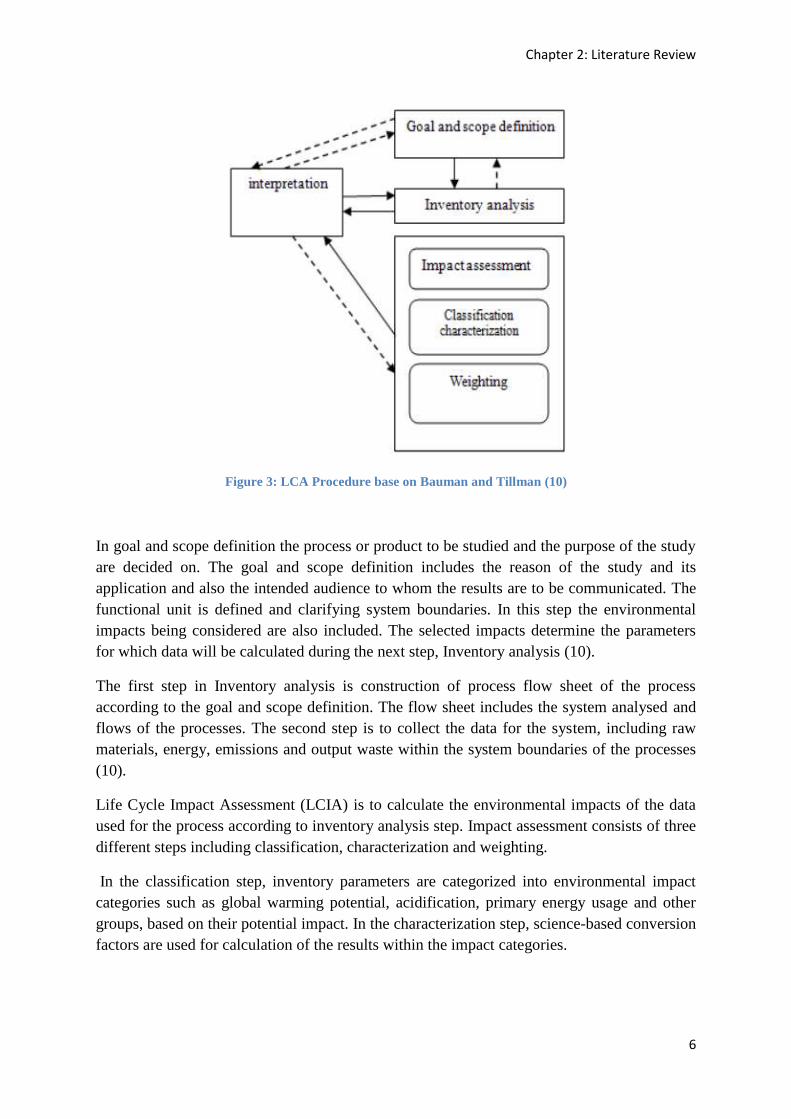
Figure 3: LCA Procedure base on Bauman and Tillman (10)
In goal and scope definition the process or product to be studied and the purpose of the study
are decided on. The goal and scope definition includes the reason of the study and its
application and also the intended audience to whom the results are to be communicated. The
functional unit is defined and clarifying system boundaries. In this step the environmental
impacts being considered are also included. The selected impacts determine the parameters
for which data will be calculated during the next step, Inventory analysis (10).
The first step in Inventory analysis is construction of process flow sheet of the process
according to the goal and scope definition. The flow sheet includes the system analysed and
flows of the processes. The second step is to collect the data for the system, including raw
materials, energy, emissions and output waste within the system boundaries of the processes
(10).
Life Cycle Impact Assessment (LCIA) is to calculate the environmental impacts of the data
used for the process according to inventory analysis step. Impact assessment consists of three
different steps including classification, characterization and weighting.
In the classification step, inventory parameters are categorized into environmental impact
categories such as global warming potential, acidification, primary energy usage and other
groups, based on their potential impact. In the characterization step, science-based conversion
factors are used for calculation of the results within the impact categories.

Chapter 2: Literature Review
7
The weighting step is optional for highlighting important potential impacts. Different
weighting methods, such as Eco-indicator 99 or EDIP, can be applied for summarizing the
results in the impact assessment, resulting in a single figure that is easier to explain (10).
2.2 Recycling of Waste Tyres: The main emphasis in literature review is on pyrolysis process because this process is
somewhat similar to the newly developed CFC process. The different methods used are:
Reuse of car tyres
Retreading
Shredding
Used as a fuel in cement kilns
Pyrolysis
Gasification
2.2.1 Retreading:
Retreading is a process which increases the life span of the tyre and it is basically the
remanufacturing of the tyre. For production of new car tyre 28 litres of oil are required but for
retreading of car tyre only 5.5 litres of oil are used (11). To retread a tyre it is necessary that
the tyre carcass is in good condition, otherwise this process is not applicable for recycling of
waste tyres. Retreading of the car tyre is only done once in the life cycle of a tyre. In
retreading process the old tread of the tyre is removed by a process called buffing. After
buffing the tyre a flat surface is formed, on which a tread is vulcanized. Retreading is of two
types:
1. Hot retreading.
2. Cold retreading.
Hot Retreading:
In hot retreading process after buffing the old tyre, an unvulcanised rubber is applied on the
tyre and then it is vulcanized in a heating press. Hot retreading process is done at 150 °C. Hot
retreading process is good for tyres having poor conditions of carcass, but in this process we
need separate moulds for every tread size and it has a high capital investment.
Cold Retreading:
In cold retreading process after buffing a precured tread is applied on the buffed tyre and
adhesive is used to paste the tread on the tyre. Cold retreading is done at 95-110 °C (11).
Cold retreading process needs less investment and is considered good for the performance of
the tyre.
2.2.2 Shredding:
Tyres which are not able to be retreaded undergo a shredding process. Shredding reduces
almost 75 percent of the volume of the waste tyres. For shredding 19.2 KWh energy is
required to shred 1000 Kg of waste tyres (12). Shredded tyres are used for different
applications depending upon the size of shredded rubber, but the cost for shredding increases
significantly as the size decreases as shown in fig. 2:

Chapter 2: Literature Review
8
Figure 4: average price of crumb rubber vs. size (13)
At first the whole tyres are fed into the large shredder where the tyres are shredded into large
chunks of approximately 7.62-10.16 centimetres, then these large pieces of shredded tyres
undergoes heavy shredding to produce tyre chips of small size approx. 0.635 centimetres.
These tyre chips are used for power generation like in cement kilns as tyre derived fuel
(TDF). Subsequently these tyre chips undergo a series of granulations to produced crumb
rubber of different sizes; crumb rubber has size 0.9525 centimetres or less. Crumb rubber is
divided into four main groups,
1. Large or coarse (0.9525 and 0.635)
2. Mid-range (10–30 mesh or 0.079–0.039)
3. Fine (40–80 mesh or 0.016–0.007)
4. Superfine (100–200 mesh or 0.006–0.003) (14)
2.2.3 Cryogenic Shredding:
Cryogenic shredding is used to obtain better quality product and for complete removal of
metal from rubber. In cryogenic shredding the whole car tyre or tyre chips are first cooled
down to -80 °C (far below the glass transition temperature) by using liquid nitrogen. At this
temperature tyres become brittle and are easy to crush and to separate rubber, steel and fibre.
The major negative impact of the cryogenic process is that it’s a costly process due to the
usage of liquid nitrogen as coolant.

Chapter 2: Literature Review
9
Figure 5: Shredding Process (14)
Waste Tires
First Shredder
Second Shredder
Magnetic Separator
Granulator
Fibre Separator
Magnetic Separator
Powdering
Screening
96 % Steel Separated
Fibre
125 KWhr/metric Tonne
Metal (Steel)
95 % Fibre Separated
99.99 % Steel Removed
< 150mm
< 20mm
< 1mm (20 Mesh)

Chapter 2: Literature Review
10
2.2.4 Uses of Crumb Rubber:
As crumb rubber is free of metal and fibre so it is used for different application depends upon
the size and requirement. Different applications of crumb rubber are:
Used to produce reclaimed rubber.
Used as TDF in cement Kilns.
Used to replace virgin material.
Used for children’s playground surfaces and tracks.
Used as soil amendment for sports turf.
Used in road construction.
Used for civil engineering purposes for construction.
2.2.5 Reclaiming of crumb rubber:
Reclamation of scrap tyres is basically a process of devulcanisation of crumb rubber. For the
manufacturing process of scrap tyres the rubber is vulcanized by using sulphur, peroxides and
different other methods for improving the dynamic properties of tyres and prevent the tyre
from cracks, however the use of sulphur makes the tyre less heat resistant. The reclamation
process the tyres are shredded to a crumb rubber of suitable size, and then steel and fibre are
removed by magnetic separator and fibre separator. After the separation of steel and fibre the
rubber is more grinded to a finer size and then mixed with different reclaiming agent depend
upon their function and reaction with the process (15). Reclamation of crumb rubber is done
by different thermal, thermo-mechanical and mechano-chemical methods (15). The processes
used for reclamation are:
Thermal processes:
Heater or pan.
Digester.
Alkaline.
Neutral.
High-pressure steam.
Engelke.
Continuous steam.
Thermo-mechanical processes:
The thermo- mechanical processes for reclamation are:
High-speed mixing
Reclaimator.
Mechano-chemical processes:
The Mechano- Chemical processes for reclamation are:
Trelleborg cold reclaiming (TCR).
De-Link.
Swelling in benzene with a sulfoxide.
Chapter 2: Literature Review
11
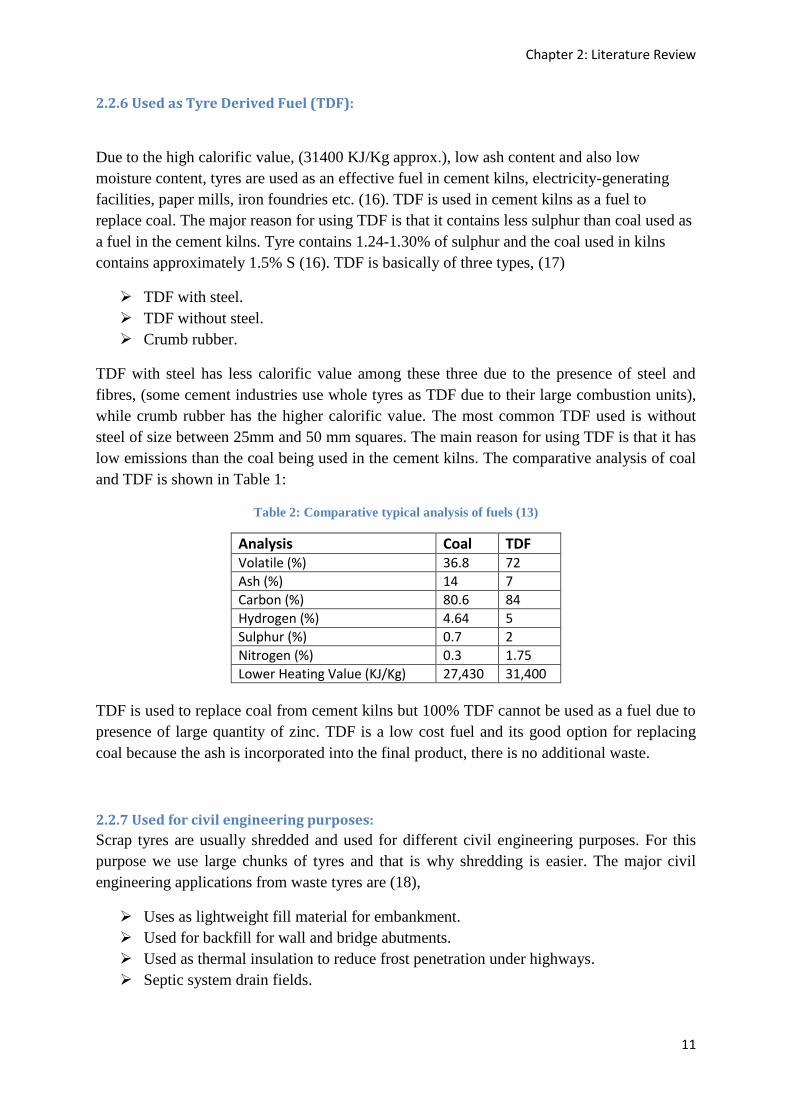
2.2.6 Used as Tyre Derived Fuel (TDF):
Due to the high calorific value, (31400 KJ/Kg approx.), low ash content and also low
moisture content, tyres are used as an effective fuel in cement kilns, electricity-generating
facilities, paper mills, iron foundries etc. (16). TDF is used in cement kilns as a fuel to
replace coal. The major reason for using TDF is that it contains less sulphur than coal used as
a fuel in the cement kilns. Tyre contains 1.24-1.30% of sulphur and the coal used in kilns
contains approximately 1.5% S (16). TDF is basically of three types, (17)
TDF with steel.
TDF without steel.
Crumb rubber.
TDF with steel has less calorific value among these three due to the presence of steel and
fibres, (some cement industries use whole tyres as TDF due to their large combustion units),
while crumb rubber has the higher calorific value. The most common TDF used is without
steel of size between 25mm and 50 mm squares. The main reason for using TDF is that it has
low emissions than the coal being used in the cement kilns. The comparative analysis of coal
and TDF is shown in Table 1:
Table 2: Comparative typical analysis of fuels (13)
Analysis Coal TDF Volatile (%) 36.8 72
Ash (%) 14 7
Carbon (%) 80.6 84
Hydrogen (%) 4.64 5
Sulphur (%) 0.7 2
Nitrogen (%) 0.3 1.75
Lower Heating Value (KJ/Kg) 27,430 31,400
TDF is used to replace coal from cement kilns but 100% TDF cannot be used as a fuel due to
presence of large quantity of zinc. TDF is a low cost fuel and its good option for replacing
coal because the ash is incorporated into the final product, there is no additional waste.
2.2.7 Used for civil engineering purposes:
Scrap tyres are usually shredded and used for different civil engineering purposes. For this
purpose we use large chunks of tyres and that is why shredding is easier. The major civil
engineering applications from waste tyres are (18),
Uses as lightweight fill material for embankment.
Used for backfill for wall and bridge abutments.
Used as thermal insulation to reduce frost penetration under highways.
Septic system drain fields.

Chapter 2: Literature Review
12
Scrap tyres are used in civil engineering purposes because of good physical properties, the
main useful properties of Tyre Derived Aggregate (TDA) are (18),
Water absorption capacity.
Unit weight (720 and 930 Kg per cubic meter).
Shear strength.
Long-term and short-term deformation and compressibility.
Thermal conductivity (for 7.62 cm. maximum size 0.000525 W/m.K.)
Hydraulic conductivity.
These properties of scrap tyres (Shredded) are compared with mineral aggregate, coarse sand
or gravel. Due to the light weight, high porosity and lower density of scrap tyres are easier to
use for different applications. Shredded tyres have also low impact on the ground water, and
it also reduces the construction cost as well.
2.2.8 Used for sports turf and different surfaces:
Scrap tyres are used for sports turf, play grounds for children and for different indoor
surfaces. For these uses the scrap tyres are shredded to crumb rubber of different sizes
mechanically and all the steel and fibre is removed using magnetic separator. Usage of scrap
tyres for these surfaces has also potential benefits regarding to health and environmental
aspects. The major benefits are (19):
Usage of crumb rubber for these surfaces decreases the chances of injuries of athletes.
These sports turf have good porosity, drainage and resiliency of the soil.
The turfs are long lasting and age of these turfs varies from 10-25 years.
These turfs are economical, long lasting and little maintenance.
Good option for usage of recycling of tyres.
Rubber turfs are also softer than the natural grass and have less chance of injuries as well
specially in cold season. Another good environmental impact of usage of these turfs is that
the requirement of water also decreases, and it does not require use of any chemical
pesticides, herbicides, fertilizers and fuel-powered maintenance equipment (20). However
these turfs have some problems in its usage as well, like newer turf field contained PAHs
level above health soil standard, but with the passage of usage the PAHs level decreases.
2.2.9 Pyrolysis of waste tyres:
The thermal degradation of car tyres in the absence of oxygen is called pyrolysis of tyres.
From pyrolysis of tyres the components generated are carbon, steel, gases and oil. The steel
obtained is recycled and then reused, oil obtained is similar to diesel and can be used to run
power plant, and rubber is used to make to different plastics. The carbon obtained from
pyrolysis of tyres is not of good quality and cannot be used in manufacturing of new car
tyres. The carbon obtained is then converted to carbon black or activated carbon. The major
applications of activated carbon are water purification, air purification and some special
applications such as fuel cells and nuclear power station (21). Pyrolysis of tyres is a better
option for recycling than retreading, shredding, TDF and other processes, but it has certain
limits that the products obtained are not of good quality, and hence the economy of the
Chapter 2: Literature Review
13
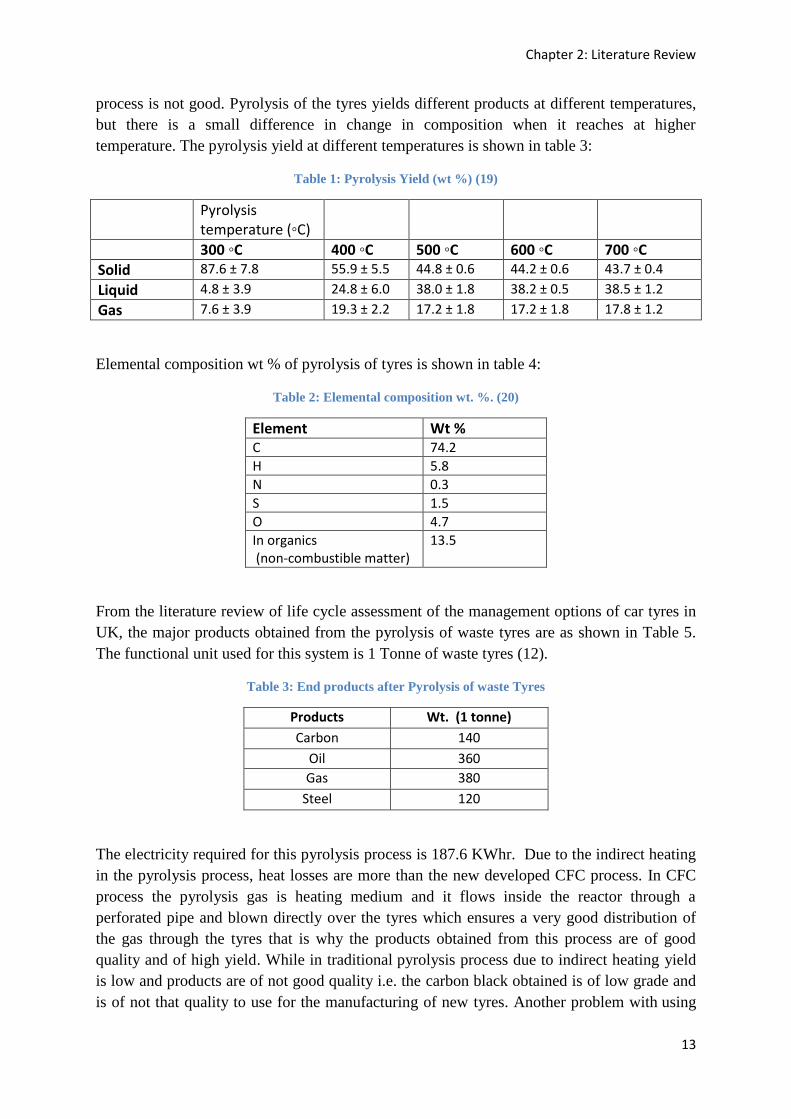
process is not good. Pyrolysis of the tyres yields different products at different temperatures,
but there is a small difference in change in composition when it reaches at higher
temperature. The pyrolysis yield at different temperatures is shown in table 3:
Table 1: Pyrolysis Yield (wt %) (19)
Pyrolysis
temperature (◦C)
300 ◦C 400 ◦C 500 ◦C 600 ◦C 700 ◦C
Solid 87.6 ± 7.8 55.9 ± 5.5 44.8 ± 0.6 44.2 ± 0.6 43.7 ± 0.4
Liquid 4.8 ± 3.9 24.8 ± 6.0 38.0 ± 1.8 38.2 ± 0.5 38.5 ± 1.2
Gas 7.6 ± 3.9 19.3 ± 2.2 17.2 ± 1.8 17.2 ± 1.8 17.8 ± 1.2
Elemental composition wt % of pyrolysis of tyres is shown in table 4:
Table 2: Elemental composition wt. %. (20)
Element Wt %
C 74.2
H 5.8
N 0.3
S 1.5
O 4.7
In organics (non-combustible matter)
13.5
From the literature review of life cycle assessment of the management options of car tyres in
UK, the major products obtained from the pyrolysis of waste tyres are as shown in Table 5.
The functional unit used for this system is 1 Tonne of waste tyres (12).
Table 3: End products after Pyrolysis of waste Tyres
Products Wt. (1 tonne)
Carbon 140
Oil 360
Gas 380
Steel 120
The electricity required for this pyrolysis process is 187.6 KWhr. Due to the indirect heating
in the pyrolysis process, heat losses are more than the new developed CFC process. In CFC
process the pyrolysis gas is heating medium and it flows inside the reactor through a
perforated pipe and blown directly over the tyres which ensures a very good distribution of
the gas through the tyres that is why the products obtained from this process are of good
quality and of high yield. While in traditional pyrolysis process due to indirect heating yield
is low and products are of not good quality i.e. the carbon black obtained is of low grade and
is of not that quality to use for the manufacturing of new tyres. Another problem with using

Chapter 2: Literature Review
14
the traditional pyrolysis process to recycle tyres is that it is hard to control the heating and
pressure of the process.
2.3 Goal and Scope:
2.3.1Goal:
The main aim of this thesis is to evaluate and compare potential environmental impacts of
pyrolysis and the CFC process, a newly developed process for tyre recycling by Scandinavian
Enviro Systems (SES). The study should identify any advantages of this process and point
out the improvements required in this process regarding to energy and environment because
this process is on pilot plant scale and soon it will be shifted to a full process plant scale.
2.3.2 Scope:
The focus of this study is the environmental impact of the ELT by associated with newly
developed process by SES. The operations involved in ELT are material recovery and energy
recovery. In material recovery the tyres are shred, and ground to recover materials like steel
and rubber. In energy recovery the tyres are used in cement kilns or in furnaces as a fuel.
The functional unit used for the calculation of environmental impacts assessment is the
processing of one batch (7 tonnes) of tyres. These calculations are for full scale process plant.
The CFC process is a batch process. This study covers the waste treatment of car tyres by
CFC technology, and also the impact analysis of this process. The system boundaries of this
life cycle analysis are mainly that this study is from gate to grave and relates after the usage
of the tyres by the user till its recycling and conversion of waste tyres into useful products.
This study is for the recycling of car tyres in EU, but the process developed by CFC can be
used for all types of tyres. The impact assessment is based on the Swedish electricity mix.
2.5 Allocation: The CFC process used by Scandinavian enviro systems is on pilot plant scale and soon the
full process plant will be launched, so the data used for LCA is taken from pilot plant.
Allocation has been avoided by expanding the system boundaries wherever possible. The
mass balance and energy balance data is converted from pilot plant scale to full scale process.
2.6 Data Collection: Data used for the life cycle assessment of CFC process was taken from the pilot plant of CFC
process and is later upscaled for the full process plant. The data used for the other processes
was taken from previous research studies and different tyre companies in EU. The data
extracted from the pilot plant is upscaled, so there might be error of less than 5% in quality of
the data.

Chapter 2: Literature Review
15
2.7 Avoided product from valuable products: After recycling of the tyres we get the many useful by-products, but the recycled material
may not be accepted as substitution for the virgin materials because of its properties and
market value. The LCI data for avoided product is also taken from Gabi software. So from
literature survey, Gabi software and previous studies of LCA of tyres the following
assumptions are taken (22):
Table 4: Avoided product from valuable products
Products Ratio
Carbon black 1:0.5
Cast iron 1:1
Oil 1:0.5
2.8 Impact Assessment Methodology:
The impact assessment and interpretation is done according to the ISO guidelines. The impact
assessment methodology Eco-indicator 99 (Hierarchist approach) provided by Gabi software
(23) is used to calculate the environmental impacts of CFC process. It is characterized as
damage-oriented approach, modelling damage into three categories: ecosystem quality,
human health and resources. Three perspectives based on different assumption regarding the
cultural perspectives and impact timeframe are defined in Eco-indicator 99: individualist
(higher weight to human health), egalitarian (higher weight to ecosystem quality) and
hierarchist (equal weight distribution). The Eco-Indicator 99 approach is used for the sake of
keeping a balance between short and long term effects of emissions, hierarchist valuation
approach is selected for the determination of environmental impact of tyre treatment
processes, from a hierarchist viewpoint Eco-Indicator 99 with an average weighting. (22)
The impact categories assessed are:
1. Climate change.
2. Inorganic respiratory.
3. Organic respiratory.
4. Carcinogenic.
5. Acidification/nutrification.
6. Ecotoxicity.
7. Fossil fuels.
2.9 GaBi Software:
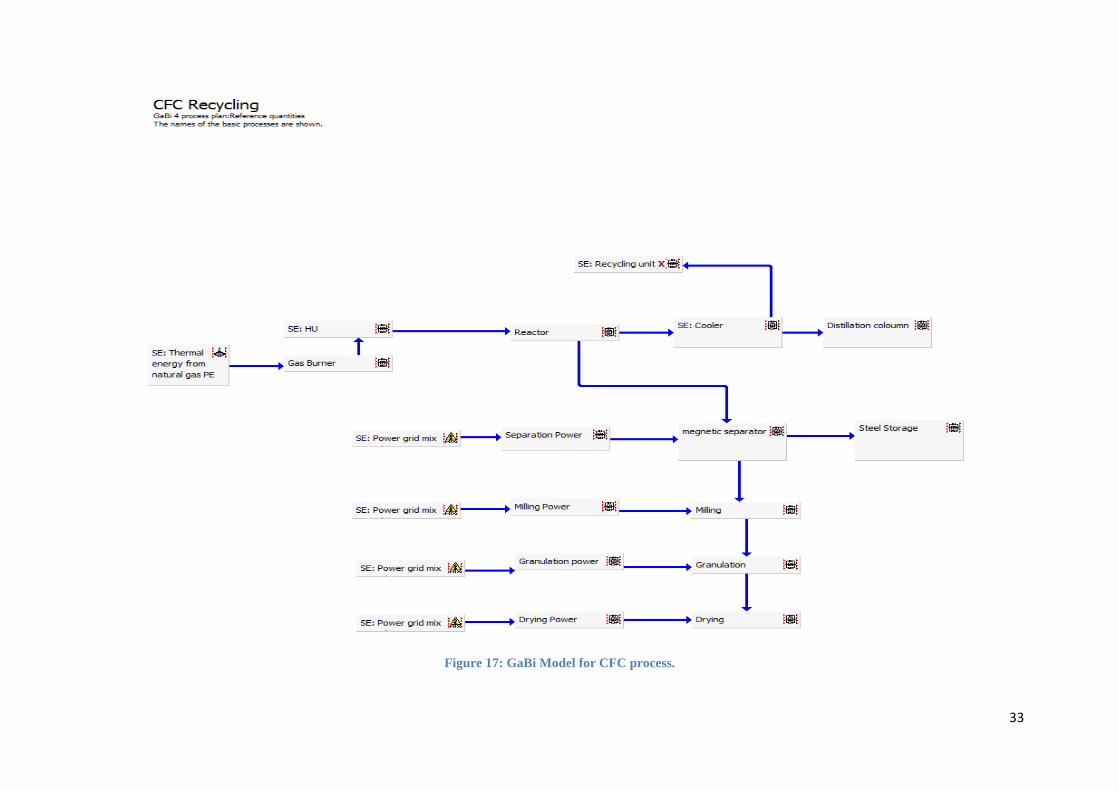
GaBi 4 software has been used for building case models and simulating the systems from a
life cycle perspective. Models for any process can be created in GaBi, material and energy
inputs and outputs, emissions, aggregate results, generate charts, and even create interactive
reports using the GaBi i-report add-on (23)

Chapter 2: Literature Review
16
2.10 Limitations: There are some limitations for the thesis. Firstly the tyre recovery systems boundaries
exclude the identical tyre life cycle stages (production, use collection, transportation and
secondary waste treatment) reduces the scope of the overall evaluation of the total potential
impacts through their life cycle. Secondly the limitation is data availability. The data
available for LCA is from a pilot scale plant; first the data is converted into full scale process
plant. When scaling up and shifting the process to the production stage, there might be
difference in data results from plant production. Data on the volume of cooling water in the
CFC process was unavailable, also for the pilot plant, data is not available for district heating
so that data is taken from literature. District heating data is different for different places and
also for some places district heating is not required so that heat can be used for other
processes where energy is required. This LCA is based on the environmental impacts only
and still the economical analysis of this process is not carried out. This report addresses the
waste treatment of car tyres in EU, but the CFC process can be used as waste treatment
method anywhere in world.

Chapter 2: Literature Review
17
Waste Tires
Collection Of Tires
Shredding
Landfilling
Grinding to crumb Rubber
Export
Tire Retreading
Tires for Reuse
Tread
Products
Used in Construction
Pyrolysis
Cement Kilns
Steel
Oil
Carbon Black
CFC Gasification
Steel
Oil
Carbon Black
Gas
Figure 6: Waste tyre life cycle Hierarchy

Chapter 3: Life Cycle Inventory
18
3 Life cycle Inventory:
3.1Power supply:
The electricity data is used from the Gabi database for Swedish power grid mix. This data is
up-to-date in 2010. During the start-up of the process power is required to run the plant but
when production starts pyrolysis gas is enough to meet the requirement of the plant.
3.2 Composition of new tyres: The major constituents of scrap tyres are natural rubber, synthetic rubber, carbon black, steel,
textile, and additives. The synthetic rubbers mainly used in tyres are SBR (styrene butadiene)
and BR (poly butadiene rubber).
Table 5: weight percentage of different component of waste tyres (22)
Tyre Composition Percentage(%)
Natural Rubber 15-19
Synthetic Rubber 25-29
Carbon Black 24-28
Steel 9-13
Textiles 5-6
Additives 14-15
3.3 CFC Technology:
The CFC process (carbonised by forced convection) is a new patented technology by SES
(Scandinavian Enviro systems). CFC technology is different from traditional pyrolysis
process. Pyrolysis is a thermochemical decomposition process without the participation of
oxygen, while in CFC process pyrolysis gas is used as a heating medium and is in direct
contact with the tyres.
After the recycling of car tyres by CFC technology the products obtained by weight percent
are 30% carbon black, 45% oil, 10% gas and 15% steel. (24)
Figure 7: Products % after recycling by CFC Technology (24; 25)
Chapter 3: Life Cycle Inventory
19
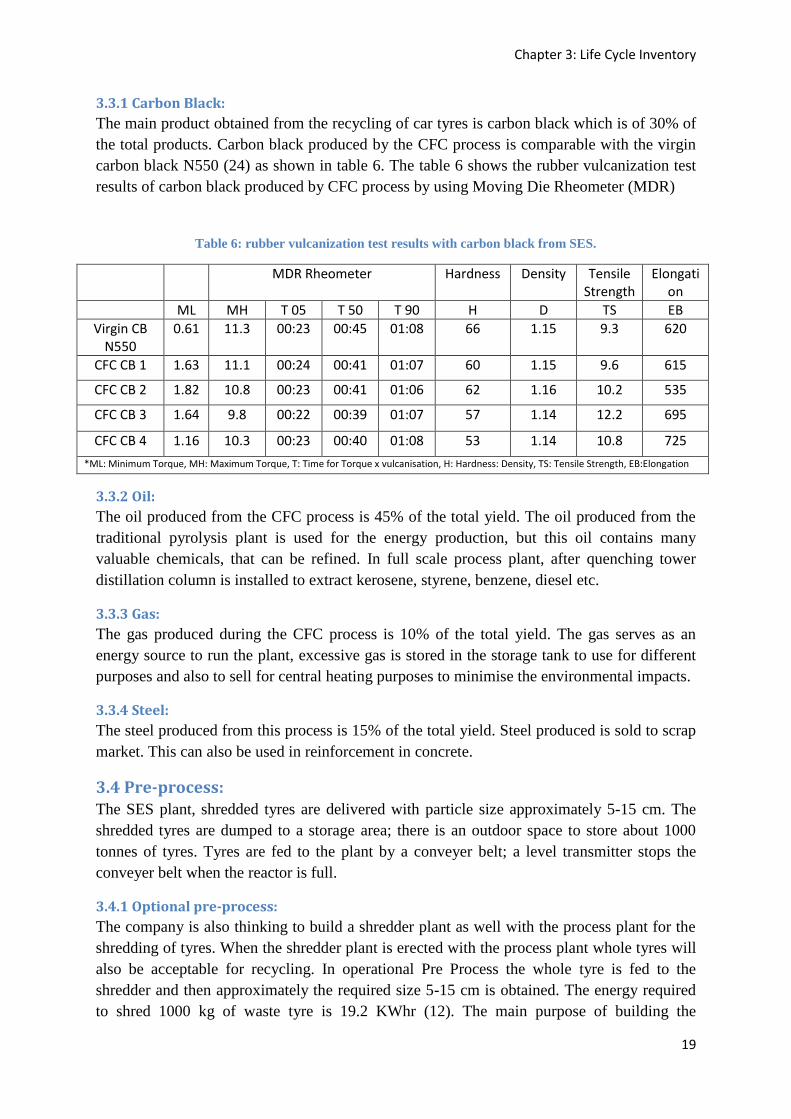
3.3.1 Carbon Black:
The main product obtained from the recycling of car tyres is carbon black which is of 30% of
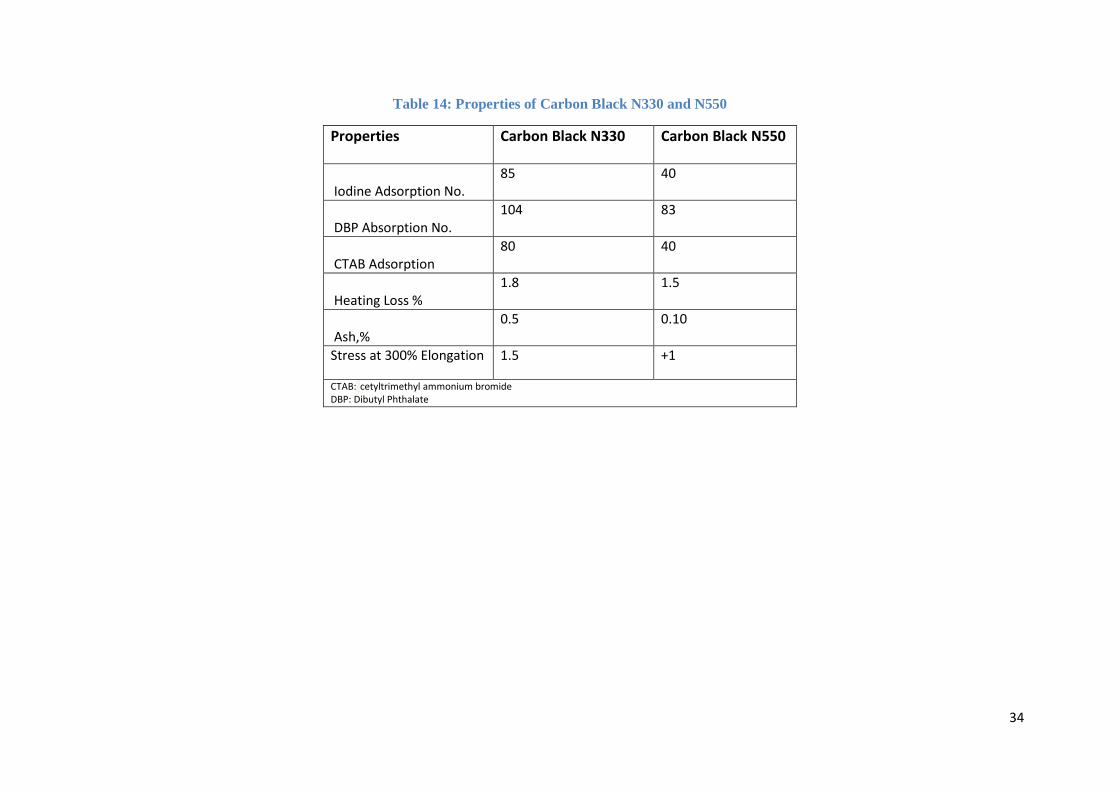
the total products. Carbon black produced by the CFC process is comparable with the virgin
carbon black N550 (24) as shown in table 6. The table 6 shows the rubber vulcanization test
results of carbon black produced by CFC process by using Moving Die Rheometer (MDR)
Table 6: rubber vulcanization test results with carbon black from SES.
MDR Rheometer Hardness Density Tensile Strength
Elongation
ML MH T 05 T 50 T 90 H D TS EB
Virgin CB N550
0.61 11.3 00:23 00:45 01:08 66 1.15 9.3 620
CFC CB 1 1.63 11.1 00:24 00:41 01:07 60 1.15 9.6 615
CFC CB 2 1.82 10.8 00:23 00:41 01:06 62 1.16 10.2 535
CFC CB 3 1.64 9.8 00:22 00:39 01:07 57 1.14 12.2 695
CFC CB 4 1.16 10.3 00:23 00:40 01:08 53 1.14 10.8 725
*ML: Minimum Torque, MH: Maximum Torque, T: Time for Torque x vulcanisation, H: Hardness: Density, TS: Tensile Strength, EB:Elongation
3.3.2 Oil:
The oil produced from the CFC process is 45% of the total yield. The oil produced from the
traditional pyrolysis plant is used for the energy production, but this oil contains many
valuable chemicals, that can be refined. In full scale process plant, after quenching tower
distillation column is installed to extract kerosene, styrene, benzene, diesel etc.
3.3.3 Gas:
The gas produced during the CFC process is 10% of the total yield. The gas serves as an
energy source to run the plant, excessive gas is stored in the storage tank to use for different
purposes and also to sell for central heating purposes to minimise the environmental impacts.
3.3.4 Steel:
The steel produced from this process is 15% of the total yield. Steel produced is sold to scrap
market. This can also be used in reinforcement in concrete.
3.4 Pre-process: The SES plant, shredded tyres are delivered with particle size approximately 5-15 cm. The
shredded tyres are dumped to a storage area; there is an outdoor space to store about 1000
tonnes of tyres. Tyres are fed to the plant by a conveyer belt; a level transmitter stops the
conveyer belt when the reactor is full.
3.4.1 Optional pre-process:
The company is also thinking to build a shredder plant as well with the process plant for the
shredding of tyres. When the shredder plant is erected with the process plant whole tyres will
also be acceptable for recycling. In operational Pre Process the whole tyre is fed to the
shredder and then approximately the required size 5-15 cm is obtained. The energy required
to shred 1000 kg of waste tyre is 19.2 KWhr (12). The main purpose of building the

Chapter 3: Life Cycle Inventory
20
shredding plant is that to recycle the tyres as much as possible and also to reduce the overall
cost of the process, because to purchase the shredded tyres costs more and affects the overall
economy of the process used.
Another optional Pre-process is tyre washer and dryer, if the incoming tyres are not clean
enough then the incoming tyres are fed to the washer, and then dryer.
3.4.2 Start up:
The pressure inside the reactor should be 1-1.2 bar and the oxygen level must be less than
4%. To decrease the oxygen level the reactor must be purged with nitrogen after closing the
reactor top valves. The root blower creates a circulating gas flow 3000 Nm3/hr through a
heating unit, reactor and cooling unit.
3.4.3 Heating Unit:
The pyrolytic gas produced after the reactor is recycled, compressed and stored. This prolytic
gas is used for heating purpose. The heating unit consists of a burner, during the start up of
the process propane is used for burning, but after the process starts the pyrolytic gas is
enough for heating purpose. The two batches are working simultaneously and through the
valves it is possible to choose that which reactor is to be processed. When one batch is
working the other one is being cooled, emptied filled and purged.
3.4.4 Reactor Unit:
The CFC process is a semi batch process; the plant consists of two reactors which take turns
to be heated, cooled, emptied, filled, and purged. It means that the heater and the cooler runs
whole times, the hot gas flows just switches between the reactors. The reactor is of height 6
meter including the top, and the width of the reactor is 2 meters, the maximum capacity of the
reactor is 7-8 tonnes. The temperature inside the reactor is 570 0C. The operating pressure of
the process is 1-1.3 bar gauge, however the design pressure for whole process is 3 bar gauge.
The exhaust gases from the gas burner are under atmospheric pressure. The gas entered into
the middle of the reactor through a perforated pipe. The pipe is divided into four zones along
its axis and the incoming gas is flowing through each zone and is controlled by valves. The
time required to complete one batch is 4 hrs.
3.4.5 Cooling Process:
The cooling process consists of two different lines, each reactor can be cooled by either line,
and the other can undergo maintenance. Two heat exchangers are used on each line for the
cooling purpose. The first heat exchanger is used to condense the gasified oil from the rubber.
In this heat exchanger the cooling media used is thermal oil with an inlet temperature of 70 0C. This heat exchanger lowers the temperature of the gasified oil to 130
0C. To cool the
gasified oil the second heat exchanger is used, the cooling medium used for this heat
exchanger is water and the inlet temperature of water is 20 0C. This heat exchanger cooled
the gasified oil to 30 0C. At 30
0C some gases in the C1-C4 range does not condense. These
gases pass through a cyclone before returning to the root blower, then these gases can be used
for the burner and the process can be optimised. These gases can increase the pressure of the
system, so to maintain the pressure a gas compressor is used to compress the excess gas. In
case of high pressure or if the compressor is not working properly then the excess gas is

Chapter 3: Life Cycle Inventory
21
diverted to the flare and burned. The cooling gas flow circulates until the reactor temperature
reaches 70 0C.
3.5 Post Process: When the reactor is cooled the reactor top is opened by opening the top valves. The reactor is
emptied by a vacuum pipe.
3.5.1 Magnetic Separator:
The mixture of steel and carbon passes through the magnetic separator where steel is
separated from the carbon. Electrical energy is used for magnetic separator, the total energy
required to separate the carbon and steel is 5 KWh. After the magnetic separator the carbon is
sent for the Milling process, while steel is separated and is recycled.
3.5.2 Milling Process:
During the milling process the carbon separated from separator is fed into the mill that
micronised the carbon to carbon black powder of size approximately 1 µm. the energy
required for milling process is 200 KWh/batch.
3.5.3 Granulation (Pelletizing):
The carbon black produced from the milling process could be pelletized in a mixer; this
process is called palletising or granulation. Pelletizing can be done by the use of oil or water.
The energy used for granulation is 21 KWh/batch
3.5.4 Drying:
Drying of the carbon black granulates of is done in dryer. The energy required to dry the
granules is 22.61 KWh. Dryer is used when water is used for palletizing otherwise the dryer
is not used. In LCI water is used for palletizing hence the energy used for drying is also
considered the efficiency of the dryer is taken as 60 %.
3.5.4 Packaging Process:
After granulation process the carbon black is packaged in large plastic bags or bulk handled
and is ready to dispatch.
Chapter 3: Life Cycle Inventory
22
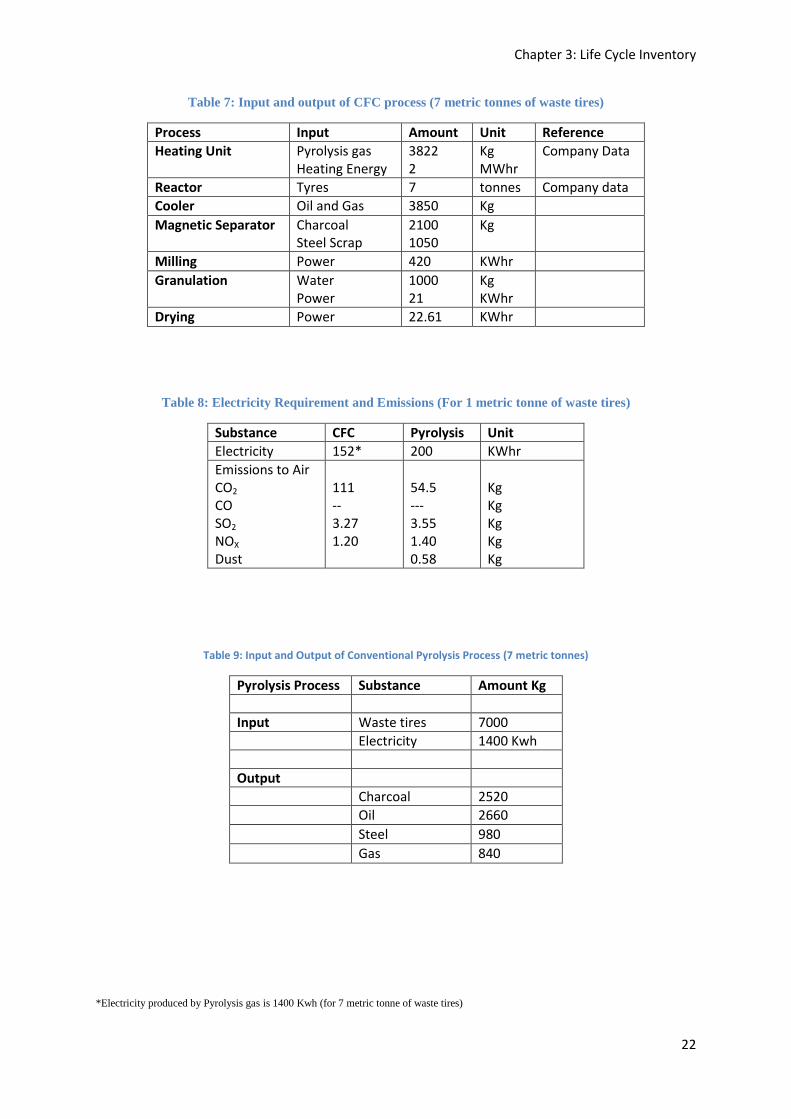
Table 7: Input and output of CFC process (7 metric tonnes of waste tires)
Process Input Amount Unit Reference
Heating Unit Pyrolysis gas Heating Energy
3822 2
Kg MWhr
Company Data
Reactor Tyres 7 tonnes Company data
Cooler Oil and Gas 3850 Kg
Magnetic Separator Charcoal Steel Scrap
2100 1050
Kg
Milling Power 420 KWhr
Granulation Water Power
1000 21
Kg KWhr
Drying Power 22.61 KWhr
Table 8: Electricity Requirement and Emissions (For 1 metric tonne of waste tires)
Substance CFC Pyrolysis Unit
Electricity 152* 200 KWhr
Emissions to Air CO2 CO SO2 NOX
Dust
111 -- 3.27 1.20
54.5 --- 3.55 1.40 0.58
Kg Kg Kg Kg Kg
Table 9: Input and Output of Conventional Pyrolysis Process (7 metric tonnes)
Pyrolysis Process Substance Amount Kg
Input Waste tires 7000
Electricity 1400 Kwh
Output
Charcoal 2520
Oil 2660
Steel 980
Gas 840
*Electricity produced by Pyrolysis gas is 1400 Kwh (for 7 metric tonne of waste tires)
Chapter 3: Life Cycle Inventory
23
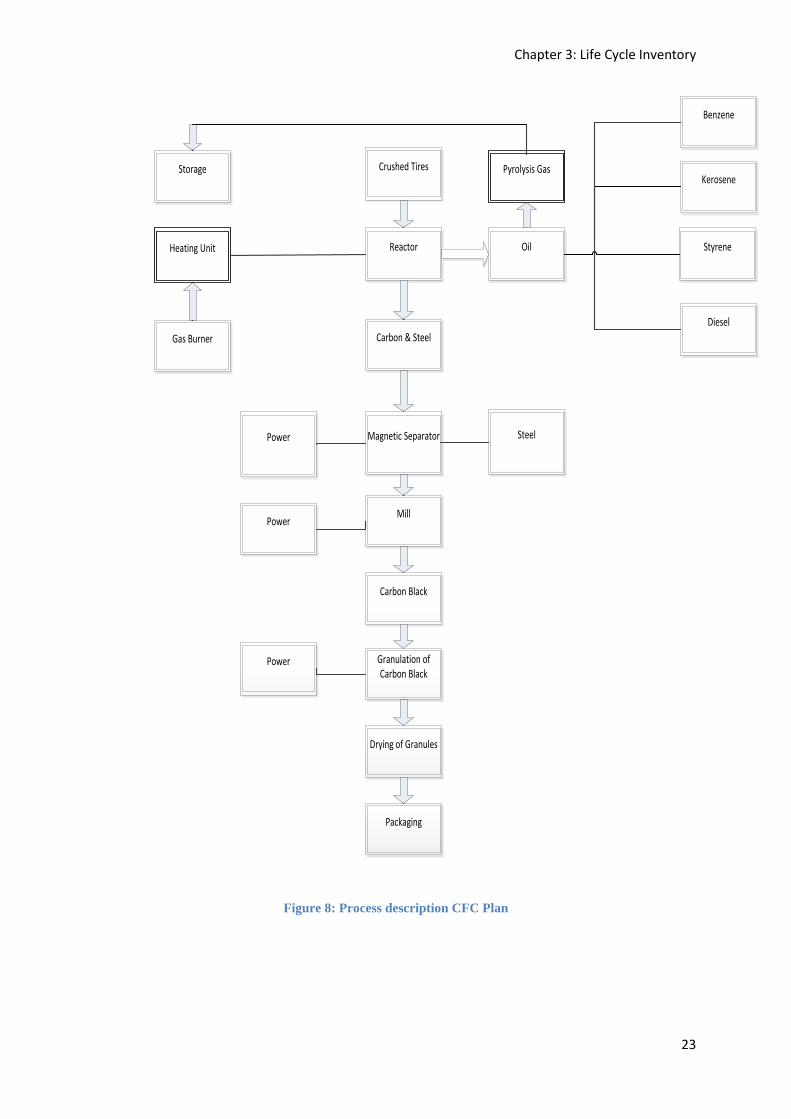
Crushed Tires
Reactor
Carbon & Steel
Oil
Magnetic Separator
Mill
Granulation of Carbon Black
Drying of Granules
Kerosene
Styrene
Benzene
Diesel
Packaging
Power
Steel
Gas Burner
Storage
Carbon Black
Heating Unit
Pyrolysis Gas
Power
Power
Figure 8: Process description CFC Plan

Chapter 4: Life Cycle Impact Assessment
24
4. Life cycle Impact Assessment (LCIA)
Material and Energy Balance:
The material and energy balance for the CFC process is done for the full scale process plant,
but this balance is based on the pilot scale plant. The numbers of experiments were done on
the different temperatures to check the quality of the products and products ratio. The
composition of the pyrolysis gas is taken at 400 0C for this material and energy balance. The
composition of the pyrolysis gas is shown in table
Table 10: Composition of Pyrolysis gas
Composition Percentage %(molar)
Carbon dioxide 23.64
Carbon monoxide 17.03
Water gas 2.42
Methane 35.5
Ethene 3.74
Ethane 6.38
Propene 5.81
Propane 4.55
Butane 0.09
Pentane 0.09
methanol 0.75
The basis taken for material and energy balance is one batch (7 metric tonnes) of the CFC
process. The pyrolysis gas is combusted to produce carbon dioxide, water and unburned
gases. The total impacts are calculated for one batch (7 metric tonnes), but for comparison the
impacts are converted for 1 metric tonne of the scrap tyres.
4.1 Impact Categories: The impact assessment is done by using Gabi 4 software; results are discussed under the
following categories:
4.1.1 Climate Change:
Climate change is caused by the greenhouse gases; mainly carbon dioxide (CO2), carbon
monoxide (CO), nitrous oxide (N2O) and methane (CH4). Figure 7 shows the greenhouse gas
emissions of the CFC process and pyrolysis process.

Chapter 4: Life Cycle Impact Assessment
25
Figure 9: Climate Change
The major contribution in climate change is due to the electrical power generation. The
treatment process that is, all the foreground unit operations as shown in figure 8 has much
lower climate change impacts. These impacts are calculated when pyrolysis gas is not used in
the process (batch process). When the process is continuous process, pyrolysis gas is enough
to meet the requirement of the power generation and the climate change impacts will be
lower. A large proportion of the CFC emissions, and all of the pyrolysis emissions are offset
by the avoided products of oil, carbon black and cast iron.
4.1.2 Respiratory (Inorganic):
The contribution to the respiratory (inorganic) emissions is mainly due to the SOx and NOx
emissions. Figure 8 shows that the major contribution in respiratory impacts for CFC process
is due to the treatment process, while power generation has very low value and is not visible
in the graph. On the other hand the pyrolysis process has more impacts than CFC process.
Even if the avoided products were taken into account CFC process have less respiratory
Inorganic impacts.
Figure 10: Respiratory (Inorganic)
-2.50E-04
-2.00E-04
-1.50E-04
-1.00E-04
-5.00E-05
0.00E+00
5.00E-05
1.00E-04
1.50E-04
2.00E-04
2.50E-04
3.00E-04
Pyrolysis CFC
Oil
Cast Iron
Carbon Black
Treatment Process
Power Generation
DA
LY
-1.50E-03
-1.00E-03
-5.00E-04
0.00E+00
5.00E-04
1.00E-03
1.50E-03
Pyrolysis CFC
Oil
Cast Iron
Carbon Black
Treatment Process
Power Generation
DA
LY

Chapter 4: Life Cycle Impact Assessment
26
4.1.3 Respiratory (Organic):
Methane (CH4) and NMVOC (non-methane volatile organic compounds) are major
contributor to respiratory (organic) impacts. Respiratory impacts due to the power generation
are very less as compared to the pyrolysis process, however both process have no impacts due
to the treatment process. Carbon black has the major proportion in the avoided products.
Overall CFC process has less respiratory (Organic) impacts.
Figure 11: Respiratory (Organic)
4.1.4 Carcinogenic:
Emissions of heavy metals to air and soil, and organic emissions to air (group VOC) are
major contributor for carcinogenic effects. Power generation has carcinogenic impacts in
CFC process but its value is less than the pyrolysis process. Cast iron is major contributor in
avoided products in CFC process. If avoided products were taken into account CFC process
is better than the Pyrolysis process.
Figure 12: Carcinogenic

Chapter 4: Life Cycle Impact Assessment
27
4.1.5 Acidification/Nutrification:
NOx, SO2, and ammonia are the main causes of this impact category. Electricity generation is
the major source of this impact category. CFC process has fewer emissions than the pyrolysis
process and also due to the Swedish electricity mix, also the treatment process less impacts
than the pyrolysis process. If the impacts from the products obtained taken into account CFC
process has the lower value than the pyrolysis process as shown in fig. 12.
Figure 13: Acidification/Nutrification
4.1.6 Ecotoxicity:
Ecotoxicity impacts are mainly due to the heavy metal emissions to the air and soil. In
addition to these, aromatic hydrocarbons such as benzene, toluene and styrene are also
causing ecotoxicity. CFC process has very less ecotoxicity effects due to the power
generation. Overall CFC process has less impact value resulting from the avoided production
of carbon black and cast iron.
Figure 14: Ecotoxicity
-40
-30
-20
-10
0
10
20
30
Pyrolysis CFC
Oil
Cast Iron
Carbon Black
TreatmentProcessPowerGeneration
PD
F*m
²*yr
CFC
-45
-40
-35
-30
-25
-20
-15
-10
-5
0
5
Pyrolysis Oil
Cast Iron
Carbon Black
TreatmentProcessPowerGeneration
PD
F*m
²*yr

Chapter 4: Life Cycle Impact Assessment
28
4.1.7 Fossil Fuels:
This impact is related to the consumption of crude oil, natural gas and coal. The major source
of impact in CFC process is due to the natural gas used in the gas burner. Impacts due to the
power generation of both the process are almost same, but when we consider the impacts due
to the avoided products CFC process has more avoided impacts than the pyrolysis process
due to the production of carbon black and oil.
Figure 15: Fossil Fuel
4.2 Normalized and weighted results:
Normalization and weighting of both the processes is calculated using EU reference values in
the hierarchist version of the EI99 method. Table 11 shows the normalisation values and the
weighting values.
Table 11: Normalization and weighted values from Eco-Indicator 99 (Hierarchist) (21)
Damage categories Impact Categories Normalization Value Weighting values
Human Health Climate Change Respiratory (organic) Respiratory(Inorganic) Carcinogenic effects
1.54E-02 (DALY/inhabitant/yr)
400
Ecosystem quality Acidification/Nutrification 5.13E+03 (PDF*m2*yr/ inhabitant/yr)
400
Resources Fossil Fuels 8.41 E+03 (MJ/inhabitant/yr)
200
CFC
-4000
-3000
-2000
-1000
0
1000
Pyrolysis Oil
Cast Iron
Carbon Black
Treatment Process
Power GenerationMJ
Surp
lus
Ener
gy

Chapter 4: Life Cycle Impact Assessment
29
The total impacts of both the process are calculated by using these values. Figure 14 shows
the total impact assessment of CFC and pyrolysis process, considering the avoided impacts
from the products obtained and energy. Figure 14 show that the CFC process is more suitable
and environmental friendly process, having less environmental impacts. It can be seen that
the total impacts of both the process are mainly contributed by climate change and fossil fuel
impact categories, which are more related to the indirect impacts by electricity generation
(power requirements) and avoided impacts generated by products obtained such as oil and
carbon black.
Figure 16: Comparison of total impacts of Pyrolysis and CFC process
4.3: Discussion: The availability of process data from different studies on pyrolysis is limited, so making
compilation of comparative LCI is difficult. Therefore, process data available only are
presented in Table 12 below (12). Clearly from the table there are wide differences in process
data depending on how any combustible byproducts are utilized. There are many other
options for recycling of waste tires but nowadays but pyrolysis process are mainly used for
recycling of waste tires to recover useful products and also used for energy purposes. The
other options for recycling of tires are gasification, Microwave treatment and use in cement
kilns as an energy source but these processes have more emissions and environmental
impacts (12).
The CFC process is advanced technology for pyrolysis process. The pyrolysis processes
compared are of two different types. In type 1 Pyrolysis the pyrolysis of shredded waste tires
is in a configuration designed for combined heat and power generation (CHP). The products
are carbon, steel, heat and electricity. In this process the oil and gas produced are used for
CHP plant to generate heat and electricity. Sodium bicarbonate is used in CHP power plant
-80
-70
-60
-50
-40
-30
-20
-10
0
10
Pyrolysis CFCFossil Fuels
Acidification/Nutrification
Ecotoxicity
Carcinogenic effects
Climate Change
Repiratory (Inorganic)
Repiratory (Organic)
Eco
-In
dic
ato
r 9
9 P
oin
ts

Chapter 4: Life Cycle Impact Assessment
30
and spent bicarbonate is produced as a waste of CHP power plant and has more
environmental impacts than the ordinary pyrolysis process and CFC process. The water usage
for type 1 pyrolysis process is also more than the CFC process. The overall emissions of type
1 pyrolysis are more than the type 2 pyrolysis and CFC process.
The second type of pyrolysis used for the comparison is conventional pyrolysis process. The
pyrolysis of shredded tires is done and the products obtained from the process are carbon, oil
and steel (12). The carbon obtained from conventional pyrolysis process is not of good
quality due to the indirect heating, and also the unburned carbon produced during the process.
The carbon obtained from this process is further processed to obtain carbon black N330 to
use for different purposes. The overall emissions and environmental impacts of conventional
pyrolysis process are less than the type 1 pyrolysis process but more than the CFC process.
Pyrolysis process is also in use for recycling of waste tires in China. The input and output
data for recycling of waste tires is shown in table 12. In this pyrolysis process the gas
produced is used in pyrolysis process but the amount of gas produced is very small. The
carbon obtained from this process is close to semi reinforcing grade carbon black due to the
direct heating, later this carbon undergoes processing and the carbon is converted to the
carbon black N330 (22). The amount of carbon black produced is half of the carbon
processed. The electricity used for this process is from coal combustion and have more
environmental impacts. The overall emissions for this pyrolysis process are also more than
the CFC process.
4.4 Conclusion and Recommendations: The results from the environmental impacts assessment of Gabi software and comparison of
the two pyrolysis process considered concludes that the CFC process is better than the
traditional pyrolysis process and have less environmental impacts. Also the products obtained
from the CFC process are of good quality and has more avoided impacts. Carbon black
obtained from the CFC process is N550, due to better heating process by changing reactor
design and process, and thus can be used in the manufacturing of new tyres, while in
pyrolysis process the carbon black obtained is N330 and it cannot be used for manufacturing
of new tyres (12). The major environmental impacts in CFC process are due to usage of
electricity for different processes.
The CFC process can be improved by making some changes to the process. A Distillation
column is necessary for distillation of oil; because the oil and the pyrolysis gas obtained from
the tire recycling by CFC process contains many useful by-products. The results of
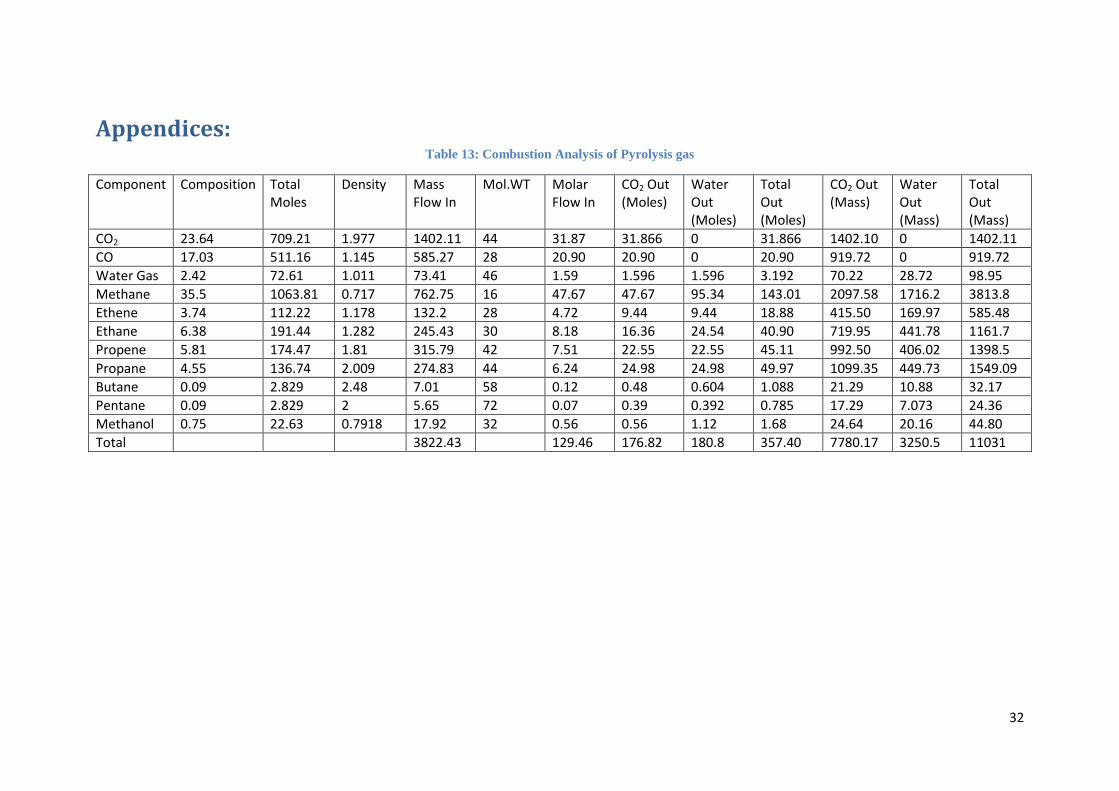
combustion analysis of pyrolysis gas are shown in table 13. The major impacts in CFC
process are due to the electricity and gas usage in the process, so energy optimization of the
process is necessary to be done. Also the water used for the for granulation process can be
used for cooling the oil and gas in heat exchanger, so pinch analysis of the system is also
worthwhile to save the power consumption and thus have less environmental impacts.

Chapter 4: Life Cycle Impact Assessment
31
Table 12: Comparison between different Pyrolysis process and CFC process
Inputs Pyrolysis Type 1 (CHP)
Pyrolysis Type 2 Pyrolysis Li. et al (22)
CFC Process
Sodium Bicarbonate
30.5 Kg/t
Ammonia 0.5 Kg/t
Gas Oil 1.2 Kg/t
Electricity 346.2 KWh/t 268 KWh/t 200 152 KWh/t
Water 157.7 Kg/t 142.8 Kg/t
Outputs
Carbon 400 Kg/t 360 Kg/t 330 300 Kg/t
Steel 120 Kg/t 140 Kg/t 220 150 Kg/t
Oil 380 Kg/t 350 450 Kg/t
Gas 100 Kg/t
CHP Heat 1.2 MWh
Electricity 0.2 MWh
CO2 563 Kg/t 85.73 Kg/t 54.5 111 Kg/t
CO 1.2 Kg /t 1.7 0.5 Kg/t
SO2 23 Kg/t 7.64 3.55 3.27 Kg/t
NOX 0.153 Kg/t 0.26 1.40 0.12 Kg/t
Dust 0.58
N2O 23.1 Kg/t
VOC 0.0019 Kg/t 0.05 Kg/t 0.0015 Kg/t
NH3 1.9 Kg/t
Particulates 3.8 Kg/t 0.17 Kg/t 0.002 Kg/t
Spent Bicarbonate 30.5 Kg/t
32
Appendices: Table 13: Combustion Analysis of Pyrolysis gas
Component Composition Total Moles
Density Mass Flow In
Mol.WT Molar Flow In
CO2 Out (Moles)
Water Out (Moles)
Total Out (Moles)
CO2 Out (Mass)
Water Out (Mass)
Total Out (Mass)
CO2 23.64 709.21 1.977 1402.11 44 31.87 31.866 0 31.866 1402.10 0 1402.11
CO 17.03 511.16 1.145 585.27 28 20.90 20.90 0 20.90 919.72 0 919.72
Water Gas 2.42 72.61 1.011 73.41 46 1.59 1.596 1.596 3.192 70.22 28.72 98.95
Methane 35.5 1063.81 0.717 762.75 16 47.67 47.67 95.34 143.01 2097.58 1716.2 3813.8
Ethene 3.74 112.22 1.178 132.2 28 4.72 9.44 9.44 18.88 415.50 169.97 585.48
Ethane 6.38 191.44 1.282 245.43 30 8.18 16.36 24.54 40.90 719.95 441.78 1161.7
Propene 5.81 174.47 1.81 315.79 42 7.51 22.55 22.55 45.11 992.50 406.02 1398.5
Propane 4.55 136.74 2.009 274.83 44 6.24 24.98 24.98 49.97 1099.35 449.73 1549.09
Butane 0.09 2.829 2.48 7.01 58 0.12 0.48 0.604 1.088 21.29 10.88 32.17
Pentane 0.09 2.829 2 5.65 72 0.07 0.39 0.392 0.785 17.29 7.073 24.36
Methanol 0.75 22.63 0.7918 17.92 32 0.56 0.56 1.12 1.68 24.64 20.16 44.80
Total 3822.43 129.46 176.82 180.8 357.40 7780.17 3250.5 11031
33
Figure 17: GaBi Model for CFC process.
34
Table 14: Properties of Carbon Black N330 and N550
Properties Carbon Black N330 Carbon Black N550
Iodine Adsorption No.
85 40
DBP Absorption No.
104 83
CTAB Adsorption
80 40
Heating Loss %
1.8 1.5
Ash,%
0.5 0.10
Stress at 300% Elongation 1.5 +1
CTAB: cetyltrimethyl ammonium bromide DBP: Dibutyl Phthalate

35
Bibliography
1. Natalie Kohler, Ed Perry. IMPLEMENTATION OF THE LANDFILL DIRECTIVE IN THE 15 MEMBER
STATES OF THE EUROPEAN UNION. Belgium : s.n., 2005.
2. LLC, Chemrisk. Tyre Generic Exposure Scenario ELT guidance. Pittsburg : s.n., 2009.
3. Jean-Pierre TAVERNE. End of life tyres, A valuable source with growing potential. Brussels :
Eurpean Tyre and Rubber Manufacturing Association (ETRMA), 2010.
4. Palma A, Blackman A. Scrap Tires in Ciudad Juárez and El Paso: Ranking the Risks. 2002.
5. energyjustice.net. [Online] [Cited: 25 august 2010.] http://www.energyjustice.net/tires/.
6. THE SWEDISH NATIONAL CHEMICALS INSPECTORATE. HA oils in automotive tyres. Stockholm :
Swedish National Chemicals Inspectorate©, 2003.
7. Moon, Alex. Hazards of Improper Disposal of Waste Tires. The Iowa department of natural
resources. [Online] Iowa DNR waste management. [Cited: 24 September 2010.]
http://www.iowadnr.gov/waste/recycling/tires/hazards.html.
8. Significance of decision making for LCA methodology. Tillman, A.M. Gothenburg : Elsevier, 1999,
Environmental Impact Assessment review, Vol. 20, pp. 113-123.
9. Curran, Mary Ann. Life cycle assessment principle and practice. System analysis branch, National
risk managemnet research laboratory. Cincinnati : s.n., 2006.
10. Henrikke Baumann, Anne Marie Tillman. The Hitch Hiker's guide to LCA. Göteborg :
studentlitteratur AB, 2004.
11. Retreading, H. Vrakking BV. [Online] [Cited: 25 09 2010.]
http://www.aircrafttyres.com/retreading%20proces%20tyres%20explained.htm.
12. S. Ogilvie, M. Collins, & S. Aumônier. Life Cycle Assessment of the management options for
waste tyres. Bristol : Environment Agency, 2004. 1 84432289 0.
13. Increasing the Recycled Content in New Tires. INTEGRATED WASTE MANAGEMENT BOARD.
Nevada : Nevada Automotive Test Center, 2004. 622-04-001.
14. Scrap tires to crumb rubber: feasibility analysis for processing facilities. Nongnard
Sunthonpagasit, Michael R. Duffey. 4, Washington, DC : Science Direct, 2003, Resources
conservation and recycling, Vol. 40, pp. 281-299.
15. Science and technology of rubber reclamation with special attention to NR-based waste latex
products. V.V. Rajana, W.K. Dierkes, J.W.M. Noordermeer. 9, Enschede : Elsevier Ltd., 2006,
Progress in polymer science, Vol. 31, pp. 811-834.
16. Use of tire derived fuel in clinker burning. P. Pipilikaki, M. Katsioti. 7-8, Athens : Elsevier Ltd.,
2005, Vol. 27.

36
17. David A Tilman. TDF as an opputunity fuel. [book auth.] N.S.harding David A Tilman. Fuel of
opportunity, characteristics and uses in combustion systems. Amsterdam : Elsevier Ltd., 2004.
18. Geosyntec Consultants. Guidance Manual for Engineering Uses of Scrap Tires. Columbia,
Maryland : Maryland Department of the Environment, 2008. ME0012-11/MD04173.
19. Utilisation of crumb rubber as a soil amendment for sports turf. P.H. Groenevelt, P.E. Grunthal.
1-2, guelph : Elsevier Science B.V., 1998, Soil and Tillage Research, Vol. 47, pp. 169-172. 0167-
1987/98.
20. Elizabeth Denly, Katarina Rutkowski, Karen M. Vetrano. A REVIEW OF THE POTENTIAL HEALTH
AND SAFETY RISKS FROM SYNTHETIC TURF FIELDS CONTAINING CRUMB RUBBER INFILL. New York, :
TRC, 2008.
21. Pyrolysis of used automobile tires and residual char utilization. A.A. Zabaniotou, G.
Stavropoulos. 2, Thessaloniki : Elsevier Science B.V., 2003, Analytical and Applied Pyrolysis, Vol. 70,
pp. 711-722.
22. Comparison of end-of-life tire treatment technologies: A chinese case study. Xingfu Li, He Xu et
al. Tianjin : Elsevier, 2010, Waste management, Vol. 30, pp. 2235-2246.
23. GaBi software. [Online] 2011. http://www.gabi-
software.com/index.php?id=85&L=31&redirect=1.
24. Enirosystems.se. [Online] Scandinavian Envirosystems. [Cited: 25 November 2010.]
http://www.envirosystems.se/index.php/index.php?option=com_content&view=section&layout=bl
og&id=3&Itemid=21.
25. Pyrolysis of scrap tyres. 1, Isabel de Marco Rodriguez et.al. 1, Bilbao : Elsevier Science B.V., 2001,
Fuel processing technology, Vol. 72, pp. 9-22.
26. Unapumnuk, Kessinee. A Study of the Pyrolysis of Tire Derived Fuels and an Analysis of Derived
Chars and Oils. CINCINNATI : UNIVERSITY OF CINCINNATI, 2006.
27. Characterization of the liquid products obtained in tyre pyrolysis. M.F. Laresgoiti, B.M. Caballero
et al. 2, Bilbao : Elsevier B.V., 2004, Analytical and applied pyrolysis, Vol. 71, pp. 917-934.
28. Significance of decision making for LCA methodology. Goteborg : Elsevier, 1999, Environmental
Impact assessment review, Vol. 20, pp. 113-123.
29. Environmental Relevance of the Platinum-Group Elements. Morrison, Sebastien Rauch and
Gregory M. s.l. : Mineralogical society of America, 2008, Vol. 4.
30. End of Life Tires. A valuable resource with a wealth of potential. Brussels : ETRMA, 2006.
www.etrma.org/public/activitiesofltelts.html
31. Continental Global site. [Online] 2010. [Cited: 24 September 2010.] http://www.conti-
online.com/generator/www/com/en/continental/csr/themes/ecology/product_responsibility/recycl
ing_tires/recycling_tires_en.html.

37