life-cycle inventory data sets for …life-cycle inventory data sets for material production of...
TRANSCRIPT

PREPARED FOR:
U.S. Environmental Protection AgencyOffice of Research and Development
PREPARED BY:
RTI InternationalP.O. Box 12194Research Triangle Park, NC 27709
LIFE-CYCLE INVENTORY DATA SETS FOR MATERIAL PRODUCTION OF
Aluminum, Glass, Paper, Plastic, and Steel IN NORTH AMERICA
February2003
Weitz_LifecycleCvr 8/11/03 11:57 AM Page 1
Foreword
The U.S. Environmental Protection Agency is charged by Congress with protecting theNation’s land, air, and water resources. Under a mandate of national environmental laws, theAgency strives to formulate and implement actions leading to a compatible balance betweenhuman activities and the ability of natural systems to support and nurture life. To meet thismandate, EPA’s research program is providing data and technical support for solvingenvironmental problems today and building a science knowledge base necessary to manage ourecological resources wisely, understand how pollutants affect our health, and prevent or reduceenvironmental risks in the future.
The National Risk Management Research Laboratory (NRMRL) is the Agency’s centerfor investigation of technological and management approaches for preventing and reducing risksfrom pollution that threaten human health and the environment. The focus of the Laboratory’sresearch program is on methods and their cost-effectiveness for prevention and control ofpollution to air, land, water, and subsurface resources; protection of water quality in public watersystems; remediation of contaminated sites, sediments and ground water; prevention and controlof indoor air pollution; and restoration of ecosystems. NRMRL collaborates with both publicand private sector partners to foster technologies that reduce the cost of compliance and toanticipate emerging problems. NRMRL’s research provides solutions to environmentalproblems by: developing and promoting technologies that protect and improve the environment;advancing scientific and engineering information to support regulatory and policy decisions; andproviding the technical support and information transfer to ensure implementation ofenvironmental regulations and strategies at the national, state, and community levels.
This publication has been produced as part of the Laboratory’s strategic long-termresearch plan. It is published and made available by EPA’s Office of Research and Developmentto assist the user community and to link researchers with their clients. For further informationabout this study, refer to the project web site at www.rti.org (from the home page, search for life-cycle management of municipal solid waste).
E. Timothy Oppelt, DirectorNational Risk Management Research Laboratory
EPA REVIEW NOTICE
This report has been peer and administratively reviewed by the U.S. EnvironmentalProtection Agency, and approved for publication. Mention of trade names or commercialproducts does not constitute endorsement or recommendation for use. The information andresults from this study are not intended for use in making comparative assertions about theenvironmental preferability of alternative materials or products.
This document is available to the public through the National Technical InformationService, Springfield, VA 22161.

ii
Abstract
Today's municipal solid waste (MSW) management systems include a variety ofalternatives for waste collection, recovery of materials, composting, combustion, and disposal. Communities now must make complex decisions requiring an analysis of both cost andenvironmental aspects for these integrated systems. To properly account for all of theenvironmental aspects associated with integrated MSW management systems, planners musthave tools that allow them to examine factors outside of the traditional MSW managementframework of activities occurring from the point of waste collection to final disposal. Thisrequires an examination of the changes in resource use and environmental releases from rawmaterials acquisition and manufacturing operations associated with the use of secondary versusprimary resources. These environmental changes can be captured by taking a life-cycleapproach to MSW management.
The U.S. Environmental Protection Agency's (EPA=s) Office of Research andDevelopment, Air Pollution Prevention and Control Division, with co-funding from the U.S.Department of Energy, is leading the development of cutting-edge life-cycle environmental andcost assessment tools into an overall decision-support tool (DST) that provides information forevaluating integrated MSW management systems in the United States. The research team forthis project includes life-cycle assessment (LCA) and solid waste management experts fromResearch Triangle Institute, North Carolina State University, the University of Wisconsin-Madison, Franklin Associates, and Roy F. Weston. Over 80 stakeholders were participants inthis research representing state and local government, environmental interest groups, industry,trade associations, and academia. The result is a credible, objective, state-of-the-art tool thatprovides assistance to MSW practitioners and others to understand environmental and costaspects of integrated MSW management. The MSW-DST also has the capability, through itsoptimization module, to identify MSW management strategies that minimize cost andenvironmental burdens.
This report includes North American life-cycle inventory data sets and supportingdocumentation that have been developed for use in this overall research project. Industryorganizations were intimately involved in developing the data sets and, although shortcomingsexist, the data are felt to be the best currently available. The data sets were developed for use inthe MSW-DST to estimate the environmental aspects associated with recycling variousaluminum, glass, paper, plastic, and steel products from the MSW stream. The data are alsoavailable as part of a stand-alone electronic database developed for the overall project.

iii
Table of Contents
Section Page
Foreword . . . . . . . . . . . . . . . . . . . . . . . . . . . . . . . . . . . . . . . . . . . . . . . . . . . . . . . . . cover 2Abstract . . . . . . . . . . . . . . . . . . . . . . . . . . . . . . . . . . . . . . . . . . . . . . . . . . . . . . . . . . . . . . iiList of Figures . . . . . . . . . . . . . . . . . . . . . . . . . . . . . . . . . . . . . . . . . . . . . . . . . . . . . . . . viiiList of Tables . . . . . . . . . . . . . . . . . . . . . . . . . . . . . . . . . . . . . . . . . . . . . . . . . . . . . . . . . . . xList of Acronyms . . . . . . . . . . . . . . . . . . . . . . . . . . . . . . . . . . . . . . . . . . . . . . . . . . . . . . xiiiAcknowledgments . . . . . . . . . . . . . . . . . . . . . . . . . . . . . . . . . . . . . . . . . . . . . . . . . . . . . . xv
1.0 Introduction and Goals . . . . . . . . . . . . . . . . . . . . . . . . . . . . . . . . . . . . . . . . . . . . 1-11.1 Goals . . . . . . . . . . . . . . . . . . . . . . . . . . . . . . . . . . . . . . . . . . . . . . . . . . 1-21.2 Intended Application of These Data . . . . . . . . . . . . . . . . . . . . . . . . . . 1-21.3 Data Review Process . . . . . . . . . . . . . . . . . . . . . . . . . . . . . . . . . . . . . 1-61.4 Key Assumptions and Limitations . . . . . . . . . . . . . . . . . . . . . . . . . . . 1-61.5 Report Organization . . . . . . . . . . . . . . . . . . . . . . . . . . . . . . . . . . . . . . 1-81.6 References . . . . . . . . . . . . . . . . . . . . . . . . . . . . . . . . . . . . . . . . . . . . . . 1-8
2.0 General Scope and Boundary Conditions . . . . . . . . . . . . . . . . . . . . . . . . . . . . . 2-12.1 General Boundary Conditions . . . . . . . . . . . . . . . . . . . . . . . . . . . . . . 2-32.2 Data Tables . . . . . . . . . . . . . . . . . . . . . . . . . . . . . . . . . . . . . . . . . . . . . 2-4
2.2.1 Energy Usage Section . . . . . . . . . . . . . . . . . . . . . . . . . . . . . . . 2-42.2.2 Environmental Emissions Section . . . . . . . . . . . . . . . . . . . . . 2-9
2.2.2.1 Air and Waterborne Releases. . . . . . . . . . . . . . . . . 2-92.2.2.2 Solid Wastes. . . . . . . . . . . . . . . . . . . . . . . . . . . . . . 2-10
2.3 General Boundary Decisions . . . . . . . . . . . . . . . . . . . . . . . . . . . . . . 2-102.3.1 Geographic Scope . . . . . . . . . . . . . . . . . . . . . . . . . . . . . . . . . 2-102.3.2 Carbon Sequestration . . . . . . . . . . . . . . . . . . . . . . . . . . . . . . 2-102.3.3 Self-Generated Electricity . . . . . . . . . . . . . . . . . . . . . . . . . . . 2-112.3.4 Recycling . . . . . . . . . . . . . . . . . . . . . . . . . . . . . . . . . . . . . . . 2-11
2.4 Components Not Included . . . . . . . . . . . . . . . . . . . . . . . . . . . . . . . . 2-122.4.1 Capital Equipment . . . . . . . . . . . . . . . . . . . . . . . . . . . . . . . . 2-122.4.2 Space Conditioning . . . . . . . . . . . . . . . . . . . . . . . . . . . . . . . . 2-122.4.3 Support Personnel Requirements . . . . . . . . . . . . . . . . . . . . . 2-122.4.4 Miscellaneous Materials and Additives . . . . . . . . . . . . . . . . 2-13
2.5 Data Sources and Quality . . . . . . . . . . . . . . . . . . . . . . . . . . . . . . . . . 2-132.5.1 Geographic Coverage . . . . . . . . . . . . . . . . . . . . . . . . . . . . . . 2-132.5.2 Time-Related Coverage . . . . . . . . . . . . . . . . . . . . . . . . . . . . 2-132.5.3 Technological Coverage . . . . . . . . . . . . . . . . . . . . . . . . . . . . 2-132.5.4 Precision . . . . . . . . . . . . . . . . . . . . . . . . . . . . . . . . . . . . . . . . 2-132.5.5 Completeness . . . . . . . . . . . . . . . . . . . . . . . . . . . . . . . . . . . . 2-132.5.6 Consistency . . . . . . . . . . . . . . . . . . . . . . . . . . . . . . . . . . . . . . 2-152.5.7 Representativeness . . . . . . . . . . . . . . . . . . . . . . . . . . . . . . . . 2-152.5.8 Reproducibility . . . . . . . . . . . . . . . . . . . . . . . . . . . . . . . . . . 2-152.5.9 Uncertainty/Limitations . . . . . . . . . . . . . . . . . . . . . . . . . . . . 2-15
2.6 References . . . . . . . . . . . . . . . . . . . . . . . . . . . . . . . . . . . . . . . . . . . . . 2-15

iv
Table of Contents (continued)
Section Page
3.0 Summary LCI of Aluminum Sheet/Coil . . . . . . . . . . . . . . . . . . . . . . . . . . . . . . 3-13.1 Introduction . . . . . . . . . . . . . . . . . . . . . . . . . . . . . . . . . . . . . . . . . . . . . 3-13.2 Aluminum Sheet/Coil Production . . . . . . . . . . . . . . . . . . . . . . . . . . . . 3-1
3.2.1 Limestone Mining . . . . . . . . . . . . . . . . . . . . . . . . . . . . . . . . . . 3-23.2.2 Lime Production . . . . . . . . . . . . . . . . . . . . . . . . . . . . . . . . . . . 3-23.2.3 Salt Mining . . . . . . . . . . . . . . . . . . . . . . . . . . . . . . . . . . . . . . . 3-43.2.4 Caustic Soda and Chlorine Production . . . . . . . . . . . . . . . . . 3-113.2.5 Bauxite Mining . . . . . . . . . . . . . . . . . . . . . . . . . . . . . . . . . . . 3-123.2.6 Alumina Production . . . . . . . . . . . . . . . . . . . . . . . . . . . . . . . 3-133.2.7 Crude Oil Production . . . . . . . . . . . . . . . . . . . . . . . . . . . . . . 3-143.2.8 Petroleum Coke Production . . . . . . . . . . . . . . . . . . . . . . . . . 3-153.2.9 Coal Mining . . . . . . . . . . . . . . . . . . . . . . . . . . . . . . . . . . . . . 3-163.2.10 Metallurgical Coke Production . . . . . . . . . . . . . . . . . . . . . . . 3-163.2.11 Anode Production . . . . . . . . . . . . . . . . . . . . . . . . . . . . . . . . . 3-163.2.12 Aluminum Smelting . . . . . . . . . . . . . . . . . . . . . . . . . . . . . . . 3-173.2.13 Ingot Casting . . . . . . . . . . . . . . . . . . . . . . . . . . . . . . . . . . . . 3-183.2.14 Hot/Cold Rolling . . . . . . . . . . . . . . . . . . . . . . . . . . . . . . . . . . 3-183.2.15 Aluminum Recovery and Processing . . . . . . . . . . . . . . . . . . 3-203.2.16 Secondary Ingot Casting . . . . . . . . . . . . . . . . . . . . . . . . . . . . 3-203.2.17 Data Quality . . . . . . . . . . . . . . . . . . . . . . . . . . . . . . . . . . . . . 3-20
3.3 References . . . . . . . . . . . . . . . . . . . . . . . . . . . . . . . . . . . . . . . . . . . . . 3-21
4.0 Summary LCI of Glass Containers . . . . . . . . . . . . . . . . . . . . . . . . . . . . . . . . . . 4-14.1 Introduction . . . . . . . . . . . . . . . . . . . . . . . . . . . . . . . . . . . . . . . . . . . . . 4-14.2 Overview . . . . . . . . . . . . . . . . . . . . . . . . . . . . . . . . . . . . . . . . . . . . . . . 4-1
4.2.1 Glass Sand Mining . . . . . . . . . . . . . . . . . . . . . . . . . . . . . . . . 4-134.2.2 Feldspar Mining . . . . . . . . . . . . . . . . . . . . . . . . . . . . . . . . . . 4-134.2.3 Cullet (In-house) . . . . . . . . . . . . . . . . . . . . . . . . . . . . . . . . . . 4-144.2.4 Cullet (Postconsumer) . . . . . . . . . . . . . . . . . . . . . . . . . . . . . . 4-144.2.5 Glass Container Manufacture . . . . . . . . . . . . . . . . . . . . . . . . 4-144.2.6 Data Quality . . . . . . . . . . . . . . . . . . . . . . . . . . . . . . . . . . . . . 4-15
4.3 References . . . . . . . . . . . . . . . . . . . . . . . . . . . . . . . . . . . . . . . . . . . . . 4-16
5.0 Summary LCI of Paper Products . . . . . . . . . . . . . . . . . . . . . . . . . . . . . . . . . . . . 5-15.1 Introduction . . . . . . . . . . . . . . . . . . . . . . . . . . . . . . . . . . . . . . . . . . . . . 5-15.2 Rolls of Linerboard and Medium for Corrugated Containers . . . . . . . 5-2
5.2.1 Introduction . . . . . . . . . . . . . . . . . . . . . . . . . . . . . . . . . . . . . . . 5-25.2.2 Linerboard and Medium Rolls Production . . . . . . . . . . . . . . . 5-25.2.3 Roundwood Harvesting . . . . . . . . . . . . . . . . . . . . . . . . . . . . 5-165.2.4 Wood Residues Production . . . . . . . . . . . . . . . . . . . . . . . . . . 5-165.2.5 Sodium Sulfate Mining and Processing . . . . . . . . . . . . . . . . 5-215.2.6 Soda Ash Production . . . . . . . . . . . . . . . . . . . . . . . . . . . . . . 5-215.2.7 Corn Starch Manufacture . . . . . . . . . . . . . . . . . . . . . . . . . . . 5-21

v
Table of Contents (continued)
Section Page
5.2.8 Primary Unbleached Kraft Paperboard Production (Linerboard) . . . . . . . . . . . . . . . . . . . . . . . . . . . . . . . . . . . . . 5-21
5.2.9 Semichemical Paperboard Production (Medium) . . . . . . . . . 5-225.2.10 Secondary Paperboard Production (Linerboard and
Medium) . . . . . . . . . . . . . . . . . . . . . . . . . . . . . . . . . . . . . . . . 5-235.2.11 Data Quality . . . . . . . . . . . . . . . . . . . . . . . . . . . . . . . . . . . . . 5-23
5.3 Newsprint . . . . . . . . . . . . . . . . . . . . . . . . . . . . . . . . . . . . . . . . . . . . . 5-235.3.1 Introduction . . . . . . . . . . . . . . . . . . . . . . . . . . . . . . . . . . . . . . 5-235.3.2 Newsprint Production . . . . . . . . . . . . . . . . . . . . . . . . . . . . . . 5-245.3.3 Mechanical Pulp Manufacture . . . . . . . . . . . . . . . . . . . . . . . 5-285.3.4 Thermomechanical Pulp (TMP) Manufacture . . . . . . . . . . . 5-295.3.5 Deinked Pulp Manufacture . . . . . . . . . . . . . . . . . . . . . . . . . . 5-395.3.6 Bleaching Agent Production . . . . . . . . . . . . . . . . . . . . . . . . . 5-395.3.7 Data Quality . . . . . . . . . . . . . . . . . . . . . . . . . . . . . . . . . . . . . 5-40
5.4 Office Paper . . . . . . . . . . . . . . . . . . . . . . . . . . . . . . . . . . . . . . . . . . . 5-415.4.1 Introduction . . . . . . . . . . . . . . . . . . . . . . . . . . . . . . . . . . . . . . 5-415.4.2 Office Paper Production . . . . . . . . . . . . . . . . . . . . . . . . . 5-415.4.3 Secondary Office Paper . . . . . . . . . . . . . . . . . . . . . . . . . . . . 5-435.4.4 Data Quality . . . . . . . . . . . . . . . . . . . . . . . . . . . . . . . . . . . . . 5-50
5.5 Textbook Paper . . . . . . . . . . . . . . . . . . . . . . . . . . . . . . . . . . . . . . . . . 5-505.5.1 Introduction . . . . . . . . . . . . . . . . . . . . . . . . . . . . . . . . . . . . . . 5-505.5.2 Textbook Paper Production . . . . . . . . . . . . . . . . . . . . . . . . 5-545.5.3 Secondary Textbook Production . . . . . . . . . . . . . . . . . . . . . . 5-545.5.4 Data Quality . . . . . . . . . . . . . . . . . . . . . . . . . . . . . . . . . . . . . 5-60
5.6 Magazine Paper . . . . . . . . . . . . . . . . . . . . . . . . . . . . . . . . . . . . . . . . . 5-665.6.1 Introduction . . . . . . . . . . . . . . . . . . . . . . . . . . . . . . . . . . . . . . 5-665.6.2 Primary Magazine Paper Production . . . . . . . . . . . . . . . . . 5-665.6.3 Secondary Magazine Paper Production . . . . . . . . . . . . . . . . 5-685.6.4 Data Quality . . . . . . . . . . . . . . . . . . . . . . . . . . . . . . . . . . . . . 5-69
5.7 Telephone Book Paper . . . . . . . . . . . . . . . . . . . . . . . . . . . . . . . . . . . 5-795.7.1 Introduction . . . . . . . . . . . . . . . . . . . . . . . . . . . . . . . . . . . . . . 5-795.7.2 Primary Telephone Book Paper Production . . . . . . . . . . . . 5-795.7.3 Secondary Telephone Book Paper Production . . . . . . . . . . . 5-815.7.4 Data Quality . . . . . . . . . . . . . . . . . . . . . . . . . . . . . . . . . . . . . 5-86
5.8 References . . . . . . . . . . . . . . . . . . . . . . . . . . . . . . . . . . . . . . . . . . . . . 5-92
6.0 Summary LCI of Plastic Products . . . . . . . . . . . . . . . . . . . . . . . . . . . . . . . . . . . 6-16.1 Introduction . . . . . . . . . . . . . . . . . . . . . . . . . . . . . . . . . . . . . . . . . . . . . 6-16.2 High-Density Polyethylene (HDPE) . . . . . . . . . . . . . . . . . . . . . . . . . 6-2
6.2.1 Introduction . . . . . . . . . . . . . . . . . . . . . . . . . . . . . . . . . . . . . . . 6-26.2.2 Ethylene Production . . . . . . . . . . . . . . . . . . . . . . . . . . . . . . . . 6-2
6.2.2.1 Crude Oil Production . . . . . . . . . . . . . . . . . . . . . . . . 6-3

vi
Table of Contents (continued)
Section Page
6.2.2.2 Natural Gas (Kent, 1974; Elvers et al., 1991; Standen, 1968) . . . . . . . . . . . . . . . . . . . . . . . . . . . . . 6-3
6.2.2.3 Liquefied Petroleum Gas (Kent, 1974; Elvers et al.,1991; Standen, 1968) . . . . . . . . . . . . . . . . . . . . . . . . 6-4
6.2.2.4 Petroleum Refining . . . . . . . . . . . . . . . . . . . . . . . . . 6-46.2.2.5 Natural Gas Processing (Berger and Anderson,
1992; Hobson, 1984; Meyers, 1986; McKetta, 1992;Gary and Handwork, 1994; Beggs, 1984) . . . . . . . . 6-6
6.2.2.6 Olefin (Polymerization of Ethylene) (Smith, 1990). 6-76.2.3 HDPE Production . . . . . . . . . . . . . . . . . . . . . . . . . . . . . . . . . . 6-76.2.4 Data Source and Calculation Procedures . . . . . . . . . . . . . . . 6-86.2.5 LCI Results . . . . . . . . . . . . . . . . . . . . . . . . . . . . . . . . . . . . . . . 6-96.2.6 Data Quality . . . . . . . . . . . . . . . . . . . . . . . . . . . . . . . . . . . . . . 6-9
6.3 Low-Density Polyethylene (LDPE) . . . . . . . . . . . . . . . . . . . . . . . . . 6-156.3.1 Introduction . . . . . . . . . . . . . . . . . . . . . . . . . . . . . . . . . . . . . . 6-156.3.2 LDPE Production . . . . . . . . . . . . . . . . . . . . . . . . . . . . . . . . . 6-16
6.3.2.1 Autoclave Process. . . . . . . . . . . . . . . . . . . . . . . . . 6-176.3.2.2 Tubular Process. . . . . . . . . . . . . . . . . . . . . . . . . . . 6-17
6.3.3 Data Source and Calculation Procedures . . . . . . . . . . . . . . 6-176.3.4 LCI Results . . . . . . . . . . . . . . . . . . . . . . . . . . . . . . . . . . . . . . 6-186.3.5 Data Quality . . . . . . . . . . . . . . . . . . . . . . . . . . . . . . . . . . . . . 6-22
6.4 Polyethylene Terephthalate (PET) . . . . . . . . . . . . . . . . . . . . . . . . . . 6-246.4.1 Introduction . . . . . . . . . . . . . . . . . . . . . . . . . . . . . . . . . . . . . . 6-246.4.2 PET Production . . . . . . . . . . . . . . . . . . . . . . . . . . . . . . . . . . . 6-256.4.3 Data Source and Calculation Procedures . . . . . . . . . . . . . . . 6-266.4.4 LCI Results . . . . . . . . . . . . . . . . . . . . . . . . . . . . . . . . . . . . . . 6-276.4.5 Data Quality . . . . . . . . . . . . . . . . . . . . . . . . . . . . . . . . . . . . . 6-27
6.5 Secondary Plastics . . . . . . . . . . . . . . . . . . . . . . . . . . . . . . . . . . . . . . 6-336.5.1 Introduction . . . . . . . . . . . . . . . . . . . . . . . . . . . . . . . . . . . . . . 6-336.5.2 Secondary Plastics Production . . . . . . . . . . . . . . . . . . . . . . . 6-336.5.3 Data Source and Calculation Procedures . . . . . . . . . . . . . . 6-346.5.4 LCI Results . . . . . . . . . . . . . . . . . . . . . . . . . . . . . . . . . . . . . . 6-356.5.5 Data Quality . . . . . . . . . . . . . . . . . . . . . . . . . . . . . . . . . . . . . 6-35
6.6 References . . . . . . . . . . . . . . . . . . . . . . . . . . . . . . . . . . . . . . . . . . . . . 6-40
7.0 Summary LCI of Steel Products . . . . . . . . . . . . . . . . . . . . . . . . . . . . . . . . . . . . 7-17.1 Introduction . . . . . . . . . . . . . . . . . . . . . . . . . . . . . . . . . . . . . . . . . . . . . 7-17.2 Primary Steel Production (BOF Technology) . . . . . . . . . . . . . . . . . . 7-2
7.2.1 Introduction . . . . . . . . . . . . . . . . . . . . . . . . . . . . . . . . . . . . . . . 7-27.2.2 Iron Ore Mining (Elvers et al., 1991; Honeycombe, 1981) . . 7-27.2.3 Limestone Quarrying . . . . . . . . . . . . . . . . . . . . . . . . . . . . . . . 7-37.2.4 Coke Production . . . . . . . . . . . . . . . . . . . . . . . . . . . . . . . . . . 7-37.2.5 Iron Production (Elvers et al., 1991) . . . . . . . . . . . . . . . . . . . . 7-3
vii
Table of Contents (continued)
Section Page
7.2.6 BOF Steel Production (Lankford et al., 1985; Pehlke et al., 1974-77) . . . . . . . . . . . . . . . . . . . . . . . . . . . . . . . . . . . . . . . . 7-3
7.2.7 Hot Rolling (Lankford et al., 1985; Ginzburg, 1989) . . . . . . 7-47.2.8 Data Source and Calculation Procedures . . . . . . . . . . . . . . . 7-47.2.9 Allocation Procedures . . . . . . . . . . . . . . . . . . . . . . . . . . . . . . 7-77.2.10 LCI Results . . . . . . . . . . . . . . . . . . . . . . . . . . . . . . . . . . . . . . . 7-77.2.11 Data Quality . . . . . . . . . . . . . . . . . . . . . . . . . . . . . . . . . . . . . . 7-7
7.2.11.1 Precision . . . . . . . . . . . . . . . . . . . . . . . . . . . . . . . . . 7-137.2.11.2 Consistency . . . . . . . . . . . . . . . . . . . . . . . . . . . . . . 7-137.2.11.3 Completeness . . . . . . . . . . . . . . . . . . . . . . . . . . . . . 7-147.2.11.4 Representativeness . . . . . . . . . . . . . . . . . . . . . . . . . 7-147.2.11.5 Reproducibility . . . . . . . . . . . . . . . . . . . . . . . . . . . 7-15
7.3 Secondary Steel Production (EAF Technology) . . . . . . . . . . . . . . . . 7-167.3.1 Introduction . . . . . . . . . . . . . . . . . . . . . . . . . . . . . . . . . . . . . . 7-167.3.2 Secondary Steel (Elvers et al., 1991; Honeycombe, 1981) 7-167.3.3 Limestone Quarrying . . . . . . . . . . . . . . . . . . . . . . . . . . . . . . 7-167.3.4 EAF Steel Production (Sims, 1962-63; Taylor, 1985; IISI,
1990; Fruehan, 1985) . . . . . . . . . . . . . . . . . . . . . . . . . . . . . . 7-177.3.5 Steel Bar (AIME, 1983) . . . . . . . . . . . . . . . . . . . . . . . . . . . . 7-187.3.6 Data Source and Calculation Procedures . . . . . . . . . . . . . . . 7-187.3.7 Allocation Procedures . . . . . . . . . . . . . . . . . . . . . . . . . . . . . . 7-187.3.8 LCI Results . . . . . . . . . . . . . . . . . . . . . . . . . . . . . . . . . . . . . . 7-197.3.9 Data Quality . . . . . . . . . . . . . . . . . . . . . . . . . . . . . . . . . . . . . 7-19
7.3.9.1 Precision. . . . . . . . . . . . . . . . . . . . . . . . . . . . . . . . 7-217.3.9.2 Consistency. . . . . . . . . . . . . . . . . . . . . . . . . . . . . . 7-217.3.9.3 Completeness. . . . . . . . . . . . . . . . . . . . . . . . . . . . 7-227.3.9.4 Representativeness . . . . . . . . . . . . . . . . . . . . . . . . . 7-227.3.9.5 Reproducibility. . . . . . . . . . . . . . . . . . . . . . . . . . . 7-23
7.4 References . . . . . . . . . . . . . . . . . . . . . . . . . . . . . . . . . . . . . . . . . . . . . 7-23
Appendix A Peer Reviewers for this Report . . . . . . . . . . . . . . . . . . . . . . . . . . . . . A-1Appendix B Project Stakeholders . . . . . . . . . . . . . . . . . . . . . . . . . . . . . . . . . . . . . . B-1
viii
Figures
Number Page
1-1 Illustration of the municipal solid waste life cycle . . . . . . . . . . . . . . . . . . . . . . 1-21-2 Framework for calculating environmental aspects for recycling newsprint . . . 1-4
3-1 Flow diagram for manufacturing 1 ton of primary aluminum sheet/coil . . . . . . 3-33-2 Flow diagram for manufacturing 1 ton of secondary aluminum sheet/coil . . . . 3-43-3 Process diagram for open pit limestone mining . . . . . . . . . . . . . . . . . . . . . . . . . 3-4
4-1 Flow diagram for generating 1 ton of primary glass containers . . . . . . . . . . . . 4-24-2 Flow diagram for generating 1 ton of 100 percent secondary glass
containers . . . . . . . . . . . . . . . . . . . . . . . . . . . . . . . . . . . . . . . . . . . . . . . . . . . . . . 4-24-3 Flow diagram for generating 1 ton of composite glass containers containing
27.5 percent postconsumer cullet and 72.5 percent primary materials . . . . . . . 4-34-4 Process diagram for open pit limestone mining . . . . . . . . . . . . . . . . . . . . . . . . 4-114-5 Process diagram for open pit and mining . . . . . . . . . . . . . . . . . . . . . . . . . . . . 4-124-6 Process diagram for underground trona mining to produce soda ash . . . . . . . 4-124-7 Process diagram for open pit mining and purifying of feldspar . . . . . . . . . . . 4-13
5.2-1 1996 U.S. containerboard raw material and product flows . . . . . . . . . . . . . . . . 5-45.2-2 Process flow diagram for producing 1 ton of primary linerboard and medium
rolls for corrugated containers . . . . . . . . . . . . . . . . . . . . . . . . . . . . . . . . . . . . . . 5-65.2-3 Process flow diagram for producing 1 ton of composite linerboard and
medium rolls for corrugated containers . . . . . . . . . . . . . . . . . . . . . . . . . . . . . . . 5-75.2-4 Process flow diagram for producing 1 ton of secondary linerboard and
medium rolls for corrugated containers . . . . . . . . . . . . . . . . . . . . . . . . . . . . . . . 5-85.3-1 U.S. newsprint raw material and product flows . . . . . . . . . . . . . . . . . . . . . . . . 5-265.3-2 Process flow diagram for producing 1 ton of primary newsprint . . . . . . . . . . 5-275.3-3 Process flow diagram for producing 1 ton of composite newsprint . . . . . . . . 5-285.3-4 Process flow diagram for producing 1 ton of secondary newsprint . . . . . . . . 5-295.4-1 Primary office paper production . . . . . . . . . . . . . . . . . . . . . . . . . . . . . . . . . . . 5-425.4-2 Simplified process flow diagram for secondary office paper production . . . . 5-495.5-1 Simplified process flow diagram for primary textbook paper production . . . . 5-555.5-2 Simplified process flow diagram for secondary textbook paper production . . 5-595.6-1 Simplified process flow diagram for primary magazine paper production. . . 5-675.6-2 Simplified process flow diagram for secondary magazine paper production . 5-735.7-1 Simplified process flow diagram for primary telephone book paper
production . . . . . . . . . . . . . . . . . . . . . . . . . . . . . . . . . . . . . . . . . . . . . . . . . . . . 5-805.7-2 Simplified process flow diagram for secondary telephone book paper
production . . . . . . . . . . . . . . . . . . . . . . . . . . . . . . . . . . . . . . . . . . . . . . . . . . . . 5-85
6-1 Simplified process flow diagram for ethylene . . . . . . . . . . . . . . . . . . . . . . . . . . 6-36-2 Simplified process flow diagram for high-density polyethylene . . . . . . . . . . . . 6-8
ix
Figures (continued)
Number Page
6-3 Simplified process flow diagram for low-density polyethylene . . . . . . . . . . . 6-166-4 Simplified process flow diagram for polyethylene terephthalate (PET) . . . . . 6-256-5 Process flow diagram for secondary plastics . . . . . . . . . . . . . . . . . . . . . . . . . . 6-34
7-1 Simplified process flow diagram for BOF steel . . . . . . . . . . . . . . . . . . . . . . . . 7-27-2 Simplified process flow diagram for EAF steel . . . . . . . . . . . . . . . . . . . . . . . . 7-16
x
Tables
Number Page
2-1 Material Definitions . . . . . . . . . . . . . . . . . . . . . . . . . . . . . . . . . . . . . . . . . . . . . . 2-22-2 Sample Data Table Format . . . . . . . . . . . . . . . . . . . . . . . . . . . . . . . . . . . . . . . . 2-52-3 Summary of Data Sources Used in LCI Profiles . . . . . . . . . . . . . . . . . . . . . . . 2-14
3-1 Data for Production of 1 Ton of Primary Aluminum Sheet/Coil . . . . . . . . . . . . 3-53-2 Data for Production of 1 Ton of Secondary Aluminum Sheet/Coil . . . . . . . . . . 3-83-3 Fuels Used to Produce Electricity for Bauxite Production . . . . . . . . . . . . . . . 3-133-4 Fuels Used to Produce Electricity for Alumina Production . . . . . . . . . . . . . . 3-143-5 Aluminum Production According to NAERC Regions and Subregions . . . . . 3-183-6 Fuel Mix for Electricity Production by NAERC Region/Subregion and
Average Mix for Aluminum Smelting . . . . . . . . . . . . . . . . . . . . . . . . . . . . . . . 3-193-7 Data Quality Information for Aluminum . . . . . . . . . . . . . . . . . . . . . . . . . . . . . 3-21
4-1 Data for Production of 1 Ton of Primary Glass Containers . . . . . . . . . . . . . . . 4-44-2 Data for Production of 1 Ton of Secondary Glass Containers . . . . . . . . . . . . . 4-64-3 Data for Production of 1 Ton of Composite (27.5 Percent Secondary/
72.5 Percent Primary) Glass Containers . . . . . . . . . . . . . . . . . . . . . . . . . . . . . . 4-94-4 Data Quality Information on Glass Containers . . . . . . . . . . . . . . . . . . . . . . . . 4-15
5.2-1 1996 U.S. Composite Containerboard Characteristics . . . . . . . . . . . . . . . . . . . 5-55.2-2 Data for Production of 1 Ton of Primary Liner and Medium for Corrugated
Containers . . . . . . . . . . . . . . . . . . . . . . . . . . . . . . . . . . . . . . . . . . . . . . . . . . . . . 5-95.2-3 Data for Production of 1 Ton of Secondary Liner and Medium for
Corrugated Containers . . . . . . . . . . . . . . . . . . . . . . . . . . . . . . . . . . . . . . . . . . . 5-135.2-4 Data for Production of 1 Ton of Composite (45 Percent Secondary/
55 Percent Primary) Liner and Medium for Corrugated Containers . . . . . . . . 5-175.2-5 Data Quality Information for Corrugated Linerboard and Medium . . . . . . . . 5-245.3-1 Data for Production of 1 Ton of Primary Newsprint Rolls . . . . . . . . . . . . . . . 5-305.3-2 Data for Production of 1 Ton of Secondary Newsprint Rolls . . . . . . . . . . . . . 5-335.3-3 Data for Production of 1 Ton of Composite (38 Percent Secondary/
62 Percent Primary) Newsprint Rolls . . . . . . . . . . . . . . . . . . . . . . . . . . . . . . . 5-365.3-4 Data Quality Information for Newsprint . . . . . . . . . . . . . . . . . . . . . . . . . . . . . 5-405.4-1 Data for Production of 1 Ton of Primary Office Paper . . . . . . . . . . . . . . . . . . 5-445.4-2 Data for Production of 1 Ton of Secondary Office Paper . . . . . . . . . . . . . . . . 5-475.4-3 Data Quality Summary for Primary and Secondary Office Paper . . . . . . . . . . 5-515.4-4 Comparison to Literature of Key Inventory Data Values for Primary
Office Paper . . . . . . . . . . . . . . . . . . . . . . . . . . . . . . . . . . . . . . . . . . . . . . . . . . . 5-535.4-5 Comparison to Literature of Key Inventory Data Values for Secondary
Office Paper . . . . . . . . . . . . . . . . . . . . . . . . . . . . . . . . . . . . . . . . . . . . . . . . . . . 5-535.5-1 Data for Production of 1 Ton of Primary Textbook Paper . . . . . . . . . . . . . . . 5-565.5-2 Data for Production of 1 Ton of Secondary Textbook Paper . . . . . . . . . . . . . 5-615.5-3 Data Quality Summary for Primary and Secondary Textbook Paper . . . . . . . 5-64

xi
Tables (continued)
Number Page
5.5-4 Comparison to Literature of Key Inventory Data Values for PrimaryTextbook Paper . . . . . . . . . . . . . . . . . . . . . . . . . . . . . . . . . . . . . . . . . . . . . . . . 5-65
5.5-5 Comparison to Literature of Key Inventory Data Values for Secondary Textbook Paper . . . . . . . . . . . . . . . . . . . . . . . . . . . . . . . . . . . . . . . . . . . . . . . . 5-66
5.6-1 Data for Producing 1 Ton of Primary Magazine Paper . . . . . . . . . . . . . . . . . . 5-705.6-2 Data for Producing 1 Ton of Secondary Magazine Paper . . . . . . . . . . . . . . . . 5-745.6-3 Data Quality Summary for Primary and Secondary Magazine Paper . . . . . . . 5-775.6-4 Comparison to Literature of Key Inventory Data Values for Primary
Magazine Paper . . . . . . . . . . . . . . . . . . . . . . . . . . . . . . . . . . . . . . . . . . . . . . . . 5-785.6-5 Comparison to Literature of Key Inventory Data Values for Secondary
Magazine Paper . . . . . . . . . . . . . . . . . . . . . . . . . . . . . . . . . . . . . . . . . . . . . . . . 5-795.7-1 Data for Producing 1 Ton of Primary Telephone Book Paper . . . . . . . . . . . . . 5-825.7-2 Data for Producing 1 Ton of Secondary Telephone Book Paper . . . . . . . . . . 5-875.7-3 Data Quality Summary for Primary and Secondary Telephone Book Paper . . 5-905.7-4 Comparison to Literature of Key Inventory Data Values for Primary
Telephone Book Paper . . . . . . . . . . . . . . . . . . . . . . . . . . . . . . . . . . . . . . . . . . . 5-915.7-5 Comparison to Literature of Key Inventory Data Values for Secondary
Telephone Book Paper . . . . . . . . . . . . . . . . . . . . . . . . . . . . . . . . . . . . . . . . . . . 5-91
6-1 Environmental Emissions for Production of 1 Ton of HDPE With andWithout European Electrical Emissions . . . . . . . . . . . . . . . . . . . . . . . . . . . . . 6-10
6-2 Data for Production of 1 Ton of Primary HDPE . . . . . . . . . . . . . . . . . . . . . . . 6-116-3 Data Quality Summary for HDPE . . . . . . . . . . . . . . . . . . . . . . . . . . . . . . . . . . 6-136-4 Comparison to Literature of Key Inventory Data Values for HDPE . . . . . . . . 6-156-5 Environmental Emissions for Production of 1 Ton of LDPE
With and Without European Electrical Emissions . . . . . . . . . . . . . . . . . . . . . 6-196-6 Data for Production of 1 Ton of Primary LDPE . . . . . . . . . . . . . . . . . . . . . . . 6-206-7 Data Quality Summary for LDPE . . . . . . . . . . . . . . . . . . . . . . . . . . . . . . . . . . 6-236-8 Comparison to Literature of Key Inventory Data Values for LDPE . . . . . . . . 6-246-9 Environmental Emissions for Production of 1 Ton of PET With and
Without European Electrical Emissions . . . . . . . . . . . . . . . . . . . . . . . . . . . . . 6-286-10 Data for Production of 1 Ton of Primary PET . . . . . . . . . . . . . . . . . . . . . . . . . 6-296-11 Data Quality Summary for PET . . . . . . . . . . . . . . . . . . . . . . . . . . . . . . . . . . . . 6-316-12 Comparison to Literature of Key Inventory Data Values for PET . . . . . . . . . 6-326-13 Data for Production of 1 Ton of Secondary Plastics . . . . . . . . . . . . . . . . . . . . 6-366-14 Data Quality Summary for Secondary Plastics . . . . . . . . . . . . . . . . . . . . . . . . 6-396-15 Comparison to Literature of Key Inventory Data Values for
Secondary Plastics . . . . . . . . . . . . . . . . . . . . . . . . . . . . . . . . . . . . . . . . . . . . . . 6-407-1 Secondary Data Sources and Their Description . . . . . . . . . . . . . . . . . . . . . . . . 7-57-2 Data for the Production of 1 Ton of Primary (BOF) Steel . . . . . . . . . . . . . . . . 7-87-3 Data Quality Summary for Steel Profiles . . . . . . . . . . . . . . . . . . . . . . . . . . . . 7-10
xii
Tables (continued)
Number Page
7-4 Domain and Geographical Coverage for Steel Production . . . . . . . . . . . . . . . 7-137-5 Unit Process Sample Size and Percent of Production . . . . . . . . . . . . . . . . . . . 7-157-6 Percent Difference of North American Hot Rolled Steel Data
Compared to Global Average . . . . . . . . . . . . . . . . . . . . . . . . . . . . . . . . . . . . . 7-157-7 Data for Production of 1 Ton of Secondary EAF Steel . . . . . . . . . . . . . . . . . . 7-207-8 Domain and Geographical Coverage for Steel Production . . . . . . . . . . . . . . . 7-217-9 Unit Process Sample Size and Percent of Production . . . . . . . . . . . . . . . . . . . 7-227-10 Difference of North American Bars Compared to Global Average . . . . . . . . 7-23
xiii
List of Acronyms
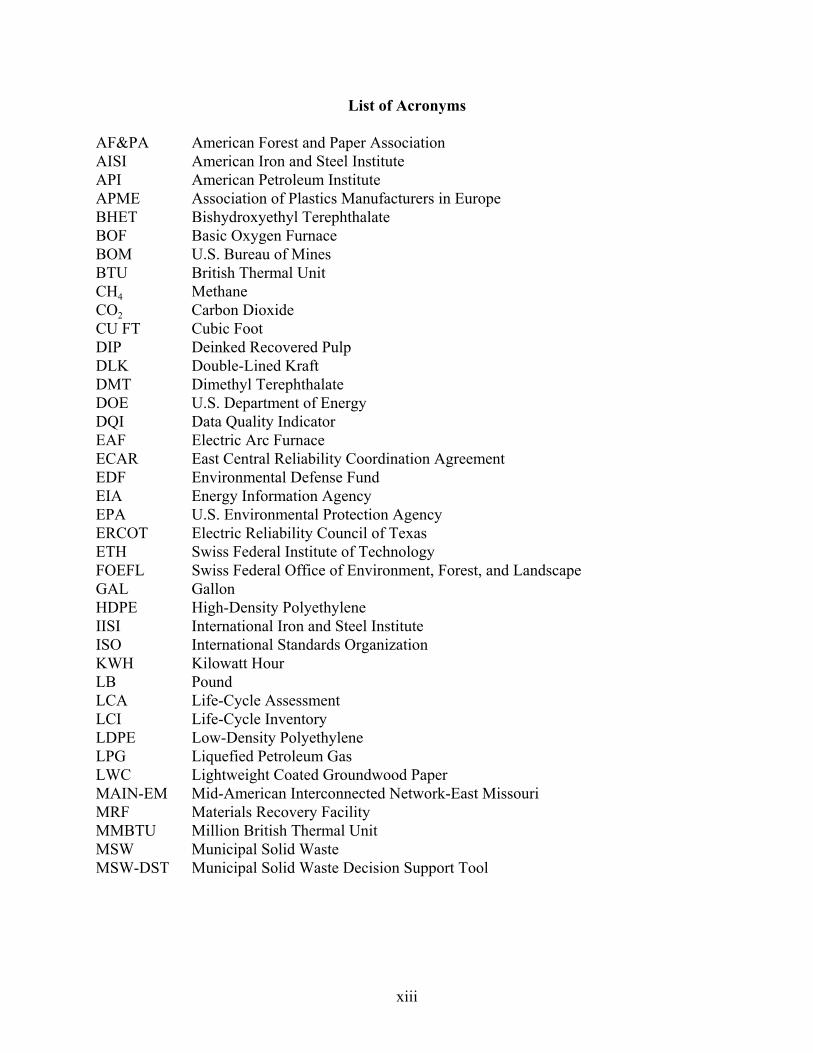
AF&PA American Forest and Paper AssociationAISI American Iron and Steel InstituteAPI American Petroleum InstituteAPME Association of Plastics Manufacturers in EuropeBHET Bishydroxyethyl TerephthalateBOF Basic Oxygen FurnaceBOM U.S. Bureau of MinesBTU British Thermal UnitCH4 MethaneCO2 Carbon DioxideCU FT Cubic FootDIP Deinked Recovered PulpDLK Double-Lined KraftDMT Dimethyl TerephthalateDOE U.S. Department of EnergyDQI Data Quality IndicatorEAF Electric Arc FurnaceECAR East Central Reliability Coordination AgreementEDF Environmental Defense FundEIA Energy Information AgencyEPA U.S. Environmental Protection AgencyERCOT Electric Reliability Council of TexasETH Swiss Federal Institute of TechnologyFOEFL Swiss Federal Office of Environment, Forest, and LandscapeGAL GallonHDPE High-Density PolyethyleneIISI International Iron and Steel InstituteISO International Standards OrganizationKWH Kilowatt HourLB PoundLCA Life-Cycle AssessmentLCI Life-Cycle InventoryLDPE Low-Density PolyethyleneLPG Liquefied Petroleum GasLWC Lightweight Coated Groundwood PaperMAIN-EM Mid-American Interconnected Network-East MissouriMRF Materials Recovery FacilityMMBTU Million British Thermal UnitMSW Municipal Solid WasteMSW-DST Municipal Solid Waste Decision Support Tool

xiv
Acronyms (continued)
NAERC North American Electric Reliability CouncilNGL Natural Gas LiquidNOx Nitrogen OxidesNPCC-NY Northeast Power Coordination Council-New York Power PoolNPCC-QUE Northeast Power Coordination Council-QuebecNSSC Neutral Sulfite Pulping ProcessOCC Old Corrugated ContainersPET Polyethylene TerephthalatePGW Pressurized Groundwood PulpRMP Refiner Mechanical PulpRTI Research Triangle InstituteSAEFL Swiss Agency for the Environment, Forests, and LandscapesSERC-TVA Southeastern Electric Reliability Council-Tennessee Valley AuthoritySERC-VAC Southeastern Electric Reliability Council-Virginia and CarolinaSETAC Society of Environmental Toxicology and ChemistrySGP Stone Groundwood PulpSPP-WC Southwest Power Pool-West CentralTPA Terephthalic AcidUSAMP U.S. Automotive Material PartnershipWCC-BPA Western System Coordinating Council-Bonneville Power AdministrationWCC-RMP Western System Coordinating Council-Rocky Mountain AreaWSCC-CAN Western System Coordinating Council-Canada

xv
Acknowledgments
Through efforts to analyze MSW management systems and their performance, concernswere raised about the lack of environmental data for many management options. For example,although many communities have good information about the cost of recycling efforts, little tono information is available to assess the potential environmental benefit of those efforts. Community representatives and other stakeholders to this project requested assistance fromEPA’s Office of Research and Development to help develop environmental information for suchoperations. Through an overall Cooperative Agreement (CR823052) with the ResearchTriangle Institute and its partners, this was conducted to develop life-cycle inventory type datafor the production of commodity materials from primary (virgin) and secondary (recycled)resources. These data would enable solid waste planners to assess the environmental aspects ofrecycling programs. Through this effort, a review of available data and information wasconducted, major data gaps identified and filled, life-cycle inventory profiles constructed, and anoverall report prepared and reviewed by project stakeholders and a peer review panel.
We would like to thank all of those who participated in providing data and informationcontained in this report, and reviewing interim drafts of this report. In particular, we would liketo acknowledge the contributions of the following individuals:
Morton Barlaz, North Carolina State UniversityScott Chubbs, formerly with the American Iron and Steel InstituteJames Fava, Five Winds InternationalBill Franklin, Franklin AssociatesMarge Franklin, Franklin AssociatesMelissa Huff, Franklin AssociatesBob Hunt, Franklin AssociatesKrishnam Raju, formerly with Roy F. WestonSabrina Spatari, Five Winds InternationalAgis Veroutis, formerly with Roy F. WestonSteve Young, Five Winds International
We would also like to acknowledge the invaluable comments and contributions providedby our project stakeholders and peer review panel. Lists of individuals who participated in thesegroups are included as Appendices A and B of this report.

Acknowledgments
Through efforts to analyze MSW management systems and their performance, concernswere raised about the lack of environmental data for many management options. For example,although many communities have good information about the cost of recycling efforts, little to noinformation is available to assess the potential environmental benefit of those efforts. Communityrepresentatives and other stakeholders to this project requested the assistance from EPA’s Office ofResearch and Development to help develop environmental information for such operations. Through an overall Cooperative Agreement (CR823052) with the Research Triangle Institute andits partners, this was conducted to develop life-cycle inventory type data for the production ofcommodity materials from primary (virgin) and secondary (recycled) resources. This data wouldenable solid waste planners to assess the environmental aspects of recycling programs. Through thiseffort, a review of available data and information was conducted, major data gaps identified andfilled, life-cycle inventory profiles constructed, an overall report prepared and reviewed by projectstakeholders and peer review panel.
We would like to thank all of those who participated in providing data and informationcontained in this report, and review of interim drafts of this report. In particular, we would like toacknowledge the contributions of the following individuals:
Morton Barlaz, North Carolina State UniversityScott Chubbs, formerly with the American Iron and Steel InsituteJames Fava, Five Winds InternationalBill Franklin, Franklin AssociatesMarge Franklin, Franklin AssociatesMelissa Huff, Franklin AssociatesBob Hunt, Franklin AssociatesKrishnam Raju, formerly with Roy F. WestonSabrina Spatari, Five Winds InternationalAgis Veroutis, formerly with Roy F. WestonSteve Young, Five Winds International
We would also like to acknowledge the invaluable comments and contributions provided byour project stakeholders and peer review panel. Lists of individuals who participated in these groupsare included as Appendices A and B of this report.
Section 1.0 Introduction and Goals
1-1
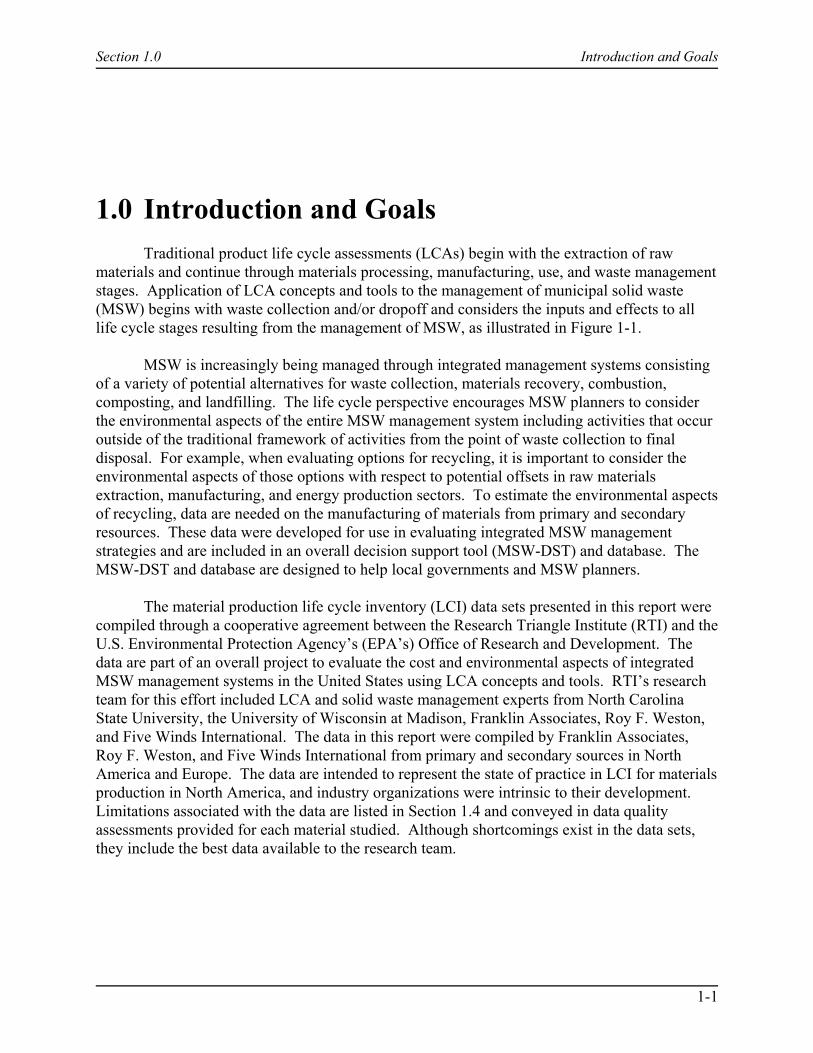
1.0 Introduction and GoalsTraditional product life cycle assessments (LCAs) begin with the extraction of raw
materials and continue through materials processing, manufacturing, use, and waste managementstages. Application of LCA concepts and tools to the management of municipal solid waste(MSW) begins with waste collection and/or dropoff and considers the inputs and effects to alllife cycle stages resulting from the management of MSW, as illustrated in Figure 1-1.
MSW is increasingly being managed through integrated management systems consistingof a variety of potential alternatives for waste collection, materials recovery, combustion,composting, and landfilling. The life cycle perspective encourages MSW planners to considerthe environmental aspects of the entire MSW management system including activities that occuroutside of the traditional framework of activities from the point of waste collection to finaldisposal. For example, when evaluating options for recycling, it is important to consider theenvironmental aspects of those options with respect to potential offsets in raw materialsextraction, manufacturing, and energy production sectors. To estimate the environmental aspectsof recycling, data are needed on the manufacturing of materials from primary and secondaryresources. These data were developed for use in evaluating integrated MSW managementstrategies and are included in an overall decision support tool (MSW-DST) and database. TheMSW-DST and database are designed to help local governments and MSW planners.
The material production life cycle inventory (LCI) data sets presented in this report werecompiled through a cooperative agreement between the Research Triangle Institute (RTI) and theU.S. Environmental Protection Agency’s (EPA’s) Office of Research and Development. Thedata are part of an overall project to evaluate the cost and environmental aspects of integratedMSW management systems in the United States using LCA concepts and tools. RTI’s researchteam for this effort included LCA and solid waste management experts from North CarolinaState University, the University of Wisconsin at Madison, Franklin Associates, Roy F. Weston,and Five Winds International. The data in this report were compiled by Franklin Associates,Roy F. Weston, and Five Winds International from primary and secondary sources in NorthAmerica and Europe. The data are intended to represent the state of practice in LCI for materialsproduction in North America, and industry organizations were intrinsic to their development. Limitations associated with the data are listed in Section 1.4 and conveyed in data qualityassessments provided for each material studied. Although shortcomings exist in the data sets,they include the best data available to the research team.

Section 1.0 Introduction and Goals
1-2
Figure 1-1. Illustration of the municipal solid waste life cycle.
1.1 Goals
The goal of this data collection effort was to develop average “cradle-to-gate” LCI datasets for common recyclable materials, including aluminum, glass, paper, plastic, and steel forNorth America. These data are used in the MSW-DST to estimate the environmental aspectsassociated with recycling and are also included in the database. These data can be used, forinstance, to estimate the total environmental benefit achieved through a residential curbsiderecycling program that recovers 25,000 tons of aluminum, glass, newsprint, and polyethyleneterephthalate (PET) per year. Alternatively, the data can be used to evaluate how theenvironmental aspects of an MSW management system change if a specific material, say glass, isadded to or removed from a community’s recycling program.
1.2 Intended Application of These Data
The data presented in this report were developed for use in evaluating the environmentalaspects of MSW management strategies involving recycling. The data are included in thedatabase as raw data as well as a “recycling” module of the MSW-DST. In the MSW-DST, an“offset analysis” is used so that any reductions (or increases) in environmental aspects associated
Section 1.0 Introduction and Goals
1-3
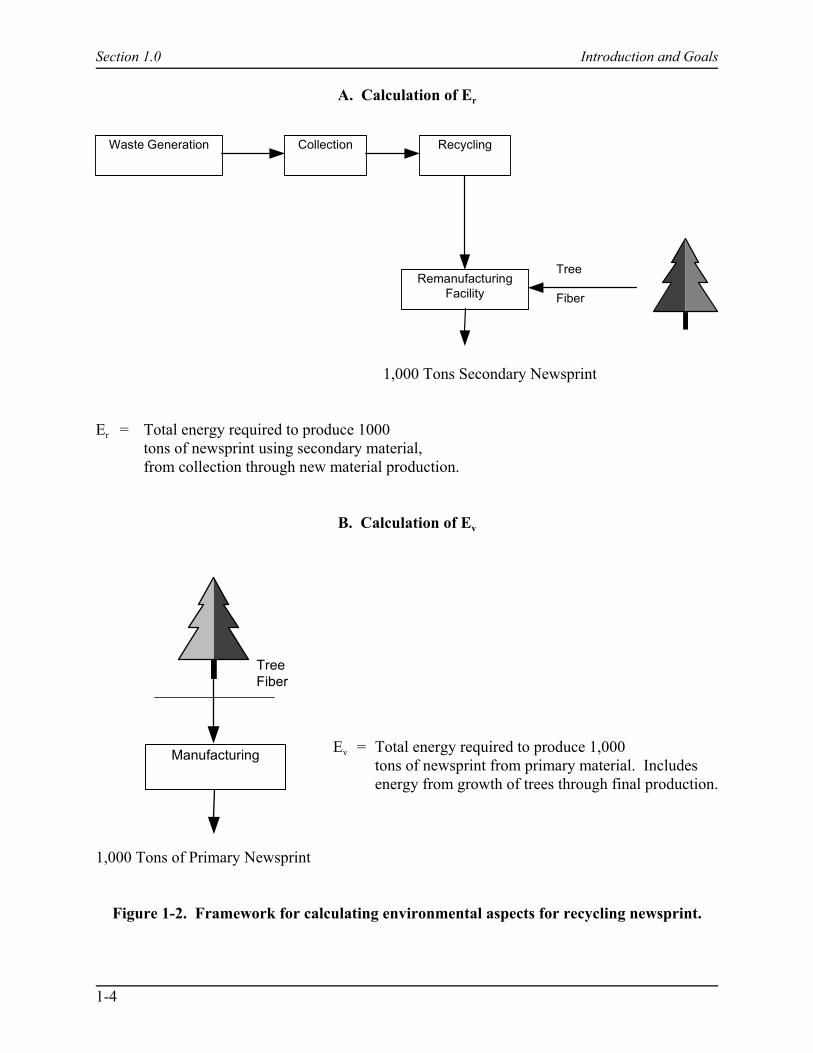
with the use of secondary materials in place of primary materials are included in the overallresults. This procedure is summarized below and illustrated in Figure 1-2.
In MSW management strategies where some portion of MSW is recycled, the recyclableswill ultimately be delivered to a facility for remanufacturing. Separation will occur duringcollection, at a materials recovery facility (MRF), or at another waste management facility.
Energy and resources will be expended to deliver the recyclables to a remanufacturing facility. At this facility, additional energy and resources will be expended to convert the recyclables to anew materials. The total amount of energy (or other LCI parameter) required to recover therecyclable from the waste stream and convert it to a new material, termed Er, will be included inthe LCI. In addition, we must include the amount of energy required to produce a similaramount of material from primary resources or Ev. The net amount of energy (En) expended (orsaved) to recycle a material will then be calculated as the difference between Er and Ev (En = Er -Ev). A similar calculation is performed for all other LCI parameters.
To use this information to calculate the net environmental aspects associated withrecycling, two additional factors are needed.
# Recycled material input ratio: represents the amount of recovered resources(e.g., old newsprint) required to produce one ton of new material (e.g., newnewsprint). This ratio allows the user of the MSW-DST to consider the widevariability in the use of secondary materials. For example, producing a ton ofnewsprint from secondary resources may require more than one ton of secondarynewsprint fiber due to losses in the repulping process. The recycled materialinput ratio allows the user to tailor the use of secondary resources to matchcurrent production practices.
The recycled material input ratios are currently defined as follows in the MSW-DST:
• Aluminum = 1.07 ton recycled/new ton• Glass = 1.03 ton recycled/new ton• Corrugated = 1.07 ton recycled/new ton• Newsprint = 1.06 ton recycled/new ton• Office Paper = 1.53 ton recycled/new ton• Textbooks = 1.44 ton recycled/new ton• Telephone Books = 1.40 ton recycled/new ton• Magazines/3rd Class Mail = 1.41ton recycled/new ton• PET = 1.16 ton recycled/new ton• LDPE = 1.16 ton recycled/new ton• HDPE = 1.16 ton recycled/new ton• Steel = 1.19 ton recycled/new ton
Section 1.0 Introduction and Goals
1-4
Tree
FiberRemanufacturing
Facility
Waste Generation Collection Recycling
TreeFiber
Manufacturing
A. Calculation of Er
1,000 Tons Secondary Newsprint
Er = Total energy required to produce 1000tons of newsprint using secondary material, from collection through new material production.
B. Calculation of Ev
1,000 Tons of Primary Newsprint
Figure 1-2. Framework for calculating environmental aspects for recycling newsprint.
Ev = Total energy required to produce 1,000tons of newsprint from primary material. Includesenergy from growth of trees through final production.
Section 1.0 Introduction and Goals
1-5
These values are implemented as defaults that the user of the MSW-DST may override ifbetter information is available.
# Materials substitution ratio: represents the amount of new material (e.g., newnewsprint) produced from secondary resources required to produce a product(e.g., newspapers) of equivalent function as a product produced from primaryresources. This ratio allows the user of the MSW-DST to consider functional orperformance differences between the primary and secondary materials. Forexample, it may take 1.2 tons of secondary corrugated container linerboard andmedium to match the functional equivalence of 1 ton of primary linerboard andmedium for a specific application.
All substitution ratios are currently set at one in the MSW-DST. The user may overridethe default and enter a new substitution ratio if there is appropriate justification.
The recycled material input and substitution ratios are implemented in theremanufacturing module of the MSW-DST and are not discussed further in this report. Foradditional information, please consult the remanufacturing process model documentation(Dumas, 2000).
Use of this analytical framework requires selection of an intermediate product for whichit is possible to compare LCI parameters between the primary and secondary processes. Forexample, PET beverage bottles may not be recovered and made into new PET beverage bottles. Thus, although the starting material for the remanufacturing process may be a used PETbeverage bottle, the end material on which the LCI data is based may be a fiber. In this case, thestudy should compare LCI parameters between the primary and secondary material productionprocesses for fiber. For this effort, intermediate materials (e.g., aluminum sheet/coil, plasticresin) were used as the endpoints for comparing primary and recycling processes.
Other applications of the data presented in this report may include
# use in other solid waste studies attempting to generate rough estimates of theenvironmental benefits associated with the recycling of specific materials.
Other applications of the data presented in this report may not include
# use as a sole criteria for making decisions regarding recycling of specificmaterials
# use in studies attempting to compare the life cycle environmental aspects ofalternative packaging materials
# use to directly compare “primary” to “secondary” materials (data for materialscollection, separation, and transport steps are also required).
Section 1.0 Introduction and Goals
1-6
1.3 Data Review Process
To ensure the applicability and usefulness of the materials LCI data, we employed aninclusive review process for all data sets and documentation that included
# Internal project team# Advisors from the U.S. EPA and the U.S. Department of Energy# Project stakeholders from state and local governments, environmental interest
groups, industry, trade associations, academia, and others (listed in Appendix A)# External project peer review committee (listed in Appendix B).
The high level of involvement by project stakeholders and peer review committee members hascontributed greatly to the success of this project and ensures that these data sets are appropriatefor supporting the overall effort.
1.4 Key Assumptions and Limitations
Primary and secondary sources of data were used to compile the data sets included in thisreport. Some of the key assumptions of the data include
# Data represent U.S. industry averages and assume an average mixture of U.S.technologies and emissions controls, except for plastics data which are fromEuropean sources (see limitations).
# The boundaries for all data sets are “cradle-to-gate.” That is, the data incorporateall processes from the extraction of raw materials through materialsmanufacturing. It is assumed that product manufacturing, distribution, and usestages are identical regardless of whether primary or secondary materials areused.
# Common commodity endpoints (e.g., aluminum sheet) were defined for eachmaterial and do not include the manufacture of specific products (e.g., aluminumcans), except for glass (see limitations).
# The data for precombustion (fuels and electrical energy production) are for NorthAmerica and electrical energy related aspects assume a national electrical energygrid mix. Consistent precombustion data was used from all data sets expect steel(see limitations).
# Data for the production of secondary materials do not include materialscollection, separation, and transportation steps. Data for these activities areincluded in other modules of the MSW-DST and are accounted for in the tool'sresults.
Although great care was taken to construct the best possible data sets from available sources,there are limitations associated with the data
Section 1.0 Introduction and Goals
1-7
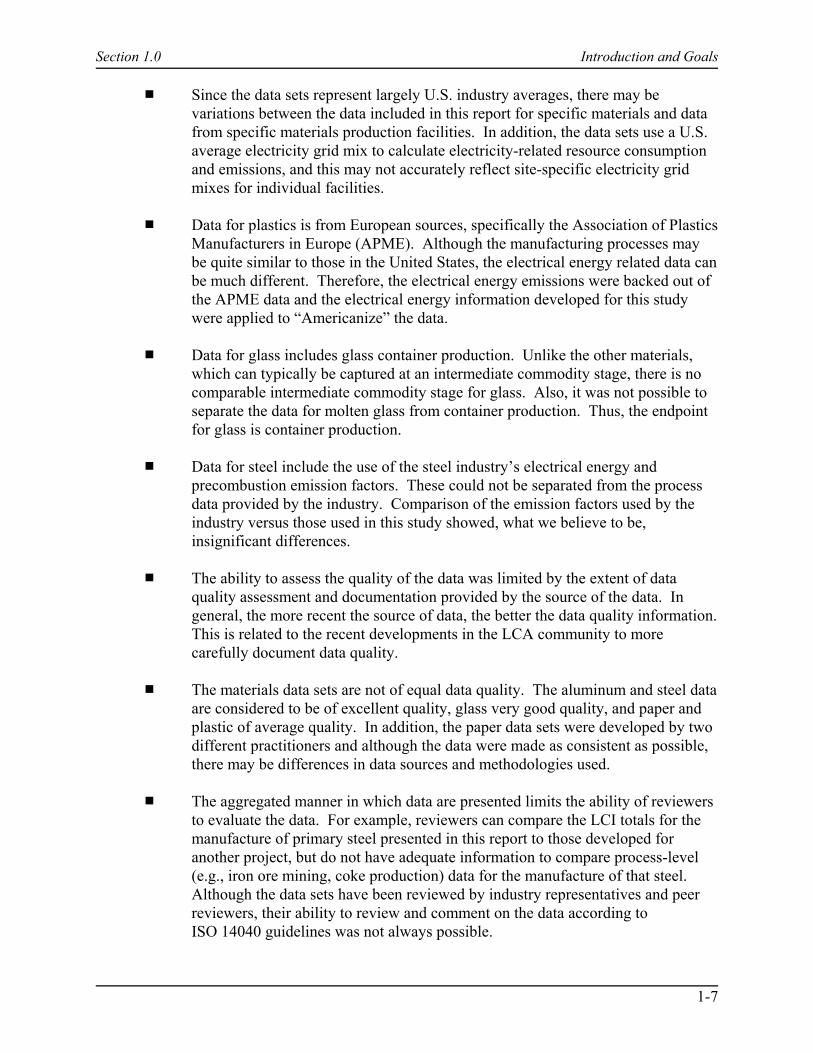
# Since the data sets represent largely U.S. industry averages, there may bevariations between the data included in this report for specific materials and datafrom specific materials production facilities. In addition, the data sets use a U.S.average electricity grid mix to calculate electricity-related resource consumptionand emissions, and this may not accurately reflect site-specific electricity gridmixes for individual facilities.
# Data for plastics is from European sources, specifically the Association of PlasticsManufacturers in Europe (APME). Although the manufacturing processes maybe quite similar to those in the United States, the electrical energy related data canbe much different. Therefore, the electrical energy emissions were backed out ofthe APME data and the electrical energy information developed for this studywere applied to “Americanize” the data.
# Data for glass includes glass container production. Unlike the other materials,which can typically be captured at an intermediate commodity stage, there is nocomparable intermediate commodity stage for glass. Also, it was not possible toseparate the data for molten glass from container production. Thus, the endpointfor glass is container production.
# Data for steel include the use of the steel industry’s electrical energy andprecombustion emission factors. These could not be separated from the processdata provided by the industry. Comparison of the emission factors used by theindustry versus those used in this study showed, what we believe to be,insignificant differences.
# The ability to assess the quality of the data was limited by the extent of dataquality assessment and documentation provided by the source of the data. Ingeneral, the more recent the source of data, the better the data quality information. This is related to the recent developments in the LCA community to morecarefully document data quality.
# The materials data sets are not of equal data quality. The aluminum and steel dataare considered to be of excellent quality, glass very good quality, and paper andplastic of average quality. In addition, the paper data sets were developed by twodifferent practitioners and although the data were made as consistent as possible,there may be differences in data sources and methodologies used.
# The aggregated manner in which data are presented limits the ability of reviewersto evaluate the data. For example, reviewers can compare the LCI totals for themanufacture of primary steel presented in this report to those developed foranother project, but do not have adequate information to compare process-level(e.g., iron ore mining, coke production) data for the manufacture of that steel. Although the data sets have been reviewed by industry representatives and peerreviewers, their ability to review and comment on the data according toISO 14040 guidelines was not always possible.
Section 1.0 Introduction and Goals
1-8
# The approach for calculating the environmental aspects of recycling in the overallMSW-DST using the data sets in this report is simplistic. The quality ofrecovered materials is dependent of the quality of materials comprising the MSWstream and their management. Contamination and product use can significantlydegrade the physical and chemical properties of different materials. It may not bereasonable to assume that the recycled (secondary) materials will always be usedin place of primary resources. In addition, the calculation for estimating theenvironmental aspects of recycling is linear. Thus, the per ton benefit oradditional burden is the same regardless of whether 10 tons or 10,000 tons arerecycled.
# The assumption that product manufacturing, distribution, and use stages areidentical regardless of whether primary or secondary materials are used is notvalid in all cases. For example, a plastic bag made from secondary plastic mayunderperform a comparable bag made from primary plastic. Although asubstitution ratio is included in the MSW-DST to address performance aspectsbetween primary and secondary materials, it cannot capture every possibleperformance issue.
# Actual environmental impacts from the materials data sets would be extremelydifficult to estimate due to the aggregated manner in which data are presented. Data for specific process steps was largely unavailable.
1.5 Report Organization
Chapter 2 presents the general scope and boundary conditions followed in generating thedata sets and Chapters 3 through 7 provide the material production LCI data sets for aluminum,glass, paper, plastic, and steel.
To the extent possible, ISO 14040 and 14041 guidelines were used to develop and reviewthe LCI data sets included in this report. Although the ISO guidelines could not be reprinted inthis report, copies of the guidelines can be obtained by contacting:
American National Standards Institute11 West 42nd Street13th floorNew York, NY 10036Phone: 212-642-4900Fax: 212-302-1286E-mail: [email protected]: http://www.ansi.org/
1.6 References
Dumas, Robert. 2000. Life-Cycle Inventory Model for Materials Remanufacturing. Preparedfor RTI by North Carolina State University, Department of Civil Engineering, Raleigh,NC 27695.
Section 2.0 General Scope and Boundary Conditions
2-1
2.0 General Scope and Boundary ConditionsA total of 42 MSW components are detailed in the overall project system description
document (Barlaz and Weitz, 1996) and include the min categories of aluminum, glass, paper,plastic, and steel. For the MSW components that are recyclable, manufacturing LCI data areneeded to evaluate the environmental aspects of recycling. The materials for which cradle-to-gate LCI data were collected and presented in this report include
# Aluminum
# Glass- clear- brown- green
# Paper- newsprint- corrugated medium and liner- office paper- textbook- telephone book- magazines/third class mail
# Plastic- low-density polyethylene (LDPE)- high-density polyethylene (HDPE)- polyethylene terephthalate (PET)
# Steel.
Data for the manufacture of each of these materials from primary and secondaryresources is included. Note that although the data sets are titled “primary” and “secondary,” few100 percent primary and secondary material production processes exist. Therefore, the termsprimary and secondary should be interpreted as predominantly primary and secondary. Table 2-1 defines the mix of primary and secondary resources used for each material LCI dataset.
In addition, for each material, a common manufacturing endpoint had to be defined andapplied consistently. For example, the endpoint for aluminum could be an aluminum can or aningot or sheet. The endpoint for paper could be pulp or paper rolls or final paper products (e.g.,
Section 2.0 General Scope and Boundary Conditions
2-2
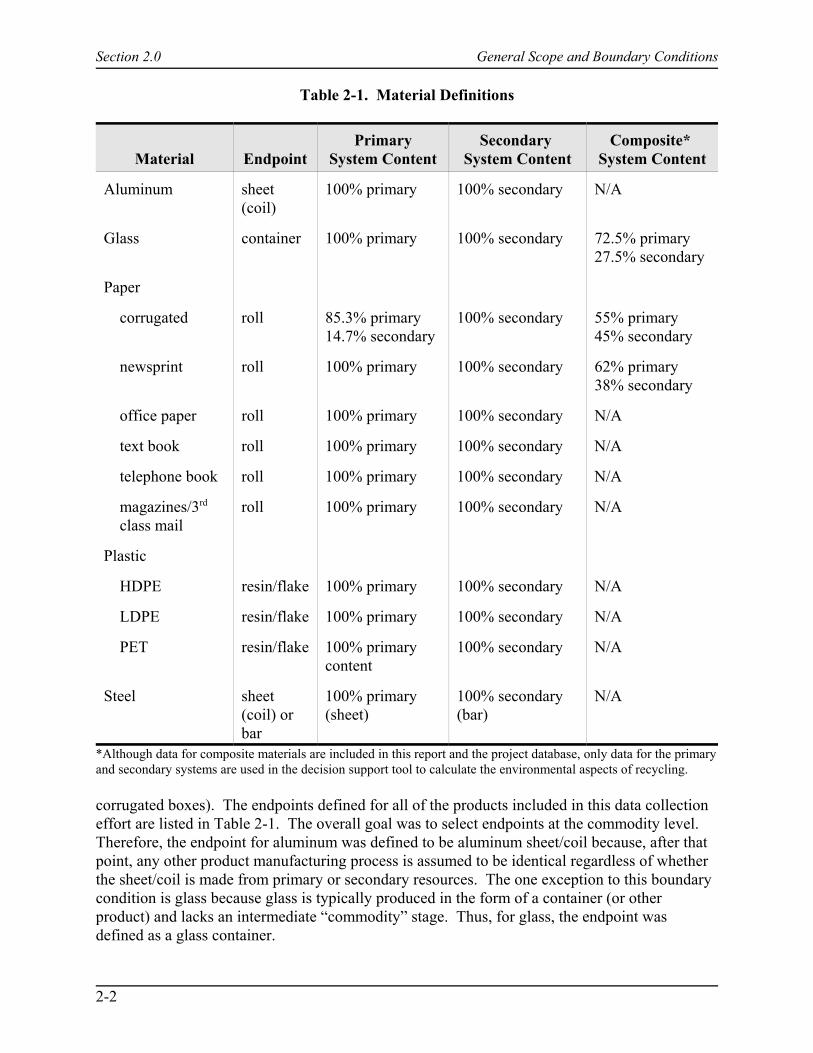
Table 2-1. Material Definitions
Material EndpointPrimary
System ContentSecondary
System ContentComposite*
System Content
Aluminum sheet(coil)
100% primary 100% secondary N/A
Glass container 100% primary 100% secondary 72.5% primary27.5% secondary
Paper
corrugated roll 85.3% primary14.7% secondary
100% secondary 55% primary45% secondary
newsprint roll 100% primary 100% secondary 62% primary38% secondary
office paper roll 100% primary 100% secondary N/A
text book roll 100% primary 100% secondary N/A
telephone book roll 100% primary 100% secondary N/A
magazines/3rd class mail
roll 100% primary 100% secondary N/A
Plastic
HDPE resin/flake 100% primary 100% secondary N/A
LDPE resin/flake 100% primary 100% secondary N/A
PET resin/flake 100% primarycontent
100% secondary N/A
Steel sheet(coil) orbar
100% primary(sheet)
100% secondary(bar)
N/A
*Although data for composite materials are included in this report and the project database, only data for the primaryand secondary systems are used in the decision support tool to calculate the environmental aspects of recycling.
corrugated boxes). The endpoints defined for all of the products included in this data collectioneffort are listed in Table 2-1. The overall goal was to select endpoints at the commodity level. Therefore, the endpoint for aluminum was defined to be aluminum sheet/coil because, after thatpoint, any other product manufacturing process is assumed to be identical regardless of whetherthe sheet/coil is made from primary or secondary resources. The one exception to this boundarycondition is glass because glass is typically produced in the form of a container (or otherproduct) and lacks an intermediate “commodity” stage. Thus, for glass, the endpoint wasdefined as a glass container.
Section 2.0 General Scope and Boundary Conditions
2-3
2.1 General Boundary Conditions
The scope and boundaries for each set of LCI data presented in the specific materials LCIsummaries are partially depicted by the accompanying process flow diagrams. Each processflow diagram for the primary materials production shows the major process steps that occur inacquiring and processing the basic raw materials needed in the life cycle of the material beingmanufactured. For example, the flow diagram for manufacturing aluminum sheet from primarymaterials shows that bauxite ore is mined and is used to make alumina, which in turn is used tomake aluminum. Also, salt is mined to make caustic soda (sodium hydroxide), which is used inthe manufacture of alumina.
Data for each process step shown in the flow diagram are included in the resultspresented in the accompanying tables. The quantities of each raw material and intermediatematerial used to make 1 ton of the material are shown on the material flow diagrams wherepossible. Therefore, the materials flow diagrams show the basic system boundaries and scopefor each option represented by the LCI results in the accompanying table. Transportation stepsare shown by the arrows between each major process step.
As is shown by the process flow diagrams, the systems for which data are presented arenot fully complete "cradle-to-grave" systems. This is because the data presented in this reportare supplemental to data included in other modules of the MSW-DST or that cover convertingsteps (e.g., production of newspapers), which are assumed to be common to both the primary andsecondary material. Only after all of the pieces of LCI data are assembled, can a full LCI foreach material be completed.
For the primary material production systems, the LCI data are “cradle-to-gate.” Thismeans that the data include the steps from raw materials extraction to production of a commoditymaterial. The fabrication of a consumer product, such as aluminum or steel cans, is not included. Also, the use and disposal steps are not included for any of the products. The use step isassumed to be identical regardless of whether the product is made from virgin or recycledmaterials. The disposal step is accounted for in separate modules of the MSW-DST.
For the recycled product systems, both the beginning steps and the ending steps of theLCI are excluded from the LCI data sets. Collection of post-consumer materials andtransportation to the reprocessing facility are not included, nor are the use or disposal steps forany of the materials. Again, this is because the disposal step (including waste collection andsorting at an MRF) and transportation are captured by separate modules of the MSW-DST.
There is one section of the system for each material that is not shown on the process flowdiagrams. This is the section that includes the processes for acquiring energy resources andprocessing these resources into usable fuels (termed “precombustion”). These components of thelife cycle are included in the LCI results presented in each of the LCI tables in the specificmaterial summaries. For example, the use of electricity to convert alumina to aluminum meansthat coal (and other energy resources) must be mined and processed to a usable form. Thisactivity uses energy and creates environmental emissions.

Section 2.0 General Scope and Boundary Conditions
2-4
If marketable coproducts or byproducts are produced in any process step in the system,adjustments have been made in the materials balance and energy requirements and processemissions to reflect only the portion of each process step that is attributable to the material beingconsidered. This is done based on the mass of each coproduct. Coproducts of any process stepare not shown on the process flow diagrams.
2.2 Data Tables
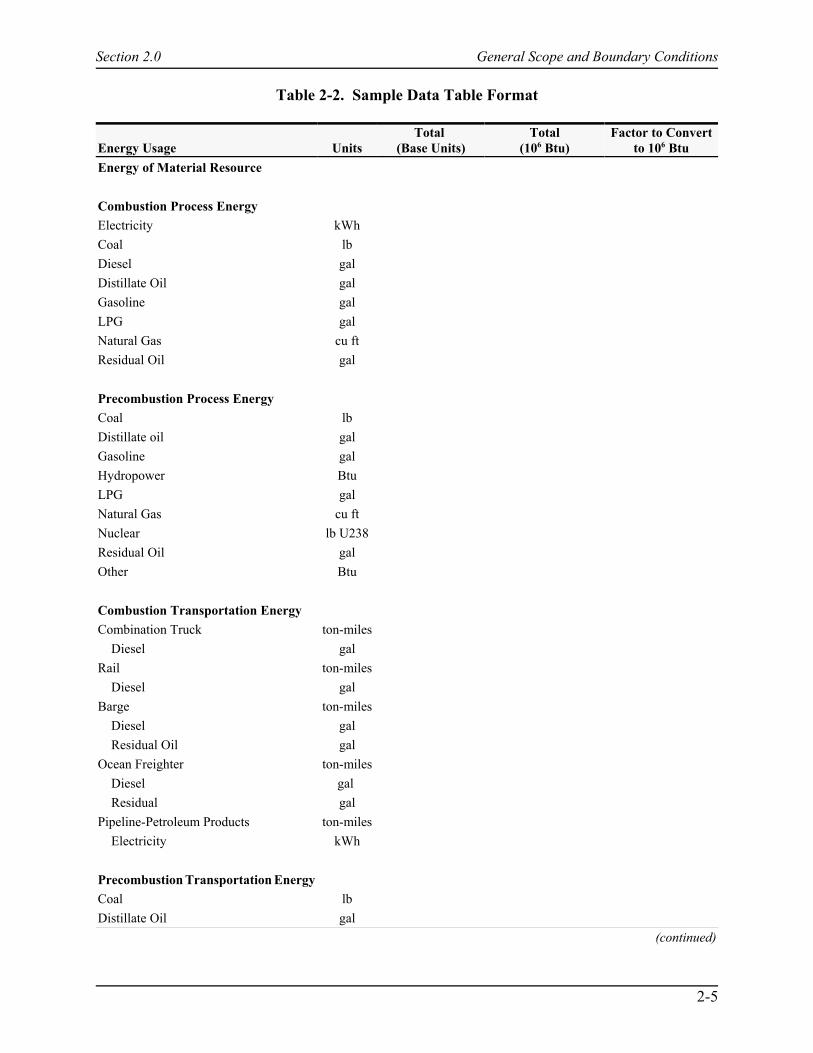
The LCI data for each material are presented in a common table format, as shown inTable 2-2. The sections of the data tables are described in this section. Note that there areexceptions to this format due to the manner in which some of the data were originally aggregatedby the source and specific data reporting requirements specified by the source.
2.2.1 Energy Usage Section
The first column in each data table shows the units of each fuel that are consumed in theaggregated process steps and aggregated transportation steps in the life cycle of the product. Inthe second column, these fuel units are converted to British thermal unit (Btu) values. The thirdcolumn shows the conversion factors used to convert from units of fuel to Btu. These factorsrepresent the higher heating values of the fuels.
For electricity, calculations are made converting delivered kilowatt-hours (kWh) ofelectricity shown in the first column to Btu of fuel used to generate and deliver the electricity inthe second column. These calculations account for the average efficiency of conversion of fuel toelectricity and for transmission losses in power lines. Therefore, the kWh value shown on thetables is the aggregated amount of electricity used by the system, as delivered to themanufacturing facilities. The Btu value shown in the second column accounts for the averagemix of fuels used by utilities to produce electricity in the United States in 1992.
Note: The U.S. average fuel grid for utilities is not used to represent electricity used byseveral of the process steps for aluminum manufacture. Instead, different combinations ofcountry- and region-specific fuels are used. These processes are different from othermanufacturing processes because a large portion of the raw materials is obtained from othercountries and the electricity-intensive process of aluminum uses a dedicated utility or provides abaseload for a specific public utility. The specific fuels used to generate electricity for aluminumprocesses are discussed in more detail in Section 3.
The data tables for each material system report (where available) energy data in thecategories of energy of material resource, combustion process energy, precombustion processenergy, combustion transportation energy, and precombustion transportation energy.
Energy of material resource is the fuel value (higher heating value) of any fossil energyresources (fossil fuel reserves—petroleum, natural gas, and coal) used as raw materials in any ofthe processing steps. For example, petroleum and coal are used to produce coke or pitch, whichare raw materials for the aluminum smelting process. In the case of aluminum, these rawmaterials are consumed in the smelting operation. For other materials, such as plastics, the rawmaterials petroleum and/or natural gas liquids become a part of the final product.
Section 2.0 General Scope and Boundary Conditions
2-5
Table 2-2. Sample Data Table Format
Energy Usage UnitsTotal
(Base Units)Total
(106 Btu)Factor to Convert
to 106 BtuEnergy of Material Resource
Combustion Process EnergyElectricity kWhCoal lbDiesel galDistillate Oil galGasoline galLPG galNatural Gas cu ftResidual Oil gal
Precombustion Process EnergyCoal lbDistillate oil galGasoline galHydropower BtuLPG galNatural Gas cu ftNuclear lb U238Residual Oil galOther Btu
Combustion Transportation EnergyCombination Truck ton-miles Diesel galRail ton-miles Diesel galBarge ton-miles Diesel gal Residual Oil galOcean Freighter ton-miles Diesel gal Residual galPipeline-Petroleum Products ton-miles Electricity kWh
Precombustion Transportation EnergyCoal lbDistillate Oil gal
(continued)
Section 2.0 General Scope and Boundary Conditions
2-6
Table 2-2. (continued)
Energy Usage UnitsTotal
(Base Units)Total
(106 Btu)Factor to Convert
to 106 BtuGasoline galHydropower BtuLPG galNatural Gas cu ftNuclear lb U238Residual Oil galOther Btu
Environmental Emissions Units Total Process Fuel Related
Atmospheric EmissionsAcreolin lbAldehydes lbAmmonia lbAntimony lbArsenic lbBenzene lbBeryllium lbCadmium lbCarbon Monoxide lbCarbon Tetrachloride lbCFC/HCFC lbChlorine lbChromium lbCobalt lbCOS lbDioxins lbFluorine lbFormaldehyde lbFossil Carbon Dioxide lbHydrocarbons lbHydrochloric Acid lbHydrogen Cyanide lbHydrogen Fluoride lbKerosene lbLead lbManganese lb
(continued)

Section 2.0 General Scope and Boundary Conditions
2-7
Table 2-2. (continued)
Environmental Emissions Units Total Process Fuel RelatedMercury lbMetals lbMethane lbMethylene Chloride lbNaphthalene lbNickel lbNitrogen Oxides lbNitrous Oxide lbN-Nitrosodimethylamine lbOther Organics lbPAH lbParticulates lbPerchloroethylene lbPFC lbPhenols lbRadionuclides CiSelenium lbSulfur Oxides lbSulfuric Acid lbTrichloroethylene lbSolid WastesAsh lbEnvironmental Abatement lbMunicipal lbProcess lb
Waterborne WastesAcid lbAmmonia lbAmmonium Ion lbBOD lbBoron lbCadmium lbCalcium lbCalcium Ion lbChloride lbChloride Ion lbChromates lbChromium lb
(continued)
Section 2.0 General Scope and Boundary Conditions
2-8
Table 2-2. (concluded)
Environmental Emissions Units Total Process Fuel RelatedCOD lbCyanide lbDetergent lbDissolved Chlorine lbDissolved Organics lbDissolved Solids lbFluorides lbHydrocarbons lbIron lbLead lbMagnesium Ion lbManganese lbMercury lbMetal Ion lbNickel lbNitrates lbNitrogen lbOil lbOther Organics lbPhenol lbPhosphates lbSulfate Ion lbSulfates lbSulfides lbSulfur lbSulfuric Acid lbSodium lbSodium Ion lbSuspended Solids lbVinyl Chloride Monomer lbZinc lb
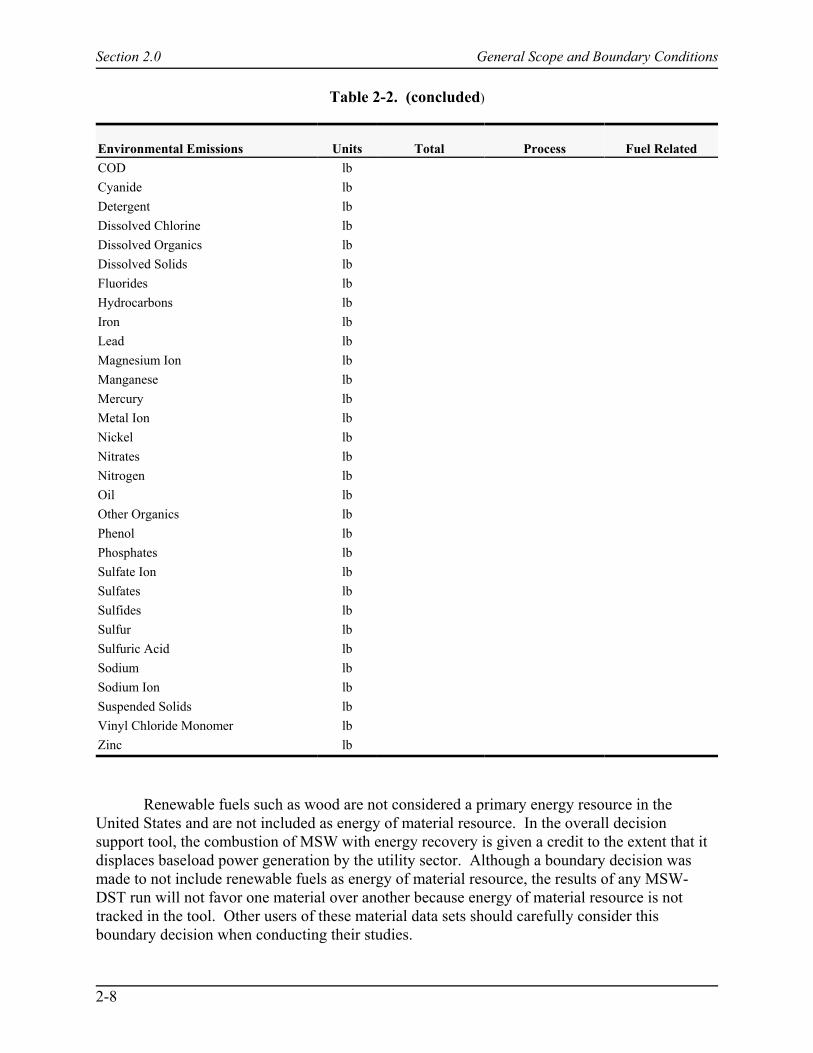
Renewable fuels such as wood are not considered a primary energy resource in theUnited States and are not included as energy of material resource. In the overall decisionsupport tool, the combustion of MSW with energy recovery is given a credit to the extent that itdisplaces baseload power generation by the utility sector. Although a boundary decision wasmade to not include renewable fuels as energy of material resource, the results of any MSW-DST run will not favor one material over another because energy of material resource is nottracked in the tool. Other users of these material data sets should carefully consider thisboundary decision when conducting their studies.
Section 2.0 General Scope and Boundary Conditions
2-9
Combustion process energy is the energy consumed in the various processes used toproduce a material. The energy to extract, transport, and process these fuels into a usable form islabeled precombustion process energy.
Combustion transportation energy describes the energy or fuels needed to transport thematerials and components to the site of the next processing step. Transportation energy iscalculated, where possible, by using the distance of transport (miles), mode of transport (truck,rail, barge, ship), and information included in the transportation process model developed for usein the overall project. The distance and mode of transportation are usually provided by specificcompanies or facilities from which materials are shipped. The transportation database expressesfuel usage per ton-mile of goods transported by specific modes of transportation. The energy toextract, transport, and process the fuels used for transportation is labeled precombustiontransportation energy. All of the transportation steps included in each LCI are presented asaggregated data.
Note: For some paper and plastic materials, transportation was already included in anaggregate form and could not be broken out into separate sections. In these cases, thetransportation energy is included in the energy totals reported in the LCI, and no section forcombustion transportation energy is provided.
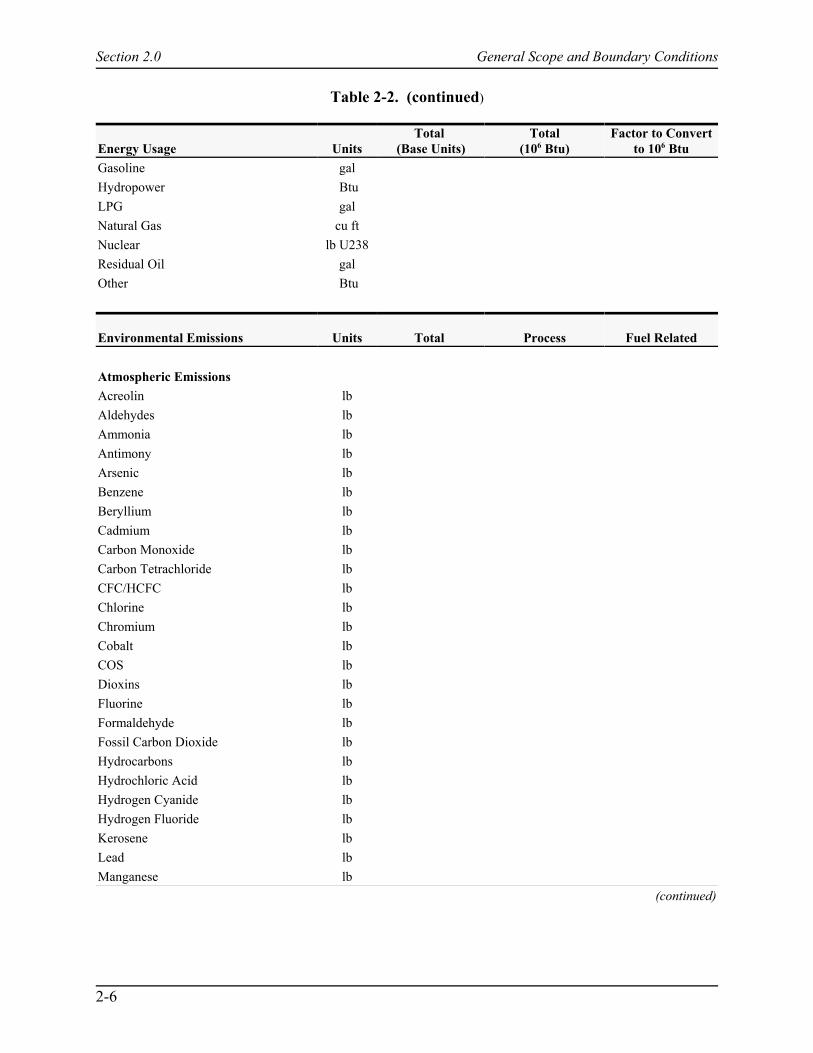
2.2.2 Environmental Emissions Section
Environmental emissions include air pollutants, solid wastes, and waterborne wastes.Environmental emissions are also labeled as process- or fuel-related. Process emissions arethose emitted during a processing step, but not as a result of fuel combustion. For example, thecalcining of limestone to produce lime emits carbon dioxide (CO2). The quantity of CO2 emittedfrom this process would be listed under process air emissions. Fuel-related emissions are thoseemissions that result from the combustion of fuels. For example, the combustion of wood by-products in a paper mill produces a fuel-related solid waste, ash. The emissions reported on thedata tables in the product summaries are the quantities reaching the environment (air, water, andland) after pollution control measures have been taken.
2.2.2.1 Air and Waterborne Releases. Atmospheric emissions include all substancesreleased to the air that are regulated or classified as pollutants. Emissions are reported as poundsof pollutant per ton of final product, as shown in the table headings. Atmospheric emissions alsoinclude CO2 releases, which are calculated from fuel combustion data or process chemistry. CO2emissions are not regulated, but they are reported in this study because of the growing concernabout global warming. CO2 emissions are labeled as being from either fossil or nonfossil fuels.
CO2 released from combustion of fossil carbon sources (coal, natural gas, or petroleum)or released during the reaction of chemicals derived from these materials is classified as fossilcarbon dioxide. CO2 released from mineral sources (e.g., the calcining of limestone to lime), isalso classified as fossil CO2. CO2 from sources other than fossil carbon sources (i.e., frombiomass) is classified as nonfossil carbon dioxide. Nonfossil CO2 includes CO2 released fromthe combustion of plant or animal material or released during the reaction of chemicals derivedfrom these materials. This labeling of the CO2 releases as either fossil or nonfossil is done to aid
Section 2.0 General Scope and Boundary Conditions
2-10
in the interpretation of the LCI data. The source of CO2 releases is an important issue in thecontext of natural carbon cycle and global warming.
As with atmospheric emissions, waterborne wastes include all substances classified aspollutants. Waterborne wastes are reported as pounds of pollutant per ton of product, as shown inthe data table headings. The values reported are the average quantity of pollutants still present inthe wastewater stream after wastewater treatment and represent discharges into receiving waters.
Air or waterborne emissions that are not regulated or reported to regulatory agencies arenot reported in the LCI results presented in the material summaries. Reliable data for any suchemissions would be difficult to obtain except for a site-specific study where additional testingwere authorized. Conversely, some air and waterborne emissions data that are regulated andreported may not have been included in the LCI results. The data used represent the bestavailable from existing sources.
The air and waterborne emissions data reported in the LCI tables are aggregated acrossthe life cycle of the product being studied. They represent a mixture of measured data fromactual manufacturing sites, calculated data from actual manufacturing sites, and estimates basedon regulatory emissions standards. Actual environmental impacts from these aggregatedemissions would be extremely difficult to estimate.
2.2.2.2 Solid Wastes. Process solid wastes include mineral processing wastes (such asred mud from alumina manufacturing), wastewater treatment sludge, solids collected in airpollution control devices, trim or waste materials from manufacturing operations that are notrecycled, and packaging materials from material suppliers. Fuel-related solid wastes are fuelcombustion residues such as the ash generated by burning coal or wood.
2.3 General Boundary Decisions
Some general decisions and assumptions have been made in assembling the LCI resultspresented. These assumptions are discussed below.
2.3.1 Geographic Scope
With the exception of overseas transportation of crude oil, bauxite, and alumina to theU.S., all data are for the U.S.
The acquisition and processing data (precombustion energy and emissions) for fuels usedto generate electricity for bauxite and alumina processing in other countries are the same foreach fuel, as if the fuels were produced in the U.S.
2.3.2 Carbon Sequestration
To account for carbon sequestration by forest systems, the paper data sets incorporate acarbon sequestration credit of 2.2 pounds of CO2 per pound of wood consumed (Kramer andKozlowski, 1979). This credit is estimated by multiplying the pounds of wood consumed in thematerial LCI by the 2.2 pounds of CO2 per pound of wood factor. The resulting value for CO2
Section 2.0 General Scope and Boundary Conditions
2-11
sequestered is netted out of the nonfossil CO2 air emission value in the LCI results. As anexample, if 1000 pounds of wood are consumed to manufacture a paper product, then 2200pounds of CO2 are assumed to be sequestered in the generation of that wood. This amount isincluded as a negative value in the nonfossil CO2 air emission value. The implications of thiscarbon sequestration credit are that any nonfossil CO2 emissions that occur through thecombustion or degradation of wood will offset by the amount of the credit. Because biogenicCO2 has a zero weighting factor in greenhouse gas calculations, this credit does not affectclimate change implications.
Note that the carbon sequestration credit only applies to wood consumed. EPA’s Officeof Solid Waste used a different methodology in a report on greenhouse gas emission from solidwaste management (EPA, 1998). Among other aspects, this methodology tracks carbon storagerelated to changes in forest carbon stocks due to paper recycling. The basic assumption used isthat increases in paper recycling result in a lower demand for wood and thus an increase inmature trees left standing in forests that store carbon. At this time, consensus has not beenreached on how to make the carbon sequestration approaches consistent. Future updates to thepaper LCI data sets will likely include a modification to the carbon sequestration methodology.
2.3.3 Self-Generated Electricity
Where self-generated electricity (electricity generated onsite at a manufacturing facility)is reported, this use of electricity is not shown in the LCI results as kilowatt-hours of electricity.Instead, the fuels used at the facility to produce self-generated electricity are shown. This avoidsrepresenting self-generated electricity with the fuels for the U.S. average grid. Many of theprimary materials production systems use some self-generated electricity. In the case ofaluminum, some companies own dedicated generating plants. In the case of paper products,wood byproducts and other purchased fuels are often used to cogenerate steam and electricityonsite.
2.3.4 Recycling
Because this report presents LCI results for secondary materials production only, a directanalysis of recycling systems cannot be made. The LCI results presented in the data summariesrepresent the partial recycling systems shown in the materials flow diagrams. No data wereincluded for the collection, processing, or transport of any product to be recycled. These data areincluded in separate modules of the MSW-DST and are incorporated into any MSWmanagement strategy using recycling.
There are different ways to model recycling systems within the LCI framework. Twobasic concepts for modeling recycling systems are open-loop recycling and closed-looprecycling. Limited recycling, such as the recycling of a newspaper into a folding carton, whichis not recycled, is referred to as “open-loop” recycling. Repeated recycling, such as therecycling of an aluminum can back into another aluminum can, is called “closed-loop” recycling. Theoretically, closed-loop recycling can occur an infinite number of times because the aluminumdoes not degrade with repeated recycling steps. The type of recycling model that is appropriatefor a material depends not only on infrastructure for collecting and transporting post-consumermaterials, but also on the physical properties of the material being recycled.

Section 2.0 General Scope and Boundary Conditions
2-12
In an open-loop system, the energy requirements, environmental emissions, and rawmaterials for primary material acquisition/processing and disposal are generally allocated equallyamong the products produced; i.e, the primary raw material energy requirements for the initialproduct are divided by the total number of product sets produced. For folding boxes made fromold newspaper, half the raw material energy, emissions, and materials are allocated to theprimary material and half to the secondary material. Likewise, half of the energy, emissions, andmaterials for reprocessing are allocated to the primary material and half to the secondarymaterial. This, in effect, links the primary and secondary material production systems and showsthe overall LCI results for the combined system.
In a closed-loop system, recycling of the same material occurs over and over,theoretically permanently diverting it from disposal. At the ideal 100 percent recycling rate, theenergy requirements and environmental emissions for primary raw material acquisition andprocessing become negligible. Then, only the data for collecting post-consumer material andreprocessing it into a secondary material is considered.
A closed-loop recycling system is assumed for all materials included in the overallproject.
2.4 Components Not Included
There are a number of items that have been excluded from the LCIs because they are typically found to be negligible in terms of the LCI totals. These items are described below.
2.4.1 Capital Equipment
The energy associated with the manufacture of capital equipment is not included in theenergy profiles. This includes equipment to manufacture buildings, motor vehicles, andindustrial machinery. The energy associated with such capital equipment generally, for a ton ofmaterials, becomes negligible when averaged over the millions of tons of product that the capitalequipment manufactures.
2.4.2 Space Conditioning
The fuels and power consumed to heat, cool, and light manufacturing establishments areomitted from the calculations. For most industries, space conditioning energy is quite lowcompared to process energy. Energy consumed for space conditioning is usually less than 1percent of the total energy consumption for the manufacturing process.
2.4.3 Support Personnel Requirements
The energy associated with research and development, sales, and administrativepersonnel or related activities have not been included in this analysis.

Section 2.0 General Scope and Boundary Conditions
2-13
2.4.4 Miscellaneous Materials and Additives
For each system evaluated, there are small amounts of miscellaneous materials associatedwith the manufacturing processes that are not included in the LCI results. Generally thesematerials make up less than 1 percent of the mass of raw materials for the system. For example,the use of biocides and other conditioning chemicals for cooling water are not documented andincluded in the LCI results except to the extent that these materials contribute to waterborneemissions from the facilities.
2.5 Data Sources and Quality
Data sources are identified and a data quality assessment performed to the extent possiblein each of the specific material LCI profiles. The data presented are from a variety of sources, assummarized in Table 2-3. Much of these data have been independently reviewed and verifiedfor other LCI projects as well as this project. Based on the project team’s evaluation of dataquality for each of these sources, a qualitative data quality rating is provided (see Table 2-3). The details of the data quality evaluation are provided in each of the materials chapters. Theindividual data quality indicators used in the evaluation are described in the following sections.
2.5.1 Geographic Coverage
Geographic coverage refers to the geographical area from which data for the unitprocesses or system under study were collected. For example, the plastics data may have beencollected to represent average plastics manufacturing in Europe.
2.5.2 Time-Related Coverage
Time-related coverage provides an indicator of the age of the data and the period overwhich data were collected.
2.5.3 Technological Coverage
Technological coverage is an indicator of the practices and technologies represented bythe data collected. For example, data may be collected to represent an average mix NorthAmerican technology for steel production.
2.5.4 Precision
Precision is a measure of variability of individual data values from the mean of the dataset. In studies that measure precision for each data category within each unit process, the meanand the standard deviation of the reported values are calculated. The precision measure providesan understanding of the variability of unit process performance.
2.5.5 Completeness
Completeness is the measure of primary data values used in the analysis divided by thenumber of possible data points for each data category within the sample domain. For example, if
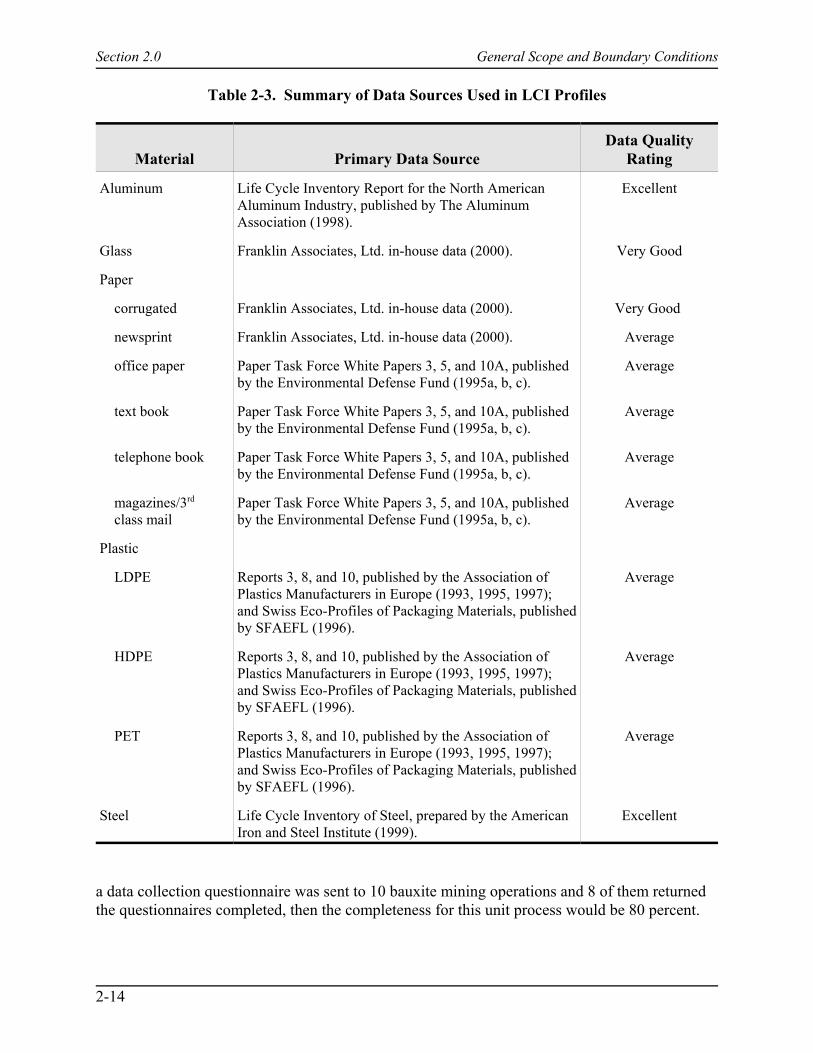
Section 2.0 General Scope and Boundary Conditions
2-14
Table 2-3. Summary of Data Sources Used in LCI Profiles
Material Primary Data SourceData Quality
Rating
Aluminum Life Cycle Inventory Report for the North AmericanAluminum Industry, published by The AluminumAssociation (1998).
Excellent
Glass Franklin Associates, Ltd. in-house data (2000). Very Good
Paper
corrugated Franklin Associates, Ltd. in-house data (2000). Very Good
newsprint Franklin Associates, Ltd. in-house data (2000). Average
office paper Paper Task Force White Papers 3, 5, and 10A, publishedby the Environmental Defense Fund (1995a, b, c).
Average
text book Paper Task Force White Papers 3, 5, and 10A, publishedby the Environmental Defense Fund (1995a, b, c).
Average
telephone book Paper Task Force White Papers 3, 5, and 10A, publishedby the Environmental Defense Fund (1995a, b, c).
Average
magazines/3rd class mail
Paper Task Force White Papers 3, 5, and 10A, publishedby the Environmental Defense Fund (1995a, b, c).
Average
Plastic
LDPE Reports 3, 8, and 10, published by the Association ofPlastics Manufacturers in Europe (1993, 1995, 1997);and Swiss Eco-Profiles of Packaging Materials, publishedby SFAEFL (1996).
Average
HDPE Reports 3, 8, and 10, published by the Association ofPlastics Manufacturers in Europe (1993, 1995, 1997);and Swiss Eco-Profiles of Packaging Materials, publishedby SFAEFL (1996).
Average
PET Reports 3, 8, and 10, published by the Association ofPlastics Manufacturers in Europe (1993, 1995, 1997);and Swiss Eco-Profiles of Packaging Materials, publishedby SFAEFL (1996).
Average
Steel Life Cycle Inventory of Steel, prepared by the AmericanIron and Steel Institute (1999).
Excellent
a data collection questionnaire was sent to 10 bauxite mining operations and 8 of them returnedthe questionnaires completed, then the completeness for this unit process would be 80 percent.

Section 2.0 General Scope and Boundary Conditions
2-15
2.5.6 Consistency
Consistency is a qualitative understanding of how uniformly the study methodology isapplied to the various components of the study. The consistency measure is one of the mostimportant in the LCI data development process. To ensure consistency, it is crucial to have aclear communication and understanding of what data is needed, how it is measured, how it isreported, and how it is to be used.
2.5.7 Representativeness
Representativeness is an indicator measures the degree to which the data values used inthe analysis present a true and accurate measurement of the average processes that the study isexamining. The degree of representativeness is normally judged by the comparison of valuesdetermined in the study with existing reported values in other analyses or published data sourcesdealing with the subject matter. Any major variances identified should be examined andexplained.
2.5.8 Reproducibility
Reproducibility is an indicator of whether or not sufficient information, bothmethodological and data values, exist to permit someone to independently carry out thecalculations and reproduce the results reported in the study.
2.5.9 Uncertainty/Limitations
Uncertainty and limitations is a qualitative indicator that was included to capture any dataquality aspects that were not addressed by the other data quality indicators.
2.6 References
Aluminum Association, Inc. 1998. Life Cycle Inventory Report for the North AmericanAluminum Industry. Prepared by Roy F. Weston, Inc. Boston, MA. November.
American Iron and Steel Institute (AISI). 1999. Life Cycle Inventory of Steel. Developed forResearch Triangle Institute, Research Triangle Park, NC.
Association of Plastics Manufacturers of Europe (APME). 1993. I. Boustead, Eco-profiles ofthe European Plastics Industry; Report 3: Polyethylene and Polypropylene. Associationof Plastic Manufacturers in Europe. Brussels, Belgium.
Association of Plastics Manufacturers of Europe (APME). 1995. I. Boustead, Eco-profiles ofthe European plastics industry; Report 8: Polyethylene Terephthalate (PET). Brussels,Belgium.
Association of Plastics Manufacturers of Europe (APME). 1997. I. Boustead, Eco-profiles ofthe European Plastics Industry, Report 10: Polymer Conversion. Brussels, Belgium.

Section 2.0 General Scope and Boundary Conditions
2-16
Barlaz, Morton and Keith Weitz. 1996. Life Cycle Management of Municipal Solid Waste:System Description. Research Triangle Institute, Research Triangle Park, NC 27709.
Environmental Defense Fund (EDF). 1995a. White Paper No. 3, Environmental Comparison -Manufacturing Technologies for Virgin and Recycled-content Printing and WritingPaper. New York, NY.
Environmental Defense Fund (EDF). 1995b. White Paper No. 5, Environmental Comparison ofBleached Kraft Pulp Manufacturing Technologies. New York, NY.
Environmental Defense Fund (EDF). 1995c. White Paper No. 10A, Environmental Comparison- Manufacturing Technologies for Virgin and Recycled-content Printing and WritingPaper. New York, NY. December 1995.
Franklin Associates, Ltd. 2000. A Life Cycle Inventory of Linerboard & Medium Rolls,Newsprint Rolls, Aluminum Sheet, and Glass Containers. Prepared for Research TriangleInstitute, Research Triangle Park, NC. January.
Kramer, P.J. and T.T. Kozlowski. 1979. Physiology of Woody Plants. Orlando, FL: AcademicPress.
Swiss Federal Agency for the Environment, Forests and Landscape (SFAEFL). 1996. LifeCycle Inventories for Packaging. Environmental Series No. 250/11, Waste. SwissAgency for the Environment, Forests and Landscape. Bern, Switzerland.
U.S. Environmental Protection Agency (EPA). 1998. Greenhouse Gas Emissions FromManagement of Selected Materials in Municipal Solid Waste. EPA-530-R-98-013. Office of Solid Waste and Emergency Response, Washington, DC. September.
Section 3.0 Summary LCI of Aluminum Sheet/Coil
3-1
3.0 Summary LCI of Aluminum Sheet/Coil3.1 Introduction
This chapter contains “cradle-to-gate” LCI data for the production of primary andsecondary aluminum sheet/coil. Process flow diagrams for primary and secondary aluminumsheet/coil are presented, as well as process descriptions for the production of aluminumsheet/coil. Also included are the LCI data tables for producing 1 ton of primary and secondaryaluminum sheet/coil. These data are a mixture of data obtained from the aluminum industry(The Aluminum Association, 1998) and data collected by Franklin Associates. Data sources arelisted at the end of the chapter in Section 3.3.
3.2 Aluminum Sheet/Coil Production
The following sections describe the steps for the production of primary aluminum fromraw materials extracted from the earth and the production of secondary aluminum from recycledaluminum containers. The process of producing molten aluminum from recycled containers ismuch simpler than the process of producing it from primary raw materials.
The following steps in the production of aluminum sheet/coil are discussed in thissection:
# Limestone mining# Lime production# Salt mining# Caustic soda and chlorine production# Bauxite mining# Alumina production# Crude oil production# Petroleum coke production# Coal mining# Metallurgical coke production# Anode production# Aluminum smelting# Ingot casting# Hot/cold rolling# Aluminum can recovery and processing# Used container melting and ingot casting.

Section 3.0 Summary LCI of Aluminum Sheet/Coil
3-2
Figure 3-1 shows the flow diagram for producing 1 ton of primary aluminum sheet/coil. The flow diagram for producing 1 ton of 100 percent secondary aluminum sheet/coil is presentedin Figure 3-2. The energy and emissions data for producing 1 ton of primary aluminumsheet/coil are shown in Table 3-1. Table 3-2 presents equivalent data for producing 100 percent secondary aluminum sheet/coil. Although for calculation purposes the secondary module used inthis study is for 100 percent recycled aluminum, the recycling percentage when post-consumeraluminum is used is generally less because the variety of alloys found in recovered aluminumprohibits 100 percent recycling.
3.2.1 Limestone Mining
Limestone is quarried primarily from open pits. In the central and eastern U.S.,underground mining is becoming more common (U.S. Bureau of Mines, 1993). The energy data(and fuel-related pollutants) used in this analysis represent a combination of open pit andunderground mining (split unknown). The process emissions data are based solely on open pittechniques. The most economical method of recovering the limestone has been through drilling,blasting, mechanical crushing, conveying, and screening (U.S. Bureau of Mines, 1993 and 1984). Airborne particulates are generated in the form of limestone dust throughout many of theoperations. A conceptual flow diagram for open pit mining is shown in Figure 3-3.
3.2.2 Lime Production
Lime is never found in a natural state but is manufactured by calcining (burning)high-purity calcitic or dolomitic limestone at high temperatures. The calcination process drivesoff the CO2, forming calcium oxide (quicklime). The subsequent addition of water createscalcium hydroxide (hydrated or slaked lime). The term lime is a general term that includes thevarious chemical and physical forms of quicklime and hydrated lime. Most of the lime producedin the United States in 1994 was quicklime (85 percent), with hydrated lime (13 percent) anddead-burned dolomite (2 percent) accounting for the rest. The data in this section are for theproduction of quicklime (EPA, 1994; USGS, 1995).
Solid wastes generated during the manufacture of lime include impurities removed fromthe limestone, tailings collected in the lime production process, and lime kiln dust collected fromparticulate control devices on the lime kilns. Based on lengthy discussions with a representativeof the National Lime Association and a confidential lime industry expert, it was assumed that allcollected lime dust and tailings from lime production are sold for various useful purposes,injected back into mines, replaced in quarries, or land-applied onsite (personal communication,Franklin Associates, with Eric Malias, National Lime Association, January 1998, andconfidential industry sources, January 1998). This may not be true of a few smaller companiesthat are not close to their source of limestone. The solid waste numbers reported in the data tableare an estimate from a representative of the lime industry and include packaging and otherindustrial wastes that may be disposed of in a municipal landfill (personal communication,Franklin Associates and confidential industry sources, January 1998).

3-3
Section 3.0Sum
mary LC
I of Aluminum
Sheet/Coil
Figure 3-1.Flow diagram for manufacturing 1 ton of primary aluminum sheet/coil. Flow diagram does notinclude alloys, lacquers, etc. Arrows indicate conveyance to the next process, including possible transportation.
The numbers on the arrows represent pounds of material. Datasets from the Aluminum Association report(1998) are designated by the table number from that report.
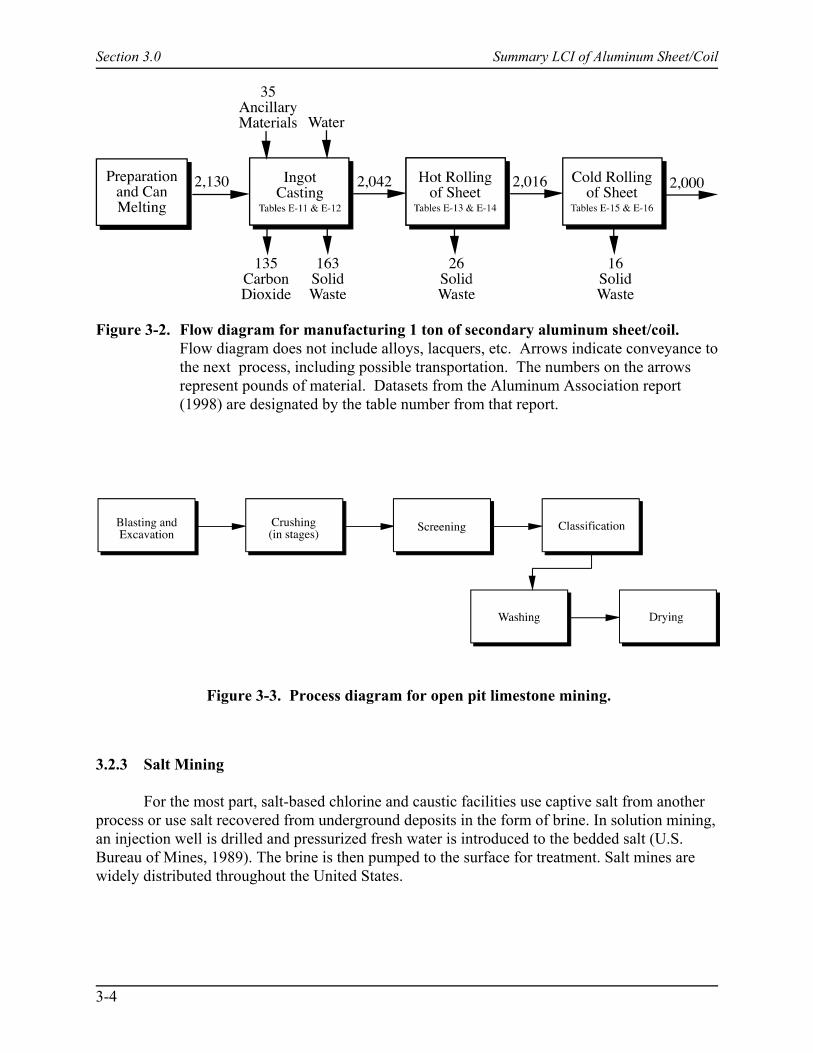
Section 3.0 Summary LCI of Aluminum Sheet/Coil
3-4
Figure 3-2. Flow diagram for manufacturing 1 ton of secondary aluminum sheet/coil. Flow diagram does not include alloys, lacquers, etc. Arrows indicate conveyance tothe next process, including possible transportation. The numbers on the arrowsrepresent pounds of material. Datasets from the Aluminum Association report(1998) are designated by the table number from that report.
Figure 3-3. Process diagram for open pit limestone mining.
3.2.3 Salt Mining
For the most part, salt-based chlorine and caustic facilities use captive salt from anotherprocess or use salt recovered from underground deposits in the form of brine. In solution mining,an injection well is drilled and pressurized fresh water is introduced to the bedded salt (U.S.Bureau of Mines, 1989). The brine is then pumped to the surface for treatment. Salt mines arewidely distributed throughout the United States.
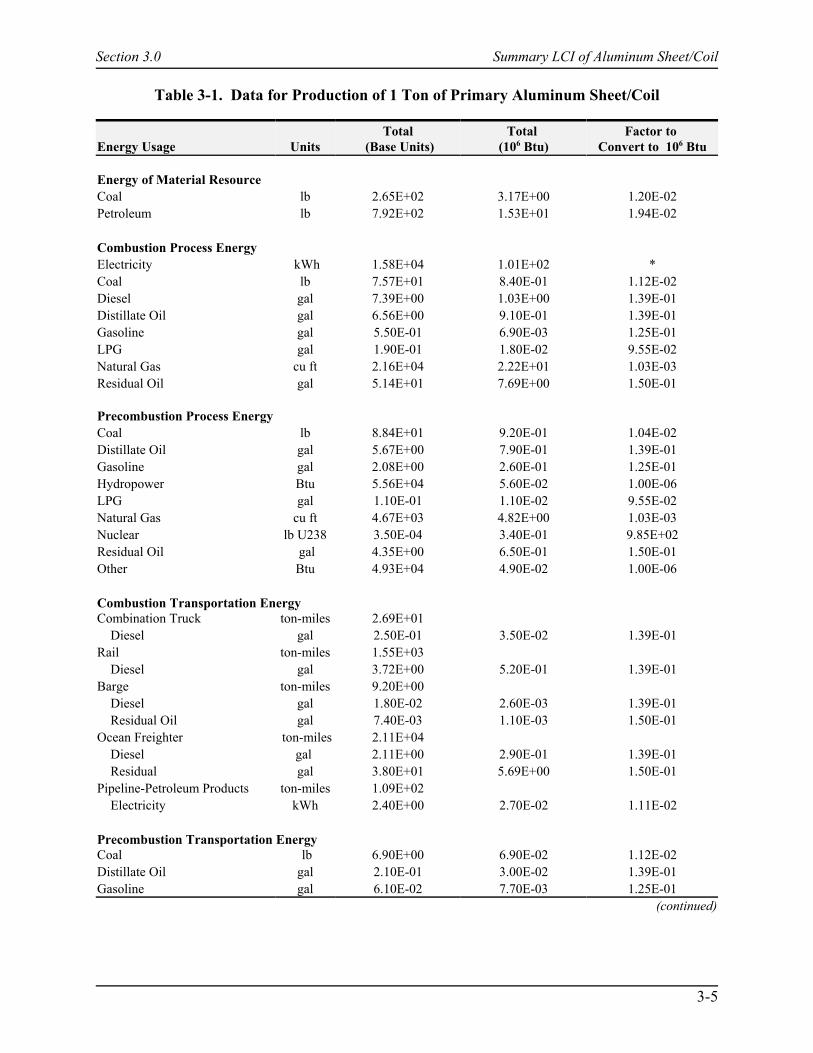
Section 3.0 Summary LCI of Aluminum Sheet/Coil
3-5
Table 3-1. Data for Production of 1 Ton of Primary Aluminum Sheet/Coil
Energy Usage UnitsTotal
(Base Units)Total
(106 Btu)Factor to
Convert to 106 Btu
Energy of Material ResourceCoal lb 2.65E+02 3.17E+00 1.20E-02Petroleum lb 7.92E+02 1.53E+01 1.94E-02
Combustion Process EnergyElectricity kWh 1.58E+04 1.01E+02 *Coal lb 7.57E+01 8.40E-01 1.12E-02Diesel gal 7.39E+00 1.03E+00 1.39E-01Distillate Oil gal 6.56E+00 9.10E-01 1.39E-01Gasoline gal 5.50E-01 6.90E-03 1.25E-01LPG gal 1.90E-01 1.80E-02 9.55E-02Natural Gas cu ft 2.16E+04 2.22E+01 1.03E-03Residual Oil gal 5.14E+01 7.69E+00 1.50E-01
Precombustion Process EnergyCoal lb 8.84E+01 9.20E-01 1.04E-02Distillate Oil gal 5.67E+00 7.90E-01 1.39E-01Gasoline gal 2.08E+00 2.60E-01 1.25E-01Hydropower Btu 5.56E+04 5.60E-02 1.00E-06LPG gal 1.10E-01 1.10E-02 9.55E-02Natural Gas cu ft 4.67E+03 4.82E+00 1.03E-03Nuclear lb U238 3.50E-04 3.40E-01 9.85E+02Residual Oil gal 4.35E+00 6.50E-01 1.50E-01Other Btu 4.93E+04 4.90E-02 1.00E-06
Combustion Transportation EnergyCombination Truck ton-miles 2.69E+01 Diesel gal 2.50E-01 3.50E-02 1.39E-01Rail ton-miles 1.55E+03 Diesel gal 3.72E+00 5.20E-01 1.39E-01Barge ton-miles 9.20E+00 Diesel gal 1.80E-02 2.60E-03 1.39E-01 Residual Oil gal 7.40E-03 1.10E-03 1.50E-01Ocean Freighter ton-miles 2.11E+04 Diesel gal 2.11E+00 2.90E-01 1.39E-01 Residual gal 3.80E+01 5.69E+00 1.50E-01Pipeline-Petroleum Products ton-miles 1.09E+02 Electricity kWh 2.40E+00 2.70E-02 1.11E-02
Precombustion Transportation EnergyCoal lb 6.90E+00 6.90E-02 1.12E-02Distillate Oil gal 2.10E-01 3.00E-02 1.39E-01Gasoline gal 6.10E-02 7.70E-03 1.25E-01
(continued)

Table 3-1. (continued)
Section 3.0 Summary LCI of Aluminum Sheet/Coil
3-6
Energy Usage UnitsTotal
(Base Units)Total
(106 Btu)Factor to
Convert to 106 Btu
Hydropower Btu 4.00E+03 4.00E-03 1.00E-06LPG gal 6.20E-02 5.90E-03 9.55E-02Natural Gas cu ft 4.81E+02 5.00E-01 1.03E-03Nuclear lb U238 2.50E-05 2.60E-02 1.03E+03Residual Oil gal 1.88E+00 2.80E-01 1.50E-01Other Btu 3.55E+03 3.60E-03 1.00E-06
Environmental Releases Units Total Process Fuel Related
Atmospheric EmissionsAcreolin lb 1.80E-04 1.80E-04Aldehydes lb 4.30E-01 4.00E-02 3.90E-01Ammonia lb 7.80E-02 2.10E-02 5.70E-02Antimony lb 2.20E-04 2.20E-04Arsenic lb 7.20E-04 7.20E-04Benzene lb 1.90E-04 1.90E-04Beryllium lb 7.10E-05 7.10E-05Cadmium lb 5.40E-04 5.40E-04Carbon Dioxide-fossil lb 2.27E+04 3.76E+03 1.89E+04Carbon Monoxide lb 1.59E+02 1.42E+02 1.71E+01Carbon Tetrachloride lb 2.40E-04 2.40E-04CFC/HCFC lb 2.50E-01 2.50E-01Chlorine lb 9.46E-01 3.60E-02 9.10E-01Chromium lb 9.70E-04 9.70E-04Cobalt lb 6.00E-04 6.00E-04COS lb 2.33E+00 2.33E+00Dioxins lb 9.70E-10 9.70E-10Fluorine lb 3.90E-02 3.90E-02Formaldehyde lb 8.00E-04 8.00E-04Hydrocarbons lb 3.55E+01 8.65E+00 2.68E+01Hydrochloric Acid lb 4.80E+00 1.10E-01 4.69E+00Hydrogen Cyanide lb 7.70E-02 7.70E-02Hydrogen Fluoride lb 1.45E+00 1.32E+00 1.30E-01Kerosene lb 2.60E-03 2.60E-03Lead lb 4.20E-04 4.20E-04 1.1.0E-03Manganese lb 1.60E-03 1.60E-03Mercury lb 5.70E-04 1.60E-04 4.10E-04Metals lb 6.12E-01 6.10E-01 1.90E-03Methane lb 3.91E+01 1.23E+00 3.79E+01Methylene Chloride lb 7.40E-04 7.40E-04Naphthalene lb 1.20E-05 1.20E-05Nickel lb 7.90E-03 7.90E-03Nitrogen Oxides lb 1.02E+02 3.27E+01 6.94E+01Nitrous Oxide lb 1.04E-01 4.40E-03 1.00E-01N-Nitrosodimethylamine lb 3.80E-05 3.80E-05Other Organics lb 1.16E+00 7.20E-01 4.40E-01
(continued)
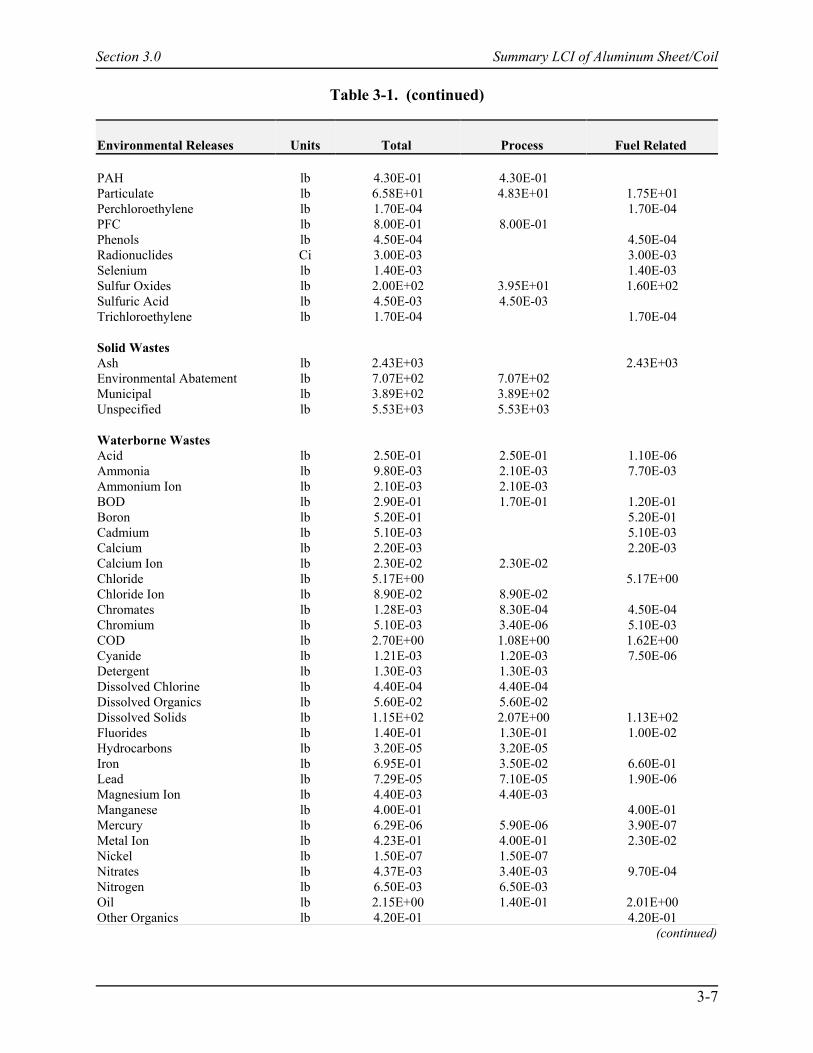
Table 3-1. (continued)
Section 3.0 Summary LCI of Aluminum Sheet/Coil
3-7
Environmental Releases Units Total Process Fuel Related
PAH lb 4.30E-01 4.30E-01Particulate lb 6.58E+01 4.83E+01 1.75E+01Perchloroethylene lb 1.70E-04 1.70E-04PFC lb 8.00E-01 8.00E-01Phenols lb 4.50E-04 4.50E-04Radionuclides Ci 3.00E-03 3.00E-03Selenium lb 1.40E-03 1.40E-03Sulfur Oxides lb 2.00E+02 3.95E+01 1.60E+02Sulfuric Acid lb 4.50E-03 4.50E-03Trichloroethylene lb 1.70E-04 1.70E-04
Solid WastesAsh lb 2.43E+03 2.43E+03Environmental Abatement lb 7.07E+02 7.07E+02Municipal lb 3.89E+02 3.89E+02Unspecified lb 5.53E+03 5.53E+03
Waterborne WastesAcid lb 2.50E-01 2.50E-01 1.10E-06Ammonia lb 9.80E-03 2.10E-03 7.70E-03Ammonium Ion lb 2.10E-03 2.10E-03BOD lb 2.90E-01 1.70E-01 1.20E-01Boron lb 5.20E-01 5.20E-01Cadmium lb 5.10E-03 5.10E-03Calcium lb 2.20E-03 2.20E-03Calcium Ion lb 2.30E-02 2.30E-02Chloride lb 5.17E+00 5.17E+00Chloride Ion lb 8.90E-02 8.90E-02Chromates lb 1.28E-03 8.30E-04 4.50E-04Chromium lb 5.10E-03 3.40E-06 5.10E-03COD lb 2.70E+00 1.08E+00 1.62E+00Cyanide lb 1.21E-03 1.20E-03 7.50E-06Detergent lb 1.30E-03 1.30E-03Dissolved Chlorine lb 4.40E-04 4.40E-04Dissolved Organics lb 5.60E-02 5.60E-02Dissolved Solids lb 1.15E+02 2.07E+00 1.13E+02Fluorides lb 1.40E-01 1.30E-01 1.00E-02Hydrocarbons lb 3.20E-05 3.20E-05Iron lb 6.95E-01 3.50E-02 6.60E-01Lead lb 7.29E-05 7.10E-05 1.90E-06Magnesium Ion lb 4.40E-03 4.40E-03Manganese lb 4.00E-01 4.00E-01Mercury lb 6.29E-06 5.90E-06 3.90E-07Metal Ion lb 4.23E-01 4.00E-01 2.30E-02Nickel lb 1.50E-07 1.50E-07Nitrates lb 4.37E-03 3.40E-03 9.70E-04Nitrogen lb 6.50E-03 6.50E-03Oil lb 2.15E+00 1.40E-01 2.01E+00Other Organics lb 4.20E-01 4.20E-01
(continued)
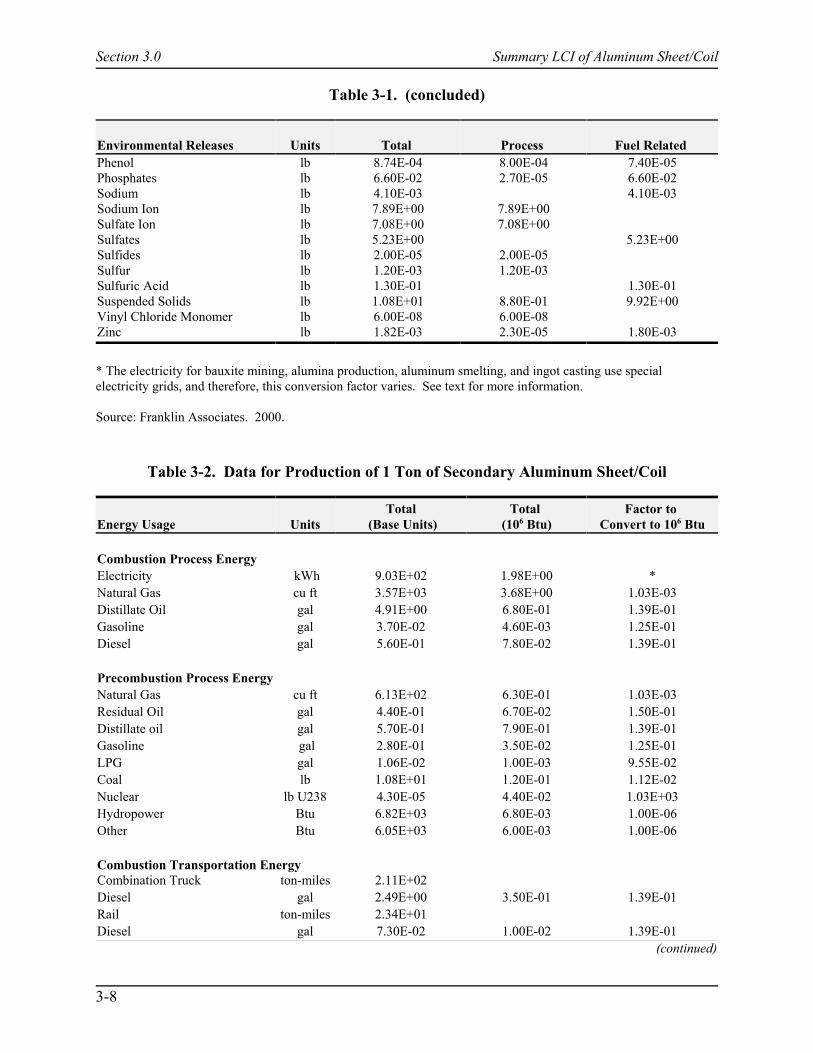
Table 3-1. (concluded)
Section 3.0 Summary LCI of Aluminum Sheet/Coil
3-8
Environmental Releases Units Total Process Fuel Related Phenol lb 8.74E-04 8.00E-04 7.40E-05Phosphates lb 6.60E-02 2.70E-05 6.60E-02Sodium lb 4.10E-03 4.10E-03Sodium Ion lb 7.89E+00 7.89E+00Sulfate Ion lb 7.08E+00 7.08E+00Sulfates lb 5.23E+00 5.23E+00Sulfides lb 2.00E-05 2.00E-05Sulfur lb 1.20E-03 1.20E-03Sulfuric Acid lb 1.30E-01 1.30E-01Suspended Solids lb 1.08E+01 8.80E-01 9.92E+00Vinyl Chloride Monomer lb 6.00E-08 6.00E-08Zinc lb 1.82E-03 2.30E-05 1.80E-03
* The electricity for bauxite mining, alumina production, aluminum smelting, and ingot casting use specialelectricity grids, and therefore, this conversion factor varies. See text for more information.
Source: Franklin Associates. 2000.
Table 3-2. Data for Production of 1 Ton of Secondary Aluminum Sheet/Coil
Energy Usage UnitsTotal
(Base Units)Total
(106 Btu)Factor to
Convert to 106 Btu
Combustion Process EnergyElectricity kWh 9.03E+02 1.98E+00 *Natural Gas cu ft 3.57E+03 3.68E+00 1.03E-03Distillate Oil gal 4.91E+00 6.80E-01 1.39E-01Gasoline gal 3.70E-02 4.60E-03 1.25E-01Diesel gal 5.60E-01 7.80E-02 1.39E-01
Precombustion Process EnergyNatural Gas cu ft 6.13E+02 6.30E-01 1.03E-03Residual Oil gal 4.40E-01 6.70E-02 1.50E-01Distillate oil gal 5.70E-01 7.90E-01 1.39E-01Gasoline gal 2.80E-01 3.50E-02 1.25E-01LPG gal 1.06E-02 1.00E-03 9.55E-02Coal lb 1.08E+01 1.20E-01 1.12E-02Nuclear lb U238 4.30E-05 4.40E-02 1.03E+03Hydropower Btu 6.82E+03 6.80E-03 1.00E-06Other Btu 6.05E+03 6.00E-03 1.00E-06
Combustion Transportation EnergyCombination Truck ton-miles 2.11E+02Diesel gal 2.49E+00 3.50E-01 1.39E-01Rail ton-miles 2.34E+01Diesel gal 7.30E-02 1.00E-02 1.39E-01
(continued)

Table 3-2. (continued)
Section 3.0 Summary LCI of Aluminum Sheet/Coil
3-9
Energy Usage UnitsTotal
(Base Units)Total
(106 Btu)Factor to
Convert to 106 Btu
Precombustion Transportation EnergyNatural Gas cu ft 2.06E+01 2.10E-02 1.03E-03Residual Oil gal 8.10E-02 1.20E-02 1.50E-01Distillate Oil gal 9.10E-03 1.30E-03 1.39E-01Gasoline gal 2.60E-03 3.30E-04 1.25E-01LPG gal 2.60E-03 2.50E-04 9.55E-02Coal lb 2.60E-01 2.90E-03 1.12E-02Nuclear lb U238 1.10E-06 1.10E-03 1.03E+03Hydropower Btu 1.70E+02 1.70E-04 1.00E-03Other Btu 1.50E+02 1.50E-04 1.00E-03
Environmental Releases Units Total Process Fuel Related
Atmospheric EmissionsAcreolin lb 1.70E-05 1.70E-05Aldehydes lb 9.10E-03 9.10E-03Ammonia lb 7.50E-03 7.50E-03Antimony lb 8.00E-06 8.00E-06Arsenic lb 4.00E-05 4.00E-05Benzene lb 1.60E-05 1.60E-05Beryllium lb 5.40E-06 5.40E-06Cadmium lb 9.90E-06 9.90E-06Carbon Dioxide-fossil lb 2.13E+03 1.82E+02 1.94E+03Carbon Monoxide lb 5.05E+01 4.81E+01 2.42E+00Carbon Tetrachloride lb 2.90E-05 2.90E-05CFC/HCFC lb 7.80E-08 7.80E-08Chlorine lb 1.30E-01 1.30E-01 1.80E-05Chromium lb 7.00E-05 7.00E-05Cobalt lb 2.50E-05 2.50E-05Dioxins lb 9.60E-11 9.60E-11Formaldehyde lb 8.50E-05 8.50E-05Hydrocarbons lb 4.53E+00 1.19E+00 3.34E+00Hydrochloric Acid lb 4.38E-01 3.50E-01 8.80E-02Hydrofluoric Acid lb 1.20E-02 1.20E-02Hydrogen Cyanide lb 1.50E-05 1.50E-05Hydrogen Fluoride lb 2.20E-02 2.20E-02Kerosene lb 4.00E-04 4.00E-04Lead lb 8.71E-04 8.10E-04 6.10E-05Manganese lb 1.30E-04 1.30E-04Mercury lb 3.40E-05 3.40E-05Metals lb 6.00E-01 6.00E-01 2.30E-04Methane lb 4.20E+00 4.20E+00Methylene Chloride lb 7.60E-05 7.60E-05Naphthalene lb 1.40E-06 1.40E-06
(continued)
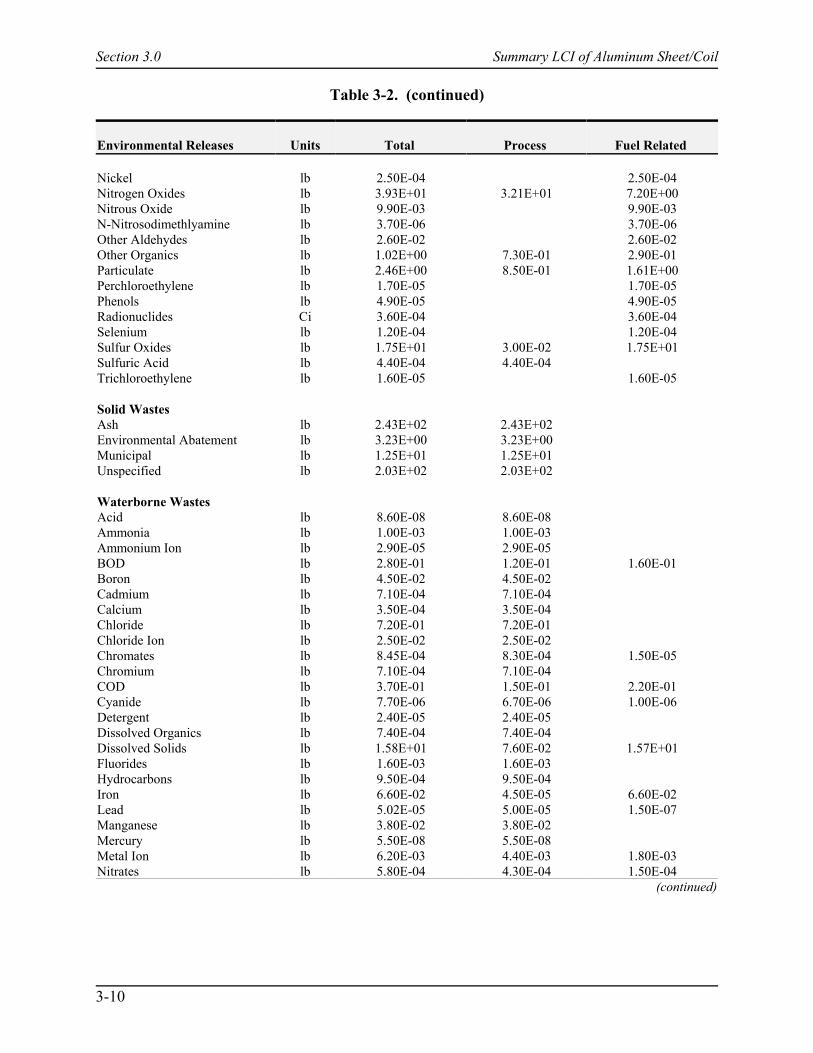
Table 3-2. (continued)
Section 3.0 Summary LCI of Aluminum Sheet/Coil
3-10
Environmental Releases Units Total Process Fuel Related
Nickel lb 2.50E-04 2.50E-04Nitrogen Oxides lb 3.93E+01 3.21E+01 7.20E+00Nitrous Oxide lb 9.90E-03 9.90E-03N-Nitrosodimethlyamine lb 3.70E-06 3.70E-06Other Aldehydes lb 2.60E-02 2.60E-02Other Organics lb 1.02E+00 7.30E-01 2.90E-01Particulate lb 2.46E+00 8.50E-01 1.61E+00Perchloroethylene lb 1.70E-05 1.70E-05Phenols lb 4.90E-05 4.90E-05Radionuclides Ci 3.60E-04 3.60E-04Selenium lb 1.20E-04 1.20E-04Sulfur Oxides lb 1.75E+01 3.00E-02 1.75E+01Sulfuric Acid lb 4.40E-04 4.40E-04Trichloroethylene lb 1.60E-05 1.60E-05
Solid WastesAsh lb 2.43E+02 2.43E+02Environmental Abatement lb 3.23E+00 3.23E+00Municipal lb 1.25E+01 1.25E+01Unspecified lb 2.03E+02 2.03E+02
Waterborne WastesAcid lb 8.60E-08 8.60E-08Ammonia lb 1.00E-03 1.00E-03Ammonium Ion lb 2.90E-05 2.90E-05BOD lb 2.80E-01 1.20E-01 1.60E-01Boron lb 4.50E-02 4.50E-02Cadmium lb 7.10E-04 7.10E-04Calcium lb 3.50E-04 3.50E-04Chloride lb 7.20E-01 7.20E-01Chloride Ion lb 2.50E-02 2.50E-02Chromates lb 8.45E-04 8.30E-04 1.50E-05Chromium lb 7.10E-04 7.10E-04COD lb 3.70E-01 1.50E-01 2.20E-01Cyanide lb 7.70E-06 6.70E-06 1.00E-06Detergent lb 2.40E-05 2.40E-05Dissolved Organics lb 7.40E-04 7.40E-04Dissolved Solids lb 1.58E+01 7.60E-02 1.57E+01Fluorides lb 1.60E-03 1.60E-03Hydrocarbons lb 9.50E-04 9.50E-04Iron lb 6.60E-02 4.50E-05 6.60E-02Lead lb 5.02E-05 5.00E-05 1.50E-07Manganese lb 3.80E-02 3.80E-02Mercury lb 5.50E-08 5.50E-08Metal Ion lb 6.20E-03 4.40E-03 1.80E-03Nitrates lb 5.80E-04 4.30E-04 1.50E-04
(continued)

Table 3-2. (continued)
Section 3.0 Summary LCI of Aluminum Sheet/Coil
3-11
Environmental Releases Units Total Process Fuel Related
Nitrogen lb 6.80E-03 6.80E-03Oil lb 3.56E-01 7.60E-02 2.80E-01Other Organics lb 5.30E-02 5.30E-02Phenol lb 4.39E-05 3.80E-05 5.90E-06Phosphates lb 5.60E-03 5.60E-03Sodium lb 6.40E-04 6.40E-04Sulfate Ion lb 2.50E-02 2.50E-02Sulfates lb 7.50E-01 7.50E-01Sulfuric Acid lb 1.10E-02 1.10E-02Suspended Solids lb 1.11E+00 9.00E-02 1.02E+00Vinyl Chloride Monomer lb 6.00E-08 6.00E-08Zinc lb 2.40E-04 2.40E-04
* The electricity for bauxite mining, alumina production, aluminum smelting, and ingot casting use specialelectricity grids, and therefore, this conversion factor varies. See text for more information.
**Materials collection, separation, and transport to a remanufacturing facility are handled by the collection,materials recovery facility, and transportation process models, respectively, of the decision support tool.
Source: Franklin Associates. 2000.
3.2.4 Caustic Soda and Chlorine Production
Caustic soda (sodium hydroxide) and chlorine are produced from salt by an electrolyticprocess. The aqueous sodium chloride solution is electrolyzed to produce caustic soda, chlorine,and hydrogen gas. For this analysis, resource requirements and environmental emissioncoproduct credits are allocated on a weight basis to each of the materials produced in the cell.Coproduct credit is given on a weight basis because it is not possible, using the electrolytic cell,to get chlorine from salt without also producing sodium hydroxide and hydrogen, both of whichhave commercial value as useful coproducts. Likewise, sodium hydroxide cannot be obtainedwithout producing the valuable coproducts chlorine and hydrogen. Furthermore, it is not possibleto control the cell to increase or decrease the amount of chlorine or caustic soda resulting from agiven input of salt. This is determined by the stoichiometry of the reaction. The electrolytic cellis perceived as a “black box” with an input of salt and electricity and an output of chlorine,sodium hydroxide, and hydrogen.
The electrolysis of sodium chloride is performed by one of two processes: the mercurycathode cell process or the diaphragm cell process. About 83 percent of electrolyzed chlorineand caustic soda production comes from the diaphragm process, with the remainder coming fromthe mercury cell process (Chlorine Institute, 1989). The data for caustic soda incorporated intoTable 3-1 represents this weighted average.
The diaphragm cell uses graphite anodes and steel cathodes. Brine solution is passedthrough the anode compartment of the cell, where the salt is decomposed into chlorine gas and
Section 3.0 Summary LCI of Aluminum Sheet/Coil
3-12
sodium ions. The gas is removed through a pipe at the top of the cell. The sodium ions passthrough a cation-selective diaphragm. The depleted brine is either resaturated with salt orconcentrated by evaporation and recycled to the cell. The sodium ions transferred across thediaphragm react at the cathode to produce hydrogen and sodium hydroxide. Diffusion of thecathode products back into the brine solution is prevented by the diaphragm.
The mercury cathode cell process is described by:
NaCl + xHg º ½ Cl2 + Na(Hg)x
and
Na(Hg)x + H2O º NaOH + ½ H2 + xHg.
Chlorine gas collects at graphite anodes. The chlorine gas from the anode compartment iscooled and dried in a sulfuric acid scrubber. The gas is then cooled further to a liquid forshipment, generally by rail and barge. Metallic sodium reacts with the mercury cathode toproduce an amalgam, which is sent to another compartment of the cell and reacted with water toproduce hydrogen and high-purity sodium hydroxide. Mercury loss is a disadvantage of themercury cathode cell process. Some of the routes by which mercury can escape are in thehydrogen gas stream, in cell room ventilation air and washing water, through purging of thebrine loop and disposal of brine sludges, and through end box fumes.
3.2.5 Bauxite Mining
Aluminum is the most widely distributed metal in the earth’s crust, with only thenonmetallic elements oxygen and silicon surpassing it in abundance. However, bauxite ore is, atpresent, the only commercially exploited source of aluminum. Although other types of earth,including ordinary clay, contain aluminum, economics favors the use of bauxite.
Bauxite is formed by the action of rain and erosion on materials containing aluminumoxide (alumina). The heavy rainfall and warm temperatures of the tropics provide nearly idealconditions for this process, and most of the world’s bauxite is mined in these regions. Australiais the leading producer of bauxite, followed by Guinea, Jamaica, Brazil, and Guyana (AmericanMetals Market, 1997). Although a number of other countries also produce and export bauxite tothe U.S., more than 98 percent of the total is supplied by Guinea, Jamaica, Brazil, and Guyana.For this analysis, only these countries are considered as the suppliers of bauxite to the U.S.
To calculate the fuels used to generate electricity for bauxite production, it is necessary todetermine the percentage of bauxite produced in each of the aforementioned countries. Thisquantity is calculated from the amount exported to the U.S. as bauxite ore and the amount usedwithin each country to produce alumina, which is then exported to the U.S. About 53 percent ofthe alumina used in U.S. smelters is produced domestically, mainly from imported bauxite (U.S.Bureau of Mines, 1996). The remaining 47 percent is imported as alumina.
Australia, Jamaica, and Suriname supply about 90 percent of the alumina imported intothe United States. For this study, these three countries are assumed to supply all of the imported
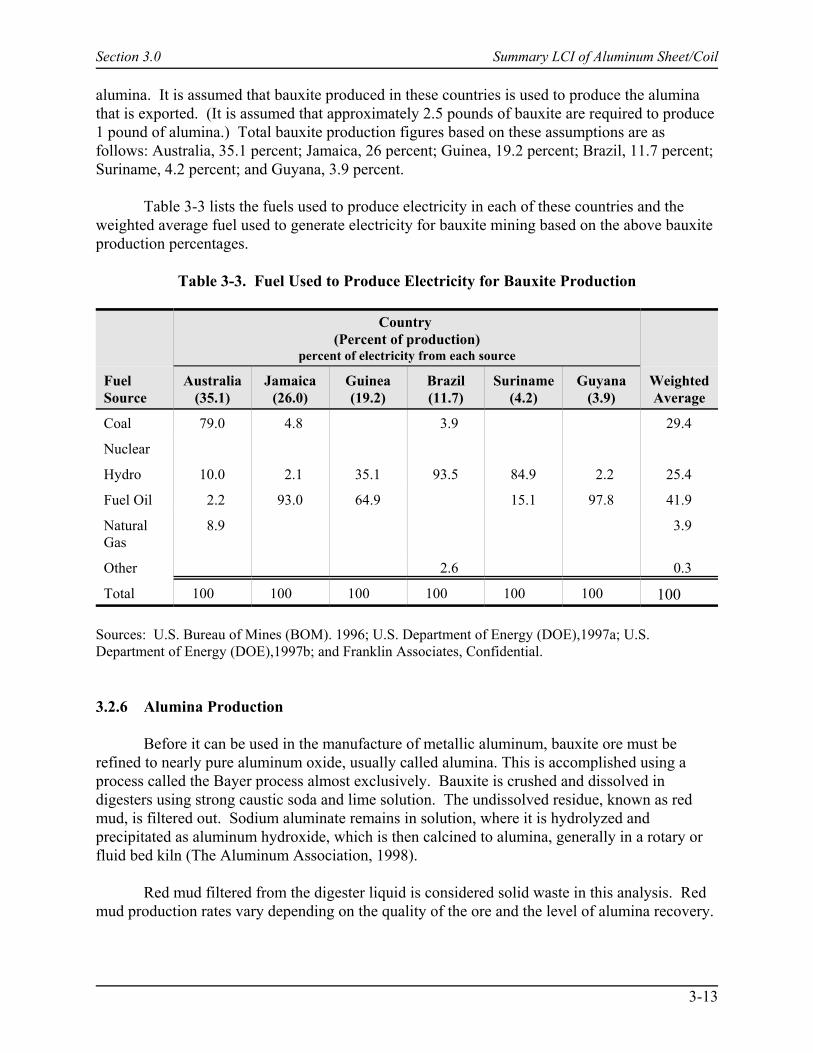
Section 3.0 Summary LCI of Aluminum Sheet/Coil
3-13
alumina. It is assumed that bauxite produced in these countries is used to produce the aluminathat is exported. (It is assumed that approximately 2.5 pounds of bauxite are required to produce1 pound of alumina.) Total bauxite production figures based on these assumptions are asfollows: Australia, 35.1 percent; Jamaica, 26 percent; Guinea, 19.2 percent; Brazil, 11.7 percent;Suriname, 4.2 percent; and Guyana, 3.9 percent.
Table 3-3 lists the fuels used to produce electricity in each of these countries and theweighted average fuel used to generate electricity for bauxite mining based on the above bauxiteproduction percentages.
Table 3-3. Fuel Used to Produce Electricity for Bauxite Production
Country (Percent of production)
percent of electricity from each source
WeightedAverage
FuelSource
Australia(35.1)
Jamaica(26.0)
Guinea(19.2)
Brazil(11.7)
Suriname(4.2)
Guyana(3.9)
Coal 79.0 4.8 3.9 29.4
Nuclear
Hydro 10.0 2.1 35.1 93.5 84.9 2.2 25.4
Fuel Oil 2.2 93.0 64.9 15.1 97.8 41.9
NaturalGas
8.9 3.9
Other 2.6 0.3
Total 100 100 100 100 100 100 100
Sources: U.S. Bureau of Mines (BOM). 1996; U.S. Department of Energy (DOE),1997a; U.S.Department of Energy (DOE),1997b; and Franklin Associates, Confidential.
3.2.6 Alumina Production
Before it can be used in the manufacture of metallic aluminum, bauxite ore must berefined to nearly pure aluminum oxide, usually called alumina. This is accomplished using aprocess called the Bayer process almost exclusively. Bauxite is crushed and dissolved indigesters using strong caustic soda and lime solution. The undissolved residue, known as redmud, is filtered out. Sodium aluminate remains in solution, where it is hydrolyzed andprecipitated as aluminum hydroxide, which is then calcined to alumina, generally in a rotary orfluid bed kiln (The Aluminum Association, 1998).
Red mud filtered from the digester liquid is considered solid waste in this analysis. Redmud production rates vary depending on the quality of the ore and the level of alumina recovery.
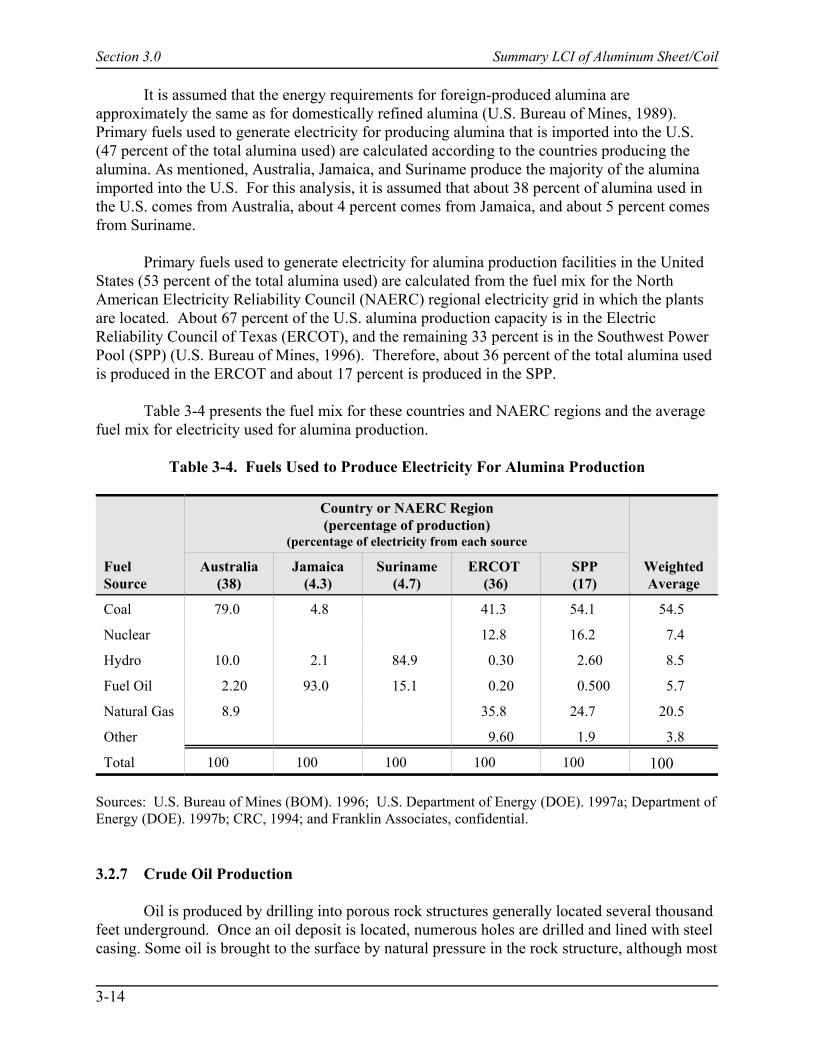
Section 3.0 Summary LCI of Aluminum Sheet/Coil
3-14
It is assumed that the energy requirements for foreign-produced alumina areapproximately the same as for domestically refined alumina (U.S. Bureau of Mines, 1989). Primary fuels used to generate electricity for producing alumina that is imported into the U.S.(47 percent of the total alumina used) are calculated according to the countries producing thealumina. As mentioned, Australia, Jamaica, and Suriname produce the majority of the aluminaimported into the U.S. For this analysis, it is assumed that about 38 percent of alumina used inthe U.S. comes from Australia, about 4 percent comes from Jamaica, and about 5 percent comesfrom Suriname.
Primary fuels used to generate electricity for alumina production facilities in the UnitedStates (53 percent of the total alumina used) are calculated from the fuel mix for the NorthAmerican Electricity Reliability Council (NAERC) regional electricity grid in which the plantsare located. About 67 percent of the U.S. alumina production capacity is in the ElectricReliability Council of Texas (ERCOT), and the remaining 33 percent is in the Southwest PowerPool (SPP) (U.S. Bureau of Mines, 1996). Therefore, about 36 percent of the total alumina usedis produced in the ERCOT and about 17 percent is produced in the SPP.
Table 3-4 presents the fuel mix for these countries and NAERC regions and the averagefuel mix for electricity used for alumina production.
Table 3-4. Fuels Used to Produce Electricity For Alumina Production
FuelSource
Country or NAERC Region(percentage of production)
(percentage of electricity from each source
WeightedAverage
Australia(38)
Jamaica(4.3)
Suriname(4.7)
ERCOT (36)
SPP(17)
Coal 79.0 4.8 41.3 54.1 54.5
Nuclear 12.8 16.2 7.4
Hydro 10.0 2.1 84.9 0.30 2.60 8.5
Fuel Oil 2.20 93.0 15.1 0.20 0.500 5.7
Natural Gas 8.9 35.8 24.7 20.5
Other 9.60 1.9 3.8
Total 100 100 100 100 100 100
Sources: U.S. Bureau of Mines (BOM). 1996; U.S. Department of Energy (DOE). 1997a; Department ofEnergy (DOE). 1997b; CRC, 1994; and Franklin Associates, confidential.
3.2.7 Crude Oil Production
Oil is produced by drilling into porous rock structures generally located several thousandfeet underground. Once an oil deposit is located, numerous holes are drilled and lined with steelcasing. Some oil is brought to the surface by natural pressure in the rock structure, although most
Section 3.0 Summary LCI of Aluminum Sheet/Coil
3-15
oil requires some energy to drive pumps that lift oil to the surface. Once oil is on the surface, itis stored in tanks to await transportation to a refinery. In some cases, it is immediatelytransferred to a pipeline, which transports the oil to a larger terminal.
There are two primary sources of waste from crude oil production. The first source isthe “oil field brine,” or water that is extracted with the oil. The brine goes through a separator ator near the well head to remove the oil from the water. These separators are very efficient andleave minimal oil in the water.
The American Petroleum Institute (API) estimates that 21 billion barrels of brine waterwere produced from crude oil production in 1985 (API, 1987). This quantity of water equates toa ratio of 5.4 barrels of water per barrel of oil. The majority of this water (85 percent) is injectedinto separate wells specifically designed to accept production-related waters. This represents allwaters produced by onshore oil production facilities, which are not permitted to discharge “oilfield brine” to surface waters (personal communication, Franklin Associates and L. Gibson,U.S. EPA, NPDES Permits Branch, Dallas, TX). The remainder of the produced water is fromoffshore oil production facilities and is assumed to be discharged to the ocean. Therefore, thewaterborne wastes represent the brine wastes present in this 15 percent of brine water (DOE,1994). Because crude oil is frequently produced along with natural gas, a portion of thewaterborne waste is allocated to natural gas production (API, 1987).
The second source of waste is the gas produced from oil wells. While most of this isrecovered for sale, some is not. Atmospheric emissions from crude oil production are primarilyhydrocarbons. They are attributed to the natural gas produced from combination wells and relateto line or transmission losses and unflared venting.
The transportation data assume a mix of foreign and domestically produced crude oil.According to the Petroleum Supply Annual (EIA, 1994), 49 percent of the crude oil used in theU.S. is imported.
3.2.8 Petroleum Coke Production
Petroleum coke is used in the manufacture of carbon electrodes, which are used in theelectrolytic reduction of alumina to aluminum. Coking is an extreme form of thermal crackingthat uses high temperatures and a long residence time to break down heavy crude residues to getlighter liquids (Kent, 1992). Coking takes place in a series of ovens in the absence of oxygen. After a typical coking time of 12 to 20 hours, most of the volatile matter is driven from the cruderesidue and the coke is formed. The desired products of the coking process are actually thevolatile products. The petroleum coke itself is considered a byproduct. The coke is collected ina coke drum, while the lighter products go overhead as vapors.
The energy requirements and environmental emissions for crude oil desalting andatmospheric and vacuum distillation to produce heavy crude residues are included in data onproduction of petroleum coke.
Section 3.0 Summary LCI of Aluminum Sheet/Coil
3-16
3.2.9 Coal Mining
Coal may be obtained by surface mining of outcrops or seams that are near the earth’ssurface or by underground mining of deposits. In strip mining, the overburden is removed fromshallow seams, the deposit is broken up, and the coal is loaded for transport. Generally, theoverburden is eventually returned to the mine and is not considered as a solid waste in thisanalysis.
After the coal is mined, it goes through various preparation processes before it is used.These processes vary depending on the quality of the coal and the use for which it is intended.Coal preparation usually involves some type of size reduction and partial removal of ash-formingmaterials.
3.2.10 Metallurgical Coke Production
The two proven processes for manufacturing metallurgical coke are known as the beehiveprocess and the byproduct process (U.S. Steel Corporation, 1985). The primary method formanufacturing coke is the byproduct method, which accounts for more than 98 percent ofU.S. coke production (U.S. EPA, 1995). For this analysis, it is assumed that all metallurgicalcoke is produced in the byproduct oven.
In the byproduct method, air is excluded from the coking chambers, and the necessaryheat for distillation is supplied from external combustion of some of the gas recovered from thecoking process (U.S. Steel Corporation, 1985). Coking 1,000 pounds of coal in the byproductoven is assumed to produce the following: coke, 774 pounds; tar, 37 pounds; water, 32 pounds;benzene, 11 pounds; and coke oven gas, 147 pounds (Loison, 1989). Coproduct credit is givenon a weight basis to all of the byproducts from the oven, except water. It is assumed that about40 percent of the coke oven gas (59 pounds) is used as a fuel for underfiring the coke oven (U.S.Steel Corporation, 1985). Therefore, coproduct credit is given for the remaining 88 lb of cokeoven gas. The energy content of the coke oven gas is accounted for in the energy of materialresource for the coal used as a feedstock for the coke oven. While it is recognized that the gas isactually used as a fuel in the coke oven, the methodology used in this study accounts for theenergy derived from materials used as feedstocks on the basis of the energy content of thematerial that is extracted from the ground to produce the raw material.
3.2.11 Anode Production
Depending on which type of smelting technology is used, either briquettes or prebakeblocks are used for the anodes. The process for making the aggregate for these is the same. Cokeis calcined, ground and blended with pitch to form a paste that is extruded into blocks orbriquettes and allowed to cool (The Aluminum Association, 1998). The briquettes are sent to thepots (reduction cell for the Soderberg design) for consumption. The blocks are sent to a separatebaking furnace.

Section 3.0 Summary LCI of Aluminum Sheet/Coil
3-17
3.2.12 Aluminum Smelting
Smelting is the reduction of refined alumina to metallic aluminum by the electrolyticseparation of aluminum from its oxide. The process is carried out in a long series of electrolyticcells carrying direct current. The alumina is dissolved in a molten bath of cryolite, whichincreases the conductivity of the electrolyte. These chemicals are assumed to be recovered withlittle or no loss, and therefore negligible inputs of these materials are assumed for this LCI. Carbon anodes carry the current to the solution and on to the next cell. The anodes areconsumed during the reaction at a rate of approximately 500 pounds of material per 1,000pounds of aluminum produced. The principal products of the reaction are carbon dioxide, whichis evolved as a gas, and elemental aluminum, which settles to the bottom of the cell and isperiodically drained off.
Aluminum smelting is based on an electrolytic process (Hall-Heroult); therefore, arelatively large quantity of electricity is used to produce primary aluminum. Although thequantity of electricity (kilowatt-hours) required to smelt aluminum can be assessed fromindustrial and literature sources, the calculation of energy used to generate this electricity issomewhat more arbitrary. This estimate has a pronounced effect on the quantity of energy (inmillion Btu) used by the process because different efficiencies are experienced for each powersource. For example, coal-fired power plants use about 1 pound of coal per kilowatt-hour ofelectricity generated (U.S. Department of Commerce, 1990). At an energy content of 9,975 Btuper pound of coal (U.S. Department of Commerce, 1990), this equates to approximately9,975 Btu per kWh. Assuming the standard conversion is 3,412 Btu per kWh (CRC Handbookof Chemistry and Physics, 1994), this equates to a thermal efficiency of about 34 percent. On theother hand, the quantity of “fuel” consumed and thermal efficiency are not considerations whenproducing electricity from hydropower. Therefore, the energy to produce electricity fromhydropower is determined using the standard conversion of 3,412 Btu/kWh. If electricity foraluminum smelting is assumed to come from coal, the energy used for smelting will be aboutthree times higher than if all electricity is assumed to come from hydropower.
According to statistics published by the International Primary Aluminum Institute (IPAI)for 1993, about 31 percent of the electricity used for primary aluminum production in NorthAmerica (Canada and the U.S.) was self-generated and the remaining 69 percent was purchased(IPAI, 1993). Although the fuel mix for self-generated electricity in North America was notreleased for reasons of confidentiality, the international percentage breakdown is reported. Thisbreakdown is assumed to be representative of North America for this analysis. The followingself-generated electricity fuel mix is reported by the IPAI: hydro, 62 percent; coal, 23 percent;and natural gas, 15 percent (IPAI, 1993).
The fuel mix for purchased electricity is estimated according to the quantity of primaryaluminum produced in each NERC region and subregion in the U.S. and Canada, with oneexception. The electricity supplied from the Northwest Power Pool is assumed to comeexclusively from the Bonneville Power Administrations portion of the regional grid.
The grid includes both the U.S. and Canada because aluminum ingots are a commoditymade and traded extensively in and between these countries. Table 3-5 presents this breakdown.

Section 3.0 Summary LCI of Aluminum Sheet/Coil
3-18
Table 3-5. Aluminum Production According to NAERC Regions and Subregions
NAERC Region/SubregionPercent ofProduction
United StatesEast Central Reliability Coordination Agreement (ECAR) 16.8Electric Reliability Council of Texas (ERCOT) 3.5Mid-American Interconnected Network/East Missouri (MAIN-EM) 3.0Northeast Power Coordination Council/New York Power Pool (NPCC-NY) 3.5Southwest Power Pool/West Central (SPP-WC) 3.8Southeastern Electric Reliability Council/Tennessee Valley Authority (SERC-TVA) 2.6Southeastern Electric Reliability Council/Virginia-Carolina (SERC-VAC) 4.1Western System Coordinating Council/Bonneville Power Administration (WCC-BPA)* 20.5Western System Coordinating Council/Rocky Mountain Power Area (WCC-RMP) 2.9
Subtotal—United States 60.7 Canada
Northeast Power Coordination Council/Quebec (NPCC-QUE) 35.0Western System Coordinating Council/Canada (WSCC-CAN) 4.3
Subtotal—Canada 39.3 Grand Total 100
*BPA is an administration within the NWPP that supplies most of the electricity to the aluminum smelters in theNorthwest.References: American Metals Market. 1997; North American Electric Reliability Council, 1994.
The fuel mix used in each of the regions and subregions is weighted according to productionpercentages to obtain the average fuel mix for purchased electricity.
Table 3-6 presents the weighted fuel mix, along with the previously discussed mix forself-generated electricity. The overall average mix for aluminum smelting in the U.S. andCanada is also presented in Table 3-6.
3.2.13 Ingot Casting
Molten aluminum is discharged from a smelter into the holding and ingot casting facility.In the holding furnace, the composition is adjusted to the specific alloy wanted. The melt is thenfluxed to remove impurities and reduce gas content (The Aluminum Association, 1998). A meltloss occurs when these impurities, called dross, are skimmed off the molten aluminum.
Electricity for ingot casting is assumed to be produced by the same fuel mix used foraluminum smelting because smelting and ingot casting usually occur in the same facility.
3.2.14 Hot/Cold Rolling
According to an aluminum industry expert, most aluminum sheet used for packagingpurposes is taken through both the hot and cold rolling processes. The ingot is taken through the

3-19
Section 3.0Sum
mary LC
I of Aluminum
Sheet/Coil
Table 3-6. Fuel Mix for Electricity Production by NAERC Region/Subregion and Average Mix for Aluminum Smelting.
NAERC Region/Subregion (Percent of total generation)
Fuel
ECAR
(11.6)
ERCOT
(2.4)
MAIN-EM
(2.1)
NPCC-NY
(2.4)
SERC-TVA
(1.8)
SERC-VAC
(2.9)
SPP-WC
(3.6)
WSCC-BPA
(14.1)
WSCC-RMP
(2.0)
NPCC-QUE
(24.2)
WSCC-CAN
(3.0)
SelfGeneratedElectricity
WeightedAverage
Coal 88.8 41.3 64.4 19.7 67.6 45.6 61.5 2.5 78.1 0.0 42.0 23 27.9
Nuclear 7.7 12.8 29.6 21.2 14.4 43.5 0.0 7.49 0.0 4.0 0.0 5.9
Hydro 0.56 0.30 5.3 18.9 17.8 2.7 7.2 89.6 15.2 95.3 48.4 62 57.3
Fuel Oil 0.14 0.19 0.22 7.9 0.10 1.0 0.0 0.0 0.01 0.28 0.0 0.3
Nat. Gas 0.26 35.8 0.48 13.1 0.08 1.1 27.3 0.27 0.88 0.0 6.6 15 7.0
Other 2.5 9.6 0.0 19.2 0.06 6.1 4.0 0.13 4.6 0.42 2.9 1.6
Total 100 100 100 100 100 100 100 100 99.9 100 99.9 100 100
Sources: American Metals Market, 1997; U.S. Department of Energy, 1994; International Primary Aluminum Institute, 1993; North AmericanElectric Reliability Council, 1994.
Section 3.0 Summary LCI of Aluminum Sheet/Coil
3-20
hot rolling mill first. The ingots are preheated to about 1,000 /F. They can then be scalped ontheir rolling surfaces or directly fed to a reversing hot mill (The Aluminum Association, 1998). The ingot then passes between the rollers, so that the thickness is reduced to between 1 to 2inches. They are then fed to a continuous hot mill so the thickness can be further reduced to lessthan one-quarter of an inch.
The coils may then be annealed to give the metal workability (The AluminumAssociation, 1998). They are then passed through a cold mill to reduce the thickness to thecustomer’s requirements and may also go through leveling, heat treating, slitting, cutting tolength, and coating processes.
3.2.15 Aluminum Recovery and Processing
Widespread aluminum can recovery is observed through voluntary collection centers,curbside collection programs, and mandatory beverage container deposit laws. The high scrapvalue and easily identified containers are two reasons for the high recovery rate experienced withaluminum. In the 1980s, collection centers could commonly be found in shopping centers andother retail store locations. At present, the recovery of aluminum creates little environmentaldisruption and requires energy only to the extent that fuel is required to transport aluminum tothe collection center.
Once the aluminum is collected, it must be densified in some fashion and shipped. Aluminum is commonly flattened or shredded at recycling centers. The processed scrap isusually blown into tractor-trailer vehicles for shipment to an aluminum recycling plant. Thescrap can also be densified in balers at the recycling center, an MRF, or in special units thatproduce smaller bales called briquettes.
Data for the collection and transportation of postconsumer aluminum are not included inTable 3-2. These data are captured in other modules of the decision support tool and included inwaste management strategies including recycling.
3.2.16 Secondary Ingot Casting
Once aluminum is recovered in a reasonably pure form and prepared for melting, it canbe placed in a secondary furnace. The main difference between primary and secondary ingotcasting is the melting technology (The Aluminum Association, 1998). Types of melting furnacesinclude top-loaded closed melters, rotary melters, and sidewall feeding melters.
3.2.17 Data Quality
Table 3-7 summarizes data quality information for aluminum.
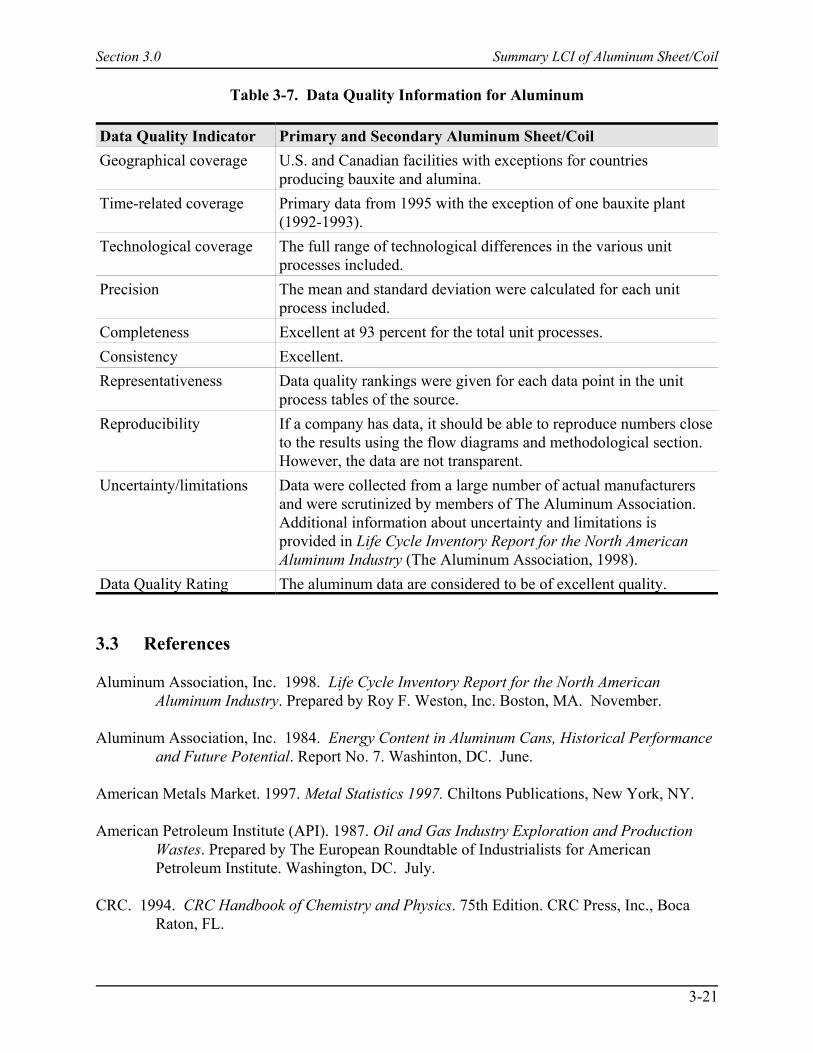
Section 3.0 Summary LCI of Aluminum Sheet/Coil
3-21
Table 3-7. Data Quality Information for Aluminum
Data Quality Indicator Primary and Secondary Aluminum Sheet/CoilGeographical coverage U.S. and Canadian facilities with exceptions for countries
producing bauxite and alumina.Time-related coverage Primary data from 1995 with the exception of one bauxite plant
(1992-1993).Technological coverage The full range of technological differences in the various unit
processes included.Precision The mean and standard deviation were calculated for each unit
process included.Completeness Excellent at 93 percent for the total unit processes.Consistency Excellent.Representativeness Data quality rankings were given for each data point in the unit
process tables of the source.Reproducibility If a company has data, it should be able to reproduce numbers close
to the results using the flow diagrams and methodological section.However, the data are not transparent.
Uncertainty/limitations Data were collected from a large number of actual manufacturersand were scrutinized by members of The Aluminum Association. Additional information about uncertainty and limitations isprovided in Life Cycle Inventory Report for the North AmericanAluminum Industry (The Aluminum Association, 1998).
Data Quality Rating The aluminum data are considered to be of excellent quality.
3.3 References
Aluminum Association, Inc. 1998. Life Cycle Inventory Report for the North AmericanAluminum Industry. Prepared by Roy F. Weston, Inc. Boston, MA. November.
Aluminum Association, Inc. 1984. Energy Content in Aluminum Cans, Historical Performanceand Future Potential. Report No. 7. Washinton, DC. June.
American Metals Market. 1997. Metal Statistics 1997. Chiltons Publications, New York, NY.
American Petroleum Institute (API). 1987. Oil and Gas Industry Exploration and ProductionWastes. Prepared by The European Roundtable of Industrialists for AmericanPetroleum Institute. Washington, DC. July.
CRC. 1994. CRC Handbook of Chemistry and Physics. 75th Edition. CRC Press, Inc., BocaRaton, FL.
Section 3.0 Summary LCI of Aluminum Sheet/Coil
3-22
Chlorine Institute, Inc. The. 1989. North American Chlor-Alkali Plants and Production DataBook. Chlorine Institute Pamphlet. Washington, DC. January.
Energy Information Administration. 1994. Petroleum Supply Annual, 1993. Vol. 1. Washington, DC. June 1994.
Franklin Associates, Ltd. 2000. A Life Cycle Inventory of Linerboard & Medium Rolls,Newsprint Rolls, Aluminum Sheet, and Glass Containers. Prepared for ResearchTriangle Institute, Research Triangle Park, NC. January.
Franklin Associates, Ltd. 1998. Discussions between Franklin Associates, Ltd. and Eric Maliasof the National Lime Association. Prairie Village, KS. January.
Franklin Associates, Ltd. Confidential. Data developed by Franklin Associates, Ltd., using dataobtained from confidential industry sources. Prairie Village, KS. 1991-1994, and1998.
Franklin Associates, Ltd. 1998. Personal communication between Franklin Associates, Ltd. andL. Gibson, U.S. Environmental Production Agency. NPDES Permits Branch. Dallas,TX.
International Primary Aluminum Institute. 1993. Electric Power Utilization Annual Report for1992. London, U.K.
Kent, J. A, Editor. 1992. Riegel’s Handbook of Industrial Chemistry. Ninth Edition. VanNostrand Reinhold, New York, NY.
Loison, R. 1989. Coke- Quality and Production. Buttersworth Books, London, U.K.
NAERC (North American Electric Reliability Council). 1994. Electric Supply and Demand1994-2003. Princeton, NJ.
U.S. Bureau of the Census (BOM). 1990. 1987 Census of Mineral Industries. Fuels and ElectricEnergy Consumed. MIC87-S-2. U.S. Department of Commerce, Washington, DC. December.
U.S. Bureau of Mines (BOM). 1984. Mineral Facts and Problems. U.S. Department of Interior,Washington, DC.
U.S. Bureau of Mines (BOM). 1989. Minerals Yearbook. Volume 1. U.S. Department ofInterior, Washington, DC.
U.S. Bureau of Mines (BOM). 1993. Minerals Yearbook. U.S. Department of Interior,Washington, DC.
U.S. Bureau of Mines (BOM). 1996. Bauxite and Alumina. U.S. Department of Interior,Washington, DC.

Section 3.0 Summary LCI of Aluminum Sheet/Coil
3-23
U.S. Department of Energy (DOE). 1972 to 1985. Industrial Energy Efficiency ImprovementProgram. Annual Report to the Congress and the President, Washington, DC.
U.S. Department of Energy (DOE). 1994. Bonneville Power Administration: 1993 Fast Facts.DOE/EP-2306. Bonneville Power Administration. Portland, OR. January.
U.S. Department of Energy (DOE). 1994. Petroleum Supply Annual 1993. Volume 1. EnergyInformation Administration, Washington, DC.
U.S. Department of Energy (DOE). 1997a. Annual Energy Review 1996. DOE/EIA-0384(96).Energy Information Administration, Washington, DC.
U.S. Department of Energy (DOE). 1997b. International Energy Annual, 1995. EnergyInformation Administration, Washington, DC.
U.S. DOC. 1990. 1987 Census of Mineral Industries. Fuels and Electric Energy Consumed. MIC87-S-2, Washington, DC.
U.S. Environmental Protection Administration (EPA). 1994. Emission Factor Documentationfor AP-42, Section 11.15, Lime Manufacturing. April 1994. NTIS PB 95-196028. Office of Air Quality Planning and Standards. Research Triangle Park, NC.
U.S. Environmental Protection Administration (EPA). 1995. Compilation of Air PollutantEmission Factors AP-42, Volume I: Stationary Point and Area Sources. NTIS PB 95-196028. Office of Air Quality Planning and Standards. Research Triangle Park, NC.
U.S. Geological Survey (USGS). 1995. “Lime,” In: Minerals Yearbook 1995.
United States Steel Corporation. 1985. The Making, Shaping and Treating of Steel, 10th Edition.Association of Iron and Steel Engineers, Pittsburgh, PA.

Section 4.0 Summary LCI of Glass Containers
4-1
4.0 Summary LCI of Glass Containers4.1 Introduction
This summary presents “cradle-to-gate” LCI results for glass container productionscenarios: primary, secondary, and composite primary/secondary. The data include energy andemissions from raw materials extraction through production of the final product but does notinclude the use or disposal portions of a traditional LCI. In addition, data for the collection,processing, and transportation of recovery cullet to a reprocessing facility are not included in thedata sets for the secondary and composite systems. These data are included in other modules ofthe MSW-DST.
Materials flow diagrams for the production scenarios are presented and LCI data for 1 tonof each type of glass container system are presented. Data sources are provided in Section 4.3.
4.2 Overview
The following sections describe the manufacture of glass from raw materials extractedfrom the earth and from recycled glass containers. This analysis identifies the primary componentsfor the glass container. The following steps for the production of glass containers are discussed.
# glass sand mining# feldspar mining# cullet (in-house)# cullet (postconsumer)# glass container manufacture.
Limestone mining is discussed in Section 3.0 and soda ash is discussed in Section 6.0. Materials flow diagrams and tables for glass container manufacturing are presented in Figures 4-1 through 4-3 and Tables 4-1 through 4-3. Table 4-1 provides the cradle-to-gate data forproducing 1 ton of primary glass. The cradle-to-gate data for the production of 1 ton of 100percent postconsumer secondary glass is are presented in Table 4-2. Table 4-3 presents thecradle-to-gate data for the production of 1 ton of composite 27.5 percent postconsumer/72.5percent primary glass. Conceptual flow diagrams for mining and processing each of the rawmaterials are provided in Figures 4-4 through 4-7. The 100 percent cullet scenario wascalculated to show the most extreme recycled content scenario. The calculations are done on thebasis of closed-loop recycling in which post consumer glass is recovered and recycled back intosecondary glass containers. However, it is not a realistic scenario for glass containermanufacturing since 100 percent cullet is not typically used. This is because much of therecovered cullet is mixed-color and otherwise contaminated and is not suitable for recyclingback into containers. Other applications are being developed for this cullet.
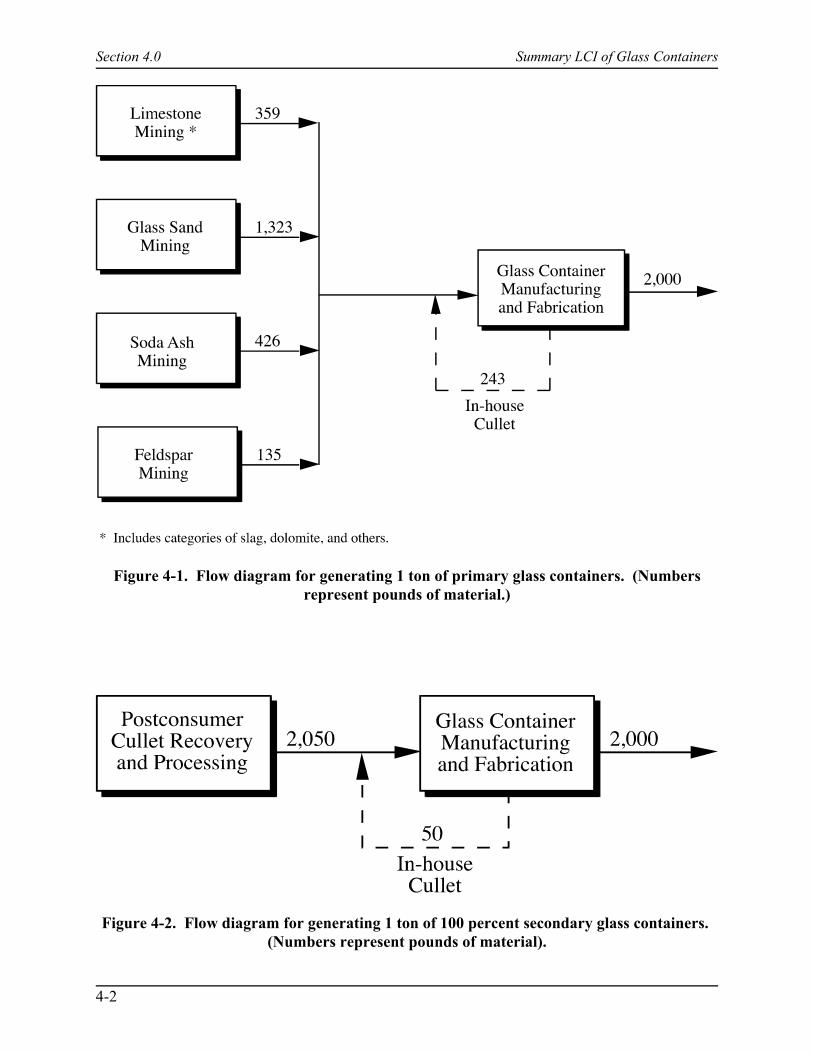
Section 4.0 Summary LCI of Glass Containers
4-2
Figure 4-2. Flow diagram for generating 1 ton of 100 percent secondary glass containers. (Numbers represent pounds of material).
Figure 4-1. Flow diagram for generating 1 ton of primary glass containers. (Numbersrepresent pounds of material.)
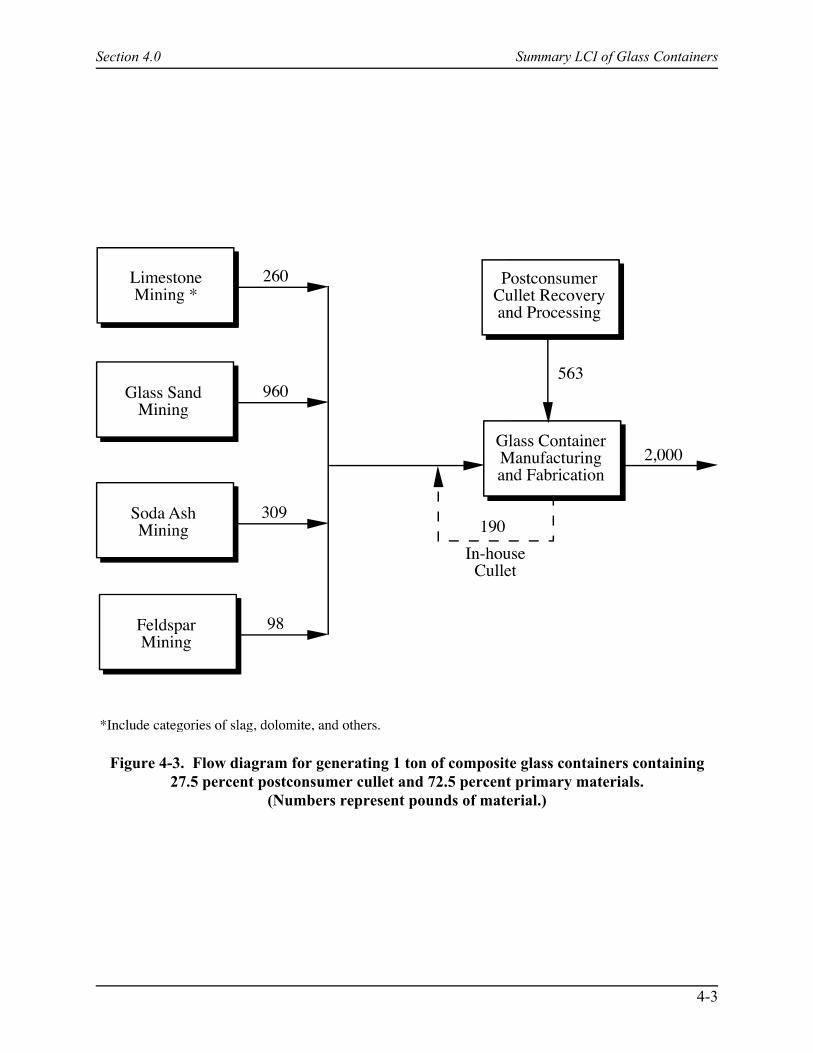
Section 4.0 Summary LCI of Glass Containers
4-3
Figure 4-3. Flow diagram for generating 1 ton of composite glass containers containing27.5 percent postconsumer cullet and 72.5 percent primary materials.
(Numbers represent pounds of material.)
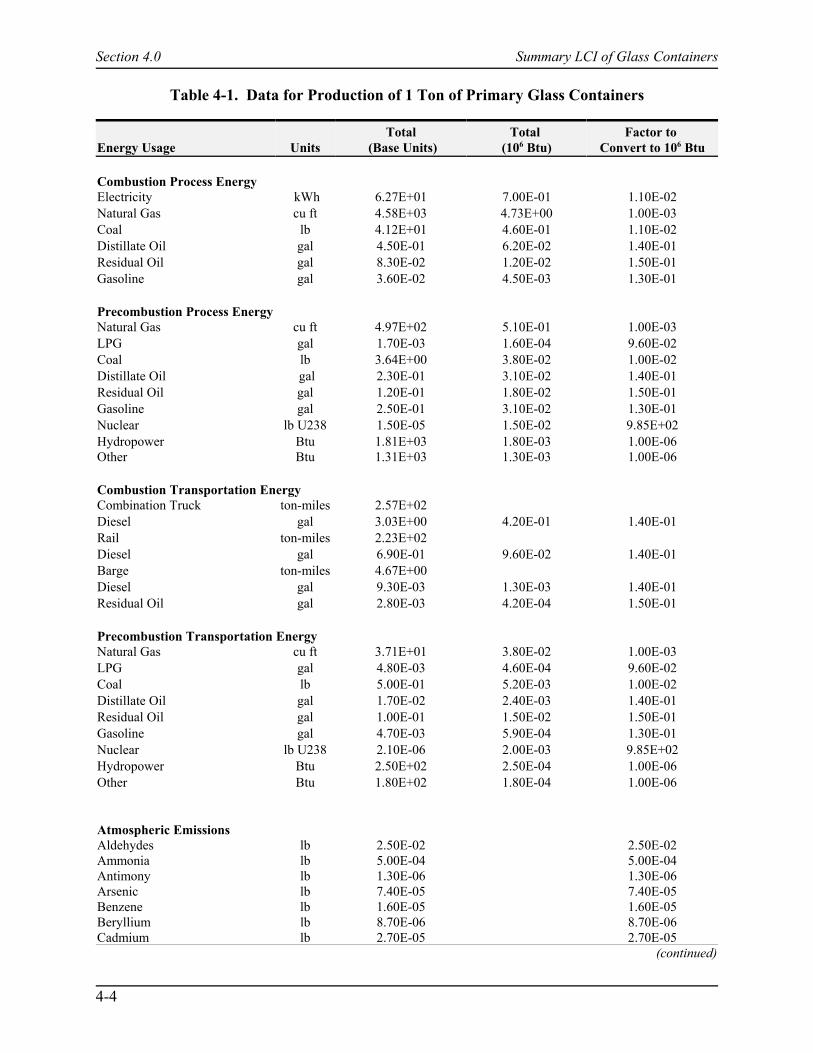
Section 4.0 Summary LCI of Glass Containers
4-4
Table 4-1. Data for Production of 1 Ton of Primary Glass Containers
Energy Usage UnitsTotal
(Base Units)Total
(106 Btu)Factor to
Convert to 106 Btu
Combustion Process EnergyElectricity kWh 6.27E+01 7.00E-01 1.10E-02Natural Gas cu ft 4.58E+03 4.73E+00 1.00E-03Coal lb 4.12E+01 4.60E-01 1.10E-02Distillate Oil gal 4.50E-01 6.20E-02 1.40E-01Residual Oil gal 8.30E-02 1.20E-02 1.50E-01Gasoline gal 3.60E-02 4.50E-03 1.30E-01
Precombustion Process EnergyNatural Gas cu ft 4.97E+02 5.10E-01 1.00E-03LPG gal 1.70E-03 1.60E-04 9.60E-02Coal lb 3.64E+00 3.80E-02 1.00E-02Distillate Oil gal 2.30E-01 3.10E-02 1.40E-01Residual Oil gal 1.20E-01 1.80E-02 1.50E-01Gasoline gal 2.50E-01 3.10E-02 1.30E-01Nuclear lb U238 1.50E-05 1.50E-02 9.85E+02Hydropower Btu 1.81E+03 1.80E-03 1.00E-06Other Btu 1.31E+03 1.30E-03 1.00E-06
Combustion Transportation EnergyCombination Truck ton-miles 2.57E+02Diesel gal 3.03E+00 4.20E-01 1.40E-01Rail ton-miles 2.23E+02Diesel gal 6.90E-01 9.60E-02 1.40E-01Barge ton-miles 4.67E+00Diesel gal 9.30E-03 1.30E-03 1.40E-01Residual Oil gal 2.80E-03 4.20E-04 1.50E-01
Precombustion Transportation EnergyNatural Gas cu ft 3.71E+01 3.80E-02 1.00E-03LPG gal 4.80E-03 4.60E-04 9.60E-02Coal lb 5.00E-01 5.20E-03 1.00E-02Distillate Oil gal 1.70E-02 2.40E-03 1.40E-01Residual Oil gal 1.00E-01 1.50E-02 1.50E-01Gasoline gal 4.70E-03 5.90E-04 1.30E-01Nuclear lb U238 2.10E-06 2.00E-03 9.85E+02Hydropower Btu 2.50E+02 2.50E-04 1.00E-06Other Btu 1.80E+02 1.80E-04 1.00E-06
Atmospheric EmissionsAldehydes lb 2.50E-02 2.50E-02Ammonia lb 5.00E-04 5.00E-04Antimony lb 1.30E-06 1.30E-06Arsenic lb 7.40E-05 7.40E-05Benzene lb 1.60E-05 1.60E-05Beryllium lb 8.70E-06 8.70E-06Cadmium lb 2.70E-05 2.70E-05
(continued)
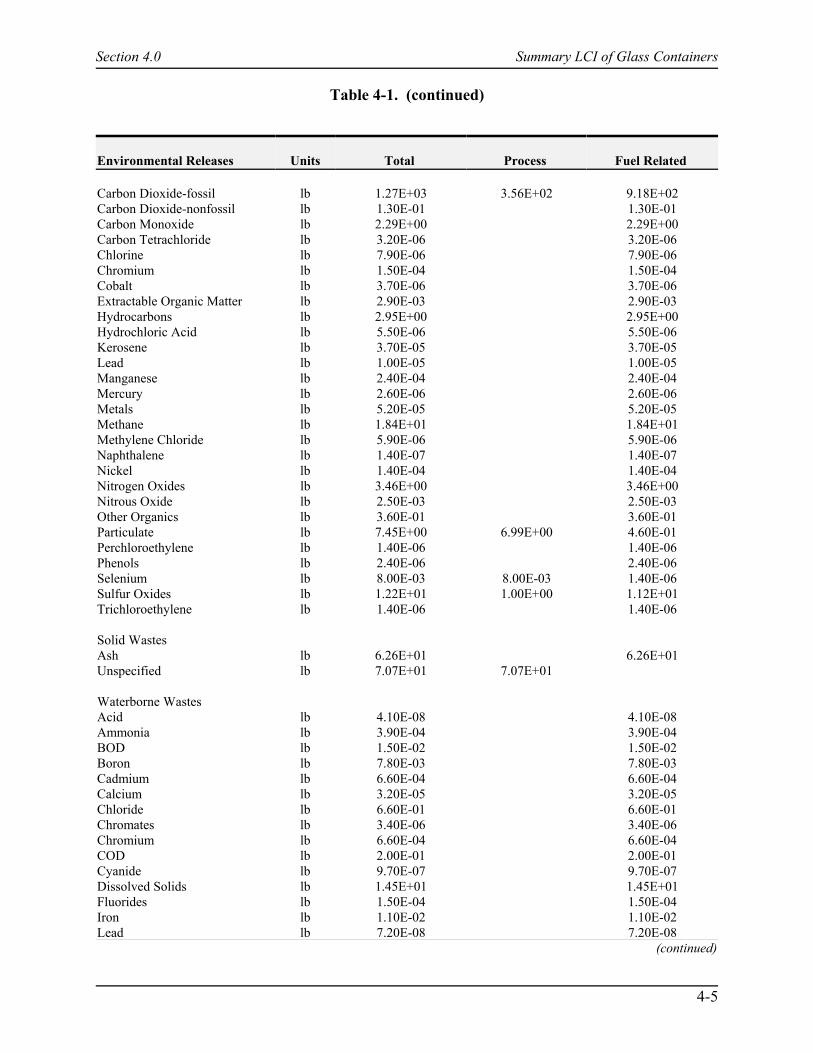
Table 4-1. (continued)
Section 4.0 Summary LCI of Glass Containers
4-5
Environmental Releases Units Total Process Fuel Related
Carbon Dioxide-fossil lb 1.27E+03 3.56E+02 9.18E+02Carbon Dioxide-nonfossil lb 1.30E-01 1.30E-01Carbon Monoxide lb 2.29E+00 2.29E+00Carbon Tetrachloride lb 3.20E-06 3.20E-06Chlorine lb 7.90E-06 7.90E-06Chromium lb 1.50E-04 1.50E-04Cobalt lb 3.70E-06 3.70E-06Extractable Organic Matter lb 2.90E-03 2.90E-03Hydrocarbons lb 2.95E+00 2.95E+00Hydrochloric Acid lb 5.50E-06 5.50E-06Kerosene lb 3.70E-05 3.70E-05Lead lb 1.00E-05 1.00E-05Manganese lb 2.40E-04 2.40E-04Mercury lb 2.60E-06 2.60E-06Metals lb 5.20E-05 5.20E-05Methane lb 1.84E+01 1.84E+01Methylene Chloride lb 5.90E-06 5.90E-06Naphthalene lb 1.40E-07 1.40E-07Nickel lb 1.40E-04 1.40E-04Nitrogen Oxides lb 3.46E+00 3.46E+00Nitrous Oxide lb 2.50E-03 2.50E-03Other Organics lb 3.60E-01 3.60E-01Particulate lb 7.45E+00 6.99E+00 4.60E-01Perchloroethylene lb 1.40E-06 1.40E-06Phenols lb 2.40E-06 2.40E-06Selenium lb 8.00E-03 8.00E-03 1.40E-06Sulfur Oxides lb 1.22E+01 1.00E+00 1.12E+01Trichloroethylene lb 1.40E-06 1.40E-06
Solid WastesAsh lb 6.26E+01 6.26E+01Unspecified lb 7.07E+01 7.07E+01
Waterborne WastesAcid lb 4.10E-08 4.10E-08Ammonia lb 3.90E-04 3.90E-04BOD lb 1.50E-02 1.50E-02Boron lb 7.80E-03 7.80E-03Cadmium lb 6.60E-04 6.60E-04Calcium lb 3.20E-05 3.20E-05Chloride lb 6.60E-01 6.60E-01Chromates lb 3.40E-06 3.40E-06Chromium lb 6.60E-04 6.60E-04COD lb 2.00E-01 2.00E-01Cyanide lb 9.70E-07 9.70E-07Dissolved Solids lb 1.45E+01 1.45E+01Fluorides lb 1.50E-04 1.50E-04Iron lb 1.10E-02 1.10E-02Lead lb 7.20E-08 7.20E-08
(continued)

Table 4-1. (continued)
Section 4.0 Summary LCI of Glass Containers
4-6
Environmental Releases Units Total Process Fuel Related Manganese lb 3.40E-05 3.40E-05Mercury lb 5.10E-08 5.10E-08Metal Ion lb 8.60E-04 8.60E-04Nitrates lb 1.40E-05 1.40E-05Oil lb 2.50E-01 2.50E-01Other Organics lb 4.30E-02 4.30E-02Phenol lb 2.80E-06 2.80E-06Phosphates lb 9.80E-04 9.80E-04Sodium lb 5.90E-05 5.90E-05Sulfates lb 5.30E-01 5.30E-01Sulfuric Acid lb 2.00E-03 2.00E-03Suspended Solids lb 1.59E+00 1.32E+00 2.70E-01Zinc lb 2.20E-04 2.20E-04
Source: Franklin Associates. 2000.
Table 4-2. Data for Production of 1 Ton of Secondary Glass Containers
Energy Usage UnitsTotal
(Base Units)Total
(106 Btu)Factor to
Convert to 106 Btu
Combustion Process EnergyElectricity kWh 2.10E+01 2.40E-01 1.10E-02Natural Gas cu ft 3.55E+03 3.66E+00 1.00E-03
Precombustion Process EnergyNatural Gas cu ft 3.73E+02 3.80E-01 1.00E-03LPG gal 5.90E-04 5.70E-05 9.60E-02Coal lb 2.24E+00 2.30E-02 1.00E-02Distillate Oil gal 1.20E-01 1.70E-02 1.40E-01Residual Oil gal 7.50E-02 1.10E-02 1.50E-01Gasoline gal 1.90E-01 2.40E-02 1.30E-01Nuclear lb U238 9.10E-06 9.00E-03 9.85E+02Hydropower Btu 1.12E+03 1.10E-03 1.00E-06Other Btu 8.10E+02 8.10E-04 1.00E-06
Combustion Transportation EnergyCombination Truck ton-miles 1.80E+02Diesel gal 2.12E+00 2.90E-01 1.40E-01Rail ton-miles 2.00E+01Diesel gal 6.20E-02 8.60E-03 1.40E-01
Precombustion Transportation EnergyNatural Gas cu ft 2.17E+01 2.20E-02 1.00E-03LPG gal 2.80E-03 2.70E-04 9.60E-02Coal lb 2.90E-01 3.10E-03 1.00E-02
(continued)
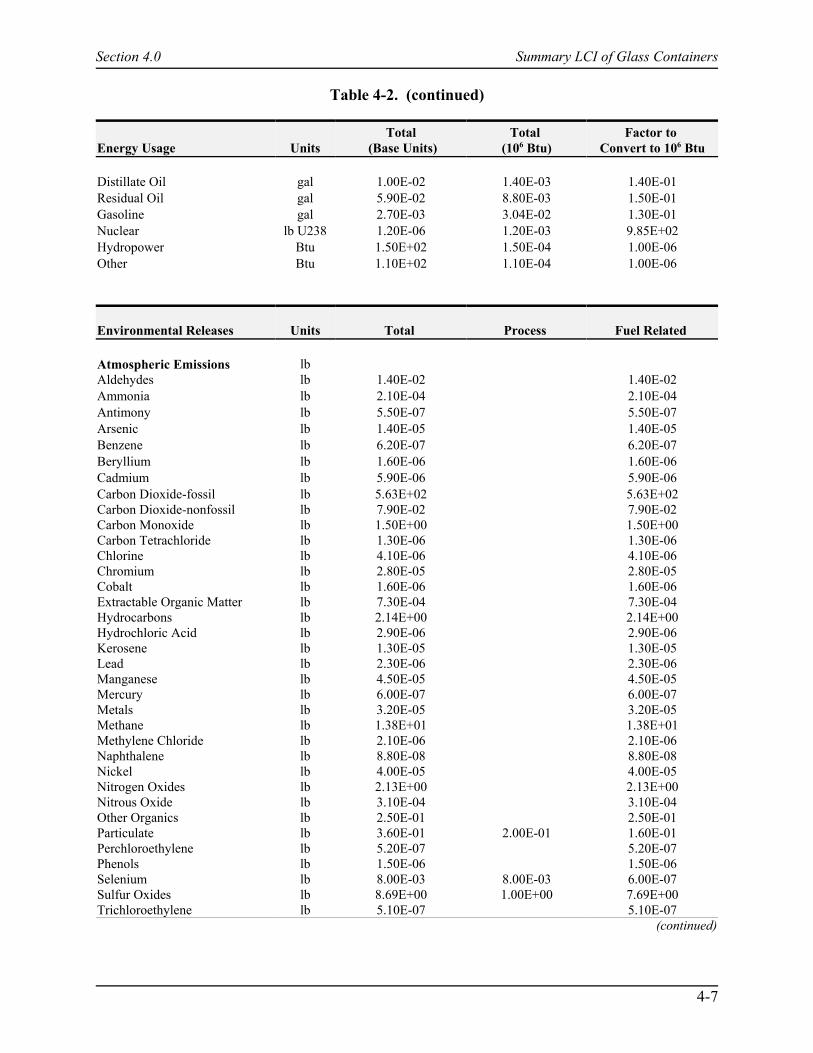
Table 4-2. (continued)
Section 4.0 Summary LCI of Glass Containers
4-7
Energy Usage UnitsTotal
(Base Units)Total
(106 Btu)Factor to
Convert to 106 Btu
Distillate Oil gal 1.00E-02 1.40E-03 1.40E-01Residual Oil gal 5.90E-02 8.80E-03 1.50E-01Gasoline gal 2.70E-03 3.04E-02 1.30E-01Nuclear lb U238 1.20E-06 1.20E-03 9.85E+02Hydropower Btu 1.50E+02 1.50E-04 1.00E-06Other Btu 1.10E+02 1.10E-04 1.00E-06
Environmental Releases Units Total Process Fuel Related
Atmospheric Emissions lbAldehydes lb 1.40E-02 1.40E-02Ammonia lb 2.10E-04 2.10E-04Antimony lb 5.50E-07 5.50E-07Arsenic lb 1.40E-05 1.40E-05Benzene lb 6.20E-07 6.20E-07Beryllium lb 1.60E-06 1.60E-06Cadmium lb 5.90E-06 5.90E-06Carbon Dioxide-fossil lb 5.63E+02 5.63E+02Carbon Dioxide-nonfossil lb 7.90E-02 7.90E-02Carbon Monoxide lb 1.50E+00 1.50E+00Carbon Tetrachloride lb 1.30E-06 1.30E-06Chlorine lb 4.10E-06 4.10E-06Chromium lb 2.80E-05 2.80E-05Cobalt lb 1.60E-06 1.60E-06Extractable Organic Matter lb 7.30E-04 7.30E-04Hydrocarbons lb 2.14E+00 2.14E+00Hydrochloric Acid lb 2.90E-06 2.90E-06Kerosene lb 1.30E-05 1.30E-05Lead lb 2.30E-06 2.30E-06Manganese lb 4.50E-05 4.50E-05Mercury lb 6.00E-07 6.00E-07Metals lb 3.20E-05 3.20E-05Methane lb 1.38E+01 1.38E+01Methylene Chloride lb 2.10E-06 2.10E-06Naphthalene lb 8.80E-08 8.80E-08Nickel lb 4.00E-05 4.00E-05Nitrogen Oxides lb 2.13E+00 2.13E+00Nitrous Oxide lb 3.10E-04 3.10E-04Other Organics lb 2.50E-01 2.50E-01Particulate lb 3.60E-01 2.00E-01 1.60E-01Perchloroethylene lb 5.20E-07 5.20E-07Phenols lb 1.50E-06 1.50E-06Selenium lb 8.00E-03 8.00E-03 6.00E-07Sulfur Oxides lb 8.69E+00 1.00E+00 7.69E+00Trichloroethylene lb 5.10E-07 5.10E-07
(continued)

Table 4-2. (continued)
Section 4.0 Summary LCI of Glass Containers
4-8
Environmental Releases Units Total Process Fuel Related
Solid WastesAsh lb 2.65E+01 2.65E+01Unspecified lb 4.51E+01 4.51E+01
Waterborne WastesAcid lb 2.10E-08 2.10E-08Ammonia lb 2.60E-04 2.60E-04BOD lb 1.10E-02 1.10E-02Boron lb 1.60E-03 1.60E-03Cadmium lb 5.10E-04 5.10E-04Calcium lb 1.20E-05 1.20E-05Chloride lb 5.00E-01 5.00E-01Chromates lb 1.40E-06 1.40E-06Chromium lb 5.00E-04 5.00E-04COD lb 1.50E-01 1.50E-01Cyanide lb 7.40E-07 7.40E-07Dissolved Solids lb 1.11E+01 1.11E+01Fluorides lb 5.40E-05 5.40E-05Iron lb 2.00E-03 2.00E-03Lead lb 3.80E-08 3.80E-08Manganese lb 1.20E-05 1.20E-05Mercury lb 3.90E-08 3.90E-08Metal Ion lb 4.50E-04 4.50E-04Nitrates lb 5.10E-06 5.10E-06Oil lb 1.90E-01 1.90E-01Other Organics lb 3.20E-02 3.20E-02Phenol lb 1.50E-06 1.50E-06Phosphates lb 1.90E-04 1.90E-04Sodium lb 2.10E-05 2.10E-05Sulfates lb 3.90E-01 3.90E-01Sulfuric Acid lb 3.90E-04 3.90E-04Suspended Solids lb 2.00E-01 2.00E-01Zinc lb 1.70E-04 1.70E-04
Note: Materials collection, separation, and transport to a remanufacturing facility are handled by the collection,materials recovery facility, and transportation process models, respectively, of the decision support tool.
Source: Franklin Associates, 2000.

Section 4.0 Summary LCI of Glass Containers
4-9
Table 4-3. Data for Production of 1 Ton of Composite (27.5 Percent Secondary/72.5Percent Primary) Glass Containers
Energy Usage UnitsTotal
(Base Units)Total
(106 Btu)Factor to
Convert to 106 Btu
Combustion Process EnergyElectricity kWh 5.13E+01 5.70E-01 1.10E-02Natural Gas cu ft 4.30E+03 4.43E+00 1.00E-03Coal lb 2.99E+01 3.30E-01 1.10E-02Distillate Oil gal 3.30E-01 4.50E-02 1.40E-01Residual Oil gal 6.00E-02 9.00E-03 1.50E-01Gasoline gal 2.60E-02 3.30E-03 1.30E-01
Precombustion Process EnergyNatural Gas cu ft 4.63E+02 4.80E-01 1.00E-03LPG gal 1.40E-03 1.30E-04 9.60E-02Coal lb 3.25E+00 3.40E-02 1.00E-02Distillate Oil gal 2.00E-01 2.70E-02 1.40E-01Residual Oil gal 1.10E-01 1.60E-02 1.50E-01Gasoline gal 2.30E-01 2.90E-02 1.30E-01Nuclear lb U238 1.30E-05 1.30E-02 9.85E+02Hydropower Btu 1.62E+03 1.60E-03 1.00E-06Other Btu 1.18E+03 1.20E-03 1.00E-06
Combustion Transportation EnergyCombination Truck ton-miles 2.36E+02Diesel gal 2.78E+00 3.90E-01 1.40E-01Rail ton-miles 1.67E+02Diesel gal 5.20E-01 7.20E-02 1.40E-01Barge ton-miles 3.38E+00Diesel gal 6.80E-03 9.40E-04 1.40E-01Residual Oil gal 2.00E-03 3.00E-04 1.50E-01
Precombustion Transportation EnergyNatural Gas cu ft 3.29E+01 3.40E-02 1.00E-03LPG gal 4.20E-03 4.00E-04 9.60E-02Coal lb 4.40E-01 4.60E-03 1.00E-02Distillate Oil gal 1.50E-02 2.10E-03 1.40E-01Residual Oil gal 8.90E-02 1.30E-02 1.50E-01Gasoline gal 4.20E-03 5.20E-04 1.30E-01Nuclear lb U238 1.80E-06 1.80E-03 9.85E+02Hydropower Btu 2.20E+02 2.20E-04 1.00E-06Other Btu 1.60E+02 1.60E-04 1.00E-06
(continued)

Table 4-3. (continued)
Section 4.0 Summary LCI of Glass Containers
4-10
Environmental Releases Units Total Process Fuel Related
Atmospheric EmissionsAldehydes lb 2.20E-02 2.20E-02Ammonia lb 4.20E-04 4.20E-04Antimony lb 1.10E-06 1.10E-06Arsenic lb 5.80E-05 5.80E-05Benzene lb 1.20E-05 1.20E-05Beryllium lb 6.70E-06 6.70E-06Cadmium lb 2.10E-05 2.10E-05Carbon Dioxide-fossil lb 1.08E+03 2.58E+02 8.21E+02Carbon Dioxide-nonfossil lb 1.10E-01 1.10E-01Carbon Monoxide lb 2.07E+00 2.07E+00Carbon Tetrachloride lb 2.60E-06 2.60E-06Chlorine lb 6.80E-06 6.80E-06Chromium lb 1.20E-04 1.20E-04Cobalt lb 3.10E-06 3.10E-06Extractable Organic Matter lb 2.30E-03 2.30E-03Hydrocarbons lb 2.73E+00 2.73E+00Hydrochloric Acid lb 4.80E-06 4.80E-06Kerosene lb 3.10E-05 3.10E-05Lead lb 8.00E-06 8.00E-06Manganese lb 1.90E-04 1.90E-04Mercury lb 2.00E-06 2.00E-06Metals lb 4.70E-05 4.70E-05Methane lb 1.71E+01 1.71E+01Methylene Chloride lb 4.80E-06 4.80E-06Naphthalene lb 1.30E-07 1.30E-07Nickel lb 1.10E-04 1.10E-04Nitrogen Oxides lb 3.09E+00 3.09E+00Nitrous Oxide lb 1.90E-03 1.90E-03Other Organics lb 3.30E-01 3.30E-01Particulate lb 5.50E+00 5.13E+00 3.70E-01Perchloroethylene lb 1.20E-06 1.20E-06Phenols lb 2.10E-06 2.10E-06Selenium lb 8.00E-03 8.00E-03 1.20E-06Sulfur Oxides lb 1.12E+01 1.00E+00 1.02E+01Trichloroethylene lb 1.10E-06 1.10E-06
Solid WastesUnspecified lb 6.37E+01 6.37E+01Ash lb 5.27E+01 5.27E+01
Waterborne WastesAcid lb 3.50E-08 3.50E-08Ammonia lb 3.60E-04 3.60E-04BOD lb 1.40E-02 1.40E-02Calcium lb 2.60E-05 2.60E-05Chloride lb 6.20E-01 6.20E-01Chromium lb 6.20E-04 6.20E-04COD lb 1.90E-01 1.90E-01Dissolved Solids lb 1.35E+01 1.35E+01
(continued)
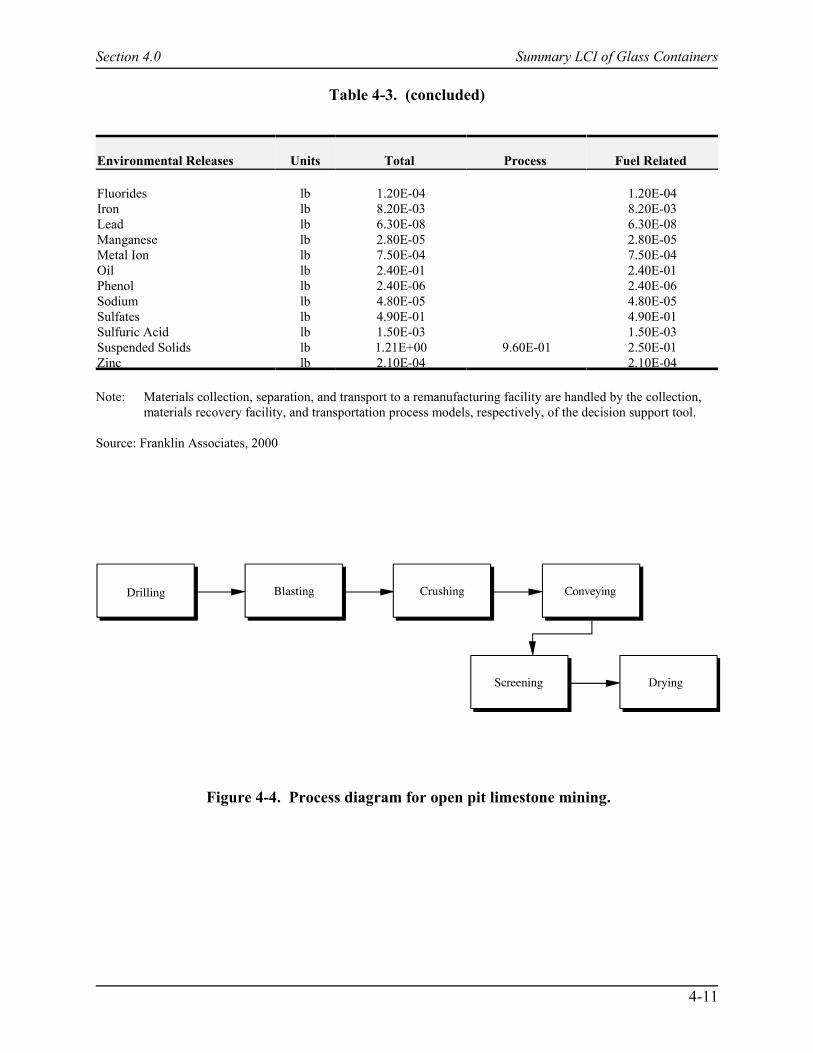
Table 4-3. (concluded)
Section 4.0 Summary LCI of Glass Containers
4-11
Figure 4-4. Process diagram for open pit limestone mining.
Environmental Releases Units Total Process Fuel Related
Fluorides lb 1.20E-04 1.20E-04Iron lb 8.20E-03 8.20E-03Lead lb 6.30E-08 6.30E-08Manganese lb 2.80E-05 2.80E-05Metal Ion lb 7.50E-04 7.50E-04Oil lb 2.40E-01 2.40E-01Phenol lb 2.40E-06 2.40E-06Sodium lb 4.80E-05 4.80E-05Sulfates lb 4.90E-01 4.90E-01Sulfuric Acid lb 1.50E-03 1.50E-03Suspended Solids lb 1.21E+00 9.60E-01 2.50E-01Zinc lb 2.10E-04 2.10E-04
Note: Materials collection, separation, and transport to a remanufacturing facility are handled by the collection,materials recovery facility, and transportation process models, respectively, of the decision support tool.
Source: Franklin Associates, 2000

Section 4.0 Summary LCI of Glass Containers
4-12
Figure 4-5. Process diagram for open pit sand mining.
Figure 4-6. Process diagram for underground trona mining to produce soda ash.

Section 4.0 Summary LCI of Glass Containers
4-13
Figure 4-7. Process diagram for open pit mining and purifying of feldspar.
4.2.1 Glass Sand Mining
Glass sand, the predominant raw material for glass manufacture, is the source of almostall of the silicon dioxide present in the finished glass. Silicon dioxide accounts forapproximately 70 percent by weight of finished glass.
Glass sand is a high-purity quartz sand with high silica content and typically less than1 percent of iron oxide, chromium compounds, and alumina, calcium, or magnesium oxides. Ingeneral, U.S. consumption of glass sand is met by U.S. production, but some high-purity glasssand is imported. Glass sand deposits exist in New Jersey in the form of unconsolidated sandbanks and as sandstone found in the Alleghenies and the Mississippi Valley. The east-west beltof states running from Pennsylvania to Illinois has rich resources of glass sand.
Mining operations vary depending on the nature of the deposit at each location. Open pitexcavation and dredging are the two basic mining methods, each requiring a combination ofmany types of equipment including crushers, screens, washers, classifiers, and grinding mills. The LCI data used for this step are based on open pit (dry) excavation. Particulates aregenerated, especially during drying and packaging operations (U.S. Bureau of Mines, 1993).Waterborne suspended solids from clay are generated during washing operations (National StoneAssociation, 1991). A flow diagram is shown in Figure 4-5.
4.2.2 Feldspar Mining
Feldspar is an aluminum silicate mineral that is used in glass manufacture to obtainaluminum oxide. This oxide improves the stability and durability of the glass microstructure.
Feldspar is mined in seven states, but North Carolina produces the majority of thenation's total. It is mined primarily by open pit quarry techniques. The data in this report forfeldspar mining are based on open pit mining. The deposit material is removed from the quarryand crushed. The crushed material is then sent through flotation processes to remove minerals,to lower the iron content, and to purify the feldspar to glass-grade products. A conceptual flow
Section 4.0 Summary LCI of Glass Containers
4-14
diagram is shown in Figure 4-7. The feldspar is used in the manufacture of glass in the form of asilica mixture or as a quartz.
The majority of the nonfeldspar material recovered with this mineral is sold as acoproduct. The remainder of the material is placed in settling ponds and used for land cover. Therefore, no solid waste is associated with the mining and processing of feldspar (personalcommunications, with Richard Phillips, N.C. Geological Survey Division of Natural Resources,February 1993, and R. Lee Astin, State of Georgia, February 1993). The air pollution generatedis primarily particulates produced during the mining and crude ore processing.
4.2.3 Cullet (In-house)
In-house cullet is melted in a glass furnace in a manner similar to the handling of virgininputs to a conventional batch operation. It is widely recognized that cullet melts at a lowertemperature than virgin glass materials. Because the glass furnace accounts for a large portion ofthe manufacturing energy for the container, any energy savings in the furnace can significantlyaffect the total energy demand. Cullet generated in-house is returned to the furnace and accountsfor approximately 8 percent of the total raw material requirements with an estimated 10 percentloss of material (Fredonia Group, Inc., 1990).
4.2.4 Cullet (Postconsumer)
Although in-house scrap has been the major source of cullet for many plants, mandatorydeposit conditions and more active collection programs have increased the amount ofpostconsumer cullet recovered. Postconsumer cullet must be recovered, sorted, and crushedbefore it is added to the primary material. The data for these steps are not included in the tablessince these steps are included as separate modules of the decision support tool. We do not haveindividual data for making glass with cullet versus primary materials; however, an industrysource estimates that, for every 1 percent of cullet added to primary glass, there is a 0.4 percentreduction in energy requirements. This rule-of-thumb is considered true up to 50 percent cullet,then the energy reduction per 1 percent becomes 0.2 percent (personal communication, withRobert Towles, Owens-Illinois, Glass Manufacturing Division, September 1997.). All otherparameters (transportation, emissions, etc.) are assumed to remain unchanged with the use ofsecondary material.
4.2.5 Glass Container Manufacture
Glass is manufactured by mixing glass sand, limestone, soda ash, feldspar, small amountsof other minerals, and cullet into a homogenous mixture, which is then fed to the meltingfurnace. This is typically a natural gas-fired, continuous melting, regenerative furnace. Fuel isconserved by using brick checkers to collect furnace exhaust gas heat, then using the hotcheckers to preheat the furnace combustion air. The molten glass is directed to formingmachines where it is cut into sections called gobs and shaped into containers. The container isfinished, annealed, inspected, and then prepared for shipment.
The melting furnace contributes over 99 percent of the total air emissions from a glassplant, including particulates, sulfur oxides, and nitrogen oxides. Particulates and selenium,
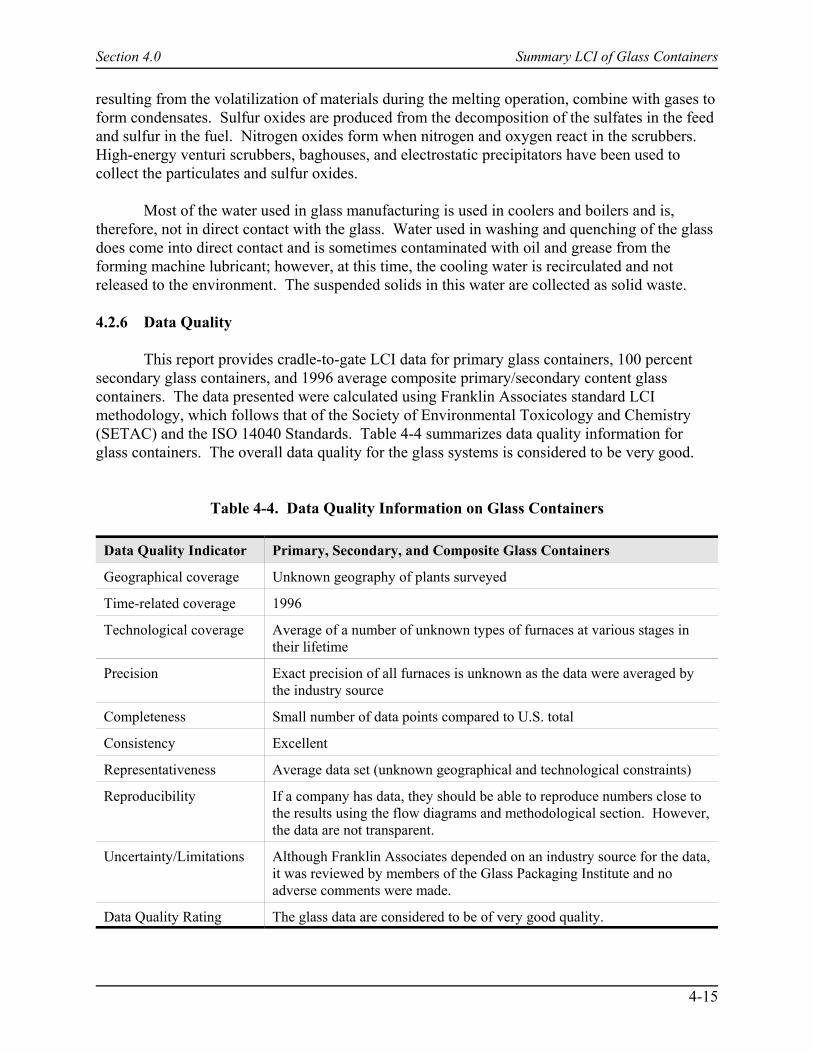
Section 4.0 Summary LCI of Glass Containers
4-15
resulting from the volatilization of materials during the melting operation, combine with gases toform condensates. Sulfur oxides are produced from the decomposition of the sulfates in the feedand sulfur in the fuel. Nitrogen oxides form when nitrogen and oxygen react in the scrubbers. High-energy venturi scrubbers, baghouses, and electrostatic precipitators have been used tocollect the particulates and sulfur oxides.
Most of the water used in glass manufacturing is used in coolers and boilers and is,therefore, not in direct contact with the glass. Water used in washing and quenching of the glassdoes come into direct contact and is sometimes contaminated with oil and grease from theforming machine lubricant; however, at this time, the cooling water is recirculated and notreleased to the environment. The suspended solids in this water are collected as solid waste.
4.2.6 Data Quality
This report provides cradle-to-gate LCI data for primary glass containers, 100 percentsecondary glass containers, and 1996 average composite primary/secondary content glasscontainers. The data presented were calculated using Franklin Associates standard LCImethodology, which follows that of the Society of Environmental Toxicology and Chemistry(SETAC) and the ISO 14040 Standards. Table 4-4 summarizes data quality information forglass containers. The overall data quality for the glass systems is considered to be very good.
Table 4-4. Data Quality Information on Glass Containers
Data Quality Indicator Primary, Secondary, and Composite Glass Containers
Geographical coverage Unknown geography of plants surveyed
Time-related coverage 1996
Technological coverage Average of a number of unknown types of furnaces at various stages intheir lifetime
Precision Exact precision of all furnaces is unknown as the data were averaged bythe industry source
Completeness Small number of data points compared to U.S. total
Consistency Excellent
Representativeness Average data set (unknown geographical and technological constraints)
Reproducibility If a company has data, they should be able to reproduce numbers close tothe results using the flow diagrams and methodological section. However,the data are not transparent.
Uncertainty/Limitations Although Franklin Associates depended on an industry source for the data,it was reviewed by members of the Glass Packaging Institute and noadverse comments were made.
Data Quality Rating The glass data are considered to be of very good quality.
Section 4.0 Summary LCI of Glass Containers
4-16
4.3 References
Astin, R. L. 1993. Conversation with R. Lee Astin, State of Georgia. Atlanta, GA. February,1993.
Franklin Associates, Ltd. 2000. A Life Cycle Inventory of Linerboard & Medium Rolls,Newsprint Rolls, Aluminum Sheet, and Glass Containers. Prepared for Research TriangleInstitute, Research Triangle Park, NC. January.
Fredonia Group, Inc. 1990. Recycling Times. October 23, pg. 3.
National Stone Association. 1991. The Aggregate Handbook. Washington, DC.
Phillips, R. Personal communication with Richard Phillips, N.C. Geological Survey Division ofNatural Resources. Raleigh, NC. February 1993.
Towles, R. Personal communication with Robert Towles, Owens - Illinois, Glass ManufacturingDivision. Toledo, OH. September 1997.
U.S. Bureau of Mines (BOM). 1984. Mineral Facts and Problems. U.S. Department ofInterior. Washington, DC.
U.S. Bureau of Mines (BOM). 1993. Minerals Yearbook. U.S. Department of Interior. Washington, DC.
Section 5.0 Summary LCI of Paper Products
5-1
5.0 Summary LCI of Paper Products5.1 Introduction
This chapter presents cradle-to-gate LCI data for the production of rolls of primary andsecondary paper for the following paper categories.
# corrugated linerboard and medium# newsprint# office paper# textbook paper # magazine/third-class mail paper # telephone book paper.
The LCI results include energy and emissions from raw materials extraction throughproduction of 1 ton of paper rolls but do not include the production of specific paper products(e.g., corrugated boxes), use, or disposal portions of a traditional LCI. For each profile, processflow diagrams and information on production processes are provided, LCI results are presented,and data quality is discussed. Also, the secondary data sets do not include data for thecollection, baling, and transport of discarded paper. Data for these activities is included inseparate modules of the MSW-DST and are captured in any waste management strategy usingrecycling.
Data from Franklin Associates, Ltd. in-house data base were used to represent the LCIprofiles for corrugated linerboard and medium and newsprint. Data from EnvironmentalDefense Fund’s (EDF) White Paper 10A (EDF, 1995c) were used to represent the LCI profilesfor office, textbook, and magazine paper. Data from EDF White Paper 3 were used to model theLCI profile for telephone book paper (EDF, 1995a). Because different data sources were used,there may be methodological differences between the practitioners that limit the comparability ofthe data sets.
All EDF data were modified to include Franklin Associates’ data on precombustionenergy and related emissions for fuels and electricity used at the paper mills, as specified in theEDF report (1995b). The model for precombustion fuel energy and their environmental releaseswas developed by Franklin Associates (1998). The allocation procedures employed are specifiedby EDF (1995c); however, White Paper 10A did not address the allocation procedure used. Allmaterial and water consumption, as well as environmental emissions, are presented as mass inpounds (lb), volume in U.S. gallons (gal), gaseous volume in cubic feet (ft3), and energy inBritish thermal units (Btu).

Section 5.0 Summary LCI of Paper Products
5-2
5.2 Rolls of Linerboard and Medium for Corrugated Containers
5.2.1 Introduction
This section contains LCI profiles for three different scenarios for producing rolls oflinerboard and medium for corrugated containers: primary, composite, and secondary. Processdescriptions for the production of rolls of linerboard and medium to be used as corrugatedcontainers (boxes) are provided. Also included are energy and environmental data tables for 1ton of primary, composite, and secondary linerboard and medium rolls. Data quality informationis provided in Section 5.2.11.
5.2.2 Linerboard and Medium Rolls Production
Corrugated containers are made by combining three paperboard layers—a kraft orsecondary paperboard inner liner and outer liner and a semichemical or secondary flutedpaperboard medium—using a starch-based adhesive to adhere all three layers. The resultingcontainerboard is then cut, scored, and possibly printed to form the finished box. The starchadhesive and finished box are not included in this profile.
The following sections describe the steps for the manufacture of primary linerboard andmedium for corrugated containers from raw materials extracted from the earth and from oldcorrugated containers (OCC). The actual manufacture of corrugated boxes and the starchadhesive used is not included in any data in this report. A primary corrugated box actuallycontains a minimum of 14.7 percent total secondary fiber content. Six percent of total secondaryfiber content is from OCC, which requires a recovery rate of 11 percent to have enoughsecondary fiber, due losses during processing. This minimum recycled content is the totalamount of OCC in the semichemical medium multiplied by the percent of that medium in thecontainer. Primary linerboard is used in this scenario. The semichemical medium almost alwayshas some OCC content in it, which is why there is some secondary content in the primarycorrugated system.
A composite corrugated box contains 45 percent total secondary fiber content and 39percent OCC content and has a recovery rate of 67 percent of the finished boxes (FranklinAssociates, 1998). The total secondary content is the total amount of OCC and kraft clippings inthe medium and liner multiplied by the percent of that medium or linerboard in the container. A100 percent secondary corrugated box contains 100 percent secondary fiber content and has arecovery rate of 100 percent. We have assumed a maximum of 100 percent OCC only for the100 percent secondary corrugated box as it is the best case scenario. It is possible for the box tocontain a percentage of double-lined kraft (DLK) in the semichemical medium and secondarymedium and linerboard.
The following steps in the production of linerboard and medium for corrugated boxes arediscussed.
# roundwood harvesting# wood residues production
Section 5.0 Summary LCI of Paper Products
5-3
# sodium sulfate mining and processing# soda ash production# corn starch manufacture# primary unbleached kraft paperboard production (linerboard)# semichemical paperboard production (medium)# secondary paperboard production (linerboard and medium).
Limestone mining and lime production data are presented in Section 3.0 and are notrepeated here. Sulfur mining and production, sulfuric acid production, salt mining, and sodiumhydroxide production are less than 1 percent of the system and have been omitted in this study.
For this profile, 1996 U.S. statistical data on linerboard and medium consumption at boxplants and recovered paper consumption are used to construct a composite corrugated container(not including the container production). Specific corrugated containers will contain varyingamounts of secondary fiber content (DLK and OCC).
Figure 5.2-1 shows the 1996 U.S. raw material and product flows of corrugated (AF&PA,1997a, 1997b, 1997c, 1998; personal communication, Franklin Associates with paper industrysources; Fibre Box Association, 1997). The figure highlights industrial scrap, which are DLKclippings from converting operations, and postconsumer fiber flows into the four categories ofpaperboard used in making containerboard—kraft linerboard, semichemical medium, secondarylinerboard, and secondary medium. The production amounts of the various paperboard categorieshave been adjusted from those reported by the paper industry to account for a small differencebetween the reported production of those paperboard categories and the consumption ofpaperboard at facilities making corrugated containers reported by another source. The box plantconsumption amount is from the Fibre Box Association Annual Report, but production statisticsfor the containerboard are from Paper, Paperboard, and Wood Pulp by the American Forest andPaper Association (AF&PA). These numbers were different, so the difference between theconsumption and production was split (using a straight average) between each type of linerboardand medium so that the production amount now equals the consumption amount.
The relevant characteristics of 1996 U.S. containerboard derived from Figure 5.2-1 aresummarized in Table 5.2-1. Figure 5.2-2 is a flow diagram for producing 1 ton of primary fiberlinerboard and medium for corrugated boxes. The flow diagram for producing 1 ton ofcomposite linerboard and medium for corrugated boxes is presented in Figure 5.2-3. Figure 5.2-4 shows the flow diagram for producing 1 ton of secondary corrugated boxes. Table5.2-2 presents the energy and emissions data for producing 1 ton of primary linerboard andmedium for corrugated boxes. The data exclude OCC collection, baling, and transportationsteps because these are included in separate modules of the MSW-DST. The energy andemissions data for producing 1 ton of secondary linerboard and medium for corrugated boxes areshown in Table 5.2-3. The energy and emissions data for producing 1 ton of compositelinerboard and medium for corrugated boxes are shown in Table 5.2-4. Tables 5.2-2 through5.2-4 include a CO2 credit for the sequestration of CO2 within the product and for the wood usedas fuel. The wood used as fuel was calculated from the mass balance—input wood minus outputproduct. The carbon content of wood is 86 percent. This credit in netted out of the nonfossilCO2 value.
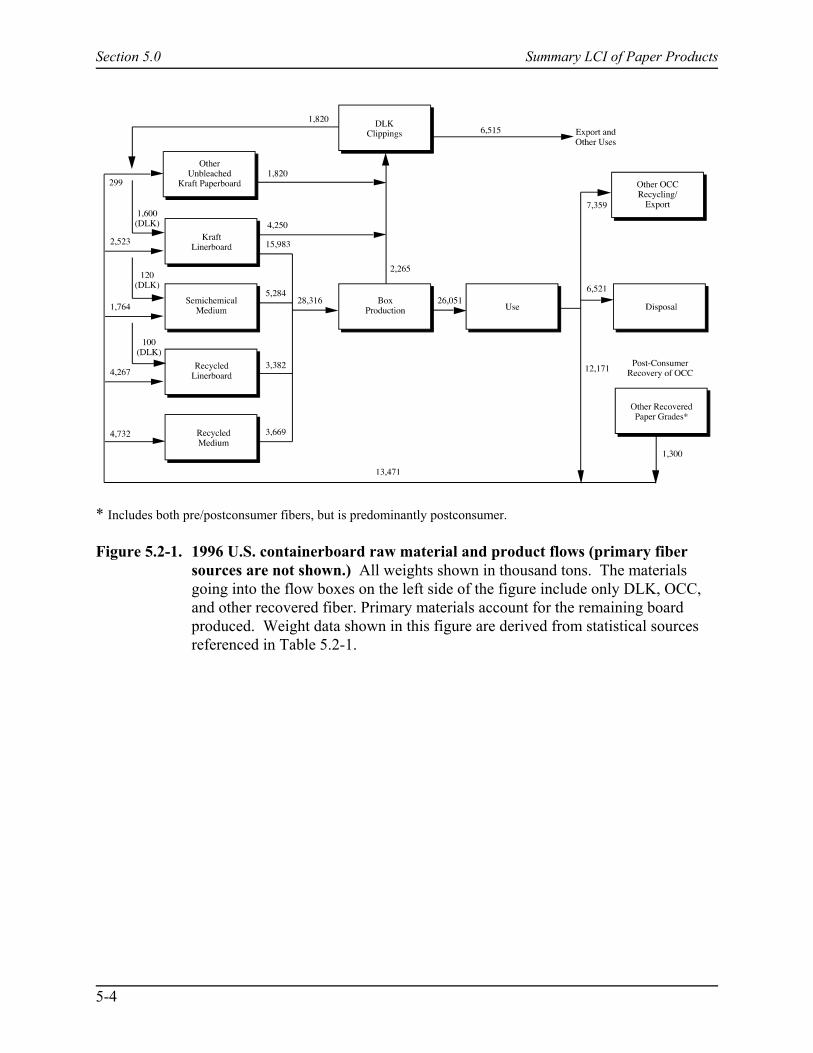
Section 5.0 Summary LCI of Paper Products
5-4
* Includes both pre/postconsumer fibers, but is predominantly postconsumer.
Figure 5.2-1. 1996 U.S. containerboard raw material and product flows (primary fibersources are not shown.) All weights shown in thousand tons. The materialsgoing into the flow boxes on the left side of the figure include only DLK, OCC,and other recovered fiber. Primary materials account for the remaining boardproduced. Weight data shown in this figure are derived from statistical sourcesreferenced in Table 5.2-1.
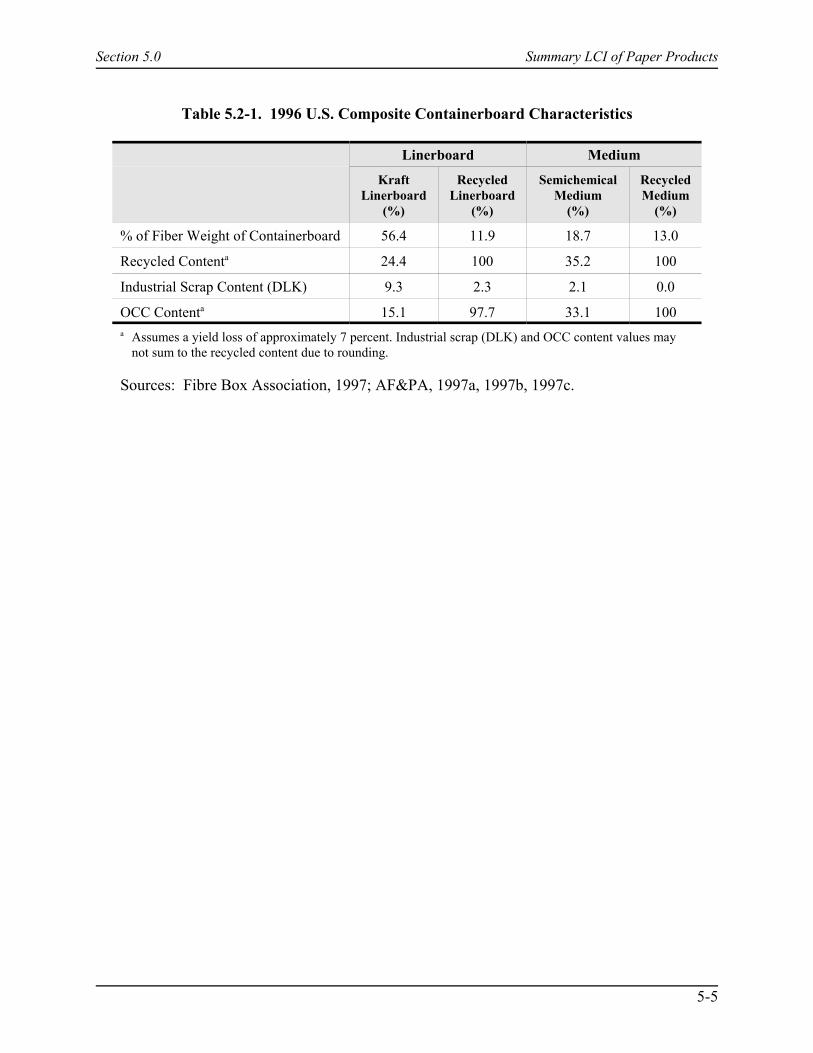
Section 5.0 Summary LCI of Paper Products
5-5
Table 5.2-1. 1996 U.S. Composite Containerboard Characteristics
Linerboard Medium
KraftLinerboard
(%)
RecycledLinerboard
(%)
SemichemicalMedium
(%)
RecycledMedium
(%)
% of Fiber Weight of Containerboard 56.4 11.9 18.7 13.0
Recycled Contenta 24.4 100 35.2 100
Industrial Scrap Content (DLK) 9.3 2.3 2.1 0.0
OCC Contenta 15.1 97.7 33.1 100a Assumes a yield loss of approximately 7 percent. Industrial scrap (DLK) and OCC content values may
not sum to the recycled content due to rounding.
Sources: Fibre Box Association, 1997; AF&PA, 1997a, 1997b, 1997c.

Section 5.0 Summary LCI of Paper Products
5-6
* Managed and/or unmanaged forest.
Figure 5.2-2. Process flow diagram for producing 1 ton of primary linerboard and mediumrolls for corrugated containers. (The system presented here represents aminimum recycled content of 14.7 percent.) All weights shown in pounds. Numbers in parentheses represent bone-dry weight of wood.

Section 5.0 Summary LCI of Paper Products
5-7
*Managed and/or unmanaged forest.
Figure 5.2-3. Process flow diagram for producing 1 ton of composite linerboard andmedium rolls for corrugated containers. (The composite system presented hererepresents an average secondary content of 45 percent.) All weights shown inpounds. Numbers in parentheses represent bone-dry weight of wood.

Section 5.0 Summary LCI of Paper Products
5-8
Figure 5.2-4. Process flow diagram for producing 1 ton of secondary linerboard and medium rolls for corrugated containers.

Section 5.0 Summary LCI of Paper Products
5-9
Table 5.2-2. Data for Production of 1 Ton of Primary Linerand Medium for Corrugated Containers
Energy Usage UnitsTotal
(Base Units)Total
(106 Btu)Factor to
Convert to 106 Btu
Combustion Process EnergyElectricity kWh 3.37E+02 3.74E+00 1.11E-02Natural Gas cu ft 1.76E+03 1.81E+00 1.03E-03LPG gal 1.80E-03 1.70E-04 9.55E-02Coal lb 3.75E+02 4.18E+00 1.12E-02Distillate oil gal 3.20E-02 4.50E-03 1.39E-01Residual oil gal 8.60E-01 1.30E-01 1.50E-01Gasoline gal 2.40E-03 3.10E-04 1.25E-01Diesel gal 2.17E+00 3.00E-01 1.39E-01Wood Btu 1.54E+07 1.54E+01 1.00E-06
Precombustion Process EnergyNatural Gas cu ft 3.90E+01 4.00E-02 1.03E-03Residual oil gal 4.50E-02 7.00E-03 1.50E-01Distillate oil gal 1.30E-02 2.00E-03 1.39E-01Gasoline gal 1.60E-02 2.00E-03 1.25E-01LPG gal 1.30E-03 1.20E-04 9.55E-02Coal lb 3.30E-04 3.70E-06 1.12E-02Nuclear lb U238 1.40E+00 1.40E-03 9.85E+02Hydropower Btu 2.30E+02 2.00E-04 1.00E-06Other Btu 2.00E+02 2.00E-04 1.00E-06
Combustion Transportation EnergyCombination Truck ton-miles 8.78E+02Diesel gal 8.30E+00 1.14E+00 1.39E-01Rail ton-miles 4.20E+02Diesel gal 1.01E+00 1.40E-01 1.39E-01Barge ton-miles 4.11E+00Diesel gal 8.20E-03 1.10E-03 1.39E-01Residual oil gal 3.30E-03 4.90E-04 1.50E-01Ocean freighter ton-miles 1.40E-01Diesel gal 1.40E+00 2.00E-06 1.39E-01Residual gal 3.00E-04 3.80E-05 1.50E-01Pipeline-natural gas ton-miles 1.90E-02Natural gas cu ft 4.00E-02 4.60E-05 1.03E-03Pipeline-petroleum products ton-miles 9.00E-03Electricity kWh 1.90E-04 2.10E-06 1.11E-02
Precombustion Transportation EnergyNatural Gas cu ft 1.37E+01 1.40E-02 1.03E-03Residual oil gal 2.00E-02 3.00E-03 1.50E-01Distillate oil gal 5.00E-03 6.00E-04 1.39E-01Gasoline gal 5.30E-03 7.00E-04 1.25E-01
(continued)
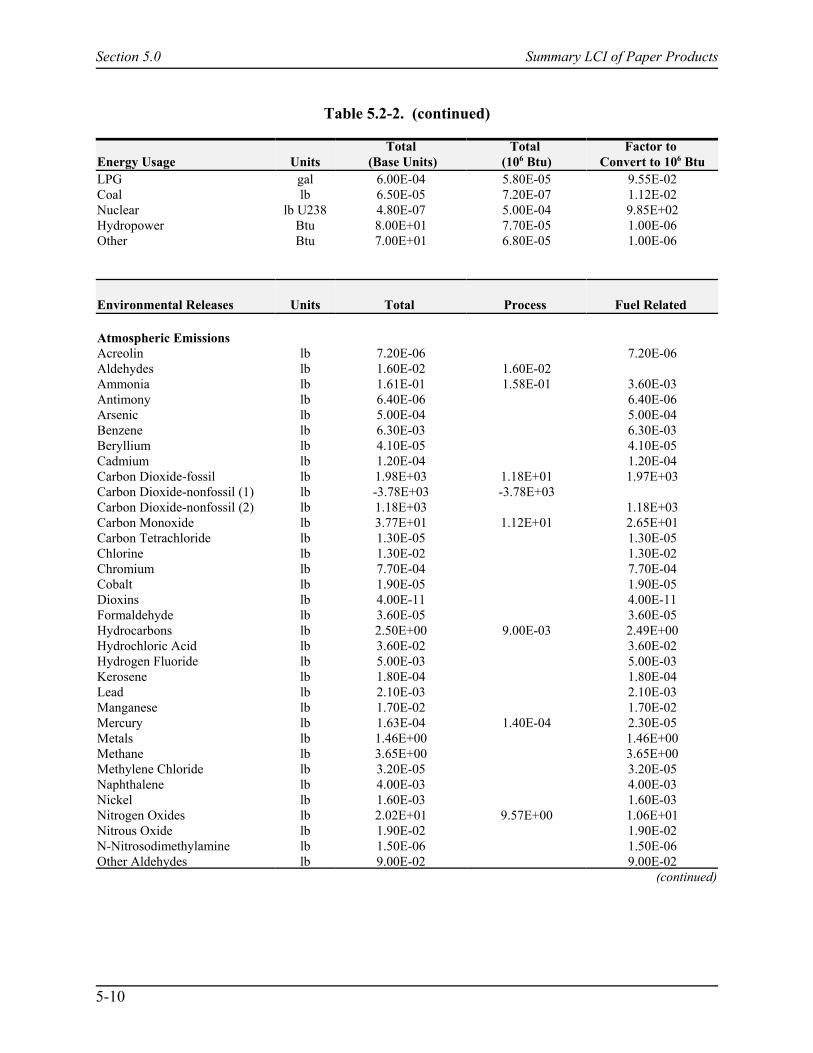
Table 5.2-2. (continued)
Section 5.0 Summary LCI of Paper Products
5-10
Energy Usage UnitsTotal
(Base Units)Total
(106 Btu)Factor to
Convert to 106 BtuLPG gal 6.00E-04 5.80E-05 9.55E-02Coal lb 6.50E-05 7.20E-07 1.12E-02Nuclear lb U238 4.80E-07 5.00E-04 9.85E+02Hydropower Btu 8.00E+01 7.70E-05 1.00E-06Other Btu 7.00E+01 6.80E-05 1.00E-06
Environmental Releases Units Total Process Fuel Related
Atmospheric EmissionsAcreolin lb 7.20E-06 7.20E-06Aldehydes lb 1.60E-02 1.60E-02Ammonia lb 1.61E-01 1.58E-01 3.60E-03Antimony lb 6.40E-06 6.40E-06Arsenic lb 5.00E-04 5.00E-04Benzene lb 6.30E-03 6.30E-03Beryllium lb 4.10E-05 4.10E-05Cadmium lb 1.20E-04 1.20E-04Carbon Dioxide-fossil lb 1.98E+03 1.18E+01 1.97E+03Carbon Dioxide-nonfossil (1) lb -3.78E+03 -3.78E+03Carbon Dioxide-nonfossil (2) lb 1.18E+03 1.18E+03Carbon Monoxide lb 3.77E+01 1.12E+01 2.65E+01Carbon Tetrachloride lb 1.30E-05 1.30E-05Chlorine lb 1.30E-02 1.30E-02Chromium lb 7.70E-04 7.70E-04Cobalt lb 1.90E-05 1.90E-05Dioxins lb 4.00E-11 4.00E-11Formaldehyde lb 3.60E-05 3.60E-05Hydrocarbons lb 2.50E+00 9.00E-03 2.49E+00Hydrochloric Acid lb 3.60E-02 3.60E-02Hydrogen Fluoride lb 5.00E-03 5.00E-03Kerosene lb 1.80E-04 1.80E-04Lead lb 2.10E-03 2.10E-03Manganese lb 1.70E-02 1.70E-02Mercury lb 1.63E-04 1.40E-04 2.30E-05Metals lb 1.46E+00 1.46E+00Methane lb 3.65E+00 3.65E+00Methylene Chloride lb 3.20E-05 3.20E-05Naphthalene lb 4.00E-03 4.00E-03Nickel lb 1.60E-03 1.60E-03Nitrogen Oxides lb 2.02E+01 9.57E+00 1.06E+01Nitrous Oxide lb 1.90E-02 1.90E-02N-Nitrosodimethylamine lb 1.50E-06 1.50E-06Other Aldehydes lb 9.00E-02 9.00E-02
(continued)

Table 5.2-2. (continued)
Section 5.0 Summary LCI of Paper Products
5-11
Environmental Releases Units Total Process Fuel Related
Other Organics lb 1.35E+00 1.35E+00Particulate lb 2.77E+01 2.46E+00 2.52E+01Perchloroethylene lb 6.90E-06 6.90E-06Phenols lb 6.60E-02 6.60E-02Radionuclides Ci 1.50E-04 1.50E-04Selenium lb 5.50E-05 5.50E-05Sulfur Oxides lb 3.10E+01 1.62E+01 1.48E+01Total Reduced Sulfur lb 7.90E-02 7.90E-02Trichloroethylene lb 6.80E-06 6.80E-06
Solid WastesAsh lb 4.24E+02 4.24E+02Sludge lb 5.06E+01 5.06E+01Unspecified lb 6.23E+01 6.23E+01
Waterborne WastesAcid lb 2.50E-03 2.50E-03 1.10E-07Aluminum lb 1.50E-01 1.50E-01Ammonia lb 5.86E-02 5.80E-02 5.90E-04BOD lb 3.82E+00 3.81E+00 9.00E-03Boron lb 5.30E-02 5.30E-02Cadmium lb 3.50E-04 3.50E-04Calcium lb 1.50E-04 1.50E-04Chloride lb 3.50E-01 3.50E-01Chromates lb 1.50E-05 1.50E-05Chromium lb 3.50E-04 1.10E-08 3.50E-04COD lb 2.19E+00 2.08E+00 1.10E-01Cyanide lb 6.02E-07 9.20E-08 5.10E-07Dissolved Solids lb 7.78E+00 8.00E-02 7.70E+00Fluorides lb 7.00E-04 7.00E-04Iron lb 7.20E-02 3.30E-05 7.20E-02Lead lb 2.00E-07 2.00E-07Manganese lb 4.50E-02 4.50E-02Mercury lb 2.70E-08 2.70E-08Metal Ion lb 2.40E-03 2.40E-03Nitrates lb 3.37E-03 3.30E-03 6.60E-05Nitrogen lb 3.10E-02 3.10E-02Oil lb 1.40E-01 5.80E-05 1.40E-01Other Organics lb 3.20E-02 3.20E-02Phenol lb 8.04E-06 2.40E-07 7.80E-06Phosphates lb 6.61E+01 1.30E-01 6.60E+01Phosphorus lb 8.80E-02 8.80E-02Sodium lb 2.80E-04 2.80E-04
(continued)

Table 5.2-2. (concluded)
Section 5.0 Summary LCI of Paper Products
5-12
Environmental Releases Units Total Process Fuel Related
Sulfates lb 3.50E-01 3.50E-01Sulfides lb 1.60E-05 1.60E-05Sulfuric Acid lb 1.30E-02 1.30E-02Suspended Solids lb 6.00E+00 4.98E+00 1.02E+00Zinc lb 2.20E+00 2.20E+00 1.20E-04
* Liner and medium for corrugated boxes are always manufactured with some secondary content. The primarydata presented here represent the minimum possible secondary content of 14.7% and recycling level of 10.5%.
(1) Carbon dioxide credit was given for the ton of linerboard and medium produced (wood contains 86% carboncontent and 2.2 lb CO2/1 lb wood product).
(2) Carbon dioxide credit was given for the difference between the input wood and output product. It is possiblethat extra purchased wood products are used in the biomass furnace which are not accounted for in thiscalculation. (Wood contains 86% carbon content and 2.2 lb CO2/lb wood burned.)
Source: Franklin Associates, 2000.
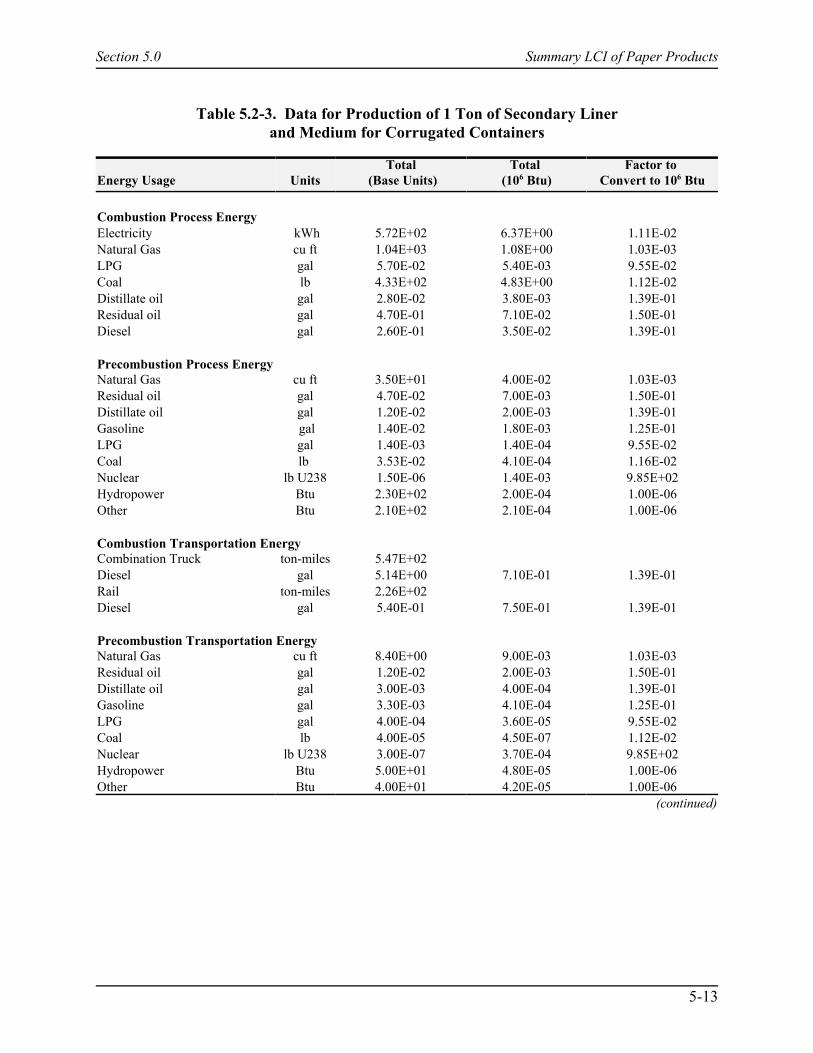
Section 5.0 Summary LCI of Paper Products
5-13
Table 5.2-3. Data for Production of 1 Ton of Secondary Linerand Medium for Corrugated Containers
Energy Usage UnitsTotal
(Base Units)Total
(106 Btu)Factor to
Convert to 106 Btu
Combustion Process EnergyElectricity kWh 5.72E+02 6.37E+00 1.11E-02Natural Gas cu ft 1.04E+03 1.08E+00 1.03E-03LPG gal 5.70E-02 5.40E-03 9.55E-02Coal lb 4.33E+02 4.83E+00 1.12E-02Distillate oil gal 2.80E-02 3.80E-03 1.39E-01Residual oil gal 4.70E-01 7.10E-02 1.50E-01Diesel gal 2.60E-01 3.50E-02 1.39E-01
Precombustion Process EnergyNatural Gas cu ft 3.50E+01 4.00E-02 1.03E-03Residual oil gal 4.70E-02 7.00E-03 1.50E-01Distillate oil gal 1.20E-02 2.00E-03 1.39E-01Gasoline gal 1.40E-02 1.80E-03 1.25E-01LPG gal 1.40E-03 1.40E-04 9.55E-02Coal lb 3.53E-02 4.10E-04 1.16E-02Nuclear lb U238 1.50E-06 1.40E-03 9.85E+02Hydropower Btu 2.30E+02 2.00E-04 1.00E-06Other Btu 2.10E+02 2.10E-04 1.00E-06
Combustion Transportation EnergyCombination Truck ton-miles 5.47E+02Diesel gal 5.14E+00 7.10E-01 1.39E-01Rail ton-miles 2.26E+02Diesel gal 5.40E-01 7.50E-01 1.39E-01
Precombustion Transportation EnergyNatural Gas cu ft 8.40E+00 9.00E-03 1.03E-03Residual oil gal 1.20E-02 2.00E-03 1.50E-01Distillate oil gal 3.00E-03 4.00E-04 1.39E-01Gasoline gal 3.30E-03 4.10E-04 1.25E-01LPG gal 4.00E-04 3.60E-05 9.55E-02Coal lb 4.00E-05 4.50E-07 1.12E-02Nuclear lb U238 3.00E-07 3.70E-04 9.85E+02Hydropower Btu 5.00E+01 4.80E-05 1.00E-06Other Btu 4.00E+01 4.20E-05 1.00E-06
(continued)
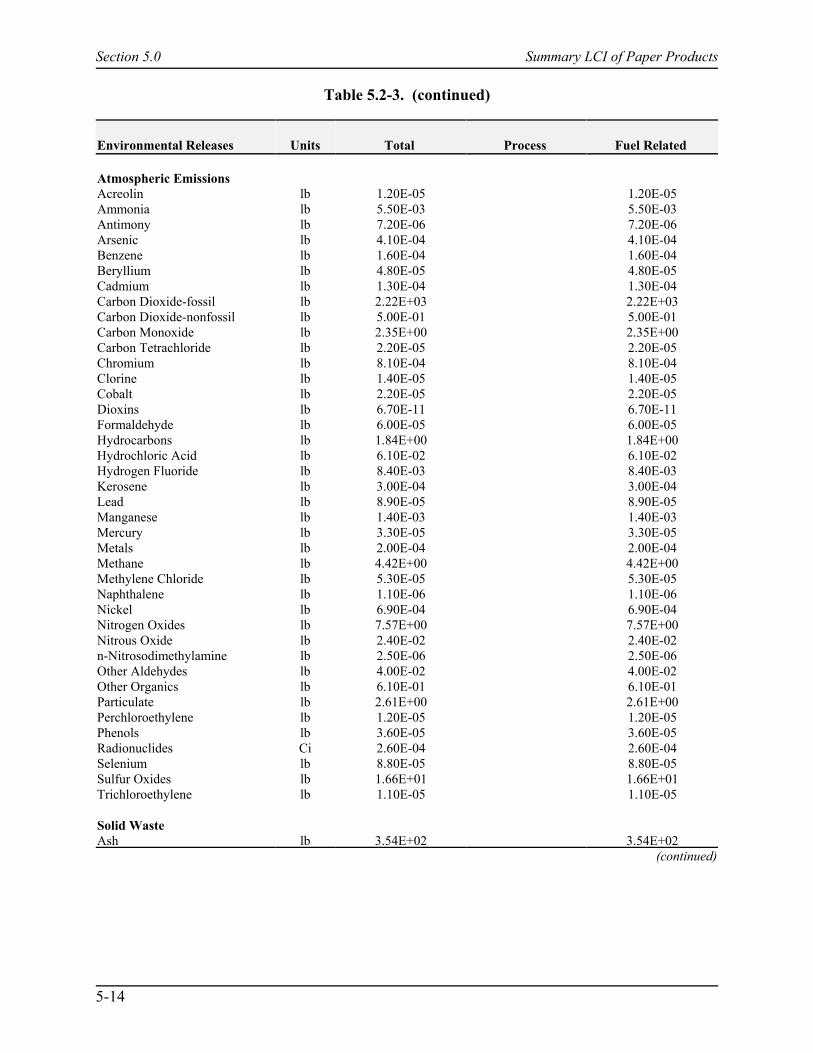
Table 5.2-3. (continued)
Section 5.0 Summary LCI of Paper Products
5-14
Environmental Releases Units Total Process Fuel Related
Atmospheric EmissionsAcreolin lb 1.20E-05 1.20E-05Ammonia lb 5.50E-03 5.50E-03Antimony lb 7.20E-06 7.20E-06Arsenic lb 4.10E-04 4.10E-04Benzene lb 1.60E-04 1.60E-04Beryllium lb 4.80E-05 4.80E-05Cadmium lb 1.30E-04 1.30E-04Carbon Dioxide-fossil lb 2.22E+03 2.22E+03Carbon Dioxide-nonfossil lb 5.00E-01 5.00E-01Carbon Monoxide lb 2.35E+00 2.35E+00Carbon Tetrachloride lb 2.20E-05 2.20E-05Chromium lb 8.10E-04 8.10E-04Clorine lb 1.40E-05 1.40E-05Cobalt lb 2.20E-05 2.20E-05Dioxins lb 6.70E-11 6.70E-11Formaldehyde lb 6.00E-05 6.00E-05Hydrocarbons lb 1.84E+00 1.84E+00Hydrochloric Acid lb 6.10E-02 6.10E-02Hydrogen Fluoride lb 8.40E-03 8.40E-03Kerosene lb 3.00E-04 3.00E-04Lead lb 8.90E-05 8.90E-05Manganese lb 1.40E-03 1.40E-03Mercury lb 3.30E-05 3.30E-05Metals lb 2.00E-04 2.00E-04Methane lb 4.42E+00 4.42E+00Methylene Chloride lb 5.30E-05 5.30E-05Naphthalene lb 1.10E-06 1.10E-06Nickel lb 6.90E-04 6.90E-04Nitrogen Oxides lb 7.57E+00 7.57E+00Nitrous Oxide lb 2.40E-02 2.40E-02n-Nitrosodimethylamine lb 2.50E-06 2.50E-06Other Aldehydes lb 4.00E-02 4.00E-02Other Organics lb 6.10E-01 6.10E-01Particulate lb 2.61E+00 2.61E+00Perchloroethylene lb 1.20E-05 1.20E-05Phenols lb 3.60E-05 3.60E-05Radionuclides Ci 2.60E-04 2.60E-04Selenium lb 8.80E-05 8.80E-05Sulfur Oxides lb 1.66E+01 1.66E+01Trichloroethylene lb 1.10E-05 1.10E-05
Solid WasteAsh lb 3.54E+02 3.54E+02
(continued)

Table 5.2-3. (concluded)
Section 5.0 Summary LCI of Paper Products
5-15
Environmental Releases Units Total Process Fuel Related
Sludge lb 4.18E+01 4.18E+01Unspecified lb 8.06E+01 8.06E+01
Waterborne WastesAcid lb 7.00E-08 7.00E-08Aluminum lb 2.00E-01 2.00E-01Ammonia lb 1.07E-02 1.00E-02 6.80E-04BOD lb 5.97E+00 5.96E+00 7.00E-03Boron lb 7.00E-02 7.00E-02Cadmium lb 3.00E-04 3.00E-04Calcium lb 2.60E-04 2.60E-04Chloride lb 3.00E-01 3.00E-01Chromates lb 1.60E-05 1.60E-05Chromium lb 3.00E-04 3.00E-04COD lb 9.45E+00 9.36E+00 9.00E-02Cyanide lb 4.30E-07 4.30E-07Dissolved Solids lb 7.13E+00 5.90E-01 6.54E+00Fluorides lb 1.20E-03 1.20E-03Iron lb 4.90E-01 3.90E-01 1.00E-01Lead lb 1.20E-07 1.20E-07Manganese lb 6.00E-02 6.00E-02Mercury lb 2.30E-08 2.30E-08Metal Ion lb 1.50E-03 1.50E-03Nitrates lb 1.10E-05 1.10E-05Oil lb 5.10E-01 3.90E-01 1.20E-01Other Organics lb 3.20E-02 3.20E-02Phenol lb 4.70E-03 4.70E-03 4.80E-06Phosphates lb 1.39E-01 1.30E-01 8.80E-03Sodium lb 4.70E-04 4.70E-04Sulfates lb 3.80E-01 3.80E-01Sulfides lb 3.90E-01 3.90E-01Sulfuric Acid lb 1.80E-02 1.80E-02Suspended Solids lb 7.21E+00 5.92E+00 1.29E+00Zinc lb 5.60E-03 5.50E-03 1.00E-04
Note: Materials collection, separation, and transport to a remanufacturing facility are handled by the collection,materials recovery facility, and transportation process models, respectively, of the MSW-DST.
Source: Franklin Associates, 2000.
Section 5.0 Summary LCI of Paper Products
5-16
5.2.3 Roundwood Harvesting
The technique of harvesting trees has become a highly mechanized process. Typically,trees are harvested by using a feller buncher to fell the wood and then pulling the wood to theroadside where branches are removed and the wood is cut to manageable lengths for loading ontrucks and delivery to the mill. After the wood is cleared from the forest, a variety of sitepreparations are used. On some sites, debris is manually removed from the forest beforereplanting, while other sites are left to grow back naturally. Some harvested sites are burned toremove any remaining debris before replanting. Emissions do result from clearing the site byburning, but this practice occurs infrequently compared to the mass of trees harvested. It isassumed that these emissions are negligible for this study (Franklin Associates, 2000).
In this study, trees harvested specifically for wood pulp production account for 53percent of the wood delivered to the paper mill. This amount varies for each paper mill. Theremainder comes from wood residues (sawdust and chips) generated by lumber production orother wood processing operations.
Roundwood debarking is generally done at the pulp mill or at a forest products site. Thebark from logs is removed to abate any chances of it interfering with the cooking process, whichin turn would reduce the quality of the pulp.
5.2.4 Wood Residues Production
Wood residues used in the production of paper are either mill residues generated bylumber mills or other wood processing operations or forest residues. It is estimated that forestproduct mill residues make up about 90 percent of the wood residues used by paper mills, andforest residues make up the remaining 10 percent.
The roundwood is sorted by diameter and then sent to a debarker. Depending on the kindof tree, its age, and the growth conditions, the bark of the tree might account for 10 to 20 percentof the trunk.
The higher the quality of pulp required, the lower the content of bark that can betolerated. Bark has a higher content of lignin and extractives and a much lower content ofcellulose than wood. The presence of bark leads to an increased consumption of cookingchemicals and reduces not only pulp yield, but also the technological properties and thebrightness of the pulp.
Drum barking is the most frequently used debarking process in the pulp industry today.In this process, small, short logs are continuously fed into a slightly inclined, horizontal-rotatingdrum. The bark is sheared off by friction between the logs and the inner walls of the drum. Thebark falls through slots in the drum wall onto a conveyor belt below the drum. Water sprayingimproves debarking, but this process is not employed today because the resulting wastewater ispolluted, and the heating value of the bark is reduced by the increased moisture content.

Section 5.0 Summary LCI of Paper Products
5-17
Table 5.2-4. Data for Production of 1 Ton of Composite (45 Percent Secondary/55 PercentPrimary) Liner and Medium for Corrugated Containers
Energy Usage UnitsTotal
(Base Units)Total
(106 Btu)Factor to
Convert to 106 Btu
Combustion Process EnergyElectricity kWh 4.58E+02 5.09E+00 1.11E-02Natural gas cu ft 4.54E+03 1.58E+00 1.03E-03LPG gal 3.00E-02 2.90E-03 9.55E-02Coal lb 4.36E+02 4.87E+00 1.12E-02Distillate oil gal 3.10E-02 4.30E-03 1.39E-01Residual oil gal 7.20E-01 1.10E-01 1.50E-01Gasoline gal 1.30E-03 1.60E-04 1.25E-01Diesel gal 1.37E+00 1.90E-01 1.39E-01Wood Btu 8.61E+06 8.61E+00 1.00E-06
Precombustion Process EnergyNatural gas cu ft 8.79E+01 9.10E-02 1.03E-03Residual oil gal 8.70E-02 1.30E-02 1.50E-01Distillate oil gal 1.90E-01 2.60E-02 1.39E-01Gasoline gal 4.40E-02 5.50E-03 1.25E-01LPG gal 2.00E-03 1.90E-04 9.55E-02Coal lb 9.10E-02 1.00E-03 1.16E-02Nuclear lb U238 1.00E-05 1.00E-02 9.85E+02Hydropower Btu 1.61E+03 1.60E-03 1.00E-06Other Btu 1.42E+03 1.40E-03 1.00E-06
Combustion Transportation EnergyCombination Truck ton-miles 7.72E+02Diesel gal 7.26E+00 1.01E+00 1.39E-01Rail ton-miles 3.31E+02Diesel gal 7.90E-01 1.10E-01 1.39E-01Barge ton-miles 1.89E+00Diesel gal 3.80E-03 5.20E-04 1.39E-01Residual oil gal 1.50E-03 2.30E-04 1.50E-01Ocean freighter ton-miles 8.40E-02Diesel gal 8.40E-06 1.20E-06 1.39E-01Residual gal 1.50E-04 2.30E-05 1.50E-01Pipeline-natural gas ton-miles 1.10E-02Natural gas cu ft 2.60E-02 2.70E-05 1.03E-03Pipeline-petroleum products ton-miles 5.00E-03Electricity kWh 1.10E-04 1.20E-06 1.11E-02
Precombustion Transportation EnergyNatural gas cu ft 2.28E+01 2.40E-02 1.03E-03Residual oil gal 6.90E-02 1.00E-02 1.50E-01Distillate oil gal 9.30E-03 1.30E-03 1.39E-01Gasoline gal 5.40E-03 6.70E-04 1.25E-01
(continued)

Table 5.2-4. (continued)
Section 5.0 Summary LCI of Paper Products
5-18
Energy Usage UnitsTotal
(Base Units)Total
(106 Btu)Factor to
Convert to 106 Btu
LPG gal 2.20E-03 2.10E-04 9.55E-02Coal lb 1.40E-04 1.60E-06 1.12E-02Nuclear lb U238 1.10E-06 1.00E-03 9.85E+02Hydropower Btu 1.70E+02 1.70E-04 1.00E-06Other Btu 1.50E+02 1.50E-04 1.00E-06
Environmental Releases Units Total Process Fuel Related
Atmospheric EmissionsAcreolin lb 9.70E-06 9.70E-06Aldehydes lb 9.50E-03 9.50E-03Ammonia lb 7.66E-02 7.20E-02 4.60E-03Antimony lb 7.00E-06 7.00E-06Arsenic lb 4.90E-04 4.90E-04Benzene lb 3.60E-03 3.60E-03Beryllium lb 4.80E-05 4.80E-05Cadmium lb 1.30E-04 1.30E-04Carbon Dioxide-fossil lb 2.22E+03 6.76E+00 2.22E+03 Carbon Dioxide-nonfossil (1) lb -2.79E+03 -2.79E+03Carbon Dioxide-nonfossil (2) lb 5.94E+02 5.94E+02Carbon Monoxide lb 2.25E+01 6.49E+00 1.60E+01Carbon Tetrachloride lb 1.80E-05 1.80E-05Chlorine lb 2.00E-10 2.00E-10Chromium lb 8.50E-04 8.50E-04Clorine lb 7.50E-03 7.50E-03Cobalt lb 2.10E-05 2.10E-05Dioxins lb 5.40E-11 5.40E-11Formaldehyde lb 4.80E+00 4.80E+00Hydrocarbons lb 2.32E+00 5.20E-03 2.31E+00Hydrochloric Acid lb 4.90E-02 4.00E-11 4.90E-02Hydrogen Fluoride lb 6.80E-03 6.80E-03Kerosene lb 2.40E-04 2.40E-04Lead lb 1.57E-03 3.70E-04 1.20E-03Manganese lb 1.00E-02 1.00E-02Mercury lb 1.08E-04 7.90E-05 2.90E-05Metals lb 8.20E-01 8.20E-01Methane lb 4.26E+00 4.26E+00Methylene Chloride lb 4.30E-05 4.30E-05Naphthalene lb 2.20E-03 2.20E-03Nickel lb 1.20E-03 1.20E-03Nitrogen Oxides lb 1.53E+01 5.57E+00 9.69E+00
(continued)

Table 5.2-4. (continued)
Section 5.0 Summary LCI of Paper Products
5-19
Environmental Releases Units Total Process Fuel Related
Nitrous Oxide lb 2.30E-02 2.30E-02n-Nitrosodimethylamine lb 2.10E-06 2.10E-06Other Aldehydes lb 7.20E-02 7.20E-02Other Organics lb 1.07E+00 1.07E+00Particulate lb 4.16E+00 1.44E+00 2.72E+00Perchloroethylene lb 9.30E-06 9.30E-06Phenols lb 3.70E-02 3.70E-02Radionuclides Ci 2.10E-03 2.10E-03Selenium lb 7.20E-05 7.20E-05Sulfur Oxides lb 2.60E+01 9.41E+00 1.66E+01Total Reduced Sulfur lb 4.60E-02 4.60E-02Trichloroethylene lb 9.20E-06 9.20E-06
Solid WasteAsh lb 4.15E+02 4.15E+02Sludge lb 4.48E+01 4.48E+01Unspecified lb 8.13E+01 8.13E+01
Waterborne WastesAcid lb 1.40E-03 1.40E-03 9.90E-08Aluminum lb 1.90E-01 1.90E-01Ammonia lb 3.97E-02 3.90E-02 6.50E-04BOD lb 4.96E+02 4.96E+02 8.50E-03Boron lb 6.50E-02 6.50E-02Cadmium lb 3.40E-04 3.40E-04Calcium lb 2.10E-04 2.10E-04Chloride lb 3.50E-01 3.50E-01Chromates lb 1.60E-05 1.60E-05Chromium lb 3.40E-04 6.70E-09 3.40E-04COD lb 1.65E+01 1.64E+01 1.10E-01Cyanide lb 5.54E-07 5.40E-08 5.00E-07Dissolved Solids lb 7.92E+00 3.50E-01 7.57E+00Fluorides lb 9.50E+00 9.50E+00Iron lb 2.89E-01 2.00E-01 8.90E-02Lead lb 1.80E-04 1.00E-12 1.80E-04Manganese lb 5.50E-02 5.50E-02Mercury lb 2.60E-08 7.30E-13 2.60E-08Metal Ion lb 2.10E-03 6.20E-09 2.10E-03Nickel lb 5.20E-13 5.20E-13Nitrates lb 9.02E+00 1.90E-02 9.00E+00Nitrogen lb 1.80E-02 1.80E-02Oil lb 3.40E-01 2.00E-01 1.40E-01Other Organics lb 3.40E-02 3.40E-02
(continued)
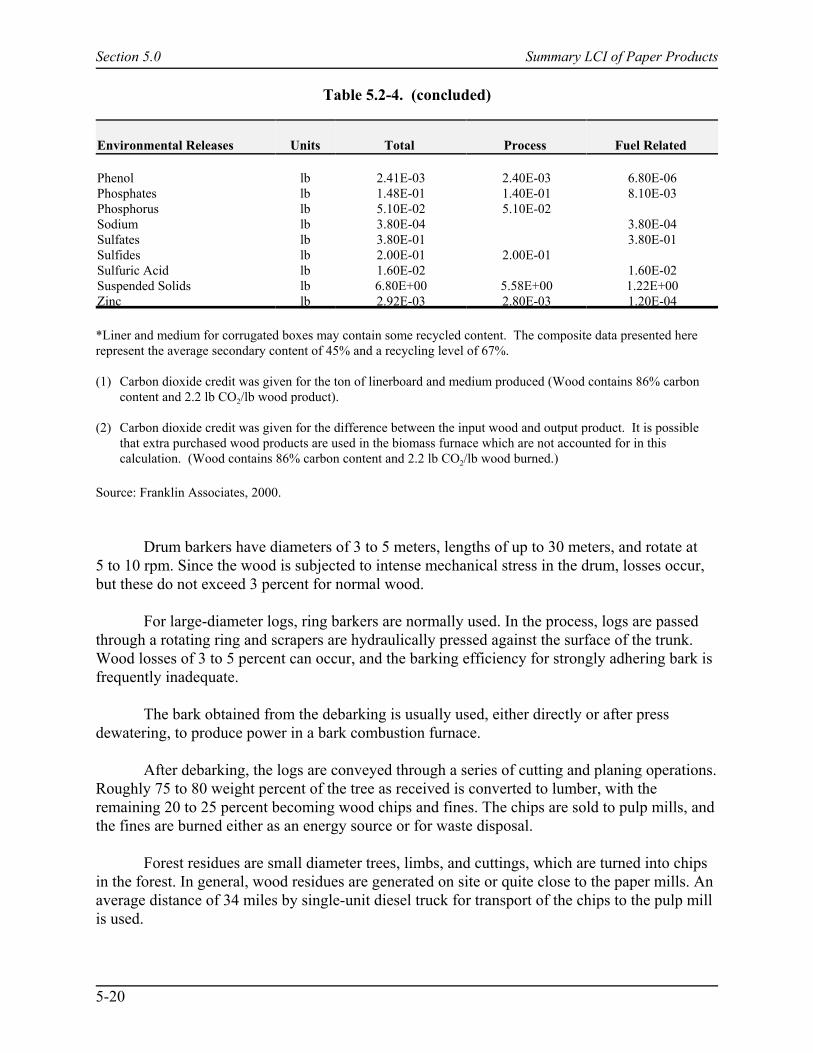
Table 5.2-4. (concluded)
Section 5.0 Summary LCI of Paper Products
5-20
Environmental Releases Units Total Process Fuel Related
Phenol lb 2.41E-03 2.40E-03 6.80E-06Phosphates lb 1.48E-01 1.40E-01 8.10E-03Phosphorus lb 5.10E-02 5.10E-02Sodium lb 3.80E-04 3.80E-04Sulfates lb 3.80E-01 3.80E-01Sulfides lb 2.00E-01 2.00E-01Sulfuric Acid lb 1.60E-02 1.60E-02Suspended Solids lb 6.80E+00 5.58E+00 1.22E+00Zinc lb 2.92E-03 2.80E-03 1.20E-04
*Liner and medium for corrugated boxes may contain some recycled content. The composite data presented hererepresent the average secondary content of 45% and a recycling level of 67%.
(1) Carbon dioxide credit was given for the ton of linerboard and medium produced (Wood contains 86% carboncontent and 2.2 lb CO2/lb wood product).
(2) Carbon dioxide credit was given for the difference between the input wood and output product. It is possiblethat extra purchased wood products are used in the biomass furnace which are not accounted for in thiscalculation. (Wood contains 86% carbon content and 2.2 lb CO2/lb wood burned.)
Source: Franklin Associates, 2000.
Drum barkers have diameters of 3 to 5 meters, lengths of up to 30 meters, and rotate at5 to 10 rpm. Since the wood is subjected to intense mechanical stress in the drum, losses occur,but these do not exceed 3 percent for normal wood.
For large-diameter logs, ring barkers are normally used. In the process, logs are passedthrough a rotating ring and scrapers are hydraulically pressed against the surface of the trunk.Wood losses of 3 to 5 percent can occur, and the barking efficiency for strongly adhering bark isfrequently inadequate.
The bark obtained from the debarking is usually used, either directly or after pressdewatering, to produce power in a bark combustion furnace.
After debarking, the logs are conveyed through a series of cutting and planing operations.Roughly 75 to 80 weight percent of the tree as received is converted to lumber, with theremaining 20 to 25 percent becoming wood chips and fines. The chips are sold to pulp mills, andthe fines are burned either as an energy source or for waste disposal.
Forest residues are small diameter trees, limbs, and cuttings, which are turned into chipsin the forest. In general, wood residues are generated on site or quite close to the paper mills. Anaverage distance of 34 miles by single-unit diesel truck for transport of the chips to the pulp millis used.
Section 5.0 Summary LCI of Paper Products
5-21
5.2.5 Sodium Sulfate Mining and Processing
Sodium sulfate is consumed in the Kraft pulping process. The upper levels of SearlesLake, California, the Great Salt Lake in Utah, and the brines of west Texas all contain sodiumsulfate. Typically, sodium sulfate crystals are removed from cooled brine. The crystals are thendissolved again and precipitated to achieve the desired purity.
5.2.6 Soda Ash Production
Soda ash (sodium carbonate) produced in the United States comes from natural soda ashobtained from trona or from alkaline brines. Almost all of the soda ash is mined from either theGreen River basin in Wyoming or from Searles Lake in California. Underground trona mining issimilar to coal mining. The most common methods are the room and pillar method and the longwall method.
In both of these processes, the material is undercut, drilled, blasted, crushed, and thentransported to the surface. Solution mining is currently under development as a more efficienttechnique. In the refining process, the predominant energy use is in the calcining of bicarbonateto produce carbonate (U.S. Bureau of Mines, 1989 and earlier years).
5.2.7 Corn Starch Manufacture
Corn starch is produced from corn by wet milling. The corn is soaked in steeping tankscontaining a solution of 0.3 percent sulfur dioxide in water to soften the kernel and dissolveinorganic components. This steep liquor is later concentrated for sale as a coproduct. Thesoftened corn is lightly milled to free the germ from the kernel. The germ is then processed foroil removal. The remaining corn fraction, mostly starch, protein, and hulls, is then heavilymilled. The starch is washed from the hulls, and the resulting starch slurry is separated, refined,washed, and dried.
Starch is a surface sizing material that fills in surface voids, thus reducing the rate ofliquid penetration in the dry paperboard.
5.2.8 Primary Unbleached Kraft Paperboard Production (Linerboard)
Kraft pulp is the most widely used type of wood pulp in the United States today,accounting for approximately 80 percent of the total wood pulp produced. The kraft pulpingprocess is based on chemical digestion of wood that has been previously debarked and chipped.The digester is a closed container that holds the wood chips and digestion liquors. The liquor ismainly an aqueous solution of chemicals including sodium sulfide and sodium hydroxide.
For digestion to take place, heat and pressure are applied to the mixture of wood andliquor. The digestion process delignifies the wood and removes other chemical components fromthe wood, leaving mostly wood fiber with some lignin and complex sugars.
Section 5.0 Summary LCI of Paper Products
5-22
In the kraft process, the used digestion liquor, called black liquor, is burned for energy.Because the liquor contains a high percentage of flammable wood components, it burns readily.The remaining digestion chemicals, called green liquor, are removed and reacted with quicklime.The resulting white liquor, containing sodium hydroxide and sodium sulfide, is returned to thedigester.
Combustion of black liquor and the bark removed from logs entering the mill oftenprovides sufficient energy to operate a pulp mill. The black liquor that is burned in the recoveryfurnace is treated as fuel for the process.
After the wood pulp is “blown” from the digester by the steam used in the process, thepulp is washed free of the chemicals, screened, and refined for entry into the paper-formingsection of the mill.
The fiber is pumped to the paper machine as a very dilute suspension in water. To formthe paperboard, the fiber suspension drains onto a finely woven plastic or wire mesh belt, whichmoves over a series of vacuum boxes where the sheet is mechanically dewatered. Next, the sheetis transferred from the wire mesh to a synthetic fabric. This felt conveys the sheet to a pressureroll with an internal vacuum box designed to remove additional water. This same pressure rollalso transfers the web to the dryer. This operation is the final drying operation for the sheet. Thepaperboard (containing about 5 percent moisture) is then wound onto rolls.
5.2.9 Semichemical Paperboard Production (Medium)
Most of the increase in semichemical pulp production in the past 40 years has been madeusing nonsulfur semichemical processes, not only because of tightened environmentalregulations, but also because of higher yields and simpler recovery systems. There are threemajor pulping processes used to manufacture semichemical pulps in integrated as well as stand-alone semichemical pulp mills.
# Neutral sulfite (NSSC) process—uses sodium carbonate and sulfur or, in somecases, sodium sulfite purchased as a byproduct from a nearby chemical operationas the cooking chemical.
# Green liquor process—uses green liquor from the kraft recovery process as thecooking chemical.
# Nonsulfur process—uses a combination of sodium carbonate, sodium hydroxide,and traces of other proprietary chemicals to enhance the properties of the pulp.
Many semichemical operations integrated with kraft mills use green liquor from the kraftrecovery process as the cooking chemical. This allows integration of the semichemical cookingchemical preparation and recovery into the kraft recovery cycle. The quality of semichemicalpulp is superior when produced by the neutral sulfite process, but it produces less pulp per poundof wood. The pulp yields from wood in the semichemical pulping processes range from 75 to 88percent.
Section 5.0 Summary LCI of Paper Products
5-23
Semichemical pulp and paper mills purchase more energy in the form of fuel and/orelectrical energy than full chemical pulp mills. A relatively small part of the steam and electricalpower required to operate the pulp mill is generated by burning recovered chemicals. In contrast,kraft pulp mills burn black liquor as well as bark and wood wastes.
The data presented are based on two different processes—the nonsulfur process and theNSSC process. A market share average of 60 percent nonsulfur and 40 percent NSSC was usedin combining the data sets.
Semichemical paperboard typically contains some recycled fiber. The proportion ofrecycled fiber will vary for specific mills. For this study, the fibrous raw materials used by themills surveyed are very similar to the national averages for semichemical paperboard shown inTable 5.2-1.
5.2.10 Secondary Paperboard Production (Linerboard and Medium)
The collected wastepaper includes primarily OCC and DLK. Also, small amounts ofpostconsumer office wastepaper and old newspapers can be used. Typically, these products arerecycled by repulping shredded material.
In the repulping process, the recovered paper is mixed with water in a huge blender-likevat called a repulper. Blades at the bottom of the vat churn the water and beat the paper fiberaway from any coatings. As the repulper is drained, filters allow the paper fibers to pass through.The coating is screened off and disposed of. Much of the short fibers are also screened off of thepulp. The sludge can be collected from the repulper for beneficial uses, such as animal beddingor ground cover at landfills, or can be disposed of as solid waste.
The proportion of postconsumer fiber and industrial scrap consumed varies for specificsecondary paperboard mills. The fibrous raw materials used in this data set reflect the nationalaverages shown in Table 5.2-1.
5.2.11 Data Quality
Table 5.2-5 summarizes data quality information for corrugated linerboard and medium. Overall, the data are considered to be of very good quality.
5.3 Newsprint
5.3.1 Introduction
This section includes LCI profiles for newsprint production in three scenarios: productionof newsprint using primary fiber pulps (derived by three pulping processes); production ofnewsprint using 100 percent secondary fiber; and production of newsprint using the compositeprimary and secondary fiber content for the U.S. for 1996. Newspaper production andpublishing are excluded because the boundary for this study is newsprint rolls. This sectionincludes a fiber
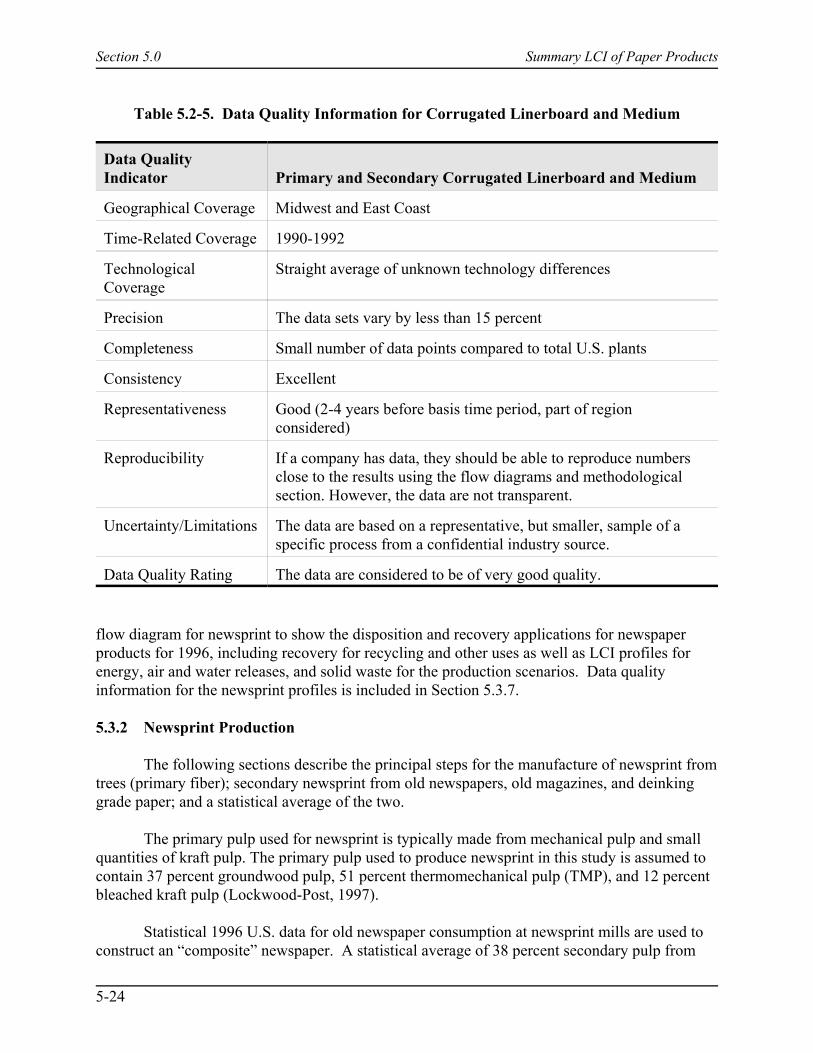
Section 5.0 Summary LCI of Paper Products
5-24
Table 5.2-5. Data Quality Information for Corrugated Linerboard and Medium
Data QualityIndicator Primary and Secondary Corrugated Linerboard and Medium
Geographical Coverage Midwest and East Coast
Time-Related Coverage 1990-1992
TechnologicalCoverage
Straight average of unknown technology differences
Precision The data sets vary by less than 15 percent
Completeness Small number of data points compared to total U.S. plants
Consistency Excellent
Representativeness Good (2-4 years before basis time period, part of regionconsidered)
Reproducibility If a company has data, they should be able to reproduce numbersclose to the results using the flow diagrams and methodologicalsection. However, the data are not transparent.
Uncertainty/Limitations The data are based on a representative, but smaller, sample of aspecific process from a confidential industry source.
Data Quality Rating The data are considered to be of very good quality.
flow diagram for newsprint to show the disposition and recovery applications for newspaperproducts for 1996, including recovery for recycling and other uses as well as LCI profiles forenergy, air and water releases, and solid waste for the production scenarios. Data qualityinformation for the newsprint profiles is included in Section 5.3.7.
5.3.2 Newsprint Production
The following sections describe the principal steps for the manufacture of newsprint fromtrees (primary fiber); secondary newsprint from old newspapers, old magazines, and deinkinggrade paper; and a statistical average of the two.
The primary pulp used for newsprint is typically made from mechanical pulp and smallquantities of kraft pulp. The primary pulp used to produce newsprint in this study is assumed tocontain 37 percent groundwood pulp, 51 percent thermomechanical pulp (TMP), and 12 percentbleached kraft pulp (Lockwood-Post, 1997).
Statistical 1996 U.S. data for old newspaper consumption at newsprint mills are used toconstruct an “composite” newspaper. A statistical average of 38 percent secondary pulp from

Section 5.0 Summary LCI of Paper Products
5-25
recovered newspapers was recycled into newsprint in 1996 (AF&PA, 1997a). A small amount ofold magazines and deinking grade paper is also used as postconsumer content in the secondarynewsprint. Figure 5.3-1 shows the 1996 U.S. fiber and product flows for newspapers (AF&PA,1997a; Recycling Advisory Council, 1992). The use of old magazines and other sources ofsecondary fiber besides old newspaper is not analyzed in this study. Therefore, values presentedfor the manufacture of newsprint from secondary fiber represent recycling of old newspapersonly.
As discussed, primary newsprint is typically made from mechanical pulps. The fiberproducts are brought into the stock storage chest where they are mixed with water and combinedwith other pulps to form a suspension (furnish), which is ready to be made into paper.
From stock preparation, the furnish is fed into the headbox. With the use of pressure, theheadbox deposits the furnish in a regulated fashion onto a wire mesh. From the headbox, thewire mesh moves over a series of vacuum boxes where the sheet is mechanically dewatered.
Next, the furnish sheet is transferred from the wire mesh to a synthetic fabric. This feltconveys the sheet to a pressure roll with an internal vacuum box designed to remove additionalwater. This same pressure roll also transfers the web to the dryer. This operation is the finaldrying operation for the sheet.
Once the fiber has passed through the dryer, it has entered the “dry end” of thepapermaking operation. From the dryer, the paper is passed through calender rolls to soften andsmooth the paper and wound onto a large, bulk size reel (now referred to as a parent roll). As thefiber passes through the papermaking process, scrap or broke that is created is fed directly intothe holding chest underneath the machine to be repulped and sent back to the headbox. Thisinternally recycled scrap is referred to as machine broke.
The secondary pulp/newsprint production step has a 15 percent loss of fiber from thesystem (Recycling Advisory Council, 1992). Emissions for this process are estimations fromkraft and other paper production steps.
The following steps in the production of newsprint are discussed in the sections below.
# Mechanical pulp manufacture# TMP pulp manufacture# Deinked pulp manufacture# Bleaching agent production# Newsprint production.
Salt mining and sodium hydroxide production process descriptions are found in thealuminum sheet LCI profiles (Section 3.0) and are not repeated here. Process descriptions forroundwood harvesting, wood residues, soda ash, and kraft pulp/paper production are found inSection 5.2 and are not repeated here. Limestone mining, sulfur mining and production, andsulfuric acid production are less than 1 percent of the system and are considered negligible inthis study.
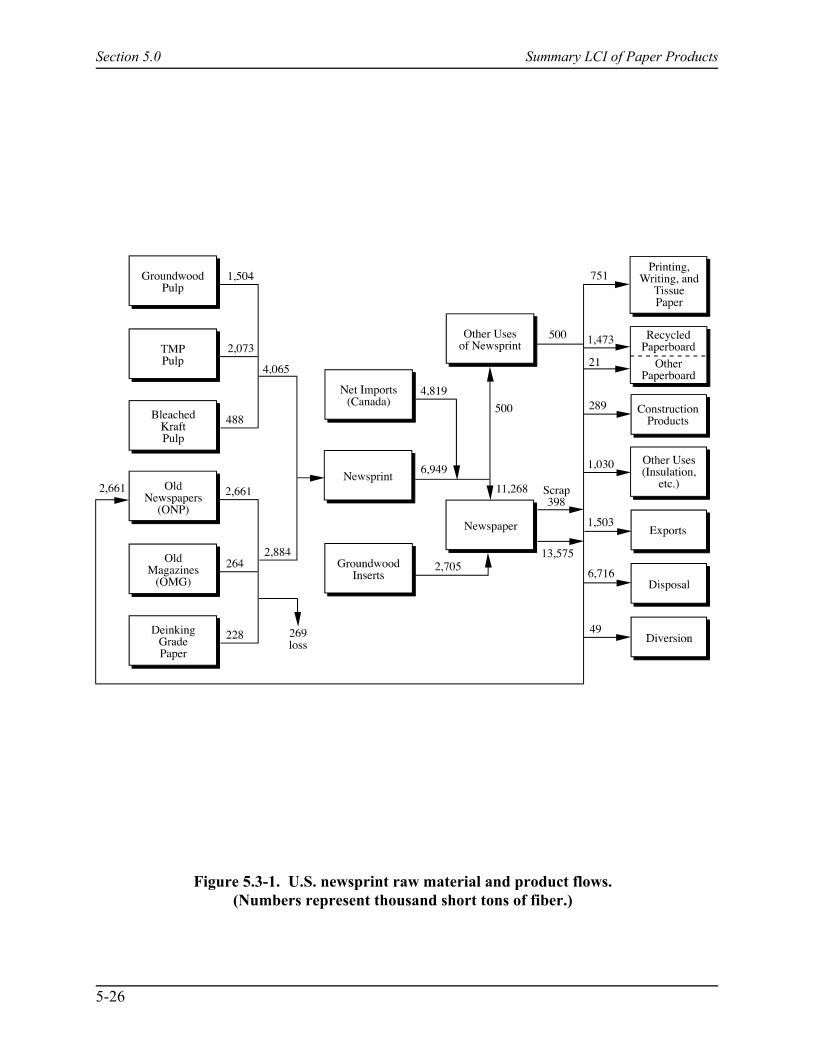
Section 5.0 Summary LCI of Paper Products
5-26
Figure 5.3-1. U.S. newsprint raw material and product flows.(Numbers represent thousand short tons of fiber.)
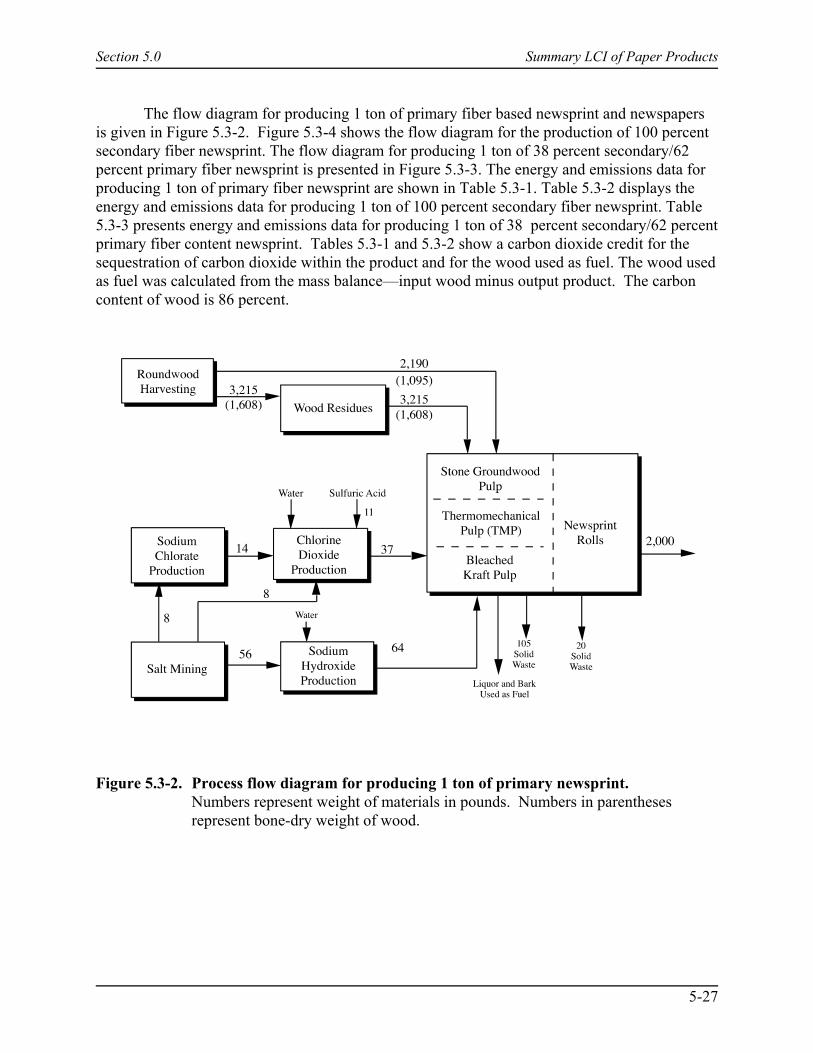
Section 5.0 Summary LCI of Paper Products
5-27
The flow diagram for producing 1 ton of primary fiber based newsprint and newspapersis given in Figure 5.3-2. Figure 5.3-4 shows the flow diagram for the production of 100 percentsecondary fiber newsprint. The flow diagram for producing 1 ton of 38 percent secondary/62percent primary fiber newsprint is presented in Figure 5.3-3. The energy and emissions data forproducing 1 ton of primary fiber newsprint are shown in Table 5.3-1. Table 5.3-2 displays theenergy and emissions data for producing 1 ton of 100 percent secondary fiber newsprint. Table5.3-3 presents energy and emissions data for producing 1 ton of 38 percent secondary/62 percentprimary fiber content newsprint. Tables 5.3-1 and 5.3-2 show a carbon dioxide credit for thesequestration of carbon dioxide within the product and for the wood used as fuel. The wood usedas fuel was calculated from the mass balance—input wood minus output product. The carboncontent of wood is 86 percent.
Figure 5.3-2. Process flow diagram for producing 1 ton of primary newsprint. Numbers represent weight of materials in pounds. Numbers in parenthesesrepresent bone-dry weight of wood.
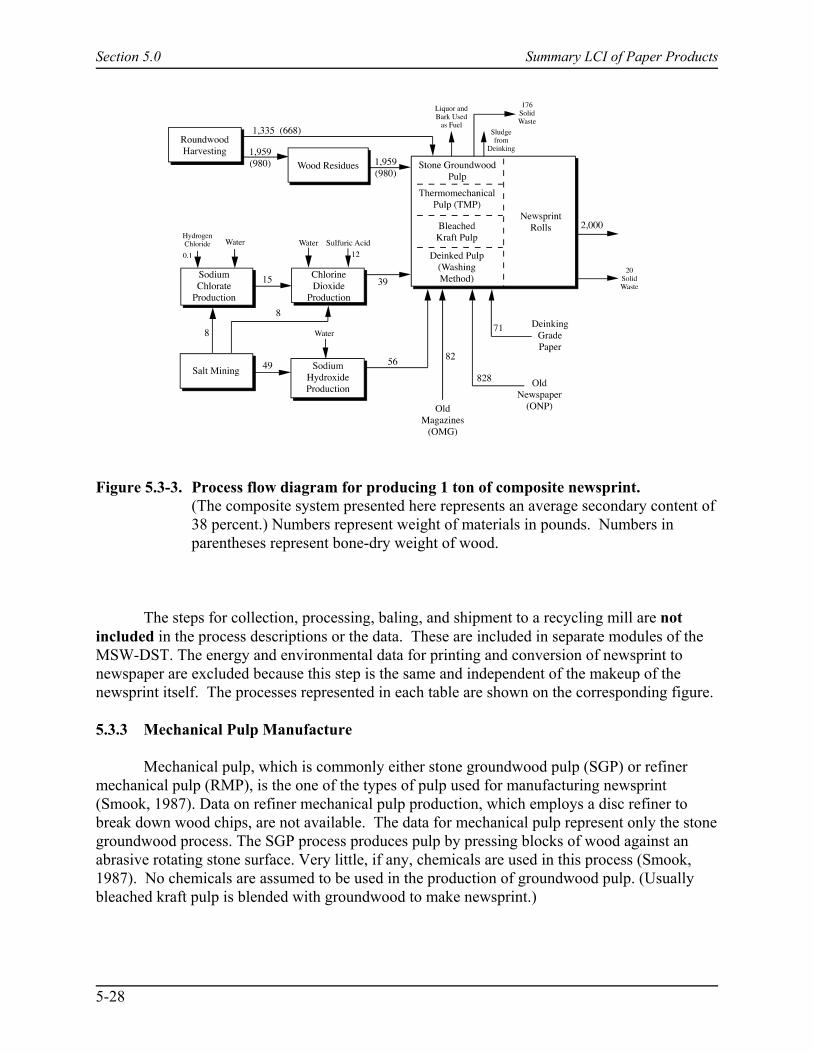
Section 5.0 Summary LCI of Paper Products
5-28
Figure 5.3-3. Process flow diagram for producing 1 ton of composite newsprint.(The composite system presented here represents an average secondary content of38 percent.) Numbers represent weight of materials in pounds. Numbers inparentheses represent bone-dry weight of wood.
The steps for collection, processing, baling, and shipment to a recycling mill are notincluded in the process descriptions or the data. These are included in separate modules of theMSW-DST. The energy and environmental data for printing and conversion of newsprint tonewspaper are excluded because this step is the same and independent of the makeup of thenewsprint itself. The processes represented in each table are shown on the corresponding figure.
5.3.3 Mechanical Pulp Manufacture
Mechanical pulp, which is commonly either stone groundwood pulp (SGP) or refinermechanical pulp (RMP), is the one of the types of pulp used for manufacturing newsprint(Smook, 1987). Data on refiner mechanical pulp production, which employs a disc refiner tobreak down wood chips, are not available. The data for mechanical pulp represent only the stonegroundwood process. The SGP process produces pulp by pressing blocks of wood against anabrasive rotating stone surface. Very little, if any, chemicals are used in this process (Smook,1987). No chemicals are assumed to be used in the production of groundwood pulp. (Usuallybleached kraft pulp is blended with groundwood to make newsprint.)
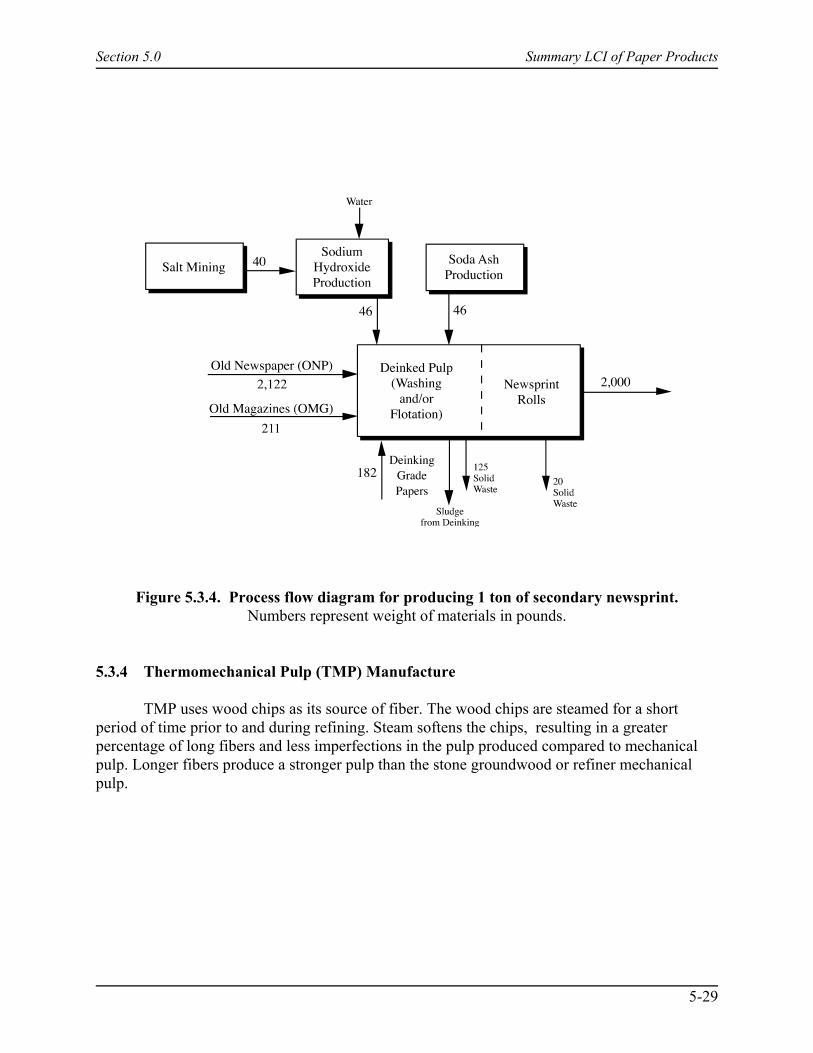
Section 5.0 Summary LCI of Paper Products
5-29
Figure 5.3.4. Process flow diagram for producing 1 ton of secondary newsprint.Numbers represent weight of materials in pounds.
5.3.4 Thermomechanical Pulp (TMP) Manufacture
TMP uses wood chips as its source of fiber. The wood chips are steamed for a shortperiod of time prior to and during refining. Steam softens the chips, resulting in a greaterpercentage of long fibers and less imperfections in the pulp produced compared to mechanicalpulp. Longer fibers produce a stronger pulp than the stone groundwood or refiner mechanicalpulp.

Section 5.0 Summary LCI of Paper Products
5-30
Table 5.3-1. Data for Production of 1 Ton of Primary Newsprint Rolls
Energy Usage UnitsTotal
(Base Units)Total
(106 Btu)Factor to
Convert to 106 Btu
Combustion Process EnergyElectricity kWh 2.07E+03 2.30E+01 1.11E-02Natural Gas cu ft 1.10E+04 1.13E+01 1.03E-03LPG gal 3.90E-05 3.70E-06 9.55E-02Coal lb 3.92E+01 4.40E-01 1.12E-02Residual oil gal 1.23E+00 1.80E-01 1.50E-01Gasoline gal 1.20E-03 1.50E-04 1.25E-01Diesel gal 1.94E+00 2.70E-01 1.39E-01Wood Btu 3.51E+06 3.51E+00 1.00E-06
Precombustion Process EnergyNatural Gas cu ft 1.66E+03 1.72E+00 1.03E-03Residual oil gal 7.70E-01 1.20E-01 1.50E-01Distillate oil gal 1.50E+00 2.10E-01 1.39E-01Gasoline gal 8.10E-01 1.00E-01 1.25E-01LPG gal 1.40E-02 1.30E-03 9.55E-02Coal lb 2.81E+01 3.10E-01 1.12E-02Nuclear lb U238 1.10E-04 1.10E-01 9.85E+02Hydropower Btu 1.78E+04 1.80E-02 1.00E-06Other Btu 1.58E+04 1.60E-02 1.00E-06
Combustion Transportation EnergyCombination Truck ton-miles 2.92E+02Diesel gal 2.75E+00 3.80E-01 1.39E-01Rail ton-miles 1.62E+02Diesel gal 3.90E-01 5.40E-02 1.39E-01Barge ton-miles 6.20E-01Diesel gal 1.20E-03 1.70E-04 1.39E-01Residual oil gal 5.00E-04 7.40E-05 1.50E-01
Precombustion Transportation EnergyNatural Gas cu ft 3.17E+01 3.30E-02 1.03E-03Residual oil gal 1.20E-01 1.90E-02 1.50E-01Distillate oil gal 1.40E-02 1.90E-03 1.39E-01Gasoline gal 4.00E-03 5.00E-04 1.25E-01LPG gal 4.10E-03 3.90E-04 9.55E-02Coal lb 4.10E-01 4.60E-03 1.12E-02Nuclear lb U238 1.70E-06 1.60E-03 9.85E+02Hydropower Btu 2.60E+02 2.60E-04 1.00E-06Other Btu 2.30E+02 2.30E-04 1.00E-06
(continued)
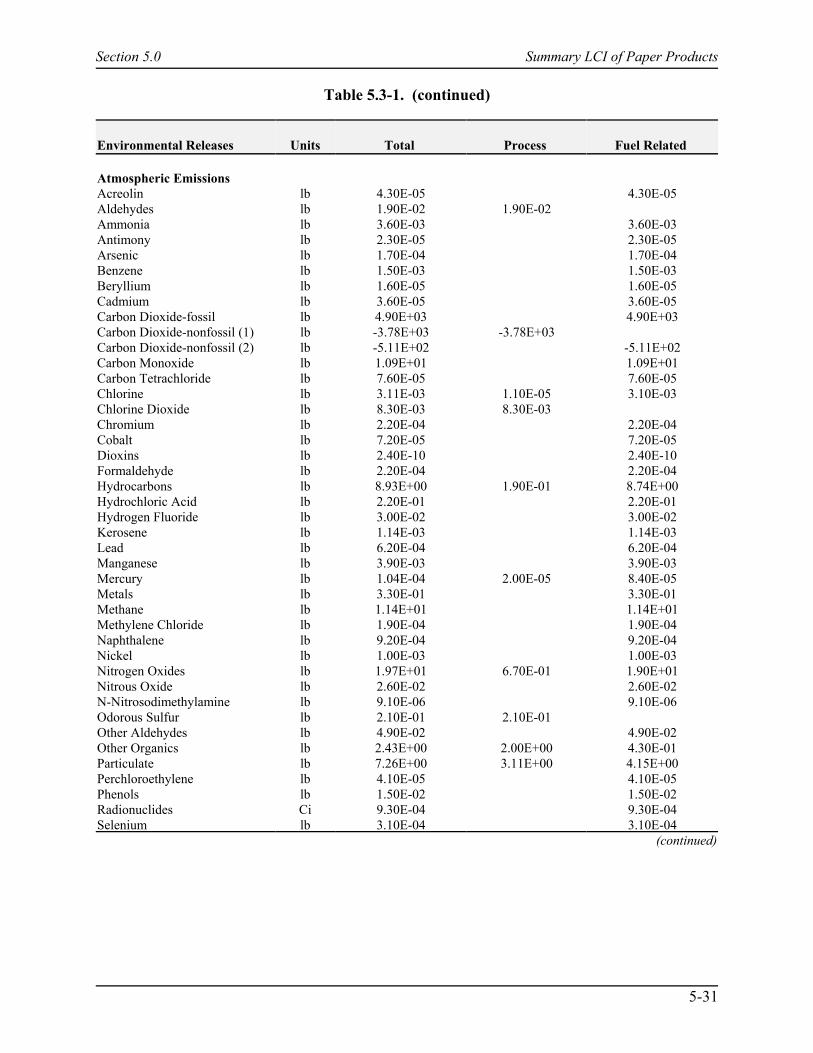
Table 5.3-1. (continued)
Section 5.0 Summary LCI of Paper Products
5-31
Environmental Releases Units Total Process Fuel Related
Atmospheric EmissionsAcreolin lb 4.30E-05 4.30E-05Aldehydes lb 1.90E-02 1.90E-02Ammonia lb 3.60E-03 3.60E-03Antimony lb 2.30E-05 2.30E-05Arsenic lb 1.70E-04 1.70E-04Benzene lb 1.50E-03 1.50E-03Beryllium lb 1.60E-05 1.60E-05Cadmium lb 3.60E-05 3.60E-05Carbon Dioxide-fossil lb 4.90E+03 4.90E+03Carbon Dioxide-nonfossil (1) lb -3.78E+03 -3.78E+03Carbon Dioxide-nonfossil (2) lb -5.11E+02 -5.11E+02Carbon Monoxide lb 1.09E+01 1.09E+01Carbon Tetrachloride lb 7.60E-05 7.60E-05Chlorine lb 3.11E-03 1.10E-05 3.10E-03Chlorine Dioxide lb 8.30E-03 8.30E-03Chromium lb 2.20E-04 2.20E-04Cobalt lb 7.20E-05 7.20E-05Dioxins lb 2.40E-10 2.40E-10Formaldehyde lb 2.20E-04 2.20E-04Hydrocarbons lb 8.93E+00 1.90E-01 8.74E+00Hydrochloric Acid lb 2.20E-01 2.20E-01Hydrogen Fluoride lb 3.00E-02 3.00E-02Kerosene lb 1.14E-03 1.14E-03Lead lb 6.20E-04 6.20E-04Manganese lb 3.90E-03 3.90E-03Mercury lb 1.04E-04 2.00E-05 8.40E-05Metals lb 3.30E-01 3.30E-01Methane lb 1.14E+01 1.14E+01Methylene Chloride lb 1.90E-04 1.90E-04Naphthalene lb 9.20E-04 9.20E-04Nickel lb 1.00E-03 1.00E-03Nitrogen Oxides lb 1.97E+01 6.70E-01 1.90E+01Nitrous Oxide lb 2.60E-02 2.60E-02N-Nitrosodimethylamine lb 9.10E-06 9.10E-06Odorous Sulfur lb 2.10E-01 2.10E-01Other Aldehydes lb 4.90E-02 4.90E-02Other Organics lb 2.43E+00 2.00E+00 4.30E-01Particulate lb 7.26E+00 3.11E+00 4.15E+00Perchloroethylene lb 4.10E-05 4.10E-05Phenols lb 1.50E-02 1.50E-02Radionuclides Ci 9.30E-04 9.30E-04Selenium lb 3.10E-04 3.10E-04
(continued)

Table 5.3-1. (concluded)
Section 5.0 Summary LCI of Paper Products
5-32
Environmental Releases Units Total Process Fuel Related
Sulfur Oxides lb 4.97E+01 1.32E+00 4.84E+01Trichloroethylene lb 4.10E-05 4.10E-05
Solid WastesAsh lb 6.68E+02 6.68E+02Sludge lb 5.28E+01 5.28E+01Unspecified lb 2.81E+01 2.81E+01
Waterborne WastesAcid lb 1.10E-07 1.10E-07Ammonia lb 2.60E-03 2.60E-03BOD lb 7.11E+00 7.06E+00 4.50E-02Boron lb 1.20E-01 1.20E-01Cadmium lb 2.10E-03 2.10E-03Calcium lb 9.20E-04 9.20E-04Chloride lb 2.07E+00 2.07E+00Chromates lb 4.90E-05 4.90E-05Chromium lb 2.10E-03 2.10E-03COD lb 2.20E+00 1.57E+00 6.30E-01Cyanide lb 3.00E-06 3.00E-06Dissolved Solids lb 4.54E+01 1.80E-01 4.52E+01Fluorides lb 4.20E-03 0.00E+00 4.20E-03Iron lb 1.70E-01 1.70E-01Lead lb 2.99E-06 2.80E-06 1.90E-07Manganese lb 9.80E-02 9.80E-02Mercury lb 2.15E-07 5.50E-08 1.60E-07Metal Ion lb 2.30E-03 2.30E-03Methanol lb 2.80E-02 2.80E-02Nickel lb 3.90E-08 3.90E-08Nitrates lb 4.00E-04 4.00E-04Oil lb 8.00E-01 8.00E-01Other Organics lb 1.50E-01 1.50E-01Phenol lb 8.02E-06 6.20E-07 7.40E-06Phosphates lb 1.50E-02 1.50E-02Sodium lb 1.70E-03 1.70E-03Sulfates lb 2.12E+00 2.12E+00Sulfides lb 5.30E-06 5.30E-06Sulfuric Acid lb 2.90E-02 2.90E-02Suspended Solids lb 1.38E+01 1.11E+01 2.71E+00Zinc lb 1.05E-03 3.50E-04 7.00E-04
(1) Carbon dioxide credit was given for the ton of newsprint produced (wood contains 86% carbon content and 2.2lb CO2/1 lb wood product).
(2) Carbon dioxide credit was given for the difference between the input wood and output product. It is possiblethat extra purchased wood products are used in the biomass furnace which are not accounted for in thiscalculation. (Wood contains 86% carbon content and 2.2 lb CO2/lb wood burned.)
Source: Franklin Associates, 2000.
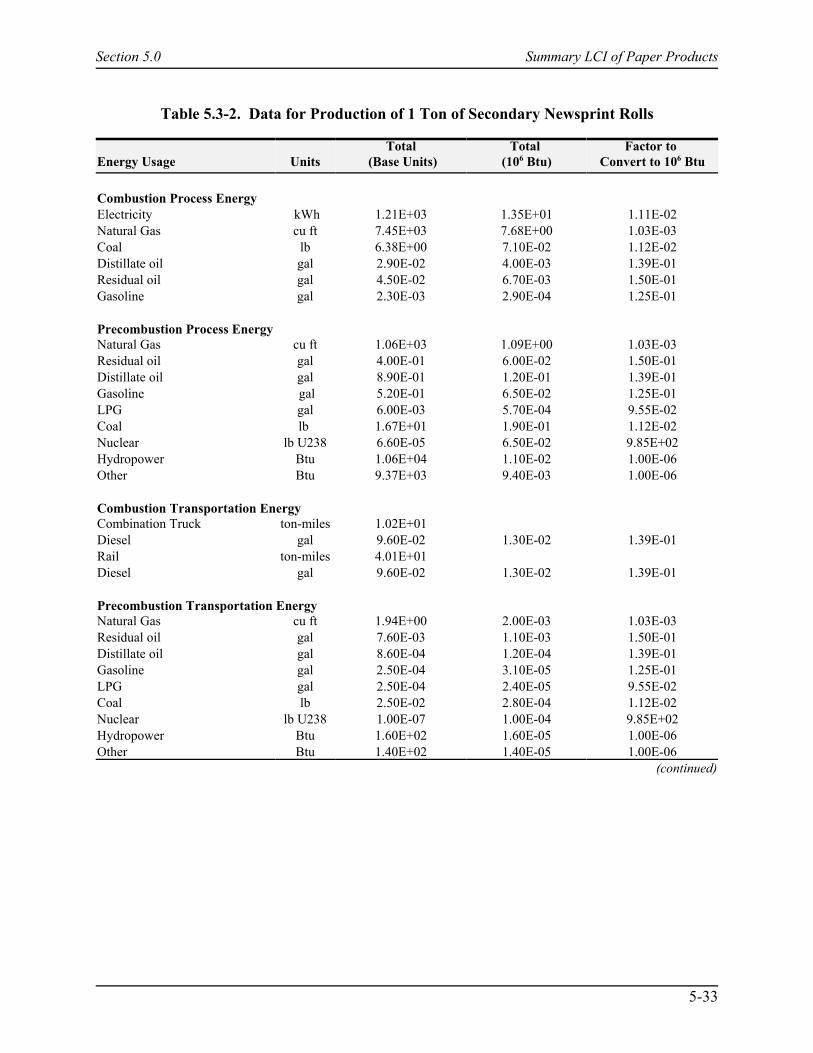
Section 5.0 Summary LCI of Paper Products
5-33
Table 5.3-2. Data for Production of 1 Ton of Secondary Newsprint Rolls
Energy Usage UnitsTotal
(Base Units)Total
(106 Btu)Factor to
Convert to 106 Btu
Combustion Process EnergyElectricity kWh 1.21E+03 1.35E+01 1.11E-02Natural Gas cu ft 7.45E+03 7.68E+00 1.03E-03Coal lb 6.38E+00 7.10E-02 1.12E-02Distillate oil gal 2.90E-02 4.00E-03 1.39E-01Residual oil gal 4.50E-02 6.70E-03 1.50E-01Gasoline gal 2.30E-03 2.90E-04 1.25E-01
Precombustion Process EnergyNatural Gas cu ft 1.06E+03 1.09E+00 1.03E-03Residual oil gal 4.00E-01 6.00E-02 1.50E-01Distillate oil gal 8.90E-01 1.20E-01 1.39E-01Gasoline gal 5.20E-01 6.50E-02 1.25E-01LPG gal 6.00E-03 5.70E-04 9.55E-02Coal lb 1.67E+01 1.90E-01 1.12E-02Nuclear lb U238 6.60E-05 6.50E-02 9.85E+02Hydropower Btu 1.06E+04 1.10E-02 1.00E-06Other Btu 9.37E+03 9.40E-03 1.00E-06
Combustion Transportation EnergyCombination Truck ton-miles 1.02E+01Diesel gal 9.60E-02 1.30E-02 1.39E-01Rail ton-miles 4.01E+01Diesel gal 9.60E-02 1.30E-02 1.39E-01
Precombustion Transportation EnergyNatural Gas cu ft 1.94E+00 2.00E-03 1.03E-03Residual oil gal 7.60E-03 1.10E-03 1.50E-01Distillate oil gal 8.60E-04 1.20E-04 1.39E-01Gasoline gal 2.50E-04 3.10E-05 1.25E-01LPG gal 2.50E-04 2.40E-05 9.55E-02Coal lb 2.50E-02 2.80E-04 1.12E-02Nuclear lb U238 1.00E-07 1.00E-04 9.85E+02Hydropower Btu 1.60E+02 1.60E-05 1.00E-06Other Btu 1.40E+02 1.40E-05 1.00E-06
(continued)

Table 5.3-2. (continued)
Section 5.0 Summary LCI of Paper Products
5-34
Environmental Releases Units Total Process Fuel Related
Atmospheric EmissionsAcreolin lb 2.50E-05 2.50E-05Ammonia lb 1.10E-02 1.10E-02Antimony lb 1.20E-05 1.20E-05Arsenic lb 6.20E-05 6.20E-05Benzene lb 2.60E-05 2.60E-05Beryllium lb 7.20E-06 7.20E-06Cadmium lb 1.00E-05 1.00E-05Carbon Dioxide-fossil lb 2.88E+03 2.88E+03Carbon Dioxide-nonfossil (2) lb 8.50E-01 8.50E-01Carbon Monoxide lb 3.09E+00 3.09E+00Carbon Tetrachloride lb 4.40E-05 4.40E-05Chlorine lb 1.58E-05 6.40E-06 9.40E-06Chromium lb 8.50E-05 8.50E-05Cobalt lb 3.70E-05 3.70E-05Dioxins lb 1.40E-10 1.40E-10Formaldehyde lb 1.30E-04 1.30E-04Hydrocarbons lb 5.38E+00 5.38E+00Hydrochloric Acid lb 1.30E-01 1.30E-01Hydrogen Fluoride lb 1.80E-02 1.80E-02Kerosene lb 6.30E-04 6.30E-04Lead lb 8.60E-05 8.60E-05Manganese lb 1.90E-04 1.90E-04Mercury lb 6.00E-05 1.20E-05 4.80E-05Metals lb 3.50E-04 3.50E-04Methane lb 7.00E+00 7.00E+00Methylene Chloride lb 1.10E-04 1.10E-04Naphthalene lb 2.10E-06 2.10E-06Nickel lb 3.80E-04 3.80E-04Nitrogen Oxides lb 1.02E+01 1.30E-03 1.02E+01Nitrous Oxide lb 1.50E-02 1.50E-02N-Nitrosodimethylamine lb 5.40E-06 5.40E-06Other Aldehydes lb 8.40E-03 8.40E-03Other Organics lb 2.03E+00 2.00E+00 2.60E-02Particulate lb 4.27E+00 2.02E+00 2.25E+00Perchloroethylene lb 2.40E-05 2.40E-05Phenols lb 7.20E-05 7.20E-05Radionuclides Ci 5.50E-04 5.50E-04Selenium lb 1.80E-04 1.80E-04Sulfur Oxides lb 2.98E+01 2.50E-05 2.98E+01Trichloroethylene lb 2.40E-05 2.40E-05
(continued)
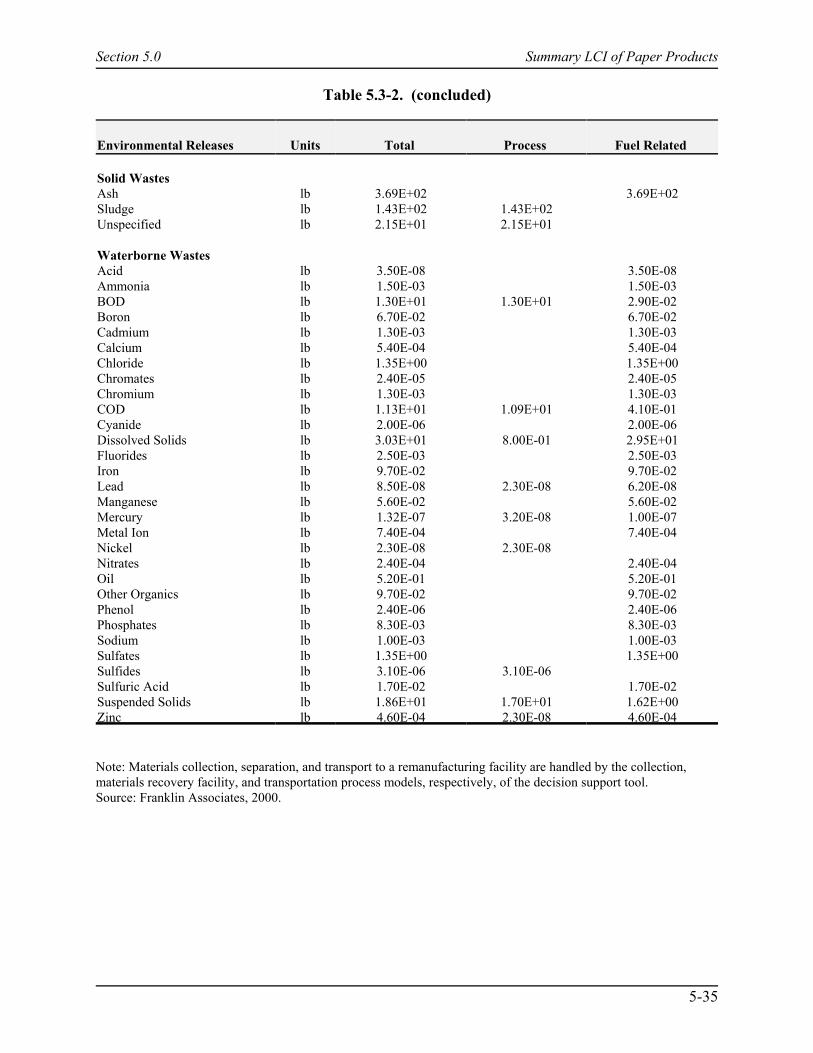
Table 5.3-2. (concluded)
Section 5.0 Summary LCI of Paper Products
5-35
Environmental Releases Units Total Process Fuel Related
Solid WastesAsh lb 3.69E+02 3.69E+02Sludge lb 1.43E+02 1.43E+02Unspecified lb 2.15E+01 2.15E+01
Waterborne WastesAcid lb 3.50E-08 3.50E-08Ammonia lb 1.50E-03 1.50E-03BOD lb 1.30E+01 1.30E+01 2.90E-02Boron lb 6.70E-02 6.70E-02Cadmium lb 1.30E-03 1.30E-03Calcium lb 5.40E-04 5.40E-04Chloride lb 1.35E+00 1.35E+00Chromates lb 2.40E-05 2.40E-05Chromium lb 1.30E-03 1.30E-03COD lb 1.13E+01 1.09E+01 4.10E-01Cyanide lb 2.00E-06 2.00E-06Dissolved Solids lb 3.03E+01 8.00E-01 2.95E+01Fluorides lb 2.50E-03 2.50E-03Iron lb 9.70E-02 9.70E-02Lead lb 8.50E-08 2.30E-08 6.20E-08Manganese lb 5.60E-02 5.60E-02Mercury lb 1.32E-07 3.20E-08 1.00E-07Metal Ion lb 7.40E-04 7.40E-04Nickel lb 2.30E-08 2.30E-08Nitrates lb 2.40E-04 2.40E-04Oil lb 5.20E-01 5.20E-01Other Organics lb 9.70E-02 9.70E-02Phenol lb 2.40E-06 2.40E-06Phosphates lb 8.30E-03 8.30E-03Sodium lb 1.00E-03 1.00E-03Sulfates lb 1.35E+00 1.35E+00Sulfides lb 3.10E-06 3.10E-06Sulfuric Acid lb 1.70E-02 1.70E-02Suspended Solids lb 1.86E+01 1.70E+01 1.62E+00Zinc lb 4.60E-04 2.30E-08 4.60E-04
Note: Materials collection, separation, and transport to a remanufacturing facility are handled by the collection,materials recovery facility, and transportation process models, respectively, of the decision support tool.Source: Franklin Associates, 2000.
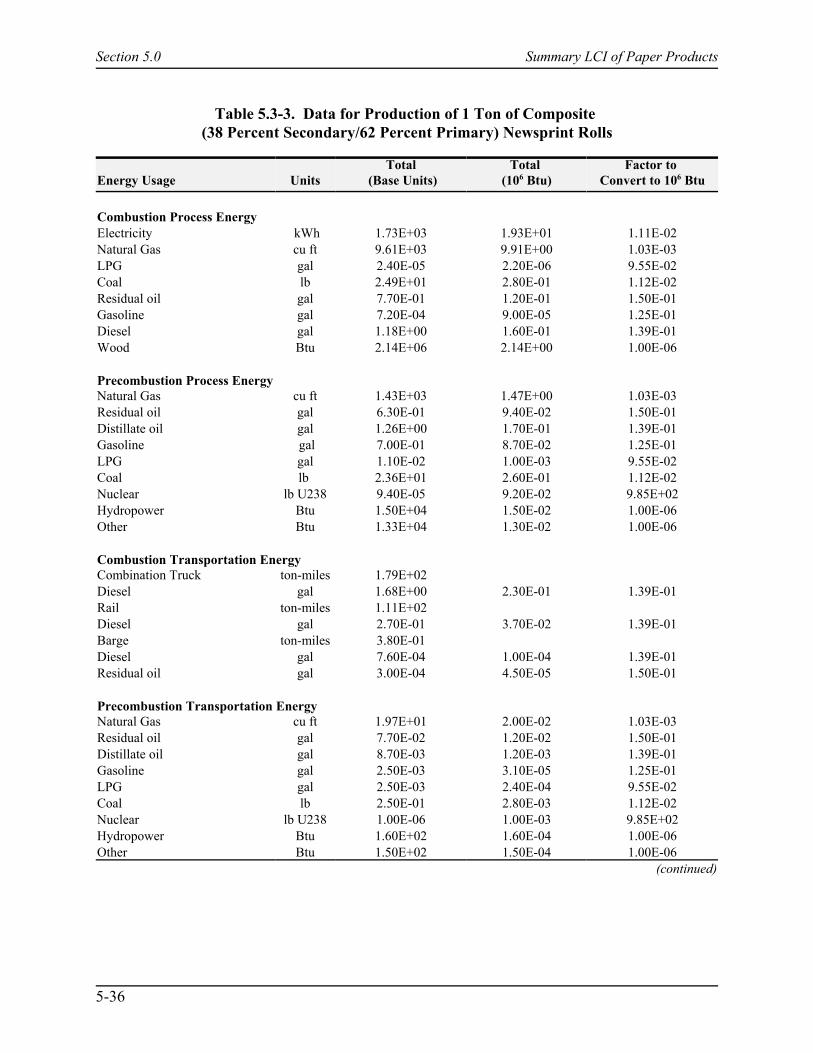
Section 5.0 Summary LCI of Paper Products
5-36
Table 5.3-3. Data for Production of 1 Ton of Composite (38 Percent Secondary/62 Percent Primary) Newsprint Rolls
Energy Usage UnitsTotal
(Base Units)Total
(106 Btu)Factor to
Convert to 106 Btu
Combustion Process EnergyElectricity kWh 1.73E+03 1.93E+01 1.11E-02Natural Gas cu ft 9.61E+03 9.91E+00 1.03E-03LPG gal 2.40E-05 2.20E-06 9.55E-02Coal lb 2.49E+01 2.80E-01 1.12E-02Residual oil gal 7.70E-01 1.20E-01 1.50E-01Gasoline gal 7.20E-04 9.00E-05 1.25E-01Diesel gal 1.18E+00 1.60E-01 1.39E-01Wood Btu 2.14E+06 2.14E+00 1.00E-06
Precombustion Process EnergyNatural Gas cu ft 1.43E+03 1.47E+00 1.03E-03Residual oil gal 6.30E-01 9.40E-02 1.50E-01Distillate oil gal 1.26E+00 1.70E-01 1.39E-01Gasoline gal 7.00E-01 8.70E-02 1.25E-01LPG gal 1.10E-02 1.00E-03 9.55E-02Coal lb 2.36E+01 2.60E-01 1.12E-02Nuclear lb U238 9.40E-05 9.20E-02 9.85E+02Hydropower Btu 1.50E+04 1.50E-02 1.00E-06Other Btu 1.33E+04 1.30E-02 1.00E-06
Combustion Transportation EnergyCombination Truck ton-miles 1.79E+02Diesel gal 1.68E+00 2.30E-01 1.39E-01Rail ton-miles 1.11E+02Diesel gal 2.70E-01 3.70E-02 1.39E-01Barge ton-miles 3.80E-01Diesel gal 7.60E-04 1.00E-04 1.39E-01Residual oil gal 3.00E-04 4.50E-05 1.50E-01
Precombustion Transportation EnergyNatural Gas cu ft 1.97E+01 2.00E-02 1.03E-03Residual oil gal 7.70E-02 1.20E-02 1.50E-01Distillate oil gal 8.70E-03 1.20E-03 1.39E-01Gasoline gal 2.50E-03 3.10E-05 1.25E-01LPG gal 2.50E-03 2.40E-04 9.55E-02Coal lb 2.50E-01 2.80E-03 1.12E-02Nuclear lb U238 1.00E-06 1.00E-03 9.85E+02Hydropower Btu 1.60E+02 1.60E-04 1.00E-06Other Btu 1.50E+02 1.50E-04 1.00E-06
(continued)

Table 5.3-3. (continued)
Section 5.0 Summary LCI of Paper Products
5-37
Environmental Releases Units Total Process Fuel Related
Atmospheric EmissionsAcreolin lb 3.60E-05 3.60E-05Aldehydes lb 1.20E-02 1.20E-02Ammonia lb 1.60E-02 1.60E-02Antimony lb 1.90E-05 1.90E-05Arsenic lb 1.30E-04 1.30E-04Benzene lb 9.00E-04 9.00E-04Beryllium lb 1.20E-05 1.20E-05Cadmium lb 2.60E-05 2.60E-05Carbon Dioxide-fossil lb 4.11E+03 4.11E+03Carbon Dioxide-nonfossil (1) lb -2.35E+03 -2.35E+03Carbon Dioxide-nonfossil (2) lb -2.72E+02 -2.72E+02Carbon Monoxide lb 7.84E+00 7.84E+00Carbon Tetrachloride lb 6.40E-05 6.40E-05Chlorine lb 9.90E+00 9.90E+00 1.90E-03Chlorine Dioxide lb 5.00E-03 5.00E-03Chromium lb 1.60E-04 1.60E-04Cobalt lb 5.80E-05 5.80E-05Dioxins lb 2.00E-10 2.00E-10Formaldehyde lb 1.80E-04 1.80E-04Hydrocarbons lb 7.53E+00 1.10E-01 7.42E+00Hydrochloric Acid lb 1.80E-01 1.80E-01Hydrogen Fluoride lb 2.50E-02 2.50E-02Kerosene lb 8.90E-04 8.90E-04Lead lb 4.10E-04 4.10E-04Manganese lb 2.50E-03 2.50E-03Mercury lb 1.80E+00 1.80E+00 7.00E-05Metals lb 2.00E-01 2.00E-01Methane lb 9.69E+00 9.69E+00Methylene Chloride lb 0.00E+00 1.6-E04 Naphthalene lb 5.60E-04 5.60E-04Nickel lb 7.80E-04 7.80E-04Nitrogen Oxides lb 1.59E+01 4.10E-01 1.55E+01Nitrous Oxide lb 2.20E-02 2.20E-02N-Nitrosodimethylamine lb 7.70E-06 7.70E-06Odorous Sulfur lb 1.30E-01 1.30E-01Other Aldehydes lb 3.30E-02 3.30E-02Other Organics lb 2.27E+00 2.00E+00 2.70E-01Particulate lb 6.07E+00 2.67E+00 3.40E+00Phenols lb 9.30E-03 9.30E-03Perchloroethylene lb 3.50E-05 3.50E-05Radionuclides Ci 7.80E-04 7.80E-04Selenium lb 2.60E-04 2.60E-04
(continued)
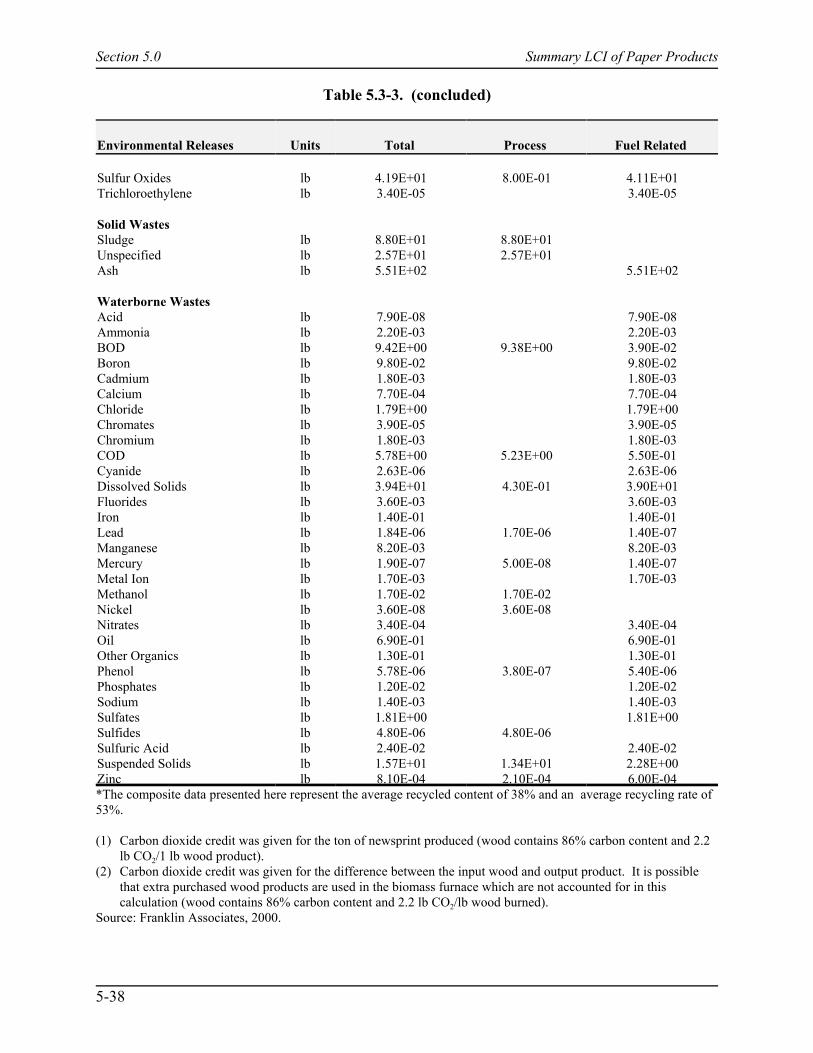
Table 5.3-3. (concluded)
Section 5.0 Summary LCI of Paper Products
5-38
Environmental Releases Units Total Process Fuel Related
Sulfur Oxides lb 4.19E+01 8.00E-01 4.11E+01Trichloroethylene lb 3.40E-05 3.40E-05
Solid WastesSludge lb 8.80E+01 8.80E+01Unspecified lb 2.57E+01 2.57E+01Ash lb 5.51E+02 5.51E+02
Waterborne WastesAcid lb 7.90E-08 7.90E-08Ammonia lb 2.20E-03 2.20E-03BOD lb 9.42E+00 9.38E+00 3.90E-02Boron lb 9.80E-02 9.80E-02Cadmium lb 1.80E-03 1.80E-03Calcium lb 7.70E-04 7.70E-04Chloride lb 1.79E+00 1.79E+00Chromates lb 3.90E-05 3.90E-05Chromium lb 1.80E-03 1.80E-03COD lb 5.78E+00 5.23E+00 5.50E-01Cyanide lb 2.63E-06 2.63E-06Dissolved Solids lb 3.94E+01 4.30E-01 3.90E+01Fluorides lb 3.60E-03 3.60E-03Iron lb 1.40E-01 1.40E-01Lead lb 1.84E-06 1.70E-06 1.40E-07Manganese lb 8.20E-03 8.20E-03Mercury lb 1.90E-07 5.00E-08 1.40E-07Metal Ion lb 1.70E-03 1.70E-03Methanol lb 1.70E-02 1.70E-02Nickel lb 3.60E-08 3.60E-08Nitrates lb 3.40E-04 3.40E-04Oil lb 6.90E-01 6.90E-01Other Organics lb 1.30E-01 1.30E-01Phenol lb 5.78E-06 3.80E-07 5.40E-06Phosphates lb 1.20E-02 1.20E-02Sodium lb 1.40E-03 1.40E-03Sulfates lb 1.81E+00 1.81E+00Sulfides lb 4.80E-06 4.80E-06Sulfuric Acid lb 2.40E-02 2.40E-02Suspended Solids lb 1.57E+01 1.34E+01 2.28E+00Zinc lb 8.10E-04 2.10E-04 6.00E-04*The composite data presented here represent the average recycled content of 38% and an average recycling rate of53%.
(1) Carbon dioxide credit was given for the ton of newsprint produced (wood contains 86% carbon content and 2.2lb CO2/1 lb wood product).
(2) Carbon dioxide credit was given for the difference between the input wood and output product. It is possiblethat extra purchased wood products are used in the biomass furnace which are not accounted for in thiscalculation (wood contains 86% carbon content and 2.2 lb CO2/lb wood burned).
Source: Franklin Associates, 2000.
Section 5.0 Summary LCI of Paper Products
5-39
5.3.5 Deinked Pulp Manufacture
The following discussion describes the production of deinked newsprint from recoveredfiber sources, either industrial scrap or postconsumer. For many paper products, repulpedwastepaper can be used as a raw material substitute for wood pulp.
The most common method of preparing recovered paper for reuse begins with repulpingthe fiber sources. During the repulping step, large-sized contaminants are separated from thefiber. Immediately following pulping, smaller-sized contaminants are screened for removal priorto deinking.
If inks are present, chemicals, heat, and mechanical energy are used to dislodge the inkparticles and disperse them. The ink particles are separated from the fiber either by washing orflotation or a hybrid process of both. In this study, the washing process is assumed. In thewashing process, detergents and dispersants are used to disperse the ink into fine particulates. The separation of these ink particulates from the pulp corresponds to a stock-thickening process,whether achieved using conventional washing equipment or screens.
Surfactants are the key chemicals used for deinking. These surfactants, which affectsurface tension, include detergents, dispersants, and foaming agents. Other chemicals used toenhance the action of the surfactants are caustic soda, sodium silicate, and borax. The deinkingprocess also removes some coatings and fillers from the coated papers such as magazines andcatalogs.
The deinked pulp is then sent to the newsprint part of the mill. No emissions data areavailable for the deinking process. This study assumes the deinking process uses sodiumhydroxide, soda ash, and chlorine dioxide. The sodium hydroxide and soda ash are eachassumed to be 2 percent of the pulp weight produced, while the chlorine dioxide is assumed to be75 percent of the pulp weight produced (Argonne National Laboratory, 1993).
5.3.6 Bleaching Agent Production
Many different bleaching agents are available to be used in pulp production. Some of themore common ones include sodium hydrosulfite, chlorine dioxide, hydrogen peroxide, andsodium bisulfide. No statistical data were available for uses of different bleaching agents. Chlorine dioxide is used in this study because data were readily available. The amount ofbleaching agent used is variable with pulp and type of agent. This study includes an estimate forthe amount of bleaching agent in newspaper.
5.3.6.1 Sodium Chlorate Production. Sodium chlorate is used to produce chlorinedioxide at the pulp mill site. Sodium chlorate is produced from electrolysis of salt brine similarto the production of caustic and chlorine, except that the chlorine and caustic are not separated,but are instead allowed to mix (Smook, 1987). Hypochlorite forms first, followed by theformation of sodium chlorate. It is assumed that the energy and emissions for the manufacture ofsodium chlorate are the same as those for chlorine (Franklin Associates, Ltd., 2000).
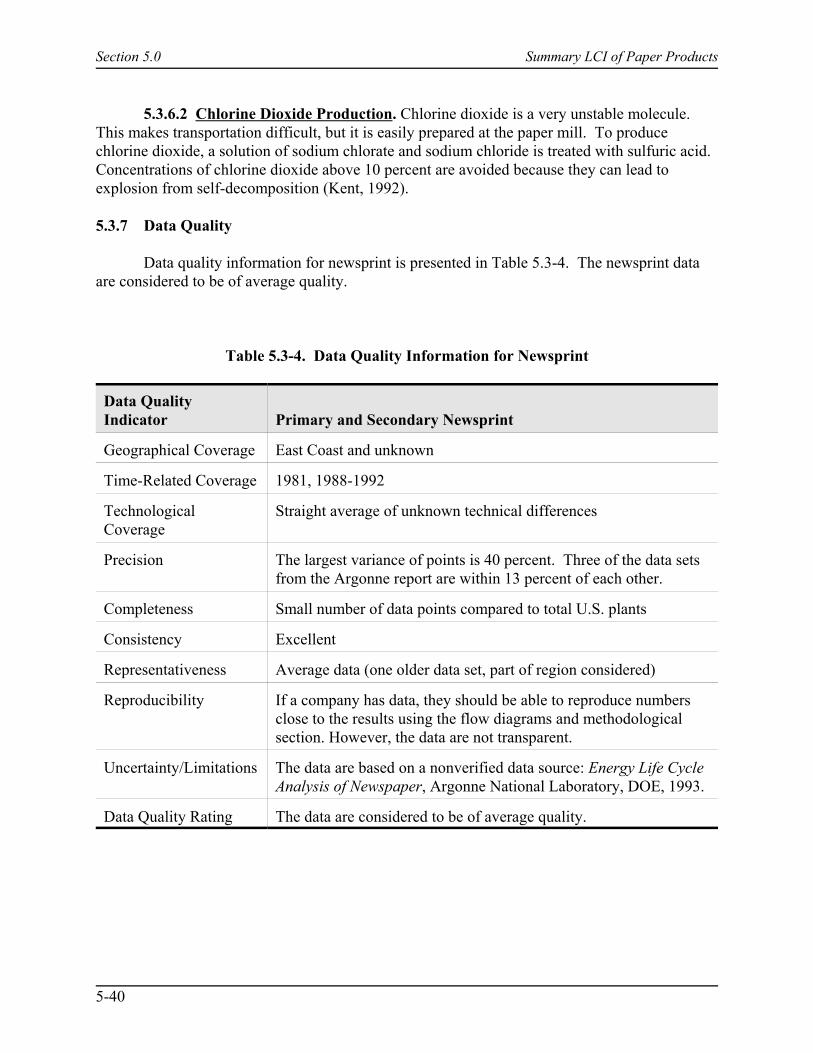
Section 5.0 Summary LCI of Paper Products
5-40
5.3.6.2 Chlorine Dioxide Production. Chlorine dioxide is a very unstable molecule. This makes transportation difficult, but it is easily prepared at the paper mill. To producechlorine dioxide, a solution of sodium chlorate and sodium chloride is treated with sulfuric acid. Concentrations of chlorine dioxide above 10 percent are avoided because they can lead toexplosion from self-decomposition (Kent, 1992).
5.3.7 Data Quality
Data quality information for newsprint is presented in Table 5.3-4. The newsprint dataare considered to be of average quality.
Table 5.3-4. Data Quality Information for Newsprint
Data QualityIndicator Primary and Secondary Newsprint
Geographical Coverage East Coast and unknown
Time-Related Coverage 1981, 1988-1992
TechnologicalCoverage
Straight average of unknown technical differences
Precision The largest variance of points is 40 percent. Three of the data setsfrom the Argonne report are within 13 percent of each other.
Completeness Small number of data points compared to total U.S. plants
Consistency Excellent
Representativeness Average data (one older data set, part of region considered)
Reproducibility If a company has data, they should be able to reproduce numbersclose to the results using the flow diagrams and methodologicalsection. However, the data are not transparent.
Uncertainty/Limitations The data are based on a nonverified data source: Energy Life CycleAnalysis of Newspaper, Argonne National Laboratory, DOE, 1993.
Data Quality Rating The data are considered to be of average quality.

Section 5.0 Summary LCI of Paper Products
5-41
5.4 Office Paper
5.4.1 Introduction
This section contains LCI profiles for the production of 100 percent primary andsecondary rolls of office paper. It contains process flow diagrams and descriptions forproduction processes for 1 short ton of paper product. Data quality information for the officepaper profiles is included in Section 5.4.4.
5.4.2 Office Paper Production
The data for primary office paper profile represent uncoated freesheet bleached paperproduced in an alkaline papermaking process using bleached kraft pulp. The product consists of78 percent pulp, 16 percent filler, and 6 percent moisture. The profile uses an average of threedifferent bleaching technologies (EDF, 1995c):
# 50 percent chlorine dioxide substituted for elemental chlorine in the firstbleaching stage
# 100 percent chlorine dioxide substituted for elemental chlorine in the firstbleaching stage
# oxygen delignification and 100 percent chlorine dioxide substituted for elementalchlorine in the first bleaching stage.
The boundaries for this study include the harvesting of trees, transporting of logs (orchips) to the mill, debarking and chipping, and manufacture of pulp and paper using primaryfiber. These data for the production of primary pulp were collected and published by EDF,according to their agreed methodology (EDF, 1995c). With the addition of precombustionenergy and emissions data from Franklin Associates (1998), the profile used in this studyrepresents boundaries for the aggregated cradle-to-gate processing of 1 ton of primary officepaper pulp. Figure 5.4-1 shows a simplified process flow diagram for processing primary officepaper pulp.
The data in this profile were primarily developed through the use of the EDF’s WhitePaper 10A on business and writing paper (EDF, 1995c). EDF’s Table 3, EnvironmentalParameters for an average uncoated freesheet paper with 0 percent secondary content, whichpresents a cradle-to-gate environmental data profile for 1 short ton of primary office paper, wasused along with precombustion energy and emissions data published by Franklin Associates(1998). The following steps were taken to calculate inventory data for primary office paper.
1. The primary office paper data profile (EDF) was converted from kilogram permetric ton to pounds per ton for water emissions and solid waste.

Section 5.0 Summary LCI of Paper Products
5-42
WoodProcurement
Debarking
Bark Handling Mill EnergyGeneration
Roundwoodw/Bark
Roundwood
Chipping
AncillaryMaterials
Wood Chips
Black LiquorSolids Wood Fiber
Pulpingto Mill Energy
Generation
Primary Office Paper
Figure 5.4-1. Primary office paper production

Section 5.0 Summary LCI of Paper Products
5-43
2. The precombustion energy and environmental emissions (air emissions, wateremissions and solid waste emissions) for the fuels used in the process were notincluded in the EDF publication; hence, the appropriate emissions and pre-combustion energies from the Franklin report were added to make it a cradle-to-gate profile.
3. To account for the regeneration of wood (from the forest) that accompanies itsremoval as a a result of forest management, this profile assumes that for everypound of wood used in the paper-making process, an equivalent is regenerated. Hence, adjustments for CO2 emissions from biomass energy were made by givingCO2 credit at 2.2 lb/lb of wood used in the process. For every pound of woodconsumed in the paper-making process (approximately 78 percent of paper weightis wood fiber), 2.2 lb of CO2 is subtracted from the biomass material balance.
Tables 5.4-1 and 5.4-2 summarize the cradle-to-gate energy consumption andenvironmental aspect for primary office paper. Table 5.4-1 breaks down the individual fuels thatmake up precombustion energy related to process fuels and electric energy fuels. Emissions toair and water (Table 5.4-2) include all emissions for processing, combustion (includingelectricity), transportation, and precombustion activities.
Descriptions of the processes for wood procurement, wood residues production, pulpingand paper formation are included in Sections 5.2 and 5.3 and not repeated here.
5.4.3 Secondary Office Paper
The secondary office paper LCI profile represents office paper produced from 100percent recovered fiber pulp collected from manufacturing sources and small-volume wastepapersources, such as houses and markets. Deinked recovered fiber pulping (DIP) technology is usedto produce recovered pulp for secondary office paper. A description of the DIP process isprovided in Section 5.3.
The LCI data for the production of secondary office paper pulp were collected andpublished by the Environmental Defense Fund (EDF, 1995c), according to their agreedmethodology. With the addition of precombustion energy and emission data from FranklinAssociates (1998), the profile used in this study represents boundaries for the aggregated cradle-to-gate processing of 1 ton of secondary office paper. Figure 5.4-2 shows a simplified processflow diagram for processing secondary office paper.
The data in the LCI profile for secondary office paper were primarily developed throughthe use of the EDF’s White Paper 10A on business and writing paper (EDF, 1995c). EDF’sTable 3, Environmental Parameters for an uncoated freesheet paper with 100 percent secondarycontent, which presents a cradle-to-gate environmental data profile for 1 short ton of secondaryoffice paper, was used along with precombustion energy and emission data from the Franklinreport (1998). The following steps outline the procedure taken to calculate inventory data for secondary office paper:
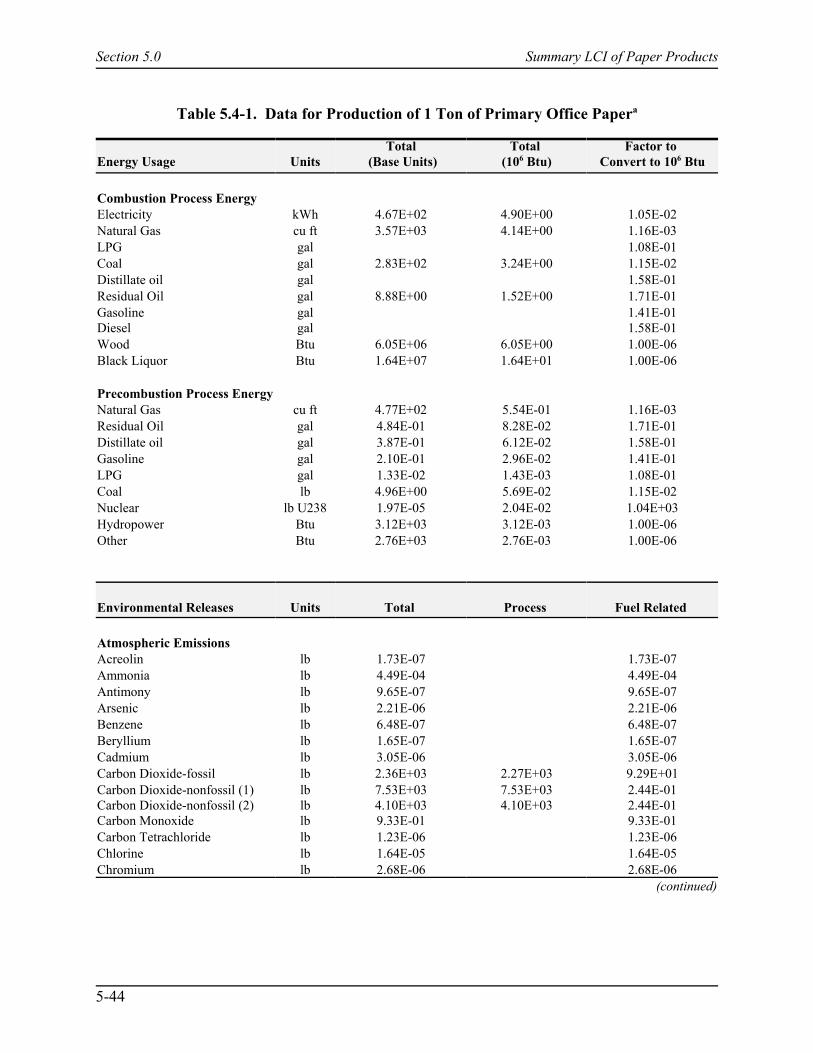
Section 5.0 Summary LCI of Paper Products
5-44
Table 5.4-1. Data for Production of 1 Ton of Primary Office Papera
Energy Usage UnitsTotal
(Base Units)Total
(106 Btu)Factor to
Convert to 106 Btu
Combustion Process EnergyElectricity kWh 4.67E+02 4.90E+00 1.05E-02Natural Gas cu ft 3.57E+03 4.14E+00 1.16E-03LPG gal 1.08E-01Coal gal 2.83E+02 3.24E+00 1.15E-02Distillate oil gal 1.58E-01Residual Oil gal 8.88E+00 1.52E+00 1.71E-01Gasoline gal 1.41E-01Diesel gal 1.58E-01Wood Btu 6.05E+06 6.05E+00 1.00E-06Black Liquor Btu 1.64E+07 1.64E+01 1.00E-06
Precombustion Process EnergyNatural Gas cu ft 4.77E+02 5.54E-01 1.16E-03Residual Oil gal 4.84E-01 8.28E-02 1.71E-01Distillate oil gal 3.87E-01 6.12E-02 1.58E-01Gasoline gal 2.10E-01 2.96E-02 1.41E-01LPG gal 1.33E-02 1.43E-03 1.08E-01Coal lb 4.96E+00 5.69E-02 1.15E-02Nuclear lb U238 1.97E-05 2.04E-02 1.04E+03Hydropower Btu 3.12E+03 3.12E-03 1.00E-06Other Btu 2.76E+03 2.76E-03 1.00E-06
Environmental Releases Units Total Process Fuel Related
Atmospheric EmissionsAcreolin lb 1.73E-07 1.73E-07Ammonia lb 4.49E-04 4.49E-04Antimony lb 9.65E-07 9.65E-07Arsenic lb 2.21E-06 2.21E-06Benzene lb 6.48E-07 6.48E-07Beryllium lb 1.65E-07 1.65E-07Cadmium lb 3.05E-06 3.05E-06Carbon Dioxide-fossil lb 2.36E+03 2.27E+03 9.29E+01Carbon Dioxide-nonfossil (1) lb 7.53E+03 7.53E+03 2.44E-01Carbon Dioxide-nonfossil (2) lb 4.10E+03 4.10E+03 2.44E-01Carbon Monoxide lb 9.33E-01 9.33E-01Carbon Tetrachloride lb 1.23E-06 1.23E-06Chlorine lb 1.64E-05 1.64E-05Chromium lb 2.68E-06 2.68E-06
(continued)
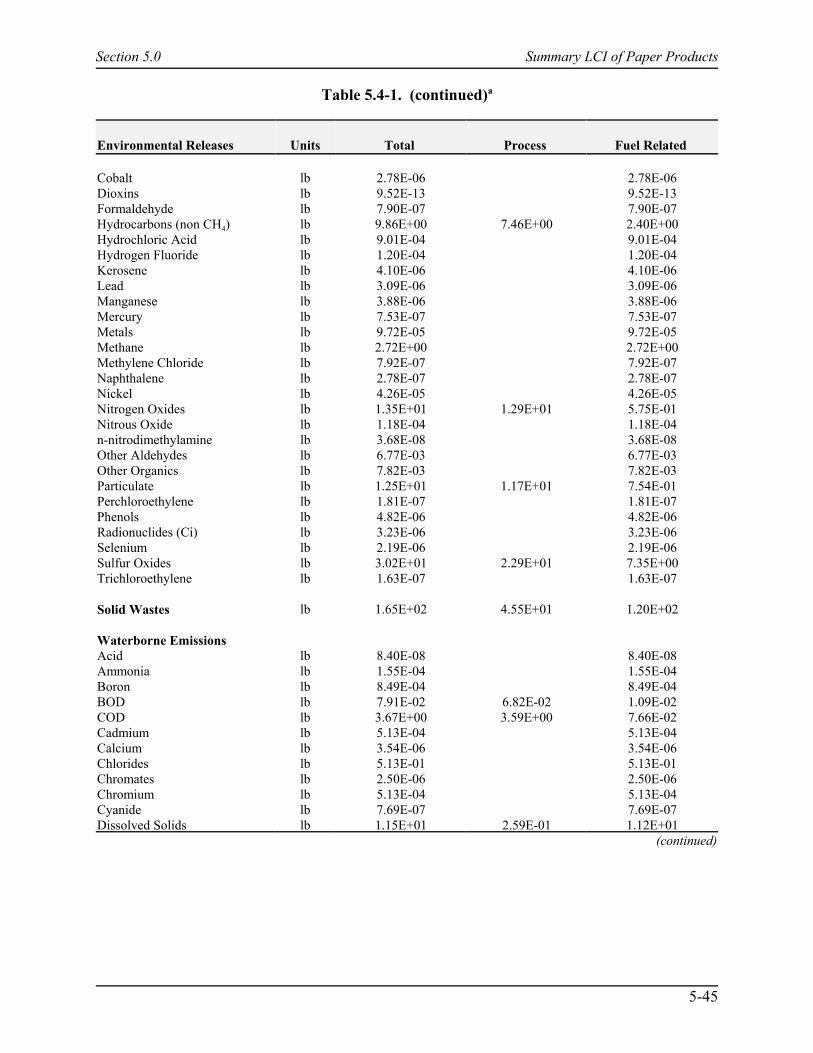
Table 5.4-1. (continued)a
Section 5.0 Summary LCI of Paper Products
5-45
Environmental Releases Units Total Process Fuel Related
Cobalt lb 2.78E-06 2.78E-06Dioxins lb 9.52E-13 9.52E-13Formaldehyde lb 7.90E-07 7.90E-07Hydrocarbons (non CH4) lb 9.86E+00 7.46E+00 2.40E+00Hydrochloric Acid lb 9.01E-04 9.01E-04Hydrogen Fluoride lb 1.20E-04 1.20E-04Kerosene lb 4.10E-06 4.10E-06Lead lb 3.09E-06 3.09E-06Manganese lb 3.88E-06 3.88E-06Mercury lb 7.53E-07 7.53E-07Metals lb 9.72E-05 9.72E-05Methane lb 2.72E+00 2.72E+00Methylene Chloride lb 7.92E-07 7.92E-07Naphthalene lb 2.78E-07 2.78E-07Nickel lb 4.26E-05 4.26E-05Nitrogen Oxides lb 1.35E+01 1.29E+01 5.75E-01Nitrous Oxide lb 1.18E-04 1.18E-04n-nitrodimethylamine lb 3.68E-08 3.68E-08Other Aldehydes lb 6.77E-03 6.77E-03Other Organics lb 7.82E-03 7.82E-03Particulate lb 1.25E+01 1.17E+01 7.54E-01Perchloroethylene lb 1.81E-07 1.81E-07Phenols lb 4.82E-06 4.82E-06Radionuclides (Ci) lb 3.23E-06 3.23E-06Selenium lb 2.19E-06 2.19E-06Sulfur Oxides lb 3.02E+01 2.29E+01 7.35E+00Trichloroethylene lb 1.63E-07 1.63E-07
Solid Wastes lb 1.65E+02 4.55E+01 1.20E+02
Waterborne EmissionsAcid lb 8.40E-08 8.40E-08Ammonia lb 1.55E-04 1.55E-04Boron lb 8.49E-04 8.49E-04BOD lb 7.91E-02 6.82E-02 1.09E-02COD lb 3.67E+00 3.59E+00 7.66E-02Cadmium lb 5.13E-04 5.13E-04Calcium lb 3.54E-06 3.54E-06Chlorides lb 5.13E-01 5.13E-01Chromates lb 2.50E-06 2.50E-06Chromium lb 5.13E-04 5.13E-04Cyanide lb 7.69E-07 7.69E-07Dissolved Solids lb 1.15E+01 2.59E-01 1.12E+01
(continued)
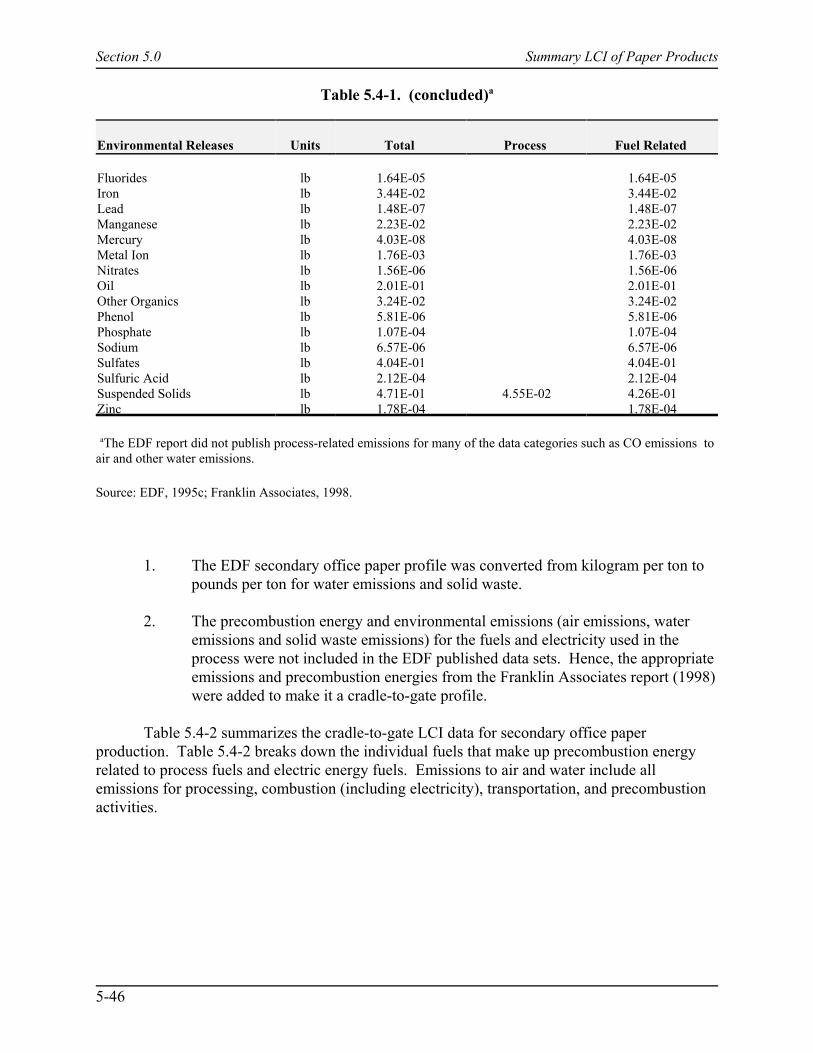
Table 5.4-1. (concluded)a
Section 5.0 Summary LCI of Paper Products
5-46
Environmental Releases Units Total Process Fuel Related
Fluorides lb 1.64E-05 1.64E-05Iron lb 3.44E-02 3.44E-02Lead lb 1.48E-07 1.48E-07Manganese lb 2.23E-02 2.23E-02Mercury lb 4.03E-08 4.03E-08Metal Ion lb 1.76E-03 1.76E-03Nitrates lb 1.56E-06 1.56E-06Oil lb 2.01E-01 2.01E-01Other Organics lb 3.24E-02 3.24E-02Phenol lb 5.81E-06 5.81E-06Phosphate lb 1.07E-04 1.07E-04Sodium lb 6.57E-06 6.57E-06Sulfates lb 4.04E-01 4.04E-01Sulfuric Acid lb 2.12E-04 2.12E-04Suspended Solids lb 4.71E-01 4.55E-02 4.26E-01Zinc lb 1.78E-04 1.78E-04
aThe EDF report did not publish process-related emissions for many of the data categories such as CO emissions toair and other water emissions.
Source: EDF, 1995c; Franklin Associates, 1998.
1. The EDF secondary office paper profile was converted from kilogram per ton topounds per ton for water emissions and solid waste.
2. The precombustion energy and environmental emissions (air emissions, wateremissions and solid waste emissions) for the fuels and electricity used in theprocess were not included in the EDF published data sets. Hence, the appropriateemissions and precombustion energies from the Franklin Associates report (1998)were added to make it a cradle-to-gate profile.
Table 5.4-2 summarizes the cradle-to-gate LCI data for secondary office paperproduction. Table 5.4-2 breaks down the individual fuels that make up precombustion energyrelated to process fuels and electric energy fuels. Emissions to air and water include allemissions for processing, combustion (including electricity), transportation, and precombustionactivities.
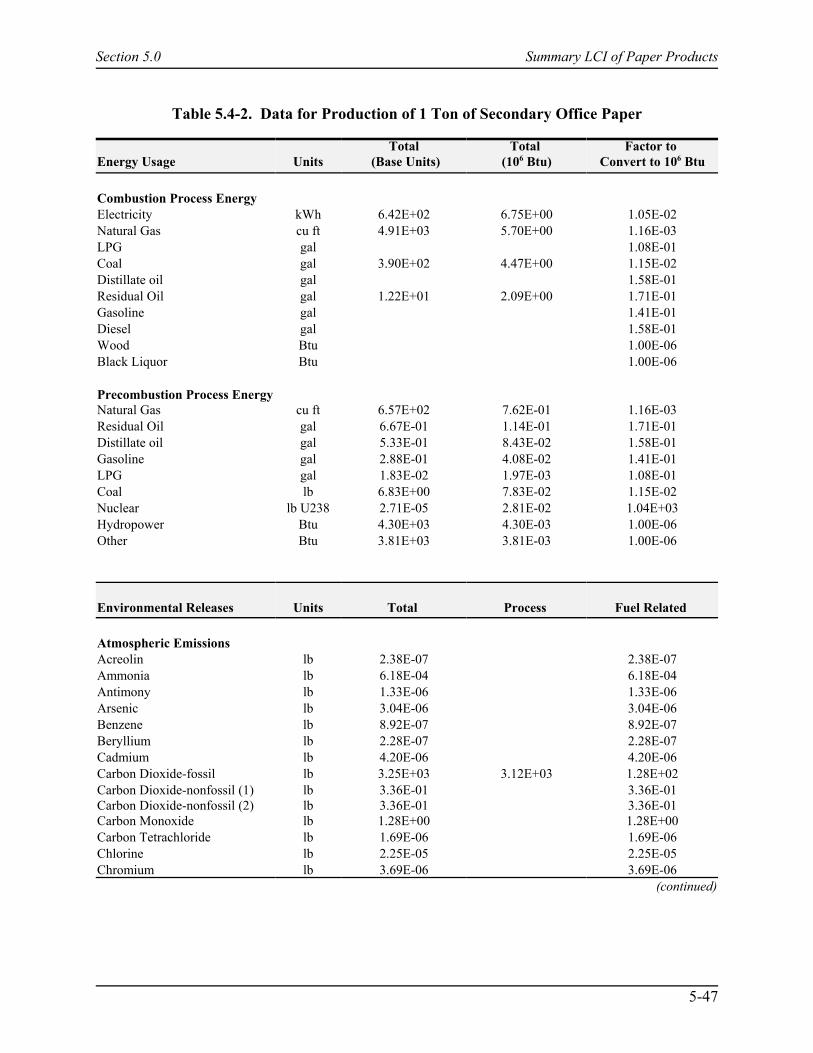
Section 5.0 Summary LCI of Paper Products
5-47
Table 5.4-2. Data for Production of 1 Ton of Secondary Office Paper
Energy Usage UnitsTotal
(Base Units)Total
(106 Btu)Factor to
Convert to 106 Btu
Combustion Process EnergyElectricity kWh 6.42E+02 6.75E+00 1.05E-02Natural Gas cu ft 4.91E+03 5.70E+00 1.16E-03LPG gal 1.08E-01Coal gal 3.90E+02 4.47E+00 1.15E-02Distillate oil gal 1.58E-01Residual Oil gal 1.22E+01 2.09E+00 1.71E-01Gasoline gal 1.41E-01Diesel gal 1.58E-01Wood Btu 1.00E-06Black Liquor Btu 1.00E-06
Precombustion Process EnergyNatural Gas cu ft 6.57E+02 7.62E-01 1.16E-03Residual Oil gal 6.67E-01 1.14E-01 1.71E-01Distillate oil gal 5.33E-01 8.43E-02 1.58E-01Gasoline gal 2.88E-01 4.08E-02 1.41E-01LPG gal 1.83E-02 1.97E-03 1.08E-01Coal lb 6.83E+00 7.83E-02 1.15E-02Nuclear lb U238 2.71E-05 2.81E-02 1.04E+03Hydropower Btu 4.30E+03 4.30E-03 1.00E-06Other Btu 3.81E+03 3.81E-03 1.00E-06
Environmental Releases Units Total Process Fuel Related
Atmospheric EmissionsAcreolin lb 2.38E-07 2.38E-07Ammonia lb 6.18E-04 6.18E-04Antimony lb 1.33E-06 1.33E-06Arsenic lb 3.04E-06 3.04E-06Benzene lb 8.92E-07 8.92E-07Beryllium lb 2.28E-07 2.28E-07Cadmium lb 4.20E-06 4.20E-06Carbon Dioxide-fossil lb 3.25E+03 3.12E+03 1.28E+02Carbon Dioxide-nonfossil (1) lb 3.36E-01 3.36E-01Carbon Dioxide-nonfossil (2) lb 3.36E-01 3.36E-01Carbon Monoxide lb 1.28E+00 1.28E+00Carbon Tetrachloride lb 1.69E-06 1.69E-06Chlorine lb 2.25E-05 2.25E-05Chromium lb 3.69E-06 3.69E-06
(continued)

Table 5.4-2. (continued)a
Section 5.0 Summary LCI of Paper Products
5-48
Environmental Releases Units Total Process Fuel Related Cobalt lb 3.83E-06 3.83E-06Dioxins lb 1.31E-12 1.31E-12Formaldehyde lb 1.09E-06 1.09E-06Hydrocarbons (non CH4) lb 6.24E+00 2.93E+00 3.31E+00Hydrochloric Acid lb 1.24E-03 1.24E-03Hydrogen Fluoride lb 1.65E-04 1.65E-04Kerosene lb 5.65E-06 5.65E-06Lead lb 4.26E-06 4.26E-06Manganese lb 5.34E-06 5.34E-06Mercury lb 1.04E-06 1.04E-06Metals lb 1.34E-04 1.34E-04Methane lb 3.75E+00 3.75E+00Methylene Chloride lb 1.09E-06 1.09E-06Naphthalene lb 3.83E-07 3.83E-07Nickel lb 5.86E-05 5.86E-05Nitrogen Oxides lb 1.00E+01 9.24E+00 7.92E-01Nitrous Oxide lb 1.63E-04 1.63E-04n-nitrodimethylamine lb 5.07E-08 5.07E-08Other Aldehydes lb 9.32E-03 9.32E-03Other Organics lb 1.08E-02 1.08E-02Particulate lb 4.92E+00 3.88E+00 1.04E+00Perchloroethylene lb 2.49E-07 2.49E-07Phenols lb 6.64E-06 6.64E-06Radionuclides (Ci) lb 4.45E-06 4.45E-06Selenium lb 3.02E-06 3.02E-06Sulfur Oxides lb 3.11E+01 2.10E+01 1.01E+01Trichloroethylene lb 2.25E-07 2.25E-07
Solid Wastes lb 2.51E+02 8.64E+01 1.65E+02
Waterborne EmissionsAcid lb 1.16E-07 1.16E-07Ammonia lb 2.13E-04 2.13E-04Boron lb 1.17E-03 1.17E-03BOD lb 2.20E-01 2.05E-01 1.50E-02COD lb 2.61E+00 2.50E+00 1.05E-01Cadmium lb 7.06E-04 7.06E-04Calcium lb 4.88E-06 4.88E-06Chlorides lb 7.06E-01 7.06E-01Chromates lb 3.44E-06 3.44E-06Chromium lb 7.06E-04 7.06E-04Cyanide lb 1.06E-06 1.06E-06Dissolved Solids lb 1.54E+01 1.54E+01Fluorides lb 2.26E-05 2.26E-05Iron lb 4.74E-02 4.74E-02
(continued)
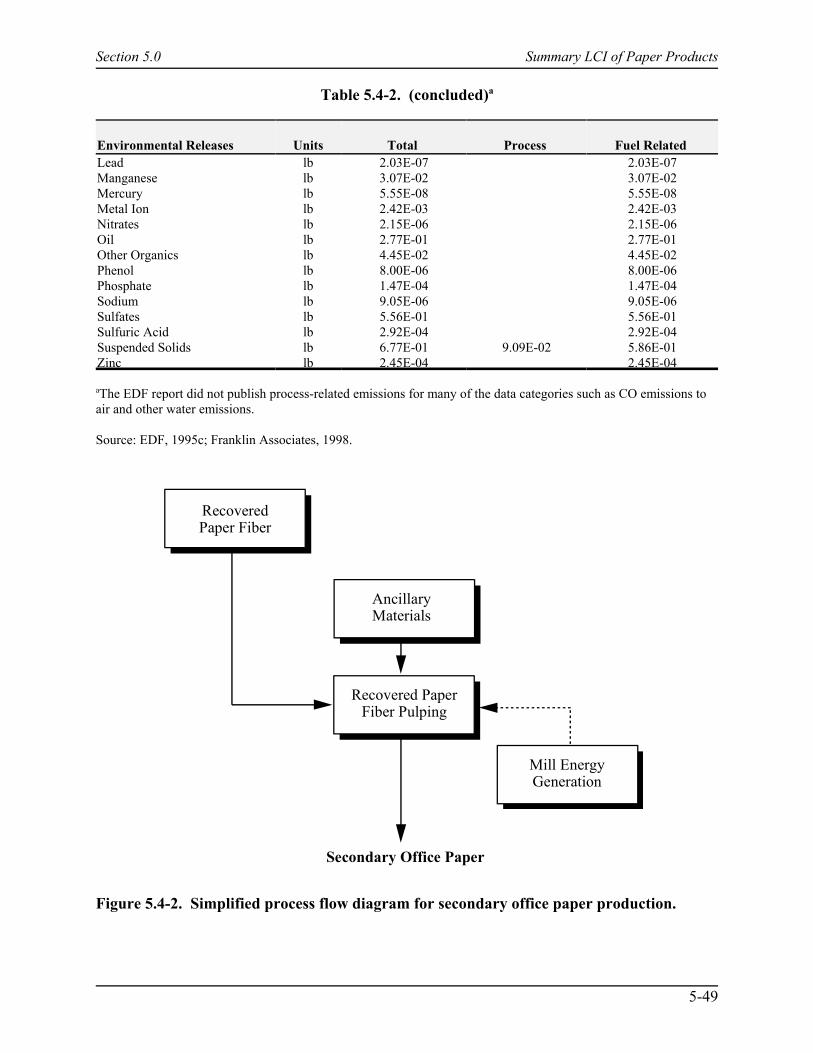
Table 5.4-2. (concluded)a
Section 5.0 Summary LCI of Paper Products
5-49
RecoveredPaper Fiber
AncillaryMaterials
Recovered PaperFiber Pulping
Mill EnergyGeneration
Secondary Office Paper
Environmental Releases Units Total Process Fuel Related Lead lb 2.03E-07 2.03E-07Manganese lb 3.07E-02 3.07E-02Mercury lb 5.55E-08 5.55E-08Metal Ion lb 2.42E-03 2.42E-03Nitrates lb 2.15E-06 2.15E-06Oil lb 2.77E-01 2.77E-01Other Organics lb 4.45E-02 4.45E-02Phenol lb 8.00E-06 8.00E-06Phosphate lb 1.47E-04 1.47E-04Sodium lb 9.05E-06 9.05E-06Sulfates lb 5.56E-01 5.56E-01Sulfuric Acid lb 2.92E-04 2.92E-04Suspended Solids lb 6.77E-01 9.09E-02 5.86E-01Zinc lb 2.45E-04 2.45E-04
aThe EDF report did not publish process-related emissions for many of the data categories such as CO emissions toair and other water emissions.
Source: EDF, 1995c; Franklin Associates, 1998.
Figure 5.4-2. Simplified process flow diagram for secondary office paper production.

Section 5.0 Summary LCI of Paper Products
5-50
5.4.4 Data Quality
Table 5.4-3 summarizes data quality for the primary and secondary office paper LCIprofiles. EDF data were based on a thorough survey of North American paper mills. The resultsdetermined here are thought to be representative of U.S. production. Because secondary datawere used in this study, precision, consistency, and completeness of information are notavailable.
Table 5.4-4 shows how certain data in the primary office paper LCI profile compare withdata from other public sources, and thus provides a measure of representativeness. In 1992, theWorld Energy Council estimated that, world wide, the pulp and paper industry consumedbetween 17 and 26 million Btu per ton of output (IIED, 1996). That range takes into account allproducts produced by the pulp and paper industry globally, from products such as newsprint,which is quite a different paper grade and requires comparatively smaller amounts of processingenergy, to primary bleached kraft paper. Table 5.4-4 compares the gross energy data (the simplesum of combustion process energy and precombustion energy) from this EPA work andEuropean data for different grades of paper. Gross energy can vary by more than 50 percentdepending on the grade of paper compared. Furthermore, there is great variation in emissionsamong the different paper grades compared in Table 5.4-4.
Table 5.4-5 shows how the data in the secondary office paper LCI profile compare withdata from other public sources, and thus provides a measure of representativeness. As withprimary paper, there is great variation in inventory data for the different grades of secondarypaper. The main source of data on paper is the SFAEFL database, which profiles many differentpaper grades, among them 100 percent secondary deinked paper and 100 percent secondarynondeinked paper (SFAEFL, 1996). Also shown in Table 5.4-5 are data for newsprint, which isa low-grade paper containing secondary fibers. Again here, as with primary paper, it must beemphasized that the wide range of different paper grades available will account for largevariations in energy requirements and emissions. Gross energy data (the simple sum ofcombustion process energy and precombustion energy) from the current work is only 5 percentlower than 100 percent secondary deinked paper, the paper grade closest in composition tosecondary office paper. There is greater variation in other emissions, such as CO2.
The data for the primary and secondary office paper profiles is considered to be ofaverage quality.
5.5 Textbook Paper
5.5.1 Introduction
This section contains LCI profiles for primary and secondary textbook paper production. Process flow diagrams and descriptions for production processes are provided, followed by LCIdata tables for 1 short ton of product. Data quality information for the textbook paper LCIprofiles is included in Section 5.5.4.

Section 5.0 Summary LCI of Paper Products
5-51
Table 5.4-3. Data Quality Summary for Primary and Secondary Office Paper
Office Paper
Data Quality Indicator Primary Secondary
Geographic Coverage The data represents North Americanpaper mills producing uncoated freesheet paper using bleached kraftpulp.
The data represents North Americanpaper mills producing uncoated freesheet paper using de-inkedrecovered pulp
Time Period Coverage EDF collected information fromseveral sources (primary andpublished) since 1980. All pre-combustion energy and fuel datawere from 1996
EDF collected information fromseveral sources (primary andpublished) since 1980. All pre-combustion energy and fuel datawere from 1996
Technology Coverage The data represents an averageprofile for the following threebleached Kraft pulps
# 50% chlorine dioxidesubstituted for elementalchlorine in the first bleachingstage;
# 100% chlorine dioxidesubstituted for elementalchlorine in the first bleachingstage; and
# oxygen delignification and100% chlorine dioxidesubstituted for elementalchlorine in the first bleachingstage.
No significant variations intechnology were outlined by EDF
Precision Information not available Information not available
Consistency Information not available Information not available
Completeness Information not available Information not available
Representativeness The pulp fibers and processes usedto profile this paper grade arerepresentative of North Americanpractices according to the EDFreport.
The pulp fibers and processes usedto profile this paper grade arerepresentative of North Americanpractices according to the EDFreport.
(continued)
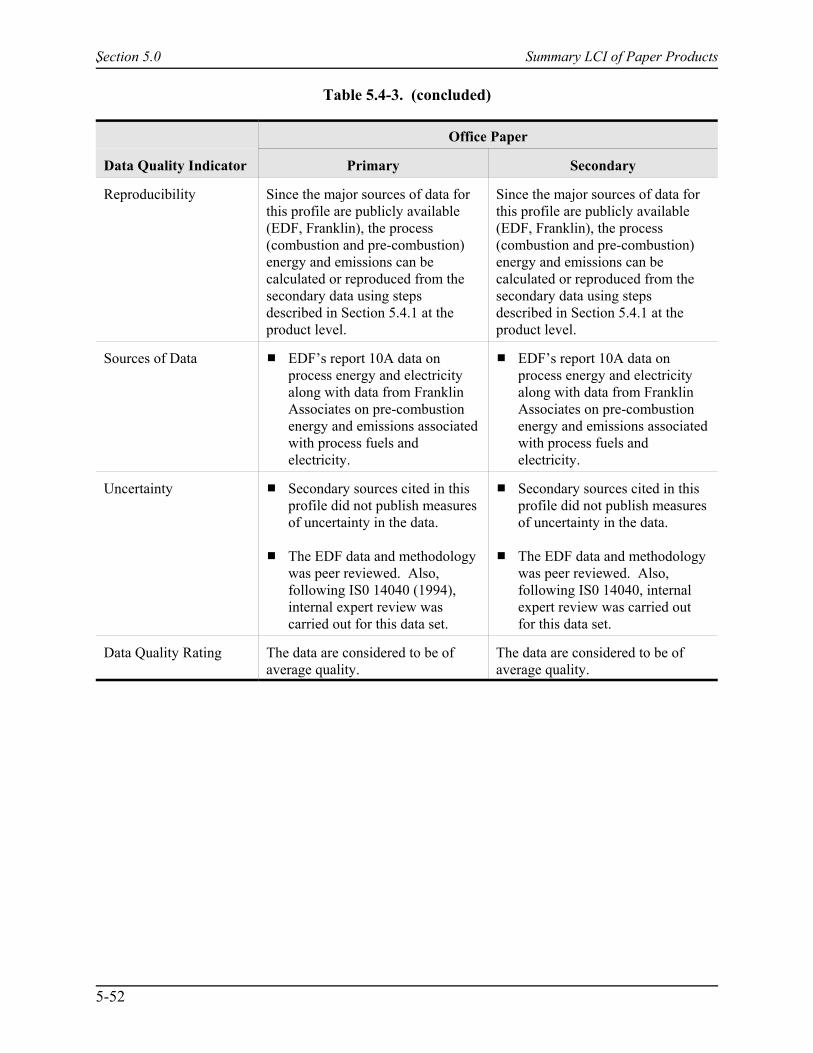
.
Table 5.4-3. (concluded)
Section 5.0 Summary LCI of Paper Products
Office Paper
Data Quality Indicator Primary Secondary
5-52
Reproducibility Since the major sources of data forthis profile are publicly available(EDF, Franklin), the process(combustion and pre-combustion)energy and emissions can becalculated or reproduced from thesecondary data using stepsdescribed in Section 5.4.1 at theproduct level.
Since the major sources of data forthis profile are publicly available(EDF, Franklin), the process(combustion and pre-combustion)energy and emissions can becalculated or reproduced from thesecondary data using stepsdescribed in Section 5.4.1 at theproduct level.
Sources of Data # EDF’s report 10A data onprocess energy and electricityalong with data from FranklinAssociates on pre-combustionenergy and emissions associatedwith process fuels andelectricity.
# EDF’s report 10A data onprocess energy and electricityalong with data from FranklinAssociates on pre-combustionenergy and emissions associatedwith process fuels andelectricity.
Uncertainty # Secondary sources cited in thisprofile did not publish measuresof uncertainty in the data.
# The EDF data and methodologywas peer reviewed. Also,following IS0 14040 (1994),internal expert review wascarried out for this data set.
# Secondary sources cited in thisprofile did not publish measuresof uncertainty in the data.
# The EDF data and methodologywas peer reviewed. Also,following IS0 14040, internalexpert review was carried outfor this data set.
Data Quality Rating The data are considered to be ofaverage quality.
The data are considered to be ofaverage quality.
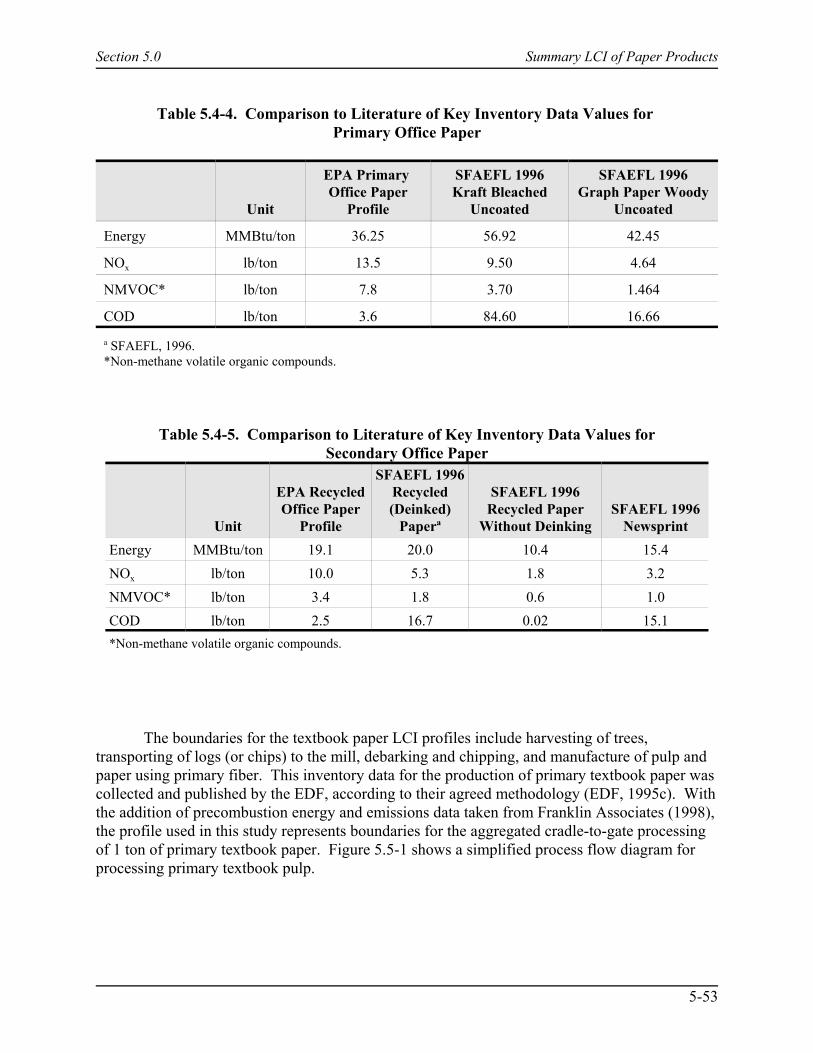
Section 5.0 Summary LCI of Paper Products
5-53
Table 5.4-4. Comparison to Literature of Key Inventory Data Values for Primary Office Paper
Unit
EPA Primary Office Paper
Profile
SFAEFL 1996Kraft Bleached
Uncoated
SFAEFL 1996Graph Paper Woody
Uncoated
Energy MMBtu/ton 36.25 56.92 42.45
NOx lb/ton 13.5 9.50 4.64
NMVOC* lb/ton 7.8 3.70 1.464
COD lb/ton 3.6 84.60 16.66a SFAEFL, 1996.*Non-methane volatile organic compounds.
Table 5.4-5. Comparison to Literature of Key Inventory Data Values forSecondary Office Paper
Unit
EPA RecycledOffice Paper
Profile
SFAEFL 1996Recycled(Deinked)
Papera
SFAEFL 1996Recycled Paper
Without DeinkingSFAEFL 1996
NewsprintEnergy MMBtu/ton 19.1 20.0 10.4 15.4NOx lb/ton 10.0 5.3 1.8 3.2NMVOC* lb/ton 3.4 1.8 0.6 1.0COD lb/ton 2.5 16.7 0.02 15.1*Non-methane volatile organic compounds.
The boundaries for the textbook paper LCI profiles include harvesting of trees,transporting of logs (or chips) to the mill, debarking and chipping, and manufacture of pulp andpaper using primary fiber. This inventory data for the production of primary textbook paper wascollected and published by the EDF, according to their agreed methodology (EDF, 1995c). Withthe addition of precombustion energy and emissions data taken from Franklin Associates (1998),the profile used in this study represents boundaries for the aggregated cradle-to-gate processingof 1 ton of primary textbook paper. Figure 5.5-1 shows a simplified process flow diagram forprocessing primary textbook pulp.
Section 5.0 Summary LCI of Paper Products
5-54
5.5.2 Textbook Paper Production
The data included in the primary textbook paper LCI profile represent primary, uncoatedgroundwood textbook paper, which consists of 94 percent pulp and 6 percent moisture. Groundwood pulp is a low-grade pulp used for printed text. The data in this profile wereprimarily developed through the use of the EDF’s White Paper 10A on business and writingpaper (EDF, 1995c). EDF’s Table 4, Environmental Parameters for an uncoated groundwoodpaper with 0% secondary content, which presents a cradle-to-gate LCI data profile for 1 short tonof primary textbooks, was used along with precombustion energy and emissions data publishedby Franklin Associates (1998). The following steps outline the procedure used to calculateinventory data for virgin textbooks.
1. The EDF primary textbook data profile was converted from kilograms per metricton to pounds per ton for emissions and solid waste.
2. The precombustion energy and environmental emissions (air emissions, wateremissions and solid waste emissions) for the fuels used in the process were notincluded in the EDF publication; hence, the appropriate emissions andprecombustion energies from the Franklin report were added to make it acradle-to-gate profile.
3. To account for the regeneration of wood (from the forest) that accompanies itsremoval as a a result of forest management, this profile assumes that, for everypound of wood used in the paper-making process, an equivalent is regenerated.
For every pound of wood consumed in the paper-making process (approximately 94 percent ofpaper weight is wood fiber), 2.2 lb of CO2 is subtracted from the biomass material balance.
Table 5.5-1 summarizes the cradle-to-gate LCI data for primary textbook paper. Table 5.5-1 breaks down the individual fuels that make up precombustion energy related toprocess fuels and electric energy fuels. Emissions to air and water include all emissions forprocessing, combustion (including electricity), transportation, and precombustion activities.
See Sections 5.2 and 5.3 for a brief description of the sequence of production for paperfrom primary sources, including forest management and wood procurement, wood residuesproduction, and pulp production (mechanical).
5.5.3 Secondary Textbook Production
This section contains an LCI profile for secondary text book paper production. The datain this profile represents secondary, uncoated groundwood textbook paper made from 15 percentdeinked recovered pulp (DIP) and 85 percent groundwood pulp. This section contains processflow diagrams and descriptions for production processes, LCI data tables for 1 short ton ofproduct. Data quality information for the secondary textbook paper production LCI profile isincluded in Section 5.5.4.
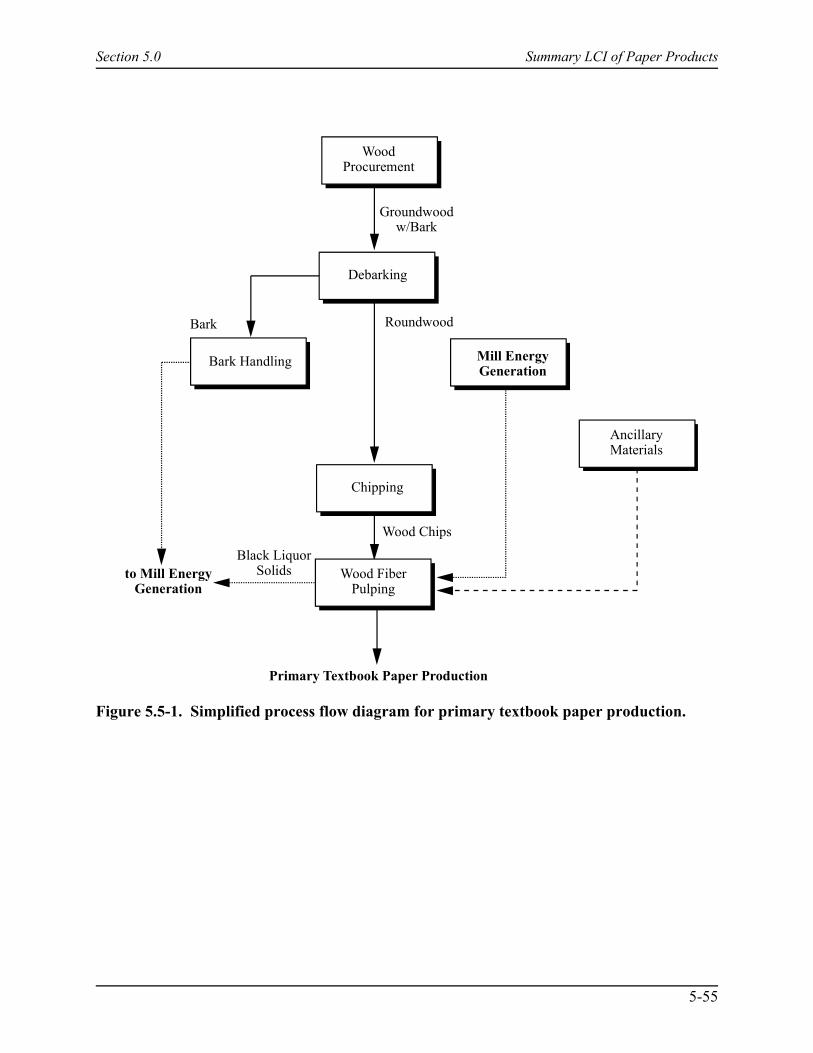
Section 5.0 Summary LCI of Paper Products
5-55
WoodProcurement
Debarking
Bark Handling Mill EnergyGeneration
Groundwoodw/Bark
Roundwood
Chipping
AncillaryMaterials
Wood Chips
Black LiquorSolids Wood Fiber
Pulpingto Mill Energy
Generation
Primary Textbook Paper Production
Bark
Figure 5.5-1. Simplified process flow diagram for primary textbook paper production.

Section 5.0 Summary LCI of Paper Products
5-56
Table 5.5-1. Data for Production of 1 Ton of Primary Textbook Papera
Energy Usage UnitsTotal
(Base Units)Total
(106 Btu)Factor to
Convert to 106 Btu
Combustion Process EnergyElectricity kWh 1.02E+03 1.07E+01 1.05E-02Natural Gas cu ft 7.78E+03 9.03E+00 1.16E-03LPG gal 1.08E-01Coal gal 6.17E+02 7.07E+00 1.15E-02Distillate oil gal 1.58E-01Residual Oil gal 1.94E+01 3.31E+00 1.71E-01Gasoline gal 1.41E-01Diesel gal 1.58E-01Wood Btu 3.20E+06 3.20E+00 1.00E-06Black Liquor Btu 0.00E+00 0.00E+00 1.00E-06
Precombustion Process EnergyNatural Gas cu ft 1.04E+03 1.21E+00 1.16E-03Residual Oil gal 1.06E+00 1.81E-01 1.71E-01Distillate oil gal 8.44E-01 1.34E-01 1.58E-01Gasoline gal 4.57E-01 6.46E-02 1.41E-01LPG gal 2.90E-02 3.12E-03 1.08E-01Coal lb 1.08E+01 1.24E-01 1.15E-02Nuclear lb U238 4.30E-05 4.45E-02 1.04E+03Hydropower Btu 6.81E+03 6.81E-03 1.00E-06Other Btu 6.03E+03 6.03E-03 1.00E-06
Environmental Releases Units Total Process Fuel Related
Atmospheric EmissionsAcreolin lb 3.76E-07 3.76E-07Ammonia lb 9.80E-04 9.80E-04Antimony lb 2.10E-06 2.10E-06Arsenic lb 4.81E-06 4.81E-06Benzene lb 1.41E-06 1.41E-06Beryllium lb 3.61E-07 3.61E-07Cadmium lb 6.66E-06 6.66E-06Carbon Dioxide-fossil lb 5.00E+03 4.80E+03 2.03E+02Carbon Dioxide-nonfossil (1) lb 6.01E+02 6.00E+02 5.32E-01Carbon Dioxide-nonfossil (2) lb -3.54E+03 -3.54E+03 5.32E-01Carbon Monoxide lb 2.04E+00 2.04E+00Carbon Tetrachloride lb 2.68E-06 2.68E-06Chlorine lb 3.57E-05 3.57E-05Chromium lb 5.85E-06 5.85E-06
(continued)
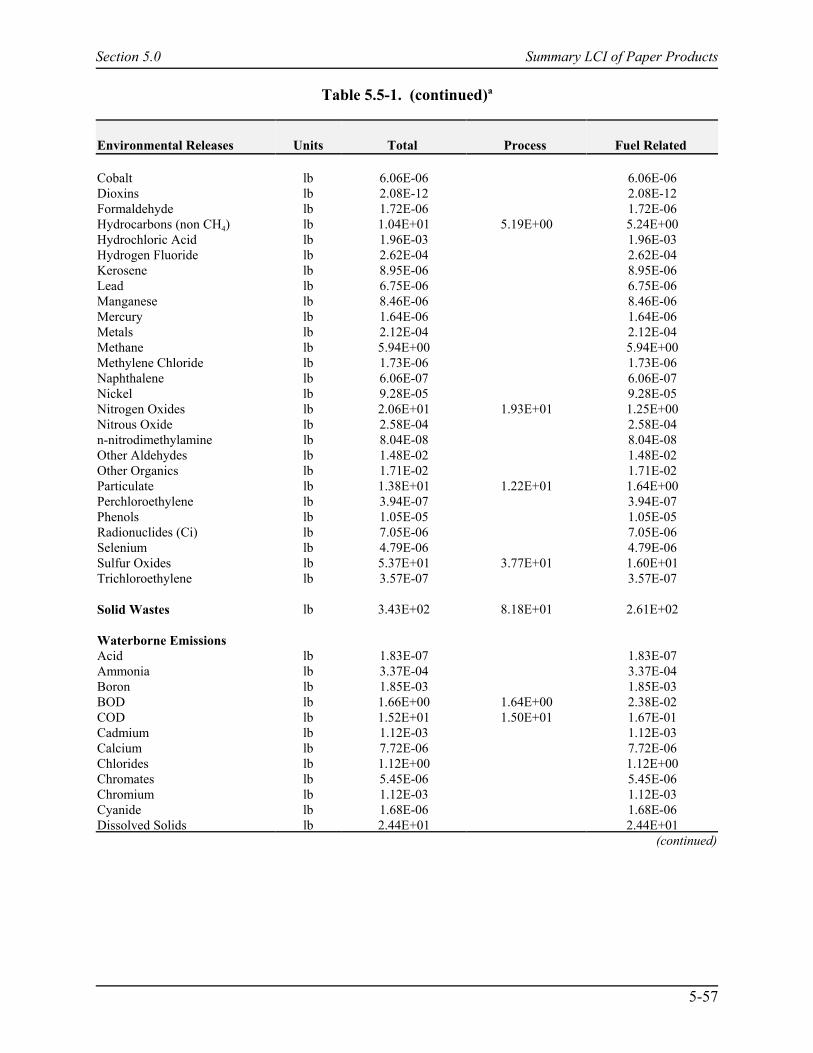
Table 5.5-1. (continued)a
Section 5.0 Summary LCI of Paper Products
5-57
Environmental Releases Units Total Process Fuel Related
Cobalt lb 6.06E-06 6.06E-06Dioxins lb 2.08E-12 2.08E-12Formaldehyde lb 1.72E-06 1.72E-06Hydrocarbons (non CH4) lb 1.04E+01 5.19E+00 5.24E+00Hydrochloric Acid lb 1.96E-03 1.96E-03Hydrogen Fluoride lb 2.62E-04 2.62E-04Kerosene lb 8.95E-06 8.95E-06Lead lb 6.75E-06 6.75E-06Manganese lb 8.46E-06 8.46E-06Mercury lb 1.64E-06 1.64E-06Metals lb 2.12E-04 2.12E-04Methane lb 5.94E+00 5.94E+00Methylene Chloride lb 1.73E-06 1.73E-06Naphthalene lb 6.06E-07 6.06E-07Nickel lb 9.28E-05 9.28E-05Nitrogen Oxides lb 2.06E+01 1.93E+01 1.25E+00Nitrous Oxide lb 2.58E-04 2.58E-04n-nitrodimethylamine lb 8.04E-08 8.04E-08Other Aldehydes lb 1.48E-02 1.48E-02Other Organics lb 1.71E-02 1.71E-02Particulate lb 1.38E+01 1.22E+01 1.64E+00Perchloroethylene lb 3.94E-07 3.94E-07Phenols lb 1.05E-05 1.05E-05Radionuclides (Ci) lb 7.05E-06 7.05E-06Selenium lb 4.79E-06 4.79E-06Sulfur Oxides lb 5.37E+01 3.77E+01 1.60E+01Trichloroethylene lb 3.57E-07 3.57E-07
Solid Wastes lb 3.43E+02 8.18E+01 2.61E+02
Waterborne EmissionsAcid lb 1.83E-07 1.83E-07Ammonia lb 3.37E-04 3.37E-04Boron lb 1.85E-03 1.85E-03BOD lb 1.66E+00 1.64E+00 2.38E-02COD lb 1.52E+01 1.50E+01 1.67E-01Cadmium lb 1.12E-03 1.12E-03Calcium lb 7.72E-06 7.72E-06Chlorides lb 1.12E+00 1.12E+00Chromates lb 5.45E-06 5.45E-06Chromium lb 1.12E-03 1.12E-03Cyanide lb 1.68E-06 1.68E-06Dissolved Solids lb 2.44E+01 2.44E+01
(continued)
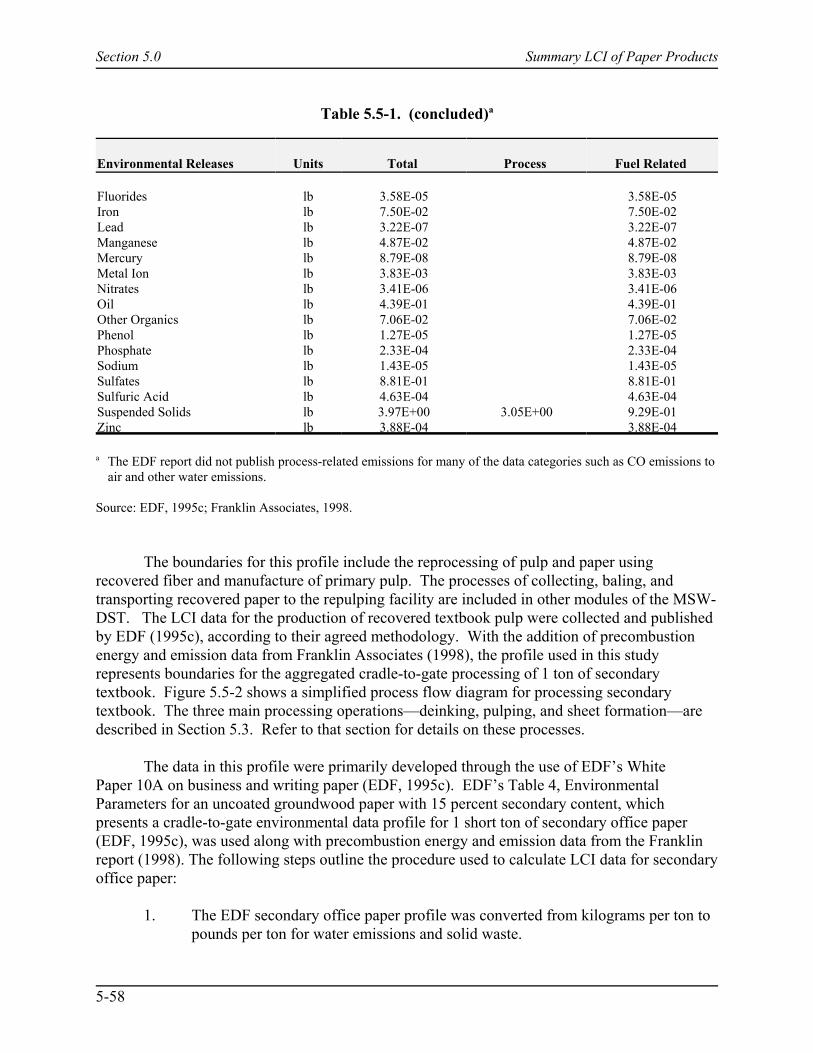
Section 5.0 Summary LCI of Paper Products
5-58
Table 5.5-1. (concluded)a
Environmental Releases Units Total Process Fuel Related
Fluorides lb 3.58E-05 3.58E-05Iron lb 7.50E-02 7.50E-02Lead lb 3.22E-07 3.22E-07Manganese lb 4.87E-02 4.87E-02Mercury lb 8.79E-08 8.79E-08Metal Ion lb 3.83E-03 3.83E-03Nitrates lb 3.41E-06 3.41E-06Oil lb 4.39E-01 4.39E-01Other Organics lb 7.06E-02 7.06E-02Phenol lb 1.27E-05 1.27E-05Phosphate lb 2.33E-04 2.33E-04Sodium lb 1.43E-05 1.43E-05Sulfates lb 8.81E-01 8.81E-01Sulfuric Acid lb 4.63E-04 4.63E-04Suspended Solids lb 3.97E+00 3.05E+00 9.29E-01Zinc lb 3.88E-04 3.88E-04
a The EDF report did not publish process-related emissions for many of the data categories such as CO emissions toair and other water emissions.
Source: EDF, 1995c; Franklin Associates, 1998.
The boundaries for this profile include the reprocessing of pulp and paper usingrecovered fiber and manufacture of primary pulp. The processes of collecting, baling, andtransporting recovered paper to the repulping facility are included in other modules of the MSW-DST. The LCI data for the production of recovered textbook pulp were collected and publishedby EDF (1995c), according to their agreed methodology. With the addition of precombustionenergy and emission data from Franklin Associates (1998), the profile used in this studyrepresents boundaries for the aggregated cradle-to-gate processing of 1 ton of secondarytextbook. Figure 5.5-2 shows a simplified process flow diagram for processing secondarytextbook. The three main processing operations—deinking, pulping, and sheet formation—aredescribed in Section 5.3. Refer to that section for details on these processes.
The data in this profile were primarily developed through the use of EDF’s WhitePaper 10A on business and writing paper (EDF, 1995c). EDF’s Table 4, EnvironmentalParameters for an uncoated groundwood paper with 15 percent secondary content, whichpresents a cradle-to-gate environmental data profile for 1 short ton of secondary office paper(EDF, 1995c), was used along with precombustion energy and emission data from the Franklinreport (1998). The following steps outline the procedure used to calculate LCI data for secondaryoffice paper:
1. The EDF secondary office paper profile was converted from kilograms per ton topounds per ton for water emissions and solid waste.

Section 5.0 Summary LCI of Paper Products
5-59
RecoveredPaper Fiber
AncillaryMaterials
Recovered PaperFiber Pulping
Mill EnergyGeneration
Secondary Textbook Paper
Primary Paper Pulp(see Fig 5.3-1)
85% fiberweight
15% fiberweight
2. The precombustion energy and environmental emissions (air emissions, wateremissions and solid waste emissions) for the fuels and electricity used in theprocess were not included in the EDF published data sets. Hence the appropriateemissions and precombustion energies from the Franklin Associates report (1998)were added to make it a cradle-to-gate profile.
3. To account for the regeneration of wood (from the forest) that accompanies itsremoval as a a result of forest management, this profile assumes that, for everypound of wood used in the paper-making process, an equivalent is regenerated. For every pound of wood consumed in the paper-making process (approximately58 percent of paper weight is wood fiber), 2.2 lb of CO2 is subtracted from theCO2 biomass material balance.
Figure 5-5.2. Simplified process flow diagram for secondary textbook paper production.

Section 5.0 Summary LCI of Paper Products
5-60
Table 5.5-2 summarizes the cradle-to-gate LCI data for secondary textbook paperproduction. Table 5.5-2 breaks down the individual fuels that make up precombustion energyrelated to process fuels and electric energy fuels. Emissions to air and water include allemissions for processing, combustion (including electricity), transportation, and precombustionactivities.
5.5.4 Data Quality
Table 5.5-3 summarizes data quality for primary and secondary textbook paper. EDFdata were based on a thorough survey of North American paper mills. The results determinedhere are thought to be representative of U.S. production. Because secondary data were used toconstruct the textbook paper LCI profiles, measures of precision, consistency, and completenessof information are not available.
Table 5.5-4 shows how certain data in the primary textbook paper LCI profile comparewith data from other public sources, and thus provides a measure of representativeness. In 1992the World Energy Council estimated that, world wide, the pulp and paper industry consumedbetween 17 and 26 million Btu per ton of output (IIED, 1996). That range takes into account allproducts produced by the pulp and paper industry globally, from products such as newsprint,which require comparatively smaller amounts of processing energy and which is quite a differentpaper grade, to primary bleached kraft paper. Table 5.5-4 compares the gross energy data (thesimple sum of combustion process energy and precombustion energy) from this EPA work andEuropean data for different grades of paper. Gross energy can vary by more than 50 percentdepending on the grade of paper compared. Furthermore, there is great variation in emissionsamong the different paper grades compared in Table 5.5-4.
Table 5.5-5 shows how the data in the secondary textbook paper LCI profile comparewith data from other public sources, and thus provides a measure of representativeness. As withprimary paper, there is great variation in inventory data for the different grades of secondarypaper. The main source of data on paper is the SFAEFL database, which profiles many differentpaper grades, among them 100 percent secondary deinked paper and 100 percent secondarynondeinked paper (SFAEFL, 1996). Also shown in Table 5.5-5 are data for newsprint, which isa low-grade paper containing secondary content. Again here, as with primary paper, it must beemphasized that the wide range of different paper grades available will account for largevariations in energy requirements and emissions. Gross energy data (the simple sum ofcombustion process energy and precombustion energy) from the current work is 40 percenthigher than 100 percent secondary deinked paper. This larger variation is likely due to the factthat these two papers differ more significantly than the other papers (secondary office andtelephone book paper) in this study compared with the SFAEFL data. There is greater variationin other emissions, such as CO2.
The data in the primary and secondary textbook paper profiles are considered to be ofaverage quality.
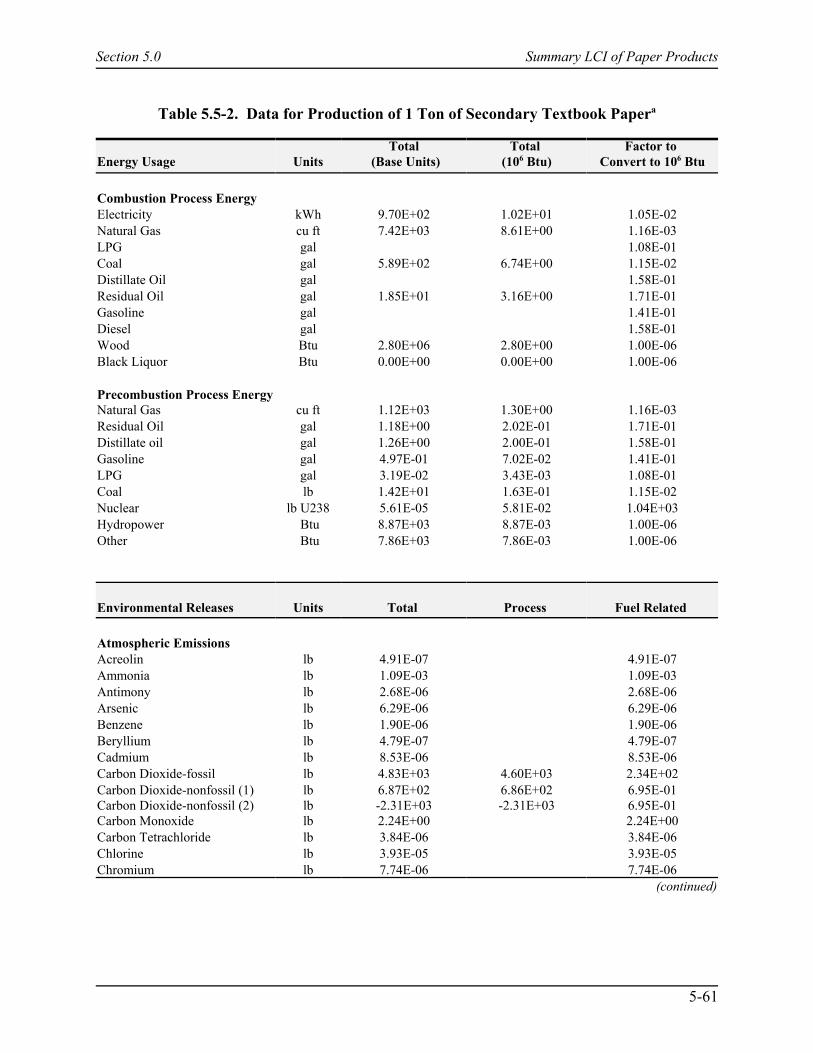
Section 5.0 Summary LCI of Paper Products
5-61
Table 5.5-2. Data for Production of 1 Ton of Secondary Textbook Papera
Energy Usage UnitsTotal
(Base Units)Total
(106 Btu)Factor to
Convert to 106 Btu
Combustion Process EnergyElectricity kWh 9.70E+02 1.02E+01 1.05E-02Natural Gas cu ft 7.42E+03 8.61E+00 1.16E-03LPG gal 1.08E-01Coal gal 5.89E+02 6.74E+00 1.15E-02Distillate Oil gal 1.58E-01Residual Oil gal 1.85E+01 3.16E+00 1.71E-01Gasoline gal 1.41E-01Diesel gal 1.58E-01Wood Btu 2.80E+06 2.80E+00 1.00E-06Black Liquor Btu 0.00E+00 0.00E+00 1.00E-06
Precombustion Process EnergyNatural Gas cu ft 1.12E+03 1.30E+00 1.16E-03Residual Oil gal 1.18E+00 2.02E-01 1.71E-01Distillate oil gal 1.26E+00 2.00E-01 1.58E-01Gasoline gal 4.97E-01 7.02E-02 1.41E-01LPG gal 3.19E-02 3.43E-03 1.08E-01Coal lb 1.42E+01 1.63E-01 1.15E-02Nuclear lb U238 5.61E-05 5.81E-02 1.04E+03Hydropower Btu 8.87E+03 8.87E-03 1.00E-06Other Btu 7.86E+03 7.86E-03 1.00E-06
Environmental Releases Units Total Process Fuel Related
Atmospheric EmissionsAcreolin lb 4.91E-07 4.91E-07Ammonia lb 1.09E-03 1.09E-03Antimony lb 2.68E-06 2.68E-06Arsenic lb 6.29E-06 6.29E-06Benzene lb 1.90E-06 1.90E-06Beryllium lb 4.79E-07 4.79E-07Cadmium lb 8.53E-06 8.53E-06Carbon Dioxide-fossil lb 4.83E+03 4.60E+03 2.34E+02Carbon Dioxide-nonfossil (1) lb 6.87E+02 6.86E+02 6.95E-01Carbon Dioxide-nonfossil (2) lb -2.31E+03 -2.31E+03 6.95E-01Carbon Monoxide lb 2.24E+00 2.24E+00Carbon Tetrachloride lb 3.84E-06 3.84E-06Chlorine lb 3.93E-05 3.93E-05Chromium lb 7.74E-06 7.74E-06
(continued)
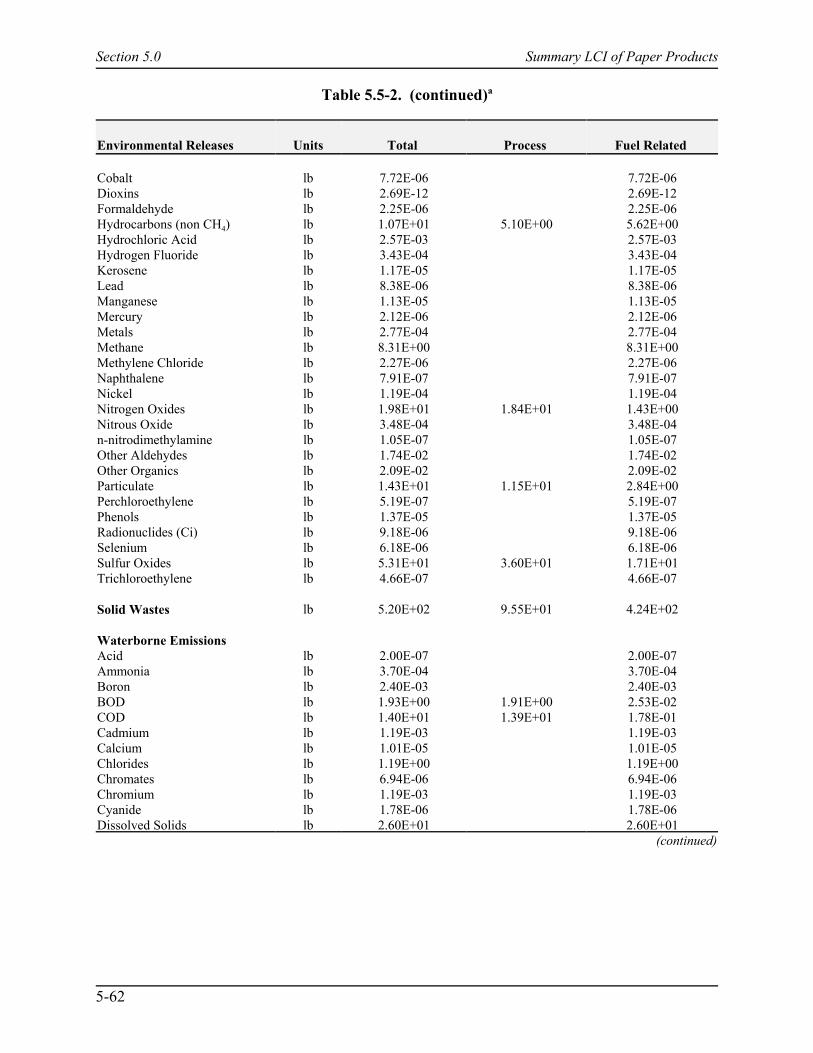
Table 5.5-2. (continued)a
Section 5.0 Summary LCI of Paper Products
5-62
Environmental Releases Units Total Process Fuel Related
Cobalt lb 7.72E-06 7.72E-06Dioxins lb 2.69E-12 2.69E-12Formaldehyde lb 2.25E-06 2.25E-06Hydrocarbons (non CH4) lb 1.07E+01 5.10E+00 5.62E+00Hydrochloric Acid lb 2.57E-03 2.57E-03Hydrogen Fluoride lb 3.43E-04 3.43E-04Kerosene lb 1.17E-05 1.17E-05Lead lb 8.38E-06 8.38E-06Manganese lb 1.13E-05 1.13E-05Mercury lb 2.12E-06 2.12E-06Metals lb 2.77E-04 2.77E-04Methane lb 8.31E+00 8.31E+00Methylene Chloride lb 2.27E-06 2.27E-06Naphthalene lb 7.91E-07 7.91E-07Nickel lb 1.19E-04 1.19E-04Nitrogen Oxides lb 1.98E+01 1.84E+01 1.43E+00Nitrous Oxide lb 3.48E-04 3.48E-04n-nitrodimethylamine lb 1.05E-07 1.05E-07Other Aldehydes lb 1.74E-02 1.74E-02Other Organics lb 2.09E-02 2.09E-02Particulate lb 1.43E+01 1.15E+01 2.84E+00Perchloroethylene lb 5.19E-07 5.19E-07Phenols lb 1.37E-05 1.37E-05Radionuclides (Ci) lb 9.18E-06 9.18E-06Selenium lb 6.18E-06 6.18E-06Sulfur Oxides lb 5.31E+01 3.60E+01 1.71E+01Trichloroethylene lb 4.66E-07 4.66E-07
Solid Wastes lb 5.20E+02 9.55E+01 4.24E+02
Waterborne EmissionsAcid lb 2.00E-07 2.00E-07Ammonia lb 3.70E-04 3.70E-04Boron lb 2.40E-03 2.40E-03BOD lb 1.93E+00 1.91E+00 2.53E-02COD lb 1.40E+01 1.39E+01 1.78E-01Cadmium lb 1.19E-03 1.19E-03Calcium lb 1.01E-05 1.01E-05Chlorides lb 1.19E+00 1.19E+00Chromates lb 6.94E-06 6.94E-06Chromium lb 1.19E-03 1.19E-03Cyanide lb 1.78E-06 1.78E-06Dissolved Solids lb 2.60E+01 2.60E+01
(continued)
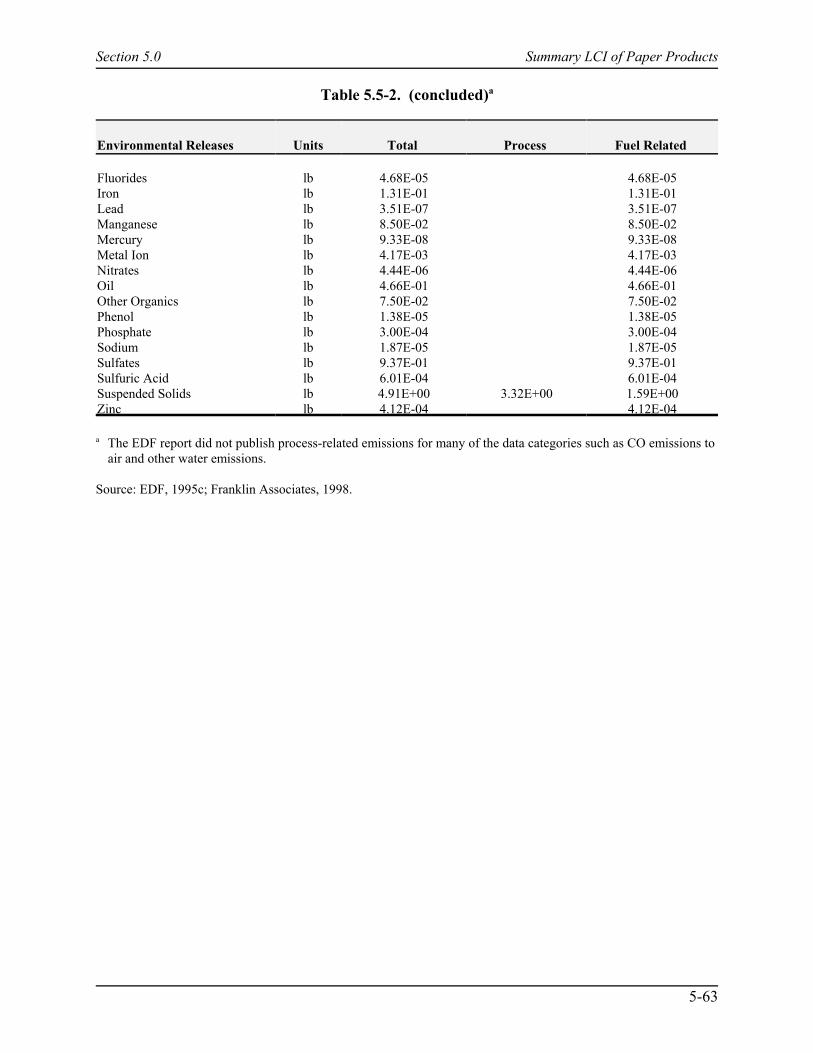
Table 5.5-2. (concluded)a
Section 5.0 Summary LCI of Paper Products
5-63
Environmental Releases Units Total Process Fuel Related
Fluorides lb 4.68E-05 4.68E-05Iron lb 1.31E-01 1.31E-01Lead lb 3.51E-07 3.51E-07Manganese lb 8.50E-02 8.50E-02Mercury lb 9.33E-08 9.33E-08Metal Ion lb 4.17E-03 4.17E-03Nitrates lb 4.44E-06 4.44E-06Oil lb 4.66E-01 4.66E-01Other Organics lb 7.50E-02 7.50E-02Phenol lb 1.38E-05 1.38E-05Phosphate lb 3.00E-04 3.00E-04Sodium lb 1.87E-05 1.87E-05Sulfates lb 9.37E-01 9.37E-01Sulfuric Acid lb 6.01E-04 6.01E-04Suspended Solids lb 4.91E+00 3.32E+00 1.59E+00Zinc lb 4.12E-04 4.12E-04
a The EDF report did not publish process-related emissions for many of the data categories such as CO emissions toair and other water emissions.
Source: EDF, 1995c; Franklin Associates, 1998.
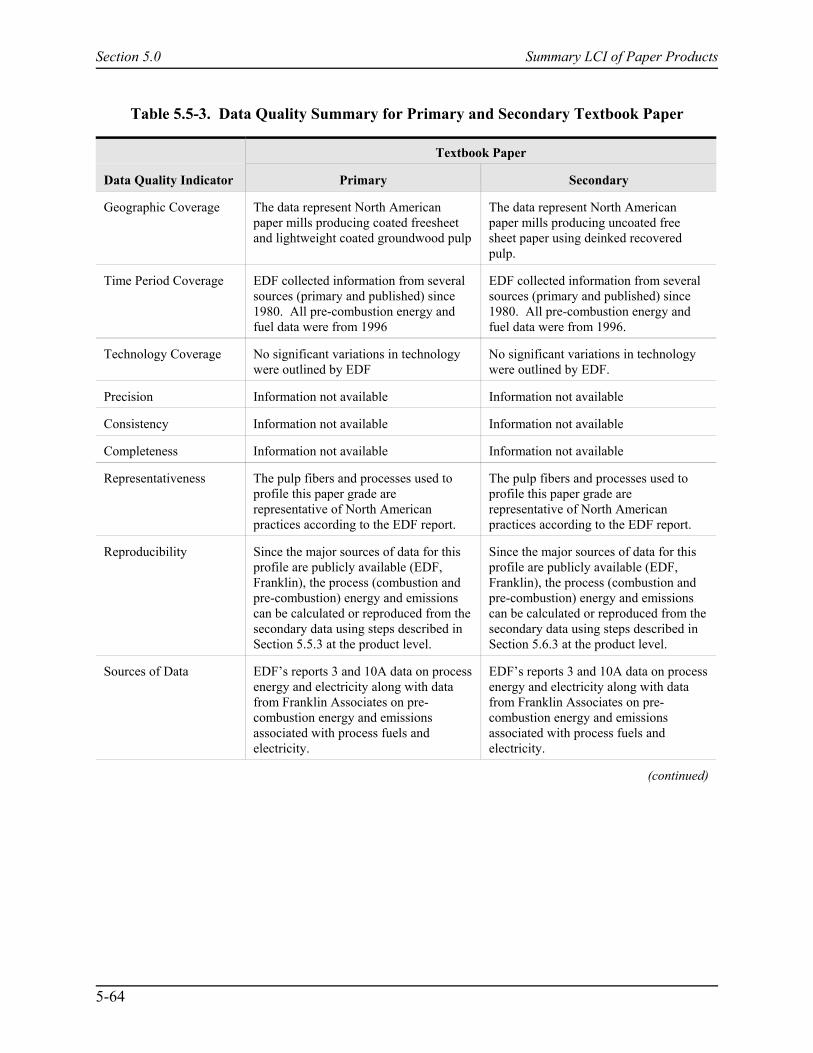
Section 5.0 Summary LCI of Paper Products
5-64
Table 5.5-3. Data Quality Summary for Primary and Secondary Textbook Paper
Textbook Paper
Data Quality Indicator Primary Secondary
Geographic Coverage The data represent North Americanpaper mills producing coated freesheetand lightweight coated groundwood pulp
The data represent North Americanpaper mills producing uncoated freesheet paper using deinked recoveredpulp.
Time Period Coverage EDF collected information from severalsources (primary and published) since1980. All pre-combustion energy andfuel data were from 1996
EDF collected information from severalsources (primary and published) since1980. All pre-combustion energy andfuel data were from 1996.
Technology Coverage No significant variations in technologywere outlined by EDF
No significant variations in technologywere outlined by EDF.
Precision Information not available Information not available
Consistency Information not available Information not available
Completeness Information not available Information not available
Representativeness The pulp fibers and processes used toprofile this paper grade arerepresentative of North Americanpractices according to the EDF report.
The pulp fibers and processes used toprofile this paper grade arerepresentative of North Americanpractices according to the EDF report.
Reproducibility Since the major sources of data for thisprofile are publicly available (EDF,Franklin), the process (combustion andpre-combustion) energy and emissionscan be calculated or reproduced from thesecondary data using steps described inSection 5.5.3 at the product level.
Since the major sources of data for thisprofile are publicly available (EDF,Franklin), the process (combustion andpre-combustion) energy and emissionscan be calculated or reproduced from thesecondary data using steps described inSection 5.6.3 at the product level.
Sources of Data EDF’s reports 3 and 10A data on processenergy and electricity along with datafrom Franklin Associates on pre-combustion energy and emissionsassociated with process fuels andelectricity.
EDF’s reports 3 and 10A data on processenergy and electricity along with datafrom Franklin Associates on pre-combustion energy and emissionsassociated with process fuels andelectricity.
(continued)
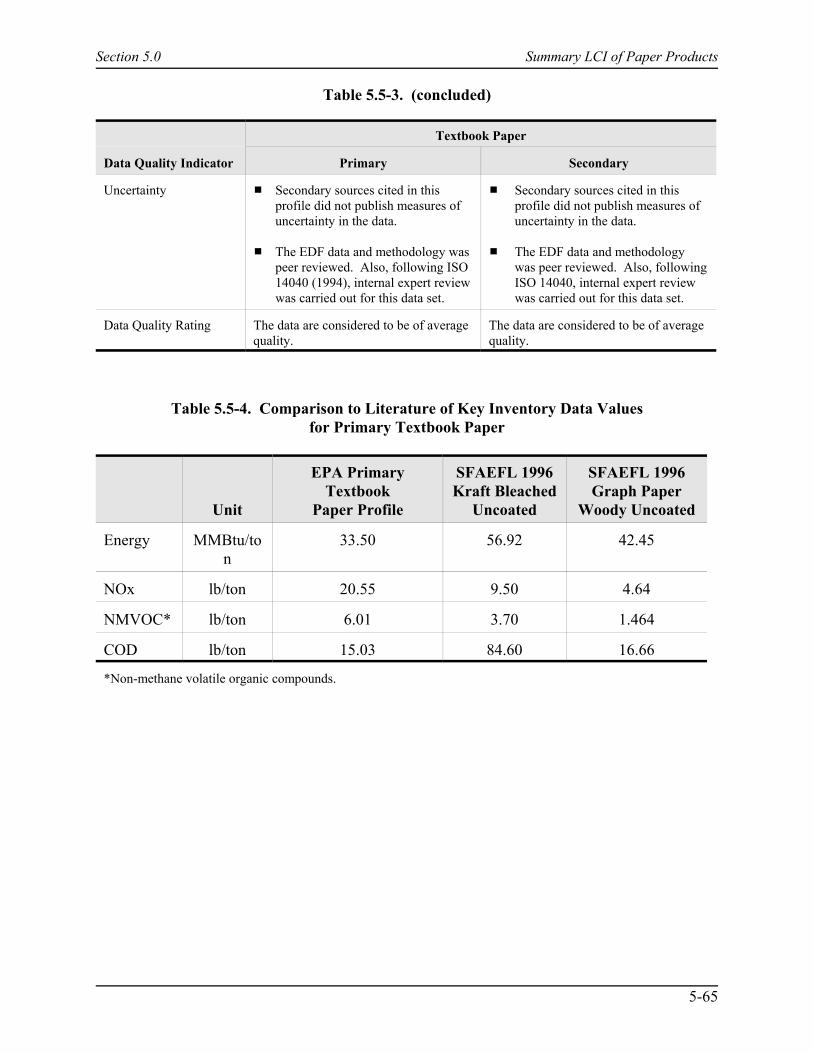
Table 5.5-3. (concluded)
Section 5.0 Summary LCI of Paper Products
Textbook Paper
Data Quality Indicator Primary Secondary
5-65
Uncertainty # Secondary sources cited in thisprofile did not publish measures ofuncertainty in the data.
# The EDF data and methodology waspeer reviewed. Also, following ISO14040 (1994), internal expert reviewwas carried out for this data set.
# Secondary sources cited in thisprofile did not publish measures ofuncertainty in the data.
# The EDF data and methodologywas peer reviewed. Also, followingISO 14040, internal expert reviewwas carried out for this data set.
Data Quality Rating The data are considered to be of averagequality.
The data are considered to be of averagequality.
Table 5.5-4. Comparison to Literature of Key Inventory Data Valuesfor Primary Textbook Paper
Unit
EPA PrimaryTextbook
Paper Profile
SFAEFL 1996Kraft Bleached
Uncoated
SFAEFL 1996Graph Paper
Woody Uncoated
Energy MMBtu/ton
33.50 56.92 42.45
NOx lb/ton 20.55 9.50 4.64
NMVOC* lb/ton 6.01 3.70 1.464
COD lb/ton 15.03 84.60 16.66
*Non-methane volatile organic compounds.

Section 5.0 Summary LCI of Paper Products
5-66
Table 5.5-5. Comparison to Literature of Key Inventory Data Values for Secondary Textbook Paper
Unit
EPASecondaryTextbook
Paper Profile
SFAEFL 1996Recycled(Deinked)
Paper
SFAEFL 1996Recycled Paper
Without Deinking
SFAEFL1996
Newsprint
Energy MMBtu/ton 31.7 20.0 10.4 15.4
NOx lb/ton 19.8 5.3 1.8 3.2
NMVOC* lb/ton 6.0 1.8 0.6 1.0
COD lb/ton 13.9 16.7 0.02 15.1
*Non-methane volatile organic compounds.
5.6 Magazine Paper
5.6.1 Introduction
This section contains an LCI profile for primary and secondary magazine paperproduction, including process flow diagrams and descriptions for production processes and LCIdata tables for 1 short ton of product. Data quality information is provided in Section 5.6.4
5.6.2 Primary Magazine Paper Production
The LCI profile for primary magazine paper production includes the harvesting of trees,transporting of logs (or chips) to the mill, debarking and chipping, and manufacture of pulp andpaper using primary fiber. This LCI data for the production of primary magazine paper pulp wascollected and published EDF, according to their agreed methodology (EDF, 1995c). With theaddition of precombustion energy and emissions data from Franklin Associates (1998), theprofile used in this study represents boundaries for the aggregated cradle-to-gate processing of 1ton of primary magazine paper pulp. Figure 5.6-1 shows a simplified process flow diagram forprocessing primary magazine paper pulp.
The data profile represents primary magazine paper made using lightweight coatedgroundwood primary pulp. The clay coating accounts for 30 percent of the weight; the pulpfurnish, 64 percent, and the remaining 6 percent is moisture (EDF, 1995c). Coated freesheetpaper contains a mix of softwood and hardwood bleached kraft pulp, while the furnish oflightweight coated groundwood papers (LWC) contains an equal mix of bleached softwood kraftand mechanical pulps, which varies with basis weight. The softwood kraft pulp providesstrength; the mechanical pulps impart opacity at low basis weights. The mechanical component
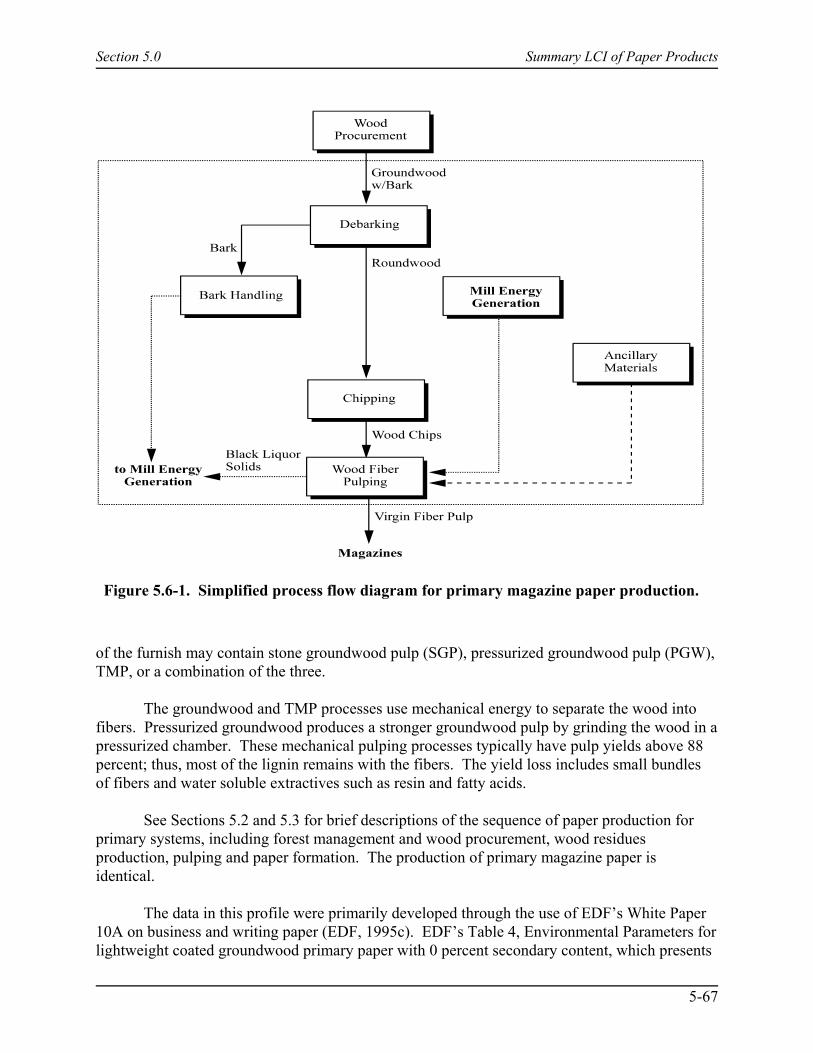
Section 5.0 Summary LCI of Paper Products
5-67
Figure 5.6-1. Simplified process flow diagram for primary magazine paper production.
of the furnish may contain stone groundwood pulp (SGP), pressurized groundwood pulp (PGW),TMP, or a combination of the three.
The groundwood and TMP processes use mechanical energy to separate the wood intofibers. Pressurized groundwood produces a stronger groundwood pulp by grinding the wood in apressurized chamber. These mechanical pulping processes typically have pulp yields above 88percent; thus, most of the lignin remains with the fibers. The yield loss includes small bundlesof fibers and water soluble extractives such as resin and fatty acids.
See Sections 5.2 and 5.3 for brief descriptions of the sequence of paper production forprimary systems, including forest management and wood procurement, wood residuesproduction, pulping and paper formation. The production of primary magazine paper isidentical.
The data in this profile were primarily developed through the use of EDF’s White Paper10A on business and writing paper (EDF, 1995c). EDF’s Table 4, Environmental Parameters forlightweight coated groundwood primary paper with 0 percent secondary content, which presents
Section 5.0 Summary LCI of Paper Products
5-68
a cradle-to-gate environmental data profile for 1 short ton of primary magazine paper, was usedalong with precombustion energy and emissions data published by Franklin Associates (1998).The following steps outline the procedure used to calculate inventory data for primary textbooks
1. The lightweight coated groundwood paper data profile (EDF, 1995c) wasconverted from kilograms per metric ton to pounds per ton for emissions and solidwaste.
2. The precombustion energy and environmental emissions (air emissions, wateremissions and solid waste emissions) for the fuels used in the process were notincluded in the EDF publication; hence, the appropriate emissions andprecombustion energies from the Franklin report were added to make it acradle-to-gate profile.
3. To account for the regeneration of wood (from the forest) that accompanies itsremoval as a result of forest management, this profile assumes that, for everypound of wood used in the paper-making process, an equivalent is regenerated. For every pound of wood consumed in the paper-making process (approximately64 percent of paper weight is wood fiber), 2.2 lb of CO2 is subtracted from thebiomass material balance.
Tables 5.6-1 summarizes the cradle-to-gate LCI data for primary magazine paperproduction. Table 5.6-1 breaks down the individual fuels that make up precombustion energyrelated to process fuels and electric energy fuels. Emissions to air and water include allemissions for processing, combustion (including electricity), transportation, and precombustionactivities.
5.6.3 Secondary Magazine Paper Production
The LCI profile for secondary magazine paper production represents coated groundwoodmagazine paper made using 10 percent DIP and 90 percent primary groundwood fiber. Itcontains process flow diagrams and descriptions for production processes, LCI data tables for 1short ton of product, and a description of data quality.
The boundaries for this profile include the reprocessing of pulp and paper usingrecovered fiber and manufacture of primary pulp. The processes of collecting, baling, andtransporting recovered paper to the repulping facility are included in other modules of the MSW-DST. The LCI data for the production of recovered magazine paper pulp were collected andpublished by EDF (1995c), according to their agreed methodology. With the addition ofprecombustion energy and emission data from Franklin Associates (1998), the profile used inthis study represents boundaries for the aggregated cradle-to-gate processing of 1 ton ofsecondary magazine paper. Figure 5.6-2 shows a simplified process flow diagram for processingsecondary magazine paper.
The data in this profile were primarily developed through the use of EDF’s White Paper10A on business and writing paper (EDF, 1995c). EDF’s Table 4, Environmental Parameters for

Section 5.0 Summary LCI of Paper Products
5-69
lightweight coated groundwood paper with 10 percent secondary content, which presents acradle-to-gate environmental data profile for 1 short ton of secondary office paper, was usedalong with precombustion energy and emission data from the Franklin report (1998). Thefollowing steps outline the procedure used to calculate inventory data for secondary office paper.
1. The EDF lightweight coated groundwood paper with 10 percent secondarycontent paper profile was converted from kilograms per ton to pounds per ton forwater emissions and solid waste.
2. The precombustion energy and environmental emissions (air emissions, wateremissions and solid waste emissions) for the fuels and electricity used in theprocess were not included in the EDF published data sets. Hence the appropriateemissions and precombustion energies from the Franklin Associates report (1998)were added to make it a cradle-to-gate profile.
3. To account for the regeneration of wood (from the forest) that accompanies itsremoval as a a result of forest management, this profile assumes that, for everypound of wood used in the paper-making process, an equivalent is regenerated. For every pound of wood consumed in the paper-making process (approximately58 percent of paper weight is wood fiber), 2.2 lb of CO2 is subtracted from thebiomass material balance.
Table 5.6-2 summarizes the cradle-to-gate LCI data for secondary magazine paperproduction. Table 5.6-2 breaks down the individual fuels that make up precombustion energyrelated to process fuels and electric energy fuels. Emissions to air and water include allemissions for processing, combustion (including electricity), transportation, and precombustionactivities.
5.6.4 Data Quality
Table 5.6-3 summarizes data quality for primary and secondary magazine paperproduction. EDF data were based on a thorough survey of North American paper mills. Theresults determined here are thought to be representative of U.S. production. Because secondarydata were used in this study, precision, consistency, and completeness of information are notavailable. The various data quality measures are defined below
Table 5.6-4 shows how certain data in the primary magazine paper profile compare withdata from other public sources, and thus provides a measure of representativeness. In 1992, theWorld Energy Council estimated that, world wide, the pulp and paper industry consumedbetween 17 and 26 million Btu per ton of output (IIED, 1996). That range takes into account allproducts produced by the pulp and paper industry globally, from products such as newsprint,which is quite a different grade of paper and requires comparatively smaller amounts ofprocessing energy, to primary bleached kraft paper. Table 5.6-4 compares the gross energy data
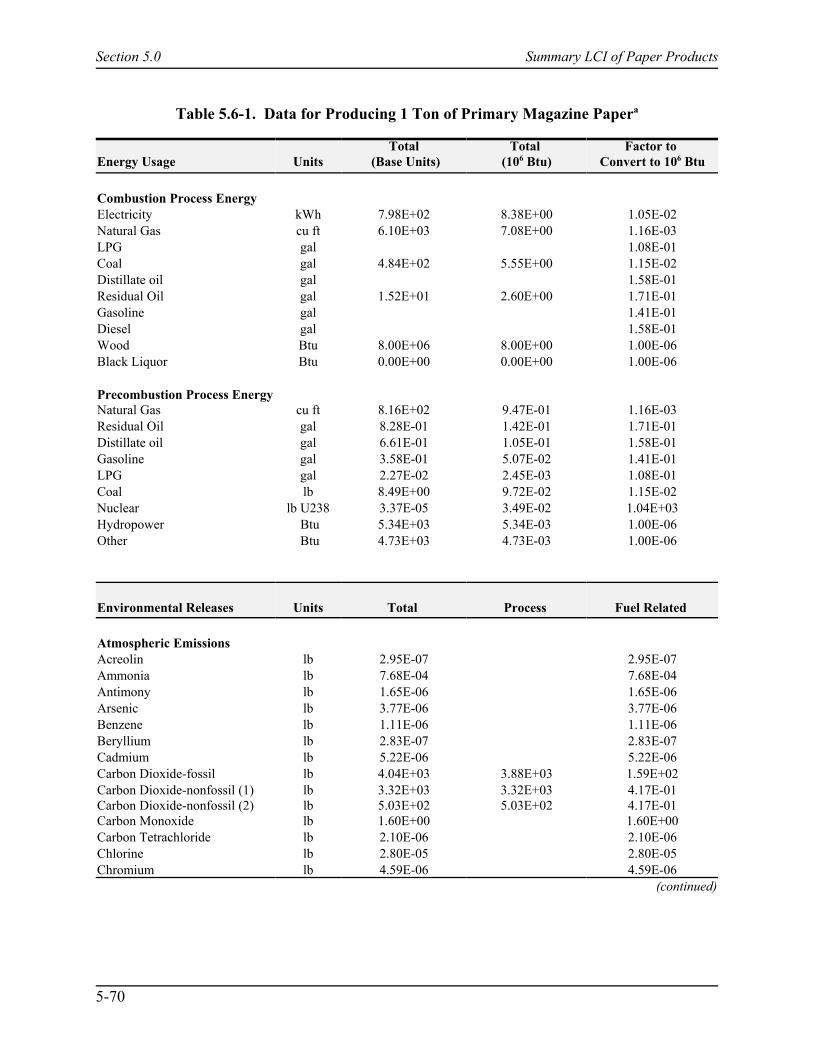
Section 5.0 Summary LCI of Paper Products
5-70
Table 5.6-1. Data for Producing 1 Ton of Primary Magazine Papera
Energy Usage UnitsTotal
(Base Units)Total
(106 Btu)Factor to
Convert to 106 Btu
Combustion Process EnergyElectricity kWh 7.98E+02 8.38E+00 1.05E-02Natural Gas cu ft 6.10E+03 7.08E+00 1.16E-03LPG gal 1.08E-01Coal gal 4.84E+02 5.55E+00 1.15E-02Distillate oil gal 1.58E-01Residual Oil gal 1.52E+01 2.60E+00 1.71E-01Gasoline gal 1.41E-01Diesel gal 1.58E-01Wood Btu 8.00E+06 8.00E+00 1.00E-06Black Liquor Btu 0.00E+00 0.00E+00 1.00E-06
Precombustion Process EnergyNatural Gas cu ft 8.16E+02 9.47E-01 1.16E-03Residual Oil gal 8.28E-01 1.42E-01 1.71E-01Distillate oil gal 6.61E-01 1.05E-01 1.58E-01Gasoline gal 3.58E-01 5.07E-02 1.41E-01LPG gal 2.27E-02 2.45E-03 1.08E-01Coal lb 8.49E+00 9.72E-02 1.15E-02Nuclear lb U238 3.37E-05 3.49E-02 1.04E+03Hydropower Btu 5.34E+03 5.34E-03 1.00E-06Other Btu 4.73E+03 4.73E-03 1.00E-06
Environmental Releases Units Total Process Fuel Related
Atmospheric EmissionsAcreolin lb 2.95E-07 2.95E-07Ammonia lb 7.68E-04 7.68E-04Antimony lb 1.65E-06 1.65E-06Arsenic lb 3.77E-06 3.77E-06Benzene lb 1.11E-06 1.11E-06Beryllium lb 2.83E-07 2.83E-07Cadmium lb 5.22E-06 5.22E-06Carbon Dioxide-fossil lb 4.04E+03 3.88E+03 1.59E+02Carbon Dioxide-nonfossil (1) lb 3.32E+03 3.32E+03 4.17E-01Carbon Dioxide-nonfossil (2) lb 5.03E+02 5.03E+02 4.17E-01Carbon Monoxide lb 1.60E+00 1.60E+00Carbon Tetrachloride lb 2.10E-06 2.10E-06Chlorine lb 2.80E-05 2.80E-05Chromium lb 4.59E-06 4.59E-06
(continued)

Table 5.6-1. (continued)a
Section 5.0 Summary LCI of Paper Products
5-71
Environmental Releases Units Total Process Fuel Related
Cobalt lb 4.75E-06 4.75E-06Dioxins lb 1.63E-12 1.63E-12Formaldehyde lb 1.35E-06 1.35E-06Hydrocarbons (non CH4) lb 9.34E+00 5.23E+00 4.11E+00Hydrochloric Acid lb 1.54E-03 1.54E-03Hydrogen Fluoride lb 2.05E-04 2.05E-04Kerosene lb 7.02E-06 7.02E-06Lead lb 5.29E-06 5.29E-06Manganese lb 6.63E-06 6.63E-06Mercury lb 1.29E-06 1.29E-06Metals lb 1.66E-04 1.66E-04Methane lb 4.66E+00 4.66E+00Methylene Chloride lb 1.36E-06 1.36E-06Naphthalene lb 4.75E-07 4.75E-07Nickel lb 7.28E-05 7.28E-05Nitrogen Oxides lb 1.68E+01 1.58E+01 9.83E-01Nitrous Oxide lb 2.03E-04 2.03E-04n-nitrodimethylamine lb 6.30E-08 6.30E-08Other Aldehydes lb 1.16E-02 1.16E-02Other Organics lb 1.34E-02 1.34E-02Particulate lb 1.18E+01 1.05E+01 1.29E+00Perchloroethylene lb 3.09E-07 3.09E-07Phenols lb 8.25E-06 8.25E-06Radionuclides (Ci) lb 5.53E-06 5.53E-06Selenium lb 3.75E-06 3.75E-06Sulfur Oxides lb 4.42E+01 3.16E+01 1.26E+01Trichloroethylene lb 2.80E-07 2.80E-07
Solid Waste lb 2.91E+02 8.64E+01 2.05E+02
Waterborne EmissionsAcid lb 1.44E-07 1.44E-07Ammonia lb 2.64E-04 2.64E-04Boron lb 1.45E-03 1.45E-03BOD lb 2.34E+00 2.32E+00 1.87E-02COD lb 1.89E+01 1.88E+01 1.31E-01Cadmium lb 8.77E-04 8.77E-04Calcium lb 6.06E-06 6.06E-06Chlorides lb 8.77E-01 8.77E-01Chromates lb 4.27E-06 4.27E-06Chromium lb 8.77E-04 8.77E-04Cyanide lb 1.31E-06 1.31E-06Dissolved Solids lb 1.95E+01 3.18E-01 1.92E+01
(continued)

Table 5.6-1. (concluded)a
Section 5.0 Summary LCI of Paper Products
5-72
Environmental Releases Units Total Process Fuel Related
Fluorides lb 2.81E-05 2.81E-05Iron lb 5.88E-02 5.88E-02Lead lb 2.52E-07 2.52E-07Manganese lb 3.82E-02 3.82E-02Mercury lb 6.89E-08 6.89E-08Metal Ion lb 3.00E-03 3.00E-03Nitrates lb 2.67E-06 2.67E-06Oil lb 3.44E-01 3.44E-01Other Organics lb 5.53E-02 5.53E-02Phenol lb 9.94E-06 9.94E-06Phosphate lb 1.83E-04 1.83E-04Sodium lb 1.12E-05 1.12E-05Sulfates lb 6.91E-01 6.91E-01Sulfuric Acid lb 3.63E-04 3.63E-04Suspended Solids lb 4.09E+00 3.36E+00 7.28E-01Zinc lb 3.04E-04 3.04E-04
a The EDF report did not publish process-related emissions for many of the data categories such as CO emissions toair and other water emissions.
Source: EDF, 1995c; Franklin Associates, 1998.

Section 5.0 Summary LCI of Paper Products
5-73
RecoveredPaper Fiber
AncillaryMaterials
Recovered PaperFiber Pulping
Mill EnergyGeneration
Secondary Magazine Paper
Primary Paper Pulp(see Fig 5.5-1)
90% fiberweight
10% fiberweight
Figure 5.6-2. Simplified process flow diagram for secondary magazine paper production.

Section 5.0 Summary LCI of Paper Products
5-74
Table 5.6-2. Data for Producing 1 Ton of Secondary Magazine Papera
Energy Usage UnitsTotal
(Base Units)Total
(106 Btu)Factor to
Convert to 106 Btu
Combustion Process EnergyElectricity kWh 7.88E+02 8.27E+00 1.05E-02Natural Gas cu ft 6.03E+03 6.99E+00 1.16E-03LPG gal 1.08E-01Coal gal 4.78E+02 5.48E+00 1.15E-02Distillate oil gal 1.58E-01Residual Oil gal 1.50E+01 2.56E+00 1.71E-01Gasoline gal 1.41E-01Diesel gal 1.58E-01Wood Btu 7.30E+06 7.30E+00 1.00E-06Black Liquor Btu 0.00E+00 0.00E+00 1.00E-06
Precombustion Process EnergyNatural Gas cu ft 8.06E+02 9.35E-01 1.16E-03Residual Oil gal 8.18E-01 1.40E-01 1.71E-01Distillate oil gal 6.53E-01 1.03E-01 1.58E-01Gasoline gal 3.54E-01 5.00E-02 1.41E-01LPG gal 2.24E-02 2.42E-03 1.08E-01Coal lb 8.38E+00 9.60E-02 1.15E-02Nuclear lb U238 3.33E-05 3.45E-02 1.04E+03Hydropower Btu 5.27E+03 5.27E-03 1.00E-06Other Btu 4.67E+03 4.67E-03 1.00E-06
Environmental Releases Units Total Process Fuel Related
Atmospheric EmissionsAcreolin lb 2.91E-07 2.91E-07Ammonia lb 7.58E-04 7.58E-04Antimony lb 1.63E-06 1.63E-06Arsenic lb 3.72E-06 3.72E-06Benzene lb 1.09E-06 1.09E-06Beryllium lb 2.79E-07 2.79E-07Cadmium lb 5.15E-06 5.15E-06Carbon Dioxide-fossil lb 3.99E+03 3.83E+03 1.57E+02Carbon Dioxide-nonfossil (1) lb 2.97E+03 2.97E+03 4.12E-01Carbon Dioxide-nonfossil (2) lb 4.34E+02 4.33E+02 4.12E-01Carbon Monoxide lb 1.58E+00 1.58E+00Carbon Tetrachloride lb 2.08E-06 2.08E-06Chlorine lb 2.76E-05 2.76E-05Chromium lb 4.53E-06 4.53E-06
(continued)

Table 5.6-2. (continued)a
Section 5.0 Summary LCI of Paper Products
5-75
Environmental Releases Units Total Process Fuel Related
Cobalt lb 4.69E-06 4.69E-06Dioxins lb 1.61E-12 1.61E-12Formaldehyde lb 1.33E-06 1.33E-06Hydrocarbons (non CH4) lb 9.05E+00 4.99E+00 4.06E+00Hydrochloric Acid lb 1.52E-03 1.52E-03Hydrogen Fluoride lb 2.02E-04 2.02E-04Kerosene lb 6.93E-06 6.93E-06Lead lb 5.23E-06 5.23E-06Manganese lb 6.55E-06 6.55E-06Mercury lb 1.27E-06 1.27E-06Metals lb 1.64E-04 1.64E-04Methane lb 4.60E+00 4.60E+00Methylene Chloride lb 1.34E-06 1.34E-06Naphthalene lb 4.69E-07 4.69E-07Nickel lb 7.19E-05 7.19E-05Nitrogen Oxides lb 1.65E+01 1.55E+01 9.71E-01Nitrous Oxide lb 2.00E-04 2.00E-04n-nitrodimethylamine lb 6.22E-08 6.22E-08Other Aldehydes lb 1.14E-02 1.14E-02Other Organics lb 1.32E-02 1.32E-02Particulate lb 1.14E+01 1.01E+01 1.27E+00Perchloroethylene lb 3.05E-07 3.05E-07Phenols lb 8.14E-06 8.14E-06Radionuclides (Ci) lb 5.46E-06 5.46E-06Selenium lb 3.70E-06 3.70E-06Sulfur Oxides lb 4.34E+01 3.10E+01 1.24E+01Trichloroethylene lb 2.76E-07 2.76E-07
Solid Wastes lb 2.97E+02 9.55E+01 2.02E+02
Waterborne EmissionsAcid lb 1.42E-07 1.42E-07Ammonia lb 2.61E-04 2.61E-04Boron lb 1.43E-03 1.43E-03BOD lb 2.47E+00 2.45E+00 1.84E-02COD lb 2.38E+01 2.36E+01 1.29E-01Cadmium lb 8.66E-04 8.66E-04Calcium lb 5.98E-06 5.98E-06Chlorides lb 8.66E-01 8.66E-01Chromates lb 4.22E-06 4.22E-06Chromium lb 8.66E-04 8.66E-04Cyanide lb 1.30E-06 1.30E-06Dissolved Solids lb 1.92E+01 2.73E-01 1.89E+01
(continued)
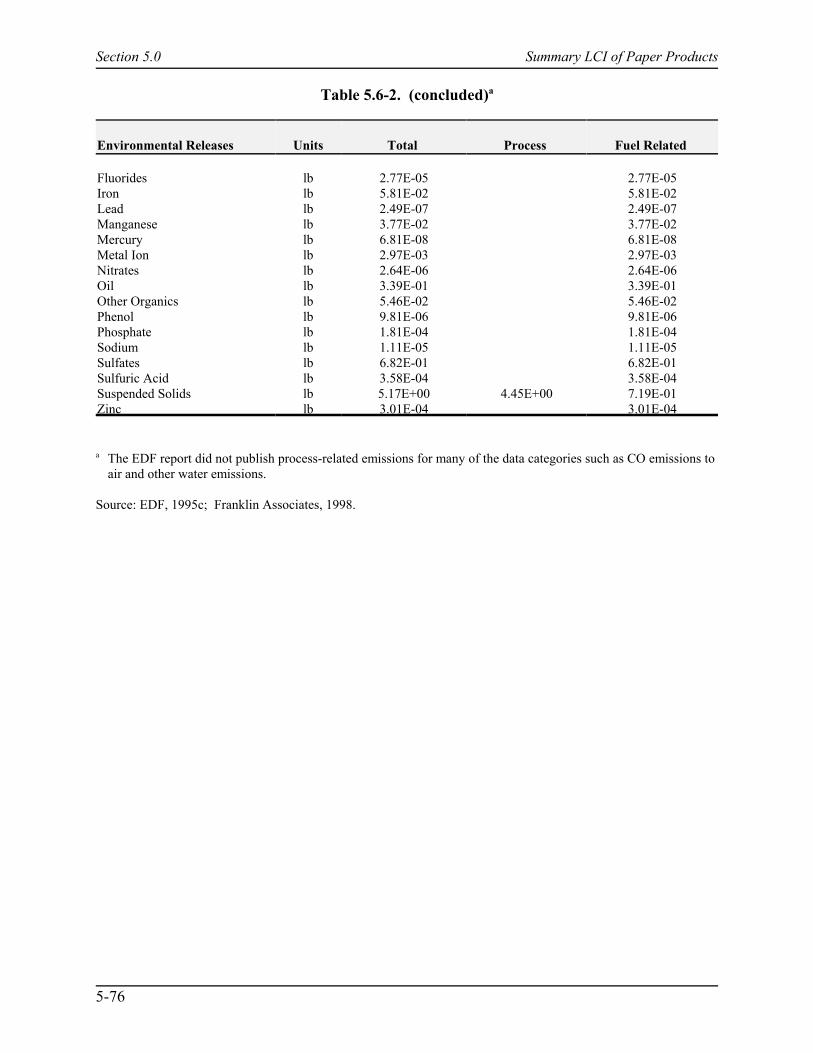
Table 5.6-2. (concluded)a
Section 5.0 Summary LCI of Paper Products
5-76
Environmental Releases Units Total Process Fuel Related
Fluorides lb 2.77E-05 2.77E-05Iron lb 5.81E-02 5.81E-02Lead lb 2.49E-07 2.49E-07Manganese lb 3.77E-02 3.77E-02Mercury lb 6.81E-08 6.81E-08Metal Ion lb 2.97E-03 2.97E-03Nitrates lb 2.64E-06 2.64E-06Oil lb 3.39E-01 3.39E-01Other Organics lb 5.46E-02 5.46E-02Phenol lb 9.81E-06 9.81E-06Phosphate lb 1.81E-04 1.81E-04Sodium lb 1.11E-05 1.11E-05Sulfates lb 6.82E-01 6.82E-01Sulfuric Acid lb 3.58E-04 3.58E-04Suspended Solids lb 5.17E+00 4.45E+00 7.19E-01Zinc lb 3.01E-04 3.01E-04
a The EDF report did not publish process-related emissions for many of the data categories such as CO emissions toair and other water emissions.
Source: EDF, 1995c; Franklin Associates, 1998.

Section 5.0 Summary LCI of Paper Products
5-77
Table 5.6-3. Data Quality Summary for Primary and Secondary Magazine Paper
Magazine Paper
Data Quality Indicator Primary Secondary
Geographic Coverage The data represent North Americanpaper mills producing uncoated freesheet paper using bleached Kraft pulp.
The data represent North Americanpaper mills producing newsprint usingdeinked recovered pulp.
Time Period Coverage EDF collected information from severalsources (primary and published) since1980. All pre-combustion energy andfuel data were from 1996.
EDF collected information from severalsources (primary and published) since1980. All pre-combustion energy andfuel data were from 1996.
Technology Coverage No significant variations in technologywere outlined by EDF
No significant variations in technologywere outlined by EDF.
Precision Information not available Information not available
Consistency Information not available Information not available
Completeness Information not available Information not available
Representativeness The pulp fibers and processes used toprofile this paper grade arerepresentative of North Americanpractices according to the EDF report.
The pulp fibers and processes used toprofile this paper grade arerepresentative of North Americanpractices according to the EDF report.
Reproducibility Since the major sources of data for thisprofile are publicly available (EDF,Franklin), the process (combustion andpre-combustion) energy and emissionscan be calculated or reproduced from thesecondary data using steps described inSection 5.6.3 at the product level.
Since the major sources of data for thisprofile are publicly available (EDF,Franklin), the process (combustion andpre-combustion) energy and emissionscan be calculated or reproduced from thesecondary data using steps described inSection 5.6.3 at the product level.
Sources of Data EDF’s reports 3 and 10A data on processenergy and electricity along with datafrom Franklin Associates on pre-combustion energy and emissionsassociated with process fuels andelectricity.
EDF’s reports 3 and 10A data on processenergy and electricity along with datafrom Franklin Associates on pre-combustion energy and emissionsassociated with process fuels andelectricity.
Uncertainty # Secondary sources cited in thisprofile did not publish measures ofuncertainty in the data.
# The EDF data and methodology waspeer reviewed. Also, following IS014040 (1994), internal expert reviewwas carried out for this data set.
# Secondary sources cited in thisprofile did not publish measures ofuncertainty in the data.
# The EDF data and methodologywas peer reviewed. Also, followingIS0 14040, internal expert reviewwas carried out for this data set.
Data Quality Rating The data are considered to be of averagequality.
The data are considered to be of averagequality.
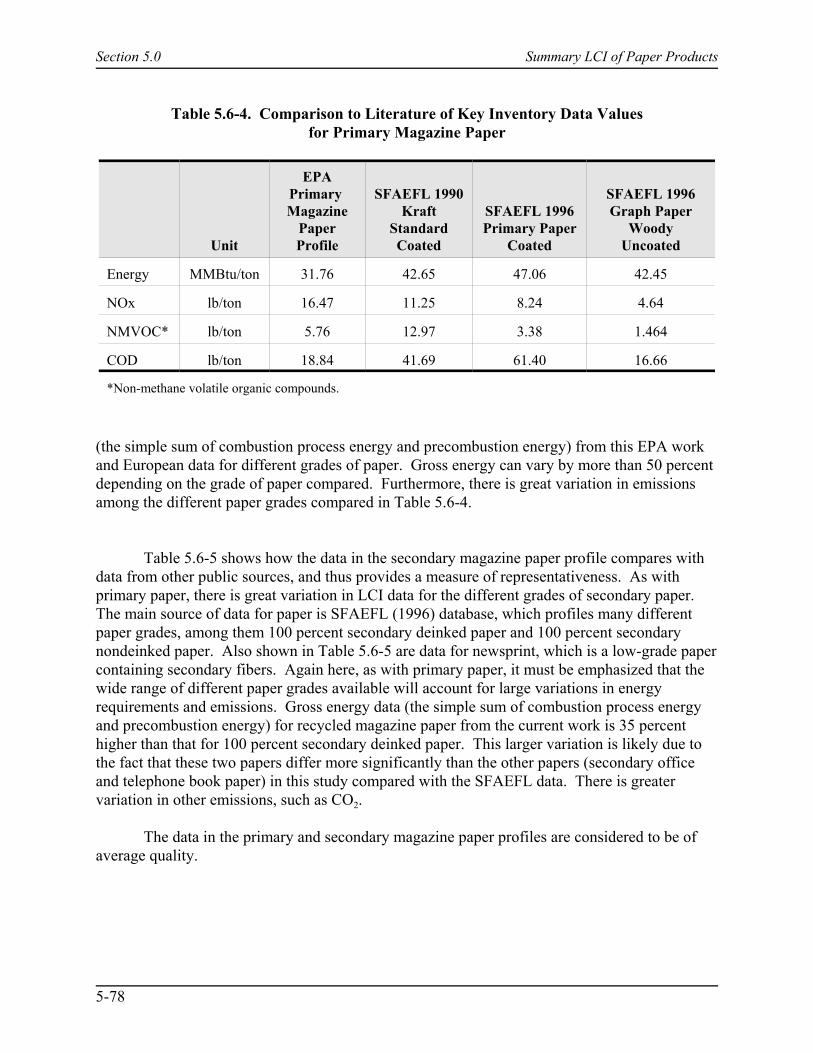
Section 5.0 Summary LCI of Paper Products
5-78
Table 5.6-4. Comparison to Literature of Key Inventory Data Valuesfor Primary Magazine Paper
Unit
EPAPrimary Magazine
PaperProfile
SFAEFL 1990Kraft
StandardCoated
SFAEFL 1996Primary Paper
Coated
SFAEFL 1996Graph Paper
WoodyUncoated
Energy MMBtu/ton 31.76 42.65 47.06 42.45
NOx lb/ton 16.47 11.25 8.24 4.64
NMVOC* lb/ton 5.76 12.97 3.38 1.464
COD lb/ton 18.84 41.69 61.40 16.66
*Non-methane volatile organic compounds.
(the simple sum of combustion process energy and precombustion energy) from this EPA workand European data for different grades of paper. Gross energy can vary by more than 50 percentdepending on the grade of paper compared. Furthermore, there is great variation in emissionsamong the different paper grades compared in Table 5.6-4.
Table 5.6-5 shows how the data in the secondary magazine paper profile compares withdata from other public sources, and thus provides a measure of representativeness. As withprimary paper, there is great variation in LCI data for the different grades of secondary paper. The main source of data for paper is SFAEFL (1996) database, which profiles many differentpaper grades, among them 100 percent secondary deinked paper and 100 percent secondarynondeinked paper. Also shown in Table 5.6-5 are data for newsprint, which is a low-grade papercontaining secondary fibers. Again here, as with primary paper, it must be emphasized that thewide range of different paper grades available will account for large variations in energyrequirements and emissions. Gross energy data (the simple sum of combustion process energyand precombustion energy) for recycled magazine paper from the current work is 35 percenthigher than that for 100 percent secondary deinked paper. This larger variation is likely due tothe fact that these two papers differ more significantly than the other papers (secondary officeand telephone book paper) in this study compared with the SFAEFL data. There is greatervariation in other emissions, such as CO2.
The data in the primary and secondary magazine paper profiles are considered to be ofaverage quality.

Section 5.0 Summary LCI of Paper Products
5-79
Table 5.6-5. Comparison to Literature of Key Inventory Data Valuesfor Secondary Magazine Paper
Unit
EPASecondary Magazine
Paper Profile
SFAEFL 1996Secondary(Deinked)
Paper
SFAEFL 1996Secondary
Paper WithoutDeinking
SFAEFL 1996Newsprint
Energy MMBtu/ton
30.8 20.0 10.4 15.4
NOx lb/ton 16.5 5.3 1.8 3.2
NMVOC* lb/ton 5.8 1.8 0.6 1.0
COD lb/ton 23.7 16.7 0.02 15.1
*Non-methane volatile organic compounds.
5.7 Telephone Book Paper
5.7.1 Introduction
This section contains LCI profiles for the production of primary and secondary rolls oftelephone book paper and includes process flow diagrams and descriptions for productionprocesses, description of data quality followed by LCI data tables for one short ton of primaryand secondary paper rolls.
5.7.2 Primary Telephone Book Paper Production
The data profile represents primary telephone book paper made using thermomechanicalpulp (TMP). The boundaries for this study include the harvesting of trees, transporting of logs(or chips) to the mill, debarking and chipping, and manufacture of pulp and paper using primaryand secondary fiber. The LCI data for the production of primary telephone book pulp wascollected and published by EDF, according to their agreed methodology (EDF, 1995a). With theaddition of pre-combustion energy and emissions data from Franklin Associates (1998), theprofile used in this study represents boundaries for the aggregated cradle-to-gate processing of 1ton of primary telephone book pulp. Figure 5.7-1 shows a simplified process flow diagram forprocessing primary telephone book pulp.
See Sections 5.2 and 5.3 for a brief description of the sequence of production for primaryoffice paper, including forest management and wood procurement, wood residues production,pulp production, and paper formation. The production of primary telephone book paper isidentical.
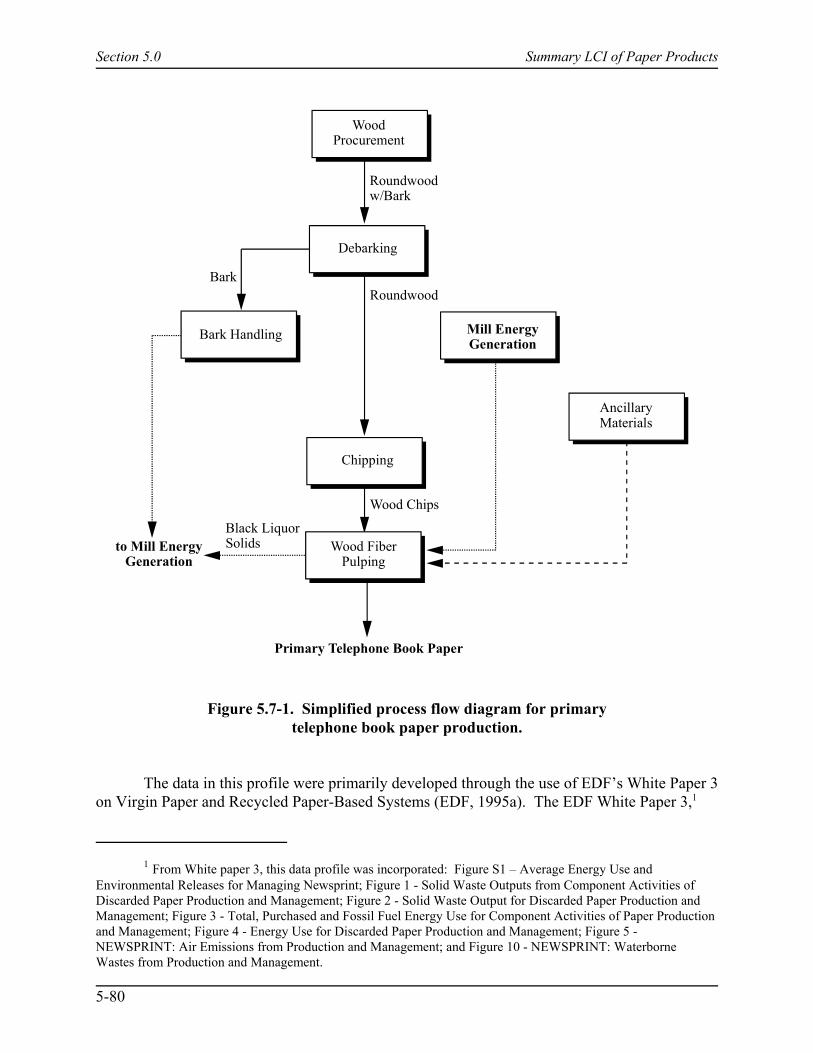
Section 5.0 Summary LCI of Paper Products
1 From White paper 3, this data profile was incorporated: Figure S1 – Average Energy Use andEnvironmental Releases for Managing Newsprint; Figure 1 - Solid Waste Outputs from Component Activities ofDiscarded Paper Production and Management; Figure 2 - Solid Waste Output for Discarded Paper Production andManagement; Figure 3 - Total, Purchased and Fossil Fuel Energy Use for Component Activities of Paper Productionand Management; Figure 4 - Energy Use for Discarded Paper Production and Management; Figure 5 -NEWSPRINT: Air Emissions from Production and Management; and Figure 10 - NEWSPRINT: WaterborneWastes from Production and Management.
5-80
WoodProcurement
Debarking
Bark Handling Mill EnergyGeneration
Roundwoodw/Bark
Roundwood
Chipping
AncillaryMaterials
Wood Chips
Black LiquorSolids Wood Fiber
Pulpingto Mill Energy
Generation
Primary Telephone Book Paper
Bark
Figure 5.7-1. Simplified process flow diagram for primarytelephone book paper production.
The data in this profile were primarily developed through the use of EDF’s White Paper 3on Virgin Paper and Recycled Paper-Based Systems (EDF, 1995a). The EDF White Paper 3,1
Section 5.0 Summary LCI of Paper Products
5-81
which presents a cradle-to-gate environmental data profile for 1 short ton of primary telephonebook paper, was used along with precombustion energy and emissions data published byFranklin Associates (1998). The following steps outline the procedure used to calculate LCI datafor primary telephone book paper:
1. The primary telephone book data profile (EDF) was converted from kilograms permetric ton to pounds per ton for water emissions and solid waste.
2. The precombustion energy and environmental emissions (air emissions, wateremissions and solid waste emissions) for the fuels used in the process were notincluded in the EDF publication; hence, the appropriate emissions andprecombustion energies from the Franklin report were added to make it acradle-to-gate profile.
3. To account for the regeneration of wood (from the forest) that accompanies itsremoval as a result of forest management, this profile assumes that, for everypound of wood used in the paper making process, an equivalent is regenerated.For every pound of wood consumed in the paper-making process (approximately88 percent of paper weight is wood fiber), 2.2 lb of CO2 is subtracted from thebiomass material balance.
Table 5.7-1 summarizes the cradle-to-gate LCI data for primary telephone book paperproduction. Table 5.7-1 breaks down the individual fuels that make up precombustion energyrelated to process fuels and electric energy fuels. Emissions to air and water include allemissions for processing, combustion (including electricity), transportation, and pre-combustionactivities.
5.7.3 Secondary Telephone Book Paper Production
This sections contains an LCI profile for the production of secondary telephone bookpaper, representing 100 percent recovered fiber. It contains process flow diagrams anddescriptions for production processes, description of data quality followed by LCI data tables forone short ton of product. The data in this profile represents secondary telephone book papermade using 100 percent DIP. See Section 5.3.5 for a description of the DIP process.
The boundaries for this profile include remanufacturing of pulp and paper usingrecovered fiber. The processes of collecting, baling, and transporting recovered paper to therepulping facility are included in other modules of the MSW-DST. The LCI data for theproduction of secondary telephone book pulp were collected and published by EDF (1995a),according to their agreed methodology. With the addition of precombustion energy andemission data from Franklin Associates (1998), the profile used in this study representsboundaries for the aggregated cradle-to-gate processing of one ton of secondary telephone book. Figure 5.7-2 shows a simplified process flow diagram for processing secondary telephone book.

Section 5.0 Summary LCI of Paper Products
5-82
Table 5.7-1. Data for Producing 1 Ton of Primary Telephone Book Papera
Energy Usage UnitsTotal
(Base Units)Total
(106 Btu)Factor to
Convert to 106 Btu
Combustion Process EnergyElectricity kWh 1.15E+03 1.21E+01 1.05E-02Natural Gas cu ft 8.82E+03 1.02E+01 1.16E-03LPG gal 1.08E-01Coal gal 6.99E+02 8.01E+00 1.15E-02Distillate oil gal 1.58E-01Residual Oil gal 2.19E+01 3.75E+00 1.71E-01Gasoline gal 1.41E-01Diesel gal 1.58E-01Wood Btu 9.45E+05 9.45E-01 1.00E-06Black Liquor Btu 2.56E+06 2.56E+00 1.00E-06
Precombustion Process EnergyNatural Gas cu ft 1.18E+03 1.37E+00 1.16E-03Residual Oil gal 1.20E+00 2.05E-01 1.71E-01Distillate oil gal 9.56E-01 1.51E-01 1.58E-01Gasoline gal 5.18E-01 7.32E-02 1.41E-01LPG gal 3.29E-02 3.54E-03 1.08E-01Coal lb 1.23E+01 1.41E-01 1.15E-02Nuclear lb U238 4.87E-05 5.04E-02 1.04E+03Hydropower Btu 7.71E+03 7.71E-03 1.00E-06Other Btu 6.83E+03 6.83E-03 1.00E-06
Environmental Releases Units Total Process Fuel Related
Atmospheric EmissionsAcreolin lb 4.26E-07 4.26E-07Ammonia lb 1.11E-03 1.11E-03Antimony lb 2.38E-06 2.38E-06Arsenic lb 5.45E-06 5.45E-06Benzene lb 1.60E-06 1.60E-06Beryllium lb 4.09E-07 4.09E-07Cadmium lb 7.54E-06 7.54E-06Carbon Dioxide-fossil lb 4.07E+03 3.84E+03 2.30E+02Carbon Dioxide-nonfossil (1) lb 1.78E+03 1.78E+03 6.02E-01Carbon Dioxide-nonfossil (2) lb -2.09E+03 -2.09E+03 6.02E-01Carbon Monoxide lb 2.31E+00 2.31E+00Carbon Tetrachloride lb 3.04E-06 3.04E-06Chlorine lb 4.04E-05 4.04E-05Chromium lb 6.63E-06 6.63E-06
(continued)

Table 5.7-1. (continued)a
Section 5.0 Summary LCI of Paper Products
5-83
Environmental Releases Units Total Process Fuel Related
Cobalt lb 6.86E-06 6.86E-06Dioxins lb 2.35E-12 2.35E-12Formaldehyde lb 1.95E-06 1.95E-06Hydrocarbons (non CH4) lb 1.17E+01 5.79E+00 5.94E+00Hydrochloric Acid lb 2.23E-03 2.23E-03Hydrogen Fluoride lb 2.96E-04 2.96E-04Kerosene lb 1.01E-05 1.01E-05Lead lb 7.65E-06 7.65E-06Manganese lb 9.58E-06 9.58E-06Mercury lb 1.86E-06 1.86E-06Metals lb 2.40E-04 2.40E-04Methane lb 6.73E+00 6.73E+00Methylene Chloride lb 1.96E-06 1.96E-06Naphthalene lb 6.87E-07 6.87E-07Nickel lb 1.05E-04 1.05E-04Nitrogen Oxides lb 2.47E+01 2.33E+01 1.42E+00Nitrous Oxide lb 2.93E-04 2.93E-04n-nitrodimethylamine lb 9.11E-08 9.11E-08Other Aldehydes lb 1.67E-02 1.67E-02Other Organics lb 1.93E-02 1.93E-02Particulate lb 1.55E+01 1.36E+01 1.86E+00Perchloroethylene lb 4.47E-07 4.47E-07Phenols lb 1.19E-05 1.19E-05Radionuclides (Ci) lb 7.99E-06 7.99E-06Selenium lb 5.42E-06 5.42E-06Sulfur Oxides lb 6.00E+01 4.18E+01 1.82E+01Trichloroethylene lb 4.04E-07 4.04E-07
Solid Wastes lb 6.62E+02 3.67E+02 2.96E+02
Waterborne EmissionsAcid lb 2.07E-07 2.07E-07Ammonia lb 3.82E-04 3.82E-04Boron lb 2.10E-03 2.10E-03BOD lb 1.16E+00 1.14E+00 2.70E-02COD lb 1.67E+01 1.65E+01 1.89E-01Cadmium lb 1.27E-03 1.27E-03Calcium lb 8.75E-06 8.75E-06Chlorides lb 1.27E+00 1.27E+00Chromates lb 6.17E-06 6.17E-06Chromium lb 1.27E-03 1.27E-03Cyanide lb 1.90E-06 1.90E-06Dissolved Solids lb 2.77E+01 2.77E+01
(continued)

Table 5.7-1. (concluded)a
Section 5.0 Summary LCI of Paper Products
5-84
Environmental Releases Units Total Process Fuel Related
Fluorides lb 4.06E-05 4.06E-05Iron lb 8.50E-02 8.50E-02Lead lb 3.65E-07 3.65E-07Manganese lb 5.51E-02 5.51E-02Mercury lb 9.96E-08 9.96E-08Metal Ion lb 4.34E-03 4.34E-03Nitrates lb 3.86E-06 3.86E-06Oil lb 4.97E-01 4.97E-01Other Organics lb 7.99E-02 7.99E-02Phenol lb 1.44E-05 1.44E-05Phosphate lb 2.64E-04 2.64E-04Sodium lb 1.62E-05 1.62E-05Sulfates lb 9.99E-01 9.99E-01Sulfuric Acid lb 5.25E-04 5.25E-04Suspended Solids lb 3.23E+00 2.18E+00 1.05E+00Zinc lb 4.40E-04 4.40E-04
a The EDF report did not publish process-related emissions for many of the data categories such as CO emissions toair and other water emissions.
Source: EDF, 1995c; Franklin Associates, 1998.

Section 5.0 Summary LCI of Paper Products
2 From White Paper 3, the following data were used: Figure S1 – Average Energy Use and EnvironmentalReleases for Managing Newsprint; Figure 1 - Solid Waste Outputs from Component Activities of Discarded PaperProduction and Management; Figure 2 - Solid Waste Output for Discarded Paper Production and Management;Figure 3 - Total, Purchased and Fossil Fuel Energy Use for Component Activities of Paper Production andManagement; Figure 4 - Energy Use for Discarded Paper Production and Management; Figure 5 - NEWSPRINT:Air Emissions from Production and Management; and Figure 10 - NEWSPRINT: Waterborne Wastes fromProduction and Management.
5-85
RecoveredPaper Fiber
AncillaryMaterials
Recovered PaperFiber Pulping
Mill EnergyGeneration
Secondary Telephone Book Paper
Figure 5.7-2. Simplified process flow diagram for secondary telephone book paper production.
The profile used in this study is composed mostly of paper recovered from offices. As aresult, deinked recovered fiber pulps produced from recovered office paper contain a highpercentage of bleached hardwood Kraft pulp. The three main processing operations—deinking,pulping, and sheet formation—are described in Sections 5.2 and 5.3. Refer to those section fordetails on these processes.
The data in this profile were primarily developed through the use of EDF’s White Paper 3on Virgin Paper And Recycled Paper-Based Systems (EDF, 1995a). The EDF white paper 3,2which presents a cradle-to-gate environmental data profile for 1 short ton of secondary telephonebook paper, was used along with precombustion energy and emission data from the Franklin
Section 5.0 Summary LCI of Paper Products
5-86
report (1998). The following steps outline the procedure used to calculate LCI data fromsecondary office paper.
1. The EDF recycled office paper profile was converted from kilograms per ton topounds per ton for water emissions and solid waste.
2. The precombustion energy and environmental emissions (air emissions, wateremissions, and solid waste emissions) for the fuels and electricity used in theprocess were not included in the EDF published data sets. Hence the appropriateemissions and precombustion energies from the Franklin Associates report (1998)were added to make it a cradle-to-gate profile.
Table 5.7-2 summarizes the cradle-to-gate LCI data for secondary telephone book paperproduction. Table 5.7-2 breaks down the individual fuels that make up pre-combustion energyrelated to process fuels, and electric energy fuels. Emissions to air and water include allemissions for processing, combustion (including electricity), transportation, and precombustionactivities.
5.7.4 Data Quality
Table 5.7-3 summarizes data quality information for primary and secondary telephonebook paper. EDF data were based on a thorough survey of North American paper mills. Theresults determined here are thought to be representative of U.S. production. Because secondarydata were used in this study, precision, consistency, and completeness of information are notavailable.
Table 5.7-4 shows how certain data in the primary profile compare with data from otherpublic sources, and thus provides a measure of representativeness. In 1992, the World EnergyCouncil estimated that, world wide, the pulp and paper industry consumed between 17 and 26million Btu per ton of output (IIED, 1996). That range takes into account all products producedby the pulp and paper industry globally, from products such as newsprint, which is quite adifferent grade of paper and requires comparatively smaller amounts of processing energy, toprimary bleached kraft paper. Table compares the gross energy data (the simple sum ofcombustion process energy and precombustion energy) from this EPA work and European datafor different grades of paper. Gross energy can vary by more than 50 percent depending on thegrade of paper compared. There is greater variation in emissions among the different papergrades compared in Table 5.7-4.
Table 5.7-5 shows how the data in the secondary profile compare with data from otherpublic sources, and thus provides a measure of representativeness. As with primary paper, thereis great variation in inventory data for the different grades of secondary paper. The main sourceof data on paper is the SFAEFL database, which profiles many different paper grades, amongthem 100 percent secondary deinked paper and 100 percent secondary nondeinked paper(SFAEFL). Also shown in Table 5.7-5 are data for newsprint, which is a low-grade papercontaining secondary fibers. Again here, as with primary paper, it must be emphasized that thewide range of different paper grades available will account for large variations in energy

Section 5.0 Summary LCI of Paper Products
5-87
Table 5.7-2. Data for Producing 1 Ton of Secondary Telephone Book Paper
Energy Usage UnitsTotal
(Base Units)Total
(106 Btu)Factor to
Convert to 106 Btu
Combustion Process EnergyElectricity kWh 7.03E+02 7.38E+00 1.05E-02Natural Gas cu ft 5.38E+03 6.24E+00 1.16E-03LPG gal 1.08E-01Coal gal 4.27E+02 4.89E+00 1.15E-02Distillate oil gal 1.58E-01Residual Oil gal 1.34E+01 2.29E+00 1.71E-01Gasoline gal 1.41E-01Diesel gal 1.58E-01Wood Btu 1.00E-06Black Liquor Btu 1.00E-06
Precombustion Process EnergyNatural Gas cu ft 7.19E+02 8.35E-01 1.16E-03Residual Oil gal 7.30E-01 1.25E-01 1.71E-01Distillate oil gal 5.83E-01 9.23E-02 1.58E-01Gasoline gal 3.16E-01 4.47E-02 1.41E-01LPG gal 2.00E-02 2.16E-03 1.08E-01Coal lb 7.48E+00 8.57E-02 1.15E-02Nuclear lb U238 2.97E-05 3.08E-02 1.04E+03Hydropower Btu 4.70E+03 4.70E-03 1.00E-06Other Btu 4.17E+03 4.17E-03 1.00E-06
Environmental Releases Units Total Process Fuel Related
Atmospheric EmissionsAcreolin lb 2.60E-07 2.60E-07Ammonia lb 6.77E-04 6.77E-04Antimony lb 1.45E-06 1.45E-06Arsenic lb 3.32E-06 3.32E-06Benzene lb 9.77E-07 9.77E-07Beryllium lb 2.49E-07 2.49E-07Cadmium lb 4.60E-06 4.60E-06Carbon Dioxide-fossil lb 3.60E+03 3.46E+03 1.40E+02Carbon Dioxide-nonfossil (1) lb 3.67E-01 3.67E-01Carbon Dioxide-nonfossil (2) lb 3.67E-01 3.67E-01Carbon Monoxide lb 1.41E+00 1.41E+00Carbon Tetrachloride lb 1.85E-06 1.85E-06Chlorine lb 2.47E-05 2.47E-05Chromium lb 4.04E-06 4.04E-06
(continued)
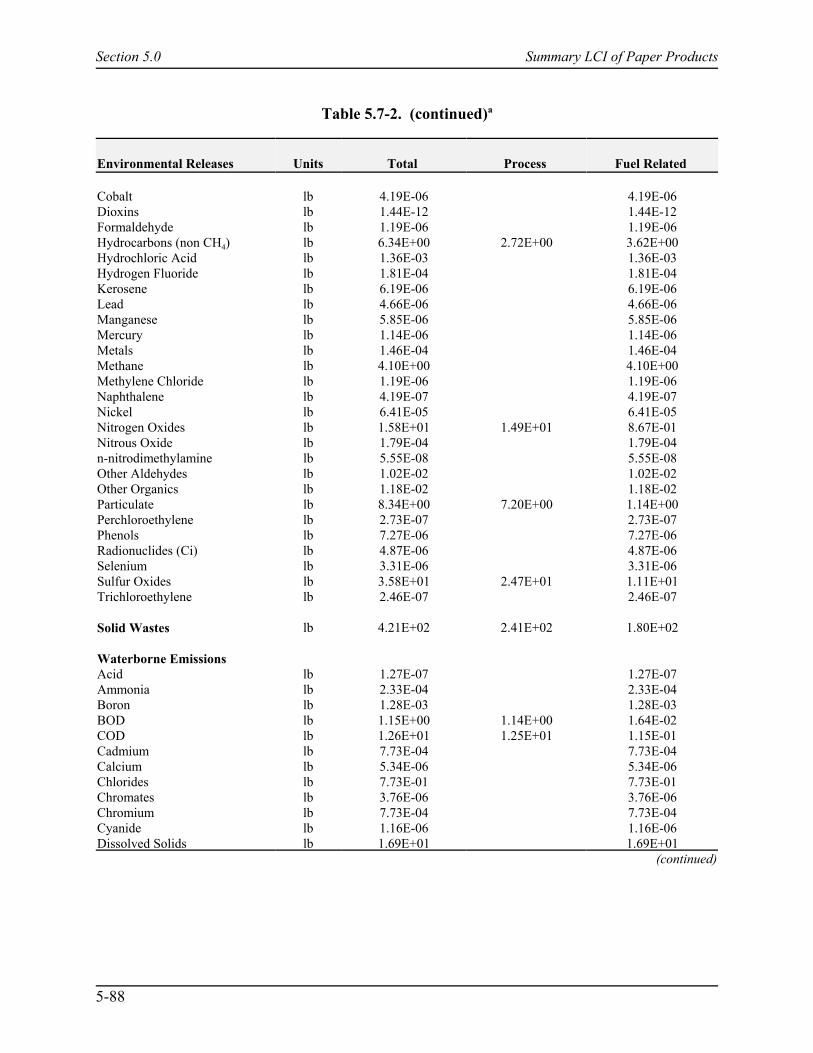
Section 5.0 Summary LCI of Paper Products
5-88
Table 5.7-2. (continued)a
Environmental Releases Units Total Process Fuel Related
Cobalt lb 4.19E-06 4.19E-06Dioxins lb 1.44E-12 1.44E-12Formaldehyde lb 1.19E-06 1.19E-06Hydrocarbons (non CH4) lb 6.34E+00 2.72E+00 3.62E+00Hydrochloric Acid lb 1.36E-03 1.36E-03Hydrogen Fluoride lb 1.81E-04 1.81E-04Kerosene lb 6.19E-06 6.19E-06Lead lb 4.66E-06 4.66E-06Manganese lb 5.85E-06 5.85E-06Mercury lb 1.14E-06 1.14E-06Metals lb 1.46E-04 1.46E-04Methane lb 4.10E+00 4.10E+00Methylene Chloride lb 1.19E-06 1.19E-06Naphthalene lb 4.19E-07 4.19E-07Nickel lb 6.41E-05 6.41E-05Nitrogen Oxides lb 1.58E+01 1.49E+01 8.67E-01Nitrous Oxide lb 1.79E-04 1.79E-04n-nitrodimethylamine lb 5.55E-08 5.55E-08Other Aldehydes lb 1.02E-02 1.02E-02Other Organics lb 1.18E-02 1.18E-02Particulate lb 8.34E+00 7.20E+00 1.14E+00Perchloroethylene lb 2.73E-07 2.73E-07Phenols lb 7.27E-06 7.27E-06Radionuclides (Ci) lb 4.87E-06 4.87E-06Selenium lb 3.31E-06 3.31E-06Sulfur Oxides lb 3.58E+01 2.47E+01 1.11E+01Trichloroethylene lb 2.46E-07 2.46E-07
Solid Wastes lb 4.21E+02 2.41E+02 1.80E+02
Waterborne EmissionsAcid lb 1.27E-07 1.27E-07Ammonia lb 2.33E-04 2.33E-04Boron lb 1.28E-03 1.28E-03BOD lb 1.15E+00 1.14E+00 1.64E-02COD lb 1.26E+01 1.25E+01 1.15E-01Cadmium lb 7.73E-04 7.73E-04Calcium lb 5.34E-06 5.34E-06Chlorides lb 7.73E-01 7.73E-01Chromates lb 3.76E-06 3.76E-06Chromium lb 7.73E-04 7.73E-04Cyanide lb 1.16E-06 1.16E-06Dissolved Solids lb 1.69E+01 1.69E+01
(continued)

Section 5.0 Summary LCI of Paper Products
5-89
Table 5.7-2. (concluded)a
Environmental Releases Units Total Process Fuel Related
Fluorides lb 2.48E-05 2.48E-05Iron lb 5.19E-02 5.19E-02Lead lb 2.22E-07 2.22E-07Manganese lb 3.36E-02 3.36E-02Mercury lb 6.08E-08 6.08E-08Metal Ion lb 2.65E-03 2.65E-03Nitrates lb 2.35E-06 2.35E-06Oil lb 3.03E-01 3.03E-01Other Organics lb 4.88E-02 4.88E-02Phenol lb 8.76E-06 8.76E-06Phosphate lb 1.61E-04 1.61E-04Sodium lb 9.91E-06 9.91E-06Sulfates lb 6.09E-01 6.09E-01Sulfuric Acid lb 3.20E-04 3.20E-04Suspended Solids lb 3.77E+00 3.13E+00 6.42E-01Zinc lb 2.68E-04 2.68E-04
a The EDF report did not publish process-related emissions for many of the data categories such as CO emissions toair and other water emissions.
Source: EDF, 1995c; Franklin Associates, 1998.
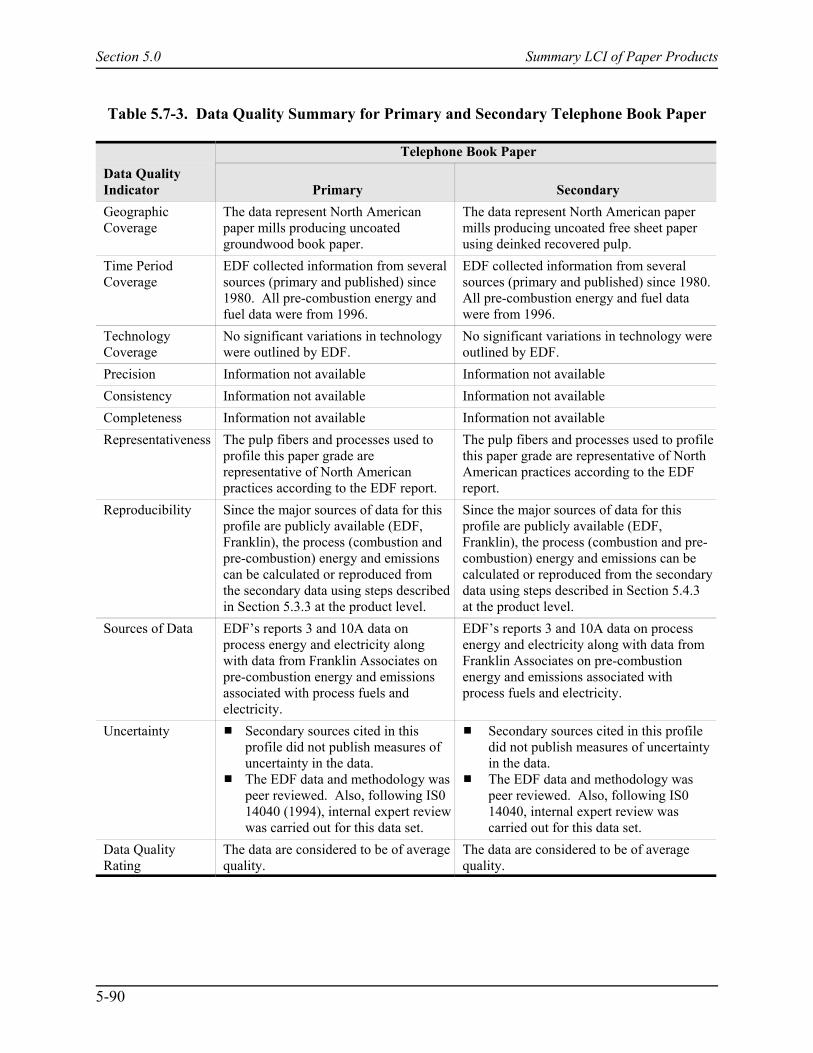
Section 5.0 Summary LCI of Paper Products
5-90
Table 5.7-3. Data Quality Summary for Primary and Secondary Telephone Book Paper
Telephone Book PaperData QualityIndicator Primary SecondaryGeographicCoverage
The data represent North Americanpaper mills producing uncoatedgroundwood book paper.
The data represent North American papermills producing uncoated free sheet paperusing deinked recovered pulp.
Time PeriodCoverage
EDF collected information from severalsources (primary and published) since1980. All pre-combustion energy andfuel data were from 1996.
EDF collected information from severalsources (primary and published) since 1980. All pre-combustion energy and fuel datawere from 1996.
TechnologyCoverage
No significant variations in technologywere outlined by EDF.
No significant variations in technology wereoutlined by EDF.
Precision Information not available Information not availableConsistency Information not available Information not availableCompleteness Information not available Information not availableRepresentativeness The pulp fibers and processes used to
profile this paper grade arerepresentative of North Americanpractices according to the EDF report.
The pulp fibers and processes used to profilethis paper grade are representative of NorthAmerican practices according to the EDFreport.
Reproducibility Since the major sources of data for thisprofile are publicly available (EDF,Franklin), the process (combustion andpre-combustion) energy and emissionscan be calculated or reproduced fromthe secondary data using steps describedin Section 5.3.3 at the product level.
Since the major sources of data for thisprofile are publicly available (EDF,Franklin), the process (combustion and pre-combustion) energy and emissions can becalculated or reproduced from the secondarydata using steps described in Section 5.4.3at the product level.
Sources of Data EDF’s reports 3 and 10A data onprocess energy and electricity alongwith data from Franklin Associates onpre-combustion energy and emissionsassociated with process fuels andelectricity.
EDF’s reports 3 and 10A data on processenergy and electricity along with data fromFranklin Associates on pre-combustionenergy and emissions associated withprocess fuels and electricity.
Uncertainty # Secondary sources cited in thisprofile did not publish measures ofuncertainty in the data.
# The EDF data and methodology waspeer reviewed. Also, following IS014040 (1994), internal expert reviewwas carried out for this data set.
# Secondary sources cited in this profiledid not publish measures of uncertaintyin the data.
# The EDF data and methodology waspeer reviewed. Also, following IS014040, internal expert review wascarried out for this data set.
Data QualityRating
The data are considered to be of averagequality.
The data are considered to be of averagequality.

Section 5.0 Summary LCI of Paper Products
5-91
Table 5.7-4. Comparison to Literature of Key Inventory Data Values for PrimaryTelephone Book Paper
Unit
EPA PrimaryTelephone
Book PaperProfile
SFAEFL 1996Kraft Bleached
Uncoated
SFAEFL 1996Graph Paper
WoodyUncoated
Energy MMBtu/ton 37.83 56.92 42.45
NOx lb/ton 24.72 9.50 4.64
NMVOC* lb/ton 6.62 3.70 1.464
COD lb/ton 16.53 84.60 16.66
*Non-methane volatile organic compounds.
Table 5.7-5. Comparison to Literature of Key Inventory Data Values for Secondary Telephone Book Paper
Unit
EPASecondaryTelephone
BookPaper Profile
SFAEFL1996
Secondary (Deinked)
Paper
SFAEFL 1996Secondary
PaperWithoutDeinking
SFAEFL1996
Newsprint
Energy MMBtu/ton
20.9 20.0 10.4 15.4
NOx lb/ton 3461.9 5.3 1.8 3.2
NMVOC* lb/ton 0.5 1.8 0.6 1.0
COD lb/ton 12.5 16.7 0.02 15.1
*Non-methane volatile organic compounds.

Section 5.0 Summary LCI of Paper Products
5-92
requirements and emissions. Gross energy data (the simple sum of combustion process energyand precombustion energy) from the current work is only 5 percent higher than 100 percentsecondary deinked paper, the paper grade closest in composition to secondary telephone bookpaper. There is greater variation in other emissions, such as CO2.
The LCI data for primary and secondary telephone book paper are considered to be ofaverage quality.
5.8 References
American Forest and Paper Association (AF&PA). 1997a. 1997 Annual Statistical Summary.Recovered Paper Utilization. Eleventh Edition. Paper Recycling Group. Washington,DC. April.
American Forest and Paper Association (AF&PA). 1997b. Paper, Paperboard, and Wood Pulp.Vol. 75. No. 8. Washington, DC. August, 1997.
American Forest and Paper Association (AF&PA). 1997c. Capacity and Fiber Consumption.Washington, DC. December.
American Forest and Paper Association (AF&PA). 1998 (date accessed). Website:<http://www.afandpa.org/recycling/recycling.html>. Washington, DC.
Argonne National Laboratory. 1993. Energy Life-Cycle Analysis of Newspaper. Energy SystemsDivision. Argonne, IL. May.
Bureau of Mines (BOM). 1989 and earlier years. Minerals Yearbook, Washington, DC.
Environmental Defense Fund (EDF). 1995a. White Paper No. 3, Environmental Comparison -Manufacturing Technologies for Virgin and Recycled-content Printing and WritingPaper. New York, NY.
Environmental Defense Fund (EDF). 1995b. White Paper No. 5, Environmental Comparison ofBleached Kraft Pulp Manufacturing Technologies. New York, NY.
Environmental Defense Fund (EDF). 1995c. White Paper No. 10A, Environmental Comparison- Manufacturing Technologies for Virgin and Recycled-content Printing and WritingPaper. New York, NY. December 1995.
Fibre Box Association, 1997. Preliminary 1996 data received from Fibre Box Association. Rolling Meadows, IL.
Franklin Associates, Ltd. 2000. A Life Cycle Inventory of Linerboard & Medium Rolls,Newsprint Rolls, Aluminum Sheet, and Glass Containers. Prepared for ResearchTriangle Institute, Research Triangle Park, NC. January.

Section 5.0 Summary LCI of Paper Products
5-93
Franklin Associates, Ltd. 1998a. Characterization of Municipal Solid Waste in the United States,Prairie Village, KS. 1997 Update.
Franklin Associates, Ltd. 1998b. Energy Requirements and Environmental Emissions for FuelConsumption. Prairie Village, KS.
International Institute for Environment and Development (IIED). 1996. Towards a SustainablePaper Cycle. London, England.
International Organization for Standardization (ISO). 1994. ISO 14040, EnvironmentalManagement – Life Cycle Assessment Principles and Framework. Geneva, Switzerland.
Kent, J. A. editor. 1992. Riegel’s Handbook of Industrial Chemistry. Ninth Edition. VanNostrand Reinhold, New York, NY.
Lockwood-Post, 1997. Directory of the Pulp, Paper, and Allied Trades. Data evaluated byFranklin Associates, Ltd. Prairie Village, KS.
Recycling Advisory Council. 1992. “Evaluation of Proposed New Recycled Paper Standardsand Definitions.” Prepared by Franklin Associates for the Recycled Paper Committee. Prairie Village, KS.
Smook, G. A. 1987. Handbook for Pulp & Paper Technologists. Joint Textbook Committee ofthe Paper Industry. TAPPI. Norcross, GA.
Swiss Federal Office of Environment, Forests, and Landscape (SFAEFL). 1991. EnvironmentalSeries No. 132. Bern. February. Birmensdorf, Switzerland.
Section 6.0 Life Cycle Inventories for Plastic Products
1 The Western European electrical energy mix data from 1992 were used to backcalculate fuels andemissions related to electrical energy consumption for the U.S. scenario. The Western European electrical grid mixis divided down into: Coal (36.4%), Natural gas (8.7%), Residual Oil (9.8%), Nuclear (34.1%), Hydro (9.9%), andOther (1.1%). The U.S. National Electric Grid mix is divided into: Coal (56.45%), Natural gas (9.75%), ResidualOil (2.62%), Distillate Oil (.23%), Nuclear (22.13%), Hydro (8.59%), and Wood (0.24%). (EIA, 1998)
6-1
6.0 Summary LCI of Plastic Products6.1 Introduction
This chapter presents cradle-to-gate LCI results for HDPE, LDPE, PET and SecondaryPlastics (PET and HDPE bottles). The LCI results include energy and emissions from rawmaterials extraction through production of the final product but do not include the use ordisposal portions of a traditional LCI. In addition, data for the collection, processing, andtransportation of discarded plastics to a reprocessing facility are not included in the data sets forthe secondary systems. Data for these activities is included in other modules of the MSW-DSTand included in any scenario including recycling.
Data from the Association of Plastics Manufacturers in Europe (APME) and the SwissAgency for the Environment, Forests,0 and Landscapes (SFAEFL) were used but were modifiedto include U.S. electrical energy and related emissions1 (EIA, 1998; Franklin Associates, 1998).The profiles for HDPE, and LDPE were put together from data presented in APME reports 3 and10 (APME, 1993, 1997). The profiles for PET and secondary PET were put together using datafrom APME Report 8 and SFAEFL, respectively (APME, 1995, SFAEFL, 1996). The datapresented follow standard LCI methodology, to the extent possible, as outlined in ISO 14040 andISO 14041. Each profile includes a discussion of data quality. Because the data profiles werecompiled from secondary sources, many of the data quality indicators reflected this secondarysource of data.
This chapter contains the LCI results for HDPE (Section 6.2), LDPE (Section 6.3), PET(Section 6.4) and Secondary Plastics (Section 6.5). Each section presents the functional unit,system boundaries (including description of unit processes), data sources and calculationprocedures, LCI results, and data quality assessment. For all of the profiles, the functional unit is1 ton (2,000 lb) of material produced.
All material and water consumption, as well as environmental emissions, are presentedas mass in pounds (lb), volume in U.S. gallons (gal), gaseous volume in cubic feet (ft3), andenergy in British thermal units (Btu).
Section 6.0 Life Cycle Inventories for Plastic Products
6-2
Because the data used in this study are from secondary sources, the allocation approachwas defined by APME (1992). Coproduct allocation was based on the calorific content for allstages of oil refining, gas extraction/processing, and cracking.
This study assumes that fuels used in Europe are characteristically the same as thoseextracted in the U.S. (i.e., calorific values of fuels in the U.S. and Europe are assumed to be thesame). The model for combustion and precombustion fuel and electrical energy-relatedenvironmental releases was developed by Franklin Associates (1998).
6.2 High-Density Polyethylene (HDPE)
6.2.1 Introduction
This section contains an LCI profile for the production of primary HDPE. It containsprocess flow diagrams and descriptions for production processes, LCI data tables for 1 short tonof product, and a discussion of data quality. Section 6.3.1 describes the typical process forproducing polyethylene.
The boundaries for this material system depend on plastic production data (secondary)from a series of papers on “eco-profiles of the European plastics industry.” The LCI data for theproduction of commodity thermoplastics was collected and published by APME membercompanies, according to their agreed methodology (APME methods). Thus, the boundaries forthe current product system include extraction of raw material (crude oil, natural gas, LPG, etc.),processing crude oil and natural gas, petroleum refining, and ethylene polymerization andseparation of HDPE.
To maintain consistency in boundaries, calculations and presentation, and confidentialityof data, the data were aggregated by APME at the product system level. With the addition ofU.S. combustion and precombustion energy, the data set used in this study represents boundariesfor the aggregated cradle-to-gate processing of 1 ton of HDPE as described in APME Report 3and adjusted based on clarification outlined in Report 10 (APME, 1993, 1997). There aredifferences between the U.S. precombustion model and the model used to generate the APMEdata. Although care was taken to “Americanize” the electrical energy related, differencesbetween the U.S. and APME precombustion models may have resulted in some errors.
6.2.2 Ethylene Production
Figure 6-1 shows a simplified process flow diagram for processing ethylene. Themanufacture of polyethylene includes production and transport of processed crude oil and naturalgas (both domestic and imported), petroleum refining, and ethylene polymerization andseparation.
Because the APME Report 3 does not include specific descriptions of the unit processes,the following descriptions are general descriptions.

Section 6.0 Life Cycle Inventories for Plastic Products
6-3
Figure 6-1. Simplified process flow diagram for ethylene (modified from APME, 1993)
6.2.2.1 Crude Oil Production. Oil is produced by drilling into porous rock structuresgenerally located several thousand feet underground. Once an oil deposit is located, numerousholes are drilled and lined with steel casing. Some oil is brought to the surface by naturalpressure in the rock structure, although most oil requires some energy to drive pumps that lift oilto the surface. Once oil is on the surface, it is stored in tanks to await transportation to arefinery. In some cases, it is immediately transferred to a pipeline, which transports the oil to alarger terminal.
There are two primary sources of waste from crude oil production. The first source isthe “oil field brine,” or water that is extracted with the oil. The brine goes through a separator ator near the well head to remove the oil from the water. These separators are very efficient andleave minimal oil in the water. The second source of waste is the gas produced from oil wells. While most of this is recovered for sale, some is not. Atmospheric emissions from crude oilproduction are primarily hydrocarbons.
6.2.2.2 Natural Gas (Kent, 1974; Elvers et al., 1991; Standen, 1968). Natural gasoccurs in three principal forms: associated gas, nonassociated gas, and gas condensate. Associated gas is found in crude oil reservoirs, either dissolved in the crude oil or in conjunctionwith crude deposits. Dissolved gases are extracted from oil wells along with the oil and areseparated from it at the well head. Much of the very large gas reserves of some Persian Gulfcountries and the Prudhoe Bay reserves of Alaska are associated gas.
Section 6.0 Life Cycle Inventories for Plastic Products
6-4
Nonassociated gas occurs in reservoirs separate from those of crude oil. It is called gaswell gas and it contains much less of the heavier, or condensable, hydrocarbons found inassociated gas. Nonassociated gas is the most commonly used gas today.
The third form is neither a true gas nor a true liquid. It occurs as a two-phase liquid.These reservoirs, called "gas condensate" reservoirs, usually are found in moderately deepformations, have very high pressures and pose special problems in production and processing.
Several nonhydrocarbon gases are also found in natural gas mixtures. Nitrogen andcarbon dioxide are noncombustible and may be found in substantial proportions. These, ifpresent in significant amounts, are removed to raise the heating value, reduce volume, andsustain combustion properties. Hydrogen sulfide is generally removed by treatment withethanolamine in a process similar to that used in petroleum refining.
Natural gas pipelines normally operate at elevated pressures. In many instances, the gasis available at low pressures; in such cases, it must be pumped or compressed to higherpressures. Usually, water-barge transport is used for importing natural gas.
6.2.2.3 Liquefied Petroleum Gas (Kent, 1974; Elvers et al., 1991; Standen, 1968). The turbo-expander process allows for the recovery of liquid ethane as well as heavierhydrocarbon components to produce liquefied petroleum gas (LPG). The process extracts workfrom the gas during expansion from a high pressure to a lower pressure, and cools it to a lowtemperature by means of heat exchange. When the gas stream from a liquid-gas separator iseither cooled or compressed, phase change occurs in the gas, and a liquid forms.
The liquid product from this facility can be introduced into either a pipeline or acontainer for shipment.
6.2.2.4 Petroleum Refining. Only the major processes within the petroleum refiningunit process are described below.
Crude Desalting. This is a water-washing process. This process allows for inmatemixing between the crude oil and water, followed by sufficient separation so that water does notenter subsequent crude-oil distillation heaters. The unrefined crude oil is treated with heat toallow for improved fluid properties. Elevated temperatures reduce oil viscosity for bettermixing, and elevated pressure suppresses vaporization. The wash water can be added eitherbefore or after heating. Mixing between the water and crude oil is assured by passing themixture through a throttling valve or emulsifier orifice. Trace quantities of caustic agents, acid,or other chemicals are sometimes added to promote treating. Then the water-in-oil emulsion isintroduced into a high voltage electrostatic field inside a gravity settler. The electrostatic fieldencourages the agglomeration of water droplets for easier settling. Salts, minerals, and otherwater-soluble impurities in the crude oil are carried off with the water discharge from the settler.Clean desalted crude oil flows from the top of the settler and is ready for subsequent refining.
Crude Distillation. Single or multiple distillation columns are used to separate crude oilinto fractions determined by their boiling range. The crude oil is heated by exchange withvarious hot products coming from the system before it passes through a fired heater. The
Section 6.0 Life Cycle Inventories for Plastic Products
6-5
temperature of the crude oil entering the first column is high enough to vaporize the heavy gasoil and all lighter fractions. Because light products must pass from the feed point up to theirrespective draw-off point, any intermediate stream will contain some of these lighter materials.Stream stripping is used to reintroduce these light materials back into the tower to continue theirpassage up through the column. The various products are then collected through ports installedalong the column.
Hydrotreating. This is a catalytic hydrogenation process that reduces the concentrationof sulfur, nitrogen, oxygen, metals, and other contaminants in a hydrocarbon feed. The feed ispumped to operating pressure and mixed with a hydrogen-rich gas, either before or after beingheated to the proper reactor inlet temperature. The heated mixture passes through a fixed bed ofcatalyst where exothermic hydrogenation reactions occur. The effluent from the reactor is thencooled and sent through two separation stages. In the first, the high-pressure scrubber removeshydrogen sulfide; the cleaned hydrogen is then recycled. In the second, the lower-pressureseparator takes off the remaining gases and light hydrocarbons from the liquid product. Hydrotreating for sulfur removal is called hydrodesulfurization, and the catalyst used is cobaltand molybdenum oxides on an alumina support.
Catalytic Cracking. This unit is characterized by two huge vessels, one to react the feedwith hot catalyst and the other to regenerate the spent catalyst by burning off carbon with air.The contact time takes place in a transfer line that connects the regenerator and the reactionvessels, where most of the reaction occurs. Products are quickly taken overhead. There areseveral configurations of reactors and regenerators. In most designs, one vessel is stacked on topof the other. All are big structures. Better regeneration of spent catalyst is obtained by operatingat high temperatures. Heavier feedstocks are put into catalytic crackers. The catalysts preventsulfur, which is contained in heavier feeds, from exhausting into the atmosphere prior to enteringthe reactor. Ordinary gas-treating methods are used to capture the hydrogen sulfide coming fromthe sulfur in the feedstock.
Coking. Coking is an extreme form of thermal cracking that uses high temperatures anda long residence time to break down heavy crude residues to get lighter liquids (Kent, 1974). Coking takes place in a series of ovens in the absence of oxygen. After a typical coking time of12 to 20 hours, most of the volatile matter is driven from the crude residue, and the coke isformed. The desired products of the coking process are actually the volatile products. Thepetroleum coke itself is considered a byproduct. The coke is collected in a coke drum, while thelighter products go overhead as vapors.
Hydrocracking. Prior to the late 1960s, most hydrogen used in processing crude oil wasfor pretreating catalytic reformer feed naphtha and for desulfurizing middle-distillate products.Soon thereafter, requirements to lower sulfur content in most fuels became an importantconsideration. Process flow is similar to hydrotreating in that feed is pumped to operatingpressure, mixed with a hydrogen-rich gas, heated, passed through a catalytic reactor, anddistributed among various fractions. Operating pressures are very high and hydrogenconsumption is also high. Under mild conditions, the process functions as a hydrotreater. Undermore severe conditions of cracking, the process produces a varying ratio of motor fuels andmiddle distillates, depending on the feedstock and operating variables.
Section 6.0 Life Cycle Inventories for Plastic Products
6-6
Production of Ethylene. Ethylene is one of the principal products derived frompetroleum cracking. In this process, a feed of raw hydrocarbon from the refinery, which iscomposed of many different hydrocarbon fractions, is fed into a furnace. Cracker feeds oftenconsist of naphtha or natural gas. At the appropriate reaction temperature, the following reactionoccurs.
Ethane÷Ethylene + H2
When the product gases leave the furnace (reactor), they are quenched and cooled to inhibitfurther reactions. The products are then separated.
Other reaction products include propylene and a mixture of butene isomers. Reactionproducts depend on feed composition, temperature, and reactant resident time. The crackertemperature and feed residence time can be set to optimize the product mix from a given feed(APME, 1993).
6.2.2.5 Natural Gas Processing (Berger and Anderson, 1992; Hobson, 1984; Meyers,1986; McKetta, 1992; Gary and Handwork, 1994; Beggs, 1984). Natural gas is often found inclose association with crude oil. In many instances it is the pressure of natural gas exerted uponthe subterranean oil reservoir that drives oil up to the surface. Natural gas components aremostly saturated light paraffins such as methane, ethane, and propane that exist in the gaseousphase, depending on the pressure in the reservoir. When pentane and heavier compounds coexist,they are usually found as liquids. When a natural gas reserve contains substantial amounts ofethane and the higher paraffinic compounds, these are usually extracted at the production siteand produced as natural gas liquids (NGLs). This source of light hydrocarbons is especiallyprominent in the U.S., where natural gas processing provides a major portion of the ethanefeedstock for olefin manufacture and the LPG for heating and commercial purposes.
Field-production gas is often available at very low pressures, 14 pounds per square inch(psi) or less being common. Most end uses of gas require pressures in the range of 500 to1,000 psi. Hence, the gas is processed through multiple stages of compression. In a simplecompression gas-processing plant, field gas is charged to an inlet scrubber, where entrainedliquids are removed. The gas is then successively compressed and cooled to remove condensedliquids and to reduce the temperature of the fluid in order to conserve compressor powerrequirements. The heavier liquids from the gas stream are separated using a more complexrefrigerated absorption and fractionation plant. The compressed raw gas is processed inadmixture with a liquid hydrocarbon, called lean oil, in an absorber column, where heaviercomponents in the gas are absorbed in the lean oil. The bulk of the gas is discharged from the topof the absorber as residue gas (usually containing 95 percent methane) for subsequent treatmentto remove sulfur and other impurities. The heavier components leave with the bottoms liquidstream, now called rich oil, for further processing to remove ethane for plant fuel orpetrochemical feedstock and to recover the lean oil. Some gas-processing plants may containadditional distilling columns for further separation of the gas liquids into propane, butanes, andheavier NGLs. Many older gas-absorption plants were designed to operate at ambienttemperature, but newer facilities usually employ refrigeration to lower processing temperaturesand increase the absorption efficiency.

Section 6.0 Life Cycle Inventories for Plastic Products
6-7
6.2.2.6 Olefin (Polymerization of Ethylene) (Smith, 1990). Chain-growthpolymerization is used to synthesize polyethylene. Three steps describe the reaction— initiation,propagation, and termination.
Catalysts, such as organic peroxides, are used to initiate the polymerization of ethyleneby decomposing into free radicals upon heating. The peroxide free radical reacts with ethylene toform a longer chain free radical. It is propagation that occurs as successive ethylene reactantsreact with the initiator free radical. Termination then occurs by the addition of a terminator freeradical or when two chains come together
Experiments and analysis have shown that the molecular structure of polyethylene iscomposed of both crystalline and amorphous regions. Until 1940, polyethylene was regarded as alinear long-chain hydrocarbon, but the advent of infrared spectroscopy has revealed more methylgroups than could previously be accounted for as terminal groups. Side chains account for theweaker mechanical properties of the polymer. Further work has shown that, if polymerizationtechniques were altered to favor the side-chain branching reaction, then the physical propertiesof the polymer would reflect those of a less crystalline, low-density material having highlybranched side chains.
Plastic films and fibers made from hydrocarbon olefins use ethylene gas and high-pressure polyethylene to produce polyethylene and polypropylene. The polymerization of lightolefins emphasizes a combination of only two or three molecules so that the resulting liquid willbe in the gasoline boiling range.
6.2.3 HDPE Production
Figure 6-2 shows a simplified process flow diagram for processing high-densitypolyethylene. The manufacture of HDPE includes: production and transport of processed crudeoil and natural gas (both domestic and imported), petroleum refining, and ethylenepolymerization and separation (Kent, 1974; Elvers et al., 1991; Standen, 1968).
Many of the material production operations for HDPE were described for polyethylene inSection 6.2. Please refer to Section 6.2.2 for a detailed description of crude oil production,natural gas production, LPG production, petroleum refining, natural gas processing, ethyleneproduction, and olefin (ethylene) polymerization.
6.2.3.1 Comonomer. Polymerization entails copolymerizing ethylene and a chosenmonomer (olefin feed) in the presence of a catalyst. Comonomers are fed continuously into thereactor, which operates at high pressure and a chosen temperature. Either aluminum trialkyltitanium tetrachloride or chromium oxide on a silica/aluminum support is used as a catalystsystem in the production of HDPE. The product resins are linear polymers in the density rangeof 0.94 to 0.96 when a comonomer is used with ethylene during polymerization. Most of thecommercially available high-molecular-weight resins are copolymers of either butene-1 orhexene-1 with ethylene.

Section 6.0 Life Cycle Inventories for Plastic Products
2 The average of the U.S. National Grid was used to calculate the electrical emissions (Franklin Associates,1998).
3 Energy conversion factors developed by Franklin Associates Ltd. (Table 9 in their 1998 report); Franklindata were used to calculate/convert to the appropriate units.
6-8
Figure 6-2. Simplified process flow diagram for high-density polyethylene
6.2.3.2 Polymerization of HDPE. The HDPE polymerization process requirescopolymerizing ethylene and the monomer feed using a catalyst. Gaseous ethylene, hydrogen, atitanium-containing catalyst, and comonomer are continuously fed to this fluidized-bed reactorthat operates at a preselected temperature and pressure. The polymer product and gas areintermittently discharged from the reactor; the gas is separated from the polymer. The polymer,in powder form, is then sent to storage or pelletizers (Kent, 1974).
6.2.4 Data Source and Calculation Procedures
The data were developed primarily using the European APME plastics data sets. Electrical energy2 and the associated emissions from these APME data were replaced with datafrom the electrical energy module included as part of the overall decision support tool. APMEReport 3, which presents a cradle-to-gate environmental data profile for 1 kilogram of HDPE,was used along with Western European electric grid data and U.S. electric grid data (EIA, 1998;Franklin Associates, 1998; APME, 1993, 1997). The following steps outline the procedure usedto construct LCI data for PE:
1. The HDPE profile from APME was converted from SI units (energy in MJ, massin milligrams per kilogram) to U.S. units (mass in lb, volume in U.S. gallons,gaseous volume in ft3, and energy in Btu/1 ton (2,000 lb).3 The electrical energyis converted from MJ to kWh using the appropriate efficiencies for each fuel inthe electrical fuel mix (EIA, 1998).
Section 6.0 Life Cycle Inventories for Plastic Products
4 Energy consumption and emissions released from Utility Boilers developed by Franklin Associates (Tables 6, 7, 8, 14, 16, 18, 20, 26 in their 1998 report). Franklin data were used to develop the appropriate pre-combustion energies and environmental emissions for 1 kWh of European electric grid.
5 U.S. Electrical Energy and Emissions data developed by Franklin Associates (Tables 6, 7, 8, 14, 16, 18,20, 26 in their 1998 report). Franklin data were used to calculate the appropriate precombustion energies andenvironmental emissions for 1 kWh of U.S. electric grid.
6-9
2. Based on the Western European Fuel Mix from 1992 and combustion andprecombustion emissions from the Franklin Report,4 an environmental profile forproducing and delivering 1 (kWh) of the Western European electrical grid5 wasdeveloped. A similar environmental profile for producing 1 kWh of the U.S.electrical grid was developed by Franklin (EIA, 1998; Franklin Associates, 1998).
3. The precombustion energy and environmental releases (air emissions, wateremissions and solid waste emissions) from the European Electrical Fuel Mix werededucted using the profile developed in Step 2 for the appropriate kWh convertedin Step 1. For the same kWh, the precombustion energies and environmentalemissions for the U.S. electrical mix are added to the profile. The net electricalenergy for the process is the same; however, the precombustion energy quantitiesand environmental emissions are different because of the different fuel mix fromthe two electrical grids.
Table 6-1 shows the original APME HDPE emissions profile. The first column showsthe published APME data profile and the second column shows APME data with the Europeanelectrical emissions subtracted. The complete LCI data results are provided in Section 6.3.4.
6.2.5 LCI Results
Table 6-2 summarizes the cradle-to-gate LCI data for primary HDPE production. Table 6-2 breaks down the individual fuels that make up the energy of material resource,combustion process energy, and precombustion energy related to material resource feedstock,process fuels, and electric energy fuels. The emissions to air and water include all emissions forprocessing, combustion (including electricity), transportation, and precombustion activities.
6.2.6 Data Quality
Table 6-3 summarizes data quality information for HDPE production. APME data werebased on a thorough survey of European producers. APME data represent a cross section ofpoor, average and above average performance and technologies. The results determined here arethought to be representative of both global and U.S. production. Young (1996) expressedconfidence that APME data used primary industry data collected from a nondiscriminatingsample in a large population. Because secondary data were used in this study, precision,consistency, and completeness of information are not all available. The various data qualitymeasures are defined below.
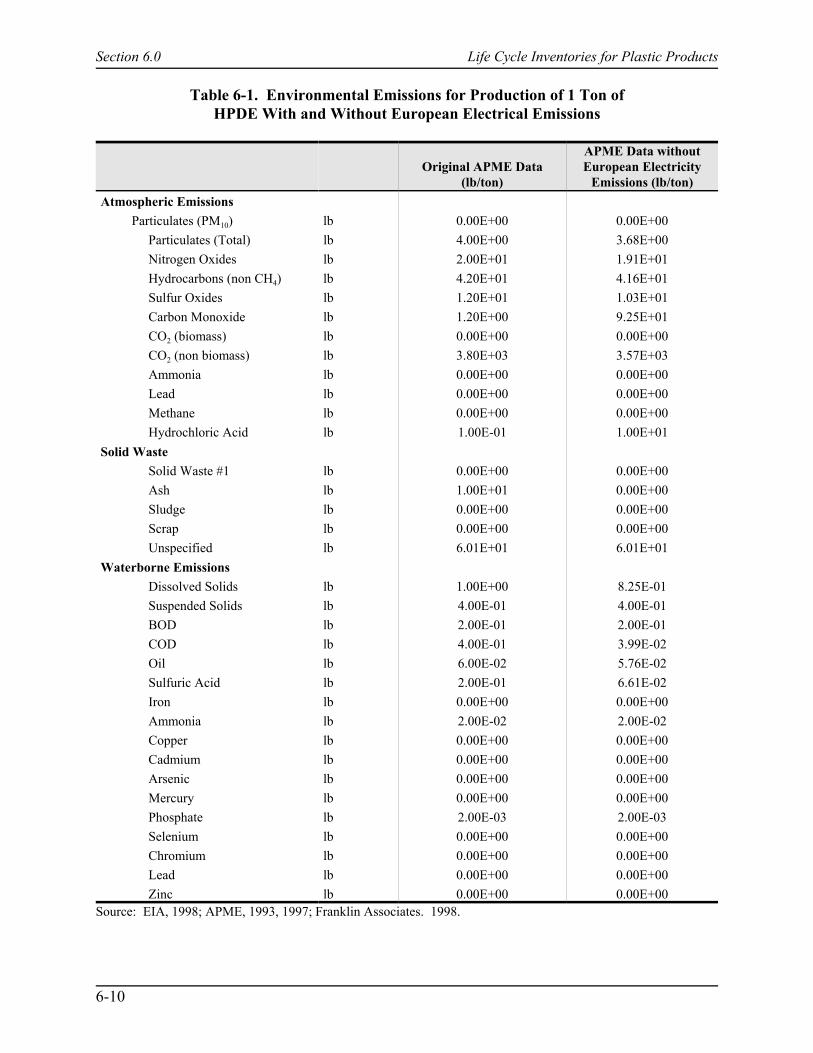
Section 6.0 Life Cycle Inventories for Plastic Products
6-10
Table 6-1. Environmental Emissions for Production of 1 Ton ofHPDE With and Without European Electrical Emissions
Original APME Data(lb/ton)
APME Data withoutEuropean Electricity
Emissions (lb/ton)Atmospheric Emissions
Particulates (PM10) lb 0.00E+00 0.00E+00Particulates (Total) lb 4.00E+00 3.68E+00Nitrogen Oxides lb 2.00E+01 1.91E+01Hydrocarbons (non CH4) lb 4.20E+01 4.16E+01Sulfur Oxides lb 1.20E+01 1.03E+01Carbon Monoxide lb 1.20E+00 9.25E+01CO2 (biomass) lb 0.00E+00 0.00E+00CO2 (non biomass) lb 3.80E+03 3.57E+03Ammonia lb 0.00E+00 0.00E+00Lead lb 0.00E+00 0.00E+00Methane lb 0.00E+00 0.00E+00Hydrochloric Acid lb 1.00E-01 1.00E+01
Solid WasteSolid Waste #1 lb 0.00E+00 0.00E+00Ash lb 1.00E+01 0.00E+00Sludge lb 0.00E+00 0.00E+00Scrap lb 0.00E+00 0.00E+00Unspecified lb 6.01E+01 6.01E+01
Waterborne EmissionsDissolved Solids lb 1.00E+00 8.25E-01Suspended Solids lb 4.00E-01 4.00E-01BOD lb 2.00E-01 2.00E-01COD lb 4.00E-01 3.99E-02Oil lb 6.00E-02 5.76E-02Sulfuric Acid lb 2.00E-01 6.61E-02Iron lb 0.00E+00 0.00E+00Ammonia lb 2.00E-02 2.00E-02Copper lb 0.00E+00 0.00E+00Cadmium lb 0.00E+00 0.00E+00Arsenic lb 0.00E+00 0.00E+00Mercury lb 0.00E+00 0.00E+00Phosphate lb 2.00E-03 2.00E-03Selenium lb 0.00E+00 0.00E+00Chromium lb 0.00E+00 0.00E+00Lead lb 0.00E+00 0.00E+00Zinc lb 0.00E+00 0.00E+00
Source: EIA, 1998; APME, 1993, 1997; Franklin Associates. 1998.

Section 6.0 Life Cycle Inventories for Plastic Products
6-11
Table 6-2. Data for Production of 1 Ton of Primary HDPE
Energy Usage UnitsTotal
(Base Units)Total
(106 Btu)Factor to
Convert to 106 Btu
Energy of Material ResourcePetroleum MMBtu 4.11E+01 4.11E+01 1.00E+00Coal MMBtu 8.60E-03 8.60E-03 1.00E+00
Combustion Process EnergyElectricity kWh 1.80E+02 1.62E+00 8.97E-03Natural Gas cu ft 1.21E+04 1.40E+01 1.03E-03LPG gal 9.55E-02Coal lb 1.12E-02Distillate oil gal 1.39E-01Residual Oil gal 5.13E+01 8.76E+00 1.50E-01Gasoline gal 1.25E-01Diesel gal 1.39E-01Wood Btu 1.00E-06
Precombustion Process EnergyNatural Gas cu ft 6.30E+02 7.31E-01 1.30E-04Residual Oil gal 4.34E+00 7.42E-01 2.10E-02Distillate oil gal 1.93E-02Gasoline gal 1.64E-02LPG gal 1.21E-02Coal lb 1.15E+02 1.32E+00 2.60E-04Nuclear lb U238 1.11E-03 1.15E+00 5.06E+01Hydropower Btu 3.33E+05 3.33E-01 1.00E-06Other Btu 3.70E+04 3.70E-02 1.00E-06
Environmental Emissions Units TotalProcess and
TransportationElectrical
Energy
Atmospheric EmissionsAcreolin lb 3.76E-06 3.76E-06Ammonia lb 1.18E-03 1.18E-03Antimony lb 1.70E-06 1.70E-06Arsenic lb 8.27E-06 8.27E-06Benzene lb 4.30E-06 4.30E-06Beryllium lb 9.60E-07 9.60E-07Cadmium lb 1.20E-06 1.20E-06Carbon Dioxide-fossil lb 3.84E+03 3.57E+03 2.61E+02Carbon Dioxide-nonfossil lb 6.51E-01 6.51E-01Carbon Monoxide lb 1.03E+00 9.25E-01 1.09E-01Carbon Tetrachloride lb 6.35E-06 6.35E-06Chlorine lb 3.12E-06 3.12E-06
(continued)

Section 6.0 Life Cycle Inventories for Plastic Products
6-12
Table 6-2. (continued)
Environmental Releases Units Total Process Fuel Related
Chromium lb 1.07E-05 1.07E-05Cobalt lb 2.12E-04 2.12E-04Dioxins lb 1.16E-06 1.16E-06Formaldehyde lb 1.15E-05 1.15E-05Hydrocarbons (non CH4) lb 4.17E+01 4.16E+01 1.35E-01Hydrochloric acid lb 1.19E-01 1.00E-01 1.91E-02Hydrogen Fluoride lb 2.63E-03 2.63E-03Kerosene lb 9.92E-05 9.92E-05Lead lb 1.25E-05 1.25E-05Manganese lb 2.81E-05 2.81E-05Mercury lb 7.04E-06 7.04E-06Metals lb 5.62E-05 5.62E-05Methane lb 5.64E-01 5.64E-01Methylene Chloride lb 1.63E-05 1.63E-05Naphthalene lb 7.62E-07 7.62E-07Nickel lb 4.93E-05 4.93E-05Nitrogen Oxides lb 2.01E+01 1.91E+01 9.74E-01Nitrous Oxide lb 2.14E-03 2.14E-03n-nitrodimethylamine lb 7.95E-07 7.95E-07Other Aldehydes lb 6.42E-04 6.42E-04Other Organics lb 1.01E-03 1.01E-03Particulate lb 3.99E+00 3.68E+00 3.17E-01Perchloroethylene lb 3.59E-06 3.59E-06Phenols lb 2.06E-05 2.06E-05Radionuclides (Ci) lb 7.05E-05 7.05E-05Selenium lb 2.67E-05 2.67E-05Sulfur Oxides lb 1.22E+01 1.03E+01 1.93E+00Trichloroethylene lb 3.56E-06 3.56E-06
Solid Wastes lb 9.33E+01 4.56E+01 4.77E+01
Waterborne EmissionsAcid lb 3.82E-09 3.82E-09Ammonia lb 2.01E-02 2.00E-02 1.65E-04BOD lb 2.00E-01 2.00E-01 6.37E-04COD lb 4.08E-01 3.99E-01 8.75E-03Boron lb 9.71E-03 9.71E-03Cadmium lb 2.78E-05 2.78E-05Calcium lb 8.52E-05 8.52E-05Chlorides lb 2.90E-02 2.90E-02Chromates lb 3.04E-06 3.04E-06Chromium lb 2.78E-05 2.78E-05Cyanide lb 4.16E-08 4.16E-08
(continued)
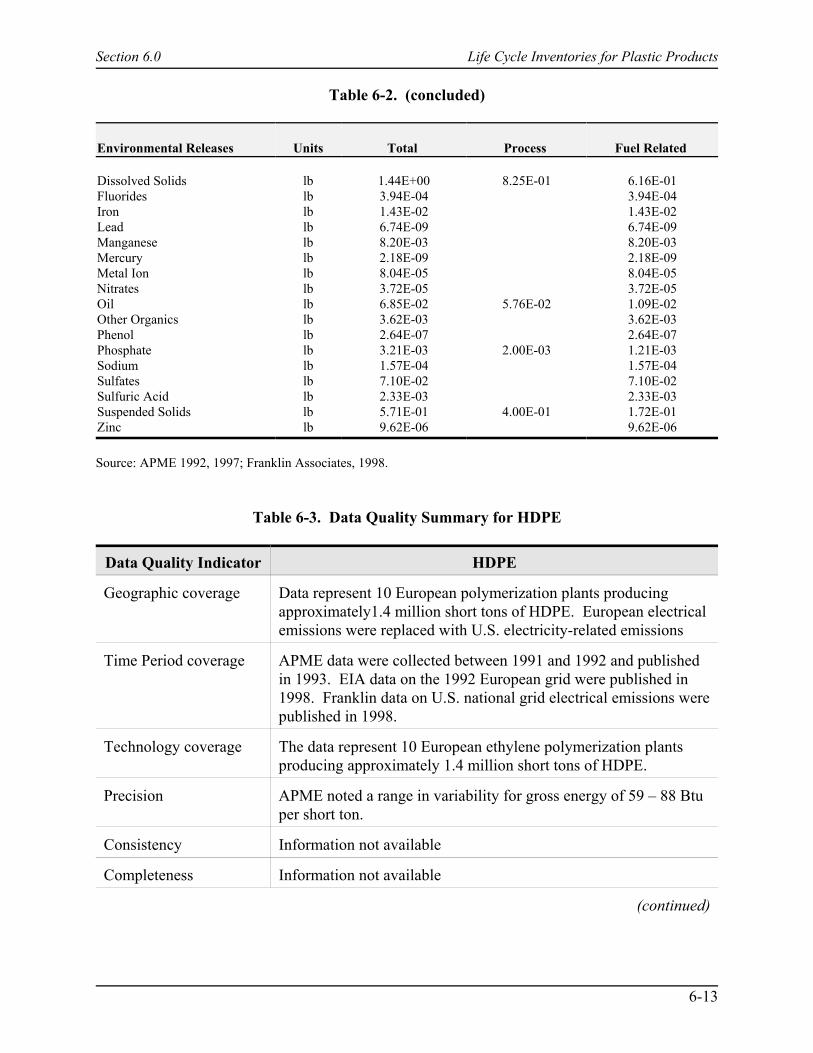
Section 6.0 Life Cycle Inventories for Plastic Products
6-13
Table 6-2. (concluded)
Environmental Releases Units Total Process Fuel Related
Dissolved Solids lb 1.44E+00 8.25E-01 6.16E-01Fluorides lb 3.94E-04 3.94E-04Iron lb 1.43E-02 1.43E-02Lead lb 6.74E-09 6.74E-09Manganese lb 8.20E-03 8.20E-03Mercury lb 2.18E-09 2.18E-09Metal Ion lb 8.04E-05 8.04E-05Nitrates lb 3.72E-05 3.72E-05Oil lb 6.85E-02 5.76E-02 1.09E-02Other Organics lb 3.62E-03 3.62E-03Phenol lb 2.64E-07 2.64E-07Phosphate lb 3.21E-03 2.00E-03 1.21E-03Sodium lb 1.57E-04 1.57E-04Sulfates lb 7.10E-02 7.10E-02Sulfuric Acid lb 2.33E-03 2.33E-03Suspended Solids lb 5.71E-01 4.00E-01 1.72E-01Zinc lb 9.62E-06 9.62E-06
Source: APME 1992, 1997; Franklin Associates, 1998.
Table 6-3. Data Quality Summary for HDPE
Data Quality Indicator HDPE
Geographic coverage Data represent 10 European polymerization plants producingapproximately1.4 million short tons of HDPE. European electricalemissions were replaced with U.S. electricity-related emissions
Time Period coverage APME data were collected between 1991 and 1992 and publishedin 1993. EIA data on the 1992 European grid were published in1998. Franklin data on U.S. national grid electrical emissions werepublished in 1998.
Technology coverage The data represent 10 European ethylene polymerization plantsproducing approximately 1.4 million short tons of HDPE.
Precision APME noted a range in variability for gross energy of 59 – 88 Btuper short ton.
Consistency Information not available
Completeness Information not available
(continued)

Table 6-3. (continued)
Section 6.0 Life Cycle Inventories for Plastic Products
Data Quality Indicator HDPE
6-14
Representativeness Gross energy is 10% lower than a small sample of other publicdata sources. CO2 is within ±10% of this sample; NOx is 5%higher, and solid waste is 25% higher than this sample of publicdata.
Reproducibility Process energy and emissions can be calculated or reproducedfrom all secondary sources since the major sources of data arepublicly available.
Sources of data HDPE profile data are from APME reports 3 and 10. EIA data onthe Western European electricity grid were used to backcalculatefuels and emissions related to electrical energy consumption andwere replaced with the U.S. national grid mix. Franklin data wereused for electrical emissions from the U.S. grid.
Uncertainty A direct analysis of uncertainty was not possible because the datawere based on secondary sources, which did not publishuncertainty ranges. However, based on review from publicsources, comments on data variation, indicate: ± 30% for energy,± 100% for emissions.
Data Quality Rating The HDPE data are considered to be of average quality.
Table 6-4 shows how the data in the current study compare with data from other publicsources, and thus provides a measure of representativeness. Gross energy data (the simple sumof energy of material resource, combustion process energy, and precombustion energy) is10 percent lower than that of the other public sources cited. CO2 is within ±10 percent of thissample of public sources, NOx is 5 percent higher, and solid waste is 25 percent higher thanthose public sources.
The APME energy profile was modified in 1997 since the publication of the originalreport from 1993. In the 1997 publication feedstock energy and fuel have changed in theproportion of oil and gas reported; however, the total energy did not change. This was due to thefact that they had not previously accounted for feedstock waste that was used as fuel. The EPAprofile used feedstock and fuel energy from both reports to determine the total primary energy ofpolyethylene.
A direct analysis of uncertainty was not possible because the study was based onsecondary data. The secondary sources cited in this profile did not publish measures ofuncertainty in the data. However, some comment on the limitations of the results is possible. Young examined the relevance and limitations of the APME data to the North American context. He noted the potential for variation in feedstock energy related to the proportion of oil versus

Section 6.0 Life Cycle Inventories for Plastic Products
6-15
Table 6-4. Comparison to Literature of Key Inventory Data Values for HDPE
Unit EPA HDPE Profile APMEa SFAEFLb Young c
Energy MMBtu/ton 64.04 69.63 69.6 69.6
CO2 lb/ton 3861 3800 4120 4100
NOx lb/ton 20.38 20 20 20
Solid Waste lb/ton 74.1 64.08 63.8 64a APME, 1993, 1997b SFAEFL, 1996c Young, 1996
natural gas used as feedstock. He further examined uncertainty in the APME data and noted thatthe range for both energy and CO2 due to variation in practice is on the order of ±20 to 30percent. For other emissions and solid wastes, it is reasonable to expect variations on the orderof ±100 percent.
Four independent experts in the field developed the APME methodology. Additionally,following IS0 14040, internal expert review was carried out on this EPA effort. Expertsindependent of the original calculations performed this review. In accordance with the ISOstandards, the internal experts are familiar with the requirements of ISO 14040 and 14041 andhave the necessary technical and scientific expertise. However, a report detailing the findings bythe internal experts was not prepared.
The HDPE data are considered to be of average quality.
6.3 Low-Density Polyethylene (LDPE)
6.3.1 Introduction
This section contains an LCI profile for the production of primary (virgin) LDPE. Itcontains process flow diagrams and descriptions for production processes, LCI data tables for1 short ton of product, and a discussion of data quality. Section 6.2 describes the typical processfor producing polyethylene. This section describes only the unit operations for LDPE that differfrom those of polyethylene.
The boundaries for this material system depend on plastic production data (secondary)from a series of papers on "eco-profiles of the European plastics industry.” These inventory datafor the production of commodity thermoplastics were collected and published by APME membercompanies, according to their agreed methodology. Thus, the boundaries for the current productsystem include extraction of raw material (crude oil, natural gas, LPG, etc.), processing crude oiland natural gas, petroleum refining, and ethylene polymerization and separation of LDPE. Tomaintain consistency in boundaries, calculations and presentation, and confidentiality of data, thedata were aggregated by APME at the product system level. With the addition of U.S.

Section 6.0 Life Cycle Inventories for Plastic Products
6-16
Figure 6-3. Simplified process flow diagram for low-density polyethlene (modified from APME, 1993)
combustion and precombustion energy, the data set used in this study represents boundaries forthe aggregated cradle to gate processing of 1 ton of LDPE as described in APME Report 3 andmodified according to clarifications outlined in APME Report 10 (APME, 1993, 1997).
6.3.2 LDPE Production
Figure 6-3 shows a simplified process flow diagram for processing low-densitypolyethylene. The manufacture of LDPE includes: production and transport of processed crudeoil and natural gas (both domestic and imported), petroleum refining, and ethylenepolymerization and separation (Kent, 1974; Elvers et al., 1991; Standen, 1968).
Many of the material production operations for LDPE were described for polyethylene inSection 6.2. Please refer to Section 6.2.2 for a detailed description of crude oil production,natural gas production, LPG production, petroleum refining, natural gas processing, ethyleneproduction, and olefin (ethylene) polymerization. This section describes the steps in LDPEproduction that were not included in the description of polyethylene production.
LDPE is produced by the free-radical polymerization of ethylene at high temperature andhigh pressure. Temperatures vary from 150°to 300°C, and pressures range from 103-345 MPa.The polymerization process involves three basic steps: initiation, propagation, and termination.
Initiation uses a peroxide as an initiator that thermally decomposes into free radicals,
Initiator (R)2 ÿ 2R'
R' reacts with ethylene
R' + CH2CH2 ÿ RCH2CH2'
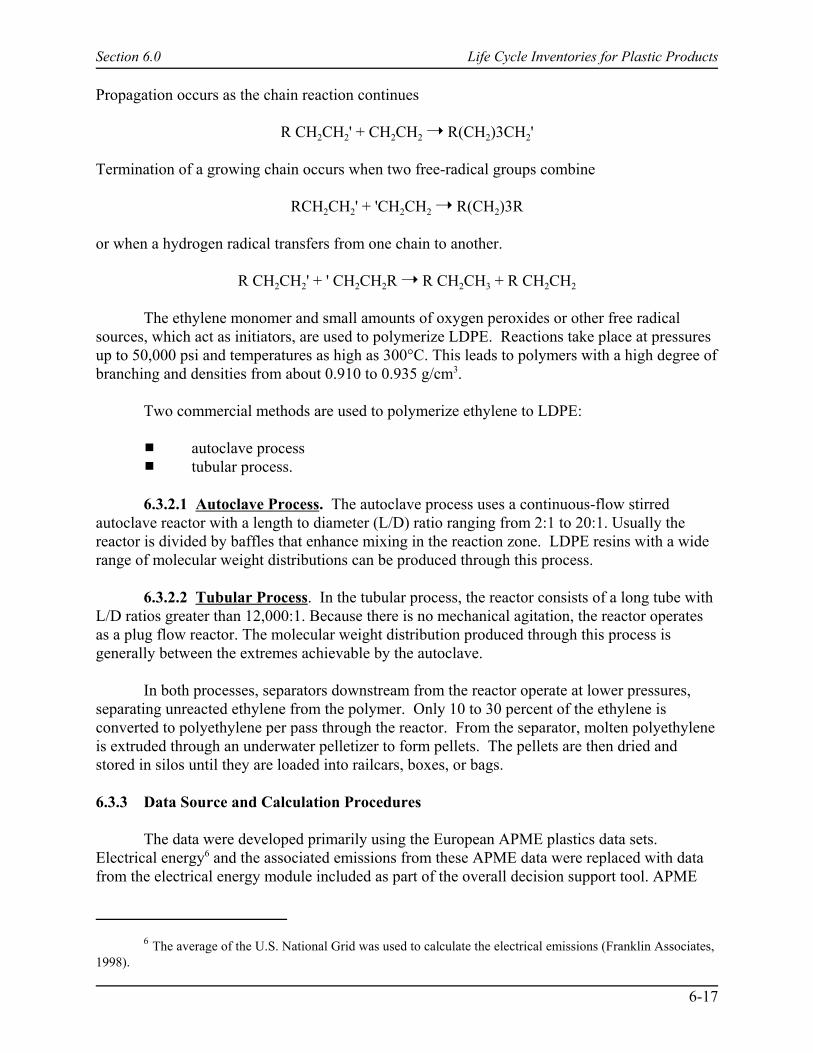
Section 6.0 Life Cycle Inventories for Plastic Products
6 The average of the U.S. National Grid was used to calculate the electrical emissions (Franklin Associates,1998).
6-17
Propagation occurs as the chain reaction continues
R CH2CH2' + CH2CH2 ÿ R(CH2)3CH2'
Termination of a growing chain occurs when two free-radical groups combine
RCH2CH2' + 'CH2CH2 ÿ R(CH2)3R or when a hydrogen radical transfers from one chain to another.
R CH2CH2' + ' CH2CH2R ÿ R CH2CH3 + R CH2CH2
The ethylene monomer and small amounts of oxygen peroxides or other free radicalsources, which act as initiators, are used to polymerize LDPE. Reactions take place at pressuresup to 50,000 psi and temperatures as high as 300°C. This leads to polymers with a high degree ofbranching and densities from about 0.910 to 0.935 g/cm3.
Two commercial methods are used to polymerize ethylene to LDPE:
# autoclave process# tubular process.
6.3.2.1 Autoclave Process. The autoclave process uses a continuous-flow stirredautoclave reactor with a length to diameter (L/D) ratio ranging from 2:1 to 20:1. Usually thereactor is divided by baffles that enhance mixing in the reaction zone. LDPE resins with a widerange of molecular weight distributions can be produced through this process.
6.3.2.2 Tubular Process. In the tubular process, the reactor consists of a long tube withL/D ratios greater than 12,000:1. Because there is no mechanical agitation, the reactor operatesas a plug flow reactor. The molecular weight distribution produced through this process isgenerally between the extremes achievable by the autoclave.
In both processes, separators downstream from the reactor operate at lower pressures,separating unreacted ethylene from the polymer. Only 10 to 30 percent of the ethylene isconverted to polyethylene per pass through the reactor. From the separator, molten polyethyleneis extruded through an underwater pelletizer to form pellets. The pellets are then dried andstored in silos until they are loaded into railcars, boxes, or bags.
6.3.3 Data Source and Calculation Procedures
The data were developed primarily using the European APME plastics data sets. Electrical energy6 and the associated emissions from these APME data were replaced with datafrom the electrical energy module included as part of the overall decision support tool. APME

Section 6.0 Life Cycle Inventories for Plastic Products
7 Energy conversion factors developed by Franklin Associates Ltd. (Table 9 in their 1998 report); Franklindata were used to calculate/convert to the appropriate units.
8 Energy consumption and emissions released from Utility Boilers developed by Franklin Associates (Tables 6, 7, 8, 14, 16, 18, 20, 26 in their 1998 report). Franklin data were used to develop the appropriate pre-combustion energies and environmental emissions for 1 kWh of European electric grid.
9 U.S. Electrical Energy and Emissions data developed by Franklin Associates (Tables 6, 7, 8, 14, 16, 18,20, 26 in their 1998 report). Franklin data were used to calculate the appropriate precombustion energies andenvironmental emissions for 1 kWh of U.S. electric grid.
6-18
Report 3, which presents a cradle-to-gate environmental data profile for 1 kilogram of LDPE,was used along with Western European electric grid data and U.S. electric grid data (EIA, 1998;Franklin Associates, 1998; APME, 1993, 1997). The following steps outline the procedure usedto construct LCI data for PE:
1. The LDPE profile from APME was converted from SI units (energy in MJ, massin milligrams per kilogram) to U.S. units (mass in lb, volume in U.S. gallons,gaseous volume in ft3, and energy in Btu/1 ton (2,000 lb).7 The electrical energyis converted from MJ to kWh using the appropriate efficiencies for each fuel inthe electrical fuel mix (EIA, 1998).
2. Based on the Western European Fuel Mix from 1992 and combustion andprecombustion emissions from the Franklin Report,8 an environmental profile forproducing and delivering 1 (kWh) of the Western European electrical grid9 wasdeveloped. A similar environmental profile for producing 1 kWh of the U.S.electrical grid was developed by Franklin (EIA, 1998; Franklin Associates, 1998).
3. The precombustion energy and environmental releases (air emissions, wateremissions and solid waste emissions) from the European Electrical Fuel Mix werededucted using the profile developed in Step 2 for the appropriate kWh convertedin Step 1. For the same kWh, the precombustion energies and environmentalemissions for the U.S. electrical mix are added to the profile. The net electricalenergy for the process is the same; however, the precombustion energy quantitiesand environmental emissions are different because of the different fuel mix fromthe two electrical grids.
Table 6-5 shows the original APME LDPE emissions profile. The first column shows thepublished APME data profile and the second column shows APME data with the Europeanelectrical emissions subtracted. The complete LCI data results are shown in Section 6.3.4.
6.3.4 LCI Results
Tables 6-6 summarizes the LCI data for virgin LDPE production. The table breaks downthe individual fuels that make up the energy of material resource, combustion process energy,and precombustion energy related to material resource feedstock, process fuels, and electric
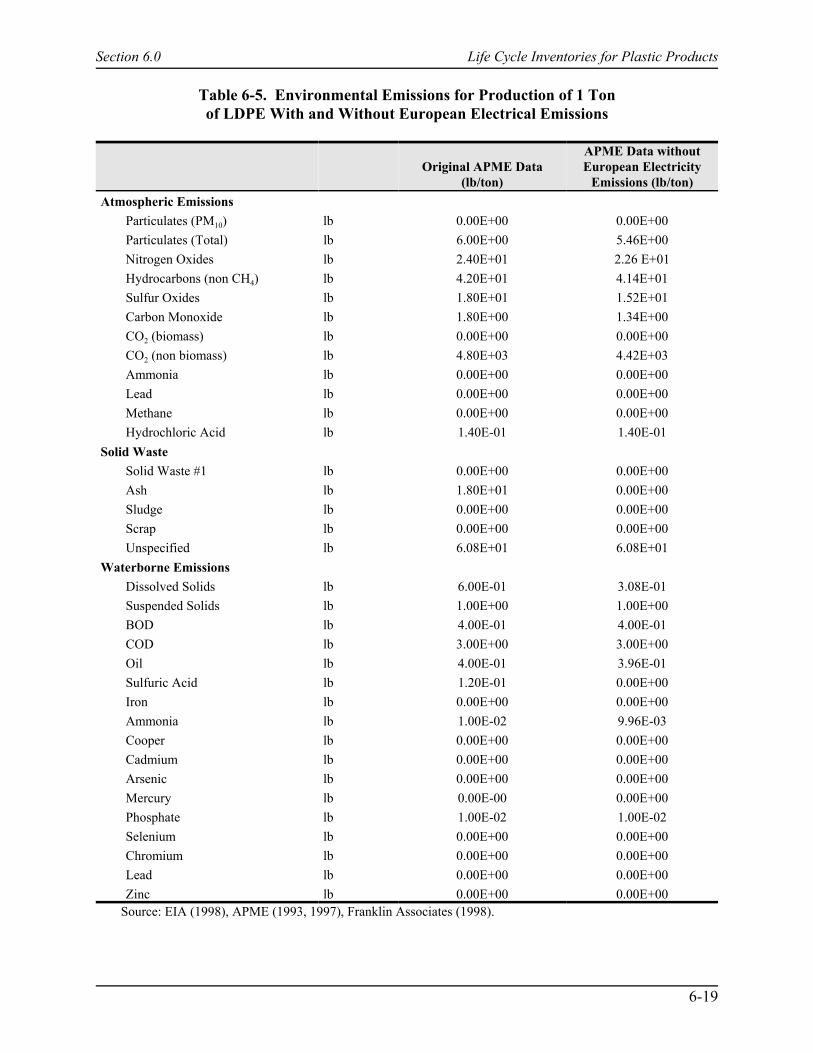
Section 6.0 Life Cycle Inventories for Plastic Products
6-19
Table 6-5. Environmental Emissions for Production of 1 Tonof LDPE With and Without European Electrical Emissions
Original APME Data(lb/ton)
APME Data withoutEuropean Electricity
Emissions (lb/ton)Atmospheric Emissions
Particulates (PM10) lb 0.00E+00 0.00E+00Particulates (Total) lb 6.00E+00 5.46E+00Nitrogen Oxides lb 2.40E+01 2.26 E+01Hydrocarbons (non CH4) lb 4.20E+01 4.14E+01Sulfur Oxides lb 1.80E+01 1.52E+01Carbon Monoxide lb 1.80E+00 1.34E+00CO2 (biomass) lb 0.00E+00 0.00E+00CO2 (non biomass) lb 4.80E+03 4.42E+03Ammonia lb 0.00E+00 0.00E+00Lead lb 0.00E+00 0.00E+00Methane lb 0.00E+00 0.00E+00Hydrochloric Acid lb 1.40E-01 1.40E-01
Solid WasteSolid Waste #1 lb 0.00E+00 0.00E+00Ash lb 1.80E+01 0.00E+00Sludge lb 0.00E+00 0.00E+00Scrap lb 0.00E+00 0.00E+00Unspecified lb 6.08E+01 6.08E+01
Waterborne EmissionsDissolved Solids lb 6.00E-01 3.08E-01Suspended Solids lb 1.00E+00 1.00E+00BOD lb 4.00E-01 4.00E-01COD lb 3.00E+00 3.00E+00Oil lb 4.00E-01 3.96E-01Sulfuric Acid lb 1.20E-01 0.00E+00Iron lb 0.00E+00 0.00E+00Ammonia lb 1.00E-02 9.96E-03Cooper lb 0.00E+00 0.00E+00Cadmium lb 0.00E+00 0.00E+00Arsenic lb 0.00E+00 0.00E+00Mercury lb 0.00E-00 0.00E+00Phosphate lb 1.00E-02 1.00E-02Selenium lb 0.00E+00 0.00E+00Chromium lb 0.00E+00 0.00E+00Lead lb 0.00E+00 0.00E+00Zinc lb 0.00E+00 0.00E+00
Source: EIA (1998), APME (1993, 1997), Franklin Associates (1998).
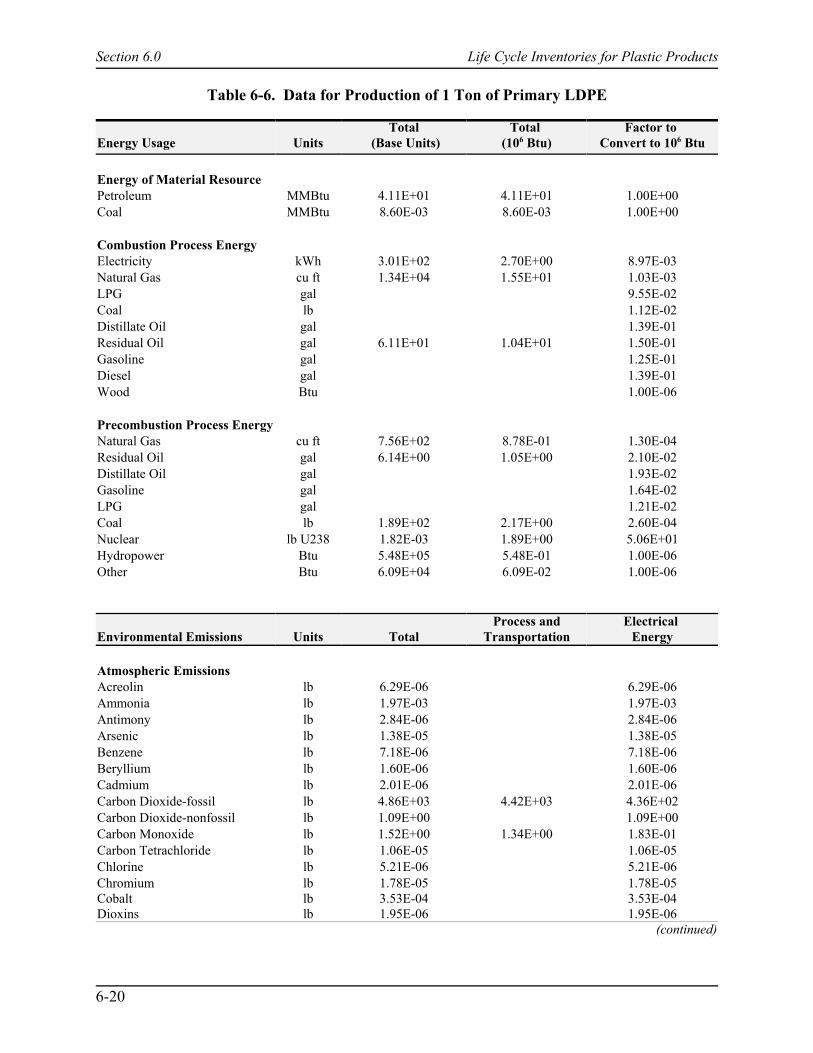
Section 6.0 Life Cycle Inventories for Plastic Products
6-20
Table 6-6. Data for Production of 1 Ton of Primary LDPE
Energy Usage UnitsTotal
(Base Units)Total
(106 Btu)Factor to
Convert to 106 Btu
Energy of Material ResourcePetroleum MMBtu 4.11E+01 4.11E+01 1.00E+00Coal MMBtu 8.60E-03 8.60E-03 1.00E+00
Combustion Process EnergyElectricity kWh 3.01E+02 2.70E+00 8.97E-03Natural Gas cu ft 1.34E+04 1.55E+01 1.03E-03LPG gal 9.55E-02Coal lb 1.12E-02Distillate Oil gal 1.39E-01Residual Oil gal 6.11E+01 1.04E+01 1.50E-01Gasoline gal 1.25E-01Diesel gal 1.39E-01Wood Btu 1.00E-06
Precombustion Process EnergyNatural Gas cu ft 7.56E+02 8.78E-01 1.30E-04Residual Oil gal 6.14E+00 1.05E+00 2.10E-02Distillate Oil gal 1.93E-02Gasoline gal 1.64E-02LPG gal 1.21E-02Coal lb 1.89E+02 2.17E+00 2.60E-04Nuclear lb U238 1.82E-03 1.89E+00 5.06E+01Hydropower Btu 5.48E+05 5.48E-01 1.00E-06Other Btu 6.09E+04 6.09E-02 1.00E-06
Environmental Emissions Units TotalProcess and
TransportationElectrical
Energy
Atmospheric EmissionsAcreolin lb 6.29E-06 6.29E-06Ammonia lb 1.97E-03 1.97E-03Antimony lb 2.84E-06 2.84E-06Arsenic lb 1.38E-05 1.38E-05Benzene lb 7.18E-06 7.18E-06Beryllium lb 1.60E-06 1.60E-06Cadmium lb 2.01E-06 2.01E-06Carbon Dioxide-fossil lb 4.86E+03 4.42E+03 4.36E+02Carbon Dioxide-nonfossil lb 1.09E+00 1.09E+00Carbon Monoxide lb 1.52E+00 1.34E+00 1.83E-01Carbon Tetrachloride lb 1.06E-05 1.06E-05Chlorine lb 5.21E-06 5.21E-06Chromium lb 1.78E-05 1.78E-05Cobalt lb 3.53E-04 3.53E-04Dioxins lb 1.95E-06 1.95E-06
(continued)
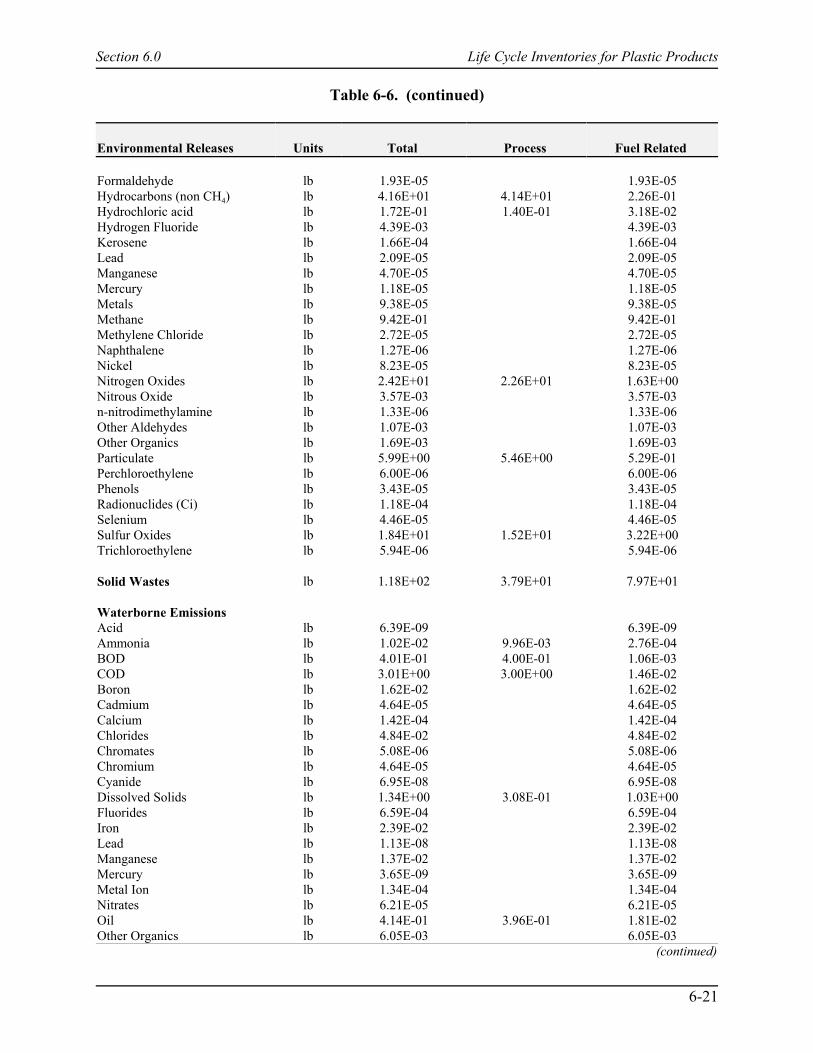
Section 6.0 Life Cycle Inventories for Plastic Products
6-21
Table 6-6. (continued)
Environmental Releases Units Total Process Fuel Related
Formaldehyde lb 1.93E-05 1.93E-05Hydrocarbons (non CH4) lb 4.16E+01 4.14E+01 2.26E-01Hydrochloric acid lb 1.72E-01 1.40E-01 3.18E-02Hydrogen Fluoride lb 4.39E-03 4.39E-03Kerosene lb 1.66E-04 1.66E-04Lead lb 2.09E-05 2.09E-05Manganese lb 4.70E-05 4.70E-05Mercury lb 1.18E-05 1.18E-05Metals lb 9.38E-05 9.38E-05Methane lb 9.42E-01 9.42E-01Methylene Chloride lb 2.72E-05 2.72E-05Naphthalene lb 1.27E-06 1.27E-06Nickel lb 8.23E-05 8.23E-05Nitrogen Oxides lb 2.42E+01 2.26E+01 1.63E+00Nitrous Oxide lb 3.57E-03 3.57E-03n-nitrodimethylamine lb 1.33E-06 1.33E-06Other Aldehydes lb 1.07E-03 1.07E-03Other Organics lb 1.69E-03 1.69E-03Particulate lb 5.99E+00 5.46E+00 5.29E-01Perchloroethylene lb 6.00E-06 6.00E-06Phenols lb 3.43E-05 3.43E-05Radionuclides (Ci) lb 1.18E-04 1.18E-04Selenium lb 4.46E-05 4.46E-05Sulfur Oxides lb 1.84E+01 1.52E+01 3.22E+00Trichloroethylene lb 5.94E-06 5.94E-06
Solid Wastes lb 1.18E+02 3.79E+01 7.97E+01
Waterborne EmissionsAcid lb 6.39E-09 6.39E-09Ammonia lb 1.02E-02 9.96E-03 2.76E-04BOD lb 4.01E-01 4.00E-01 1.06E-03COD lb 3.01E+00 3.00E+00 1.46E-02Boron lb 1.62E-02 1.62E-02Cadmium lb 4.64E-05 4.64E-05Calcium lb 1.42E-04 1.42E-04Chlorides lb 4.84E-02 4.84E-02Chromates lb 5.08E-06 5.08E-06Chromium lb 4.64E-05 4.64E-05Cyanide lb 6.95E-08 6.95E-08Dissolved Solids lb 1.34E+00 3.08E-01 1.03E+00Fluorides lb 6.59E-04 6.59E-04Iron lb 2.39E-02 2.39E-02Lead lb 1.13E-08 1.13E-08Manganese lb 1.37E-02 1.37E-02Mercury lb 3.65E-09 3.65E-09Metal Ion lb 1.34E-04 1.34E-04Nitrates lb 6.21E-05 6.21E-05Oil lb 4.14E-01 3.96E-01 1.81E-02Other Organics lb 6.05E-03 6.05E-03
(continued)
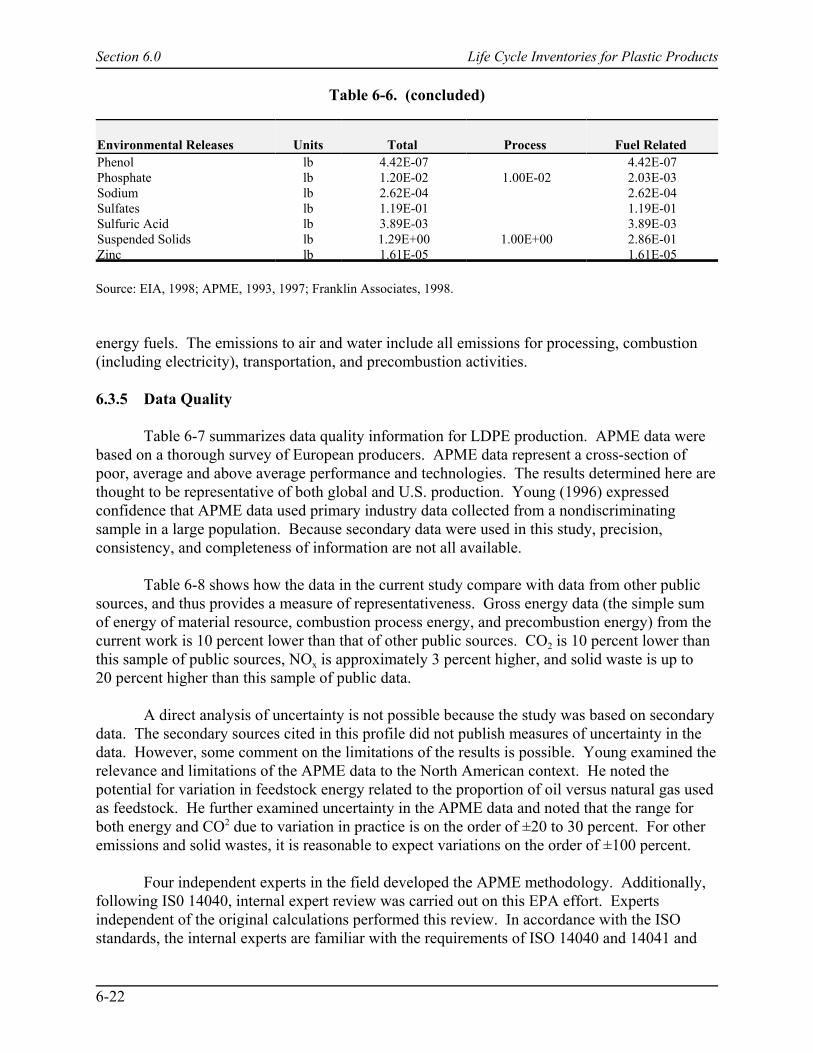
Section 6.0 Life Cycle Inventories for Plastic Products
6-22
Table 6-6. (concluded)
Environmental Releases Units Total Process Fuel Related Phenol lb 4.42E-07 4.42E-07Phosphate lb 1.20E-02 1.00E-02 2.03E-03Sodium lb 2.62E-04 2.62E-04Sulfates lb 1.19E-01 1.19E-01Sulfuric Acid lb 3.89E-03 3.89E-03Suspended Solids lb 1.29E+00 1.00E+00 2.86E-01Zinc lb 1.61E-05 1.61E-05
Source: EIA, 1998; APME, 1993, 1997; Franklin Associates, 1998.
energy fuels. The emissions to air and water include all emissions for processing, combustion(including electricity), transportation, and precombustion activities.
6.3.5 Data Quality
Table 6-7 summarizes data quality information for LDPE production. APME data werebased on a thorough survey of European producers. APME data represent a cross-section ofpoor, average and above average performance and technologies. The results determined here arethought to be representative of both global and U.S. production. Young (1996) expressedconfidence that APME data used primary industry data collected from a nondiscriminatingsample in a large population. Because secondary data were used in this study, precision,consistency, and completeness of information are not all available.
Table 6-8 shows how the data in the current study compare with data from other publicsources, and thus provides a measure of representativeness. Gross energy data (the simple sumof energy of material resource, combustion process energy, and precombustion energy) from thecurrent work is 10 percent lower than that of other public sources. CO2 is 10 percent lower thanthis sample of public sources, NOx is approximately 3 percent higher, and solid waste is up to20 percent higher than this sample of public data.
A direct analysis of uncertainty is not possible because the study was based on secondarydata. The secondary sources cited in this profile did not publish measures of uncertainty in thedata. However, some comment on the limitations of the results is possible. Young examined therelevance and limitations of the APME data to the North American context. He noted thepotential for variation in feedstock energy related to the proportion of oil versus natural gas usedas feedstock. He further examined uncertainty in the APME data and noted that the range forboth energy and CO2 due to variation in practice is on the order of ±20 to 30 percent. For otheremissions and solid wastes, it is reasonable to expect variations on the order of ±100 percent.
Four independent experts in the field developed the APME methodology. Additionally,following IS0 14040, internal expert review was carried out on this EPA effort. Expertsindependent of the original calculations performed this review. In accordance with the ISOstandards, the internal experts are familiar with the requirements of ISO 14040 and 14041 and
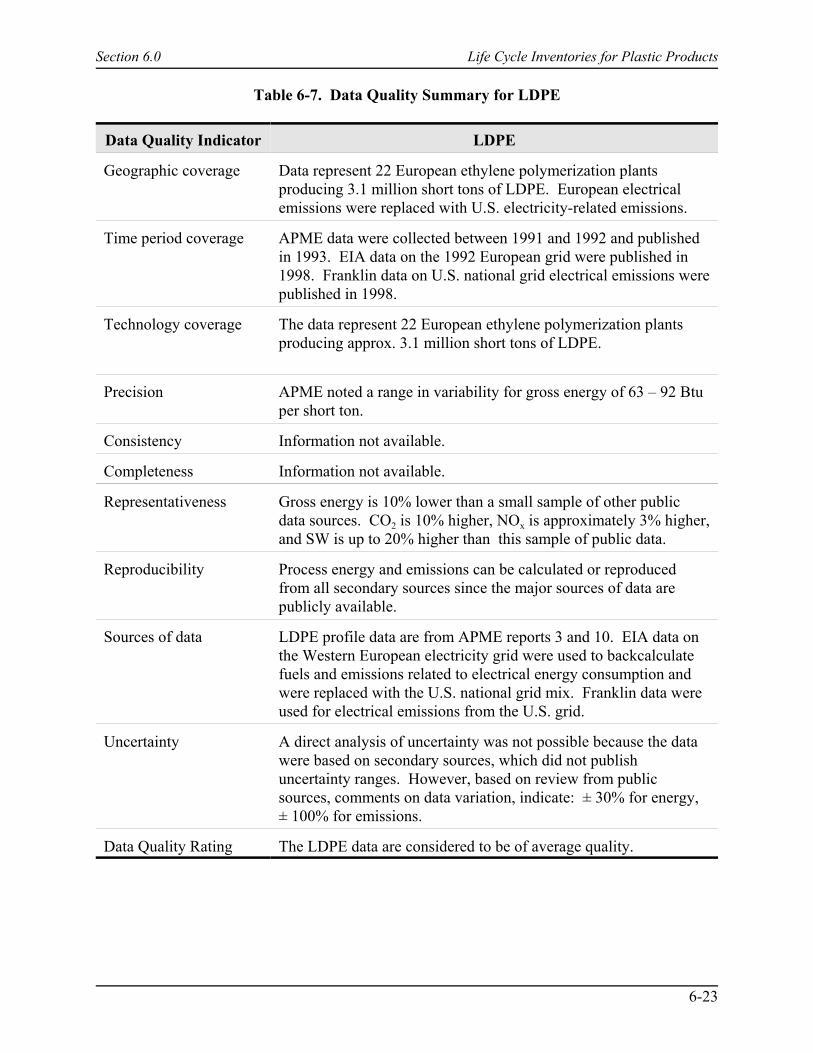
Section 6.0 Life Cycle Inventories for Plastic Products
6-23
Table 6-7. Data Quality Summary for LDPE
Data Quality Indicator LDPE
Geographic coverage Data represent 22 European ethylene polymerization plantsproducing 3.1 million short tons of LDPE. European electricalemissions were replaced with U.S. electricity-related emissions.
Time period coverage APME data were collected between 1991 and 1992 and publishedin 1993. EIA data on the 1992 European grid were published in1998. Franklin data on U.S. national grid electrical emissions werepublished in 1998.
Technology coverage The data represent 22 European ethylene polymerization plantsproducing approx. 3.1 million short tons of LDPE.
Precision APME noted a range in variability for gross energy of 63 – 92 Btuper short ton.
Consistency Information not available.
Completeness Information not available.
Representativeness Gross energy is 10% lower than a small sample of other publicdata sources. CO2 is 10% higher, NOx is approximately 3% higher,and SW is up to 20% higher than this sample of public data.
Reproducibility Process energy and emissions can be calculated or reproducedfrom all secondary sources since the major sources of data arepublicly available.
Sources of data LDPE profile data are from APME reports 3 and 10. EIA data onthe Western European electricity grid were used to backcalculatefuels and emissions related to electrical energy consumption andwere replaced with the U.S. national grid mix. Franklin data wereused for electrical emissions from the U.S. grid.
Uncertainty A direct analysis of uncertainty was not possible because the datawere based on secondary sources, which did not publishuncertainty ranges. However, based on review from publicsources, comments on data variation, indicate: ± 30% for energy,± 100% for emissions.
Data Quality Rating The LDPE data are considered to be of average quality.
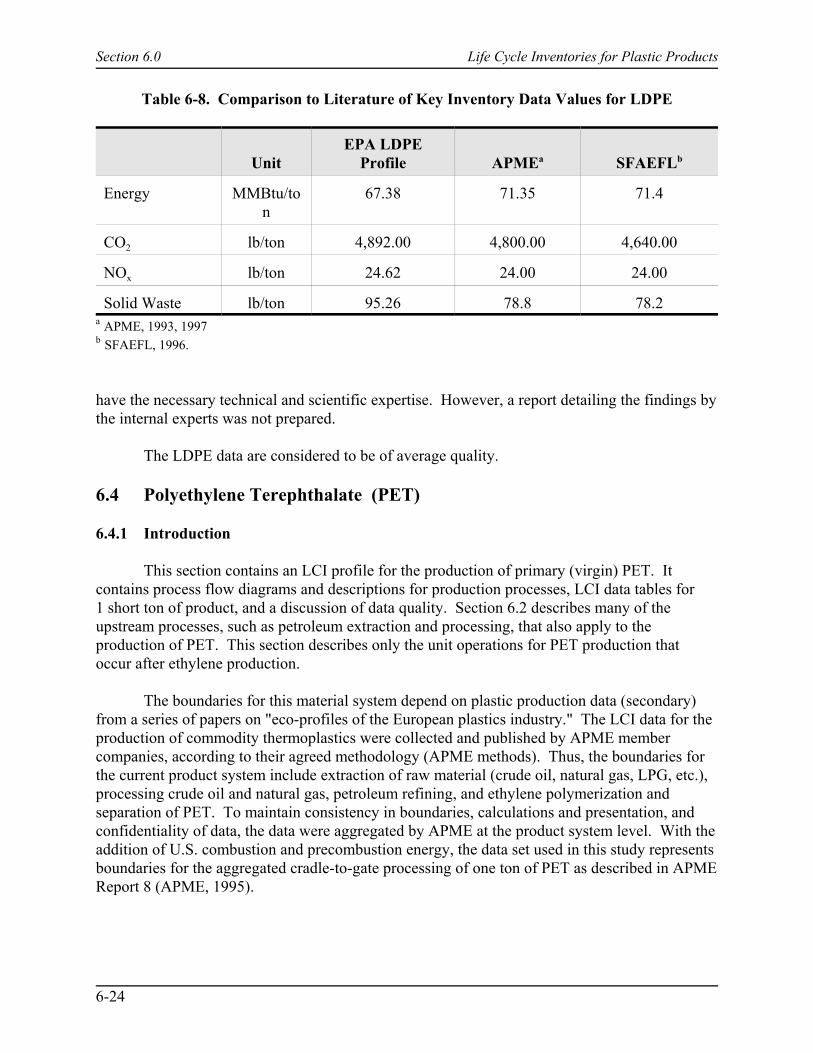
Section 6.0 Life Cycle Inventories for Plastic Products
6-24
Table 6-8. Comparison to Literature of Key Inventory Data Values for LDPE
UnitEPA LDPE
Profile APMEa SFAEFLb
Energy MMBtu/ton
67.38 71.35 71.4
CO2 lb/ton 4,892.00 4,800.00 4,640.00
NOx lb/ton 24.62 24.00 24.00
Solid Waste lb/ton 95.26 78.8 78.2a APME, 1993, 1997b SFAEFL, 1996.
have the necessary technical and scientific expertise. However, a report detailing the findings bythe internal experts was not prepared.
The LDPE data are considered to be of average quality.
6.4 Polyethylene Terephthalate (PET)
6.4.1 Introduction
This section contains an LCI profile for the production of primary (virgin) PET. Itcontains process flow diagrams and descriptions for production processes, LCI data tables for1 short ton of product, and a discussion of data quality. Section 6.2 describes many of theupstream processes, such as petroleum extraction and processing, that also apply to theproduction of PET. This section describes only the unit operations for PET production thatoccur after ethylene production.
The boundaries for this material system depend on plastic production data (secondary)from a series of papers on "eco-profiles of the European plastics industry." The LCI data for theproduction of commodity thermoplastics were collected and published by APME membercompanies, according to their agreed methodology (APME methods). Thus, the boundaries forthe current product system include extraction of raw material (crude oil, natural gas, LPG, etc.),processing crude oil and natural gas, petroleum refining, and ethylene polymerization andseparation of PET. To maintain consistency in boundaries, calculations and presentation, andconfidentiality of data, the data were aggregated by APME at the product system level. With theaddition of U.S. combustion and precombustion energy, the data set used in this study representsboundaries for the aggregated cradle-to-gate processing of one ton of PET as described in APMEReport 8 (APME, 1995).
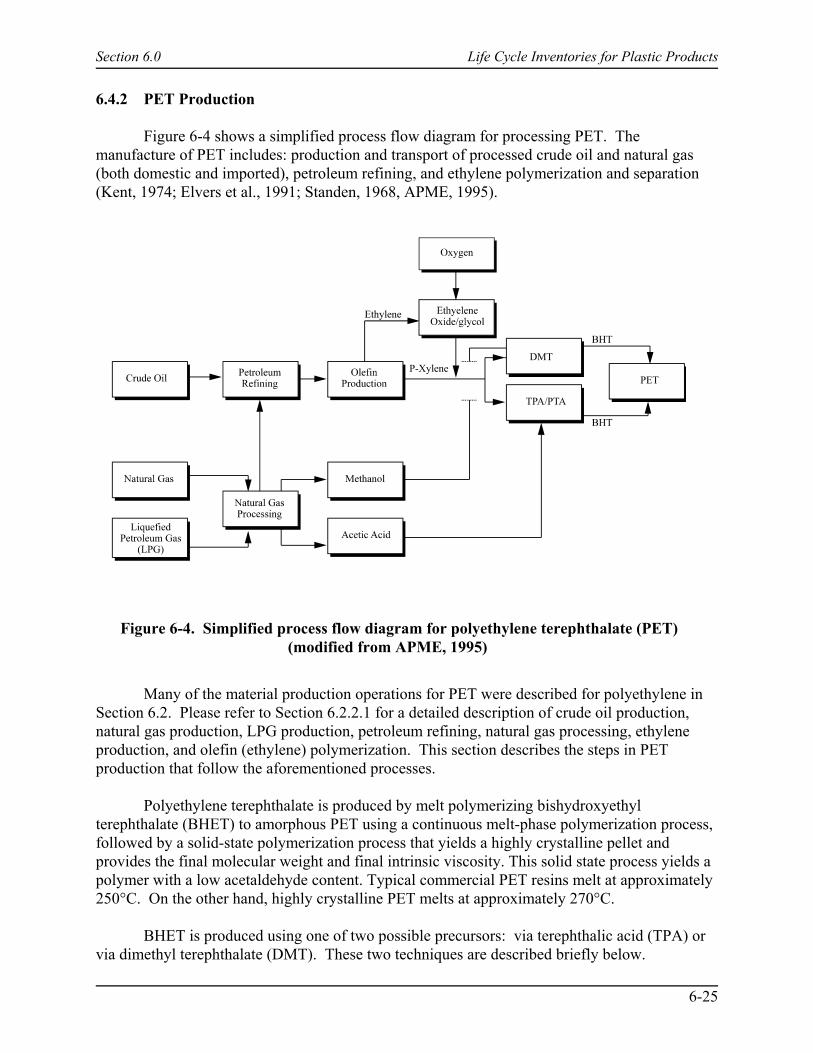
Section 6.0 Life Cycle Inventories for Plastic Products
6-25
Figure 6-4. Simplified process flow diagram for polyethylene terephthalate (PET) (modified from APME, 1995)
6.4.2 PET Production
Figure 6-4 shows a simplified process flow diagram for processing PET. Themanufacture of PET includes: production and transport of processed crude oil and natural gas(both domestic and imported), petroleum refining, and ethylene polymerization and separation(Kent, 1974; Elvers et al., 1991; Standen, 1968, APME, 1995).
Many of the material production operations for PET were described for polyethylene inSection 6.2. Please refer to Section 6.2.2.1 for a detailed description of crude oil production,natural gas production, LPG production, petroleum refining, natural gas processing, ethyleneproduction, and olefin (ethylene) polymerization. This section describes the steps in PETproduction that follow the aforementioned processes.
Polyethylene terephthalate is produced by melt polymerizing bishydroxyethylterephthalate (BHET) to amorphous PET using a continuous melt-phase polymerization process,followed by a solid-state polymerization process that yields a highly crystalline pellet andprovides the final molecular weight and final intrinsic viscosity. This solid state process yields apolymer with a low acetaldehyde content. Typical commercial PET resins melt at approximately250°C. On the other hand, highly crystalline PET melts at approximately 270°C.
BHET is produced using one of two possible precursors: via terephthalic acid (TPA) orvia dimethyl terephthalate (DMT). These two techniques are described briefly below.
Section 6.0 Life Cycle Inventories for Plastic Products
10 The average of the U.S. National Grid was used to calculate the electrical emissions (FranklinAssociates, 1998).
11 Energy conversion factors developed by Franklin Associates Ltd. (Table 9 in their 1998 report); Franklindata were used to calculate/convert to the appropriate units.
12 Energy consumption and emissions released from Utility Boilers developed by Franklin Associates (Tables 6, 7, 8, 14, 16, 18, 20, 26 in their 1998 report). Franklin data were used to develop the appropriate pre-combustion energies and environmental emissions for 1 kWh of European electric grid.
13 U.S. Electrical Energy and Emissions data developed by Franklin Associates (Tables 6, 7, 8, 14, 16, 18,20, 26 in their 1998 report). Franklin data were used to calculate the appropriate precombustion energies andenvironmental emissions for 1 kWh of U.S. electric grid.
6-26
In the TPA route, also known as the direct esterification route, PET is manufactured byoxidizing para-xylene and reacting it with acetic acid, which is produced from natural gas, tomake terephthalic acid. TPA is then purified and combined with ethylene glycol in a reactionthat produces BHT. BHT is then used to produce PET.
In the DMT route, also known as the ester interchange reaction, PET is produced byreacting para-xylene and methanol to form DMT, which then reacts with ethylene glycol in theester interchange reaction to produce BHET. BHET is then used to produce PET.
6.4.3 Data Source and Calculation Procedures
The data were developed primarily using the European APME plastics data sets. Electrical energy10 and the associated emissions from these APME data were replaced with datafrom the electrical energy module included as part of the overall decision support tool. APMEReport 8, which presents a cradle-to-gate environmental data profile for 1 kilogram of PET, wasused along with Western European electric grid data and U.S. electric grid data (EIA, 1998;Franklin Associates, 1998; APME, 1993, 1997). The following steps outline the procedure usedto construct LCI data for PET:
1. The TPA profile from APME was converted from SI units (energy in MJ, mass inmilligrams per kilogram) to U.S. units (mass in lb, volume in U.S. gallons,gaseous volume in ft3, and energy in Btu/1 ton (2,000 lb).11 The electrical energyis converted from MJ to kWh using the appropriate efficiencies for each fuel inthe electrical fuel mix (EIA, 1998).
2. Based on the Western European Fuel Mix from 1992 and combustion andprecombustion emissions from the Franklin Report,12 an environmental profile forproducing and delivering 1 (kWh) of the Western European electrical grid13 wasdeveloped. A similar environmental profile for producing 1 kWh of the U.S.electrical grid was developed by Franklin (EIA, 1998; Franklin Associates, 1998).
3. The precombustion energy and environmental releases (air emissions, wateremissions and solid waste emissions) from the European Electrical Fuel Mix werededucted using the profile developed in Step 2 for the appropriate kWh converted
Section 6.0 Life Cycle Inventories for Plastic Products
6-27
in Step 1. For the same kWh, the precombustion energies and environmentalemissions for the U.S. electrical mix are added to the profile. The net electricalenergy for the process is the same; however, the precombustion energy quantitiesand environmental emissions are different because of the different fuel mix fromthe two electrical grids.
Table 6-9 shows the original APME PET emissions profile. The first column shows thepublished APME data profile and the second column shows APME data with the Europeanelectrical emissions subtracted. The complete LCI results are provided in Section 6.4.4.
6.4.4 LCI Results
Table 6-10 summarizes the cradle-to-gate LCI data for virgin PET production. The tablebreaks down the individual fuels that make up the energy of material resource, combustionprocess energy, and precombustion energy related to material resource feedstock, process fuels,and electric energy fuels. The emissions to air and water include all emissions for processing,combustion (including electricity), transportation, and precombustion activities.
6.4.5 Data Quality
Table 6-11 summarizes data quality information for virgin PET production. APME datawere based on a thorough survey of European producers. APME data represent a cross-sectionof poor, average and above average performance and technologies. The results determined hereare thought to be representative of both global and U.S. production. Young (1996) expressedconfidence that APME data used primary industry data collected from a nondiscriminatingsample in a large population. Because secondary data were used in this study, precision,consistency, and completeness of information is not all available. The various data qualitymeasures are defined below.
Table 6-12 shows how the data in the current study compare with data from other publicsources, and thus provides a measure of representativeness. Gross energy data (the simple sumof energy of material resource, combustion process energy, and precombustion energy) from thecurrent work is up to 10 percent lower than that of other public sources. CO2 is up to 10 percenthigher than this sample of public data, NOx is up to 8 percent higher, and solid waste is up to25 percent higher than this sample.
A direct analysis of uncertainty was not possible because the study was based onsecondary data. The secondary sources cited in this profile did not publish measures ofuncertainty in the data. However, some comment on the limitations of the results is possible. Young (1996) examined the relevance and limitations of the APME data to the North Americancontext. He noted the potential for variation in feedstock energy related to the proportion of oilversus natural gas used as feedstock. He further examined uncertainty in the APME data andnoted that the range for both energy and CO2 due to variation in practice is in the order of ±20 to30 percent. For other emissions and solid wastes, it is reasonable to expect variations on theorder of ±100 percent.
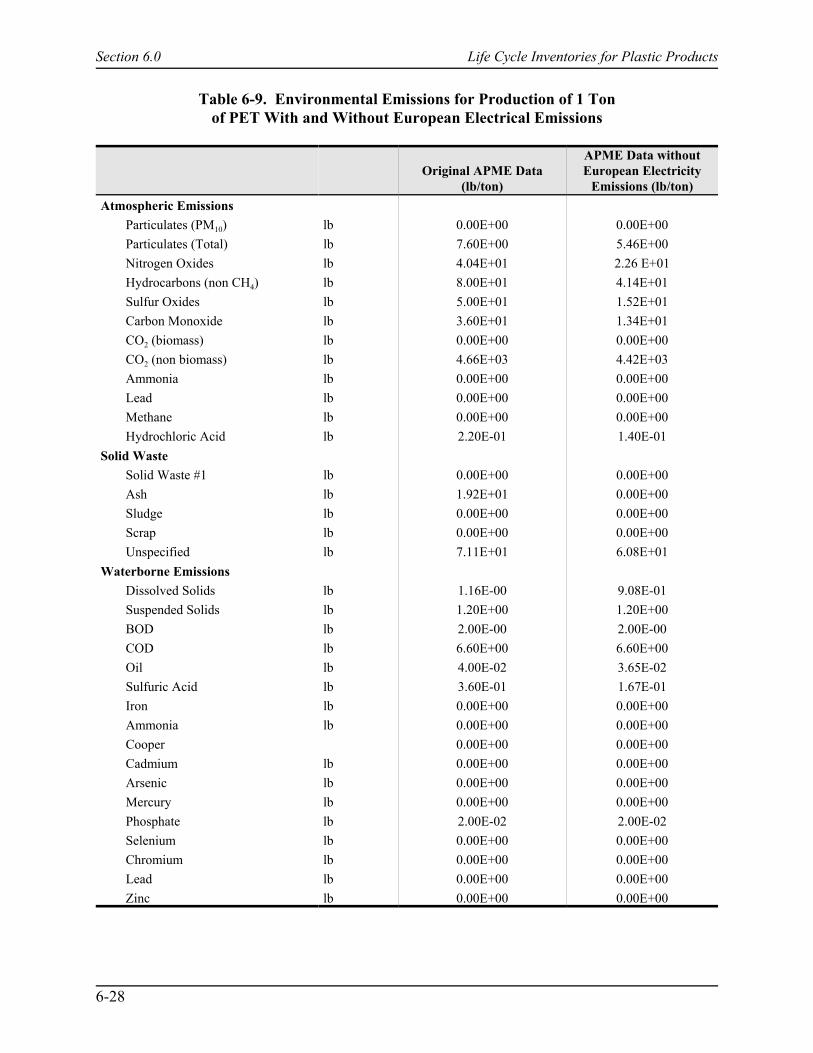
Section 6.0 Life Cycle Inventories for Plastic Products
6-28
Table 6-9. Environmental Emissions for Production of 1 Tonof PET With and Without European Electrical Emissions
Original APME Data(lb/ton)
APME Data withoutEuropean Electricity
Emissions (lb/ton)Atmospheric Emissions
Particulates (PM10) lb 0.00E+00 0.00E+00Particulates (Total) lb 7.60E+00 5.46E+00Nitrogen Oxides lb 4.04E+01 2.26 E+01Hydrocarbons (non CH4) lb 8.00E+01 4.14E+01Sulfur Oxides lb 5.00E+01 1.52E+01Carbon Monoxide lb 3.60E+01 1.34E+01CO2 (biomass) lb 0.00E+00 0.00E+00CO2 (non biomass) lb 4.66E+03 4.42E+03Ammonia lb 0.00E+00 0.00E+00Lead lb 0.00E+00 0.00E+00Methane lb 0.00E+00 0.00E+00Hydrochloric Acid lb 2.20E-01 1.40E-01
Solid WasteSolid Waste #1 lb 0.00E+00 0.00E+00Ash lb 1.92E+01 0.00E+00Sludge lb 0.00E+00 0.00E+00Scrap lb 0.00E+00 0.00E+00Unspecified lb 7.11E+01 6.08E+01
Waterborne EmissionsDissolved Solids lb 1.16E-00 9.08E-01Suspended Solids lb 1.20E+00 1.20E+00BOD lb 2.00E-00 2.00E-00COD lb 6.60E+00 6.60E+00Oil lb 4.00E-02 3.65E-02Sulfuric Acid lb 3.60E-01 1.67E-01Iron lb 0.00E+00 0.00E+00Ammonia lb 0.00E+00 0.00E+00Cooper 0.00E+00 0.00E+00Cadmium lb 0.00E+00 0.00E+00Arsenic lb 0.00E+00 0.00E+00Mercury lb 0.00E+00 0.00E+00Phosphate lb 2.00E-02 2.00E-02Selenium lb 0.00E+00 0.00E+00Chromium lb 0.00E+00 0.00E+00Lead lb 0.00E+00 0.00E+00Zinc lb 0.00E+00 0.00E+00

Section 6.0 Life Cycle Inventories for Plastic Products
6-29
Table 6-10. Data for Production of 1 Ton of Primary PET
Energy Usage UnitsTotal
(Base Units)Total
(106 Btu)Factor to
Convert to 106 Btu
Energy of Material ResourcePetroleum MMBtu 3.94E+01 3.94E+01 1.00E+00Coal MMBtu 8.60E-03 8.60E-03 1.00E+00
Combustion Process EnergyElectricity kWh 2.60E+02 2.33E+00 8.97E-03Natural Gas cu ft 1.05E+04 1.22E+01 1.16E-03LPG gal 1.08E-01Coal lb 1.15E-02Distillate oil gal 1.58E-01Residual Oil gal 5.71E+01 9.76E+00 1.71E-01Gasoline gal 1.41E-01Diesel gal 1.58E-01Wood Btu 1.00E-06
Precombustion Process EnergyNatural Gas cu ft 1.46E+03 1.70E+00 1.16E-03Residual Oil gal 1.33E+01 2.27E+00 1.71E-01Distillate oil gal 1.58E-01Gasoline gal 1.41E-01LPG gal 1.08E-01Coal lb 1.84E+02 2.11E+00 1.15E-02Nuclear lb U238 1.77E-03 1.84E+00 1.04E+03Hydropower Btu 5.33E+05 5.33E-01 1.00E-06Other Btu 5.92E+04 5.92E-02 1.00E-06
Environmental Emissions Units TotalProcess and
TransportationElectrical
Energy
Atmospheric EmissionsAcreolin lb 5.43E-06 5.43E-06Ammonia lb 1.70E-03 1.70E-03Antimony lb 2.45E-06 2.45E-06Arsenic lb 1.19E-05 1.19E-05Benzene lb 6.19E-06 6.19E-06Beryllium lb 1.38E-06 1.38E-06Cadmium lb 1.73E-06 1.73E-06Carbon Dioxide-fossil lb 4.71E+03 4.33E+03 3.76E+02Carbon Dioxide-nonfossil lb 9.39E-01 9.39E-01Carbon Monoxide lb 3.58E+01 3.56E+01 1.58E-01Carbon Tetrachloride lb 9.16E-06 9.16E-06Chlorine lb 4.50E-06 4.50E-06
(continued)
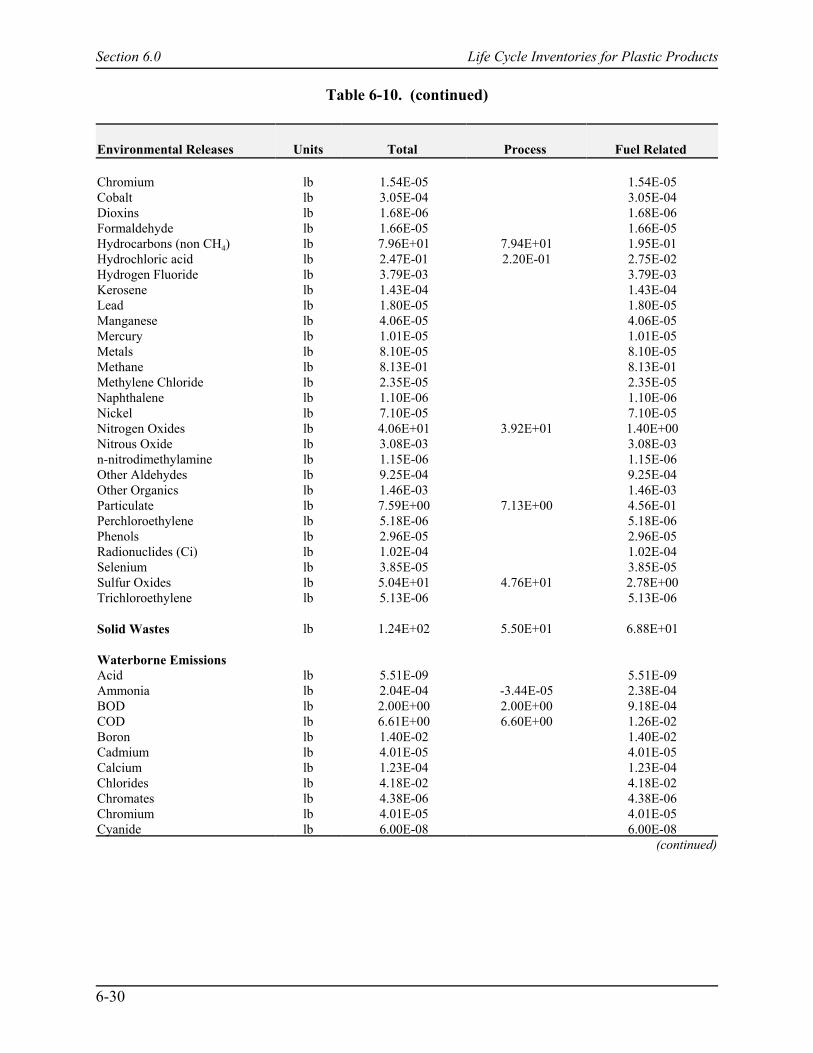
Table 6-10. (continued)
Section 6.0 Life Cycle Inventories for Plastic Products
6-30
Environmental Releases Units Total Process Fuel Related
Chromium lb 1.54E-05 1.54E-05Cobalt lb 3.05E-04 3.05E-04Dioxins lb 1.68E-06 1.68E-06Formaldehyde lb 1.66E-05 1.66E-05Hydrocarbons (non CH4) lb 7.96E+01 7.94E+01 1.95E-01Hydrochloric acid lb 2.47E-01 2.20E-01 2.75E-02Hydrogen Fluoride lb 3.79E-03 3.79E-03Kerosene lb 1.43E-04 1.43E-04Lead lb 1.80E-05 1.80E-05Manganese lb 4.06E-05 4.06E-05Mercury lb 1.01E-05 1.01E-05Metals lb 8.10E-05 8.10E-05Methane lb 8.13E-01 8.13E-01Methylene Chloride lb 2.35E-05 2.35E-05Naphthalene lb 1.10E-06 1.10E-06Nickel lb 7.10E-05 7.10E-05Nitrogen Oxides lb 4.06E+01 3.92E+01 1.40E+00Nitrous Oxide lb 3.08E-03 3.08E-03n-nitrodimethylamine lb 1.15E-06 1.15E-06Other Aldehydes lb 9.25E-04 9.25E-04Other Organics lb 1.46E-03 1.46E-03Particulate lb 7.59E+00 7.13E+00 4.56E-01Perchloroethylene lb 5.18E-06 5.18E-06Phenols lb 2.96E-05 2.96E-05Radionuclides (Ci) lb 1.02E-04 1.02E-04Selenium lb 3.85E-05 3.85E-05Sulfur Oxides lb 5.04E+01 4.76E+01 2.78E+00Trichloroethylene lb 5.13E-06 5.13E-06
Solid Wastes lb 1.24E+02 5.50E+01 6.88E+01
Waterborne EmissionsAcid lb 5.51E-09 5.51E-09Ammonia lb 2.04E-04 -3.44E-05 2.38E-04BOD lb 2.00E+00 2.00E+00 9.18E-04COD lb 6.61E+00 6.60E+00 1.26E-02Boron lb 1.40E-02 1.40E-02Cadmium lb 4.01E-05 4.01E-05Calcium lb 1.23E-04 1.23E-04Chlorides lb 4.18E-02 4.18E-02Chromates lb 4.38E-06 4.38E-06Chromium lb 4.01E-05 4.01E-05Cyanide lb 6.00E-08 6.00E-08
(continued)

Table 6-10. (continued)
Section 6.0 Life Cycle Inventories for Plastic Products
6-31
Environmental Releases Units Total Process Fuel Related
Dissolved Solids lb 1.80E+00 9.08E-01 8.87E-01Fluorides lb 5.68E-04 5.68E-04Iron lb 2.06E-02 2.06E-02Lead lb 9.71E-09 9.71E-09Manganese lb 1.18E-02 1.18E-02Mercury lb 3.15E-09 3.15E-09Metal Ion lb 1.16E-04 1.16E-04Nitrates lb 5.36E-05 5.36E-05Oil lb 5.22E-02 3.65E-02 1.57E-02Other Organics lb 5.22E-03 5.22E-03Phenol lb 3.81E-07 3.81E-07Phosphate lb 2.17E-02 2.00E-02 1.75E-03Sodium lb 2.26E-04 2.26E-04Sulfates lb 1.02E-01 1.02E-01Sulfuric Acid lb 3.36E-03 3.36E-03Suspended Solids lb 1.45E+00 1.20E+00 2.47E-01Zinc lb 1.39E-05 1.39E-05
Source: EIA, 1998; APME, 1995; Franklin Associates, 1998.
Table 6-11. Data Quality Summary for PET
Data Quality Indicator PET
Geographic Coverage Data represent 12 European plants producing approximately180,000 short tons of PET. European electrical emissions werereplaced with U.S. electricity- related emissions.
Time Period Coverage APME data refer to a time period between 1989 and 1991. EIAdata on the 1992 European grid were published in 1998. Franklindata on U.S. national grid electrical emissions were publishedin1998.
Technology Coverage Approximately 80% of the 180,000 short tons of PET is producedby the terephthalic acid (TPA) route and the remainder is producedfrom dimethyl terephthalate (DMA).
Precision APME noted a range in variability for gross energy of 57 – 84 Btuper short ton.
Consistency Information not available.
(continued)
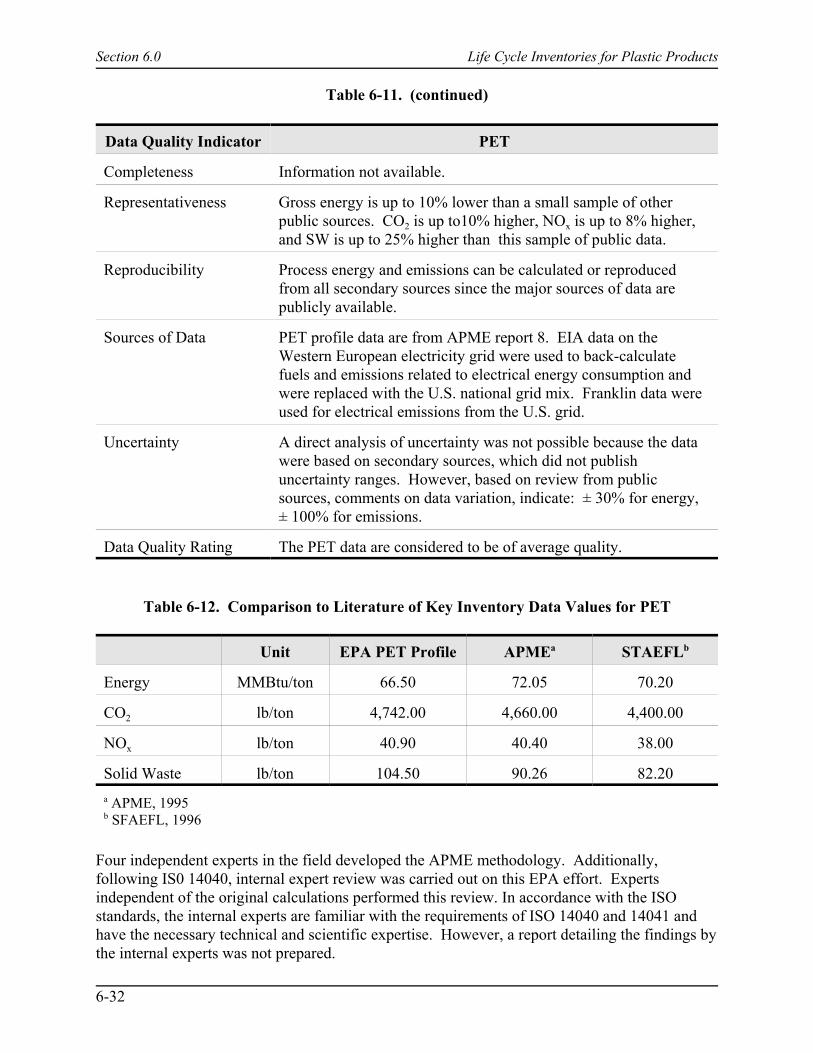
Table 6-11. (continued)
Section 6.0 Life Cycle Inventories for Plastic Products
Data Quality Indicator PET
6-32
Completeness Information not available.
Representativeness Gross energy is up to 10% lower than a small sample of otherpublic sources. CO2 is up to10% higher, NOx is up to 8% higher,and SW is up to 25% higher than this sample of public data.
Reproducibility Process energy and emissions can be calculated or reproducedfrom all secondary sources since the major sources of data arepublicly available.
Sources of Data PET profile data are from APME report 8. EIA data on theWestern European electricity grid were used to back-calculatefuels and emissions related to electrical energy consumption andwere replaced with the U.S. national grid mix. Franklin data wereused for electrical emissions from the U.S. grid.
Uncertainty A direct analysis of uncertainty was not possible because the datawere based on secondary sources, which did not publishuncertainty ranges. However, based on review from publicsources, comments on data variation, indicate: ± 30% for energy,± 100% for emissions.
Data Quality Rating The PET data are considered to be of average quality.
Table 6-12. Comparison to Literature of Key Inventory Data Values for PET
Unit EPA PET Profile APMEa STAEFLb
Energy MMBtu/ton 66.50 72.05 70.20
CO2 lb/ton 4,742.00 4,660.00 4,400.00
NOx lb/ton 40.90 40.40 38.00
Solid Waste lb/ton 104.50 90.26 82.20a APME, 1995b SFAEFL, 1996
Four independent experts in the field developed the APME methodology. Additionally,following IS0 14040, internal expert review was carried out on this EPA effort. Expertsindependent of the original calculations performed this review. In accordance with the ISOstandards, the internal experts are familiar with the requirements of ISO 14040 and 14041 andhave the necessary technical and scientific expertise. However, a report detailing the findings bythe internal experts was not prepared.
Section 6.0 Life Cycle Inventories for Plastic Products
6-33
The PET data are considered to be of average quality.
6.5 Secondary Plastics
6.5.1 Introduction
This section contains an LCI profile for the production of secondary plastic. Plasticsaccount for 9.4 percent of MSW generation by weight behind paper and paperboard, whichtogether accounted for 38.1 percent of the MSW for 1997 (U.S. EPA, 1998). The remainingMSW fractions include yard trimmings at 13.4 percent, food at 10.4 percent, and "other wastes"(e.g., rubber and leather, textiles, miscellaneous inorganic waste) at 9.9 percent. About 5 percentof LDPE from industrial waste is recycled in the U.S. (Beck, 1997a). The secondary plastic dataset models only the most commonly collected and recycled plastic waste: HDPE and PETbottles (Beck, 1997b). The processes for recycling PET and HDPE bottles and the LCI aresimilar; therefore, only one Secondary Plastics profile is provided for both polymers as part ofthis study.
The boundaries for this study depend on secondary plastic production data from a seriesof papers on packaging materials published in Europe. These inventory data for the recycling ofPET and HDPE were collected and published by SFAEFL, according to their agreedmethodology. Thus, the boundaries for the current material system includes the reprocessing ofPET bottles. The secondary data used in this study were part of a larger database developed bySFAEFL. To maintain consistency in calculations and presentation and confidentiality of data,the data were aggregated at the unit process level. With the addition of combustion andprecombustion energy, the data set used in this study represents an aggregated cradle-to-gateprocessing of 1 ton of secondary plastic flakes.
6.5.2 Secondary Plastics Production
Sorted plastic bottle bales are delivered from a MRF to a reprocessing facility. Thesorted plastics are passed across a shaker screen to remove small pieces of trash and dirt. Therecyclable plastics are then put through a grinding process where they are cut into small pieces. These pieces then are combined with water to soften and remove contaminants from the newlyformed plastic flakes. The flakes are then conveyed into a washing system where residualcontents, dirt, and labels are removed. Because different types of plastics have differentdensities, a flotation tank is used to separate the mixed plastics and contaminants. Heated air isused to dry the cleaned and separated flakes. Figure 6-5 shows a simplified process flowdiagram for processing secondary plastics.
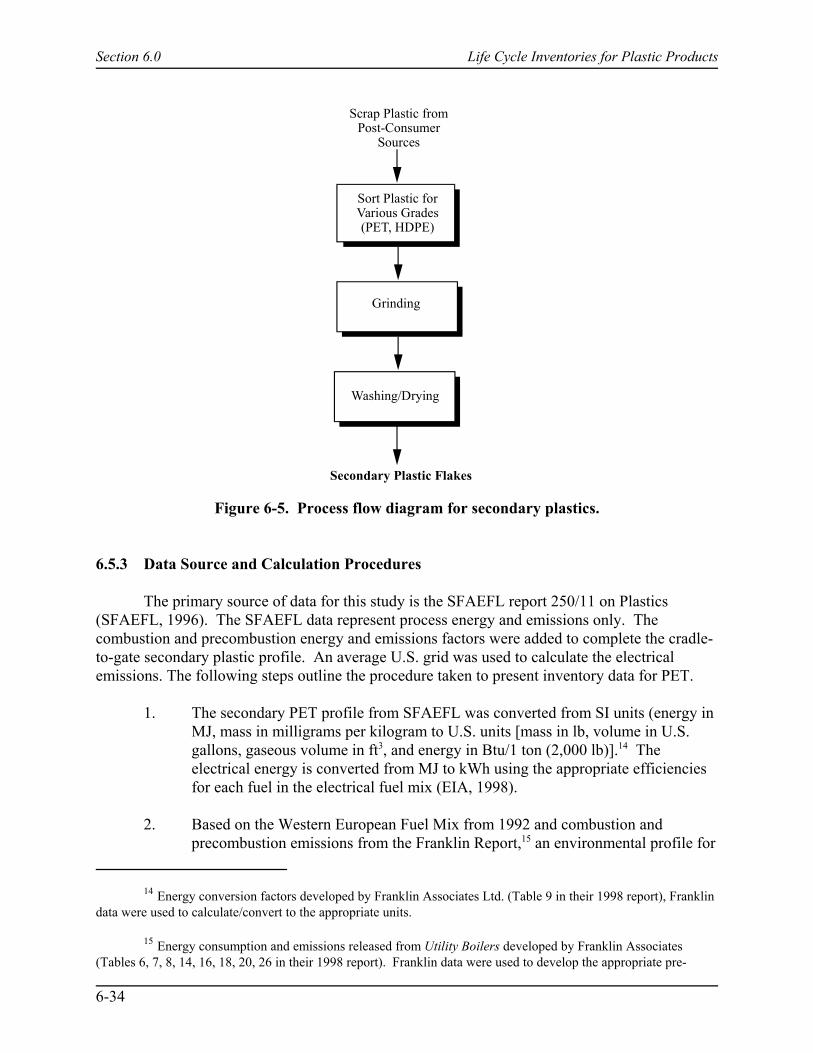
Section 6.0 Life Cycle Inventories for Plastic Products
14 Energy conversion factors developed by Franklin Associates Ltd. (Table 9 in their 1998 report), Franklindata were used to calculate/convert to the appropriate units.
15 Energy consumption and emissions released from Utility Boilers developed by Franklin Associates (Tables 6, 7, 8, 14, 16, 18, 20, 26 in their 1998 report). Franklin data were used to develop the appropriate pre-
6-34
Sort Plastic forVarious Grades(PET, HDPE)
Grinding
Washing/Drying
Secondary Plastic Flakes
Scrap Plastic fromPost-Consumer
Sources
Figure 6-5. Process flow diagram for secondary plastics.
6.5.3 Data Source and Calculation Procedures
The primary source of data for this study is the SFAEFL report 250/11 on Plastics(SFAEFL, 1996). The SFAEFL data represent process energy and emissions only. Thecombustion and precombustion energy and emissions factors were added to complete the cradle-to-gate secondary plastic profile. An average U.S. grid was used to calculate the electricalemissions. The following steps outline the procedure taken to present inventory data for PET.
1. The secondary PET profile from SFAEFL was converted from SI units (energy inMJ, mass in milligrams per kilogram to U.S. units [mass in lb, volume in U.S.gallons, gaseous volume in ft3, and energy in Btu/1 ton (2,000 lb)].14 Theelectrical energy is converted from MJ to kWh using the appropriate efficienciesfor each fuel in the electrical fuel mix (EIA, 1998).
2. Based on the Western European Fuel Mix from 1992 and combustion andprecombustion emissions from the Franklin Report,15 an environmental profile for
Section 6.0 Life Cycle Inventories for Plastic Products
combustion energies and environmental emissions for 1 kWh of European electric grid.
16 U.S. Electrical Energy and Emissions data developed by Franklin Associates (Tables 6, 7, 8, 14, 16, 18,20, 26 in their 1998 report). Franklin data were used to calculate the appropriate precombustion energies andenvironmental emissions for 1 kWh of U.S. electric grid.
17 U.S. Electrical Energy and Emissions developed by Franklin Associates Ltd. (Tables 6, 7, 8, 14, 16, 18,20, 26) were used to add the appropriate precombustion energies and environmental emissions for 1kWh of U.S.Electric Grid.
18 Precombustion Energy and Emissions for Natural Gas developed by Franklin Associates Ltd. (Table 11)was used to add the appropriate precombustion energies and environmental emissions.
6-35
producing and delivering 1 (kWh) of the Western European electrical grid16 wasdeveloped. A similar environmental profile for producing 1 kWh of the U.S.electrical grid was developed by Franklin (EIA, 1998; Franklin Associates, 1998).
3. The precombustion energy and environmental emissions (air emissions, wateremissions and solid waste emissions) from the European Electrical Fuel Mix werededucted using the profile developed in Step 2 for the appropriate kWh convertedin Step 1. For the same kWh, the precombustion energies and environmentalemissions for the U.S. electrical mix are added to the profile. The net electricalenergy for the process is the same; however, the precombustion energy quantitiesand environmental emissions are different because of the different fuel mix fromthe two electrical grids. Because the data published in the SFAEFL report werefor mechanical processing only, we have added the electrical17 and fuel (naturalgas18) precombustion energies and emissions. In addition we have assumed thatthe material inputs and solid wastes released are transported 70 miles on a single-unit diesel truck. Table 6-17 shows the breakdown of process-related andcombustion and precombustion related emissions for the secondary plasticsprofile. The combustion and precombustion related emissions are further brokendown into electrical, natural gas, and transport-related emissions.
6.5.4 LCI Results
Tables 6-13 summarizes the cradle-to-gate LCI data for Secondary Plastics. The tablebreaks down the individual fuels that make up precombustion energy related to material resourcefeedstock, process fuels, and electric energy fuels. Emissions to air and water include allemissions for processing, combustion (including electricity), transportation, and precombustionactivities.
6.5.5 Data Quality
Table 6-14 summarizes data quality information for Secondary Plastics production. Because secondary data were used in this study, precision, consistency, and completeness ofinformation is not available.
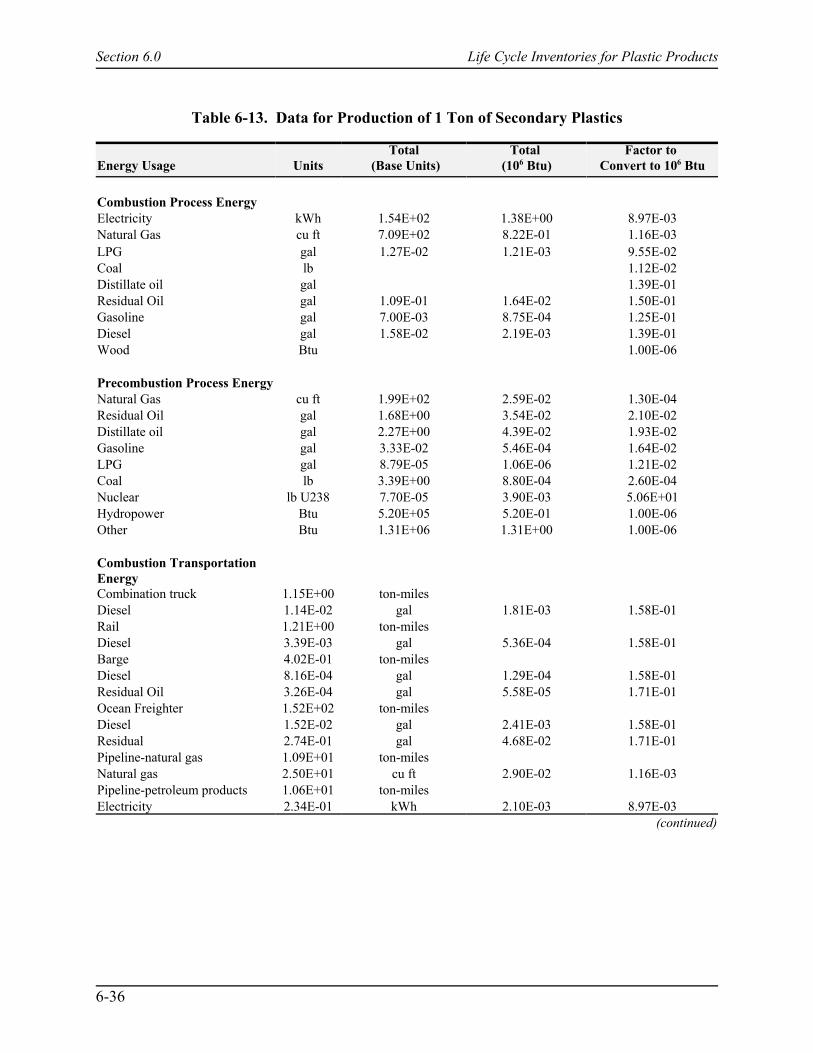
Section 6.0 Life Cycle Inventories for Plastic Products
6-36
Table 6-13. Data for Production of 1 Ton of Secondary Plastics
Energy Usage UnitsTotal
(Base Units)Total
(106 Btu)Factor to
Convert to 106 Btu
Combustion Process EnergyElectricity kWh 1.54E+02 1.38E+00 8.97E-03Natural Gas cu ft 7.09E+02 8.22E-01 1.16E-03LPG gal 1.27E-02 1.21E-03 9.55E-02Coal lb 1.12E-02Distillate oil gal 1.39E-01Residual Oil gal 1.09E-01 1.64E-02 1.50E-01Gasoline gal 7.00E-03 8.75E-04 1.25E-01Diesel gal 1.58E-02 2.19E-03 1.39E-01Wood Btu 1.00E-06
Precombustion Process EnergyNatural Gas cu ft 1.99E+02 2.59E-02 1.30E-04Residual Oil gal 1.68E+00 3.54E-02 2.10E-02Distillate oil gal 2.27E+00 4.39E-02 1.93E-02Gasoline gal 3.33E-02 5.46E-04 1.64E-02LPG gal 8.79E-05 1.06E-06 1.21E-02Coal lb 3.39E+00 8.80E-04 2.60E-04Nuclear lb U238 7.70E-05 3.90E-03 5.06E+01Hydropower Btu 5.20E+05 5.20E-01 1.00E-06Other Btu 1.31E+06 1.31E+00 1.00E-06
Combustion TransportationEnergyCombination truck 1.15E+00 ton-milesDiesel 1.14E-02 gal 1.81E-03 1.58E-01Rail 1.21E+00 ton-milesDiesel 3.39E-03 gal 5.36E-04 1.58E-01Barge 4.02E-01 ton-milesDiesel 8.16E-04 gal 1.29E-04 1.58E-01Residual Oil 3.26E-04 gal 5.58E-05 1.71E-01Ocean Freighter 1.52E+02 ton-milesDiesel 1.52E-02 gal 2.41E-03 1.58E-01Residual 2.74E-01 gal 4.68E-02 1.71E-01Pipeline-natural gas 1.09E+01 ton-milesNatural gas 2.50E+01 cu ft 2.90E-02 1.16E-03Pipeline-petroleum products 1.06E+01 ton-milesElectricity 2.34E-01 kWh 2.10E-03 8.97E-03
(continued)

Table 6.13. (continued)
Section 6.0 Life Cycle Inventories for Plastic Products
6-37
Environmental Emissions Units TotalProcess and
TransportationElectrical
Energy
Atmospheric EmissionsAcreolin lb 3.18E-06 3.18E-06Ammonia lb 3.30E-03 2.30E-03 9.97E-04Antimony lb 1.44E-06 1.44E-06Arsenic lb 7.00E-06 7.00E-06Benzene lb 3.63E-06 3.63E-06Beryllium lb 8.12E-07 8.12E-07Cadmium lb 1.02E-06 1.02E-06Carbon Dioxide-fossil lb 5.67E+02 3.47E+02 2.21E+02Carbon Dioxide-nonfossil lb 6.31E-01 8.04E-02 5.51E-01Carbon Monoxide lb 3.41E+00 3.32E+00 9.25E-02Carbon Tetrachloride lb 5.37E-06 5.37E-06Chlorine lb 2.64E-06 2.64E-06Chromium lb 9.02E-06 9.02E-06Cobalt lb 1.79E-04 1.79E-04Dioxins lb 9.85E-07 9.85E-07Formaldehyde lb 9.75E-06 9.75E-06Hydrocarbons (non CH4) lb 1.52E+00 1.41E+00 1.15E-01Hydrochloric Acid lb 1.64E-02 3.19E-04 1.61E-02Hydrogen Fluoride lb 2.22E-03 2.22E-03Kerosene lb 8.39E-05 8.39E-05Lead lb 1.24E-05 1.82E-06 1.06E-05Manganese lb 2.38E-05 2.38E-05Mercury lb 5.95E-06 5.95E-06Metals lb 4.75E-05 4.75E-05Methane lb 7.57E-01 2.80E-01 4.77E-01Methylene Chloride lb 1.38E-05 1.38E-05Naphthalene lb 6.44E-07 6.44E-07Nickel lb 4.17E-05 4.17E-05Nitrogen Oxides lb 4.44E+00 3.62E+00 8.24E-01Nitrous Oxide lb 1.81E-03 1.81E-03n-nitrodimethylamine lb 6.72E-07 6.72E-07Other Aldehydes lb 5.43E-04 5.43E-04Other Organics lb 8.54E-04 8.54E-04Particulate lb 9.99E-01 7.31E-01 2.68E-01Perchloroethylene lb 3.04E-06 3.04E-06Phenols lb 1.74E-05 1.74E-05Radionuclides (Ci) lb 5.96E-05 5.96E-05Selenium lb 2.26E-05 2.26E-05Sulfur Oxides lb 3.51E+00 1.88E+00 1.63E+00Trichloroethylene lb 3.01E-06 3.01E-06
(continued)
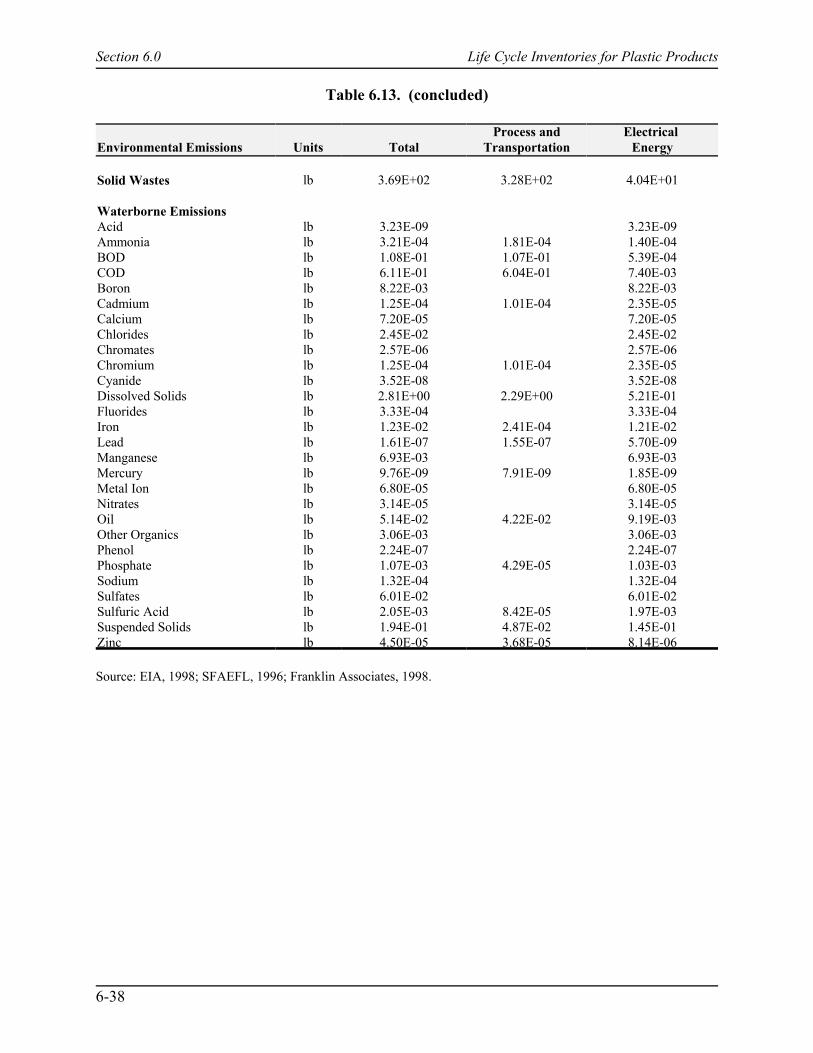
Table 6.13. (concluded)
Section 6.0 Life Cycle Inventories for Plastic Products
6-38
Environmental Emissions Units TotalProcess and
TransportationElectrical
Energy
Solid Wastes lb 3.69E+02 3.28E+02 4.04E+01
Waterborne EmissionsAcid lb 3.23E-09 3.23E-09Ammonia lb 3.21E-04 1.81E-04 1.40E-04BOD lb 1.08E-01 1.07E-01 5.39E-04COD lb 6.11E-01 6.04E-01 7.40E-03Boron lb 8.22E-03 8.22E-03Cadmium lb 1.25E-04 1.01E-04 2.35E-05Calcium lb 7.20E-05 7.20E-05Chlorides lb 2.45E-02 2.45E-02Chromates lb 2.57E-06 2.57E-06Chromium lb 1.25E-04 1.01E-04 2.35E-05Cyanide lb 3.52E-08 3.52E-08Dissolved Solids lb 2.81E+00 2.29E+00 5.21E-01Fluorides lb 3.33E-04 3.33E-04Iron lb 1.23E-02 2.41E-04 1.21E-02Lead lb 1.61E-07 1.55E-07 5.70E-09Manganese lb 6.93E-03 6.93E-03Mercury lb 9.76E-09 7.91E-09 1.85E-09Metal Ion lb 6.80E-05 6.80E-05Nitrates lb 3.14E-05 3.14E-05Oil lb 5.14E-02 4.22E-02 9.19E-03Other Organics lb 3.06E-03 3.06E-03Phenol lb 2.24E-07 2.24E-07Phosphate lb 1.07E-03 4.29E-05 1.03E-03Sodium lb 1.32E-04 1.32E-04Sulfates lb 6.01E-02 6.01E-02Sulfuric Acid lb 2.05E-03 8.42E-05 1.97E-03Suspended Solids lb 1.94E-01 4.87E-02 1.45E-01Zinc lb 4.50E-05 3.68E-05 8.14E-06
Source: EIA, 1998; SFAEFL, 1996; Franklin Associates, 1998.

Section 6.0 Life Cycle Inventories for Plastic Products
6-39
Table 6-14 Data Quality Summary for Secondary Plastics
Data Quality Indicator Secondary Plastic
Geographic Coverage The data represent collection and processing of plastic bottles inSwitzerland and Germany. http://www.snre.umich.edu./cemp/
Time Period Coverage The secondary data (process-related energy emissions) werecollected between 1989 and 1991 and published in 1997. EIA dataon the 1992 European grid were published in 1998. Franklin dataon U.S. national grid electrical emissions were published in1996.
Technology Coverage Process data represent mechanical processing of PET and HDPEbottles (postconsumer) only.
Precision Information not available.
Consistency Information not available.
Completeness Information not available.
Representativeness Gross energy is approximately 40% higher than one other publicdata source.
Reproducibility Process energy and emissions can be calculated or reproducedfrom all secondary sources since the major sources of data arepublicly available.
Sources of Data The secondary PET profile data are from the Swiss Eco-profiles ofPackaging Materials, published by SFAEFL. EIA data on theWestern European electricity grid were used to back-calculatefuels and emissions related to electrical energy consumption andwere replaced with the U.S. national grid mix. Franklin data wereused for electrical emissions from the U.S. grid.
Uncertainty Information on data uncertainty was not available since the datacollected in the secondary PET profile were compiled fromsecondary sources, which did not include an analysis ofuncertainty.
Data Quality Rating The secondary plastics data are considered to be of averagequality.
Table 6-15 shows how the data in the current study compare with data from one otherpublic source, and thus provides a measure of representativeness. Gross energy data (the simplesum of energy of material resource, combustion process energy, and precombustion energy) fromthe current work is 40 percent higher than that of the EPIC model (Canadian Plastics IndustryAssociation). Data from other inventory categories such as CO2 and NOx were not available tocompare for secondary PET (American Plastics Council, 1999a, b).
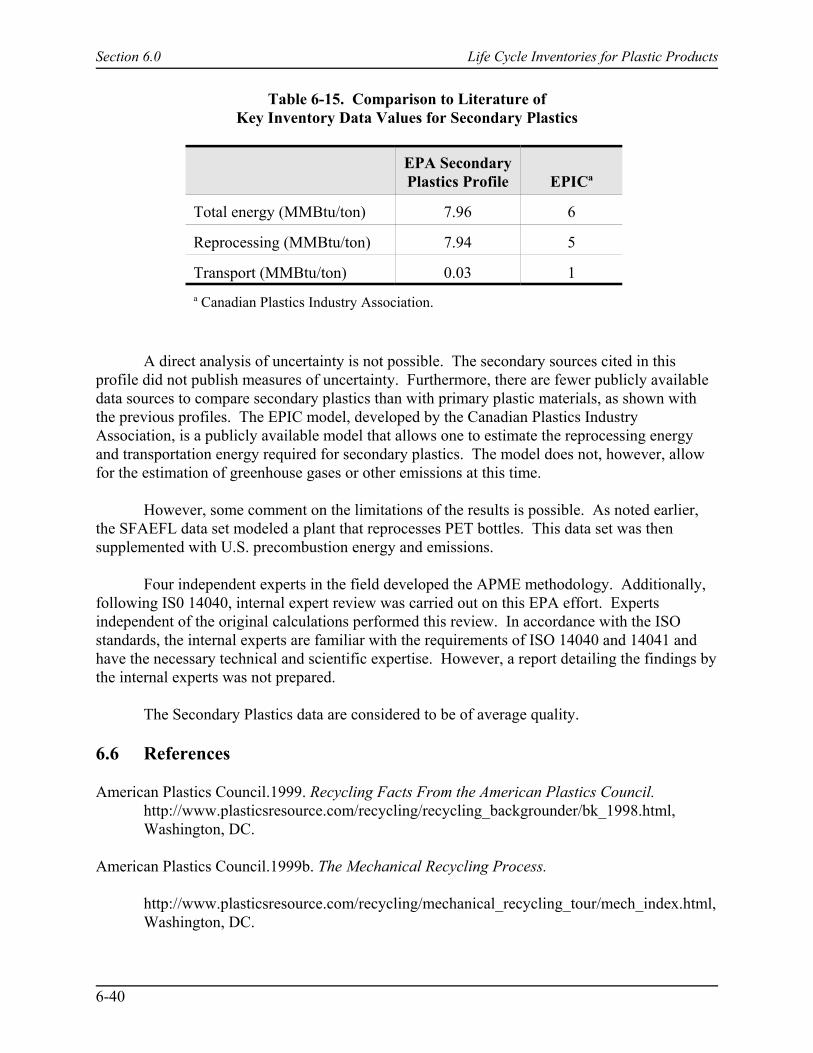
Section 6.0 Life Cycle Inventories for Plastic Products
6-40
Table 6-15. Comparison to Literature ofKey Inventory Data Values for Secondary Plastics
EPA SecondaryPlastics Profile EPICa
Total energy (MMBtu/ton) 7.96 6
Reprocessing (MMBtu/ton) 7.94 5
Transport (MMBtu/ton) 0.03 1a Canadian Plastics Industry Association.
A direct analysis of uncertainty is not possible. The secondary sources cited in thisprofile did not publish measures of uncertainty. Furthermore, there are fewer publicly availabledata sources to compare secondary plastics than with primary plastic materials, as shown withthe previous profiles. The EPIC model, developed by the Canadian Plastics IndustryAssociation, is a publicly available model that allows one to estimate the reprocessing energyand transportation energy required for secondary plastics. The model does not, however, allowfor the estimation of greenhouse gases or other emissions at this time.
However, some comment on the limitations of the results is possible. As noted earlier,the SFAEFL data set modeled a plant that reprocesses PET bottles. This data set was thensupplemented with U.S. precombustion energy and emissions.
Four independent experts in the field developed the APME methodology. Additionally,following IS0 14040, internal expert review was carried out on this EPA effort. Expertsindependent of the original calculations performed this review. In accordance with the ISOstandards, the internal experts are familiar with the requirements of ISO 14040 and 14041 andhave the necessary technical and scientific expertise. However, a report detailing the findings bythe internal experts was not prepared.
The Secondary Plastics data are considered to be of average quality.
6.6 References
American Plastics Council.1999. Recycling Facts From the American Plastics Council.http://www.plasticsresource.com/recycling/recycling_backgrounder/bk_1998.html,Washington, DC.
American Plastics Council.1999b. The Mechanical Recycling Process.
http://www.plasticsresource.com/recycling/mechanical_recycling_tour/mech_index.html,Washington, DC.

Section 6.0 Life Cycle Inventories for Plastic Products
6-41
Association of Plastics Manufacturers of Europe (APME). 1993. I. Boustead, Eco-profiles ofthe European Plastics Industry; Report 3: Polyethylene and Polypropylene. Associationof Plastic Manufacturers in Europe. Brussels, Belgium.
Association of Plastics Manufacturers of Europe (APME). 1992. I. Boustead, Eco-balanceMethodology for Commodity Thermoplastics. Brussels, Belgium.
Association of Plastics Manufacturers of Europe (APME). 1995. I. Boustead, Eco-profiles ofthe European plastics industry; Report 8: Polyethylene Terephthalate (PET). Brussels,Belgium.
Association of Plastics Manufacturers of Europe (APME). 1997. I. Boustead, Eco-profiles ofthe European Plastics Industry, Report 10: Polymer Conversion. Brussels, Belgium.
Beck, R.W. 1997a. National Post-Consumer Recycling Rate Study. R.W. Beck. Orlando, FL.
Beck, R.W. 1997b. National Post-Consumer Plastics Community Collection Study. R.W. Beck. Orlando, FL.
Beggs, H. Dale. 1984. Gas Production Operations. Oil & Gas Consultants International. Tulsa,OK.
Berger, B. D., and K. E. Anderson. 1992. Modern Petroleum: A Basic Primer of the Industry.3rd ed. Pennwell, Tulsa, OK.
Elvers, B., S. Hawkins, and G. Shulz (Eds.). 1991. Ullmann's Encyclopedia of IndustrialChemistry. 5th Edition. Verlagsgesellschatt, Germany.
Energy Information Administration (EIA). 1998. International Net Electricity Generation Data. http://www.eia.doe.gov/emeu/international/electric.html#Production. Department ofEnergy, Washington, DC.
Franklin Associates, Ltd. 1998. Energy Requirements and Environmental Emissions for FuelConsumption. Prairie Village, KS.
Gary, J. H., and G.E. Handwork. 1994. Petroleum Refining: Technology and Economics. 3rd ed.Marcel Dekker. Monticello, NY.
Hobson, G.D. (Ed.). 1984. Modern Petroleum Technology. 5th ed., 2 vol. Wiley. New York,NY.
International Organization for Standardization (ISO). 1997. Environmental Management – LifeCycle Assessment – Principles and Framework. ISO 14040. Geneva, Switzerland.
International Organization for Standardization (ISO). 1998. Environmental Management – LifeCycle Assessment – Goal and Scope Definition and Inventory Analysis, ISO 14041.Geneva, Switzerland.

Section 6.0 Life Cycle Inventories for Plastic Products
6-42
Kent, J.A. (Ed.). 1974. Riegel's Handbook of Industrial Chemistry. 7th Edition. Van NostrandReinhold, New York, NY.
McKetta, J.J. (Ed.). 1992. Chemical Processing Handbook. Marcel Dekker, Monticello, NY.
Meyers, R.A. (Ed.). 1986. Handbook of Petroleum Refining Processes. McGraw-Hill, NewYork, NY.
Swiss Federal Agency for the Environment, Forests and Landscape (SFAEFL). 1996. LifeCycle Inventories for Packaging. Environmental Series No. 250/11, Waste. SwissAgency for the Environment, Forests and Landscape. Bern, Switzerland.
Smith, W. 1990. Principles of Materials Science and Engineering. 2nd ed. McGraw-Hill, NewYork, NY.
Standen, A. (Ed.). 1968. Kirk – Othmer Encyclopedia of Chemical Technology, 2nd Edition. Interscience Publishers. New York, NY.
U.S. Environmental Protection Agency (EPA). 1998. Characterization of Municipal SolidWaste in the United States: 1997 Update. EPA-530/R-98-007. May. Office of SolidWaste and Emergency Response. Washington, DC.
Young, S.B. 1996. Assessment of Environmental Life Cycle Approach for Industrial Materialsand Products. Ph.D thesis. University of Toronto, Canada.

Section 7.0 Summary LCI for Steel Products
1 AISI Report "Life Cycle Inventory of Steel" has been reformatted to suit EPA format for units andpresentation.
7-1
7.0 Summary LCI of Steel Products1
7.1 Introduction
This chapter presents cradle-to-gate LCI profiles for two steel materials: primary hotrolled coil produced using the basic oxygen furnace (BOF) steel-making technology (Section7.2) and secondary steel bars produced using the electric arc furnace (EAF) steel-makingtechnology (Section 7.3). The data were collected by the American Iron and Steel Institute(AISI) and are intended for use in the MSW-DST (AISI, 1999). The intended audience for thesteel data includes steel customers, consumers of steel and recycled steel, steel recyclers, andsteel researchers. The LCI results include inputs and outputs from raw materials extractionthrough production of the final product but do not include the use or disposal portions of atraditional LCI.
The product system function is defined as the production of steel materials at the factorygate. The steel materials are later used in the manufacture of many types of goods, such asautomobiles, food and beverage packaging, bridges, and housing, though these uses of steel arebeyond the scope of this work. The functional unit, the unit by which the product inputs andoutputs are referenced, is 1 ton (2,000 lb) of steel (BOF and EAF) product.
All material and water consumption, as well as environmental emissions, are presentedas mass in pounds (lb), volume in U.S. gallons (gal), gaseous volume in cubic feet (ft3), andenergy in British thermal units (Btu).
The model uses combustion and precombustion fuel and electrical energy-relatedenvironmental releases developed by AISI (and their consultants) for the U.S. AutomotiveMaterial Partnership (USAMP) (AISI, 1999). AISI was not able to split out their fuel andelectrical energy information from their steel profiles and thus we were not able to apply ourcommon fuel and electrical energy model as was done for the other materials. A review of theAISI fuel and electrical energy data revealed no significant differences from our overall fuel andelectrical energy model used for the other materials.
This chapter describes the function of each product system, the product systemboundaries, allocation procedures, type of impact assessment employed, data requirements,assumptions, limitations, data quality, critical review, and the study report.

Section 7.0 Summary LCI for Steel Products
7-2
Figure 7-1. Simplified process flow diagram for BOF steel.
7.2 Primary Steel Production (BOF Technology)
7.2.1 Introduction
This section contains an LCI profile for primary hot rolled coil produced using BOFsteel-making technology (AISI, 1999). It contains process flow diagrams and descriptions forproduction processes, LCI data tables for 1 ton of product, and a discussion of allocation anddata quality.
The LCI data for this profile were collected by AISI (1999) and models BOF steel (hotrolled steel) product from cradle-to-gate. The boundaries for the BOF steel data in this profileinclude all unit processes from acquisition of raw materials through production of the steel. Primary data were collected for the following unit processes: iron ore mining, limestonequarrying, coke production, iron production, BOF steel production, and hot rolling. Figure 7-1shows a simplified process flow diagram for processing BOF steel. As indicated in Figure 7-1,data for coal mining were obtained from secondary sources.
The following sections briefly describe the unit processes for mining and productionactivities associated with the production of steel.
7.2.2 Iron Ore Mining (Elvers et al., 1991; Honeycombe, 1981)
Most iron ores are extracted by surface mining techniques. Although some undergroundmines exist, surface mining is preferred by industry because there are abundant sources insurface mines and they are more economical to operate.

Section 7.0 Summary LCI for Steel Products
7-3
7.2.3 Limestone Quarrying
Limestone is quarried primarily from open pits. In the central and eastern United States,underground mining is becoming more common (Bureau of Mines, 1993). The most economicalmethod of recovering the limestone has been through drilling, blasting, mechanical crushing,conveying, and screening (Bureau of Mines, 1993 and 1984). Airborne particulates aregenerated in the form of limestone dust throughout many of the operations. The limestonequarrying information used for the primary hot-rolled steel LCI is based upon one site in theUnited Kingdom. No further information about the recovery method used at this site wasavailable.
7.2.4 Coke Production
Petroleum coking is an extreme form of thermal cracking that uses high temperatures anda long residence time to break down heavy crude residues to get lighter liquids (Kent, 1992). Coke production involves the reduction of coal in a series of ovens in the absence of oxygen. After a typical coking time of 12 to 20 hours, most of the volatile matter is driven from the cruderesidue and the coke is formed. The desired outputs of the coking process are actually thevolatile products. The petroleum coke itself is considered a byproduct. The coke is collected ina coke drum, while the lighter products go overhead as vapors. Volatiles are captured forrecovery of by-products.
7.2.5 Iron Production (Elvers et al., 1991)
Iron production involves the production of hot (iron) metal by removing oxygen from theiron ore. Almost all iron production in North America uses blast furnace technology, and it isthis technology which is reflected in the steel data presented in this LCI profile. The blastfurnace is a countercurrent heat and oxygen exchanger in which rising combustion gasesexchange heat with descending iron oxides, which begins to convert to metallic iron at 1300°F.
7.2.6 BOF Steel Production (Lankford et al., 1985; Pehlke et al., 1974-77)
More than half the world's steel is produced in BOF, which uses pure oxygen to convert acharge of liquid blast-furnace iron and scrap into steel. The BOF is a refractory-lined, tiltableconverter into which a vertically movable, water-cooled lance is inserted to blow oxygen throughnozzles at supersonic velocity onto the charge. The use of pure oxygen at high flow rates resultsin fast oxidation of the elements contained in blast-furnace iron.
When oxygen contacts blast-furnace iron, a great amount of heat is released by theensuing exothermic reactions, particularly the oxidation of silicon to silica, that, using onlyblast-furnace iron, would result in a liquid steel temperature too high for casting. Therefore,before the hot metal is added, a specific amount of scrap is charged into the furnace. Melting thisscrap consumes approximately 340 kilocalories per kilogram, effectively cooling the process. Atypical BOF charge, therefore, consists of about 75 percent liquid iron and 25 percent scrap. Thisrequires a reliable supply of low-cost iron with a uniform chemical composition, which isattainable only by keeping the operating condition of the blast furnace as constant as possible;

Section 7.0 Summary LCI for Steel Products
7-4
this, in turn, requires a consistent iron consumer. There are also certain iron properties (e.g., forexample, the silicon and sulfur content) that are selected to optimize the blast furnace and BOFoperations and to produce steel at minimal cost. Such interdependence requires that blastfurnaces and BOF facilities work within a well integrated operating system.
7.2.7 Hot Rolling (Lankford et al., 1985; Ginzburg, 1989)
Rolling is the most widely used method of shaping metals and is particularly important inthe manufacture of steel for use in construction and other industries. Rolling may be done whilethe steel is hot (hot-rolling) or cold (cold-rolling). The process consists of passing the metalbetween pairs of rollers revolving at the same speed but in opposite directions and spaced so thatthe distance between them is slightly less than the thickness of the metal. The degree of changethat can be made in the thickness of the steel depends on its temperature, with higher heatincreasing the plasticity of the steel. The data included in the LCI profile reflect hot-rollingonly.
7.2.8 Data Source and Calculation Procedures
Data were acquired from a combination of primary and secondary sources. Four NorthAmerican steel companies provided primary data for the production of hot-rolled coil, while datawere obtained from three sites for cold-rolled steel and hot dip galvanized steel. Two NorthAmerican sites and one European site provided primary data for bar steel. Additional primarycoke production data were obtained from 21 sites in Europe and Japan and used, along with thetwo North American sites, to calculate a global average value. This average value was used intwo cases where data were not available from two North American BOF steel producers. Furtherprimary data were collected for some upstream processes, such as iron ore mining and limeproduction. Secondary data were obtained from LCI databases and literature.
Sources of primary and secondary data include
# primary data from participating steel and mining companies# BOF steelmaking: 2 in Canada, 2 in the United States# coke production: 2 in Canada, 21 in Europe and Japan# iron ore mining: 1 in Minnesota, 1 in Sweden# limestone quarrying: 1 in the United Kingdom# secondary data from Ecobalance database and literature source (AISI, 1999)
Table 7-1 summarizes the sources of secondary data and its quality.
The BOF (hot rolled steel) profile from AISI was converted from SI units (energy in MJ,mass in grams) per kilogram to U.S. units (mass in pounds [lb], volume in U.S. gallons [gal],gaseous volume in cubic feet [ft3], and energy in British thermal units (Btu) per 1 ton [2,000 lb]of steel). Energy consumed was followed back to elementary flows from the earth and presentedas materials inflows (e.g., coal, natural gas, oil) in the AISI profile. In the summary results,energy breakdowns for total process energy and transport energy are presented.

Section 7.0 Summary LCI for Steel Products
7-5
Table 7-1. Secondary Data Sources and Their Description
Material Source Data Quality
Aluminum (Al) Swiss Federal Office of Environment,Forests, and Landscape (FOEFL orSFAEFL) Environment Series No. 132.Bern. February 1991.
Model based on aluminum slab production,25% aluminum scrap and 75% primaryaluminum.
Cast iron Confidential source Technology: Primary data from an ironcasting plant supplying parts to the NorthAmerican automotive industry. Averagedwith North American secondary data oniron casting to preserve confidentiality. Temporal: Primary data collected for theyear 1995. Secondary data are unknown.Geographical: North American data.
Chromium (Cr) Swiss Federal Institute of Technology(ETH), Zurich, Ecoprofiles for EnergySystems, 1996. Page 58
Technology: Production of 1 kg chromiumincluding mining, concentration, andreduction by electrolysis. Transport is notincluded. 99% in mass of ETH sources aretaken into account. Chromium “ore” isreported as pure chromium; therefore, 1 kgof “ore” is used to produce 1 kg of material.Temporal: 1995Geographical: Average of European sites.
Coal SFAEFL 132 (1991) A11 Adapted by Ecobilan. Adaptation coversCO2 emissions added for what SFAEFLcalls precombustion for fuels productionmodels; cross loop treatment for fuelsproduction models; recalculation fromprocess data when provided in SFAEFL;waste changed to 0.05 kg/kg representinggreater dominance of open-pit mining.
Copper (Cu) Swiss Federal Institute of Technology(ETH), Zurich, Ecoprofiles for Energy Systems, 1996. Page 60-69
Technology: Production of 1 kg Cu (ingot)with 60% primary copper + 40% secondarycopper. Inputs of copper ore are 1 kg (for 1kg Cu produced) because all flows arecalculated up to the cradle (or gate) in ETHdata (including Cu ore present in thesecondary material). Also, Cu “ore” isreported as pure copper; therefore, 1 kg of“ore” is used to produce 1 kg of material.Transport is included for secondary copper(200 km rail, 100 km truck). 99% in massof ETH sources are taken into account.Temporal: 1995Geographical: Average of European sites.
(continued)

Table 7-1. (concluded)
Section 7.0 Summary LCI for Steel Products
Material Source Data Quality
7-6
Dolomite(CaCO3.MgCO3)
Swiss Federal Office of Environment,Forests, and Landscape (FOEFL orSFAEFL) Environment Series No. 132.Bern. February 1991.
Particulate emissions changed from 72 g/kgof dolomite to 0.11 g/kg due to primarydata from one European limestone quarry.
Ferrite (Fe) Confidential source. Technology: Production of ferrite. Only85% of inputs are accounted for. Site datahave been aggregated with upstreamprocesses to ensure confidentialityTemporal: Data collected in 1992Geographical: European data
Lead (Pb) Swiss Federal Institute ofTechnology (ETH), Zurich,Ecoprofiles for EnergySystems, 1996.Page 91
Technology: Production of lead includingmining. Lead “ore” is reported as pure lead;therefore, 1 kg of “ore” is used to produce 1kg of material.Temporal: 1995Geographical: Average of European sites
Tin (Sn) 1) Metal resources and energy, Chapman,London 1983.
2) Metals and Minerals Yearbook, sectionMinerals 1989.
Technology: Production of 1 kg of tin. Bothmining and recycling are taken intoaccount. Tin “ore” is reported as pure tin;therefore, 1 kg of “ore” is used to produce 1kg of material.Temporal: 1989Geographical: Worldwide tin productionImportant producers are: Brazil (23%),Malaysia (14%), Indonesia (14%), andChina (12%)
Zinc (Zn) Swiss Federal Institute of Technology(ETH), Zurich, Ecoprofiles for EnergySystems, 1996. Page 107-108.
Technology: Mining, concentration, andrefining. Transport included for 1 ton/kmrail and 36 ton/km sea (per kg of Zn). Zincore is reported as pure zinc; therefore, 1 kgof ore is used to produce 1 kg of material.99% in mass of ETH sources are taken intoaccount.Temporal: 1995Geographical average of several Europeansites
Source: AISI, 1999

Section 7.0 Summary LCI for Steel Products
7-7
7.2.9 Allocation Procedures
The steel LCI study includes consideration of several approaches to co-productallocation. Steel materials can be modeled by allocating inputs and outputs based on a mass,energy, or economics basis. Two other options are available, these being no allocation andavoiding allocation by using system expansion. The last option is not allocation, but is includedhere for convenience. AISI decided to pursue multiple approaches to co-product allocationbecause it is an issue of some debate and flexibility was a part of the study goals. For the datareported here, AISI used allocation for five co-products. Four co-products are generated in thecoke production unit process—coal tar, ammonia, ammonium sulfate, and light oil. Theseco-products were allocated on the basis of mass. One co-product is generated in the ironproduction unit process: blast furnace slag. This co-product was allocated based on economicvalue. Within the system boundary, allocation was based on a physical parameter or, if moreappropriate, economic value. An example of a physical allocation is water flow into a commonwastewater treatment plant that has multiple inputs. The inputs and outputs of the wastewatertreatment plant were allocated to a product based on the water flow from the unit processassociated with the product. The only exception to allocation based on a physical parameter waseconomic allocation used for blast furnace gas. The blast furnace gas was allocated at the ironproduction unit process within the product system boundary.
7.2.10 LCI Results
Table 7-2 summarizes the cradle-to-gate LCI data for primary (BOF) steel (hot-rolledsteel) production. Energy consumed was followed back to elementary flows from the earth andpresented as materials inflows (e.g., coal, natural gas, oil) in the AISI profile. In the summaryresults, energy reminders for total process energy and transport energy are presented. Emissionsto air and water include all emissions for processing, combustion (including electricity),transportation, and pre-combustion activities.
7.2.11 Data Quality
The Canadian and American steel data were derived from a world-wide LCI studycommissioned by the International Iron and Steel Institute.
The data collected by AISI follow standard LCI methodology as outlined in ISO 14040and ISO 14041. Each profile includes a discussion of data quality. Because the data profileswere compiled from secondary sources, many of the data quality indicators reflected thissecondary source of data. Table 7-3 summarizes the data quality assessment provided in eachsteel profile (adapted from AISI, 1999). Table 7-4 summarizes the domain and geographicalcoverage for steel production. Every attempt was made to collect high-quality primary data. Where primary data were not available, secondary or surrogate data were employed. For eachprocess, information on the source, nature, and quality of the data was reported by therespondent. In addition to the data quality aspects of geographic coverage, temporal coverage,technology coverage, and data sources, data quality was reported using five data qualityindicators (DQIs)—precision, consistency, completeness, representativeness, andreproducibility. Assessments for these DQIs are summarized below.
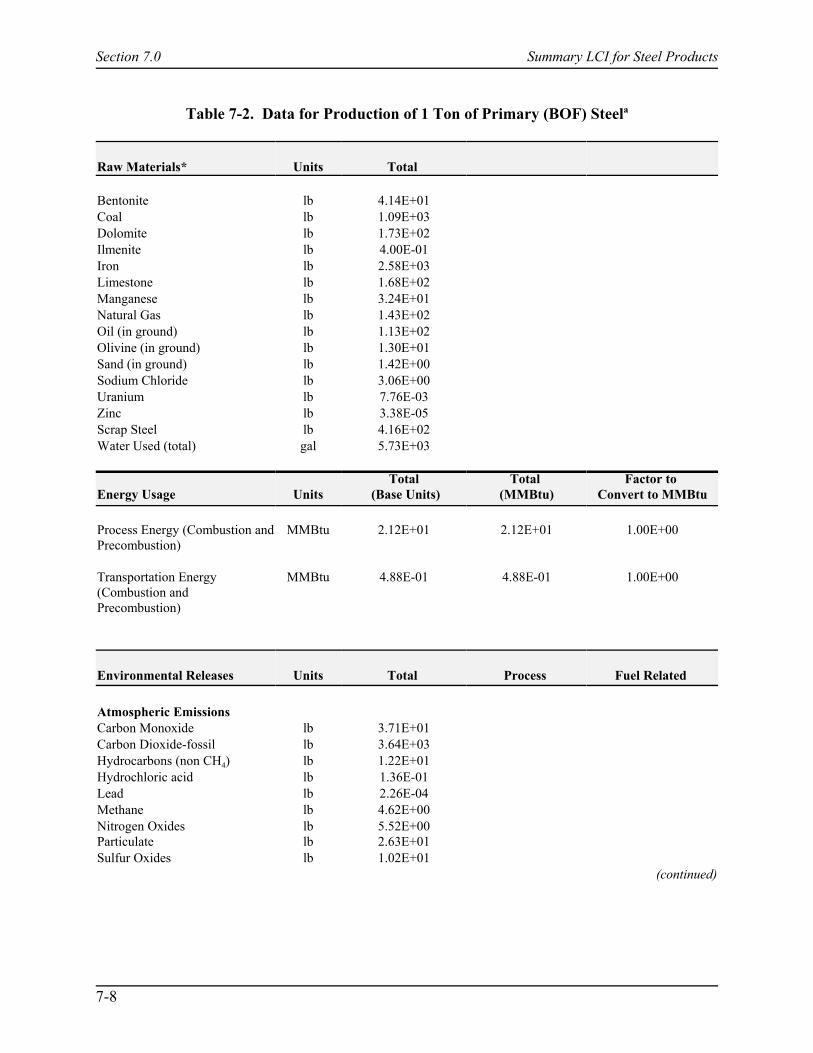
Section 7.0 Summary LCI for Steel Products
7-8
Table 7-2. Data for Production of 1 Ton of Primary (BOF) Steela
Raw Materials* Units Total
Bentonite lb 4.14E+01Coal lb 1.09E+03Dolomite lb 1.73E+02Ilmenite lb 4.00E-01Iron lb 2.58E+03Limestone lb 1.68E+02Manganese lb 3.24E+01Natural Gas lb 1.43E+02Oil (in ground) lb 1.13E+02Olivine (in ground) lb 1.30E+01Sand (in ground) lb 1.42E+00Sodium Chloride lb 3.06E+00Uranium lb 7.76E-03Zinc lb 3.38E-05Scrap Steel lb 4.16E+02Water Used (total) gal 5.73E+03
Energy Usage UnitsTotal
(Base Units)Total
(MMBtu)Factor to
Convert to MMBtu
Process Energy (Combustion andPrecombustion)
MMBtu 2.12E+01 2.12E+01 1.00E+00
Transportation Energy(Combustion andPrecombustion)
MMBtu 4.88E-01 4.88E-01 1.00E+00
Environmental Releases Units Total Process Fuel Related
Atmospheric EmissionsCarbon Monoxide lb 3.71E+01Carbon Dioxide-fossil lb 3.64E+03Hydrocarbons (non CH4) lb 1.22E+01Hydrochloric acid lb 1.36E-01Lead lb 2.26E-04Methane lb 4.62E+00Nitrogen Oxides lb 5.52E+00Particulate lb 2.63E+01Sulfur Oxides lb 1.02E+01
(continued)

Table 7-2. (concluded)
Section 7.0 Summary LCI for Steel Products
7-9
Environmental Emissions Units TotalProcess and
TransportationElectrical
Energy
Solid WastesUnspecified lb 8.70E+02
Waterborne EmissionsAmmonia lb 1.23E-01Dissolved Solids lb 1.73E+00Oil lb 2.10E-02Phosphate lb 1.26E-03Suspended Solids lb 6.54E-01
*Data for raw materials are not included for other materials and are not included in the decision support tool. AISIrequested that these data to be presented.** Further disaggregation of the data was not possible with the data provided by AISI.
Source: AISI (1999)

Section 7.0 Summary LCI for Steel Products
7-10
Table 7-3. Data Quality Summary for Steel Profiles
Data Quality Indicator Basic Oxygen Furnace (BOF) Electric Arc Furnace (EAF)Geographic coverage # Steel production and its
associated supply chain inCanada (provinces of Ontarioand Quebec) and the U.S.(Maryland, Ohio, andPennsylvania).
# Iron ore mining data werecollected from a site inMinnesota, which wereaugmented with primary datafrom an iron ore mining site inSweden.
# Primary data for limestonequarrying were based on a site inthe United Kingdom.
# The global coke production dataare averages of 23 coke plantslocated in Europe, Japan, andCanada, representing productionin 1994/95. For two instanceswhere company-specific cokeproduction data were notavailable, global coke productiondata collected by theInternational Iron and SteelInstitute (IISI) were used.
# The data cover:
- One limestone quarry located inthe United Kingdom
- Three EAF steel production siteslocated in North America andEurope
- Three bar production siteslocated in North America andEurope
Time Period Coverage # Primary data used for steel production are based on annual production ineither 1994 or 1995.
# Secondary data are based on sources from no later than 1990, thoughconstituent data within the secondary sources may be older than 1990.
(continued)

Table 7-3. (continued)
Section 7.0 Summary LCI for Steel Products
Data Quality Indicator Basic Oxygen Furnace (BOF) Electric Arc Furnace (EAF)
7-11
Technology Coverage # This LCI covers BOF steel-making technology that produceshot rolled coil.
# BOF steel-making combinesmolten iron source from a blastfurnace, recycled steel,limestone, and alloying additives.Oxygen is injected into the steel-making vessel to remove carbonfrom the molten iron.
# BOF data cover continuouscasting technology.
# This LCI covers EAF steel-making technology that producesbar
# EAF uses electricity to meltrecycled steel for the casting ofnew materials.
# Two technologies for the castingof steel are included in the LCI:continuous casting and ingotcasting. Virtually all of the steelproducers in North America usecontinuous casting technology,only one facility uses ingotcasting.
Precision # For each unit process where primary data were collected, the mean,minimum, maximum, and standard deviation values were calculated foreach data category (included in AISI report).
# Secondary data used in the study generally consisted of a single value.Consistency # Consistent application of the LCI methodology.
# Experts from steel companies around the world worked with the projectconsultant to produce process flow diagrams with commonnomenclature.
# The data collection procedure ensured verification and validity checkingof data points.
# The project consultant again checked the data entered into the LCImodeling software.
# In addition to this, industry experts reviewed the model results to checkfor inconsistencies.
Completeness The steel LCI completeness for each data category was derived from thequestionnaires submitted by each participating site to AISI. Where a sitesubmitted a questionnaire that contained a missing value for a data category,the procedures defined in the U.S. Automotive Material Partnership reportfor the treatment of missing data were employed. On a unit process level,each of the sites that agreed to contribute to the sample domain reporteddata.
(continued)

Table 7-3. (concluded)
Section 7.0 Summary LCI for Steel Products
Data Quality Indicator Basic Oxygen Furnace (BOF) Electric Arc Furnace (EAF)
7-12
Representativeness # The data in this profile are arepresentative sample of NorthAmerican steel production
# Comparing this data profile toglobal data collected by IISI forhot rolled steel product producedusing BOF steel-makingtechnology, for each steelproduct the difference betweenthe North American and globaldata sets is less than 10% foreach of the key indicative datacategories.
# The data in this profile are arepresentative sample of NorthAmerican steel production.
# North American average forrecycled steel consumption iswithin 3.8% of the globalaverage found in theinternational steel study
# For the global steel study, from which the North American average wasderived, about 60% of the primary data values were measured, 25%were calculated, and about 15% were estimated.
Reproducibility # Since the major sources of data for this profile were aggregated prior topresentation in the AISI report, the original data are not available. Results may be approximated based on the LCI profile and themethodology discussed.
Sources of Data # AISI (1999)Uncertainty # The results of this study and its methodology were peer-reviewed as part
of the U.S. Automotive Material Partnership project by an independentgroup of experts in the field.
# Following ISO 14040, an internal expert review was carried out on thisEPA effort. Experts independent of the original calculations performedthis review.
Data Quality Rating The primary hot rolled steel data are considered to be of excellent quality.

Section 7.0 Summary LCI for Steel Products
7-13
Table 7-4. Domain and Geographical Coverage for Steel Production
Steel Technology Unit Process Geographical Region Sites
BOF Steel Production Iron ore pellet production North America, Sweden 2
Limestone Quarrying United Kingdom 1
Coke Production North America (Global Avg.) 2 (23a)
Iron Production North America 4
BOF Steel Production North America 4
Hot Rolling North America 4
Total 17(40a)a Number of sites in world-wide average for coke production.
The results of this study and its methodology were peer-reviewed as part of the U.S.AMPproject by an independent group of experts in the field. Additionally, following ISO 14040, aninternal expert review was carried out on this EPA effort. Experts independent of the originalcalculations performed this review. In accordance with the ISO standards, the internal expertsare familiar with the requirements of ISO 14040 and 14041 and have the necessary technical andscientific expertise. However, a report detailing the findings by the internal experts was notprepared.
Overall, the primary hot rolled steel data are considered to be of excellent quality.
7.2.11.1 Precision. This is a measure of variability from the mean of the data set. Foreach data category within each unit process, the mean and the standard deviation of the reportedvalues are calculated. The precision measure provides the industry with an understanding of thevariability of unit process performance and enables them to define opportunities forimprovement from a benchmarking perspective.
In the steel study, for each of the unit processes where primary data were collected, themean, minimum, maximum, and standard deviation values were calculated for each datacategory. Secondary data used in the study generally consisted of a single value.
7.2.11.2 Consistency. Consistency is a qualitative understanding of how uniformly thestudy methodology is applied to the various components of the study.
Effort was undertaken to ensure the consistent application of the LCI methodology forthe steel study. Experts from steel companies around the world worked with the projectconsultant to produce process flow diagrams with common nomenclature. A training session washeld for all people collecting data at the unit process level. These people received comprehensivemanuals that provided guidance on the unit processes, including the process flow diagrams with
Section 7.0 Summary LCI for Steel Products
7-14
the common nomenclature, to further aid their data collection efforts. Each of these people couldalso call the project consultant to ask questions about data collection. The data collection usedExcel spreadsheets with data verification based on initial data gathering from three sites. If a datavalue was entered into the spreadsheet that lay outside the initial data range, a warning to checkdata validity was issued. The person was then instructed to check the validity of the data point,keeping the value if it was valid or correcting the value if it was an error. Additionally, thespreadsheets calculated carbon and iron balances to give the user another check on the validity ofthe data entered. The data contained in the spreadsheets were electronically downloaded into theLCI modeling software. This procedure eliminated the chance of making a data transcriptionerror. The project consultant again checked the data entered into the LCI modeling software. Ifan error was noted, the consultant contacted the data source for correction. In addition to this,industry experts reviewed the model results to check for inconsistencies.
7.2.11.3 Completeness. Completeness is the measure of primary data values used in theanalysis divided by the number of possible data points for each data category within the sampledomain. The steel LCI completeness for each data category was derived from the questionnairessubmitted by each participating site. If a site submitted a questionnaire that contained a missingvalue for a data category, the procedures for the treatment of missing data were employed. On aunit process level, each of the sites that agreed to contribute to the sample domain reported data.
7.2.11.4 Representativeness. This indicator measures the degree to which the datavalues used in the analysis present a true and accurate measurement of the average processes thatthe study is examining. The degree of representativeness is normally judged by the comparisonof values determined in the study with existing reported values in other analyses or publisheddata sources dealing with the subject matter. Any major variances identified should be examinedand explained.
The LCI used for steel materials was calculated using a small sample size. It would benatural to question whether the small sample size fairly represents the production of steel used inthe generic automobile. The representativeness of primary steel data is presented in Table 7-5 asthe percent of Canadian and U.S. production. Table 7-5 shows the number of sites where primarydata were gathered and the percent of Canada and American production that these sitesrepresent. One explanation of why the percent production is relatively high given the sample sizeis that the two largest steel producers in Canada and in the United States chose to take part in theLCI of steel materials. In addition, the largest iron ore mine in North America was included inthe study. The participating steel companies represent about 26 percent of annual steelproduction in Canada and the United States.
Another way to address representativeness is to compare North American data to globaldata collected by IISI for key data categories. Table 7-6 presents the comparison of NorthAmerican and global data for hot rolled steel product produced using BOF steel-makingtechnology. It can be seen that, for each steel product, the difference between the NorthAmerican and global data sets is less than 10 percent for each of the key indicative datacategories. Based on this result and the knowledge that steel-making technology is similaramong integrated steel producers in North America, it can be expected that expanding the NorthAmerican sample size would have relatively little effect on the LCI results for hot rolled steel.

Section 7.0 Summary LCI for Steel Products
7-15
Table 7-5. Unit Process Sample Size and Percent of Production
Unit Process Sample SizePercent of Canada and
U.S. ProductionIron ore mining 2 13.6c
Coke production 2 8.8b,c
Iron production 4 14.4a
BOF steel production 4 15.5a
Hot rolling 4 18.7b
a Based on 1995 AISI production data.b Estimated from 1993 AISI production data.c Figure does not include primary data from global steel study used to complement North American data.
Table 7-6. Percent Difference of North American Hot Rolled Steel DataCompared to Global Average
Data Category Hot RolledSteel
Iron ore (raw material) -8.4
Coal (raw material) -8.8
Carbon dioxide (air) 9.8
Total energy (energy) 3.2
To further assess the representativeness of the primary data, each site indicated whethereach data value supplied was measured, calculated, or estimated. This information allows theindustry to make a qualitative judgment regarding the level of confidence in the results. For theglobal steel study, from which the North American average was derived, about 60 percent of theprimary data values were measured, 25 percent were calculated, and about 15 percent wereestimated.
7.2.11.5 Reproducibility. This characteristic of data describes whether or not sufficientinformation, both methodological and data values, exists to permit someone to independentlycarry out the calculations and reproduce the results reported in the study.
AISI retains the original LCI and can reproduce the results. Others may approximate theresults based on the LCI profile and the methodology discussed.

Section 7.0 Summary LCI for Steel Products
7-16
7.3 Secondary Steel Production (EAF Technology)
7.3.1 Introduction
This section contains an LCI profile for secondary steel bar product produced using EAFsteel-making technology. It contains process flow diagrams and descriptions for productionprocesses, LCI data tables for 1 ton of product, and a discussion of allocation and data quality.
The LCI data for this profile were collected by AISI (1999), and models EAF steel (hotrolled) product from cradle-to-gate. The boundaries for the EAF steel data in this profile includeall unit processes from material acquisition through production of the EAF steel. Primary datawere collected for limestone quarrying, EAF steel production, and bar production. Figure 7-2shows a simplified process flow diagram for processing EAF steel. The two main inputs aresecondary steel and limestone. These unit processes associated with EAF steel making aredescribed in Sections 7.2.2 through 7.2.5.
7.3.2 Secondary Steel (Elvers et al., 1991; Honeycombe, 1981)
Scrap steel makes up a significant percentage of the feed to electric-arc furnaces. Thescrap comes from steel fabrication operations and from discarded or obsolete goods made fromiron and steel. Metal cuttings or imperfect materials are recycled by remelting, recasting, andredrawing within the steel mill.
7.3.3 Limestone Quarrying
Limestone is quarried primarily from open pits. In the central and eastern U.S.,underground mining is becoming more common (U.S. Bureau of Mines, 1993). The mosteconomical method of recovering the limestone has been through drilling, blasting, mechanical
Figure 7-2. Simplified process flow diagram for EAF steel.
Section 7.0 Summary LCI for Steel Products
7-17
crushing, conveying, and screening (U.S. Bureau of Mines, 1993 and 1984). Airborneparticulates are generated in the form of limestone dust throughout many of the operations. Thelimestone quarrying information used for the secondary bar steel LCI is based upon one site inthe United Kingdom. No further information about the recovery method used at this site wasavailable.
7.3.4 EAF Steel Production (Sims, 1962-63; Taylor, 1985; IISI, 1990; Fruehan, 1985)
About one third of the world's steel is produced by the electric-arc method (IISI website:www.worldsteel.org), which uses high-current electric arcs to melt steel scrap and convert it intoliquid steel of a specified chemical composition and temperature. The external arc heatingpermits better thermal control than does the basic oxygen process, in which heating isaccomplished by the exothermic oxidation of elements contained in the charge. This allowslarger alloy additions to be made than are possible using the BOF process. However, EAFsteel-making does not achieve the level of oxidation that BOF process does, and slag-metalmixing is not as intense; therefore, electric-arc steels normally have carbon contents higher than0.05 percent. In addition, they usually have a higher nitrogen content (40 to 120 ppm),compared with 30 to 50 ppm in BOF steels. Nitrogen, which renders steel brittle, is absorbed byliquid steel from air in the high-temperature zone of the arc. The nitrogen content can be loweredby blowing other gases into the furnace, by heating with a short arc, and by applying a vigorouscarbon monoxide boil or argon stir to the melt.
The major charge material of EAF steel-making is scrap steel. Its availability at low costand proper quality is essential. The importance of scrap quality becomes apparent when makingsteels of high ductility, which must have a total maximum content of residuals (i.e., copper,chromium, nickel, molybdenum, and tin) of 0.2 percent. Most of these residuals are present inscrap and, instead of oxidizing during steel-making, they accumulate and increase in recycledscrap. In such cases, some shops augment their scrap charges with direct-reduced iron or coldblast-furnace iron, which do not contain residuals. Generally, the higher contents of carbon,nitrogen, and residuals make the electric-arc process less attractive for producing low-carbon,ductile steels.
Most scrap yards keep various grades of scrap separated. High-alloy shops, such asstainless-steel producers, accumulate, purchase, and charge scrap of similar composition to thesteel they make in order to minimize expensive alloying additions.
Several EAFs are operated by direct current (dc) instead of alternating current (ac).Direct current furnaces normally have only one very large electrode extending through the centreof the roof, with the counter electrode embedded in the furnace bottom and contacting the melt.Power and electrode consumption is lower than in regular ac furnaces. The dc arc has a steadierand quieter burn, which results in less disturbance of the surrounding power system and lessnoise around the furnace. The electrical equipment is smaller but still expensive because of therequired rectifiers. Critical in dc furnace operation are the short life of the bottom electrode,integrity of the hearth, and current limitations with a one-electrode system. Furnaces withcapacities up to 130 tons are in operation.
Section 7.0 Summary LCI for Steel Products
7-18
7.3.5 Steel Bar (AIME, 1983)
Steel bars are long, usually of round, square, rectangular, or hexagonal cross section andof 0.5 to 2 inches (12- to 50-mm) diameter or equivalent. (Since bar mills are also capable ofrolling small-shaped products such as angles, flats, channels, fence posts, and tees, thesematerials are sometimes called merchant bars). In principle, after removal of the furnace scaleby water jets, a primary reduction takes place in several passes through roll stands in open,semicontinuous, or fully continuous arrangement. These can use an alternating square-diamondrolling principle on horizontal and vertical rolls or a series of oval-to-round passes.
The finishing stand of a bar mill gives the bar its final shape and often a specific surfacepattern, such as the protrusions on concrete-reinforcing bars. The rolling speed increases as thecross section at each successive stand decreases, and the exit speed can be as high as 49 ft/ssecond (15 m/s). The hot bar is then cut by a flying shear into cooling-bed length (e.g., 164 ft),after which it is cooled, inspected, and cold-cut to shipping length.
7.3.6 Data Source and Calculation Procedures
Data were acquired from a combination of primary and secondary sources. Two NorthAmerican sites and one European site provided primary data for bar steel. Further primary datawere collected for some upstream processes, such as iron ore mining and lime production.Secondary data were obtained from LCI databases and literature.
Sources of primary and secondary data include
# EAF steelmaking: one in Canada, one in the United States, one in Europe
# Limestone quarrying: one in the United Kingdom.
# Secondary data from Ecobalance database and literature sources are shown inTable 7-1.
The EAF steel bar profile from AISI was converted from SI units (energy in MJ, mass ingrams) per kilogram to U.S. units (mass in pounds [lb], volume in U.S. gallons [gal], gaseousvolume in cubic feet [ft3], and energy in British thermal units [Btu] per 1 ton [2,000 lb]).
7.3.7 Allocation Procedures
The steel LCI study includes consideration of several approaches to co-productallocation. Steel materials can be modeled by allocating inputs and outputs based on a mass,energy, or economics basis. Two other options are available, these being no allocation andavoiding allocation by using system expansion. The last option is not allocation, but is includedhere for convenience. AISI decided to pursue multiple approaches to co-product allocationbecause it is an issue of some debate and flexibility was a part of the study goals. The inputs andoutputs of the wastewater treatment plant were allocated to a product based on the water flow

Section 7.0 Summary LCI for Steel Products
7-19
from the unit process associated with the product. For secondary steel production, no co-productallocation issues were identified.
7.3.8 LCI Results
Table 7-7 summarizes the cradle-to-gate LCI data for secondary EAF steel bar. Energyconsumed was followed back to elementary flows from the earth and presented as materialsinflows (e.g., coal, natural gas, oil) in the AISI profile. In the summary results, energy remindersfor total process energy and transport energy are presented. Emissions to air and water includeall emissions for processing, combustion (including electricity), transportation, andpre-combustion activities. Emissions to air and water include all emissions for processing,combustion (including electricity), transportation, and precombustion activities.
7.3.9 Data Quality
The Canadian and American steel data was derived from a world-wide LCI studycommissioned by IISI. Table 7-8 summarizes the domain and geographic coverage for EAFsteel production. There were a few exceptions to this geographic coverage. In the case of steelbar, a European steel production site was added to the North American database to increase thesample size and protect confidentiality of company data. This European site data were generatedin the same LCI exercise as the North American site data, so the methodology applied isconsistent. In addition, the European site data were coupled with energy and ancillary materialsdata common to this study to make it more consistent with the North American sites. Primarydata for limestone quarrying were based on a site in the United Kingdom. These data were alsocollected as part of the international steel LCI study. For the two instances wherecompany-specific coke production data were not available, global coke production data collectedby IISI were used.
Every attempt was made to collect high-quality primary data. Where primary data werenot available, secondary or surrogate data were employed. For each process, information on thesource, nature, and quality of the data was reported by the respondent. In addition to the dataquality aspects of geographic coverage, temporal coverage, technology coverage, and datasources, data quality was reported using five DQIs: precision, consistency, completeness,representativeness, and reproducibility. Assessments for these data quality indicators aresummarized in below.
The results of this study and its methodology were peer-reviewed as part of the U.S.AMP project by an independent group of experts in the field. Additionally, following ISO14040, internal expert review was carried out on this EPA effort. Experts independent of theoriginal calculations performed this review. In accordance with the ISO standards, the internalexperts are familiar with the requirements of ISO 14040 and 14041 and have the necessarytechnical and scientific expertise. However, a report detailing the findings by the internalexperts was not prepared.

Section 7.0 Summary LCI for Steel Products
7-20
Table 7-7. Data for Production of 1 Ton of Secondary EAF Steela
Raw Materials* Units Total
Bentonite lb 2.00E-03Coal lb 3.54E+02Dolomite lb 3.32E+00Iron lb 1.98E+01Limestone lb 1.92E+02Manganese lb 3.32E+01Natural Gas lb 4.08E+01Oil (in ground) lb 3.58E+01Sand (in ground) lb 1.22E+01Sodium Chloride lb 2.06E-01Uranium lb 4.96E-03Scrap Steel lb 2.20E+03Water Used (total) gal 2.03E+03
Energy Usage UnitsTotal
(Base Units)Total
(Million Btu)Factor to
Convert to MMBtu
Process Energy (Combustion andPrecombustion)
MMBtu 7.99E+00 7.99E+00 1.00E+00
Transportation Energy(Combustion andPrecombustion)
MMBtu 1.44E-01 1.44E-01 1.00E+00
Environmental Emissions Units TotalProcess and
TransportationElectrical
Energy
Atmospheric EmissionsCarbon Monoxide lb 7.93E+00Carbon Dioxide-fossil lb 1.19E+03Hydrocarbons (non CH4) lb 5.76E-01Hydrochloric acid lb 1.79E-01Lead lb 1.87E-03Methane lb 2.58E+00Nitrogen Oxides lb 3.53E+00Particulate lb 1.44E+01Sulfur Oxides lb 5.97E+00
(continued)

Table 7-7. (concluded)
Section 7.0 Summary LCI for Steel Products
7-21
Environmental Emissions Units TotalProcess and
TransportationElectrical
Energy
Solid WastesUnspecified lb 2.66E+02
Waterborne EmissionsAmmonia lb 2.08E-03Dissolved Solids lb 3.38E-01Oil lb 8.74E-03Phosphate lb 7.56E-03Suspended Solids lb 1.24E-01
*Data for raw materials are not included for other materials and are not included in the decision support tool. AISIrequested that these data be presented.** Further disaggregation of the data was not possible with the data provided by AISI.
Source: AISI (1999)
Table 7-8. Domain and Geographical Coverage for Steel Production
Steel Technology Unit Process Geographical Region Sites
EAF steel production Limestone quarrying United Kingdom 1
EAF steel production North America, Europe 3
Bar production North America, Europe 3
Total 7
The secondary EAF steel data are considered to be of excellent quality.
7.3.9.1 Precision. The precision measure provides the industry with an understanding ofthe variability of unit process performance and enables them to define opportunities forimprovement from a benchmarking perspective. In the steel study, for each of the unit processeswhere primary data were collected, the mean, minimum, maximum, and standard deviationvalues were calculated for each data category. Secondary data used in the study generallyconsisted of a single value.
7.3.9.2 Consistency. Effort was undertaken to ensure the consistent application of theLCI methodology for the steel study. Experts from steel companies around the world workedwith the project consultant to produce process flow diagrams with common nomenclature. Atraining session was held for all those people who were collecting data at the unit process level.These people received comprehensive manuals that provided guidance on the unit processes,including the process flow diagrams with the common nomenclature, to further aid their datacollection efforts. Each of these people could also call the project consultant to ask questions

Section 7.0 Summary LCI for Steel Products
7-22
about data collection. The data collection used Excel spreadsheets with data verification basedon initial data gathering from three sites. If a data value was entered into the spreadsheet that layoutside the initial data range, a warning to check data validity was issued. The person then wasinstructed to check the validity of the data point, keeping the value if it was valid or correctingthe value if it was an error. Additionally, the spreadsheets calculated carbon and iron balances togive the user another check on the validity of the data entered. The data contained in thespreadsheets were electronically downloaded into the LCI modeling software. This procedureeliminated the chance of making a data transcription error. The project consultant again checkedthe data entered into the LCI modeling software. If an error was noted, the consultant contactedthe data source for correction. In addition to this, the industry experts reviewed the model resultsto check for inconsistencies.
7.3.9.3 Completeness. The steel LCI completeness for each data category was derivedfrom the questionnaires submitted by each participating site. If a site submitted a questionnairethat contained a missing value for a data category, the procedures for the treatment of missingdata were employed. On a unit process level, each of the sites that agreed to contribute to thesample domain reported data.
7.3.9.4 Representativeness. The LCI used for steel materials was calculated using asmall sample size. It would be natural to question whether the small sample size fairly representsthe production of steel used in the generic automobile. The representativeness of primary steeldata is presented in Table 7-9 as the percent of Canadian and U.S. production. Table 7-9 showsthe number of sites where primary data were gathered and the percent of Canadian and Americanproduction that these sites represent. One explanation why the percent production is relativelyhigh given the sample size is that the two largest steel producers in Canada and in the UnitedStates chose to take part in the life cycle inventory of steel materials. The participating steelcompanies represent about 26 percent of annual steel production in Canada and the UnitedStates.
Another way to address representativeness is to compare North American data to globaldata collected by IISI for key data categories.
Table 7-9. Unit Process Sample Size and Percent of Production
Unit Process Sample SizePercent of Canada and
U.S. Production
EAF steel production 3 3.2 a,c
Bar mill 3 5.8 b
a Based on 1995 AISI production data.b Estimated from 1993 AISI production data.c Figure does not include primary data from global steel study used to complement North
American data.
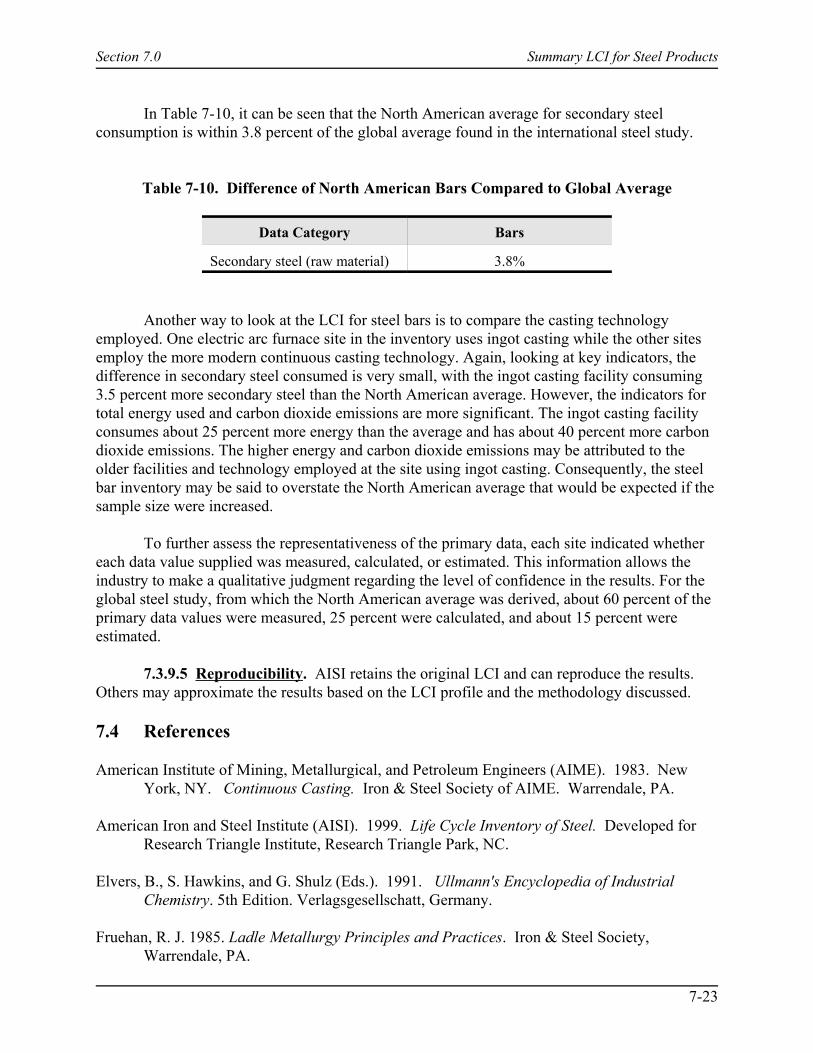
Section 7.0 Summary LCI for Steel Products
7-23
In Table 7-10, it can be seen that the North American average for secondary steelconsumption is within 3.8 percent of the global average found in the international steel study.
Table 7-10. Difference of North American Bars Compared to Global Average
Data Category Bars
Secondary steel (raw material) 3.8%
Another way to look at the LCI for steel bars is to compare the casting technologyemployed. One electric arc furnace site in the inventory uses ingot casting while the other sitesemploy the more modern continuous casting technology. Again, looking at key indicators, thedifference in secondary steel consumed is very small, with the ingot casting facility consuming3.5 percent more secondary steel than the North American average. However, the indicators fortotal energy used and carbon dioxide emissions are more significant. The ingot casting facilityconsumes about 25 percent more energy than the average and has about 40 percent more carbondioxide emissions. The higher energy and carbon dioxide emissions may be attributed to theolder facilities and technology employed at the site using ingot casting. Consequently, the steelbar inventory may be said to overstate the North American average that would be expected if thesample size were increased.
To further assess the representativeness of the primary data, each site indicated whethereach data value supplied was measured, calculated, or estimated. This information allows theindustry to make a qualitative judgment regarding the level of confidence in the results. For theglobal steel study, from which the North American average was derived, about 60 percent of theprimary data values were measured, 25 percent were calculated, and about 15 percent wereestimated.
7.3.9.5 Reproducibility. AISI retains the original LCI and can reproduce the results. Others may approximate the results based on the LCI profile and the methodology discussed.
7.4 References
American Institute of Mining, Metallurgical, and Petroleum Engineers (AIME). 1983. NewYork, NY. Continuous Casting. Iron & Steel Society of AIME. Warrendale, PA.
American Iron and Steel Institute (AISI). 1999. Life Cycle Inventory of Steel. Developed forResearch Triangle Institute, Research Triangle Park, NC.
Elvers, B., S. Hawkins, and G. Shulz (Eds.). 1991. Ullmann's Encyclopedia of IndustrialChemistry. 5th Edition. Verlagsgesellschatt, Germany.
Fruehan, R. J. 1985. Ladle Metallurgy Principles and Practices. Iron & Steel Society,Warrendale, PA.
Section 7.0 Summary LCI for Steel Products
7-24
Ginzburg, V. B. 1989. Steel-Rolling Technology: Theory and Practice. Marcel Dekker,Monticello, NY.
Herman, M. F., et al. (eds.) 1978-84. Encyclopedia of Chemical Technology. 3rd ed., 31 vol.Formerly known as Kirk-Othmer Encyclopedia of Chemical Technology. Wiley, NewYork, NY.
Honeycombe, R.W.K. 1981. Steels: Microstructures and Properties. Butterworth Hienmann,Oxford, UK.
IISHI website: www.worldsteel.org.
International Iron and Steel Institute (IISI). 1990. Committee On Technology, The Electric ArcFurnace. Published by IISI, Brussels, Belgium.
International Organization for Standardization (ISO). 1998. Environmental Management – LifeCycle Assessment – Goal and Scope Definition and Inventory Analysis, ISO 14041.Geneva, Switzerland.
International Organization for Standardization (ISO). 1997. Environmental Management - LifeCycle Assessment - Principles and Framework. ISO 14040. Geneva, Switzerland.
Kent, James A. 1992. Riegel’s Handbook of Industrial Chemistry. Ninth Edition. VanNostrand Reinbold. New York, NY.
Lankford, W. T., Jr., et al. (Eds.). 1985. The Making, Shaping, and Treating of Steel. 10th ed. The Association of Iron and Steel Engineers, Pittsburgh, PA.
Pehlke, R. D., et al. (Eds.). 1974-77. BOF Steelmaking. 5 volumes. Iron and Steel Society of theAmerican Institute of Mining, Metallurgical, and Petroleum Engineers (AIME). NewYork, NY.
Sims, C. E. (Ed.). 1962-63. Electric Furnace Steelmaking. 2 volumes. Wiley InterSciencePublishers. New York, NY.
Swiss Federal Institute of Technology (ETH), Zurich, Ecoprofiles for Energy Systems, 1996. pg. 58. Birmensdorf, Switzerland.
Swiss Federal Institute of Technology (ETH), Zurich, Ecoprofiles for Energy Systems, 1996. pg. 60-69. Birmensdorf, Switzerland.
Swiss Federal Office of Environment, Forests, and Landscapes (SFAEFL). 1991. Environmental Series No. 132. Bern. February 1991. Birmensdorf, Switzerland.
Taylor, C. R. (Ed.). 1985. Electric Furnace Steelmaking. Iron & Steel Society, Warrendale, PA.

Section 7.0 Summary LCI for Steel Products
7-25
U.S. Bureau of Mines (BOM). 1993. Minerals Yearbook. Washington, DC.
U.S. Bureau of Mines (BOM). 1984. Mineral Facts and Problems. Washington, DC.

A-1
Appendix APeer Reviewers for this Report
David Allen - University of Texas at AustinRobert P. Anex - University of Oklahoma
Gregory A. Keoleian - University of MichiganMitchell Kessler - TIA Solid Waste Management Consultants, Inc.
Jay Lund - University of California at DavisRuksana Mirza - Formerly with Proctor and Redfern, Ltd.
Lynn Scarlett - Reason Public Policy InstituteAarne Vesilind - Bucknell University
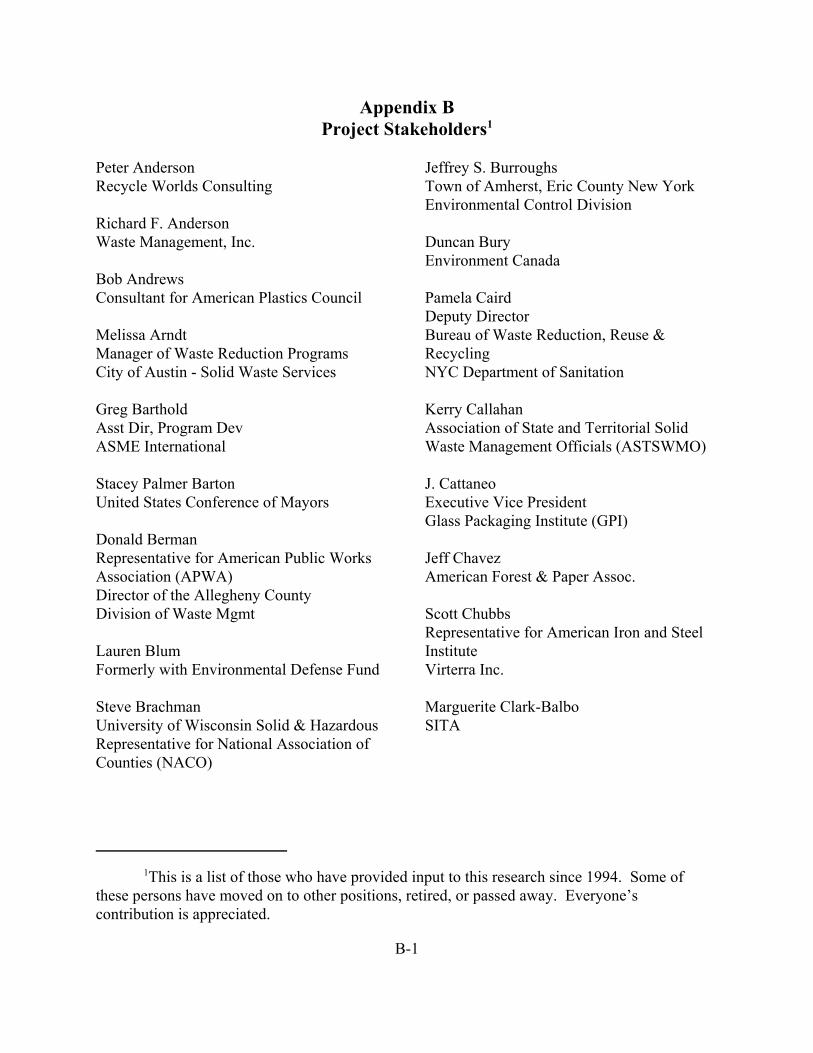
1This is a list of those who have provided input to this research since 1994. Some ofthese persons have moved on to other positions, retired, or passed away. Everyone’scontribution is appreciated.
B-1
Appendix BProject Stakeholders1
Peter AndersonRecycle Worlds Consulting
Richard F. AndersonWaste Management, Inc.
Bob AndrewsConsultant for American Plastics Council
Melissa Arndt Manager of Waste Reduction ProgramsCity of Austin - Solid Waste Services
Greg BartholdAsst Dir, Program DevASME International
Stacey Palmer BartonUnited States Conference of Mayors
Donald BermanRepresentative for American Public WorksAssociation (APWA)Director of the Allegheny County Division of Waste Mgmt
Lauren BlumFormerly with Environmental Defense Fund
Steve Brachman University of Wisconsin Solid & HazardousRepresentative for National Association ofCounties (NACO)
Jeffrey S. BurroughsTown of Amherst, Eric County New YorkEnvironmental Control Division
Duncan BuryEnvironment Canada
Pamela CairdDeputy DirectorBureau of Waste Reduction, Reuse &RecyclingNYC Department of Sanitation
Kerry CallahanAssociation of State and Territorial SolidWaste Management Officials (ASTSWMO)
J. Cattaneo Executive Vice PresidentGlass Packaging Institute (GPI)
Jeff ChavezAmerican Forest & Paper Assoc.
Scott ChubbsRepresentative for American Iron and SteelInstituteVirterra Inc.
Marguerite Clark-BalboSITA

B-2
Kate CooperState of WisconsinSolid Waste Reduction & Recycling SectionBureau of Solid & Hazardous WasteManagement
David CornellCMA RepresentativeEastman Chemical Company
Norm CramptonExecutive DirectorIndiana Institute of Recycling
Gregory L. CrawfordVice President of Recycling OperationsSteel Recycling Institute
Jennifer DeLongProgram ManagerU.S. Conference of Mayors
Richard Denison Environmental Defense Fund
Eileen DohertyProgram DirectorNational Conference of State Legislatures
Frank Duncan, Jr.Chairman, GPI Technical CommitteeGlass Technologist
Marty DurbinAmerican Plastics Council
Robert A. EplerDirector - Environmental Services DeptThe City of San Diego
Marty FelkerWaste Management, Inc.
Ferretti, WillExecutive DirectorNational Recycling Coalition
James A. FreyResource Recycling Systems, Inc.
Naomi FriedmanSolid Waste & Pollution Prevention ProjectNational Assoc. of Counties
Rick FuszekManager of Waste Reduction ProgramsCity of Austin
Lawrence Goodland South Carolina Institute for Energy
John GreenThe Aluminum Association
Jonathan GreenbergDirector of Environmental PolicyRepresentative for Browning-FerrisIndustries
Michael Greenman Interim Executive DirectorGlass Manufacturing Industry Council
Karen Harrington, Principal PlannerMinnesota Office of EnvironmentalAssistance
Randy HartmannOffice of Environmental ManagementGeorgia Department of Community Affairs
Steven G. HentgesAmerican Plastics CouncilAssociate Director of Technical
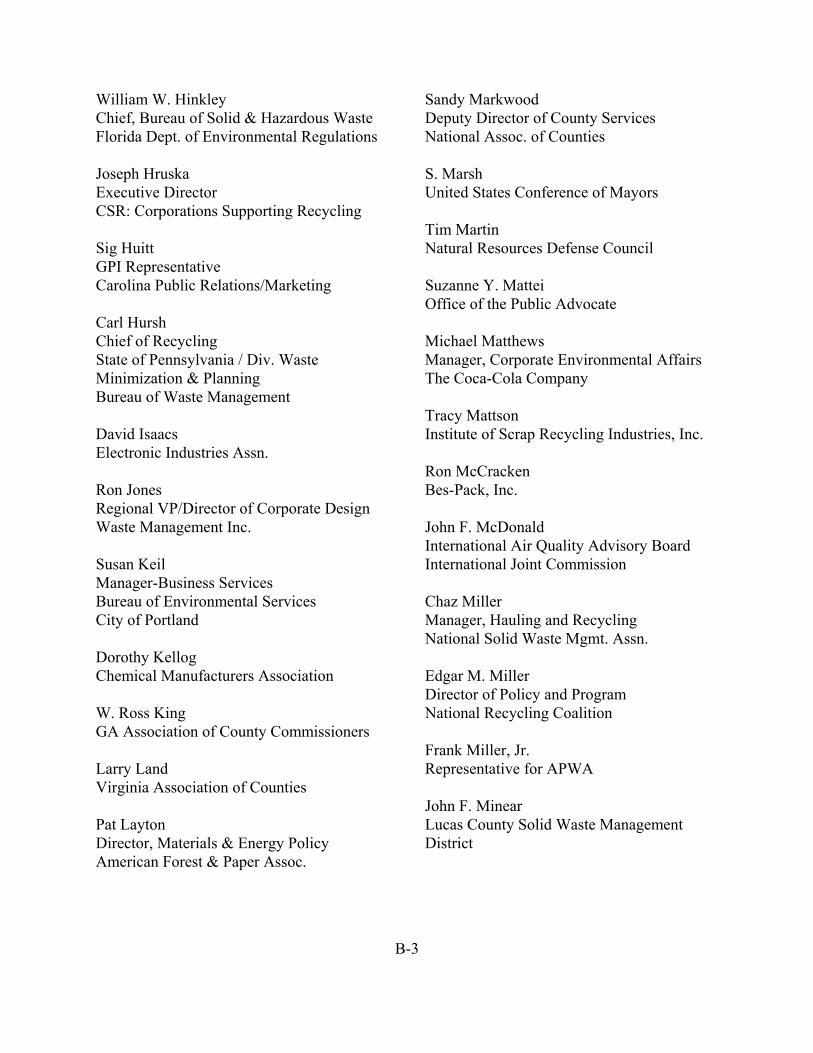
B-3
William W. HinkleyChief, Bureau of Solid & Hazardous WasteFlorida Dept. of Environmental Regulations
Joseph Hruska Executive DirectorCSR: Corporations Supporting Recycling
Sig Huitt GPI RepresentativeCarolina Public Relations/Marketing
Carl HurshChief of RecyclingState of Pennsylvania / Div. WasteMinimization & PlanningBureau of Waste Management
David IsaacsElectronic Industries Assn.
Ron JonesRegional VP/Director of Corporate DesignWaste Management Inc.
Susan Keil Manager-Business ServicesBureau of Environmental ServicesCity of Portland
Dorothy KellogChemical Manufacturers Association
W. Ross KingGA Association of County Commissioners
Larry LandVirginia Association of Counties
Pat Layton Director, Materials & Energy PolicyAmerican Forest & Paper Assoc.
Sandy MarkwoodDeputy Director of County ServicesNational Assoc. of Counties
S. MarshUnited States Conference of Mayors
Tim MartinNatural Resources Defense Council
Suzanne Y. MatteiOffice of the Public Advocate
Michael MatthewsManager, Corporate Environmental AffairsThe Coca-Cola Company
Tracy MattsonInstitute of Scrap Recycling Industries, Inc.
Ron McCrackenBes-Pack, Inc.
John F. McDonaldInternational Air Quality Advisory BoardInternational Joint Commission
Chaz MillerManager, Hauling and RecyclingNational Solid Waste Mgmt. Assn.
Edgar M. MillerDirector of Policy and ProgramNational Recycling Coalition
Frank Miller, Jr.Representative for APWA
John F. MinearLucas County Solid Waste ManagementDistrict
B-4
Reid A. MinerProgram DirectorNational Council of the Paper Industry for Air & Stream Improvements, Inc.(NCASI)
Randall B. MonkDirector of OperationsThe Composting Council
A. MorganSouth Carolina Institute for Energy
Jeffrey Morris Sound Resource Mgmt. Group
David MyersMonterey Regional Waste Mgmt District
Richard E. Oakley IIIPresident, BFI Gas Services
Jeremy K. O’BrienDirector of Applied ResearchSolid Waste Assn. of North America
Stephanie OsbornAmerican Public Works Assn. (APWA)
Tom OsdobaResearch and PlanningMinnesota Office of EnvironmentalAssistance
Richard D. Otis, Jr.American Plastics Council
J. W. Owens Principal Scientist, Corporate P&RSThe Procter & Gamble Company
Stephen PearsonCan Manufacturers Institute
Gary PierceEnergy Answers Corporation, Inc.
Blair PollackCounty CommissionerOrange County
Lonnie C. Poole, ChairmanWaste Industries, Inc.
Edward W. Repa, PhDEnvironmental Industries Assn.
William RhodesDirector, Solid Waste ServciesCity of Austin
Ellen RyanIntegrated Waste ManagementOffice of Environmental ManagementCity of San Jose
Laurie Crick SahatjianDyer, Ellis & JosephRepresentative for GPI
Patrick SchiavoCalifornia Environmental Protection AgencyIntegrated Waste Management Board
Judy ShehanU.S. Conference of Mayors
Michael ShoreNC Depart. of Environment and Natural ResourcesSpecial Asst for Environmental Protection
Michael A. SillsRepresentative for ASTSWMONew Hampshire Department ofEnvironmental ServicesWaste Management Division

B-5
Edmund J. SkernolisWaste Management Inc.
John Skinner Executive DirectorSolid Waste Assn. of North America
Drew SonesBureau of SanitationCity of Los Angeles
Richard Ian StesselColumbia University in the City of NewYork
David B. SussmanPoubelle AssociatesGovt & Public Relations
S. ThyagarajanEnergy Answers Corporation, Inc.
Steve TilneySolid Waste ManagerCity of PhiladelphiaSanitation Division
Robert J. TowlesOwens-Illinois, Inc.Manager, Env. Affairs
John TrottiMSW Management
Richard M. Van FrankRepresentative for Audobon
Joseph R. Vissalli, Program Mgr. Municipal Wastes & EnvironmentalResearchNew York State Energy R&D Authority
Richard P. WatsonChief of Engineering & OperationsDelaware Solid Waste Authority
Heidi Whitman Solid Waste Planning ManagerCounty Waste Mgmt. Division
Charles E. WilliamsV.P. - Environmental/EngineeringWaste Management Inc.
J. Kenneth WittleElctro-Pyrolysis, Inc.Representative for the American Society of Mechanical Engineers
Barbara YuhasInternational City/County Mgmt. Assn.
Maria ZannesPresident/Executive DirectorIntegrated Waste Services Assn.