life cycle material data update for greet model
TRANSCRIPT

Life Cycle Material Data Update for GREET Model
Gregory Keoleian, Shelie Miller, Robert De Kleine, Andrew Fang, and Janet Mosley
Report No. CSS12-12
July 9, 2012

Life Cycle Material Data Update for GREET Model
Gregory Keoleian Shelie Miller
Robert De Kleine Andrew Fang Janet Mosley
Center for Sustainable Systems
University of Michigan Ann Arbor
July 9, 2012
A report of the Center for Sustainable Systems Report No. CSS12-12
Document Description
LIFE CYCLE MATERIAL DATA UPDATE FOR GREET MODEL Gregory Keoleian, Shelie Miller, Robb De Kleine, Andrew Fang, and Janet Mosley Center for Sustainable Systems, Report No. CSS12-12 University of Michigan, Ann Arbor, Michigan July 9, 2012 74 pp., tables, figures, appendices This document is available online at: http://css.snre.umich.edu
Center for Sustainable Systems School of Natural Resources and Environment University of Michigan 440 Church Street, Dana Building Ann Arbor, MI 48109-1041 Phone: 734-764-1412 Fax: 734-647-5841 Email: [email protected] Web: http://css.snre.umich.edu
© Copyright 2012 by the Regents of the University of Michigan

i
Table of Contents Acknowledgements ..................................................................................................................................... vii
1 Introduction .......................................................................................................................................... 1
1.1 Project Description ........................................................................................................................ 1
1.2 Scope ............................................................................................................................................. 2
1.2.1 Environmental Burdens ........................................................................................................ 2
1.2.2 System Boundaries ................................................................................................................ 2
1.2.3 Materials ............................................................................................................................... 3
1.2.4 Production Stages ................................................................................................................. 3
1.2.5 Transformation Processes ..................................................................................................... 3
1.2.6 Geographic Scope ................................................................................................................. 3
1.2.7 Temporal Scope .................................................................................................................... 4
1.3 Potential Sources of Discrepancy .................................................................................................. 4
2 Methods and Results ............................................................................................................................ 5
2.1 Metals ........................................................................................................................................... 5
2.1.1 Steel Material Production and Transformation .................................................................... 5
2.1.1 Aluminum ............................................................................................................................ 13
2.1.2 Nickel ................................................................................................................................... 18
2.1.3 Data Preparation for GREET ................................................................................................ 20
2.1.4 Copper ................................................................................................................................. 23
2.2 Plastics......................................................................................................................................... 26
2.2.1 High-Density Polyethylene (HDPE) Resin Production ......................................................... 26
2.2.2 Low-Density Polyethylene (LDPE) Resin Production ........................................................... 29
2.2.3 Linear Low-Density Polyethylene (LLDPE) Resin Production .............................................. 30
2.2.4 Polypropylene (PP) Resin Production ................................................................................. 32
2.2.5 Polyethylene Terephthalate (PET) Resin Production .......................................................... 33
2.2.6 General Purpose Polystyrene (GPPS) Resin Production ..................................................... 35
2.2.7 High-Impact Polystyrene (HIPS) Resin Production .............................................................. 37
2.2.8 Polyvinyl Chloride (PVC) Resin Production ......................................................................... 38
2.2.9 Acrylonitrile-Butadiene-Styrene (ABS) Resin Production ................................................... 40
2.2.10 Ethylene Propylene Diene Monomer (EPDM) Resin Production ........................................ 42
2.2.11 Nylon 66 Resin Production .................................................................................................. 44
2.2.12 Nylon 6 Resin Production .................................................................................................... 46
2.2.13 Liquid Epoxy Resin Production ............................................................................................ 47
2.2.14 Polycarbonate (PC) Resin Production ................................................................................. 49

ii
2.2.15 Rigid Polyurethane (PUR) Foam Production ....................................................................... 51
2.2.16 Flexible Polyurethane (PUR) Foam Production ................................................................... 54
2.2.17 Blow Molding of HDPE Bottles ............................................................................................ 56
2.2.18 Calendaring of PVC Film ...................................................................................................... 58
2.2.19 Extrusion of HDPE Pipe ....................................................................................................... 59
2.2.20 Extrusion of PVC Pipe .......................................................................................................... 60
2.2.21 Extrusion of PP Pipe ............................................................................................................ 61
2.2.22 Injection Molding of HDPE .................................................................................................. 62
2.2.23 Injection Molding of PVC .................................................................................................... 63
2.2.24 Injection Molding of PP ....................................................................................................... 64
2.2.25 Compression Molding ......................................................................................................... 65
2.2.26 Average Transformed Plastic Products ............................................................................... 67
3 Summary of Total Energy and Greenhouse Gas Emissions ................................................................ 72
4 Discussion of Results for Future GREET Updates ................................................................................ 72

iii
List of Figures and Tables Figure 1.1: Total Energy Cycle for Transportation Technologies .................................................................. 1 Figure 1.2: Schematic of Total Energy and Total Emissions Calculations in GREET ...................................... 2 Figure 2.1: Steel Production Flowchart ......................................................................................................... 7 Figure 2.2: Material Flow of Intermediate Steel Products through Rolling and Stamping (per ton of steel product) ...................................................................................................................................................... 11 Figure 2.3: Screenshot of Excel Solver Setup Used for Purchased Energy Calculation .............................. 21 Table 1.1: Scope of Raw Materials Included within the Project ................................................................... 3 Table 1.2: Fuel Categories and Fuel Assignments in GREET ......................................................................... 4 Table 2.1: Mass Fraction of Steel Type in Conventional Vehicle .................................................................. 8 Table 2.2: Integrated Mill Process Stages ..................................................................................................... 8 Table 2.3: Mini Mill Process Stages ............................................................................................................... 9 Table 2.4: Comparison of Virgin Steel Data ................................................................................................ 12 Table 2.5: Comparison of Recycled Steel Data ........................................................................................... 13 Table 2.6: Electricity Grid Mix Input in GREET Model for Hall-Heroult Process ......................................... 15 Table 2.7: PFC Emissions during Primary Aluminum Production................................................................ 16 Table 2.8: Total Energy and Emissions Results for Wrought Aluminum (per ton) ..................................... 17 Table 2.9: Total Energy and Emissions Results for Cast Aluminum (per ton) ............................................. 17 Table 2.10: Total Energy and Emissions Results for Extruded Aluminum (per ton) ................................... 18 Table 2.11: Total Energy for Nickel Production Input into Excel Solver ..................................................... 21 Table 2.12: Purchased Energy Outputs from Excel Solver for Nickel Production ....................................... 21 Table 2.13: Total Energy and Emissions Results for Primary Nickel (per ton of wire) ................................ 22 Table 2.14: Total Energy and Emissions Results for Primary Copper (per ton of wire) .............................. 25 Table 2.15: Comparison of HDPE Resin Data .............................................................................................. 29 Table 2.16: Comparison of LDPE Resin Data ............................................................................................... 30 Table 2.17: Comparison of LLDPE Resin Data ............................................................................................. 31 Table 2.18: Comparison of PP Resin Data ................................................................................................... 33 Table 2.19: Comparison of PET Resin Data ................................................................................................. 35 Table 2.20: Comparison of GPPS Resin Data .............................................................................................. 36 Table 2.21: Comparison of HIPS Resin Data................................................................................................ 38 Table 2.22: Comparison of PVC Resin Data ................................................................................................ 40 Table 2.23: Comparison of ABS Resin Data ................................................................................................. 42 Table 2.24: EPDM Resin Data ...................................................................................................................... 44 Table 2.25: Comparison of Nylon 66 Resin Data ........................................................................................ 46 Table 2.26: Comparison of Nylon 6 Resin Data........................................................................................... 47 Table 2.27: Comparison of Liquid Epoxy Resin Data ................................................................................... 48 Table 2.28: Inputs to GREET and Outputs from Solver for PC Purchased Energy Calculation .................... 50 Table 2.29: Comparison of PC Resin Data ................................................................................................... 51 Table 2.30: Comparison of Rigid PUR Foam Data ....................................................................................... 53 Table 2.31: Comparison of Flexible PUR Foam Data ................................................................................... 56 Table 2.32: HDPE Blow Molding Data ......................................................................................................... 57 Table 2.33: PVC Film Calendaring Data ....................................................................................................... 59 Table 2.34: HDPE Pipe Extrusion Data ........................................................................................................ 60 Table 2.35: PVC Pipe Extrusion Data ........................................................................................................... 61 Table 2.36: PP Pipe Extrusion Data ............................................................................................................. 62 Table 2.37: HDPE Injection Molding Data ................................................................................................... 63 Table 2.38: PVC Injection Molding Data ..................................................................................................... 64
iv
Table 2.39: PP Injection Molding Data ........................................................................................................ 65 Table 2.40 Compression Molding Data ....................................................................................................... 66 Table 2.41: Weights for Transformations for Each Resin, % by weight ...................................................... 68 Table 2.42: Mass of Resin Input into Plastics Transformation Processes ................................................... 68 Table 2.43: Composition of GFRP and CFRP, % by weight .......................................................................... 69 Table 2.44: Results for an Average Ton of Transformed HDPE, LDPE, and LLDPE ...................................... 69 Table 2.45: Results for an Average Ton of Transformed PP, PET, and PVC ................................................ 69 Table 2.46: Results for an Average Ton of Transformed ABS and EPDM ................................................... 70 Table 2.47: Results for an Average Ton of Transformed Nylon 66, Nylon 6, and PC .................................. 70 Table 2.48: Results for 1 Ton of Final GFRP and CFRP Product .................................................................. 71 Table 3.1: Summary of Total Energy and GHG Emissions by Raw Material................................................ 72

v
Nomenclature and Glossary ABBREVIATIONS General AA Aluminum Association ANL Argonne National Laboratory ACC American Chemistry Council BOF basic oxygen furnace EAF electric arc furnace GHG greenhouse gas GREET Greenhouse gases, Regulated Emissions, and Energy use in Transportation
model HHV higher heating value IAI International Aluminium Institute LCI life cycle inventory LPG liquefied petroleum gas LHV lower heating value USGS United States Geographic Survey Emissions VOC volatile organic compounds CO carbon monoxide NOx nitrogen oxides (mainly no and no2) PM10 particulate matter (with a diameter of 10 micrometers or less) PM2.5 particulate matter (with a diameter of 2.5 micrometers or less) SOx sulfur oxides (principally so2) CH4 methane N2O nitrous oxide CO2 carbon dioxide
CO2 (VOC, CO, CO2) carbon dioxide total including carbon content of CO, VOC emissions converts to carbon dioxide
GHGs greenhouse gases (reported as global warming potential in CO2 equivalent) Plastics ABS acrylonitrile-butadiene-styrene EPDM ethylene propylene diene monomer GPPS general purpose polystyrene HDPE high density polyethylene HIPS high impact polystyrene LDPE low density polyethylene LLDPE linear low density polyethylene PC polycarbonate PET polyethylene terephthalate PP polypropylene PUR polyurethane PVC polyvinyl chloride UPR unsaturated polyester resin

vi
KEY TERMINOLOGY General Purchased Energy Energy or energy carriers purchased by the raw material producers for the
creation of these materials. Sometimes referred to as ‘delivered energy’. Upstream Energy Energy consumed to extract, harvest, refine, process, and deliver purchased
energy. Primary Energy Sum of purchased energy and corresponding upstream energy. Sometimes
referred to as ‘resource energy’. Upstream Emissions Emissions generated to extract, harvest, refine, process, and deliver
purchased energy and purchased materials. Feedstock Energy The energy content of fuels that are typically combusted, but instead serve
as inputs in the production of raw material (especially plastics). Terms as used in GREET Combustion Emissions Air emissions resulting from the combustion of fuels including fuels used to
generate electricity. Upstream emissions are included in this total. Non-Combustion Emissions
Air emissions resulting from the generation and release of substances into the air that are not directly associated with the combustion of fuels.
Total Energy See primary energy. Total Emissions Sum of combustion and non-combustion emissions.

vii
Acknowledgements The authors would like to acknowledge support of Argonne National Laboratory, specifically, Michael Wang, John Sullivan, and Andrew Burnham. In addition, we wish to thank the following individuals and their respective organizations for providing data and guidance related to raw material data: Ken Martchek at Alcoa, Marshall Wang at the Aluminum Association, Bruce McKean at the Nickel Institute, Anne Landfield-Grieg formerly at Ecobalance, Olivier Muller currently at Ecobalance, Ivo Mersiowsky at DEKRA Industrial GmbH, Colin McMillan formerly at the Center for Sustainable Systems, Matthew Eckelman and Barbara Reck at Yale, Rebe Feraldi at Franklin Associates, and Shawn Hunter at Dow Chemical.

1
1 Introduction First developed in 1995 at Argonne National Laboratory (ANL), the Greenhouse gases, Regulated Emissions, and Energy use in Transportation (GREET) model quantifies the energy consumption and emissions resulting from passenger vehicle transportation in the United States over the vehicle’s life cycle. The model includes fuel-cycle analysis (GREET 1.8) and vehicle-cycle analysis (GREET 2.7) to allow for a Well-to-Wheel accounting of energy consumption and air emissions for different conventional and alternative passenger vehicle systems. A schematic showing the stages covered in each component of the model is shown in Figure 1.1.
Figure 1.1: Total Energy Cycle for Transportation Technologies1
1.1 Project Description The Center for Sustainable Systems (CSS) was contracted to update the raw material production data used to calculate the environmental burdens from vehicle production within the GREET model. In addition, CSS also characterized some common material transformation processes used to manufacture vehicle components. Among the reasons for undertaking this project at this time were:
• The opportunity to update data for existing materials in the GREET model with more recent and/or higher quality data.
• The opportunity to acquire data for materials not currently found in GREET, but expected to have growing importance in the composition of vehicles in the future.
• As automobile manufacturers continue to improve use phase efficiency, the material production and manufacturing stages become more significant in determining total life cycle burdens of personal transportation. Thus representing vehicle manufacturing will become increasingly important.
• GREET data is used as a resource for other life cycle research, and thus the results of this project are expected to benefit future research.
1 Burnham, A., Wang, M., Wu, Y. (2006) Development and Applications of GREET 2.7: The Transportation Vehicle-Cycle Model. Argonne National Laboratory: Argonne, IL.
2
1.2 Scope 1.2.1 Environmental Burdens Consistent with GREET’s current scope, the following environmental pollutants and energy resources were considered:
• Criteria Air Pollutants: volatile organic compounds (VOCs), carbon monoxide (CO), nitrogen oxides (NOx), sulfur oxides (SOx), and particulate matter (PM2.5 and PM10).
• Greenhouse Gas (GHG) emissions: carbon dioxide (CO2), methane (CH4), and nitrous oxide (N2O), and other significant GHGs where data are available such as Sulfur hexafluoride (SF6), perfluorocarbons (PFCs), and hydrofluorocarbons (HFCs).
• Energy resource consumption: Total primary energy, fossil energy resources (e.g., petroleum), energy carriers (e.g., diesel, electricity)
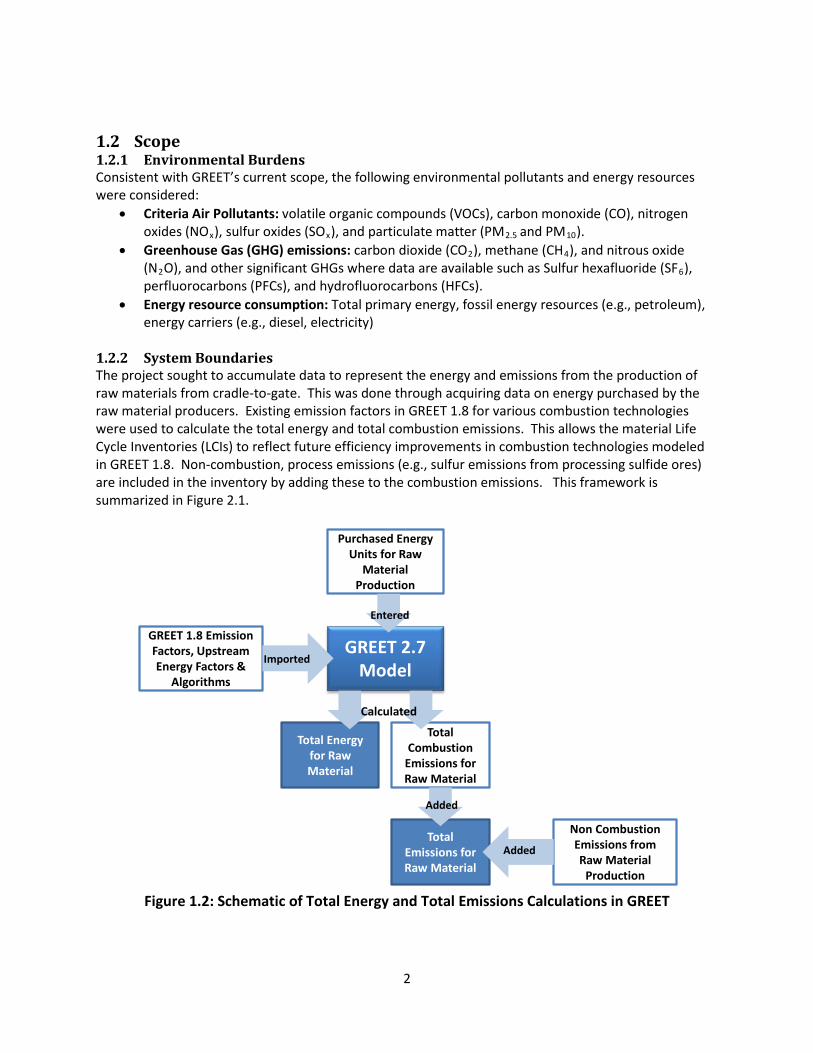
1.2.2 System Boundaries The project sought to accumulate data to represent the energy and emissions from the production of raw materials from cradle-to-gate. This was done through acquiring data on energy purchased by the raw material producers. Existing emission factors in GREET 1.8 for various combustion technologies were used to calculate the total energy and total combustion emissions. This allows the material Life Cycle Inventories (LCIs) to reflect future efficiency improvements in combustion technologies modeled in GREET 1.8. Non-combustion, process emissions (e.g., sulfur emissions from processing sulfide ores) are included in the inventory by adding these to the combustion emissions. This framework is summarized in Figure 2.1.
Figure 1.2: Schematic of Total Energy and Total Emissions Calculations in GREET
GREET 2.7 Model
GREET 1.8 Emission Factors, Upstream Energy Factors &
Algorithms
Purchased Energy Units for Raw
Material Production
Total Energy for Raw Material
Imported
Entered
Total Combustion
Emissions for Raw Material
Non Combustion Emissions from Raw Material
Production
EnteredTotal
Emissions for Raw Material
Calculated
Added
Added

3
Transportation of energy and materials within the raw material supply chain are included when the data are available. Transportation beyond the factory gate is excluded. 1.2.3 Materials Table 1.1 summarizes the changes being made to the material modules in GREET 2.7.
Table 1.1: Scope of Raw Materials Included within the Project Metals Plastics
Revised Materials Steel (Primary and Secondary) Aluminum (Primary and Secondary) Nickel (Primary) Copper (Primary)
Polypropylene HDPE Liquid Epoxy (replacing ‘Polyester’ in GREET)
New Materials to GREET LDPE
LLDPE Nylon 66 Nylon 6 Polycarbonate Polystyrene (General Purpose and High Impact) Polyvinyl Chloride Acrylonitrile-Butadiene-Styrene EPDM Epoxy Polyurethane (Rigid and Flexible Foam)
The materials currently examined in this project account for over 80% of the mass of raw material used in a conventional vehicle as modeled in GREET. Material recycling credits are not considered, but primary and secondary sources are quantified separately for metals when the data is available. 1.2.4 Production Stages GREET currently considers the production of metals in different production stages. Mining is modeled separately and processing of the extracted material is then modeled in one or more stages. Whenever possible, we attempted to preserve the separation of production stages and even add additional intermediate stages to the model. However, this was not always possible due to the way industry data is compiled and detail may actually be lost as a result. 1.2.5 Transformation Processes The research team compiled and reported on existing datasets for relevant material transformation processes (e.g., stamping, casting, etc.) used in vehicle manufacturing where this data was available. 1.2.6 Geographic Scope The geographic scope for the data is primarily North America. In cases where material production practices are similar among regions, data sets from these other regions (e.g., Europe) were used when the data are deemed to be of higher quality. Global data was also used as necessary to fill in data gaps.

4
1.2.7 Temporal Scope In general, the most recent data available prior to September 2011 (the conclusion of the project) for the respective raw materials was utilized. Older data was considered in cases where the data is deemed to be more representative or more complete.
1.3 Potential Sources of Discrepancy Every effort was made to represent the raw materials and transformation processes as accurately as possible with the GREET model, but some factors may contribute to discrepancies between the project results, existing GREET values, and other published results. These factors are summarized below:
• Different heating values: GREET relies on lower heating values (LHV) to calculate energy burdens while other sources prefer using higher heating values. In addition, heating values (whether higher or lower) can vary slightly among sources.
• Limited fuel classifications in GREET: The current GREET model relies on five main fuels and electricity to calculate total life cycle energy and emissions for each raw material. These categories are residual oil, diesel, natural gas, coal, electricity. Other published results for raw material production often have more diverse categorization schemes, which allow for more specific energy and emission factors to be applied. For this project, additional fuel categorizes were incorporated in the GREET raw material model spreadsheets in order to allow for more specific energy and emission factors to be used. The energy and emissions factors for these fuels were already contained in the GREET 1.8 fuel model spreadsheets. The new fuel categorization scheme is presented in Table 1.2.
Table 1.2: Fuel Categories and Fuel Assignments in GREET
Existing Categories Proposed Additions to GREET Residual oil Diesel Natural gas Coal Electricity Crude Oil LPG Gasoline Residual Oil Heavy Fuel Oil Light Fuel Oil
Diesel Distillate Oil
Natural gas
Coal
Electricity Uranium (used in electricity generation)
Crude Oil LPG Propane
Gasoline
In addition, the following material-specific fuel categories were necessary in order to model materials:
o Coke (steel) o Coke Oven Gas (steel) o Blast Furnace Gas (steel) o Internal Offgas from Natural Gas/Oil (plastics)
• Ancillary material burdens: Energy and emissions associated with ancillary materials are
excluded in GREET model. In this project, lime production was modeled for steel making. Other published data may account for burdens from more ancillary materials.
• Feedstock energy: Feedstock energy for plastic resin production is typically included in published sources. However, it does not appear that feedstock energy was included in existing GREET due to the fact that combustion emissions are calculated as if all fuel sources are combusted. If feedstock energy was considered, a certain portion of the input fuels should have been excluded from combustion.
• Upstream factors: For all materials except aluminum, GREET calculates energy and emission results based on an electricity grid mix that the user can select. The default is the

5
average U.S. grid mix. For some industries, this grid mix may not be representative of the actual sources used to generate the electricity purchased.
• By-product allocations: The GREET model does not allocate energy and emission burdens to waste products that are sold to other industries outside of the raw material production system. Other published results sometimes allocate a portion of the energy consumption and resulting emissions to these waste products based on factors such as mass or economic value.
2 Methods and Results The methods for compiling purchased energy and non-combustion emissions are discussed below. Additions or alterations to the GREET model need to incorporate these data are also presented. Total energy and emissions results were calculated using the GREET model. The results are presented in the same format as the GREET spreadsheet model. The number of significant digits displayed should not be interrupted as an indication of precision.
2.1 Metals 2.1.1 Steel Material Production and Transformation 2.1.1.1 Description of Process Steps The two dominant steel production methods are described below. Integrated Mills – These steel mills produce virgin steel product using mined iron ore although some steel scrap is usually recycled in the process as well. The steps in producing steel in an integrated mill are summarized below:
• Limestone and Lime – Limestone is extracted and processed into lime. Both are used as fluxes to capture impurities in the steel making process.
• Mining – Iron-bearing rock is extracted out of the earth. • Ore Pelletizing -- The rock is crushed into fine particles, and the iron ore within the rock is
separated out using magnets. This powder of iron ore is heated to form iron ore pellets. • Sintering –Sinter is formed from steelmaking waste products such as iron ore powder, coke
breeze, and limestone or other flux materials. These ingredients are fused together with heat and then crushed into smaller pieces to be added to the blast furnace.
• Coke Production – Coal is crushed and baked in ovens to remove impurities leaving a high-carbon fuel for steel making.
• Blast Furnace – Iron ore pellets, sinter, and coke are added to the blast furnace. Limestone helps remove impurities, which float to the top of the furnace and are removed as slag. The coke combusts in the furnace and the resulting product is liquid pig iron.
• Basic O2 Processing – Liquid iron is added to the basic oxygen furnace along with oxygen to reduce the carbon content of the iron, thus converting it into steel.
• Rolling – Steel is cast into steel slabs and rolled through a series of rollers into steel sheets. The rolling process begins with heated steel (hot rolling), but further rolling is often done on cold sheet steel (cold rolling) to further reduce thickness and achieve desirable material characteristics.
• Galvanizing – A thin zinc coating is often applied to cold rolled steel in order to prevent corrosion.

6
Mini Mills – In these mills, steel scrap is fed into a furnace and is melted by means of an electric arc from an electrode lowered into the furnace. While both of these production approaches can be used to produce a variety of steel material, integrated mills typically specialize in producing flat rolled products such a sheet steel and mini-mills tend to specialize in the production of long products such as rod and bar stock. Thus, steel production was represented using the appropriate mill type for each steel form. Steel sheet products are often manufactured into auto parts by means of a stamping press equipped with a die that transforms the material into the desirable shape. Steel bar and rod may be machined into necessary forms, but these processes were not explored in this project. Scrap steel processing activities were not modeled in this project. Steel scrap input in the BOF is assumed to be composed of internally generated scrap. No energy burdens are assigned to this scrap at this stage. Instead, the scrap generated in subsequent unit processes reduces process yields (% metal output/metal input), which increases the amount of liquid steel demanded from the BOF to produce sheet steel product. The production of steel is summarized in flow chart in Figure 2.1.

7
Figure 2.1: Steel Production Flowchart
2.1.1.2 Data Source(s) Data from the Athena Sustainable Materials Institute served as the basis for the results presented in this project. The data is detailed in Cradle-To-Gate Life Cycle Inventory: Canadian and U.S. Steel Production by Mill Type2. The report represents both basic oxygen furnace (BOF) and electric arc furnace (EAF) production methods. Due to the complexity of the steel making process, the authors synthesized the data into reference plants to represent each production approach. The data represent the production of steel from the extraction of ore through the manufacture of semi-finished steel products including sheet, plate, rod, bar, and section products. The data for the production of limestone and lime are given as well.
2 Athena Sustainable Materials Institute (2003) Cradle-To-Gate Life Cycle Inventory: Canadian and U.S. Steel Production by Mill Type. Based on reports by Markus Engineering Services.
Limestone Extraction and
Processing
Ore Extraction and Processing
Coke Production
Sintering
Blast Furnace
Basic Oxygen Furnace
Hot Rolling Skin Mill
Cold Rolling
Galvanizing
Steel Scrap
Stamping
Rod and Bar Mill
Electric Arc Furnace
Steel Auto Parts
MINI MILL
INTEGRATED MILL

8
Data Quality The Athena report is a revision of separate BOF and EAF reports which were produced 1993-1994. The extent of the revisions and the time period of the primary data collection were not reported. Energy and material data is presented by process stage. Other Data Sources Additional data for the project was sought from the World Steel Association (formerly the International Iron and Steel Institute). World Steel is compiling data for the production to semi-finished steel products. This data is more recent than the Athena data, but World Steel was not able to provide results with the necessary degree of detail within the timeframe of this project. 2.1.1.3 Data Preparation for GREET Four different steel types were used to represent the steel material used for vehicle manufacturing. Each material’s relative contribution to the curb weight of the vehicle is presented in Table 2.1.
Table 2.1: Mass Fraction of Steel Type in Conventional Vehicle3 Steel sheet products (hot rolled, cold rolled, and galvanized) were assumed to be formed by stamping while steel from EAF processing was modeled as rod/bar stock with no further processing. The steps for preparing the Athena data for incorporation into GREET are outline below.
1. Synthesizing process stages: The Athena report presents mass and energy balances for steelmaking processes. Some of these processes were combined and renamed to provide a simpler format for the GREET model. This reorganization is summarized in Table 2.2 and Table 2.3 for Integrated and Mini Mills, respectively.
Table 2.2: Integrated Mill Process Stages GREET Process Stage Represented Athena Process Stages Limestone Extraction and Processing • Limestone Extraction (for blast furnace and
sinter plant) • Limestone Extraction (to make lime) • Burnt Lime Production • Dolomitic Lime Production
Ore Extraction and Processing • Ore Exploration and Development • Hematite Ore (mining, crushing,
concentrating, pelletizing) • Magnetite Ore (mining, processing)
Coke Production • Coke Ovens Sintering • Sintering Plant Blast Furnace • Blast Furnaces
3 Sullivan et al. (1998) A Life Cycle Inventory of a Generic U.S. Family Sedan—Overview of Results, USCAR AMP Project. Proceedings of Total Life Cycle Conference and Exposition. Society of Automotive Engineers, Graz, Austria.
Steel Material Mass % Galvanized 44.0% EAF 26.4% Hot Rolled 15.5% Cold Rolled 14.1%

9
• Stoves • Boilers (whole plant) • Steam to Produce Electricity
(turbines/generators) Basic O2 Processing • BOF
• Steelmaking Ladles • Caster (includes casting tundishes)
Hot Rolling Mill • Hot Strip Mill Skin Mill • Skin Mill Cold Rolling • Cold Mill Complex (includes annealing,
pickling, & cleaning) Galvanizing • Galvanizing Line Stamping
• Not from Athena Data--Retained from the previous version of GREET
Table 2.3: Mini Mill Process Stages Electric Arc Furnace • EAF – Shapes
• Ladle Metallurgy Furnace (LMF) – Shapes • Billet Caster
Rod and Bar Mill • Rod and Bar Mill
2. Add fuel energy by process stage: The energy associated with the input fuels was summed for each process stage in GREET. The creation of coke, blast furnace gas, and coke oven gas were credited as negative values. Fossil fuels that were used as feedstock sources were presented separately. The following fuel categorizes were used:
• Residual oil (included fuel oil) • Diesel (included gasoline) • Natural gas used • Coal • Electricity • Oil as feed • Natural Gas as feed • Coal as feed • Coke • Blast furnace gas • Coke oven gas
In the ‘Hematite Ore’ stage in the Athena data ‘Light Fuel Oil’ and ‘Fuel Oil’ are each shown as contributing 725,225 GJ of energy toward the production of 1,870,390 tons of ore. It was assumed this value was duplicated because only ‘Fuel Oil’ is shown among the specific energy values. Thus, the 725,225 GJ value was represented as residual oil. The energy from the boiler plant was included along with the blast furnace stage; however steam from the boiler plant was used in other process stages. The portion of the fuels combusted to provide this exported steam was reported separately in the case of the rolling mills and other finishing operations. Thus, the input of combustion fuels in the boiler plant was adjusted accordingly so that these fuels were allocated to the processes in which the steam was utilized.

10
Tar and Benzene are by-products of the steelmaking process and are sold outside the system. These were not credited in this project.
3. Add non-combustion emissions by process stage: The data presented in the Athena report separated emissions into combustion and process emissions for the integrated mill. Non-combustion emissions were added together for each process stage. The following corrections and modifications were made to the data:
• Emissions for ‘Ore Exploration and Development’ were labeled as combustion, but no fuel data was presented and thus these emissions were included as non-combustion emissions.
• Emissions for the ‘Sintering Plant’ included process emissions for the wind box. It was assumed that coke oven gas was the primary fuel combusted in this operation. Thus combustion factors for coke oven gas were used to calculate the combustion emissions for the stage. These were subtracted from the wind box process emissions and the remaining emissions were included as non-combustion emissions.
• Emissions data for mini mills were not separated between combustion and non-combustion emissions. For the ‘EAF-Shape’ and ‘Billet Caster’ stages, emission factors for the combustion of natural gas were used to calculate combustion emissions. These were then subtracted from the reported emissions, and the remaining emissions were assumed to be process emissions.
4. Calculation of mass balance of intermediate products: Material flows were calculated from the reference plants in the Athena report. In the case of the integrated mill, only hot rolled, cold rolled, and galvanized sheet products were modeled for GREET, thus the mass balance through the final rolling stages were adjusted to meet the desired mass portion. Figure 2.2 summarizes the flow of intermediate material through the final production stages into sheet products.

11
Figure 2.2: Material Flow of Intermediate Steel Products through Rolling and Stamping (per
ton of steel product)
5. Alterations to GREET model: The previous GREET model was altered as follows: • Emission factors for the combustion blast furnace gas and coke oven gas were added to
GREET based on factors given in the Athena report. • Categories for blast furnace and coke oven gas credits were added so the both the
generation and consumption these gases within a process stage could be accounted for separately.
• The calculation of total the energy from coke, coke oven gas, and blast furnace gas was summed along with coal energy for calculating the total primary coal energy consumed. The upstream energy from these coal-byproduct fuels was calculated in the same manner as coal itself based on the energy of the fuel. Credits for coke oven gas and blast furnace gas in a particular stage reduced the total energy consumed in the stage in which they were generated. The energy associated with these by-product gasses was accounted for in stages in which they were combusted.
0.283 Hot Rolled Sheet
Hot Rolling
Skin Mill Cold Rolling
Galvanizing
Stamping
1.411
1.369
1.082
0.770
0.256
0.801Galvanized Sheet
1.000Stamped Steel Product
1.340
0.287
1.027 Cold Rolled Sheet

12
2.1.1.4 Total Energy and Emissions Results4 The total energy and emissions results for steel are summarized in Table 2.4 and Table 2.5 below. Results for hot rolled sheet are also presented for comparison with the USLCI Database.
Table 2.4: Comparison of Virgin Steel Data
Updated Updated GREET 2.7 GREET 2.7 USLCI Database
Values Values
(Final Product) (Hot Rolled) (Final Product) (Rolled Steel) (Hot Rolled) Energy Use (mmBtu/ton)
Total Energy 50.750 26.701 38.771 23.293 21.639 Fossil fuels 48.110 25.559 37.856 22.909 Coal 34.272 20.186 24.233 16.691 Natural gas 11.033 3.494 11.936 5.025 Petroleum 2.804 1.879 1.688 1.193 Total Emissions (g/ton)
VOC 3949.152 2817.717 536.021 360.117 188.232 CO 28666.748 20727.160 108,869.120 81,120.454 22,594.331 NOx 4048.560 2042.527 3,602.296 2,237.815 2,560.439 PM10 3872.456 2165.683 14,593.847 10,632.276 PM2.5 1424.213 857.951 6,303.381 4,627.528 SOx 10662.420 6077.278 1,988.177 1,023.602 3,920.672 CH4 3386.972 1203.032 5,181.747 2,986.783 1,024.212 N2O 28.561 10.780 30.362 16.444 CO2 3,911,899 2,072,497 4,587,856 3,034,020 2,060,381 CO2 (VOC,CO,CO2) 3,969,255 2,113,850 4,760,607 3,162,617 GHGs 4,062,441 2,147,138 4,899,199 3,242,187 2,085,986
4 Note about total energy and emissions values in this report: In order to better understand the data compiled for this project and make comparisons with the material production and processing burdens in the GREET 2.7 model and other sources, it was necessary to incorporate the data into the GREET model. Frequently, alterations to the model itself were required in order to input the data (e.g. adding additional process stages and/or fuels) to generate energy and emissions results. The values that were output from this process may differ somewhat from values in subsequent versions of the GREET model released by Argonne National Laboratory due to differences in modeling the material production and transformation itself as well as other changes to the fuel cycle portions of the model. The project results are provided for reference only.

13
Table 2.5: Comparison of Recycled Steel Data5 Updated GREET 2.7 Values
(EAF Steel) (EAF Steel) Energy Use (mmBtu/ton) Total Energy 21.108 29.337 Fossil fuels 18.901 27.564 Coal 11.455 8.281 Natural gas 7.023 18.847 Petroleum 0.423 0.436 Total Emissions (g/ton) VOC 927.752 202.475 CO 3707.204 5,080.603 NOx 1907.773 2,144.607 PM10 2715.878 1,653.773 PM2.5 626.808 499.548 SOx 4268.510 2,691.319 CH4 2495.758 4,449.723 N2O 21.873 28.111 CO2 1,619,186 1,928,235 CO2 (VOC, CO, CO2) 1,627,903 1,936,850 GHGs 1,696,815 2,056,470
Energy values for virgin steel are higher than previous GREET values, while the GHG totals are lower. In EAF steel, the energy and GHG results were both lower. The discrepancy is likely due to more comprehensive modeling in this project for the production of sheet steel than in the GREET 2.7 model. The ratio of GHG emissions to total energy demand for the GREET 2.7 virgin steel values is significantly higher than this project or for other published results, which might indicate a modeling error associated the emissions calculations for virgin steel in GREET 2.7. 2.1.1 Aluminum 2.1.1.1 Description of Process Stages
• Bauxite mining – Aluminum is found mainly in tropical/subtropical areas and recovered from open pit mines. Beneficiation (washing, drying, screening, etc.) is required for ores from forested areas and included in this stage.
• Alumina Production (Bayer) – Al2O3 (alumina) is produced by grinding bauxite then reacting it with caustic soda and calcined lime. Alumina is precipitated out of this reaction and is then calcined to remove water.
• Anode Production – For use in electrolysis, petrol coke is calcined, ground, and blended with pitch to form blocks/briquettes that are baked, and then cooled to form the anode.
• Electrolysis (Hall-Heroult) – A steel pot (acting as the cathode) is filled with a molten cryolite bath and alumina. The anode is suspended in the bath and a current is run through the circuit. Aluminum is reduced during this process and tapped out of the pot daily. Consumption of the anode results in non-combustion SOX and PFC emissions.
• Ingot Casting – Molten metal is transferred from steel pots into a holding furnace, where its composition is altered to form the desired alloy. Fluxing the molten metal with chlorine/nitrogen or carbon monoxide/argon/chlorine removes impurities and gas content. An in-line filter removes any oxides that have formed during the processing. The metal is then cast into an ingot and cooled.
5 See footnote 4 on page 12

14
2.1.1.2 Data Source(s) The Aluminum Association (AA), a U.S. based aluminum industry group, sources primary production data from the International Aluminum Institute (IAI) surveys. The Aluminum Association published a life cycle assessment in 2010 for the aluminum can industry that addressed primary and secondary aluminum production in the United States6. This AA (2010) report is intended to be representative of 2006 North American industry data and was prepared by PE Americas. Because the AA (2010) report was specific to the aluminum can industry which has particular recycling procedures that are not necessary representative of aluminum recycling in general, another source was needed to for an accurate representation of secondary aluminum production. In 1998, the Aluminum Association published a report entitled “Life Cycle Inventory Report for the North American Aluminum Industry” (AA 1998). This LCI provides information from 1995 as part of the United States Automotive Materials Partnership (USAMP) initiative. This source was deemed to be the best available data for secondary aluminum production and aluminum transformation processes. The GREET stages of Bauxite Mining, Alumina Production (Bauxite Refining), Electrolysis (Alumina Reduction), and Aluminum Melting and Casting were updated with data from AA (2010). The ‘Anode Production’ stage is new to GREET. Data Quality No transportation or upstream data is included in the AA datasets, so the system boundary is around the facility only. Other Data Sources The International Aluminium Institute (IAI) produced a life cycle inventory documenting worldwide primary aluminum production in September 2007 using 2005 inventory data.7 The IAI results cover the following percentages of primary aluminum production: 85% Africa, 87% North America, 24% Latin America, 14% Asia, 78% Europe, 100% Oceania. Data for China is not available. This data source was not used due to the fact that more recent data from the IAI was used to inform the 2010 AA LCA. Additionally, the IAI report intends to characterize worldwide aluminum production, while the AA report focuses on North American production. Also, industry contacts were familiar with the AA report and recommended it as the best available data. 2.1.1.3 Data Preparation for GREET Primary Aluminum Energy
1. Calculate purchased energy values by fuel: AA (2010) data given in physical units of purchased energy. GREET heating values used to convert to mmBtu/ton.
2. Allocation to fuel categories: Heavy fuel oil is assumed to be residual oil and hard coal is assumed to be “coal” for AA(2010) data for the purposes of input into GREET.
3. Inputting grid mix for Hall-Heroult process: Grid mixes reported by AA are input into “user-defined” grid mix; GREET uses this as the electricity mix for Hall-Heroult process. This mix is shown in Table 2.6. Electricity mix for other process stages is assumed to be GREET’s U.S. mix.
6 Aluminum Association (2010) http://www.aluminum.org/Content/ContentFolders/LCA/LCA_REPORT.pdf 7 International Aluminum Institute (2007) Life Cycle Assessment of Aluminium: Inventory Data for the Primary Aluminium Industry – Year 2005 Update. http://www.world-aluminium.org/UserFiles/File/LCA.pdf

15
Table 2.6: Electricity Grid Mix Input in GREET Model for Hall-Heroult Process
Generating Source Percentage Hydropower 69.4% Coal 29.7% Oil 0.0% Natural Gas 0.6% Nuclear 0.3%
Primary Aluminum Non-Combustion Emissions
1. Modeling SO2 from anode production: AP-42 is the primary compilation of EPA’s emission factor information. The most recent edition8 was published in 1995. This methodology was used to model SOx emissions and is summarized below: AP-42 Equations (SOx emissions)
Anode baking furnace, uncontrolled SO2 emissions (excluding furnace fuel combustion emissions):
40(𝐶)(𝑆) × (1 − 0.01𝐾) 𝑙𝑏𝑠/𝑡𝑜𝑛
Prebake (reduction) cell, uncontrolled SO2 emissions: 0.4(𝐶)(𝑆)(𝐾) 𝑙𝑏𝑠/𝑡𝑜𝑛
where: C = Anode consumption* during electrolysis, lb anode consumed/lb Al produced S = % sulfur in anode before baking K = % of total SO2 emitted by prebake (reduction) cells. *Anode consumption weight is weight of anode paste (coke + pitch) before baking.
Inputs to AP-42 Equations:
C = 0.446 kg anode/kg Al from DOE EERE 20039 S = 3% according to AP-42 (this assumes use of Eastern U.S. coal) K = 21%, BCS reports 21% of pitch to be volatilized, it is assumed that the same distribution of sulfur will be lost during baking (anode production)
2. CO2 emissions: Emissions data from the DOE EERE 2003 report was used to model CO2
emissions from the anode production and consumption process stages.
3. PFC emissions: IAI reported emissions for CF4 and C2F6 from reporting facilities for 2009 and used Global Warming Potentials from the IPCC 2nd Assessment.10 IAI estimates Chinese industry
8 U.S. EPA (1995) AP-42, Compilation of Air Pollutant Emission Factors. http://www.epa.gov/ttnchie1/ap42/ 9 U.S. DOE EERE (2003) U.S. Energy Requirements for Aluminum Production - Historical Perspective, Theoretical Limits and New Opportunities. Based on report by BCS, Inc. http://www.secat.net/docs/resources/US_Energy_Requirements_for_Aluminum_Production.pdf 10 IPCC (2007) Fourth Assessment on Climate Change: Table 2.14 (Errata) http://www.ipcc.ch/publications_and_data/ar4/wg1/en/errataserrata-errata.html

16
emissions and reports the global emission factor in units of kgCO2e/ton Al. This is then converted from metric units and input into GREET. The IAI publishes PFC emission data on an annual basis.11 This data is presented in Table 1.1Table 2.7.
Table 2.7: PFC Emissions during Primary Aluminum Production
IAI (2009) Units CF4 0.069 kg/ton Al GWP - CF4 7,390 CO2eq C2F6; R116 0.008 kg/ton Al GWP - C2F6 12,200 CO2eq Total PFCs 535 kgCO2e/ton Al
Secondary Aluminum Secondary Aluminum data is sourced from AA (1998).12 All values are in the form of purchased energy and converted to mmBtu/ton. Because the report did not provide data on scrap processing, therefore, only the remelting/casting stage is considered. “Scrap Preparation” and “Al Recycling” stages were retained from previous GREET model. Transformation Processes Transformation stages were defined as those coming after the “Ingot Casting” stage in the AA (1998) study. All values are in the form of purchased energy and converted to mmBtu/ton. The transformation process stages included were:
• hot rolling, cold rolling, and stamping (referred to collectively as ‘wrought aluminum’) • extrusion • shape casting
Stamping data was not present in the AA report, and thus the existing stamping data in GREET as retained. According to the AA study, aluminum use for automotive applications is 73.8% cast aluminum, 22.8% extruded aluminum, and 3.4% rolled aluminum. Table 2.8, Table 2.9, and Table 2.10 show total energy and emissions results using the project values. Given that the reported roll-up inventory values for bauxite for each type of aluminum product were the same as those for prime ingot in the dataset, it was assumed there were no material losses occurring during these unit processes in order to calculate the values in these tables. An alternative mass input-output ratio could be calculated by assuming that manufactured scrap generated during each is recycled within each unit process. Thus, the mass of the prime ingot entering into these transformation stages would be the difference between the “metal” input and the “manufactured scrap”. This approach would increase the energy and emissions values by 2.1% for wrought aluminum, 21.2% for cast aluminum, and 0.5% for extruded aluminum product.
11 IAI (2010) Results of the 2009 Anode Effect Survey. http://www.world-aluminium.org/Sustainability/Environmental+Issues/Greenhouse+gases/PFCs 12 AA (1998) Life Cycle Inventory Report for the North American Aluminum Industry. Based on USAMP LCI methodology developed by Roy F. Weston, Inc.

17
2.1.1.4 TotalEnergyandEmissionsResults13
Table 2.8: Total Energy and Emissions Results for Wrought Aluminum (per ton) Updated GREET 2.7 Aluminum Assoc. Values (aluminum ingot) Energy Use (mmBtu/ton) Total Energy 164.955 157.507 133.256 Fossil fuels 112.681 119.724 Coal 75.912 61.487 Natural gas 24.849 41.381 Petroleum 11.920 16.855 Total Emissions(g/ton) VOC 924.751 1,018.729 CO 2,824.190 3,396.301 NOx 12,502.462 13,428.240 2,013.540 PM10 29,411.160 31,975.284 8,308.120 PM2.5 11,591.450 13,539.925 SOx 43,049.522 34,351.349 20,207.960 CH4 14,540.617 16,319.137 N2O 118.043 126.263 CO2 12,937,641 10,574,404 CO2 (VOC, CO, CO2) 12,944,961 10,578,253 GHGs 14,183,513 11,023,858 10,031,420
Table 2.9: Total Energy and Emissions Results for Cast Aluminum (per ton) Updated GREET 2.7 Aluminum Assoc. Values (aluminum ingot) Energy Use (mmBtu/ton) Total Energy 115.352 132.856 133.256 Fossil fuels 78.414 96.572 Coal 50.612 54.477 Natural gas 19.325 26.210 Petroleum 8.478 15.885 Total Emissions(g/ton) VOC 637.742 843.946 CO 1960.924 2,850.783 NOx 8657.103 11,390.999 2,013.540 PM10 20542.094 30,659.443 8,308.120 PM2.5 8204.027 13,150.997 SOx 29883.924 31,947.068 20,207.960 CH4 10269.891 12,642.084 N2O 80.990 99.560 CO2 8,964,457 8,820,725 CO2 (VOC, CO, CO2) 8,969,526 8,827,835 GHGs 9,859,002 9,173,556 10,031,420
13 See footnote 4 on page 12

18
Table 2.10: Total Energy and Emissions Results for Extruded Aluminum (per ton) Updated GREET 2.7 Aluminum Assoc. Values
(aluminum ingot)
Energy Use (mmBtu/ton) Total Energy 111.635 133.256 Fossil fuels 74.604 Coal 51.267 Natural gas 14.844 Petroleum 8.493 Total Emissions(g/ton) VOC 613.999 CO 1891.841 NOx 8415.892 2,013.540 PM10 20663.393 8,308.120 PM2.5 8229.564 SOx 30014.169 20,207.960 CH4 9519.356 N2O 76.862 CO2 8,767,493 CO2 (VOC, CO, CO2) 8,772,380 GHGs 9,641,862 10,031,420
The reduction in Total Energy relative to previous GREET values is likely due to industry efforts to increase efficiency and decrease GHG emissions. Industry reports a higher total energy due to their use of GaBi 4.3 to calculate Total Energy. Discrepancy in SOx emissions between industry and GREET is likely due to emissions control technology that is not taken into account by AP-42. Increased GHG emissions from previous GREET findings is likely due to the inclusion of PFCs not accounted for previously in GREET. 2.1.2 Nickel 2.1.2.1 Description of Process Stages
• Mining – This stage includes all processes up to point of delivery to the “Beneficiation” process. The inventory accounts for both surface and underground mining.
• Beneficiation – Nickel ore undergoes crushing, grinding and flotation and leaves this stage as nickel concentrate for use in “Primary Extraction.”
• Primary Extraction – Hydrometallurgical and pyrometallurgical processes convert nickel concentrate into nickel matte (a.k.a. smelting). Facilities using both processes were modeled and accounted for using a weighted average of the primary extraction facilities who reported.
• Refining – Nickel matte undergoes crushing, leaching, separation, and electrolysis to form the final nickel product.
2.1.2.2 Data Source(s) The Nickel Institute provides life cycle data through its website14 that was compiled by Ecobalance, Inc. The report was published in 2000 based on 1998 data. This study accounted for 87% of Western world nickel production and 55% total world nickel production. Currently, Russia, Indonesia, and the
14 Nickel Institute (2000) http://www.nickelinstitute.org/index.cfm?ci_id=205&la_id=1 Accessed June 8, 2011.

19
Philippines are the top three nickel producing countries according to USGS, but they are not included in the Nickel Institute report. More than 75% of primary nickel production energy use is due to smelting and refining. Therefore, overall energy consumption of nickel production is highly dependent on the grid mix of the producing country. According to USGS, about half of U.S. imports are currently from Canada. Since this data encompasses the majority of Western world production in 2000, it should be representative of the majority of North American nickel consumption. Data Quality For this NI (2000) study, purchased energy values are not given. Instead results are aggregated with upstream energy and presented as primary energy values. Energy and emissions attributed to capital equipment (i.e., building energy, transport of steel/concrete) are assumed to be negligible, less than 1%. Human activities involved in nickel production (e.g., driving to/from work, societal impacts, etc.) are neglected. The Nickel Institute acknowledges that this data is not the best representation of 2011 production due to a change in ore profile (more lateritic, less sulfidic) and new production facilities (using different process technologies). However, they are unable to identify any other possible data sources. This data is from a 1998 facility-level survey and is intended to be representative of 2000 technology. When 1998 data was not available, a previous year’s data was used as long as production processes were similar. Missing production data is ignored in weighted average results; the collected data (87%) is presumed to be representative of Western world production. Secondary data are used to model upstream materials production (e.g., fuel, auxiliary materials, electricity, etc.), transportation, and any other modeling or production data within the study boundaries not attainable by nickel production facilities. The secondary data sources include: • Ecobalance’s database, DEAM15 • Engineer calculations • Bibliographic sources Other Data Sources A secondary and possibly more reliable data source is available from Matthew Eckelman, a post-doc at Yale’s Center for Industrial Ecology. He worked with the Nickel Institute to develop a facility-level greenhouse gas emissions assessment of the global Nickel industry. His paper16 was published in Resources, Conservation, and Recycling in 2010 and is able to provide data. Unfortunately, he could not provide the data in time to include in this project.
15 Ecobilan Data for Environmental Analysis and Management. https://www.ecobilan.com/uk_deam.php 16 Eckelman, Matthew (2010) Facility-level energy and greenhouse gas life-cycle assessment of the global nickel industry. http://www.sciencedirect.com/science/article/pii/S0921344909001852

20
2.1.3 Data Preparation for GREET 1. Compile energy values: Primary nickel production process stages (mining, beneficiation, primary
extraction, refining) are separated into electricity, energy, upstream materials, and transportation components. The Nickel Institute only provides Total/Primary Energy values.
2. Units conversion: The Nickel Institute reports the mass of Coal, Oil, Natural Gas, Uranium used in primary nickel production. This data is converted to units of mmBtu/ton using GREET heating values.
3. Determination of grid mix: The percentage of fuels allocated to electricity for each process stage is summed; this total is used to determine the electricity grid mix. This mix is input into GREET for the purposes of using Excel Solver to determine delivered energy values.
4. Allocating energy in mining: For the purposes of calculating the electricity grid mix, 50% of energy used in the mining stage is assumed to be in the form of electricity.
5. Non-combustion emissions: No data were available to model, thus GREET2.7 values were used. 6. Purchased energy calculation: Because the Nickel Institute reported only total/primary energy,
Excel Solver was used to back-calculate purchased energy through the GREET model. The method is described below:
o All purchased fuels are to be greater than zero. o Coal, natural gas, and petroleum total energy values are set equal to reported values.
Lower bounds are placed on the 5 purchased energy cells to insure the solution does not result in negative energy values for purchased fuels. Excel solver seeks to get as close to the reported total energy value as possible. See Figure 2.3 below.
o Inputs were placed into Rows 28-32 and the Solver function attempted to get “Total Energy” (Row 28) as close to 181.836 mmBtu/ton as possible, while constraining Coal, Natural Gas, and Oil to be values in the Table 2.11 below.
o Note: Uranium was not input as a constraint, because it is not a fuel currently present in the GREET model
o Rows 23-27 were designated as the variable cells that Solver could change in order to achieve its objective. These are the purchased energy cells and the resulting values that Solver determined are presented in Table 2.12.

21
Figure 2.3: Screenshot of Excel Solver Setup Used for Purchased Energy Calculation
Table 2.11: Total Energy for Nickel Production Input into Excel Solver
Overall Mining
Beneficiation Primary Extraction
Refining
Coal 33.229 0.997 1.661 22.596 7.975 Natural Gas 72.962 1.459 0.730 50.344 20.429 Oil 73.407 1.468 1.468 68.268 2.936 Residual Oil
Uranium 2.238 0.045 0.045 0.716 1.455 Electricity
Total - Nickel Institute 181.836 3.969 3.904 141.924 32.796
Table 2.12: Purchased Energy Outputs from Excel Solver for Nickel Production
Overall Mining
Beneficiation Primary Extraction
Refining
Coal Natural Gas 55.087 1.000 0.119 37.372 16.547 Oil Residual Oil 61.092 1.136 0.972 58.700 1.655 Uranium Electricity 17.359 0.528 0.878 11.600 4.316 Total - GREET 133.537 2.663 1.969 107.672 22.518
22
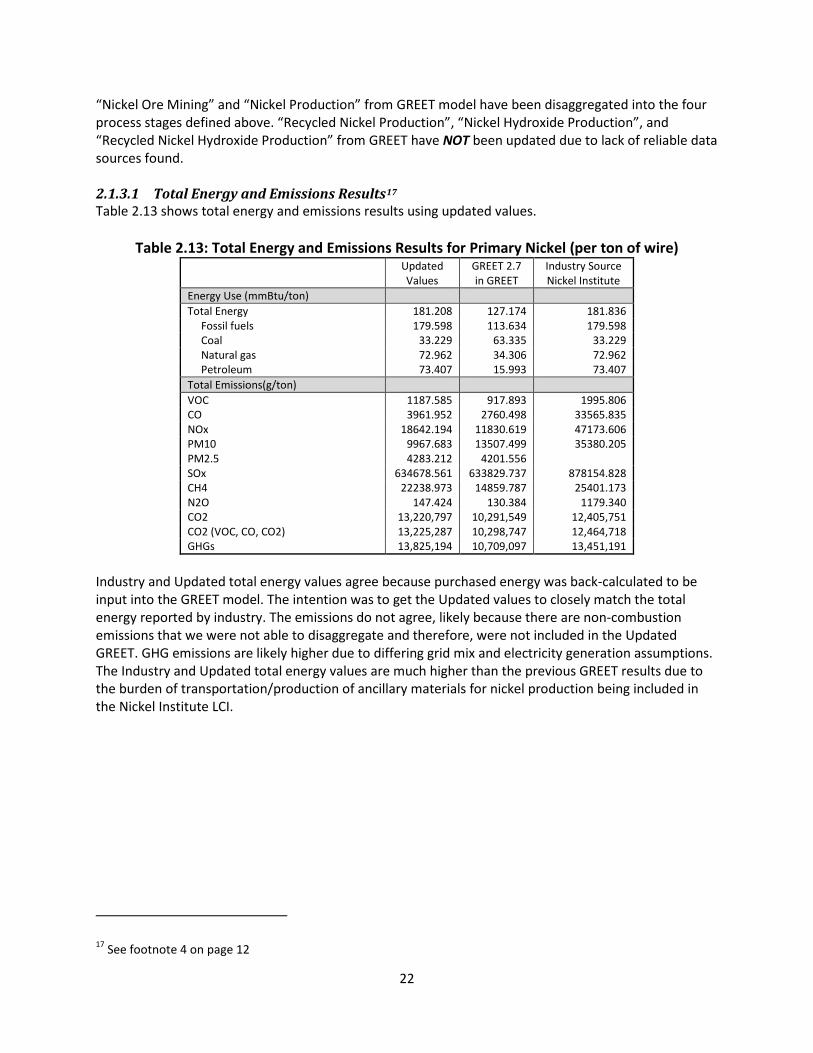
“Nickel Ore Mining” and “Nickel Production” from GREET model have been disaggregated into the four process stages defined above. “Recycled Nickel Production”, “Nickel Hydroxide Production”, and “Recycled Nickel Hydroxide Production” from GREET have NOT been updated due to lack of reliable data sources found. 2.1.3.1 Total Energy and Emissions Results17 Table 2.13 shows total energy and emissions results using updated values.
Table 2.13: Total Energy and Emissions Results for Primary Nickel (per ton of wire) Updated GREET 2.7 Industry Source Values in GREET Nickel Institute Energy Use (mmBtu/ton) Total Energy 181.208 127.174 181.836 Fossil fuels 179.598 113.634 179.598 Coal 33.229 63.335 33.229 Natural gas 72.962 34.306 72.962 Petroleum 73.407 15.993 73.407 Total Emissions(g/ton) VOC 1187.585 917.893 1995.806 CO 3961.952 2760.498 33565.835 NOx 18642.194 11830.619 47173.606 PM10 9967.683 13507.499 35380.205 PM2.5 4283.212 4201.556 SOx 634678.561 633829.737 878154.828 CH4 22238.973 14859.787 25401.173 N2O 147.424 130.384 1179.340 CO2 13,220,797 10,291,549 12,405,751 CO2 (VOC, CO, CO2) 13,225,287 10,298,747 12,464,718 GHGs 13,825,194 10,709,097 13,451,191
Industry and Updated total energy values agree because purchased energy was back-calculated to be input into the GREET model. The intention was to get the Updated values to closely match the total energy reported by industry. The emissions do not agree, likely because there are non-combustion emissions that we were not able to disaggregate and therefore, were not included in the Updated GREET. GHG emissions are likely higher due to differing grid mix and electricity generation assumptions. The Industry and Updated total energy values are much higher than the previous GREET results due to the burden of transportation/production of ancillary materials for nickel production being included in the Nickel Institute LCI.
17 See footnote 4 on page 12

23
2.1.4 Copper 2.1.4.1 Description of Process Stages
• Mining –Copper ores, mainly sulfide ores, are mining from both underground mines and open pit mines.
• Beneficiation – Ore is ground, then gravity, flotation, and organic chemicals are used to concentrate the copper to ~25%.
• There are two dominant methods for refining copper: o Pyrometallurgical Processing
Pre-treatment – Drying and roasting of copper to remove water (SO2 also removed)
Smelting/Reduction – copper is reduced using siliceous mixture Refining – Electrolysis used to refine copper into copper cathode, which is then
re-melted and cast before undergoing transformation processes o Hydrometallurgical Processing (This method is not considered in this project)
Pre-treatment – grinding or roasting of ore Leaching – likely dump or heap leaching, sulfuric acid or ammonia-based
solution applied to ore, soluble copper released from the ore Electrowinning – electrolysis to separate copper from solution
2.1.4.2 Data Sources Fthenakis et al. conducted a LCI for metals used in the production of photovoltaics18. Copper was included among these metals. The article and supporting report19 aim to represent production in US and Canada. Data Quality Energy data was derived using published values from several copper producers. The distribution of energy among different fuels types was calculated using the fossil fuel distribution from the Manufacturing Energy Consumption Survey20 for nonferrous metal production (excluding aluminum production). The non-combustion emissions reported were derived from Toxics Release Inventory data for Kennecott Utah Copper. In terms of sulfur capture, the authors acknowledge this operation has “one of cleanest copper smelters in the world”. Therefore, sulfur emissions data was deemed to be unrepresentative of the North American copper industry as a whole and additional data contained within the article was used to calculate a SOx emissions value.
18 Fthenakis, V., Wang, W., & Kim, H. C., 2009. Life cycle inventory analysis of the production of metals used in photovoltaics. Renewable and Sustainable Energy Reviews, 13(3), 493-517. 19 Fthenakis, V., Wang, W., & Kim, H. C., 2007. Life cycle inventory analysis of the production of metals used in photovoltaics. Brookhaven National Laboratory, BNL-77919-2007. 20 Manufacturing energy consumption survey, 2002. Table 1.2 First Use of Energy for All Purposes (Fuel and Nonfuel), 2002. Energy Information Administration.
24
2.1.4.3 Other Data Sources International Copper Association (ICA) – Cradle-to-gate life cycle inventory for copper production in the U.S. and Europe. Scott Baker, Director of the Environment Program at ICA, indicated that this study is currently in the process of peer review. It was not released in time for inclusion in this report, but this has the potential to be a valuable resource for future versions of GREET. Chilean Copper Commission – Chile accounts for about one third of worldwide primary copper production. The Chilean Copper Commission has kept track of energy and emissions from the copper industry for the past decade. Yearly data is available on their website. Metalytics – Using IEA data, a Northgate paper from CSIRO in Australia, and proprietary data, Metalytics has compiled energy consumption and GHG emissions data for aluminum, copper, and nickel. The energy data is broken down by process stage, but not by fuel type. The data was presented at the Joint ILZSG –ICSG –INSG Energy and Climate Change Policy Seminar in April 2009 in Lisbon, Portugal. 2.1.4.4 Data Preparation for GREET
1. Energy values converted: Energy data (allocated on a mass basis) were converted into the appropriate energy units.
2. Particulate emissions: The particulate emissions reported were assumed to be PM10. PM2.5 was assumed to be half of PM10 emissions.
3. Sulfur oxide emissions: As previously discussed, the SOx emissions data was deemed to represent advanced copper processing and not the industry as a whole. In order to get a value that was more representative of the North American copper industry, a weighted average SOx emission factor (125,927 g/ton of Cu) of all the NA copper smelters referenced in the article was calculated.
2.1.4.5 Transformation Processes It is assumed that copper being used in the automobile is largely copper wire. It is also assumed that 1 kg primary copper forms 1 kg of copper wire. Copper wire transformation data is sourced from the Sullivan, Burnham, and Wang report21 produced in September 2010. Purchased energy units are converted into mmBtu/ton and input into the GREET model as a separate unit process stage.
21 Sullivan, J. L., Burnham, A., and Wang, M. (2010) Energy-Consumption and Carbon-Emission Analysis of Vehicle and Component Manufacturing. Argonne National Laboratory.
25
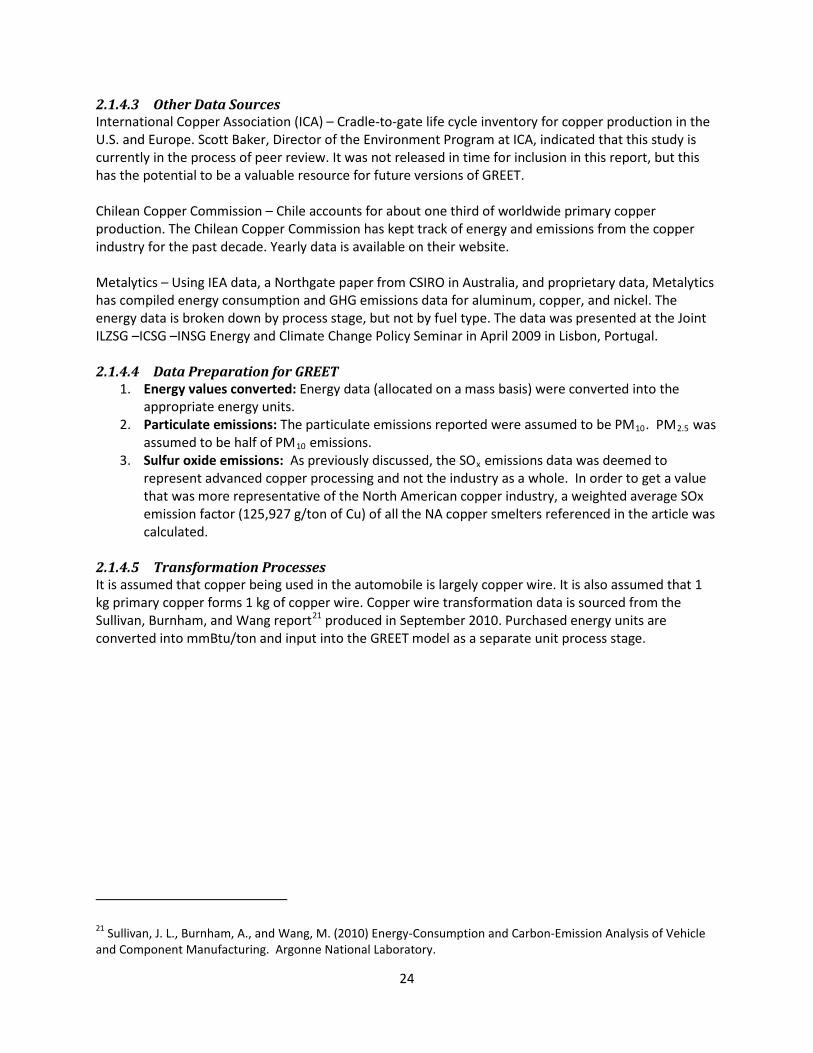
2.1.4.6 Total Energy and Emissions Results22 Table 2.14 shows total energy and emissions results using updated values.
Table 2.14: Total Energy and Emissions Results for Primary Copper (per ton of wire) Updated GREET 2.7 Values in GREET Energy Use (mmBtu/ton) Total Energy 43.299 95.706 Fossil fuels 43.299 90.137 Coal 3.334 26.203 Natural gas 36.309 37.620 Petroleum 3.656 26.314 Total Emissions(g/ton) per ton VOC 475.308 666.630 CO 2010.997 2144.665 NOx 4156.742 9624.947 PM10 1174.039 7493.291 PM2.5 532.643 2860.383 SOx 127210.089 195054.269 CH4 6942.755 12162.939 N2O 57.020 88.318 CO2 2,838,004 7,355,950 CO2 (VOC, CO, CO2) 2,840,283 7,361,398 GHGs 3,030,844 7,691,790
The decrease in copper energy intensity compared to GREET 2.7 more likely a reflection of the variability in copper energy data and modeling rather than significant improvements in the production of copper. Fthenakis et al. review other energy data for the production of copper and found values ranging from 21.8 GJ/mton (21.9 mmBtu/ton) to 164.2 GJ/mton (171.5 mmBtu/ton). It is likely this project’s results underestimate the energy intensity of copper production. The mining energy is based on a 3% ore concentration, which requires significantly less electricity to process than the lower grade ores that are typically extracted. In addition, only pyrometallurgical processing, which has a lower energy demand compared to hydrometallurgical processing, were considered.
22 See footnote 4 on page 12

26
2.2 Plastics 2.2.1 High-Density Polyethylene (HDPE) Resin Production 2.2.1.1 Description of Process Steps
• Extraction and refining of crude oil and natural gas. • Manufacture of olefin (ethylene) from processed natural gas and refined oil. • Production of HDPE resin from ethylene.
2.2.1.2 Data Source(s) The Plastics Division of the American Chemistry Council (ACC) (formerly American Plastics Council) was determined to have the best available life cycle inventory data for North American production of HDPE resin. Franklin Associates completed a report, Cradle-To-Gate Life Cycle Inventory of Nine Plastic Resins and Four Polyurethane Precursors, in February 2011 for ACC that, along with accompanying appendices, documents energy requirements and emissions for the production of HDPE resin.23,24
Primary data for ethylene production were gathered from eight thermal-cracking units in the U.S. and Canada for production year 2003. Primary data for HDPE production were gathered from five plants in the U.S. and Canada for production year 2003.
Data Quality These data were compiled by Franklin Associates, a well-respected life cycle practitioner, and as such, the results were deemed to be of high quality. Total non-combustion emissions from the ACC report included emissions due to upstream fuel production for transportation. Although transportation energy was not included in the final results of this GREET update report, the non-combustion emissions from transportation were not removed. As energy for transportation is minimal, it is likely that non-combustion emissions from fuel production for transportation would be quite small and have little effect on total emissions.
Other Data Sources PlasticsEurope, a trade association of plastic manufacturers with representation in 31 European countries, also has LCI data for HDPE resin production.25 This is a good alternative data source, where, as of February 2011, the total energy result for HDPE resin differed by 8% from ACC value. However, the geographic scope of this dataset is not North American.
23 American Chemistry Council (ACC), Plastics Division (2011) Final Report: Cradle-to-Gate Life Cycle Inventory of Nine Plastic Resins and Four Polyurethane Precursors. Based on reports by Franklin Associates. http://plastics.americanchemistry.com/LifeCycle-Inventory-of-9-Plastics-Resins-and-4-Polyurethane-Precursors-Rpt-Only 24 American Chemistry Council (ACC), Plastics Division (2011) Final Appendices:Cradle-to-Gate Life Cycle Inventory of Nine Plastic Resins and Four Polyurethane Precursors. Based on reports by Franklin Associates. http://plastics.americanchemistry.com/LifeCycle-Inventory-of-9-Plastics-Resins-and-4-Polyurethane-Precursors-APPS-Only 25 PlasticsEurope (2010) The Plastics Portal: Eco-profiles. http://www.plasticseurope.org/plastics-sustainability/eco-profiles.aspx

27
2.2.1.3 Data Preparation for GREET The following steps were used to prepare data from the ACC report for insertion into the GREET model.
1. Add fuel energy: The energy associated with process fuels was summed to find the “energy use” input for GREET. Fossil fuels that were used for feedstock sources or transportation were presented separately. The following fuel categorizes were used:
o Residual oil o Diesel (included distillate oil) o Natural gas (NG) o Coal o Electricity o LPG o Gasoline o Internal offgas from NG o Internal offgas from oil o Oil as feed o NG as feed
• Physical units of purchased energy for feedstock, process, and transportation energy were drawn from Table B-1 of the ACC report appendices.
• Data were manipulated to convert reference flow from 1000 lbs resin to 2000 lbs (1 ton) resin.
• Energy values were converted from physical units to mmBtu/ton resin using LHV factors found in GREET 1.8.c.
• Internal offgas26 energy values were drawn from the “Total Energy” column from appendices Table B-1, then manipulated to convert reference flow from 1000 lbs to 1 ton resin.
• Recovered Energy values were determined in the same manner as internal offgas. • Recovered energy was excluded from the total as it was not possible to model in GREET
using the data currently available, and it comprises only 1-2% of total “energy use.”
2. Add Non-combustion emissions: The data presented in the ACC report separated emissions into combustion and process (non-combustion) emissions. Non-combustion emissions were reported in GREET. • Data for non-combustion emissions were taken from the “process emissions” column from
Table 2-4 from the ACC report and converted to grams per ton of resin.
3. Alterations to GREET model: The previous GREET model was altered as follows: • LPG; gasoline; and internal offgas from oil and NG fuel categories were added. • A column to report feedstock energy separately in GREET was added. • Combustion of natural gas, petroleum, and internal offgas in the hydrocracker for olefin
production creates an emissions profile different from standard combustion of natural gas and petroleum in an industrial boiler. To correctly account for these emissions, emissions factors (in g/mmBtu of natural gas) unique to each olefin must be multiplied by the amount
26 Internal offgas results from the combustion of petroleum and natural gas feedstock in the hydrocracker. The energy from combustion is used in the production process and must be accounted for in process energy.

28
(in mmBtu) of natural gas combusted for each olefin needed to produce a particular resin. Hydrocracker emissions for ethylene, propylene, pyrolysis gas, and butadiene were provided by Franklin Associates and are available in the U.S. LCI Database (see Appendix). The following steps were taken so that the GREET model would accurately reflect emissions from the olefin production stage.
o Emission factors from the hydrocracker for each olefin were added to GREET. o The portion of natural gas combusted for the plastic resin during the production of
each olefin was calculated using weights of material inputs provided in the ACC report appendices for each unit process. For HDPE, 4.422 mmBtu of natural gas was combusted per ton of resin for production of ethylene.
o In the calculations of total emissions, total mmBtu of natural gas used for olefin production was subtracted from the amount of natural gas combusted in an industrial boiler in order to avoid double counting of emissions (4.422 mmBtu for HDPE). The amount of natural gas used for each olefin was multiplied by the olefin’s respective emissions profile.
4. Transportation energy: GREET does not currently include transportation of plastic resins in its model. Transportation data was compiled for possible future use by ANL. (See Appendix) • Transportation data were reported in both purchased energy and mmBtu per ton of resin. • Transportation energy requirements were also reported in terms of mode of transport and
ton-miles per ton of resin. 2.2.1.4 Total Energy and Emissions Results27 Table 2.15 shows total energy and emissions results for HDPE resin production using updated values. Also presented are total energy and emissions results previously in GREET and from the ACC report. Note that the ACC reported HHV for total energy. This would account for a 5-10% difference in updated and industry results. The large increase in updated total energy over the total energy value previously in GREET could be due to inclusion of feedstock energy in the updated values.
27 See footnote 4 on page 12
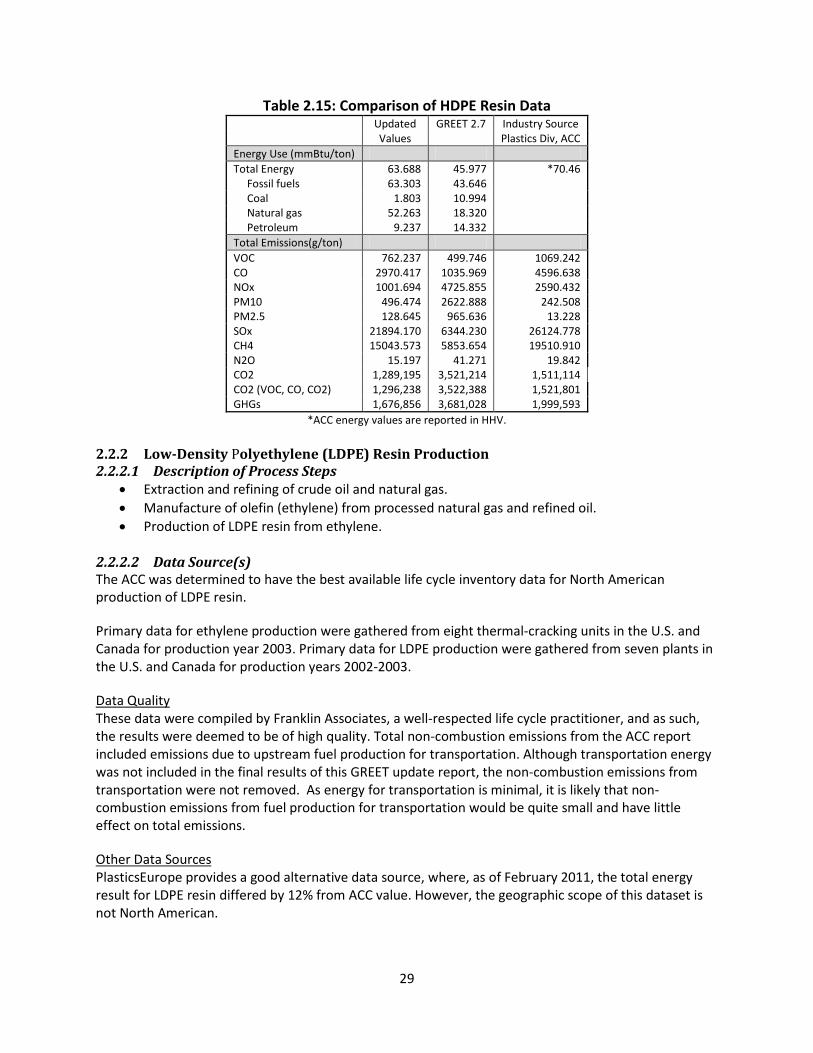
29
Table 2.15: Comparison of HDPE Resin Data Updated GREET 2.7 Industry Source Values
Plastics Div, ACC
Energy Use (mmBtu/ton) Total Energy 63.688 45.977 *70.46 Fossil fuels 63.303 43.646 Coal 1.803 10.994 Natural gas 52.263 18.320 Petroleum 9.237 14.332 Total Emissions(g/ton) VOC 762.237 499.746 1069.242 CO 2970.417 1035.969 4596.638 NOx 1001.694 4725.855 2590.432 PM10 496.474 2622.888 242.508 PM2.5 128.645 965.636 13.228 SOx 21894.170 6344.230 26124.778 CH4 15043.573 5853.654 19510.910 N2O 15.197 41.271 19.842 CO2 1,289,195 3,521,214 1,511,114 CO2 (VOC, CO, CO2) 1,296,238 3,522,388 1,521,801 GHGs 1,676,856 3,681,028 1,999,593
*ACC energy values are reported in HHV. 2.2.2 Low-Density Polyethylene (LDPE) Resin Production 2.2.2.1 Description of Process Steps
• Extraction and refining of crude oil and natural gas. • Manufacture of olefin (ethylene) from processed natural gas and refined oil. • Production of LDPE resin from ethylene.
2.2.2.2 Data Source(s) The ACC was determined to have the best available life cycle inventory data for North American production of LDPE resin.
Primary data for ethylene production were gathered from eight thermal-cracking units in the U.S. and Canada for production year 2003. Primary data for LDPE production were gathered from seven plants in the U.S. and Canada for production years 2002-2003.
Data Quality These data were compiled by Franklin Associates, a well-respected life cycle practitioner, and as such, the results were deemed to be of high quality. Total non-combustion emissions from the ACC report included emissions due to upstream fuel production for transportation. Although transportation energy was not included in the final results of this GREET update report, the non-combustion emissions from transportation were not removed. As energy for transportation is minimal, it is likely that non-combustion emissions from fuel production for transportation would be quite small and have little effect on total emissions.
Other Data Sources PlasticsEurope provides a good alternative data source, where, as of February 2011, the total energy result for LDPE resin differed by 12% from ACC value. However, the geographic scope of this dataset is not North American.
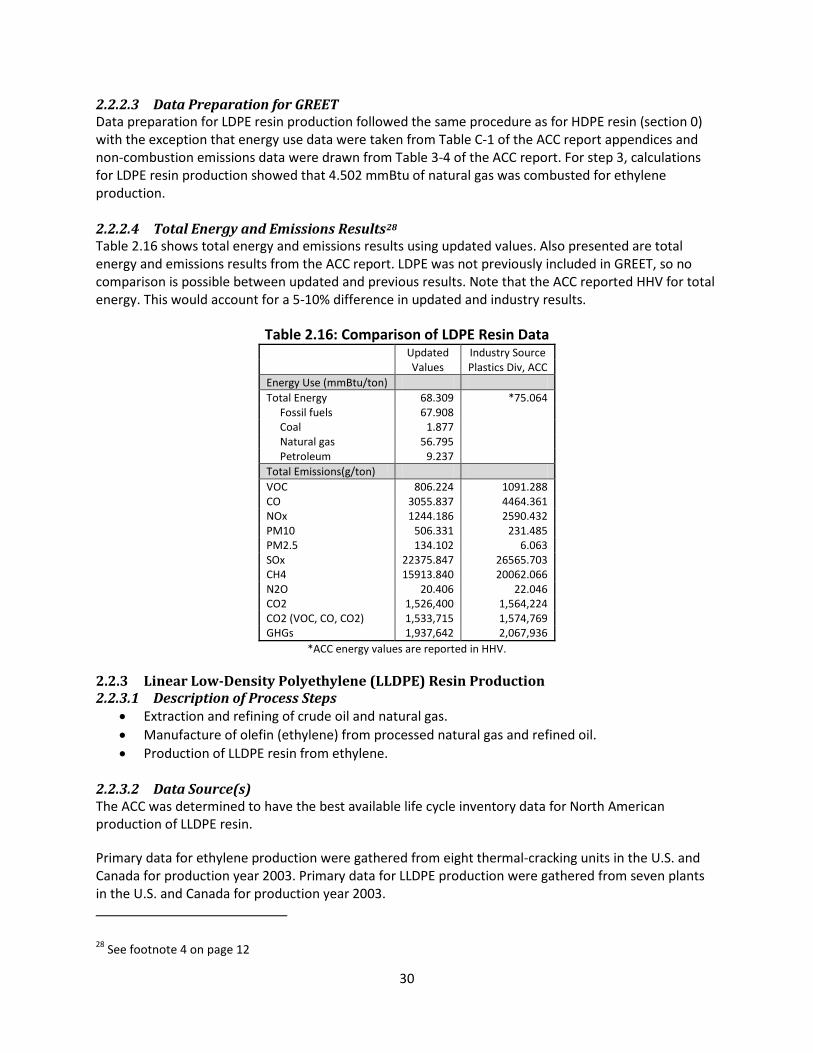
30
2.2.2.3 Data Preparation for GREET Data preparation for LDPE resin production followed the same procedure as for HDPE resin (section 0) with the exception that energy use data were taken from Table C-1 of the ACC report appendices and non-combustion emissions data were drawn from Table 3-4 of the ACC report. For step 3, calculations for LDPE resin production showed that 4.502 mmBtu of natural gas was combusted for ethylene production. 2.2.2.4 Total Energy and Emissions Results28 Table 2.16 shows total energy and emissions results using updated values. Also presented are total energy and emissions results from the ACC report. LDPE was not previously included in GREET, so no comparison is possible between updated and previous results. Note that the ACC reported HHV for total energy. This would account for a 5-10% difference in updated and industry results.
Table 2.16: Comparison of LDPE Resin Data Updated Industry Source Values Plastics Div, ACC Energy Use (mmBtu/ton) Total Energy 68.309 *75.064 Fossil fuels 67.908 Coal 1.877 Natural gas 56.795 Petroleum 9.237 Total Emissions(g/ton) VOC 806.224 1091.288 CO 3055.837 4464.361 NOx 1244.186 2590.432 PM10 506.331 231.485 PM2.5 134.102 6.063 SOx 22375.847 26565.703 CH4 15913.840 20062.066 N2O 20.406 22.046 CO2 1,526,400 1,564,224 CO2 (VOC, CO, CO2) 1,533,715 1,574,769 GHGs 1,937,642 2,067,936
*ACC energy values are reported in HHV.
2.2.3 Linear Low-Density Polyethylene (LLDPE) Resin Production 2.2.3.1 Description of Process Steps
• Extraction and refining of crude oil and natural gas. • Manufacture of olefin (ethylene) from processed natural gas and refined oil. • Production of LLDPE resin from ethylene.
2.2.3.2 Data Source(s) The ACC was determined to have the best available life cycle inventory data for North American production of LLDPE resin.
Primary data for ethylene production were gathered from eight thermal-cracking units in the U.S. and Canada for production year 2003. Primary data for LLDPE production were gathered from seven plants in the U.S. and Canada for production year 2003. 28 See footnote 4 on page 12

31
Data Quality These data were compiled by Franklin Associates, a well-respected life cycle practitioner, and as such, the results were deemed to be of high quality. Total non-combustion emissions from the ACC report included emissions due to upstream fuel production for transportation. Although transportation energy was not included in the final results of this GREET update report, the non-combustion emissions from transportation were not removed. As energy for transportation is minimal, it is likely that non-combustion emissions from fuel production for transportation would be quite small and have little effect on total emissions.
Other Data Sources PlasticsEurope provides a good alternative data source, where, as of February 2011, the total energy result for LLDPE resin differed by 13% from ACC value. However, the geographic scope of this dataset is not North American.
2.2.3.3 Data Preparation for GREET Data preparation for LLDPE resin production followed the same procedure as for HDPE resin (section 0) with the exception that energy use data were taken from Table D-1 of the ACC report appendices and non-combustion emissions data were drawn from Table 4-4 of the ACC report. For step 3, calculations for LLDPE resin production showed that 4.462 mmBtu of natural gas was combusted for ethylene production. 2.2.3.4 Total Energy and Emissions Results29 Table 2.17 shows total energy and emissions results using updated values. Also presented are total energy and emissions results from the ACC report. LLDPE was not previously included in GREET, so no comparison is possible between updated and previous results. Note that the ACC reported HHV for total energy. This would account for a 5-10% difference in updated and industry results.
Table 2.17: Comparison of LLDPE Resin Data Updated Industry Source Values Plastics Div, ACC Energy Use (mmBtu/ton) Total Energy 63.500 *70.256 Fossil fuels 63.169 Coal 1.547 Natural gas 52.433 Petroleum 9.190 Total Emissions(g/ton) VOC 767.095 1080.265 CO 3014.566 4519.476 NOx 1771.366 2480.200 PM10 426.794 209.439 PM2.5 111.877 11.023 SOx 22381.806 26345.240 CH4 15055.686 19731.372 N2O 30.070 38.581 CO2 2,395,936 1,541,263 CO2 (VOC, CO, CO2) 2,403,064 1,551,861 GHGs 2,788,417 2,040,378
*ACC energy values are reported in HHV.
29 See footnote 4 on page 12
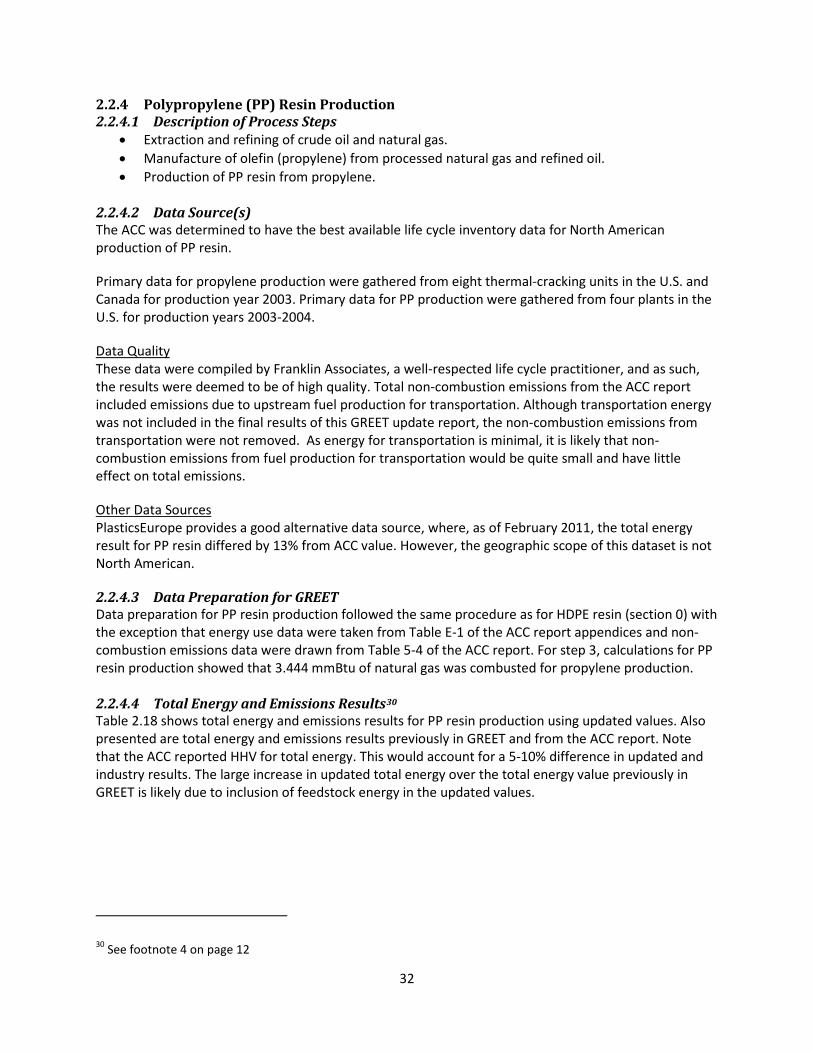
32
2.2.4 Polypropylene (PP) Resin Production 2.2.4.1 Description of Process Steps
• Extraction and refining of crude oil and natural gas. • Manufacture of olefin (propylene) from processed natural gas and refined oil. • Production of PP resin from propylene.
2.2.4.2 Data Source(s) The ACC was determined to have the best available life cycle inventory data for North American production of PP resin.
Primary data for propylene production were gathered from eight thermal-cracking units in the U.S. and Canada for production year 2003. Primary data for PP production were gathered from four plants in the U.S. for production years 2003-2004.
Data Quality These data were compiled by Franklin Associates, a well-respected life cycle practitioner, and as such, the results were deemed to be of high quality. Total non-combustion emissions from the ACC report included emissions due to upstream fuel production for transportation. Although transportation energy was not included in the final results of this GREET update report, the non-combustion emissions from transportation were not removed. As energy for transportation is minimal, it is likely that non-combustion emissions from fuel production for transportation would be quite small and have little effect on total emissions.
Other Data Sources PlasticsEurope provides a good alternative data source, where, as of February 2011, the total energy result for PP resin differed by 13% from ACC value. However, the geographic scope of this dataset is not North American.
2.2.4.3 Data Preparation for GREET Data preparation for PP resin production followed the same procedure as for HDPE resin (section 0) with the exception that energy use data were taken from Table E-1 of the ACC report appendices and non-combustion emissions data were drawn from Table 5-4 of the ACC report. For step 3, calculations for PP resin production showed that 3.444 mmBtu of natural gas was combusted for propylene production. 2.2.4.4 Total Energy and Emissions Results30 Table 2.18 shows total energy and emissions results for PP resin production using updated values. Also presented are total energy and emissions results previously in GREET and from the ACC report. Note that the ACC reported HHV for total energy. This would account for a 5-10% difference in updated and industry results. The large increase in updated total energy over the total energy value previously in GREET is likely due to inclusion of feedstock energy in the updated values.
30 See footnote 4 on page 12
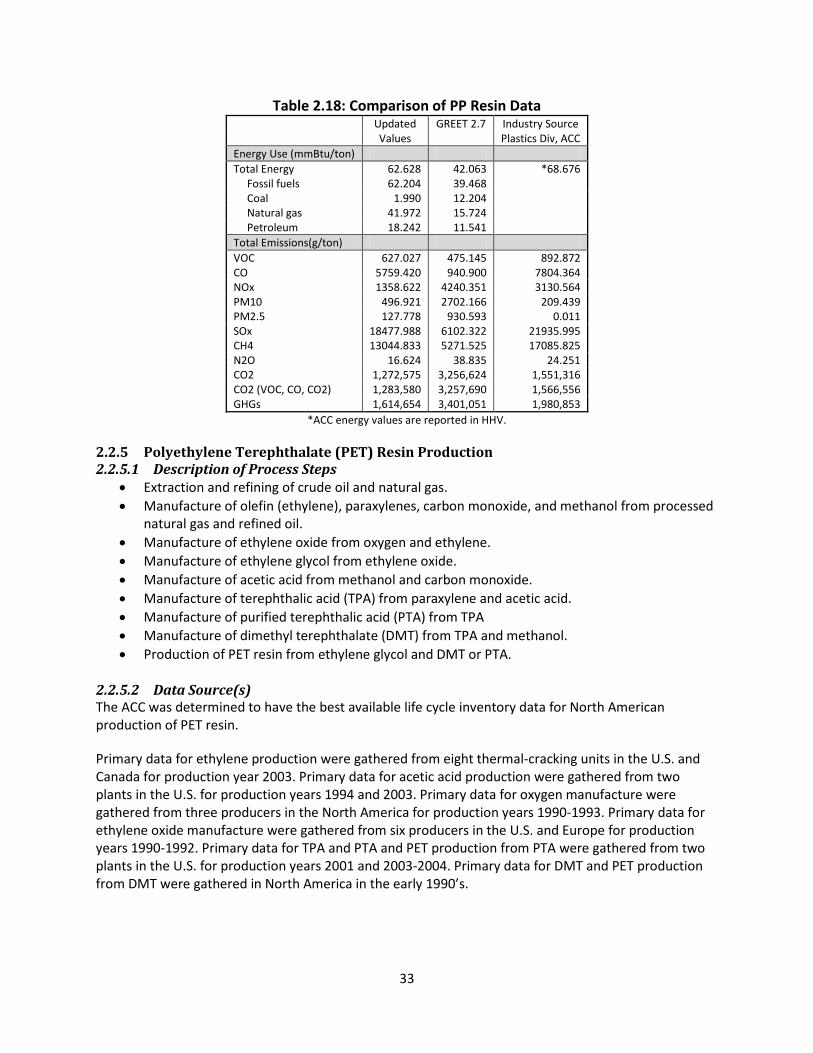
33
Table 2.18: Comparison of PP Resin Data Updated GREET 2.7 Industry Source Values
Plastics Div, ACC
Energy Use (mmBtu/ton) Total Energy 62.628 42.063 *68.676 Fossil fuels 62.204 39.468 Coal 1.990 12.204 Natural gas 41.972 15.724 Petroleum 18.242 11.541 Total Emissions(g/ton) VOC 627.027 475.145 892.872 CO 5759.420 940.900 7804.364 NOx 1358.622 4240.351 3130.564 PM10 496.921 2702.166 209.439 PM2.5 127.778 930.593 0.011 SOx 18477.988 6102.322 21935.995 CH4 13044.833 5271.525 17085.825 N2O 16.624 38.835 24.251 CO2 1,272,575 3,256,624 1,551,316 CO2 (VOC, CO, CO2) 1,283,580 3,257,690 1,566,556 GHGs 1,614,654 3,401,051 1,980,853
*ACC energy values are reported in HHV.
2.2.5 Polyethylene Terephthalate (PET) Resin Production 2.2.5.1 Description of Process Steps
• Extraction and refining of crude oil and natural gas. • Manufacture of olefin (ethylene), paraxylenes, carbon monoxide, and methanol from processed
natural gas and refined oil. • Manufacture of ethylene oxide from oxygen and ethylene. • Manufacture of ethylene glycol from ethylene oxide. • Manufacture of acetic acid from methanol and carbon monoxide. • Manufacture of terephthalic acid (TPA) from paraxylene and acetic acid. • Manufacture of purified terephthalic acid (PTA) from TPA • Manufacture of dimethyl terephthalate (DMT) from TPA and methanol. • Production of PET resin from ethylene glycol and DMT or PTA.
2.2.5.2 Data Source(s) The ACC was determined to have the best available life cycle inventory data for North American production of PET resin.
Primary data for ethylene production were gathered from eight thermal-cracking units in the U.S. and Canada for production year 2003. Primary data for acetic acid production were gathered from two plants in the U.S. for production years 1994 and 2003. Primary data for oxygen manufacture were gathered from three producers in the North America for production years 1990-1993. Primary data for ethylene oxide manufacture were gathered from six producers in the U.S. and Europe for production years 1990-1992. Primary data for TPA and PTA and PET production from PTA were gathered from two plants in the U.S. for production years 2001 and 2003-2004. Primary data for DMT and PET production from DMT were gathered in North America in the early 1990’s.

34
Data Quality These data were compiled by Franklin Associates, a well-respected life cycle practitioner, and as such, the results were deemed to be of high quality. Total non-combustion emissions from the ACC report included emissions due to upstream fuel production for transportation. Although transportation energy was not included in the final results of this GREET update report, the non-combustion emissions from transportation were not removed. As energy for transportation is minimal, it is likely that non-combustion emissions from fuel production for transportation would be quite small and have little effect on total emissions.
Other Data Sources PlasticsEurope provides a good alternative data source, where, as of February 2011, the total energy result for PET resin differed by 4% from ACC value. However, the geographic scope of this dataset is not North American.
2.2.5.3 Data Preparation for GREET Data preparation for PET resin production followed the same procedure as for HDPE resin production (section 0) with the exception that energy use data were taken from Table F-1 of the ACC report appendices and non-combustion emissions data were drawn from Table 6-4 of the ACC report. For step 3, calculations for PET resin production showed that 0.768 mmBtu of natural gas was combusted for ethylene production. 2.2.5.4 Total Energy and Emissions Results31 Table 2.19 shows total energy and emissions results for PET resin production using updated values. Also presented are total energy and emissions results previously in GREET and from the ACC report. Note that the ACC reported HHV for total energy. This would account for a 5-10% difference in updated and industry results. The large decrease in updated total energy over the total energy value previously in GREET could be due to the reduction of input materials to the final production stage. The ACC data show that PET resin production used less than one half the amount of ethylene glycol and two-thirds the amount of xylenes shown in the report used for previous GREET values.
31 See footnote 4 on page 12

35
Table 2.19: Comparison of PET Resin Data Updated GREET 2.7 Industry Source Values
Plastics Div, ACC
Energy Use (mmBtu/ton) Total Energy 55.563 74.537 *60.814 Fossil fuels 54.601 72.927 Coal 5.225 7.892 Natural gas 24.223 16.531 Petroleum 25.153 48.503 Total Emissions(g/ton) VOC 334.495 676.980 639.341 CO 12667.965 1730.703 18077.905 NOx 2367.272 9429.901 6657.960 PM10 1192.370 3585.871 319.670 PM2.5 404.794 1804.166 0.000 SOx 8673.291 12421.151 9060.999 CH4 9264.640 8101.291 13778.891 N2O 28.895 49.668 52.911 CO2 2,053,513 6,011,201 2,586,243 CO2 (VOC, CO, CO2) 2,074,463 6,013,162 2,617,046 GHGs 2,314,689 6,230,495 2,932,148
*ACC energy values are reported in HHV.
2.2.6 General Purpose Polystyrene (GPPS) Resin Production 2.2.6.1 Description of Process Steps
• Extraction and refining of crude oil and natural gas. • Manufacture of olefins (ethylene and pyrolysis gas) and naphtha from processed natural gas and
refined oil. • Manufacture of benzene from pyrolysis gas and naphtha. • Manufacture of styrene from benzene and ethylene. • Production of GPPS resin from styrene.
2.2.6.2 Data Source(s) The ACC was determined to have the best available life cycle inventory data for North American production of GPPS resin.
Primary data for ethylene and pyrolysis gas production were gathered from eight thermal-cracking units in the U.S. and Canada for production year 2003. Primary data for benzene production were gathered from one plant in the U.S. for production year 2003. Two other datasets for North American benzene production were collected in 1992. Primary data for ethylbenzene and styrene production were gathered from two plants in the U.S. for production years 2002-2003. A third dataset for North American ethylbenzene and styrene production was collected in 1993. Primary data for GPPS production were gathered from six plants in the U.S. for production years 2000-2003.
Data Quality These data were compiled by Franklin Associates, a well-respected life cycle practitioner, and as such, the results were deemed to be of high quality. Total non-combustion emissions from the ACC report included emissions due to upstream fuel production for transportation. Although transportation energy was not included in the final results of this GREET update report, the non-combustion emissions from transportation were not removed. As energy for transportation is minimal, it is likely that non-
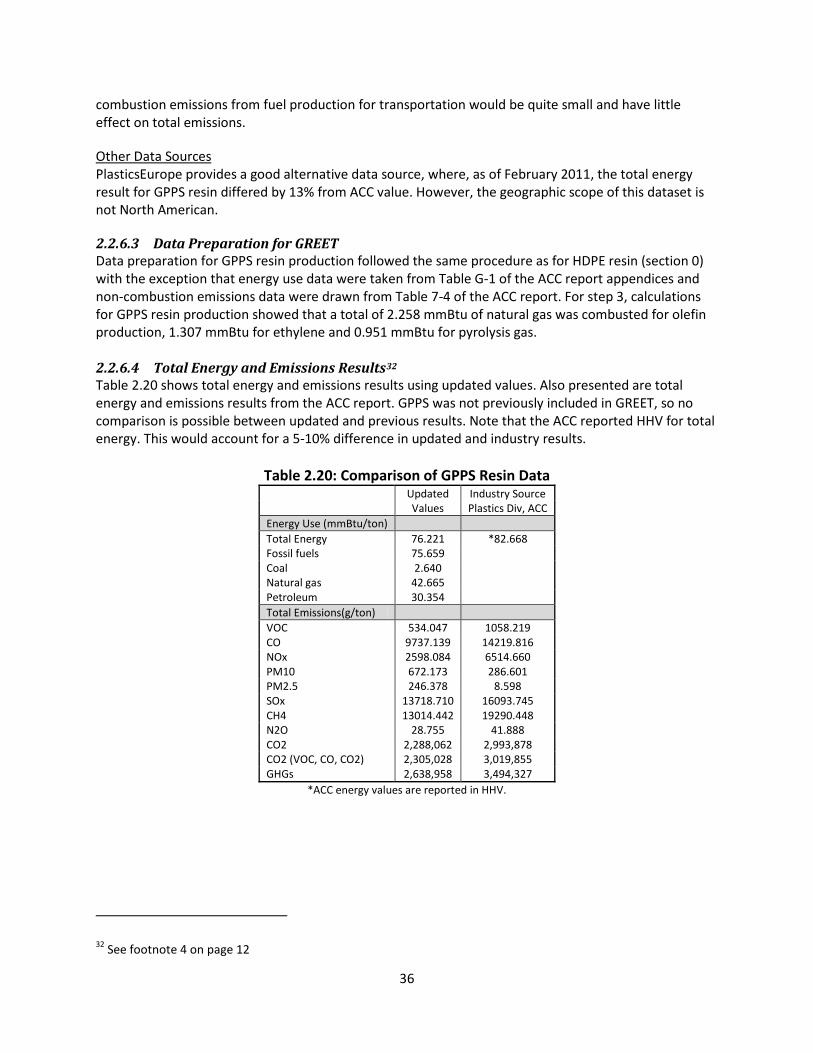
36
combustion emissions from fuel production for transportation would be quite small and have little effect on total emissions.
Other Data Sources PlasticsEurope provides a good alternative data source, where, as of February 2011, the total energy result for GPPS resin differed by 13% from ACC value. However, the geographic scope of this dataset is not North American.
2.2.6.3 Data Preparation for GREET Data preparation for GPPS resin production followed the same procedure as for HDPE resin (section 0) with the exception that energy use data were taken from Table G-1 of the ACC report appendices and non-combustion emissions data were drawn from Table 7-4 of the ACC report. For step 3, calculations for GPPS resin production showed that a total of 2.258 mmBtu of natural gas was combusted for olefin production, 1.307 mmBtu for ethylene and 0.951 mmBtu for pyrolysis gas. 2.2.6.4 Total Energy and Emissions Results32 Table 2.20 shows total energy and emissions results using updated values. Also presented are total energy and emissions results from the ACC report. GPPS was not previously included in GREET, so no comparison is possible between updated and previous results. Note that the ACC reported HHV for total energy. This would account for a 5-10% difference in updated and industry results.
Table 2.20: Comparison of GPPS Resin Data
Updated Industry Source
Values Plastics Div, ACC
Energy Use (mmBtu/ton) Total Energy 76.221 *82.668
Fossil fuels 75.659 Coal 2.640 Natural gas 42.665 Petroleum 30.354 Total Emissions(g/ton)
VOC 534.047 1058.219 CO 9737.139 14219.816 NOx 2598.084 6514.660 PM10 672.173 286.601 PM2.5 246.378 8.598 SOx 13718.710 16093.745 CH4 13014.442 19290.448 N2O 28.755 41.888 CO2 2,288,062 2,993,878 CO2 (VOC, CO, CO2) 2,305,028 3,019,855 GHGs 2,638,958 3,494,327
*ACC energy values are reported in HHV.
32 See footnote 4 on page 12

37
2.2.7 High-Impact Polystyrene (HIPS) Resin Production 2.2.7.1 Description of Process Steps
• Extraction and refining of crude oil and natural gas. • Manufacture of olefins (ethylene, pyrolysis gas, and butadiene) and naphtha from processed
natural gas and refined oil. • Manufacture of benzene from pyrolysis gas and naphtha. • Manufacture of styrene from benzene and ethylene. • Manufacture of polybutadiene from butadiene. • Production of HIPS resin from styrene, polybutadiene, and mineral oil.
2.2.7.2 Data Source(s) The ACC was determined to have the best available life cycle inventory data for North American production of HIPS resin.
Primary data for ethylene and pyrolysis gas production were gathered from eight thermal-cracking units in the U.S. and Canada for production year 2003. Primary data for butadiene production were gathered from three thermal-cracking units in the U.S. and Canada for production year 2003. Primary and secondary production data for polybutadiene production were collected in the 1970’s. Primary data for benzene production were gathered from one plant in the U.S. for production year 2003. Two other datasets for North American benzene production were collected in 1992. Primary data for ethylbenzene and styrene production were gathered from two plants in the U.S. for production years 2002-2003. A third dataset for North American ethylbenzene and styrene production was collected in 1993. Primary data for HIPS production were gathered from six plants in the U.S. for production years 2000-2003.
Data Quality These data were compiled by Franklin Associates, a well-respected life cycle practitioner, and as such, the results were deemed to be of high quality. Total non-combustion emissions from the ACC report included emissions due to upstream fuel production for transportation. Although transportation energy was not included in the final results of this GREET update report, the non-combustion emissions from transportation were not removed. As energy for transportation is minimal, it is likely that non-combustion emissions from fuel production for transportation would be quite small and have little effect on total emissions.
Other Data Sources PlasticsEurope provides a good alternative data source, where, as of February 2011, the total energy result for HIPS resin differed by 13% from ACC value. However, the geographic scope of this dataset is not North American.
2.2.7.3 Data Preparation for GREET Data preparation for HIPS resin production followed the same procedure as for HDPE resin (section 0) with the exception that energy use data were taken from Table H-1 of the ACC report appendices and non-combustion emissions data were drawn from Table 8-4 of the ACC report. For step 3, calculations for HIPS resin production showed that a total of 2.125 mmBtu of natural gas was combusted for olefin production, 1.225 mmBtu for ethylene, 0.155 mmBtu for butadiene, and 0.745 mmBtu for pyrolysis gas.

38
2.2.7.4 Total Energy and Emissions Results33 Table 2.21 shows total energy and emissions results using updated values. Also presented are total energy and emissions results from the ACC report. HIPS was not previously included in GREET, so no comparison is possible between updated and previous results. Note that the ACC reported HHV for total energy. This would account for a 5-10% difference in updated and industry results.
Table 2.21: Comparison of HIPS Resin Data Updated Industry Source Values Plastics Div, ACC Energy Use (mmBtu/ton) Total Energy 76.892 *83.44 Fossil fuels 76.321 Coal 2.683 Natural gas 43.271 Petroleum 30.368 Total Emissions(g/ton) VOC 549.841 1069.242 CO 9669.043 14219.816 NOx 2578.898 6602.845 PM10 683.432 297.624 PM2.5 243.984 8.047 SOx 14200.043 16644.901 CH4 13223.193 19510.910 N2O 28.044 41.888 CO2 2,277,184 3,013,146 CO2 (VOC, CO, CO2) 2,294,091 3,039,158 GHGs 2,633,028 3,508,657
*ACC energy values are reported in HHV.
2.2.8 Polyvinyl Chloride (PVC) Resin Production 2.2.8.1 Description of Process Steps
• Extraction and refining of crude oil and natural gas. • Manufacture of olefin (ethylene) from processed natural gas and refined oil. • Mining of salt (NaCl) and production of chlorine. • Production of hydrogen to manufacture hydrochloric acid from hydrogen and chlorine. • Manufacture of vinyl chloride monomer (VCM) from ethylene, chlorine, and hydrochloric acid. • Production of PVC resin from VCM.
2.2.8.2 Data Source(s) The ACC was determined to have the best available life cycle inventory data for North American production of PVC resin.
Primary data for ethylene production were gathered from eight thermal-cracking units in the U.S. and Canada for production year 2003. PlasticsEurope provided the data for mining of NaCl. Primary data for chlorine production were gathered from three plants in the U.S. for production year 2003. Four other datasets for North American chlorine production were collected in 1989-1992. Data for production of HCl is from the Swiss Center for LCI’s Ecoinvent Database34 and represents European production for the
33 See footnote 4 on page 12 34 Swiss Centre for Life Cycle Inventories (2011) http://www.ecoinvent.ch/

39
years 1997-2000. Primary data for VCM and PVC production were gathered from three plants in the U.S. for production years 2003-2004.
Data Quality These data were compiled by Franklin Associates, a well-respected life cycle practitioner, and as such, the results were deemed to be of high quality. Total non-combustion emissions from the ACC report included emissions due to upstream fuel production for transportation. Although transportation energy was not included in the final results of this GREET update report, the non-combustion emissions from transportation were not removed. As energy for transportation is minimal, it is likely that non-combustion emissions from fuel production for transportation would be quite small and have little effect on total emissions.
Other Data Sources PlasticsEurope provides a good alternative data source, where, as of February 2011, the total energy result for HIPS resin differed by 7% from ACC value. However, the geographic scope of this dataset is not North American.
2.2.8.3 Data Preparation for GREET Data preparation for PVC resin production followed the same procedure as for HDPE resin (section 0) with the exception that energy use data were taken from Table I-1 of the ACC report appendices and non-combustion emissions data were drawn from Table 9-4 of the ACC report. For step 3, calculations for PVC resin production showed that 2.025 mmBtu of natural gas was combusted for ethylene production. 2.2.8.4 Total Energy and Emissions Results35 Table 2.22 shows total energy and emissions results using updated values. Also presented are total energy and emissions results from the ACC report. PVC was not previously included in GREET, so no comparison is possible between updated and previous results. Note that the ACC reported HHV for total energy. This would account for a 5-10% difference in updated and industry results.
35 See footnote 4 on page 12
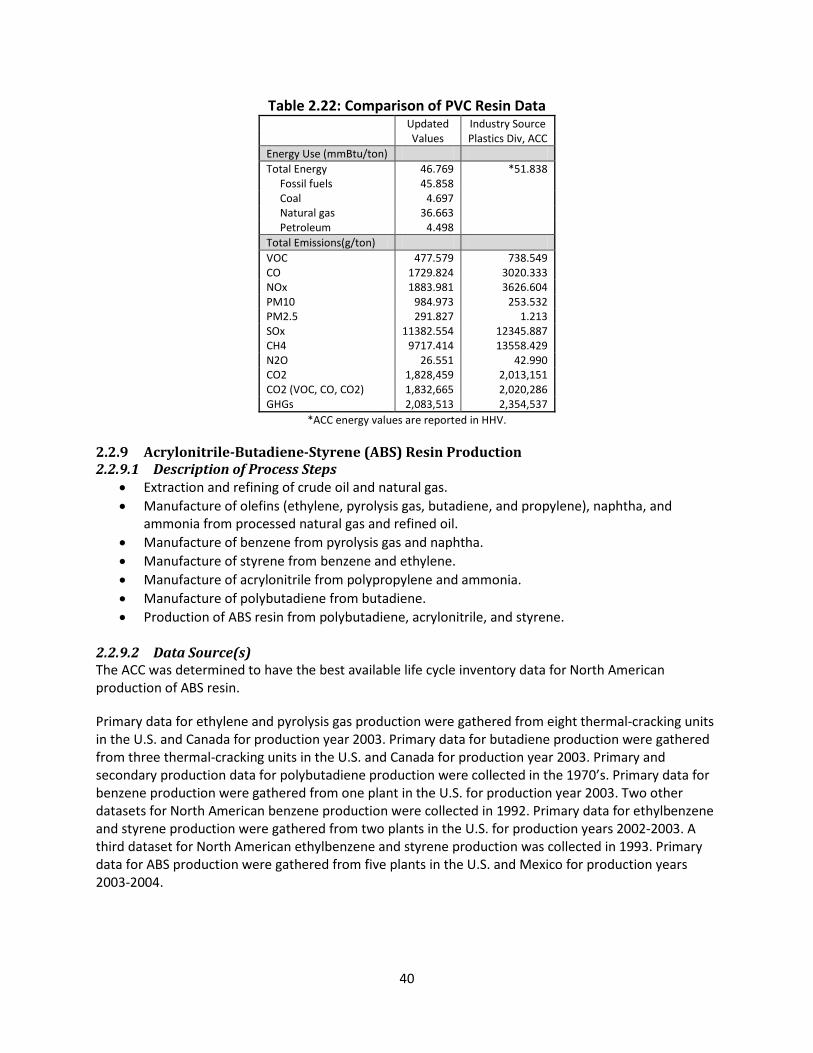
40
Table 2.22: Comparison of PVC Resin Data Updated Industry Source Values Plastics Div, ACC Energy Use (mmBtu/ton) Total Energy 46.769 *51.838 Fossil fuels 45.858 Coal 4.697 Natural gas 36.663 Petroleum 4.498 Total Emissions(g/ton) VOC 477.579 738.549 CO 1729.824 3020.333 NOx 1883.981 3626.604 PM10 984.973 253.532 PM2.5 291.827 1.213 SOx 11382.554 12345.887 CH4 9717.414 13558.429 N2O 26.551 42.990 CO2 1,828,459 2,013,151 CO2 (VOC, CO, CO2) 1,832,665 2,020,286 GHGs 2,083,513 2,354,537
*ACC energy values are reported in HHV.
2.2.9 Acrylonitrile-Butadiene-Styrene (ABS) Resin Production 2.2.9.1 Description of Process Steps
• Extraction and refining of crude oil and natural gas. • Manufacture of olefins (ethylene, pyrolysis gas, butadiene, and propylene), naphtha, and
ammonia from processed natural gas and refined oil. • Manufacture of benzene from pyrolysis gas and naphtha. • Manufacture of styrene from benzene and ethylene. • Manufacture of acrylonitrile from polypropylene and ammonia. • Manufacture of polybutadiene from butadiene. • Production of ABS resin from polybutadiene, acrylonitrile, and styrene.
2.2.9.2 Data Source(s) The ACC was determined to have the best available life cycle inventory data for North American production of ABS resin.
Primary data for ethylene and pyrolysis gas production were gathered from eight thermal-cracking units in the U.S. and Canada for production year 2003. Primary data for butadiene production were gathered from three thermal-cracking units in the U.S. and Canada for production year 2003. Primary and secondary production data for polybutadiene production were collected in the 1970’s. Primary data for benzene production were gathered from one plant in the U.S. for production year 2003. Two other datasets for North American benzene production were collected in 1992. Primary data for ethylbenzene and styrene production were gathered from two plants in the U.S. for production years 2002-2003. A third dataset for North American ethylbenzene and styrene production was collected in 1993. Primary data for ABS production were gathered from five plants in the U.S. and Mexico for production years 2003-2004.

41
Data Quality These data were compiled by Franklin Associates, a well-respected life cycle practitioner, and as such, the results were deemed to be of high quality. Total non-combustion emissions from the ACC report included emissions due to upstream fuel production for transportation. Although transportation energy was not included in the final results of this GREET update report, the non-combustion emissions from transportation were not removed. As energy for transportation is minimal, it is likely that non-combustion emissions from fuel production for transportation would be quite small and have little effect on total emissions.
Other Data Sources PlasticsEurope provides a good alternative data source, where, as of February 2011, the total energy result for ABS resin differed by 13% from ACC value. However, the geographic scope of this dataset is not North American.
2.2.9.3 Data Preparation for GREET Data preparation for ABS resin production followed the same procedure as for HDPE resin (section 0) with the exception that energy use data were taken from Table J-1 of the ACC report appendices and non-combustion emissions data were drawn from Table 10-4 of the ACC report. For step 3, calculations for ABS resin production showed that a total of 2.125 mmBtu of natural gas was combusted for olefin production, 0.879 mmBtu for ethylene, 0.588 mmBtu for propylene, 0.348 mmBtu for butadiene, and 0.535 mmBtu for pyrolysis gas. 2.2.9.4 Total Energy and Emissions Results36 Table 2.23 shows total energy and emissions results using updated values. Also presented are total energy and emissions results from the ACC report. ABS was not previously included in GREET, so no comparison is possible between updated and previous results. Note that the ACC reported HHV for total energy. This would account for a 5-10% difference in updated and industry results.
36 See footnote 4 on page 12

42
Table 2.23: Comparison of ABS Resin Data Updated Industry Source Values Plastics Div, ACC Energy Use (mmBtu/ton) Total Energy 83.801 *91.44 Fossil fuels 82.592 Coal 6.997 Natural gas 48.467 Petroleum 27.128 Total Emissions(g/ton) VOC 676.452 1157.427 CO 9196.307 13558.429 NOx 3586.311 8465.751 PM10 1560.829 485.017 PM2.5 489.655 5.842 SOx 17957.286 19621.141 CH4 14962.518 21935.995 N2O 33.223 78.264 CO2 2,753,184 3,550,765 CO2 (VOC, CO, CO2) 2,769,744 3,576,002 GHGs 3,153,707 4,107,212
*ACC energy values are reported in HHV.
2.2.10 Ethylene Propylene Diene Monomer (EPDM) Resin Production 2.2.10.1 Description of Process Steps
• Extraction and refining of crude oil and natural gas. • Manufacture of olefins (ethylene, propylene, and butadiene) and naphtha from processed
natural gas and refined oil. • Manufacture of cyclopentadiene from steam cracking of naphtha.37 • Manufacture of ethylidene norbornene from cyclopentadiene and butadiene.38 • Production of EPDM resin from ethylene, propylene and ethylidene norbornene.
2.2.10.2 Data Source(s) No recent, publicly available source was found for EPDM. In a report for the Athena Sustainable Material Institute, Franklin Associates modeled the production of EPDM assuming that the composition of EPDM resin was approximately 65% ethylene, 31% propylene, and 4% diene.39 This assumption was based on a conversation with UniRoyal Chemical, a former leading manufacturer of EPDM. Franklin Associates could not find a data source for production of ethylidene norbornene, the preferred diene for EPDM, and consequently used butadiene production as a substitute. For this study, the model of EPDM resin
37 Hönicke, D., Födisch, R., Claus, P. and Olson, M. (2000) Cyclopentadiene and Cyclopentene. Ullmann's Encyclopedia of Industrial Chemistry. http://onlinelibrary.wiley.com/doi/10.1002/14356007.a08_227/full 38 Kent and Riegel’s Handbook of Industrial Chemistry and Biotechnology, 11th Edition (2007) Edited by James A. Kent. pp. 706. http://books.google.com/books?id=AYjFoLCNHYUC&pg=PA706&lpg=PA706&dq=%22ethylidene+norbornene%22+and+butadiene+and+cyclopentadiene&source=bl&ots=GPUxMw4sEE&sig=jeoIIEHiWQ50iT2lqO0f6QuIgsQ&hl=en&ei=ahxyTqDyDITz0gHr5fGkCg&sa=X&oi=book_result&ct=result&resnum=6&ved=0CEAQ6AEwBQ#v=onepage&q&f=false 39 Athena Sustainable Materials Institute (2001) Life Cycle Inventory of Selected Commercial Roofing Products. Based on reports by Franklin Associates.
43
production used the material composition suggested in the 2001 Athena report, but was built using unit processes from the 2011 ACC plastics report.
Primary data for ethylene and propylene production were gathered from eight thermal-cracking units in the U.S. and Canada for production year 2003. Primary data for butadiene production were gathered from three thermal-cracking units in the U.S. and Canada for production year 2003.
Data Quality As production of ethylidene norbornene requires other chemical inputs and several production steps beyond butadiene manufacture, this model of EPDM resin is expected to have lower than actual energy and emissions results.
2.2.10.3 Data Preparation for GREET The following steps were used to model EPDM resin production and prepare the results for insertion into the GREET model.
1. Model energy use and emissions for EPDM resin production: Unit processes for extraction of crude oil, refining of petroleum products, extraction of natural gas, processing of natural gas, production of ethylene, production of propylene, and production of butadiene were weighted and combined to model EPDM resin production. • Physical units of purchased energy for feedstock, process, and transportation energy as well
as atmospheric non-combustion emissions were drawn from Tables B-2, B-3, B-4, B-5, B-6, E-2, and H-2 of the ACC report appendices.
• Weights of material inputs for each unit process provided in the ACC report appendices were used to determine the amount of fuel use, transportation, and emissions resulting from the manufacture of 653.125 lbs of ethylene, 307.8125 lbs of propylene, and 39.0625 lbs of butadiene. These factors were derived from the Athena roofing study where Franklin Associates assumed that 640 lbs of EPDM resin was composed of 418 lbs ethylene, 197 lbs propylene, and 25 lbs butadiene.
• The resulting datasets for ethylene, propylene, and butadiene were summed to make one data set for 1000 lbs of EPDM resin.
2. Add fuel energy, non-combustion emissions, and modification of GREET: From this point, data processing matched steps 1-4 for HDPE resin (section 0) with the following exceptions. • The dataset from step 1 above was used for feedstock, process energy, emissions, and
transportation. • For step 3, calculations for EPDM resin production showed that a total of 4.075 mmBtu of
natural gas was combusted for olefin production, 2.917 mmBtu for ethylene, 1.064 mmBtu for propylene, and 0.093 mmBtu for butadiene.
2.2.10.4 Total Energy and Emissions Results40 Table 2.24 shows total energy and emissions results using updated values. EPDM data were not previously included in GREET or published in full by an industry or in literature, so no comparison is possible between updated and previous GREET or industry results.
40 See footnote 4 on page 12

44
Table 2.24: EPDM Resin Data Updated Values Energy Use (mmBtu/ton) Total Energy 67.918 Fossil fuels 67.699 Coal 1.027 Natural gas 52.655 Petroleum 14.017 Total Emissions(g/ton) VOC 693.878 CO 3709.203 NOx 763.261 PM10 306.210 PM2.5 67.445 SOx 20605.933 CH4 13776.766 N2O 9.880 CO2 1,011,176 CO2 (VOC, CO, CO2) 1,019,167 GHGs 1,366,531
2.2.11 Nylon 66 Resin Production 2.2.11.1 Description of Process Steps
• Extraction and refining of crude oil and natural gas. • Manufacture of olefins (ethylene, pyrolysis gas, butadiene, and propylene), naphtha, and
ammonia from processed natural gas and refined oil. • Manufacture of benzene from pyrolysis gas and naphtha. • Manufacture of adipic acid from benzene and nitric acid. • Manufacture of acrylonitrile from polypropylene and ammonia. • Manufacture of hexamethylene diamine from acrylonitrile or butadiene. • Production of nylon 66 from adipic acid and hexamethyl diamine.
2.2.11.2 Data Source(s) PlasticsEurope was determined to have the best available life cycle inventory data for production of nylon 66 resin. No other publicly available source of nylon 66 production data provides the level of detail necessary for use in the GREET model. All PlasticsEurope eco-profiles were found on their website.
Primary data for ethylene, pyrolysis gas, and propylene production were gathered from 17 European manufacturing sites for production year 1999. Primary data for butadiene production were gathered from three European manufacturing sites for production year 1997. Primary data for benzene production were gathered from eleven European manufacturing sites for production year 2002. Primary data for ammonia production were gathered from one European manufacturing site for production year 2001. Primary data for acrylonitrile production were gathered from three European manufacturing sites for production year 1995. Primary data for nylon 66 production were gathered from four European manufacturing sites for production year 1996.
Data Quality These data were compiled by well-respected life cycle practitioners employed by PlasticsEurope, who work with more than 100 polymer manufacturers, which represents over 90% of European plastics production, and as such, the results were deemed to be of high quality.

45
2.2.11.3 Data Preparation for GREET The following steps were used to prepare data for nylon 66 from PlasticsEurope for use in the GREET model.
1. Add fuel energy: The energy associated with process fuels was summed to find the “energy use” input for GREET. Fossil fuels that were used for feedstock sources or transportation were presented separately. The following fuel categorizes were used:
o Crude oil o Natural gas (NG) o Coal o Electricity o Oil as feed o NG as feed
• Purchased energy for feedstock and process energy (“energy content of delivered fuel”) were taken from Table 2 of the nylon 66 eco-profile. “Oil fuels” were assumed to be crude oil, and “other fuels” were assumed to be natural gas.
• Purchased energy for transportation was also derived from Table 2, but had to be estimated due to the upstream energy included in the “energy use in transport” category. The “energy use in transport” value for each fuel category (electricity, oil fuels, and other fuels) was multiplied by the ratio of “energy content of delivered fuel” to “total energy” for the corresponding fuel category to estimate the amount of delivered, or purchased, energy was used in transportation.
• Data were manipulated to convert reference flow from 1 kg of resin to 1 ton of resin. • Energy values were converted from HHV in MJ to physical U.S. customary units using HHV
factors for each fuel found in GREET 1.8.c. • Conversion of energy values from physical units to mmBtu/ton resin using LHV factors found
in GREET 1.8.c.
2. Add Non-combustion emissions: The data presented in the eco-profile separated emissions into several categories, including process (non-combustion) emissions. Non-combustion emissions were reported in GREET. • Data for non-combustion emissions were drawn from the “from process” column in Table 7
of the nylon 66 eco-profile and converted to grams per ton of resin.
3. Alterations to GREET model: The previous GREET model was altered as follows: • A crude oil fuel category was added. • A column to report feedstock energy separately in GREET was added.
4. Transportation energy: GREET does not currently include transportation of plastic resins in its
model. Transportation data was compiled for possible future use by ANL. (See Appendix) • Transportation data were reported in both purchased energy and mmBtu per ton of resin.
2.2.11.4 Total Energy and Emissions Results41 Table 2.25 shows total energy and emissions results using updated values. Also presented are total energy and emissions results from PlasticsEurope. Nylon 66 was not previously included in GREET, so no 41 See footnote 4 on page 12

46
comparison is possible between updated and previous results. Note that the PlasticsEurope reported HHV for total energy. This would account for a 5-10% difference in updated and industry results.
Table 2.25: Comparison of Nylon 66 Resin Data Updated Industry Source Values PlasticsEurope Energy Use (mmBtu/ton) Total Energy 105.129 *119.202 Fossil fuels 102.680 110.167 Coal 11.440 15.903 Natural gas 58.848 58.513 Petroleum 32.391 35.749 Total Emissions(g/ton) VOC 442.774 19.675 CO 3093.002 6637.763 NOx 8186.669 12280.543 PM10 2709.107 1931.106 PM2.5 880.287 SOx 8869.070 16161.913 CH4 11554.776 44688.010 N2O 744.446 668.100 CO2 5,377,578 5,934,498 CO2 (VOC, CO, CO2) 5,383,818 5,945,131 GHGs 5,894,533 7,184,794
*PlasticsEurope energy values are reported in HHV. 2.2.12 Nylon 6 Resin Production 2.2.12.1 Description of Process Steps
• Extraction and refining of crude oil and natural gas. • Manufacture of olefin (pyrolysis gas) and naphtha from processed natural gas and refined oil. • Manufacture of benzene from pyrolysis gas and naphtha. • Manufacture of cyclohexanone from benzene and phenol. • Manufacture of caprolactam from cyclohexanone. • Production of nylon 6 resin from caprolactam.
2.2.12.2 Data Source(s) PlasticsEurope was determined to have the best available life cycle inventory data for production of nylon 6 resin. No other publicly available source of nylon 6 production data provides the level of detail necessary for use in the GREET model.
Primary data for pyrolysis gas production were gathered from 17 European manufacturing sites for production year 1999. Primary data for benzene production were gathered from eleven European manufacturing sites for production year 2002. Primary data for phenol production were gathered from two European manufacturing sites for production year 1994.
2.2.12.3 Data Preparation for GREET Data preparation for use in GREET for nylon 6 resin production was the same as for nylon 66 (section 2.2.11.3) except that energy data were taken from Table 1 and emissions data were from Table 6 of the nylon 6 eco-profile.

47
2.2.12.4 Total Energy and Emissions Results42 Table 2.26 shows total energy and emissions results using updated values. Also presented are total energy and emissions results from PlasticsEurope. Nylon 6 was not previously included in GREET, so no comparison is possible between updated and previous results. Note that the PlasticsEurope reported HHV for total energy. This would account for a 5-10% difference in updated and industry results.
Table 2.26: Comparison of Nylon 6 Resin Data Updated GREET 2.7 Industry Source Values
PlasticsEurope
Energy Use (mmBtu/ton) Total Energy 92.208 – *103.588 Fossil fuels 90.790 – 95.784 Coal 6.626 – 11.939 Natural gas 54.597 – 50.679 Petroleum 29.566 – 33.165 Total Emissions(g/ton) VOC 407.128 – 18.481 CO 6528.715 – 8836.469 NOx 14014.264 – 16866.847 PM10 1884.136 – 2640.409 PM2.5 712.631 – SOx 8489.632 – 15058.231 CH4 11448.642 – 42518.689 N2O 7890.922 – 7809.753 CO2 5,255,372 – 4,954,035 CO2 (VOC, CO, CO2) 5,266,901 – 4,968,166 GHGs 7,904,612 – 8,280,100
*PlasticsEurope energy values are reported in HHV.
2.2.13 Liquid Epoxy Resin Production 2.2.13.1 Description of Process Steps
• Extraction and refining of crude oil and natural gas. • Manufacture of olefins (propylene, pyrolysis gas) and naphtha from processed natural gas and
refined oil. • Manufacture of benzene from pyrolysis gas and naphtha. • Manufacture of epichlorohydrin from propylene and chlorine. • Manufacture of Bisphenol-A from benzene, propylene, acetone, and phenol. • Production of liquid epoxy resin from epichlorohydrin and bisphenol-A.
2.2.13.2 Data Source(s) PlasticsEurope was determined to have the best available life cycle inventory data for production of liquid epoxy resin. No other publicly available source of epoxy production data provides the level of detail necessary for use in the GREET model.
Primary data for propylene and pyrolysis gas production were gathered from 17 European manufacturing sites for production year 1999. Primary data for benzene production were gathered from eleven European manufacturing sites for production year 2002. Primary data for phenol production were gathered from two European manufacturing sites for production year 1994. Primary data for
42 See footnote 4 on page 12
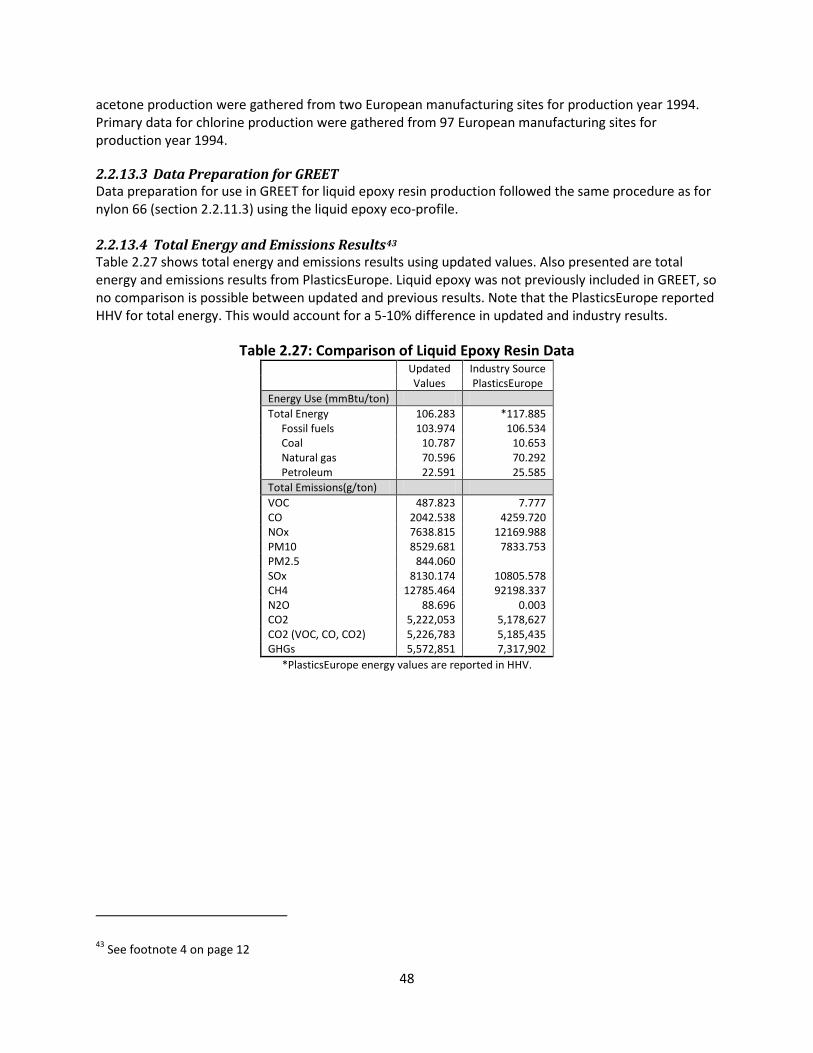
48
acetone production were gathered from two European manufacturing sites for production year 1994. Primary data for chlorine production were gathered from 97 European manufacturing sites for production year 1994.
2.2.13.3 Data Preparation for GREET Data preparation for use in GREET for liquid epoxy resin production followed the same procedure as for nylon 66 (section 2.2.11.3) using the liquid epoxy eco-profile. 2.2.13.4 Total Energy and Emissions Results43 Table 2.27 shows total energy and emissions results using updated values. Also presented are total energy and emissions results from PlasticsEurope. Liquid epoxy was not previously included in GREET, so no comparison is possible between updated and previous results. Note that the PlasticsEurope reported HHV for total energy. This would account for a 5-10% difference in updated and industry results.
Table 2.27: Comparison of Liquid Epoxy Resin Data Updated Industry Source Values PlasticsEurope Energy Use (mmBtu/ton) Total Energy 106.283 *117.885 Fossil fuels 103.974 106.534 Coal 10.787 10.653 Natural gas 70.596 70.292 Petroleum 22.591 25.585 Total Emissions(g/ton) VOC 487.823 7.777 CO 2042.538 4259.720 NOx 7638.815 12169.988 PM10 8529.681 7833.753 PM2.5 844.060 SOx 8130.174 10805.578 CH4 12785.464 92198.337 N2O 88.696 0.003 CO2 5,222,053 5,178,627 CO2 (VOC, CO, CO2) 5,226,783 5,185,435 GHGs 5,572,851 7,317,902
*PlasticsEurope energy values are reported in HHV.
43 See footnote 4 on page 12
49
2.2.14 Polycarbonate (PC) Resin Production 2.2.14.1 Description of Process Steps
• Extraction and refining of crude oil and natural gas. • Mining of salt (NaCl) and production of chlorine and sodium hydroxide. • Manufacture of olefins (propylene, pyrolysis gas) and naphtha from processed natural gas and
refined oil. • Manufacture of benzene from pyrolysis gas and naphtha. • Manufacture of Bisphenol-A from benzene, propylene, acetone, and phenol. • Manufacture of phosgene from chlorine and sodium hydroxide. • Production of liquid epoxy resin from bisphenol-A and phosgene.
2.2.14.2 Data Source(s) PlasticsEurope was determined to have the best available life cycle inventory data for production of PC resin. No other publicly available source of PC production data provides the level of detail necessary for use in the GREET model.
Primary data for propylene and pyrolysis gas production were gathered from 17 European manufacturing sites for production year 1999. Primary data for benzene production were gathered from eleven European manufacturing sites for production year 2002. Primary data for phenol production were gathered from two European manufacturing sites for production year 1994. Primary data for acetone production were gathered from two European manufacturing sites for production year 1994. Primary data for chlorine production were gathered from 97 European manufacturing sites for production year 1994. Primary data for polycarbonate production were gathered from five European manufacturing sites for production year 2007.
Data Quality This PlasticsEurope eco-profile provided only total energy values including upstream energy. As such, an estimation of purchased energy using the GREET model was necessary. Since the removal of upstream energy required use of GREET assumptions based on fuel production and delivery in the U.S., which was not ideal given that European fuel production and delivery data was likely utilized in the PC eco-profile, this estimation introduced uncertainty and possibly significant error into the total energy and emissions results. Although this data source provided a list of total emissions, it was not possible to separate out non-combustion emissions for inclusion in the GREET model. Additionally, this data set did not include energy use or emissions from transportation as it was expected to be less than 2% of total energy use and therefore not significant. Lastly, the eco-profile authors noted uncertainty in how much feedstock was combusted in the hydrocracker and became a process fuel. If the amount of feedstock combusted was over-estimated, total emissions results would be too high, or too low if feedstock combustion was under-estimated.
2.2.14.3 Data Preparation for GREET The following steps were used to prepare data for PC from PlasticsEurope for use in the GREET model.
1. Add fuel energy: The energy associated with process fuels was summed to find the “energy use” input for GREET. Fossil fuels that were used for feedstock sources were presented separately. The following fuel categorizes were used:
o Crude oil o Natural gas (NG)

50
o Coal o Electricity o Oil as feed o NG as feed
• Feedstock energy and process energy, in primary energy form, were derived from Table 2 of the PC eco-profile. If presented with a range of values (a result of uncertainty in feedstock combustion) the median of the range was used. Feedstock values were taken directly from “Feedstock Energy Input.” To calculate the amount of primary energy used for electricity, both “Fuel Energy Input” and “Feedstock Energy Input” categories were subtracted from the “Total Energy Input” category, and the results were summed. “Fuel Energy Input” was used to determine primary process energy. To simplify the modeling of fuel energy input, lignite was grouped with coal and fuel energy from nuclear, biomass, wood, and other renewables were disregarded as they represented less than 1 ten-thousandth of a percent of total fuel energy input.
2. Excel Solver: Solver was used to estimate purchased energy from the primary energy values. • The objective was set to equal the value of total energy of a selected fuel entered into the
“Total Energy” cell in the GREET model. (See Input to Total Energy in Table 2.28.) • The “energy use” value for the selected fuel was the variable cell that Solver changed so
that the “Total Energy” matched the input. The value returned by Solver in the “energy use” cell was used as the purchased energy value for that fuel. (See Output to Energy Use in Table 2.28.)
• This process was repeated separately for each fuel type.
Table 2.28: Inputs to GREET and Outputs from Solver for PC Purchased Energy Calculation Fuel Type
Input to Total Energy Output to Energy Use (mmBtu/ton resin)
Crude Oil 9.591 8.502 Natural Gas 29.961 27.930 Coal 0.408 0.400 Electricity 14.695 5.730
• Data were manipulated to convert reference flow from 1 kg of resin to 1 ton of resin. • Energy values were converted from HHV in MJ to physical U.S. customary units using HHV
factors for each fuel found in GREET 1.8.c. • Conversion of energy values from physical units to mmBtu/ton resin using LHV factors found
in GREET 1.8.c.
1. Alterations to GREET model: The previous GREET model was altered as follows: • A crude oil fuel category was added. • A column to report feedstock energy separately in GREET was added.
2.2.14.4 Total Energy and Emissions Results44 Table 2.29 shows total energy and emissions results using updated values. Also presented are total energy and emissions results from PlasticsEurope. PC was not previously included in GREET, so no
44 See footnote 4 on page 12

51
comparison is possible between updated and previous results. Note that the PlasticsEurope reported HHV for total energy. This would account for a 5-10% difference in updated and industry results.
Table 2.29: Comparison of PC Resin Data Updated Industry Source Values PlasticsEurope Energy Use (mmBtu/ton) Total Energy 83.263 *89.935 Fossil fuels 81.245 83.349 Coal 9.827 5.890 Natural gas 37.761 38.351 Petroleum 33.658 36.451 Total Emissions(g/ton) VOC 355.523 2275.052 CO 1284.459 1451.496 NOx 5354.616 4508.708 PM10 2139.440 27.488 PM2.5 746.170 90.718 SOx 6676.477 3710.386 CH4 8003.297 10953.294 N2O 67.393 79.288 CO2 3,768,919 3,456,374 CO2 (VOC, CO, CO2) 3,772,046 3,465,848 GHGs 3,992,211 3,746,673
*PlasticsEurope energy values are reported in HHV.
2.2.15 Rigid Polyurethane (PUR) Foam Production 2.2.15.1 Description of Process Steps
• Extraction and refining of crude oil and natural gas. • Mining of salt (NaCl) and production of chlorine, NaOH, and potassium hydroxide (KOH). • Manufacture of olefins (propylene, pyrolysis gas), ammonia, naphtha, and formaldehyde from
processed natural gas and refined oil. • Manufacture of benzene from pyrolysis gas and naphtha. • Manufacture of aniline from ammonia and benzene. • Manufacture of phosgene from chlorine and sodium hydroxide. • Production of methylene diphenylene diisocyanate (MDI) from phosgene, formaldehyde, and
aniline. • Manufacture of sucrose from sugar beets. • Manufacture of propylene oxide from propylene, chlorine, oxygen, NaCl, and NaOH. • Production of polyol for rigid foam from propylene oxide, sucrose, KOH and limestone. • Production of rigid polyurethane foam from polyol for rigid foam and MDI.
2.2.15.2 Data Source(s) While the ACC report provides data concerning precursor resins for rigid polyurethane foam, it does not address the final production stage where the precursor polyol and isocyanate, MDI, are mixed to create the rigid PUR foam. PlasticsEurope has a module that accounts for all production stages for rigid PUR foam. However, in the 2011 ACC report, Franklin Associates noted that PlasticsEurope total energy values for MDI were quite high due to incorrect allocation to HCl production. Ideally, North American data would be used, but the final stage of production should also be included. Thus a model was created where European data for the final production stage was added to the North American data for the precursors.

52
Primary data for propylene and pyrolysis gas production were gathered from eight thermal-cracking units in the U.S. and Canada for production year 2003. Primary data for oxygen manufacture were gathered from three producers in the North America for production years 1990-1993. PlasticsEurope provided the data for mining of NaCl. Primary data for chlorine production were gathered from three plants in the U.S. for production year 2003. Primary data for polyether polyol for rigid foam manufacture were gathered from three plants in the U.S. for production year 2003. Primary data for benzene production were gathered from one plant in the U.S. for production year 2003. Primary data for nitric acid fabrication were gathered from a European source in 1990. Primary data for nitrobenzene and aniline production were gathered from two plants in the U.S. for production years 2003-2004. Primary data for formaldehyde production were gathered from one producer in the U.S. for production year 2007. Primary data for MDI production were gathered from four plants in the U.S. for production year 2003. Primary data for rigid PUR foam production were gathered from one European site in 1996.
Data Quality In order to get a dataset for final production stage energy and emissions due to precursor production had to be subtracted out using European data from PlasticsEurope eco-profiles for MDI and polyol. An assumption had to be made, based on the rigid PUR foam eco-profile, about how much MDI and polyol was used in the rigid foam production. If the weight factors used in the calculations were incorrect, or the division between precursor and foam production was not exact, errors in the total energy and emissions would result.
2.2.15.3 Data Preparation for GREET The following steps were used to prepare data for PUR precursor production from the ACC report and rigid PUR foam production from PlasticsEurope eco-profiles for use in the GREET model.
1. Preparation of North American precursor data: Feedstock, process, and transportation energy values as well as non-combustion emissions for each precursor were weighted and added together. • Physical units of purchased energy for feedstock, process, and transportation energy were
drawn from Table K-1 and M-1 of the ACC report appendices for rigid foam polyol and MDI, respectively.
• Internal offgas and recovered energy values were also taken from the “Total Energy” column from appendices Table K-1 and M-1.
• Energy data for each precursor were manipulated to convert reference flow from 1000 lbs resin to 2000 lbs (1 ton) resin.
• Non-combustion emissions data were taken from the “process emissions” column from Table 11-4 and Table 13-4 from the ACC report for the polyol and MDI and converted to grams per ton of resin.
• Both polyol and MDI datasets, including emissions, were multiplied by 0.5 (to model how much of each precursor is in a ton of rigid PUR foam) and then summed.
2. Preparation of European final production stage data: Feedstock, process, and transportation energy values as well as non-combustion emissions for each precursor were weighted and added together, then subtracted from the full rigid PUR foam dataset. • Energy use data preparation step 1, parts 1-4, for nylon 66 resin (section 2.2.11.3) was
followed using PlasticsEurope data from Table 1 of the polyol and MDI eco-profiles and Table 3 of the rigid PUR foam production eco-profile.

53
• Non-combustion emissions data were drawn from the “from process” column in Table 6 of the polyol and MDI eco-profiles and Table 8 of the rigid PUR foam eco-profile and converted to grams per ton of resin.
• Datasets, including emissions, for the polyol and MDI were multiplied by 0.386 and 0.616, respectively, and subtracted from the rigid PUR foam dataset.
3. Combination of the North American precursor and European final production stage data: Data calculated for North American precursors and European final production stage were summed. • The North American precursor dataset resulting from step 1 above was added to the
European dataset resulting from step 2 above. • Energy values were converted from physical units to mmBtu/ton resin using LHV factors
found in GREET 1.8.c. • Recovered energy was excluded from the total as it was not possible to model in GREET
using the data currently available, and it comprises only 1-2% of total “energy use.” • Final data preparation was the same as step 3 for HDPE resin (section 0). For part 3 of step
3, calculations for rigid PUR foam production showed that a total of 1.521 mmBtu of natural gas was combusted for olefin production, 1.314 mmBtu for propylene and 0.207 mmBtu for pyrolysis gas.
2.2.15.4 Total Energy and Emissions Results45 Table 2.30 shows total energy and emissions results using updated values. Also presented are total energy and emissions results from PlasticsEurope. Rigid PUR foam was not previously included in GREET, so no comparison is possible between updated and previous results. Note that the PlasticsEurope reported HHV for total energy. This would account for a 5-10% difference in updated and industry results.
Table 2.30: Comparison of Rigid PUR Foam Data Updated Industry Source Values PlasticsEurope Energy Use (mmBtu/ton) Total Energy 64.253 *87.260 Fossil fuels 62.804 78.748 Coal 7.899 9.553 Natural gas 36.054 37.473 Petroleum 18.851 31.720 Total Emissions(g/ton) VOC 570.197 10.160 CO 5578.136 4491.955 NOx 3900.995 7437.353 PM10 1839.692 3878.925 PM2.5 611.325 SOx 13544.816 10229.836 CH4 11104.096 29397.384 N2O 35.504 9.530 CO2 2,681,401 3,073,533 CO2 (VOC, CO, CO2) 2,691,944 3,080,719 GHGs 2,980,126 3,778,080
*PlasticsEurope energy values are reported in HHV.
45 See footnote 4 on page 12

54
2.2.16 Flexible Polyurethane (PUR) Foam Production 2.2.16.1 Description of Process Steps
• Extraction and refining of crude oil and natural gas. • Manufacture of olefins (ethylene, propylene), ammonia, and toluene from processed natural gas
and refined oil. • Mining of salt (NaCl) and production of chlorine, NaOH, and KOH. • Manufacture of propylene oxide from propylene, oxygen, chlorine, NaCl, and NaOH. • Manufacture of ethylene oxide from ethylene and oxygen. • Harvesting of palm kernel to manufacture glycerine. • Production of polyol for flexible foam from propylene oxide, ethylene oxide and KOH. • Manufacture of phosgene from chlorine and sodium hydroxide. • Manufacture of nitric acid from ammonia. • Manufacture of dinitrotoluene from nitric and sulfuric acids. • Manufacture of toluene diamine (TDA) from dinitrotoluene and hydrogen. • Production of TDI from TDA and phosgene. • Production of flexible polyurethane foam from polyol for flexible foam and TDI.
2.2.16.2 Data Source(s) Although the ACC report provides data concerning precursor resins for flexible polyurethane foam, it does not address the final production stage where the precursor polyol and isocyanate, TDI, are mixed to create the flexible PUR foam. PlasticsEurope has a module that accounts for all production stages for flexible PUR foam. However, in the 2011 ACC report, Franklin Associates noted that PlasticsEurope total energy values for TDI were quite high due to incorrect allocation to HCl production. Ideally, North American data would be used, but the final stage of production should also be included. Thus a model was created where European data for the final production stage was added to the North American data for the precursors.
Primary data for ethylene and propylene production were gathered from eight thermal-cracking units in the U.S. and Canada for production year 2003. Primary data for oxygen manufacture were gathered from three producers in the North America for production years 1990-1993. Primary data for ethylene oxide manufacture were gathered from six producers in the U.S. and Europe for production years 1990-1992. PlasticsEurope provided the data for mining of NaCl. Primary data for chlorine production were gathered from three plants in the U.S. for production year 2003. Primary data for polyether polyol for flexible foam manufacture were gathered from five plants in the U.S. for production years 2003 and 2005. Primary data for nitric acid fabrication were gathered from a European source in 1990. Primary data for toluene manufacture were collected from two European producers in the early 1990’s. Primary data for dinitrotoluene production were gathered from one U.S. source. Primary data for TDA production were gathered from two sources in the U.S. for production year 2003. Primary data for TDI production were gathered from three plants in the U.S. for production year 2003. Primary data for flexible PUR foam production were gathered from one European site in 1996.
Data Quality In order to get dataset for final production stage energy and emissions due to precursor production had to be subtracted out using European data from PlasticsEurope eco-profiles for TDI and polyol. An assumption had to be made, based on the flexible PUR foam eco-profile, about how much TDI and polyol was used in the flexible foam production. If the weight factors used in the calculations were

55
incorrect, or the division between precursor and foam production was not exact, errors in the total energy and emissions would result.
2.2.16.3 Data Preparation for GREET The following steps were used to prepare data for flexible PUR foam production from the ACC report and PlasticsEurope eco-profiles for use in the GREET model.
1. Preparation of North American precursor data: Feedstock, process, and transportation energy values as well as non-combustion emissions for each precursor were weighted and added together. • Physical units of purchased energy for feedstock, process, and transportation energy were
drawn from Table L-1 and N-1 of the ACC report appendices for flexible foam polyol and TDI, respectively.
• Internal offgas and recovered energy values were also taken from the “Total Energy” column from appendices Table L-1 and N-1.
• Energy data for each precursor were manipulated to convert reference flow from 1000 lbs resin to 2000 lbs (1 ton) resin.
• Non-combustion emissions data were taken from the “process emissions” column from Table 12-4 and Table 14-4 from the ACC report for polyol and TDI and converted to grams per ton of resin.
• The polyol and TDI datasets, including emissions, were multiplied by 0.713 and 0.285, respectively, and then summed.
2. Preparation of European final production stage data: Feedstock, process, and transportation energy values as well as non-combustion emissions for each precursor were weighted and added together, then subtracted from the full rigid PUR foam dataset. • Energy use data preparation step 1, parts 1-4, for nylon 66 resin (section 2.2.11.3) were
followed using PlasticsEurope data from Table 1 of the polyol and TDI eco-profiles and Table 3 of the flexible PUR foam production eco-profile.
• Non-combustion emissions data were drawn from the “from process” column in Table 6 of the polyol and TDI eco-profiles and Table 8 of the flexible PUR foam eco-profile and converted to grams per ton of resin.
• Datasets, including emissions, for polyol and TDI were multiplied by, respectively, and subtracted from the flexible PUR foam dataset.
3. Combination of the North American precursor and European final production stage data: Data calculated for North American precursors and European final production stage were summed. • The North American precursor dataset resulting from step 4 above was added to the
European dataset resulting from step 6 above. • Energy values were converted from physical units to mmBtu/ton resin using LHV factors
found in GREET 1.8.c. • Recovered energy was excluded from the total “energy use” as it was not possible to model
in GREET using the data currently available, and it comprises only 1-2% of total “energy use.” Biomass energy was also excluded for reasons similar to those for recovered energy.
• Final data preparation was the same as step 3 for HDPE resin (section 0). For part 3 of step 3, calculations for flexible PUR foam production showed that a total of 2.394 mmBtu of

56
natural gas was combusted for olefin production, 0.284 mmBtu for ethylene and 2.111 mmBtu for propylene.
2.2.16.4 Total Energy and Emissions Results46 Table 2.31 shows total energy and emissions results using updated values. Also presented are total energy and emissions results from PlasticsEurope. Flexible PUR foam was not previously included in GREET, so no comparison is possible between updated and previous results. Note that the PlasticsEurope reported HHV for total energy. This would account for a 5-10% difference in updated and industry results.
Table 2.31: Comparison of Flexible PUR Foam Data Updated Industry Source Values PlasticsEurope Energy Use (mmBtu/ton) Total Energy 68.704 *87.824 Fossil fuels 67.081 77.681 Coal 8.394 9.447 Natural gas 42.352 38.456 Petroleum 16.335 29.777 Total Emissions(g/ton) VOC 627.918 5.207 CO 5216.203 4897.114 NOx 3919.177 8358.749 PM10 1907.986 5774.393 PM2.5 617.765 SOx 14442.348 11612.792 CH4 13066.711 29588.073 N2O 38.040 17.595 CO2 3,009,784 3,523,618 CO2 (VOC, CO, CO2) 3,019,938 3,531,433 GHGs 3,357,942 4,227,904
*PlasticsEurope energy values are reported in HHV.
2.2.17 Blow Molding of HDPE Bottles 2.2.17.1 Description of Process Steps
• Heat HDPE resin. • Extrude molten polymer as a tube into a mold. • Inject compressed air into the mold, forcing the resin to the sides of the mold. • Chill the mold with water to solidify the HDPE product and eject from mold.
2.2.17.2 Data Source(s) PlasticsEurope was determined to have the best available life cycle inventory data for blow molding of HDPE bottles. No other publicly available source of blow molding data provides the level of detail necessary for use in the GREET model.
Primary data for blow molding of HDPE bottles were gathered from two European manufacturing sites in 1998.
46 See footnote 4 on page 12
57
Data Quality PlasticsEurope report that few non-combustion emissions result from the transformation process itself. Thus, although a separate list of non-combustion emissions was not made available for HDPE blow molding, the effects on the overall results are expected to be minimal. 2.2.17.3 Data Preparation for GREET The following steps were used to prepare data for HDPE blow molding from PlasticsEurope for use in the GREET model.
1. Add fuel energy: The energy associated with process fuels was summed to find the “energy use” input for GREET. The following fuel categorizes were used:
o Electricity o Diesel o Gas oil (as diesel) o Propane (as LPG)
• Purchased process energy was drawn from Table 1 in the HDPE Bottles eco-profile. Propane was modeled as LPG and gas oil was modeled as diesel.
• Data were manipulated to convert reference flow from 1 kg of transformed product to 1 ton of transformed product.
• Energy values were converted from HHV in MJ to physical U.S. customary units using HHV factors for each fuel found in GREET 1.8.c.
• Energy values were converted from physical units to mmBtu per ton of blow molded HDPE bottles using LHV factors found in GREET 1.8.c.
2.2.17.4 Total Energy and Emissions Results47 Table 2.32 shows total energy and emissions results for blow molding of HDPE bottles. Results do not include energy use or emissions from resin or additive production, packaging, or transport. HDPE blow molding was not previously included in GREET, so no comparison is possible between updated and previous results.
47 See footnote 4 on page 12

58
Table 2.32: HDPE Blow Molding Data
Updated Values Energy Use (mmBtu/ton) Total Energy 13.596 Fossil fuels 11.760 Coal 8.575 Natural gas 2.834 Petroleum 0.351 Total Emissions(g/ton) VOC 100.454 CO 291.882 NOx 1193.038 PM10 1520.841 PM2.5 399.732 SOx 2618.289 CH4 1521.840 N2O 14.887 CO2 1,129,300 CO2 (VOC, CO, CO2) 1,130,071 GHGs 1,172,554
2.2.18 Calendaring of PVC Film 2.2.18.1 Description of Process Steps
• Preheat PVC resin. • Pass PVC resin between a series of heated rollers to create a sheet of even thickness. • Pass PVC film between cooling rollers. • Trim film and wind into a final roll.
2.2.18.2 Data Source(s) PlasticsEurope was determined to have the best available life cycle inventory data for calendaring of PVC film. No other publicly available source of PVC calendaring data provides the level of detail necessary for use in the GREET model.
Primary data for calendaring of PVC film were gathered from one German manufacturing site for production year 2007.
2.2.18.3 Data Preparation for GREET The following steps were used to prepare data from the PlasticsEurope PVC film calendaring eco-profile for use in the GREET model.
1. Add fuel energy: The energy associated with process fuels was summed to find the “energy use” input for GREET. The following fuel categorizes were used:
o Electricity • Purchased process energy values were found in Table 1. • Data were manipulated to convert reference flow from 1 kg to 1 ton of transformed
product. • Energy data were converted from MJ to kWh and then to mmBtu/ton of calendared PVC
film.
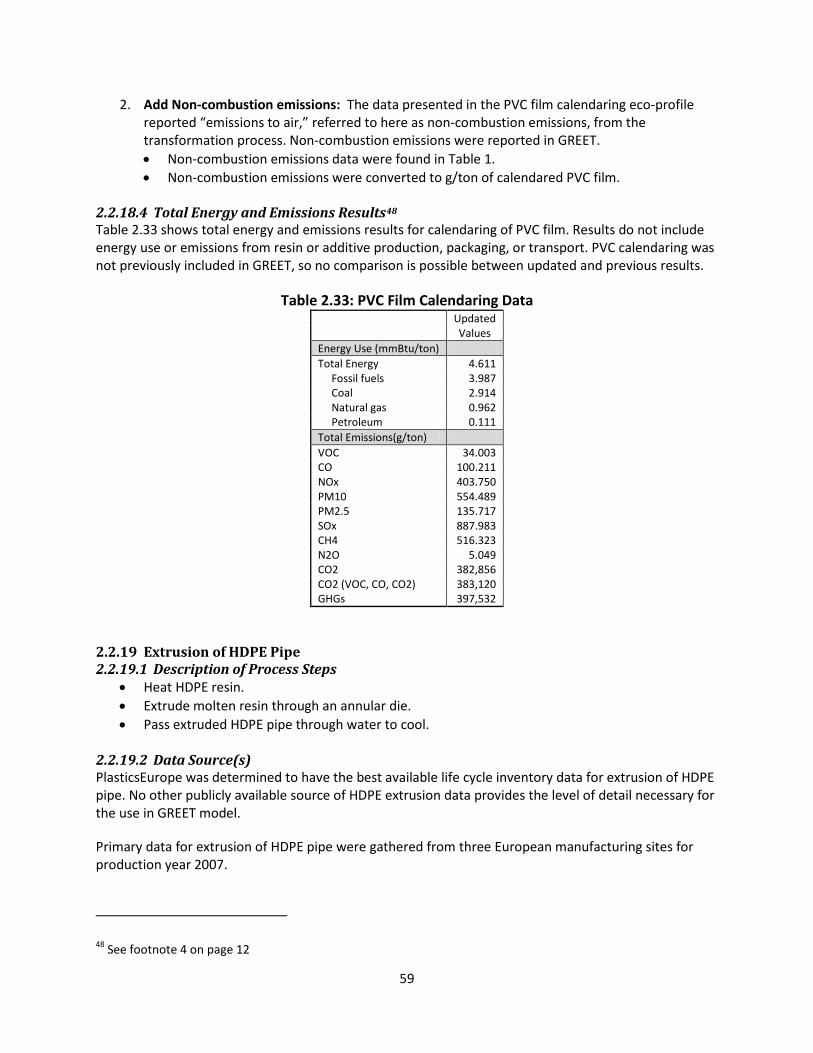
59
2. Add Non-combustion emissions: The data presented in the PVC film calendaring eco-profile reported “emissions to air,” referred to here as non-combustion emissions, from the transformation process. Non-combustion emissions were reported in GREET. • Non-combustion emissions data were found in Table 1. • Non-combustion emissions were converted to g/ton of calendared PVC film.
2.2.18.4 Total Energy and Emissions Results48 Table 2.33 shows total energy and emissions results for calendaring of PVC film. Results do not include energy use or emissions from resin or additive production, packaging, or transport. PVC calendaring was not previously included in GREET, so no comparison is possible between updated and previous results.
Table 2.33: PVC Film Calendaring Data Updated Values Energy Use (mmBtu/ton) Total Energy 4.611 Fossil fuels 3.987 Coal 2.914 Natural gas 0.962 Petroleum 0.111 Total Emissions(g/ton) VOC 34.003 CO 100.211 NOx 403.750 PM10 554.489 PM2.5 135.717 SOx 887.983 CH4 516.323 N2O 5.049 CO2 382,856 CO2 (VOC, CO, CO2) 383,120 GHGs 397,532
2.2.19 Extrusion of HDPE Pipe 2.2.19.1 Description of Process Steps
• Heat HDPE resin. • Extrude molten resin through an annular die. • Pass extruded HDPE pipe through water to cool.
2.2.19.2 Data Source(s) PlasticsEurope was determined to have the best available life cycle inventory data for extrusion of HDPE pipe. No other publicly available source of HDPE extrusion data provides the level of detail necessary for the use in GREET model.
Primary data for extrusion of HDPE pipe were gathered from three European manufacturing sites for production year 2007.
48 See footnote 4 on page 12

60
2.2.19.3 Data Preparation for GREET The following steps were used to prepare data from the PlasticsEurope pipe extrusion eco-profile for use in the GREET model.
1. Add fuel energy: The energy associated with process fuels was summed to find the “energy use” input for GREET. The following fuel categorizes were used:
o Electricity • Purchased process energy data were found in Table 2 in the pipe extrusion eco-profile. • Data were manipulated to convert reference flow from 1 kg to 1 ton of transformed
product. • Electricity data were converted from MJ to kWh and then to mmBtu/ton of extruded HDPE
pipe. 2.2.19.4 Total Energy and Emissions Results49 Table 2.34 shows total energy and emissions results for extrusion of HDPE pipe. Results do not include energy use or emissions from resin or additive production, packaging, or transport. HDPE extrusion was not previously included in GREET, so no comparison is possible between updated and previous results.
Table 2.34: HDPE Pipe Extrusion Data Updated Values Energy Use (mmBtu/ton) Total Energy 4.347 Fossil fuels 3.759 Coal 2.747 Natural gas 0.907 Petroleum 0.105 Total Emissions(g/ton) VOC 32.055 CO 92.474 NOx 380.607 PM10 486.988 PM2.5 127.943 SOx 837.100 CH4 486.745 N2O 4.760 CO2 360,903 CO2 (VOC, CO, CO2) 361,148 GHGs 374,735
2.2.20 Extrusion of PVC Pipe 2.2.20.1 Description of Process Steps
• Preheat PVC resin. • Extrude molten resin through an annular die. • Pass extruded PVC pipe through water to cool.
49 See footnote 4 on page 12

61
2.2.20.2 Data Source(s) PlasticsEurope was determined to have the best available life cycle inventory data for extrusion of PVC pipe. No other publicly available source of PVC extrusion data provides the level of detail necessary for use in the GREET model.
Primary data for extrusion of PVC pipe were gathered from four European manufacturing sites for production year 2007.
2.2.20.3 Data Preparation for GREET Data preparation for the PVC pipe extrusion followed the same procedure as for HDPE pipe extrusion (section 0) except that data was taken from Table 1 of the pipe extrusion eco-profile. 2.2.20.4 Total Energy and Emissions Results50 Table 2.35 shows total energy and emissions results for extrusion of PVC pipe. Results do not include energy use or emissions from resin or additive production, packaging, or transport. PVC extrusion was not previously included in GREET, so no comparison is possible between updated and previous results.
Table 2.35: PVC Pipe Extrusion Data Updated Values Energy Use (mmBtu/ton) Total Energy 4.188 Fossil fuels 3.621 Coal 2.646 Natural gas 0.874 Petroleum 0.101 Total Emissions(g/ton) VOC 30.883 CO 89.091 NOx 366.685 PM10 469.175 PM2.5 123.263 SOx 806.480 CH4 468.941 N2O 4.586 CO2 347,701 CO2 (VOC, CO, CO2) 347,937 GHGs 361,027
2.2.21 Extrusion of PP Pipe 2.2.21.1 Description of Process Steps
• Preheat PP resin. • Extrude molten resin through an annular die. • Pass extruded PP pipe through water to cool.
2.2.21.2 Data Source(s) PlasticsEurope was determined to have the best available life cycle inventory data for extrusion of PP pipe. No other publicly available source of PP extrusion data provides the level of detail necessary for use in the GREET model. 50 See footnote 4 on page 12

62
Primary data for extrusion of PP pipe were gathered from three European manufacturing sites for production year 2007.
2.2.21.3 Data Preparation for GREET Data preparation for the PP pipe extrusion followed the same procedure as for HDPE pipe extrusion (section 0) except that data was taken from Table 3 of the pipe extrusion eco-profile. 2.2.21.4 Total Energy and Emissions Results51 Table 2.36 shows total energy and emissions results for extrusion of PP pipe. Results do not include energy use or emissions from resin or additive production, packaging, or transport. PP extrusion was not previously included in GREET, so no comparison is possible between updated and previous results.
Table 2.36: PP Pipe Extrusion Data Updated Values Energy Use (mmBtu/ton) Total Energy 5.560 Fossil fuels 4.808 Coal 3.513 Natural gas 1.160 Petroleum 0.134 Total Emissions(g/ton) VOC 41.001 CO 118.279 NOx 486.817 PM10 622.885 PM2.5 163.646 SOx 1070.698 CH4 622.574 N2O 6.088 CO2 461,615 CO2 (VOC, CO, CO2) 461,928 GHGs 479,307
2.2.22 Injection Molding of HDPE 2.2.22.1 Description of Process Steps
• Heat HDPE resin. • Inject molten resin into a mold. • Cool mold with water and eject HDPE product from mold once solid.
2.2.22.2 Data Source(s) PlasticsEurope was determined to have the best available life cycle inventory data for injection molding of HDPE. No other publicly available source of HDPE injection molding data provides the level of detail necessary for use in the GREET model.
Primary data for injection molding of HDPE were gathered from three European manufacturing sites for production year 2007.
51 See footnote 4 on page 12

63
2.2.22.3 Data Preparation for GREET Data preparation for the HDPE injection molding followed the same procedure as for HDPE pipe extrusion (section 0) except that data was taken from Table 2 of the injection molding eco-profile. 2.2.22.4 Total Energy and Emissions Results52 Table 2.37 shows total energy and emissions results for injection molding of HDPE. Results do not include energy use or emissions from resin or additive production, packaging, or transport. HDPE injection molding was not previously included in GREET, so no comparison is possible between updated and previous results.
Table 2.37: HDPE Injection Molding Data Updated Values Energy Use (mmBtu/ton) Total Energy 15.862 Fossil fuels 13.715 Coal 10.022 Natural gas 3.310 Petroleum 0.383 Total Emissions(g/ton) VOC 116.969 CO 337.434 NOx 1388.821 PM10 1777.002 PM2.5 466.858 SOx 3054.551 CH4 1776.118 N2O 17.368 CO2 1,316,922 CO2 (VOC, CO, CO2) 1,317,817 GHGs 1,367,395
2.2.23 Injection Molding of PVC 2.2.23.1 Description of Process Steps
• Heat PVC resin. • Inject molten resin into a mold. • Cool mold with water and eject PVC product from mold once solid.
2.2.23.2 Data Source(s) PlasticsEurope was determined to have the best available life cycle inventory data for injection molding of PVC. No other publicly available source of PVC injection molding data provides the level of detail necessary for use in the GREET model.
Primary data for injection molding of PVC were gathered from four European manufacturing sites for production year 2007.
52 See footnote 4 on page 12
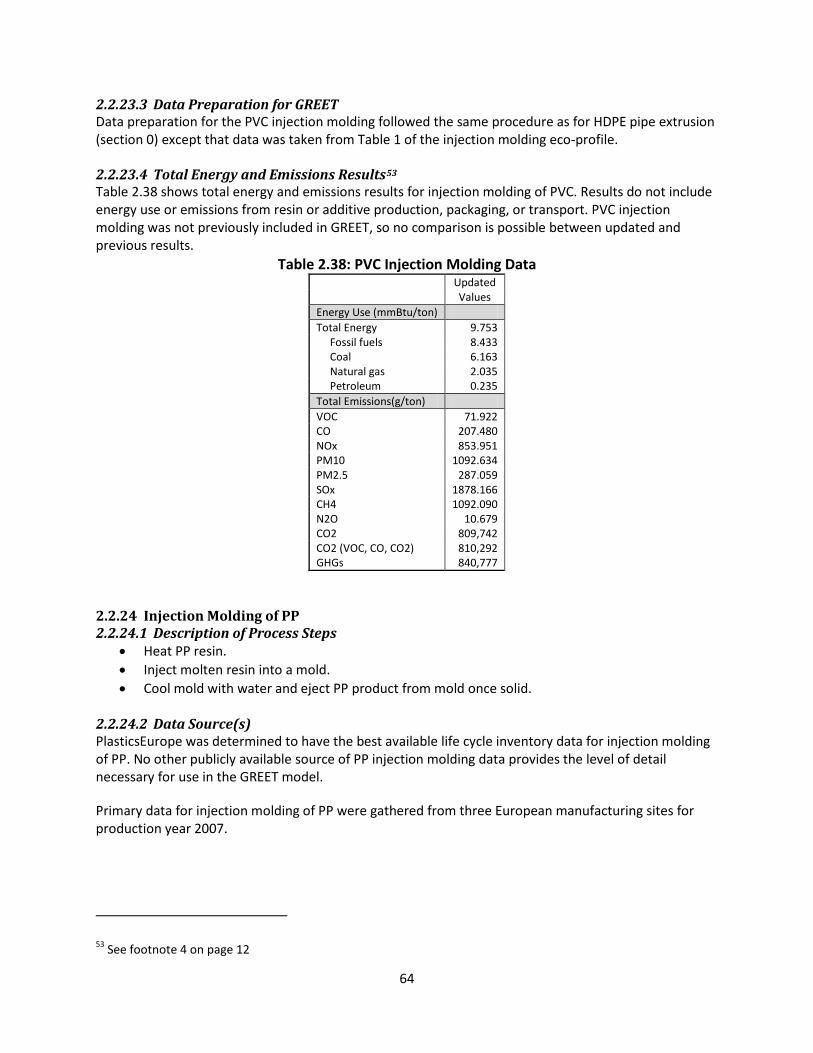
64
2.2.23.3 Data Preparation for GREET Data preparation for the PVC injection molding followed the same procedure as for HDPE pipe extrusion (section 0) except that data was taken from Table 1 of the injection molding eco-profile. 2.2.23.4 Total Energy and Emissions Results53 Table 2.38 shows total energy and emissions results for injection molding of PVC. Results do not include energy use or emissions from resin or additive production, packaging, or transport. PVC injection molding was not previously included in GREET, so no comparison is possible between updated and previous results.
Table 2.38: PVC Injection Molding Data Updated Values Energy Use (mmBtu/ton) Total Energy 9.753 Fossil fuels 8.433 Coal 6.163 Natural gas 2.035 Petroleum 0.235 Total Emissions(g/ton) VOC 71.922 CO 207.480 NOx 853.951 PM10 1092.634 PM2.5 287.059 SOx 1878.166 CH4 1092.090 N2O 10.679 CO2 809,742 CO2 (VOC, CO, CO2) 810,292 GHGs 840,777
2.2.24 Injection Molding of PP 2.2.24.1 Description of Process Steps
• Heat PP resin. • Inject molten resin into a mold. • Cool mold with water and eject PP product from mold once solid.
2.2.24.2 Data Source(s) PlasticsEurope was determined to have the best available life cycle inventory data for injection molding of PP. No other publicly available source of PP injection molding data provides the level of detail necessary for use in the GREET model.
Primary data for injection molding of PP were gathered from three European manufacturing sites for production year 2007.
53 See footnote 4 on page 12

65
2.2.24.3 Data Preparation for GREET Data preparation for the PP injection molding followed the same procedure as for HDPE pipe extrusion (section 0) except that data was taken from Table 3 of the injection molding eco-profile. 2.2.24.4 Total Energy and Emissions Results54 Table 2.39 shows total energy and emissions results for injection molding of PP. Results do not include energy use or emissions from resin or additive production, packaging, or transport. PP injection molding was not previously included in GREET, so no comparison is possible between updated and previous results.
Table 2.39: PP Injection Molding Data Updated Values Energy Use (mmBtu/ton) Total Energy 6.345 Fossil fuels 5.486 Coal 4.009 Natural gas 1.324 Petroleum 0.153 Total Emissions(g/ton) VOC 46.788 CO 134.974 NOx 555.529 PM10 710.801 PM2.5 186.743 SOx 1221.820 CH4 710.447 N2O 6.947 CO2 526,769 CO2 (VOC, CO, CO2) 527,127 GHGs 546,958
2.2.25 Compression Molding 2.2.25.1 Description of Process Steps
• Heat resin. • Extrude molten resin through an annular die. • Pass extruded polymer through water to cool. • Slicing and finishing of extruded polymer. • Molding, curing, and finishing of polymer.
2.2.25.2 Data Source(s) In a 2010 Argonne National Laboratory study, Sullivan, Burnham, and Wang modeled the energy use and emissions resulting from vehicle component manufacture, including transformation processes for plastics.55 The authors drew process energy data for tire and inner tube molding from Energy Analysis of
54 See footnote 4 on page 12 55 Sullivan, J. L., Burnham, A., and Wang, M. (2010) Energy-Consumption and Carbon-Emission Analysis of Vehicle Component Manufacturing. ANL/ESD/10-6. Argonne, IL: Center for Transportation Research, Energy Systems Division, Argonne National Laboratory.
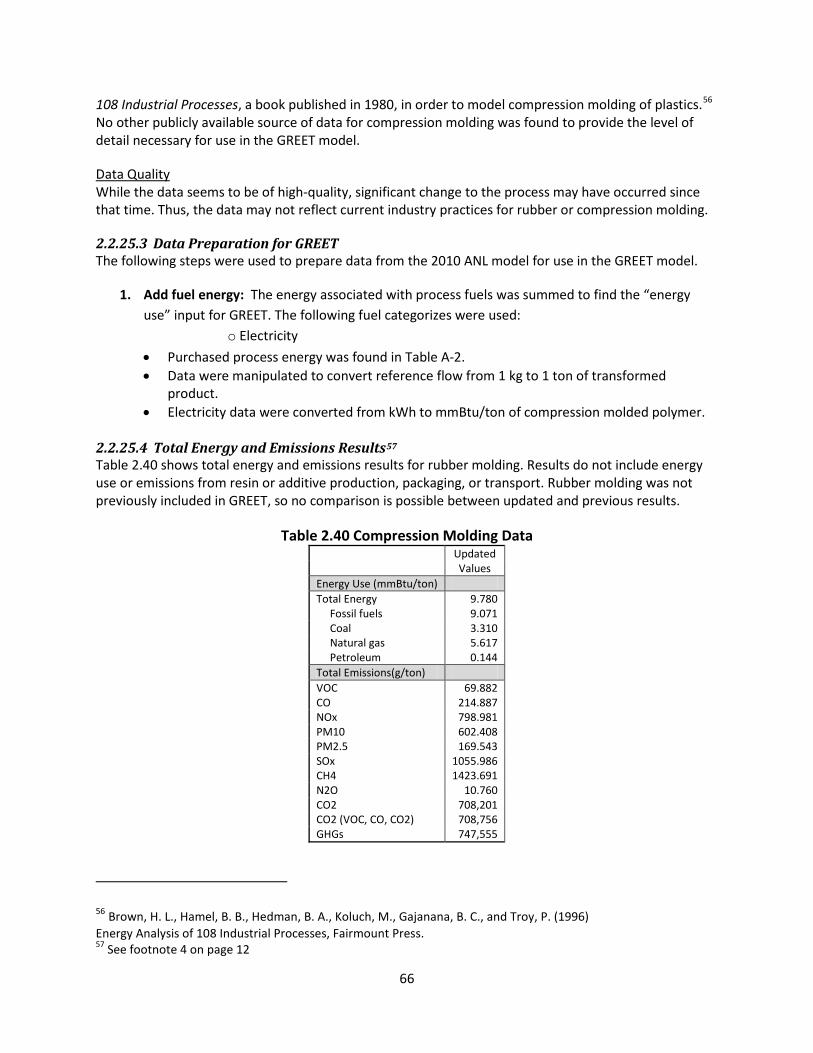
66
108 Industrial Processes, a book published in 1980, in order to model compression molding of plastics.56 No other publicly available source of data for compression molding was found to provide the level of detail necessary for use in the GREET model.
Data Quality While the data seems to be of high-quality, significant change to the process may have occurred since that time. Thus, the data may not reflect current industry practices for rubber or compression molding.
2.2.25.3 Data Preparation for GREET The following steps were used to prepare data from the 2010 ANL model for use in the GREET model.
1. Add fuel energy: The energy associated with process fuels was summed to find the “energy use” input for GREET. The following fuel categorizes were used:
o Electricity • Purchased process energy was found in Table A-2. • Data were manipulated to convert reference flow from 1 kg to 1 ton of transformed
product. • Electricity data were converted from kWh to mmBtu/ton of compression molded polymer.
2.2.25.4 Total Energy and Emissions Results57 Table 2.40 shows total energy and emissions results for rubber molding. Results do not include energy use or emissions from resin or additive production, packaging, or transport. Rubber molding was not previously included in GREET, so no comparison is possible between updated and previous results.
Table 2.40 Compression Molding Data Updated Values Energy Use (mmBtu/ton) Total Energy 9.780 Fossil fuels 9.071 Coal 3.310 Natural gas 5.617 Petroleum 0.144 Total Emissions(g/ton) VOC 69.882 CO 214.887 NOx 798.981 PM10 602.408 PM2.5 169.543 SOx 1055.986 CH4 1423.691 N2O 10.760 CO2 708,201 CO2 (VOC, CO, CO2) 708,756 GHGs 747,555
56 Brown, H. L., Hamel, B. B., Hedman, B. A., Koluch, M., Gajanana, B. C., and Troy, P. (1996) Energy Analysis of 108 Industrial Processes, Fairmount Press. 57 See footnote 4 on page 12
67
2.2.26 Average Transformed Plastic Products 2.2.26.1 Description of Process Steps
• Transformation of plastic resins into semi-finished products via blow molding, calendaring, extrusion, injection molding, and compression molding.
2.2.26.2 Data Source(s) The USAMP study58 provided data on the percent by weight of each type of plastic in an average family sedan. Even though this data represents plastic composition of a car in 1995, more recent data was not found.
In a 2010 Argonne National Laboratory study, Sullivan, Burnham, and Wang modeled the energy use and emissions resulting from vehicle component manufacture. Data were presented for the percent of curb weight of each transformation type for a given plastic resin. If data for the actual transformation process was not available, the best surrogate transformation method was indicated. 2.2.26.3 Data Preparation for GREET The following steps were taken to combine resin production and plastic transformation modules to model the energy use and emissions of semi-finished plastic products.
1. Calculation of transformation weights: Determine how much each transformation type is used to convert each plastic resin into 1 ton of transformed plastic product. • The percent of curb weight for each transformation of a particular resin was drawn from
Table A-1 in the appendices of the 2010 ANL study. No data was available for HIPS, GPPS, or epoxy, so no transformations were applied to those resins.
• The percent of curb weight of each resin was acquired from Table 2 of the USAMP study. • To find the share of each transformation type used on each plastic resin, the percent of curb
weight for each transformation of a given resin was divided by the percent of curb weight of each resin. (See Table 2.41)
2. Calculation of the average plastic product: The energy and emissions profile of an average ton of transformed plastic was calculated. • The total energy and emissions datasets for each transformation was weighted by the
resulting percentages from step 1 above for each resin and added to the total energy and emissions datasets for the production of each resin.
• Material input into each transformation process was calculated from PlasticsEurope data. Any minor resins and other additives were summed together with the dominant resin and modeled as such. The mass input factors are shown in Table 2.42.
• The weights for polyethylene (PE) were applied to HDPE, LDPE, and LLDPE.
58 Sullivan, J., et al (1998) Life Cycle Inventory of a Generic U.S. Family Sedan Overview of Results USCAR AMP Project. Society of Automotive Engineers. SAE #982160.

68
Table 2.41: Weights for Transformations for Each Resin, % by weight
PP PVC Nylon 66 ABS EPDM PE PC PET Nylon 6 Blow Molding 9.2% 0.0% 0.0% 0.0% 0.0% 0.0% 0.0% 0.0% 36.4% Calendering 0.0% 18.1% 0.0% 0.0% 0.0% 0.0% 0.0% 0.0% 0.0% Compression Molding 15.3% 1.5% 34.3% 23.8% 31.9% 24.3% 22.0% 50.0% 45.4% Extrusion (HDPE) 0.0% 0.0% 29.9% 17.5% 27.5% 9.3% 0.0% 0.0% 0.0% Extrusion (PVC) 0.0% 51.1% 0.0% 0.0% 0.0% 0.0% 0.0% 0.0% 0.0% Extrusion (PP) 1.9% 0.0% 0.0% 0.0% 0.0% 0.0% 0.0% 0.0% 0.0% Inj. Molding (HDPE) 0.0% 0.0% 0.0% 0.0% 0.0% 66.5% 0.0% 0.0% 0.0% Inj. Molding (PVC) 0.0% 29.3% 0.0% 0.0% 0.0% 0.0% 0.0% 0.0% 0.0% Injection Molding (PP) 73.6% 0.0% 35.8% 58.7% 40.6% 0.0% 78.0% 50.0% 18.2%
Table 2.42: Mass of Resin Input into Plastics Transformation Processes
Tons of Resin Input
per Ton of Transformed Product Blow Molding 1.0003 Calendaring 1.1554 Compression Molding 1.0000 Extrusion (HDPE) 0.9459 Extrusion (PVC) 1.0024 Extrusion (PP) 1.0018 Injection Molding (HDPE) 1.0056 Injection Molding (PVC) 1.0307 Injection Molding (PP) 1.1393
3. Calculation of fiber-reinforced plastics: Glass fiber-reinforced plastic (GFRP) and carbon fiber-
reinforced plastic (CFRP) modules were developed using liquid epoxy resin in addition to existing GREET datasets for glass fiber, carbon fiber, and a reinforced plastic fabrication. Epoxy is a common thermosetting polymer used in glass and carbon fiber-reinforced plastics and was used as a representative resin for all thermosetting plastics used in GFRP or CFRP. • The epoxy and glass fiber modules were weighted and summed according to the percent
composition seen in Table 2.43, which was taken from GREET 2.7. • The epoxy module and carbon fiber modules were weighted and summed according to the
percent composition seen in Table 2.43. • The combined datasets were then multiplied by a factor of 1.140 to adjust for the tons of
intermediate product needed for 1 ton of final GFRP or CFRP product. • The module for reinforced plastic fabrication found in GREET 2.7 was added to both of the
datasets resulting from the previous step to account for the final transformation stages of the reinforced plastics.

69
Table 2.43: Composition of GFRP and CFRP, % by weight
Epoxy Fiber Tons of Intermediate Material Needed for 1
Ton of Final Reinforced Plastic Product GFRP 50.0% 50.0% 1.140 CFRP 70.0% 30.0% 1.140
2.2.26.4 Total Energy and Emissions Results59
Table 2.44: Results for an Average Ton of Transformed HDPE, LDPE, and LLDPE HDPE LDPE LLDPE Average Average Average Energy Use (mmBTU/ton) Total Energy 76.928 81.543 76.740 Fossil fuels 74.890 79.489 74.757 Coal 9.523 9.596 9.266 Natural gas 55.843 60.369 56.013 Petroleum 9.524 9.524 9.477 Total Emissions(g/ton) VOC 858.958 902.888 863.810 CO 3251.672 3336.983 3295.765 NOx 2152.937 2395.119 2921.624 PM10 1868.675 1878.519 1799.084 PM2.5 491.890 497.341 475.143 SOx 24230.925 24711.985 24717.936 CH4 16595.700 17464.853 16607.798 N2O 29.776 34.979 44.630 CO2 2,368,420 2,605,322 3,473,744 CO2 (VOC, CO, CO2) 2,376,207 2,613,380 3,481,615 GHGs 2,799,972 3,060,425 3,910,110
Table 2.45: Results for an Average Ton of Transformed PP, PET, and PVC
PP PET PVC Average Average Average Energy Use (mmBTU/ton) Total Energy 76.574 67.496 54.542 Fossil fuels 75.182 65.683 52.796 Coal 6.507 9.249 8.612 Natural gas 48.394 29.381 39.370 Petroleum 20.282 27.053 4.814 Total Emissions(g/ton) VOC 746.481 416.088 539.951 CO 6511.362 13725.424 1923.840 NOx 2148.137 3211.003 2478.877 PM10 1314.915 1932.075 1692.034 PM2.5 344.143 611.258 477.222 SOx 21694.811 10416.232 12958.041 CH4 15275.279 10976.994 10764.487 N2O 26.574 39.764 34.117 CO2 2,011,848 2,811,167 2,393,428 CO2 (VOC, CO, CO2) 2,024,407 2,834,032 2,398,134 GHGs 2,414,208 3,120,307 2,677,413
59 See footnote 4 on page 12
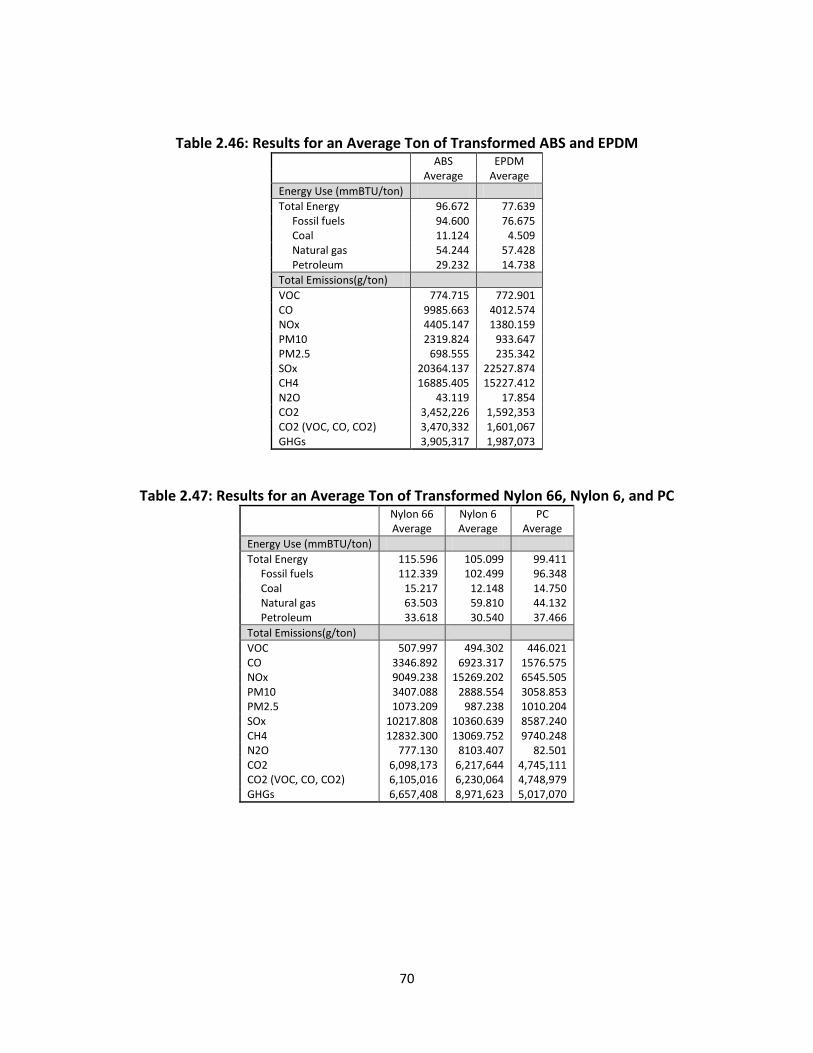
70
Table 2.46: Results for an Average Ton of Transformed ABS and EPDM ABS EPDM Average Average Energy Use (mmBTU/ton) Total Energy 96.672 77.639 Fossil fuels 94.600 76.675 Coal 11.124 4.509 Natural gas 54.244 57.428 Petroleum 29.232 14.738 Total Emissions(g/ton) VOC 774.715 772.901 CO 9985.663 4012.574 NOx 4405.147 1380.159 PM10 2319.824 933.647 PM2.5 698.555 235.342 SOx 20364.137 22527.874 CH4 16885.405 15227.412 N2O 43.119 17.854 CO2 3,452,226 1,592,353 CO2 (VOC, CO, CO2) 3,470,332 1,601,067 GHGs 3,905,317 1,987,073
Table 2.47: Results for an Average Ton of Transformed Nylon 66, Nylon 6, and PC Nylon 66 Nylon 6 PC Average Average Average Energy Use (mmBTU/ton) Total Energy 115.596 105.099 99.411 Fossil fuels 112.339 102.499 96.348 Coal 15.217 12.148 14.750 Natural gas 63.503 59.810 44.132 Petroleum 33.618 30.540 37.466 Total Emissions(g/ton) VOC 507.997 494.302 446.021 CO 3346.892 6923.317 1576.575 NOx 9049.238 15269.202 6545.505 PM10 3407.088 2888.554 3058.853 PM2.5 1073.209 987.238 1010.204 SOx 10217.808 10360.639 8587.240 CH4 12832.300 13069.752 9740.248 N2O 777.130 8103.407 82.501 CO2 6,098,173 6,217,644 4,745,111 CO2 (VOC, CO, CO2) 6,105,016 6,230,064 4,748,979 GHGs 6,657,408 8,971,623 5,017,070

71
Table 2.48: Results for 1 Ton of Final GFRP and CFRP Product Glass Fiber-Reinforced Plastic Carbon Fiber-Reinforced Plastic Average Average Energy Use (mmBTU/ton) Total Energy 72.677 137.937 Fossil fuels 70.727 135.770 Coal 9.137 10.346 Natural gas 46.399 80.522 Petroleum 15.192 44.902 Total Emissions(g/ton) VOC 379.435 766.683 CO 2074.228 2901.387 NOx 10863.583 12374.462 PM10 5126.528 7845.488 PM2.5 736.654 1653.069 SOx 9702.409 12775.011 CH4 9199.739 17503.488 N2O 63.373 112.754 CO2 4,085,748 8,323,559 CO2 (VOC, CO, CO2) 4,090,190 8,330,508 GHGs 4,339,068 8,801,696

72
3 Summary of Total Energy and Greenhouse Gas Emissions The total energy and total GHG emissions resulting from modeling the raw materials along with the respective material transformations in GREET are shown in Table 3.1. Table 3.1: Summary of Total Energy and GHG Emissions by Raw Material60
Calculated Results GREET 2.7 Total Energy GHG Emissions Total Energy GHG Emissions mmBtu/ton grams/ton mmBtu/ton grams/ton Steel Product
Primary 51.189 4,060,444 38.771 4,899,199 Secondary 20.441 1,677,140 29.337 2,056,470 Aluminum Product
Cast Aluminum (Primary) 115.352 9,850,535 132.856 9,173,556 Extruded Aluminum (Primary) 111.635 9,633,395
Wrought Aluminum (Primary) 122.985 10,533,730 157.507 11,023,858 Nickel Product
Primary 181.208 13,825,194 127.174 10,709,097 Copper Product
Primary 43.299 3,030,844 95.706 7,691,790 Plastics Product
HDPE 77.01 2,802,119 45.977 3,521,214 LDPE 81.631 3,062,905 LLDPE 81.631 3,913,680 PP 70.152 2,248,634 42.063 3,256,624 PET 63.626 2,959,275 PVC 52.748 2,597,512 ABS 90.613 3,680,061 PS 74.809 1,930,118 Nylon 6 63.626 2,959,275 Nylon 66 112.054 6,458,801 PC 90.364 4,583,301 EPDM 74.809 1,930,118 PUR (Rigid Foam) 64.253 2,980,126 PUR (Flexible Foam) 68.704 3,357,942 Fiber Reinforced Plastic Glass Fiber Reinforced 72.677 4,339,068 63.266 5,200,982 Carbon Fiber Reinforced 137.937 8,801,696 130.423 10,437,082
Results from this project vary from existing GREET values based on a variety of factors including difference in source data, alternative modeling approaches, and data gaps. A more detailed discussion of sources of discrepancy can be found in Section 1.3. In general, it is difficult to determine the cause of discrepancy when comparing to the existing GREET model because of a lack of documentation.
4 Discussion of Results for Future GREET Updates In this project, raw material production and transformation processes were modeled using best available data. The degree to which the results of this project are representative of these processes as
60 See footnote 4 on page 12

73
well as guidance to Argonne National Laboratory for using these results to update GREET are discussed briefly by material type.
• Steel The steel results were based on data from the Athena Sustainable Materials. While the data were not recent (1993-2003), the report is relatively comprehensive and transparent. As such, it is believed that the inclusion of the steel results from this project would improve the model. In the future, if sufficiently detailed data were made available from the World Steel Association, these data would likely be preferable to the Athena data because it is significantly more recent.
• Aluminum The primary aluminum data came from Life Cycle Impact Assessment of Aluminum Beverage Cans (2010) report, which is believed to be the most representative of the industry. Secondary aluminum production as well as transformation processes were based on data from the Aluminum Association Report, Life Cycle Inventory Report for the Aluminum Industry (1998). While the data are not very current, the report is very detailed and remains a good resource for updating the GREET model.
• Nickel The nickel results from this project are not believed to be very representative of current nickel production. They are based on data from the Nickel Institute which are aggregated to include upstream energy and are outdated. The Nickel Institute is planning to collect new data in 2012, with intentions of publishing new results in 2013. These updated data should be reviewed and considered for use in the GREET model.
• Copper International Copper Association (ICA) is preparing to publish life cycle inventory data shortly. Unfortunately, these data were not available in time to include in this project. They should be reviewed for considered for inclusion into GREET as they would likely be preferable to results from this project, which likely underestimate energy and emission burdens. • HDPE, LDPE, LLDPE, PP, PET, GPPS, HIPS, PVC, ABS The results for these plastics were based on data from the American Chemistry Council, which were compiled by Franklin Associates. The ACC report and appendix demonstrates a high degree of rigor, detail, and transparency, and as such was a strong source for updating GREET. A revised report from Franklin with updated mass balance flows is anticipated soon. It is advisable that the GREET update reflect the revised data when it becomes available. • Nylon 6, Nylon 66, Liquid Epoxy Resin, Polycarbonate The results for these plastics were based on data from PlasticsEurope, assembled by several well-known LCA practitioners. PlasticsEurope receives data from many plastics manufacturers throughout Europe and continually updates their plastics eco-profiles. Thus, the data for these plastics are recommended for use in the GREET model. However, PC energy use was only provided in terms of primary energy and purchased energy had to be back calculated. Updates to nylon 6, nylon 66, liquid epoxy, and PC modules in GREET should be made as new eco-profiles are made available by PlasticsEurope.

74
• EPDM The results of this resin were based on current data from the American Chemistry Council, which were compiled by Franklin Associates. Due to the rigor of the ACC plastics data, this was considered to be a good representation of EPDM. As no data for ethylidene norbornene was available; its precursor butadiene was used as substitute. If data for ethylidene norbornene becomes available, it should be used to replace the butadiene portion of the model. Additionally, it is advisable that the GREET update reflect the modified data from the revised ACC data when it becomes available.
• Rigid PUR foam, Flexible PUR foam Rigid and flexible PUR foam results were based on a hybrid of North American PUR precursor and European final foam production stage data due to the lack of final foam production stage data for North American producers and incorrect HCl allocation in PlasticsEurope’s TDI and MDI data. Since assumptions of material composition were used to create the hybrid PUR foam models for this report, a new, corrected version of PlasticsEurope’s full rigid and flexible PUR foam production eco-profiles would likely be a better representation of PUR foam production.

APPENDIX: Life Cycle Material Data Update for GREET Model

i
Index Metals Data Pg Number
Steel .................................................................................................................................................. 1
Limestone Extraction and Processing
Ore Extraction and Processing
Coke Production
Sintering
Blast Furnace
Basic Oxygen Furnace
Hot Rolling
Skin Mill
Cold Rolling
Galvanizing
Electric Arc Furnace
Rod and Bar Mill
Stamping
Blast Furnace and Coke Oven Gas Combustion Factors
Comparison of Virgin Steel Data
Comparison of Recycled Steel Data
Aluminum ........................................................................................................................................ 17
Bauxite Mining
Alumina Production
Anode Production
Electrolysis
Ingot Casting

ii
Secondary Production
Hot Rolling
Cold Rolling
Extrusion
Shape Casting
Comparison of Cast Aluminum Data
Comparison of Wrought Aluminum Data
Comparison of Extruded Aluminum Data
Nickel .............................................................................................................................................. 30
Nickel Ore Mining (con’t)
Beneficiation (con’t)
Primary Extraction (con’t)
Refining (con’t)
Comparison of Nickel Data
Copper............................................................................................................................................. 40
Ore Mining
Copper Production
Wire Drawing
Secondary Copper
Comparison of Copper Data

iii
Plastics Data
ABS.................................................................................................................................................. 43
Acrylonitrile‐Butadiene‐Styrene Production (con’t)
Comparison of ABS Data
EPDM .............................................................................................................................................. 46
Ethylene Propylene Diene Monomer Production (con’t)
Comparison of EPDM Data
Epoxy .............................................................................................................................................. 49
Liquid Epoxy Production (con’t)
Comparison of Epoxy Data
GPPS ................................................................................................................................................ 52
General‐Purpose Polystyrene Production (con’t)
Comparison of GPPS Data
HIPS ................................................................................................................................................. 55
High‐Impact Polystyrene Production (con’t)
Comparison of HIPS Data
HDPE ............................................................................................................................................... 58
High‐Density Polyethylene Production (con’t)
Comparison of HDPE Data
LDPE ................................................................................................................................................ 61
Low Density Polyethylene Production (con’t)
Comparison of LDPE Data
LLDPE .............................................................................................................................................. 64
Linear‐Low Density Polyethylene Production (con’t)
Comparison of LLDPE Data
Nylon 6 ............................................................................................................................................ 67
Nylon 6 Production (con’t)

iv
Comparison of Nylon 6 Data
Nylon 66 .......................................................................................................................................... 70
Nylon 66 Production (con’t)
Comparison of Nylon 66 Data
PC .................................................................................................................................................... 73
Polycarbonate Production (con’t)
Comparison of PC Data
PET .................................................................................................................................................. 76
Polyester Terephthalate Production (cont'd)
Comparison of PET Data
PP .................................................................................................................................................... 79
Polypropylene Production (cont'd)
Comparison of PP Data
PUR (Flexible Foam) ......................................................................................................................... 82
Flexible Polyurethane Foam Production (cont'd)
Comparison of Flexible PUR Foam Data
PUR (Rigid Foam) ............................................................................................................................. 85
Rigid Polyurethane Foam Production (cont'd)
Comparison of Rigid PUR Foam Data
PVC ................................................................................................................................................. 88
Polyvinyl Chloride Production (cont'd)
Comparison of PVC Data
Plastic Precursors ............................................................................................................................. 91
Flexible PUR Foam Production
MDI Production (European)
MDI Production
Polyol for Flexible PUR Foam Production

v
Polyol for Rigid Foam Production
Polyol Production (European)
Rigid PUR Foam Production (European)
TDI Production (European)
TDI Production
Plastic Transformation Processes.................................................................................................... 109
Blow Molding HDPE
Comparison of Blow Molded HDPE Data
HDPE Extrusion
Comparison of Extruded HDPE Data
HDPE Injection Molding
Comparison of Injection Molded HDPE Data
Extrusion of PP
Comparison of Extruded PP Data
PP Injection Molding
Comparison of Injection Molded PP Data
PVC Calendaring
Comparison of Calendared PVC Data
PVC Extrusion
Comparison of Extruded PVC Data
PVC Injection Molding
Comparison of Injection Molded PVC Data

Reference Unit: 1 ton of Lime/Limestone Mix
Principal Data Source(s): Athena Sustainable Material InsitituteGeographic Location: Canada and USTimeframe: c. 1993‐2003Description:
MATERIAL PRODUCTION DATA
Energy ContentValue Unit ( MMBtu)
Resid. oil gal
Diesel 0.232 gal 0.030
Natural gas 3082.719 cu ft 3.030
Coal lb
Electricity 29.818 kWh 0.102
Crude Oil gal
Distillate Oil gal
Gasoline gal
LPG gal
MISC: Oil as feed gal
MISC: NG as feed cu ftMISC: Coal as feed lb
MISC: Coke lb
MISC: Blast furnace gas cu ftMISC: Coke oven gas cu ftMISC: Blast furnace gas (credit) cu ftMISC: Coke oven gas (credit) cu ftTOTAL
Non‐combustion Emissions Value Unit
VOC g
CO g
NOx g
PM10 g
PM2.5 g
SOx 630.247 g
CH4 g
N2O g
CO2 419922.463 g
Notes:
Physical Units calculated using GREET
Limestone Extraction and Processing
Fuel InputsPhysical Units
Mix is approx 45% Limestone, 39% Burnt Lime, 16% Dolomite
Energy content calculated using GREET heating values and Athena data (for coke, coke oven gas, and blast furnace gas).
1

Reference Unit: 1 ton of processed/pelletized iron orePrincipal Data Source(s): Athena Sustainable Material InsitituteGeographic Location: Canada and USTimeframe: c. 1993‐2003Description:
MATERIAL PRODUCTION DATA
Energy ContentValue Unit ( MMBtu)
Resid. oil 1.19 gal 0.167
Diesel 0.22 gal 0.028
Natural gas 179.32 cu ft 0.176
Coal lb
Electricity 368.56 kWh 1.258
Crude Oil gal
Distillate Oil gal
Gasoline gal
LPG gal
MISC: Oil as feed gal
MISC: NG as feed cu ftMISC: Coal as feed lb
MISC: Coke lb
MISC: Blast furnace gas cu ftMISC: Coke oven gas cu ftMISC: Blast furnace gas (credit) cu ftMISC: Coke oven gas (credit) cu ftTOTAL
Non‐combustion Emissions Value Unit
VOC 0.218 g
CO 1.770 g
NOx 3.541 g
PM10 g
PM2.5 g
SOx 0.354 g
CH4 g
N2O g
CO2 218.261 g
Notes:
Physical Units calculated using GREET
Ore Extraction and Processing
Fuel InputsPhysical Units
Energy content calculated using GREET heating values and Athena data (for coke, coke oven gas, and blast furnace gas).
2

Reference Unit: 1 ton of cokePrincipal Data Source(s): Athena Sustainable Material InsitituteGeographic Location: Canada and USTimeframe: c. 1993‐2003Description:
MATERIAL PRODUCTION DATA
Energy ContentValue Unit ( MMBtu)
Resid. oil gal
Diesel gal
Natural gas cu ftCoal lb
Electricity 110.509 kWh 0.377
Crude Oil gal
Distillate Oil gal
Gasoline gal
LPG gal
MISC: Oil as feed gal
MISC: NG as feed cu ftMISC: Coal as feed 3618.788 lb 35.367
MISC: Coke ‐1814.370 lb ‐25.674MISC: Blast furnace gas cu ftMISC: Coke oven gas 5896.375 cu ft 2.829
MISC: Blast furnace gas (credit) cu ftMISC: Coke oven gas (credit) ‐14729.682 cu ft ‐7.068TOTAL
Non‐combustion Emissions Value Unit
VOC 3378.403 g
CO 750.047 g
NOx 401.811 g
PM10 1515.402 g
PM2.5 757.701 g
SOx 2353.465 g
CH4 g
N2O g
CO2 6708.333 g
Notes:
Physical Units calculated using GREET
Coke Production
Fuel InputsPhysical Units
Energy content calculated using GREET heating values and Athena data (for coke, coke oven gas, and blast furnace gas).
3

Reference Unit: 1 ton of sinterPrincipal Data Source(s): Athena Sustainable Material InsitituteGeographic Location: Canada and USTimeframe: c. 1993‐2003Description:
MATERIAL PRODUCTION DATA
Energy ContentValue Unit ( MMBtu)
Resid. oil gal
Diesel gal
Natural gas cu ftCoal lb
Electricity 115.325 kWh 0.394
Crude Oil gal
Distillate Oil gal
Gasoline gal
LPG gal
MISC: Oil as feed gal
MISC: NG as feed cu ftMISC: Coal as feed lb
MISC: Coke 70.911 lb 1.003
MISC: Blast furnace gas cu ftMISC: Coke oven gas 334.217 cu ft 0.160
MISC: Blast furnace gas (credit) cu ftMISC: Coke oven gas (credit) cu ftTOTAL
Non‐combustion Emissions Value Unit
VOC 308.250 g
CO 20268.449 g
NOx 112.051 g
PM10 1859.729 g
PM2.5 929.865 g
SOx 220.105 g
CH4 g
N2O g
CO2 190377.123 g
Notes:
Physical Units calculated using GREET
Sintering
Fuel InputsPhysical Units
Energy content calculated using GREET heating values and Athena data (for coke, coke oven gas, and blast furnace gas).
4

Reference Unit: 1 ton of liquid ironPrincipal Data Source(s): Athena Sustainable Material InsitituteGeographic Location: Canada and USTimeframe: c. 1993‐2003Description:
MATERIAL PRODUCTION DATA
Energy ContentValue Unit ( MMBtu)
Resid. oil gal
Diesel gal
Natural gas cu ftCoal lb
Electricity 105.069 kWh 0.359
Crude Oil gal
Distillate Oil gal
Gasoline gal
LPG gal
MISC: Oil as feed 9.798 gal 1.271
MISC: NG as feed 348.077 cu ft 0.342
MISC: Coal as feed lb
MISC: Coke 802.721 lb 11.359
MISC: Blast furnace gas 45665.107 cu ft 3.958
MISC: Coke oven gas 1382.656 cu ft 0.663
MISC: Blast furnace gas (credit) ‐48158.125 cu ft ‐4.174MISC: Coke oven gas (credit) cu ftTOTAL
Non‐combustion Emissions Value Unit
VOC 1282.961 g
CO 16616.418 g
NOx 13.795 g
PM10 7.211 g
PM2.5 g
SOx 1374.512 g
CH4 g
N2O g
CO2 52215.772 g
Notes:
Physical Units calculated using GREET
Blast Furnace
Fuel InputsPhysical Units
Energy content calculated using GREET heating values and Athena data (for coke, coke oven gas, and blast furnace gas).
5
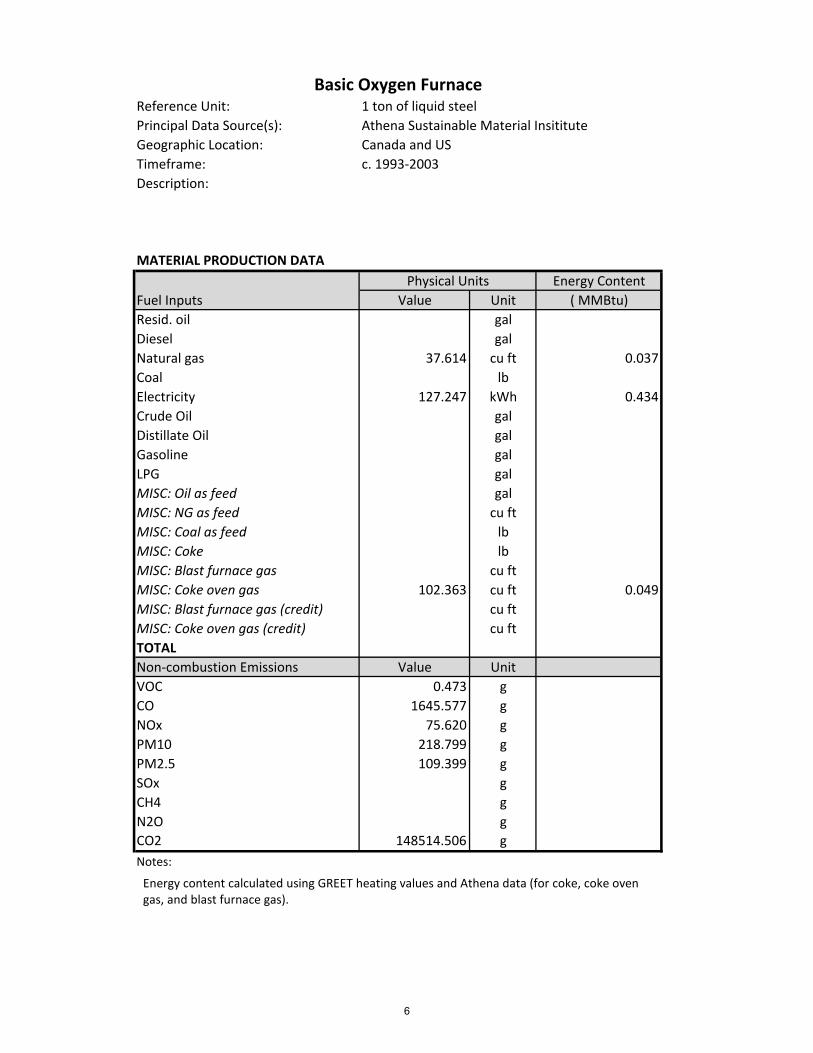
Reference Unit: 1 ton of liquid steelPrincipal Data Source(s): Athena Sustainable Material InsitituteGeographic Location: Canada and USTimeframe: c. 1993‐2003Description:
MATERIAL PRODUCTION DATA
Energy ContentValue Unit ( MMBtu)
Resid. oil gal
Diesel gal
Natural gas 37.614 cu ft 0.037
Coal lb
Electricity 127.247 kWh 0.434
Crude Oil gal
Distillate Oil gal
Gasoline gal
LPG gal
MISC: Oil as feed gal
MISC: NG as feed cu ftMISC: Coal as feed lb
MISC: Coke lb
MISC: Blast furnace gas cu ftMISC: Coke oven gas 102.363 cu ft 0.049
MISC: Blast furnace gas (credit) cu ftMISC: Coke oven gas (credit) cu ftTOTAL
Non‐combustion Emissions Value Unit
VOC 0.473 g
CO 1645.577 g
NOx 75.620 g
PM10 218.799 g
PM2.5 109.399 g
SOx g
CH4 g
N2O g
CO2 148514.506 g
Notes:
Physical Units calculated using GREET
Basic Oxygen Furnace
Fuel InputsPhysical Units
Energy content calculated using GREET heating values and Athena data (for coke, coke oven gas, and blast furnace gas).
6
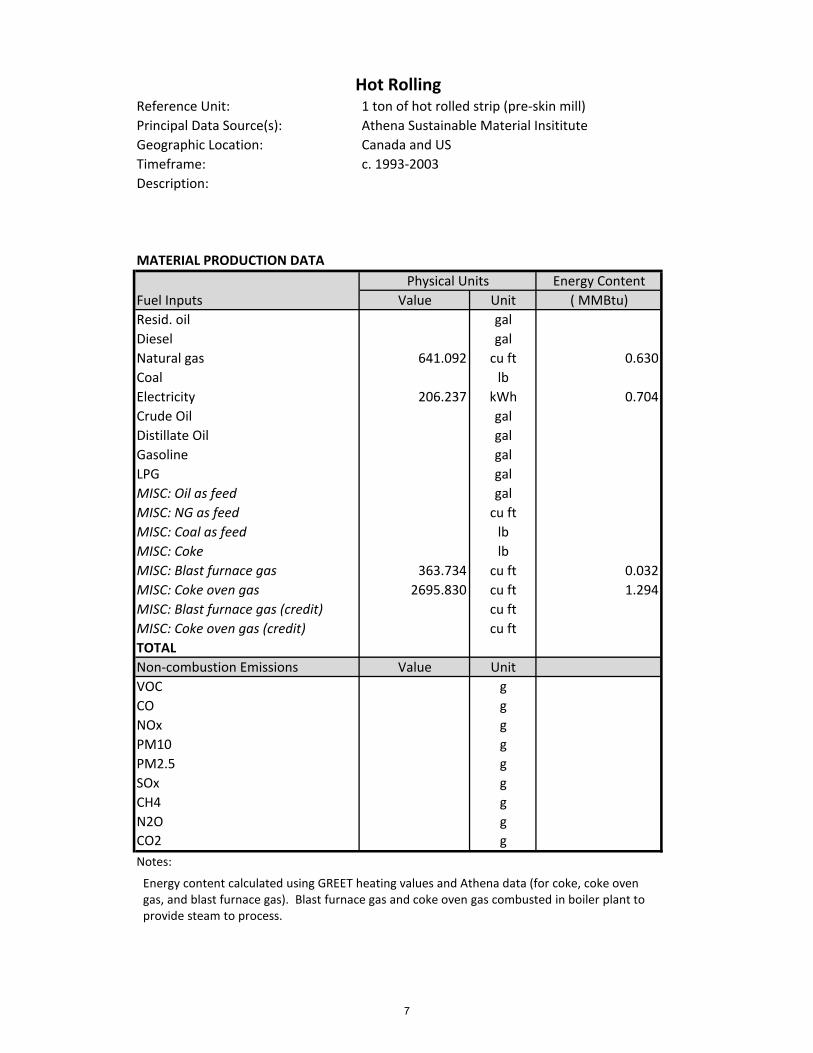
Reference Unit: 1 ton of hot rolled strip (pre‐skin mill)
Principal Data Source(s): Athena Sustainable Material InsitituteGeographic Location: Canada and USTimeframe: c. 1993‐2003Description:
MATERIAL PRODUCTION DATA
Energy ContentValue Unit ( MMBtu)
Resid. oil gal
Diesel gal
Natural gas 641.092 cu ft 0.630
Coal lb
Electricity 206.237 kWh 0.704
Crude Oil gal
Distillate Oil gal
Gasoline gal
LPG gal
MISC: Oil as feed gal
MISC: NG as feed cu ftMISC: Coal as feed lb
MISC: Coke lb
MISC: Blast furnace gas 363.734 cu ft 0.032
MISC: Coke oven gas 2695.830 cu ft 1.294
MISC: Blast furnace gas (credit) cu ftMISC: Coke oven gas (credit) cu ftTOTAL
Non‐combustion Emissions Value Unit
VOC g
CO g
NOx g
PM10 g
PM2.5 g
SOx g
CH4 g
N2O g
CO2 g
Notes:
Physical Units calculated using GREET
Hot Rolling
Fuel InputsPhysical Units
Energy content calculated using GREET heating values and Athena data (for coke, coke oven gas, and blast furnace gas). Blast furnace gas and coke oven gas combusted in boiler plant to provide steam to process.
7

Reference Unit: 1 ton of hot rolled sheetPrincipal Data Source(s): Athena Sustainable Material InsitituteGeographic Location: Canada and USTimeframe: c. 1993‐2003Description:
MATERIAL PRODUCTION DATA
Energy ContentValue Unit ( MMBtu)
Resid. oil gal
Diesel gal
Natural gas cu ftCoal lb
Electricity 12.247 kWh 0.042
Crude Oil gal
Distillate Oil gal
Gasoline gal
LPG gal
MISC: Oil as feed gal
MISC: NG as feed cu ftMISC: Coal as feed lb
MISC: Coke lb
MISC: Blast furnace gas 363.734 cu ft 0.032
MISC: Coke oven gas 1.911 cu ft 0.001
MISC: Blast furnace gas (credit) cu ftMISC: Coke oven gas (credit) cu ftTOTAL
Non‐combustion Emissions Value Unit
VOC g
CO g
NOx g
PM10 g
PM2.5 g
SOx g
CH4 g
N2O g
CO2 g
Notes:
Physical Units calculated using GREET
Skin Mill
Fuel InputsPhysical Units
Energy content calculated using GREET heating values and Athena data (for coke, coke oven gas, and blast furnace gas). Blast furnace gas and coke oven gas combusted in boiler plant to provide steam to process.
8
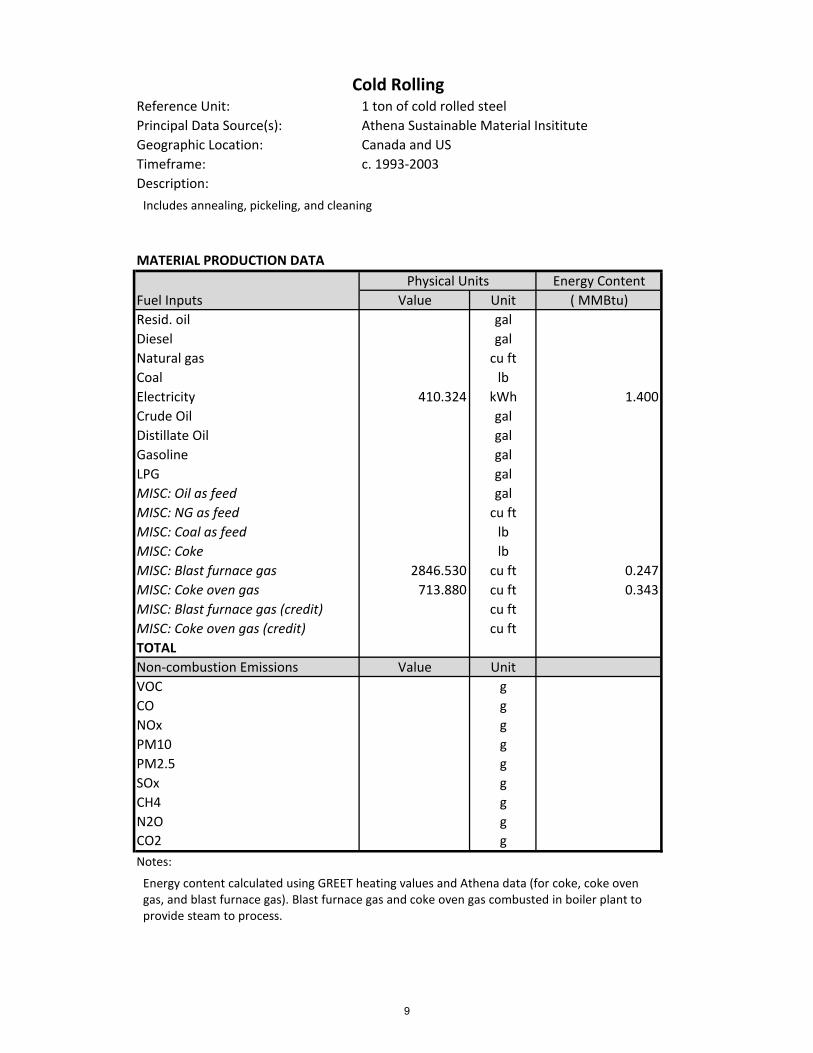
Reference Unit: 1 ton of cold rolled steelPrincipal Data Source(s): Athena Sustainable Material InsitituteGeographic Location: Canada and USTimeframe: c. 1993‐2003Description:
MATERIAL PRODUCTION DATA
Energy ContentValue Unit ( MMBtu)
Resid. oil gal
Diesel gal
Natural gas cu ftCoal lb
Electricity 410.324 kWh 1.400
Crude Oil gal
Distillate Oil gal
Gasoline gal
LPG gal
MISC: Oil as feed gal
MISC: NG as feed cu ftMISC: Coal as feed lb
MISC: Coke lb
MISC: Blast furnace gas 2846.530 cu ft 0.247
MISC: Coke oven gas 713.880 cu ft 0.343
MISC: Blast furnace gas (credit) cu ftMISC: Coke oven gas (credit) cu ftTOTAL
Non‐combustion Emissions Value Unit
VOC g
CO g
NOx g
PM10 g
PM2.5 g
SOx g
CH4 g
N2O g
CO2 g
Notes:
Physical Units calculated using GREET
Cold Rolling
Fuel InputsPhysical Units
Includes annealing, pickeling, and cleaning
Energy content calculated using GREET heating values and Athena data (for coke, coke oven gas, and blast furnace gas). Blast furnace gas and coke oven gas combusted in boiler plant to provide steam to process.
9

Reference Unit: 1 ton of galvinized sheetPrincipal Data Source(s): Athena Sustainable Material InsitituteGeographic Location: Canada and USTimeframe: c. 1993‐2003Description:
MATERIAL PRODUCTION DATA
Energy ContentValue Unit ( MMBtu)
Resid. oil gal
Diesel gal
Natural gas cu ftCoal lb
Electricity 203.913 kWh 0.696
Crude Oil gal
Distillate Oil gal
Gasoline gal
LPG gal
MISC: Oil as feed gal
MISC: NG as feed cu ftMISC: Coal as feed lb
MISC: Coke lb
MISC: Blast furnace gas 2029.524 cu ft 0.176
MISC: Coke oven gas 2328.119 cu ft 1.117
MISC: Blast furnace gas (credit) cu ftMISC: Coke oven gas (credit) cu ftTOTAL
Non‐combustion Emissions Value Unit
VOC g
CO g
NOx g
PM10 g
PM2.5 g
SOx g
CH4 g
N2O g
CO2 g
Notes:
Physical Units calculated using GREET
Galvanizing
Fuel InputsPhysical Units
Energy content calculated using GREET heating values and Athena data (for coke, coke oven gas, and blast furnace gas). Blast furnace gas and coke oven gas combusted in boiler plant to provide steam to process.
10

Reference Unit: 1 ton of cold rolled steelPrincipal Data Source(s): Athena Sustainable Material InsitituteGeographic Location: Canada and USTimeframe: c. 1993‐2003Description:
MATERIAL PRODUCTION DATA
Energy ContentValue Unit ( MMBtu)
Resid. oil gal
Diesel gal
Natural gas 1210.454 cu ft 1.190
Coal lb
Electricity 1463.554 kWh 4.994
Crude Oil gal
Distillate Oil gal
Gasoline gal
LPG gal
MISC: Oil as feed gal
MISC: NG as feed cu ftMISC: Coal as feed lb
MISC: Coke 12.031 lb 0.170
MISC: Blast furnace gas cu ftMISC: Coke oven gas cu ftMISC: Blast furnace gas (credit) cu ftMISC: Coke oven gas (credit) cu ftTOTAL
Non‐combustion Emissions Value Unit
VOC 174.550 g
CO 3010.138 g
NOx 65.367 g
PM10 582.365 g
PM2.5 g
SOx 349.639 g
CH4 0.136 g
N2O g
CO2 23340.363 g
Notes:
Physical Units calculated using GREET
Electric Arc Furnace
Fuel InputsPhysical Units
Scrap melted in electric arc furnace to create billets for long products
Energy content calculated using GREET heating values and Athena data (for coke, coke oven gas, and blast furnace gas).
11
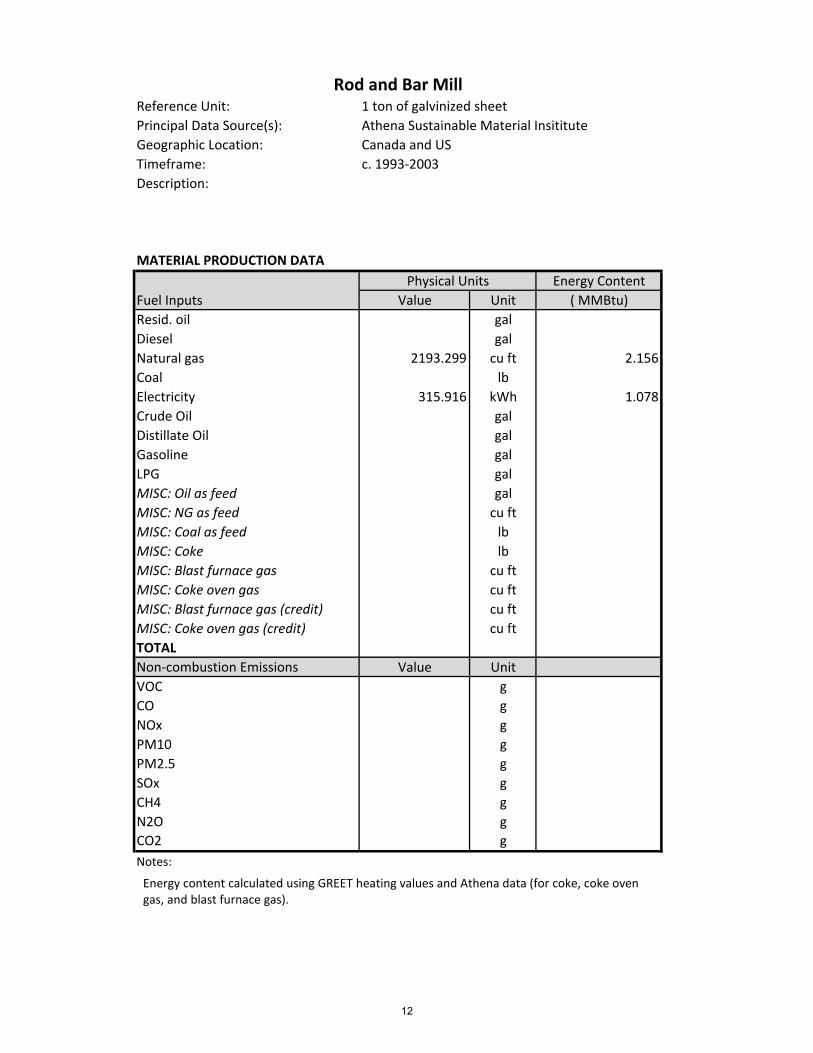
Reference Unit: 1 ton of galvinized sheetPrincipal Data Source(s): Athena Sustainable Material InsitituteGeographic Location: Canada and USTimeframe: c. 1993‐2003Description:
MATERIAL PRODUCTION DATA
Energy ContentValue Unit ( MMBtu)
Resid. oil gal
Diesel gal
Natural gas 2193.299 cu ft 2.156
Coal lb
Electricity 315.916 kWh 1.078
Crude Oil gal
Distillate Oil gal
Gasoline gal
LPG gal
MISC: Oil as feed gal
MISC: NG as feed cu ftMISC: Coal as feed lb
MISC: Coke lb
MISC: Blast furnace gas cu ftMISC: Coke oven gas cu ftMISC: Blast furnace gas (credit) cu ftMISC: Coke oven gas (credit) cu ftTOTAL
Non‐combustion Emissions Value Unit
VOC g
CO g
NOx g
PM10 g
PM2.5 g
SOx g
CH4 g
N2O g
CO2 g
Notes:
Physical Units calculated using GREET
Rod and Bar Mill
Fuel InputsPhysical Units
Energy content calculated using GREET heating values and Athena data (for coke, coke oven gas, and blast furnace gas).
12

Reference Unit: 1 ton of stamped steel productPrincipal Data Source(s): Data contained in GREET 2.7Geographic Location: unknown
Timeframe: unknown
Description:
MATERIAL PRODUCTION DATA
Energy ContentValue Unit ( MMBtu)
Resid. oil gal
Diesel gal
Natural gas 4382.370 cu ft 4.308
Coal lb
Electricity 335.587 kWh 1.145
Crude Oil gal
Distillate Oil gal
Gasoline gal
LPG gal
MISC: Oil as feed gal
MISC: NG as feed cu ftMISC: Coal as feed lb
MISC: Coke lb
MISC: Blast furnace gas cu ftMISC: Coke oven gas cu ftMISC: Blast furnace gas (credit) cu ftMISC: Coke oven gas (credit) cu ftTOTAL
Non‐combustion Emissions Value Unit
VOC g
CO g
NOx g
PM10 g
PM2.5 g
SOx g
CH4 g
N2O g
CO2 g
Notes:
Physical Units calculated using GREET
Stamping
Fuel InputsPhysical Units
13

Principal Data Source(s): Athena Sustainable Material Insititute
Emissions Coke Oven Gas Blast Furnace GasVOC 1.089
CO 9.577 14.564
NOx 135.911 115.461
PM10 2.244
PM2.5
SOx 612.600
CH4 0.491
N2O
CO2 42,209 235,042
grams per mmBtu of fuel combusted
Blast Furnace and Coke Oven Gas Combustion Factors
14
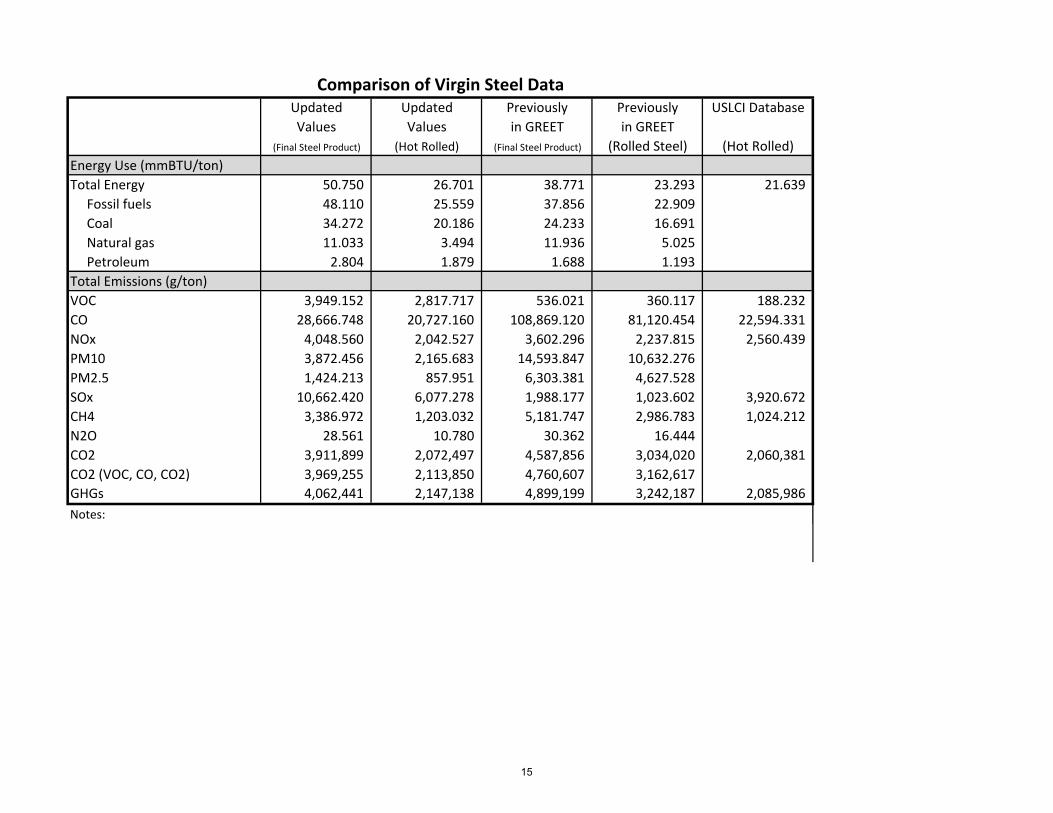
Updated Updated Previously Previously USLCI DatabaseValues Values in GREET in GREET
(Final Steel Product) (Hot Rolled) (Final Steel Product) (Rolled Steel) (Hot Rolled)Energy Use (mmBTU/ton)
Total Energy 50.750 26.701 38.771 23.293 21.639 Fossil fuels 48.110 25.559 37.856 22.909 Coal 34.272 20.186 24.233 16.691 Natural gas 11.033 3.494 11.936 5.025 Petroleum 2.804 1.879 1.688 1.193 Total Emissions (g/ton)VOC 3,949.152 2,817.717 536.021 360.117 188.232 CO 28,666.748 20,727.160 108,869.120 81,120.454 22,594.331 NOx 4,048.560 2,042.527 3,602.296 2,237.815 2,560.439 PM10 3,872.456 2,165.683 14,593.847 10,632.276 PM2.5 1,424.213 857.951 6,303.381 4,627.528 SOx 10,662.420 6,077.278 1,988.177 1,023.602 3,920.672 CH4 3,386.972 1,203.032 5,181.747 2,986.783 1,024.212 N2O 28.561 10.780 30.362 16.444 CO2 3,911,899 2,072,497 4,587,856 3,034,020 2,060,381 CO2 (VOC, CO, CO2) 3,969,255 2,113,850 4,760,607 3,162,617 GHGs 4,062,441 2,147,138 4,899,199 3,242,187 2,085,986 Notes:
Comparison of Virgin Steel Data
15

Updated Previously
Values in GREET(EAF Steel) (EAF Steel)
Energy Use (mmBTU/ton)
Total Energy 21.108 29.337 Fossil fuels 18.901 27.564 Coal 11.455 8.281 Natural gas 7.023 18.847 Petroleum 0.423 0.436 Total Emissions (g/ton)VOC 927.752 202.475 CO 3,707.204 5,080.603 NOx 1,907.773 2,144.607 PM10 2,715.878 1,653.773 PM2.5 626.808 499.548 SOx 4,268.510 2,691.319 CH4 2,495.758 4,449.723 N2O 21.873 28.111 CO2 1,619,186 1,928,235 CO2 (VOC, CO, CO2) 1,627,903 1,936,850 GHGs 1,696,815 2,056,470 Notes:
Comparison of Recycled Steel Data
16

Reference Unit: 1 ton of aluminum ingotPrincipal Data Source(s): Aluminum Association ‐ Aluminum Beverage Can LCAGeographic Location: North America
Timeframe: 2010
Description:
MATERIAL PRODUCTION DATA
Energy ContentValue Unit ( MMBtu)
Resid. oil 0.324 gal 0.045
Diesel 1.731 gal 0.222
Natural gas 0.061 cu ft 0.000
Coal lb
Electricity 9.123 kWh 0.031
Crude Oil gal
Distillate Oil gal
Gasoline gal
LPG gal
MISC: Process off‐gas from Oil lb
MISC: Process off‐gas from NG lb
MISC: Recovered Energy x
TOTAL 0.298
Feedstock Inputs Value Unit
Crude Oil gal
Natural Gas cu ftTOTAL
Non‐combustion Emissions Value Unit
VOC g
CO g
NOx g
PM10 g
PM2.5 g
SOx g
CH4 g
N2O g
CO2 g
Notes:Physical Units calculated using GREET
Fuel InputsPhysical Units
Bauxite Mining
Process stage in which bauxite ore is extracted from the Earth.
Physical Units calculated using GREET heating value assumptions. Results were calculated from total primary energy data using assumptions in GREET 1.8c model.
17

Reference Unit: 1 ton of aluminum ingotPrincipal Data Source(s): Aluminum Association ‐ Aluminum Beverage Can LCAGeographic Location: North America
Timeframe: 2010
Description:
MATERIAL PRODUCTION DATA
Energy ContentValue Unit ( MMBtu)
Resid. oil 48.095 gal 6.750
Diesel 0.375 gal 0.048
Natural gas 6917.606 cu ft 6.800
Coal 269.207 lb 2.631
Electricity 218.083 kWh 0.744
Crude Oil gal
Distillate Oil gal
Gasoline gal
LPG gal
MISC: Process off‐gas from Oil lb
MISC: Process off‐gas from NG lb
MISC: Recovered Energy x
TOTAL 16.973
Feedstock Inputs Value Unit
Crude Oil gal
Natural Gas cu ftTOTAL
Non‐combustion Emissions Value Unit
VOC g
CO g
NOx g
PM10 g
PM2.5 g
SOx g
CH4 g
N2O g
CO2 g
Notes:Physical Units calculated using GREET
Fuel InputsPhysical Units
Alumina Production
Process stage in which alumina is produced by calcining/reacting bauxite with caustic soda and lime.
Physical Units calculated using GREET heating value assumptions. Results were calculated from total primary energy data using assumptions in GREET 1.8c model.
18

Reference Unit: 1 ton of aluminum ingotPrincipal Data Source(s): Aluminum Association ‐ Aluminum Beverage Can LCAGeographic Location: North America
Timeframe: 2010
Description:
MATERIAL PRODUCTION DATA
Energy ContentValue Unit ( MMBtu)
Resid. oil 48.093 gal 0.080
Diesel 0.374 gal 0.015
Natural gas 6917.599 cu ft 0.890
Coal 3.991 lb 0.039
Electricity 218.033 kWh 0.183
Crude Oil gal
Distillate Oil gal
Gasoline gal
LPG gal
MISC: Process off‐gas from Oil lb
MISC: Process off‐gas from NG lb
MISC: Recovered Energy x
TOTAL 1.207
Feedstock Inputs Value Unit
Crude Oil gal
Natural Gas cu ftTOTAL
Non‐combustion Emissions Value Unit
VOC g
CO g
NOx g
PM10 g
PM2.5 g
SOx 484.510 g
CH4 g
N2O g
CO2 110862.742 g
Notes:Physical Units calculated using GREET
Fuel InputsPhysical Units
Anode Production
Process stage in which anodes are formed by baking coke/pitch for use in electrolysis
Physical Units calculated using GREET heating value assumptions. Results were calculated from total primary energy data using assumptions in GREET 1.8c model.
19

Reference Unit: 1 ton of aluminum ingotPrincipal Data Source(s): Aluminum Association ‐ Aluminum Beverage Can LCAGeographic Location: North America
Timeframe: 2010
Description:
MATERIAL PRODUCTION DATA
Energy ContentValue Unit ( MMBtu)
Resid. oil gal
Diesel gal
Natural gas cu ftCoal lb
Electricity 14105.664 kWh 48.133
Crude Oil gal
Distillate Oil gal
Gasoline gal
LPG gal
MISC: Process off‐gas from Oil lb
MISC: Process off‐gas from NG lb
MISC: Recovered Energy x
TOTAL 48.133
Feedstock Inputs Value Unit
Crude Oil gal
Natural Gas cu ftTOTAL
Non‐combustion Emissions Value Unit
VOC g
CO g
NOx g
PM10 g
PM2.5 g
SOx 5443.164 g
CH4 g
N2O g
CO2 1483564.670 g
Notes:Physical Units calculated using GREET
Fuel InputsPhysical Units
Electrolysis
Process stage in which alumina is reduced to form pure aluminum
CF4: 62.41 g/ton AlC2F6: 7.45 g/ton AlTotal PFCs: 608,594 g CO2eq/ton Al (not included CO2 reported above)
20
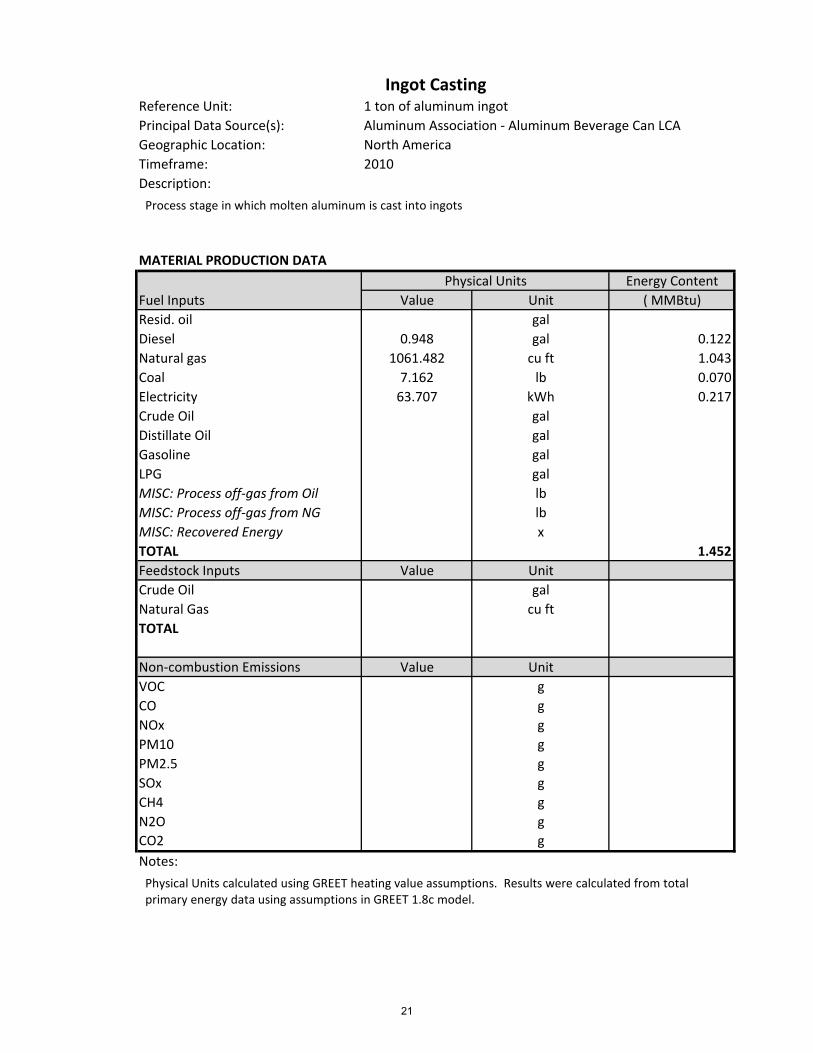
Reference Unit: 1 ton of aluminum ingotPrincipal Data Source(s): Aluminum Association ‐ Aluminum Beverage Can LCAGeographic Location: North America
Timeframe: 2010
Description:
MATERIAL PRODUCTION DATA
Energy ContentValue Unit ( MMBtu)
Resid. oil gal
Diesel 0.948 gal 0.122
Natural gas 1061.482 cu ft 1.043
Coal 7.162 lb 0.070
Electricity 63.707 kWh 0.217
Crude Oil gal
Distillate Oil gal
Gasoline gal
LPG gal
MISC: Process off‐gas from Oil lb
MISC: Process off‐gas from NG lb
MISC: Recovered Energy x
TOTAL 1.452
Feedstock Inputs Value Unit
Crude Oil gal
Natural Gas cu ftTOTAL
Non‐combustion Emissions Value Unit
VOC g
CO g
NOx g
PM10 g
PM2.5 g
SOx g
CH4 g
N2O g
CO2 g
Notes:Physical Units calculated using GREET
Fuel InputsPhysical Units
Ingot Casting
Process stage in which molten aluminum is cast into ingots
Physical Units calculated using GREET heating value assumptions. Results were calculated from total primary energy data using assumptions in GREET 1.8c model.
21

Reference Unit: 1 ton of aluminum ingotPrincipal Data Source(s): Aluminum Association ‐ North American Industry LCAGeographic Location: North America
Timeframe: 1998
Description:
MATERIAL PRODUCTION DATA
Energy ContentValue Unit ( MMBtu)
Resid. oil 4.206 gal 0.590
Diesel 0.044 gal 0.006
Natural gas 1659.175 cu ft 1.631
Coal lb
Electricity 191.377 kWh 0.653
Crude Oil gal
Distillate Oil gal
Gasoline 0.018 gal 0.002
LPG gal
MISC: Process off‐gas from Oil lb
MISC: Process off‐gas from NG lb
MISC: Recovered Energy x
TOTAL 2.882
Feedstock Inputs Value Unit
Crude Oil gal
Natural Gas cu ftTOTAL
Non‐combustion Emissions Value Unit
VOC g
CO g
NOx g
PM10 g
PM2.5 g
SOx g
CH4 g
N2O g
CO2 g
Notes:Physical Units calculated using GREET
Fuel InputsPhysical Units
Secondary Production
Process stage for secondary aluminum production, involving the remelt/casting of recycled aluminum. Does not include scrap preparation.
Physical Units calculated using GREET heating value assumptions. Results were calculated from total primary energy data using assumptions in GREET 1.8c model.Propane ‐ 1.61E‐02 mmBtu (not shown)
22

Reference Unit: 1 ton of rolled aluminum
Principal Data Source(s): Aluminum Association ‐ North American Industry LCAGeographic Location: North America
Timeframe: 1998
Description:
MATERIAL PRODUCTION DATA
Energy ContentValue Unit ( MMBtu)
Resid. oil gal
Diesel 0.010 gal 0.001
Natural gas 1069.815 cu ft 1.052
Coal lb
Electricity 240.355 kWh 0.820
Crude Oil gal
Distillate Oil gal
Gasoline 0.002 gal 0.000
LPG gal
MISC: Process off‐gas from Oil lb
MISC: Process off‐gas from NG lb
MISC: Recovered Energy x
TOTAL 1.873
Feedstock Inputs Value Unit
Crude Oil gal
Natural Gas cu ftTOTAL
Non‐combustion Emissions Value Unit
VOC g
CO g
NOx g
PM10 g
PM2.5 g
SOx g
CH4 g
N2O g
CO2 g
Notes:Physical Units calculated using GREET
Fuel InputsPhysical Units
Hot Rolling
Process stage for transformation of aluminum ingot to wrought aluminum
Physical Units calculated using GREET heating value assumptions. Results were calculated from total primary energy data using assumptions in GREET 1.8c model.Kerosene ‐ 1.72E‐04 mmBtu (not shown)Propane ‐ 6.86E‐04 mmBtu (not shown)
23

Reference Unit: 1 ton of rolled aluminum
Principal Data Source(s): Aluminum Association ‐ North American Industry LCAGeographic Location: North America
Timeframe: 1998
Description:
MATERIAL PRODUCTION DATA
Energy ContentValue Unit ( MMBtu)
Resid. oil gal
Diesel 0.009 gal 0.001
Natural gas 794.354 cu ft 0.781
Coal lb
Electricity 316.543 kWh 1.080
Crude Oil gal
Distillate Oil gal
Gasoline 0.515 gal 0.06
LPG gal
MISC: Process off‐gas from Oil lb
MISC: Process off‐gas from NG lb
MISC: Recovered Energy x
TOTAL 1.922
Feedstock Inputs Value Unit
Crude Oil gal
Natural Gas cu ftTOTAL
Non‐combustion Emissions Value Unit
VOC g
CO g
NOx g
PM10 g
PM2.5 g
SOx g
CH4 g
N2O g
CO2 g
Notes:Physical Units calculated using GREET
Fuel InputsPhysical Units
Cold Rolling
Process stage for transformation of aluminum ingot to wrought aluminum
Physical Units calculated using GREET heating value assumptions. Results were calculated from total primary energy data using assumptions in GREET 1.8c model.Propane ‐ 4.80E‐03 mmBtu (not shown)
24

Reference Unit: 1 ton of extruded aluminum
Principal Data Source(s): Aluminum Association ‐ North American Industry LCAGeographic Location: North America
Timeframe: 1998
Description:
MATERIAL PRODUCTION DATA
Energy ContentValue Unit ( MMBtu)
Resid. oil 0.001 gal 0.000
Diesel 0.100 gal 0.013
Natural gas 3267.100 cu ft 3.212
Coal 22.408 lb 0.219
Electricity 84.351 kWh 0.288
Crude Oil gal
Distillate Oil gal
Gasoline 0.011 gal 0.001
LPG gal
MISC: Process off‐gas from Oil lb
MISC: Process off‐gas from NG lb
MISC: Recovered Energy x
TOTAL 3.733
Feedstock Inputs Value Unit
Crude Oil gal
Natural Gas cu ftTOTAL
Non‐combustion Emissions Value Unit
VOC g
CO g
NOx g
PM10 g
PM2.5 g
SOx g
CH4 g
N2O g
CO2 g
Notes:Physical Units calculated using GREET
Fuel InputsPhysical Units
Extrusion
Process stage for transformation of aluminum ingot to extruded aluminum
Physical Units calculated using GREET heating value assumptions. Results were calculated from total primary energy data using assumptions in GREET 1.8c model.Kerosene ‐ 6.83E‐04 mmBtu (not shown)Propane ‐ 9.00E‐02 mmBtu (not shown)
25

Reference Unit: 1 ton of cast aluminum
Principal Data Source(s): Aluminum Association ‐ North American Industry LCAGeographic Location: North America
Timeframe: 1998
Description:
MATERIAL PRODUCTION DATA
Energy ContentValue Unit ( MMBtu)
Resid. oil gal
Diesel gal
Natural gas 7687.295 cu ft 7.557
Coal lb
Electricity 3.655 kWh 0.012
Crude Oil gal
Distillate Oil gal
Gasoline gal
LPG gal
MISC: Process off‐gas from Oil lb
MISC: Process off‐gas from NG lb
MISC: Recovered Energy x
TOTAL 7.569
Feedstock Inputs Value Unit
Crude Oil gal
Natural Gas cu ftTOTAL
Non‐combustion Emissions Value Unit
VOC g
CO g
NOx g
PM10 g
PM2.5 g
SOx g
CH4 g
N2O g
CO2 g
Notes:Physical Units calculated using GREET
Fuel InputsPhysical Units
Shape Casting
Process stage for transformation of aluminum ingot to cast aluminum
Physical Units calculated using GREET heating value assumptions. Results were calculated from total primary energy data using assumptions in GREET 1.8c model.
26

Updated Previously Industry SourceValues in GREET Aluminum Assoc.
Energy Use (mmBTU/ton)
Total Energy 115.352 132.856 133.256
Fossil fuels 78.414 96.572
Coal 50.612 54.477
Natural gas 19.325 26.210
Petroleum 8.478 15.885
Total Emissions(g/ton)
VOC 637.742 843.946
CO 1,960.924 2,850.783
NOx 8,657.103 11,390.999 2,013.540
PM10 20,542.094 30,659.443 8,308.120
PM2.5 8,204.027 13,150.997
SOx 29,883.924 31,947.068 20,207.960
CH4 10,269.891 12,642.084
N2O 80.990 99.560
CO2 8,964,457 8,820,725
CO2 (VOC, CO, CO2) 8,969,526 8,827,835
GHGs 9,859,002 9,173,556 10,031,420
Notes:
Comparison of Cast Aluminum Data
Industry Values are per ton aluminum ingot, Industry emissions from International Aluminum Institute.
27

Updated Previously Industry SourceValues in GREET Aluminum Assoc.
Energy Use (mmBTU/ton)
Total Energy 164.955 157.507 133.256
Fossil fuels 112.681 119.724
Coal 75.912 61.487
Natural gas 24.849 41.381
Petroleum 11.920 16.855
Total Emissions(g/ton)
VOC 924.751 1,018.729
CO 2,824.190 3,396.301
NOx 12,502.462 13,428.240 2,013.540
PM10 29,411.160 31,975.284 8,308.120
PM2.5 11,591.450 13,539.925
SOx 43,049.522 34,351.349 20,207.960
CH4 14,540.617 16,319.137
N2O 118.043 126.263
CO2 12,937,641 10,574,404
CO2 (VOC, CO, CO2) 12,944,961 10,578,253
GHGs 14,183,513 11,023,858 10,031,420
Notes:
Comparison of Wrought Aluminum Data
Industry Values are per ton aluminum ingot, Industry emissions from International Aluminum Institute.

Updated Previously Industry SourceValues in GREET Aluminum Assoc.
Energy Use (mmBTU/ton)
Total Energy 111.635 133.256
Fossil fuels 74.604
Coal 51.267
Natural gas 14.844
Petroleum 8.493
Total Emissions(g/ton)
VOC 613.999
CO 1,891.841
NOx 8,415.892 2,013.540
PM10 20,663.393 8,308.120
PM2.5 8,229.564
SOx 30,014.169 20,207.960
CH4 9,519.356
N2O 76.862
CO2 8,767,493
CO2 (VOC, CO, CO2) 8,772,380
GHGs 9,641,862 10,031,420
Notes:
Comparison of Extruded Aluminum Data
Industry Values are per ton aluminum ingot, Industry emissions from International Aluminum Institute.
29

Reference Unit: 1 ton of Class 1 NickelPrincipal Data Source(s): Nickel Institute LCAGeographic Location: North America
Timeframe: 2000.000
Description:
MATERIAL PRODUCTION DATA
Energy ContentValue Unit ( MMBtu)
Resid. oil 8.091 gal 1.136
Diesel gal
Natural gas 1016.840 cu ft 1.000
Coal lb
Electricity 154.809 kWh 0.528
Crude Oil gal
Distillate Oil gal
Gasoline gal
LPG gal
MISC: Process off‐gas from Oil lb
MISC: Process off‐gas from NG lb
MISC: Recovered Energy x
TOTAL 2.663
Nickel Ore Mining
Fuel InputsPhysical Units
Process stage in which sulphidic/lateritic ore is extracted from the Earth
Feedstock Inputs Value Unit
Crude Oil gal
Natural Gas cu ftTOTAL
Non‐combustion Emissions Value Unit
VOC g
CO g
NOx g
PM10 g
PM2.5 g
SOx g
CH4 g
N2O g
CO2 g
Notes:Physical Units calculated using GREET Physical Units calculated using GREET heating value assumptions.
30

PRIMARY ENERGY DATA USED TO ESTIMATE PURCHASED ENERGY DATA
Energy ContentValue Unit ( MMBtu)
Resid. oilDiesel
Natural gas 32.659 kg 1.459
Coal 46.266 kg 0.997
Electricity
Crude Oil 36.287 kg 1.468
MISC: Uranium 0.0007 kg 0.045
TOTAL
Notes:XX g of Uranium were reported in the study.
Nickel Ore Mining (Con't)
Fuel InputsPhysical Units
Uranium was not an input into the model, when trying to backcalculate purchased energy.
31
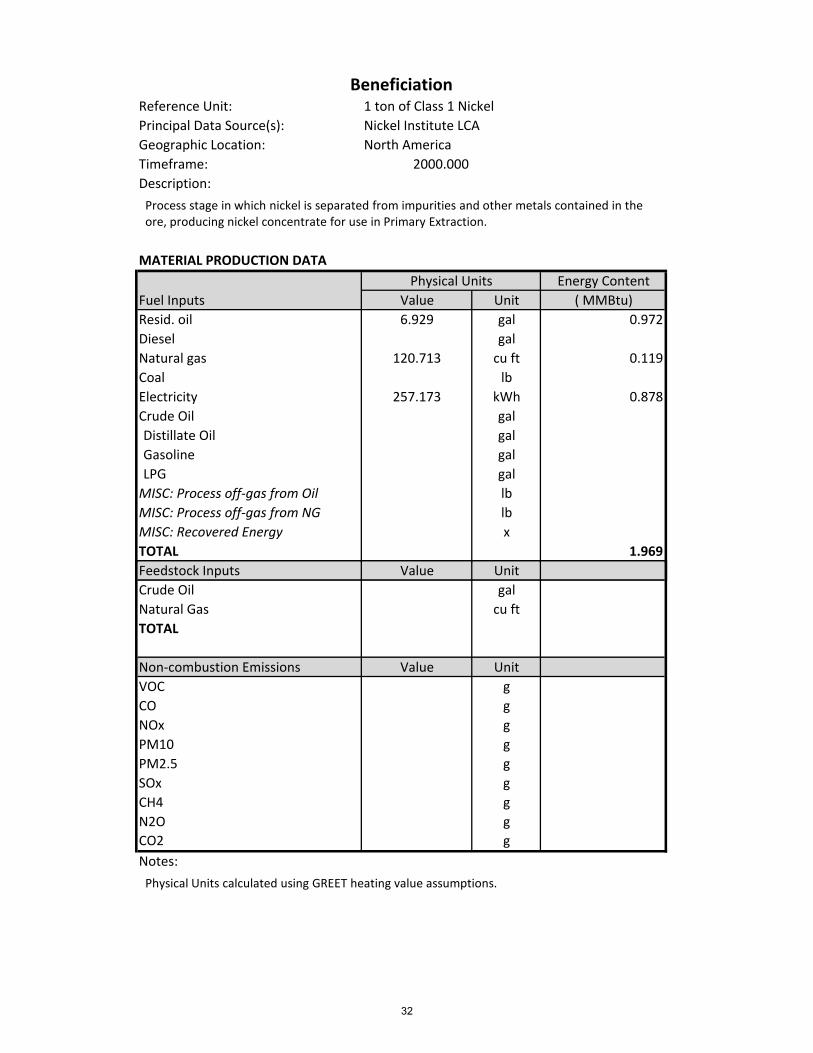
Reference Unit: 1 ton of Class 1 NickelPrincipal Data Source(s): Nickel Institute LCAGeographic Location: North America
Timeframe: 2000.000
Description:
MATERIAL PRODUCTION DATA
Energy ContentValue Unit ( MMBtu)
Resid. oil 6.929 gal 0.972
Diesel gal
Natural gas 120.713 cu ft 0.119
Coal lb
Electricity 257.173 kWh 0.878
Crude Oil gal
Distillate Oil gal
Gasoline gal
LPG gal
MISC: Process off‐gas from Oil lb
MISC: Process off‐gas from NG lb
MISC: Recovered Energy x
TOTAL 1.969
Beneficiation
Fuel InputsPhysical Units
Process stage in which nickel is separated from impurities and other metals contained in the ore, producing nickel concentrate for use in Primary Extraction.
Feedstock Inputs Value Unit
Crude Oil gal
Natural Gas cu ftTOTAL
Non‐combustion Emissions Value Unit
VOC g
CO g
NOx g
PM10 g
PM2.5 g
SOx g
CH4 g
N2O g
CO2 g
Notes:Physical Units calculated using GREET Physical Units calculated using GREET heating value assumptions.
32

PRIMARY ENERGY DATA USED TO ESTIMATE PURCHASED ENERGY DATA
Energy ContentValue Unit ( MMBtu)
Resid. oilDiesel
Natural gas 16.329 kg 0.730
Coal 77.111 kg 1.661
Electricity
Crude Oil 36.287 kg 1.468
MISC: Uranium 0.0007 kg 0.045
TOTAL
Notes:XX g of Uranium were reported in the study.
Beneficiation (Con't)
Fuel InputsPhysical Units
Uranium was not an input into the model, when trying to backcalculate purchased energy.
33

Reference Unit: 1 ton of Class 1 NickelPrincipal Data Source(s): Nickel Institute LCAGeographic Location: North America
Timeframe: 2000.000
Description:
MATERIAL PRODUCTION DATA
Energy ContentValue Unit ( MMBtu)
Resid. oil 418.232 gal 58.700
Diesel gal
Natural gas 38018.252 cu ft 37.372
Coal lb
Electricity 3399.377 kWh 11.600
Crude Oil gal
Distillate Oil gal
Gasoline gal
LPG gal
MISC: Process off‐gas from Oil lb
MISC: Process off‐gas from NG lb
MISC: Recovered Energy x
TOTAL 107.672
Primary Extraction
Fuel InputsPhysical Units
Process stage in which nickel concentrate is converted into nickel matte via smelting.
Feedstock Inputs Value Unit
Crude Oil gal
Natural Gas cu ftTOTAL
Non‐combustion Emissions Value Unit
VOC g
CO g
NOx g
PM10 g
PM2.5 g
SOx g
CH4 g
N2O g
CO2 g
Notes:Physical Units calculated using GREET Physical Units calculated using GREET heating value assumptions.
34

PRIMARY ENERGY DATA USED TO ESTIMATE PURCHASED ENERGY DATA
Energy ContentValue Unit ( MMBtu)
Resid. oilDiesel
Natural gas 1126.723 kg 50.344
Coal 1048.706 kg 22.596
Electricity
Crude Oil 1687.364 kg 68.268
MISC: Uranium 0.0105 kg 0.716
TOTAL
Notes:XX g of Uranium were reported in the study.
Primary Extraction (Con't)
Fuel InputsPhysical Units
Uranium was not an input into the model, when trying to backcalculate purchased energy.
35

Reference Unit: 1 ton of Class 1 NickelPrincipal Data Source(s): Nickel Institute LCAGeographic Location: North America
Timeframe: 2000.000
Description:
MATERIAL PRODUCTION DATA
Energy ContentValue Unit ( MMBtu)
Resid. oil 11.790 gal 1.655
Diesel gal
Natural gas 16833.062 cu ft 16.547
Coal lb
Electricity 1264.825 kWh 4.316
Crude Oil gal
Distillate Oil gal
Gasoline gal
LPG gal
MISC: Process off‐gas from Oil lb
MISC: Process off‐gas from NG lb
MISC: Recovered Energy x
TOTAL 22.518
Refining
Fuel InputsPhysical Units
Process stage in which nickel matte undergoes leaching, separation, and electrolysis to form class I nickel
Feedstock Inputs Value Unit
Crude Oil gal
Natural Gas cu ftTOTAL
Non‐combustion Emissions Value Unit
VOC g
CO g
NOx g
PM10 g
PM2.5 g
SOx g
CH4 g
N2O g
CO2 g
Notes:Physical Units calculated using GREET Physical Units calculated using GREET heating value assumptions.
36

PRIMARY ENERGY DATA USED TO ESTIMATE PURCHASED ENERGY DATA
Energy ContentValue Unit ( MMBtu)
Resid. oilDiesel
Natural gas 457.221 kg 20.429
Coal 370.131 kg 7.975
Electricity
Crude Oil 72.575 kg 2.936
MISC: Uranium 0.0212 kg 1.455
TOTAL
Notes:XX g of Uranium were reported in the study.
Refining (Con't)
Fuel InputsPhysical Units
Uranium was not an input into the model, when trying to backcalculate purchased energy.
37

Updated Previously Industry SourceValues in GREET Nickel Institute
Energy Use (mmBTU/ton)
Total Energy 181.208 127.174 181.836
Fossil fuels 179.598 113.634 179.598
Coal 33.229 63.335 33.229
Natural gas 72.962 34.306 72.962
Petroleum 73.407 15.993 73.407
Total Emissions(g/ton)
VOC 1187.585 917.893 1995.806
CO 3961.952 2760.498 33565.835
NOx 18642.194 11830.619 47173.606
PM10 9967.683 13507.499 35380.205
PM2.5 4283.212 4201.556
SOx 634678.561 633829.737 878154.828
CH4 22238.973 14859.787 25401.173
N2O 147.424 130.384 1179.340
CO2 13,220,797 10,291,549 12,405,751 CO2 (VOC, CO, CO2) 13,225,287 10,298,747 12,464,718 GHGs 13,825,194 10,709,097 13,451,191 Notes:
Comparison of Nickel Data
Nickel Institute reports PM (unspecified), which is reported as PM10 here.
38
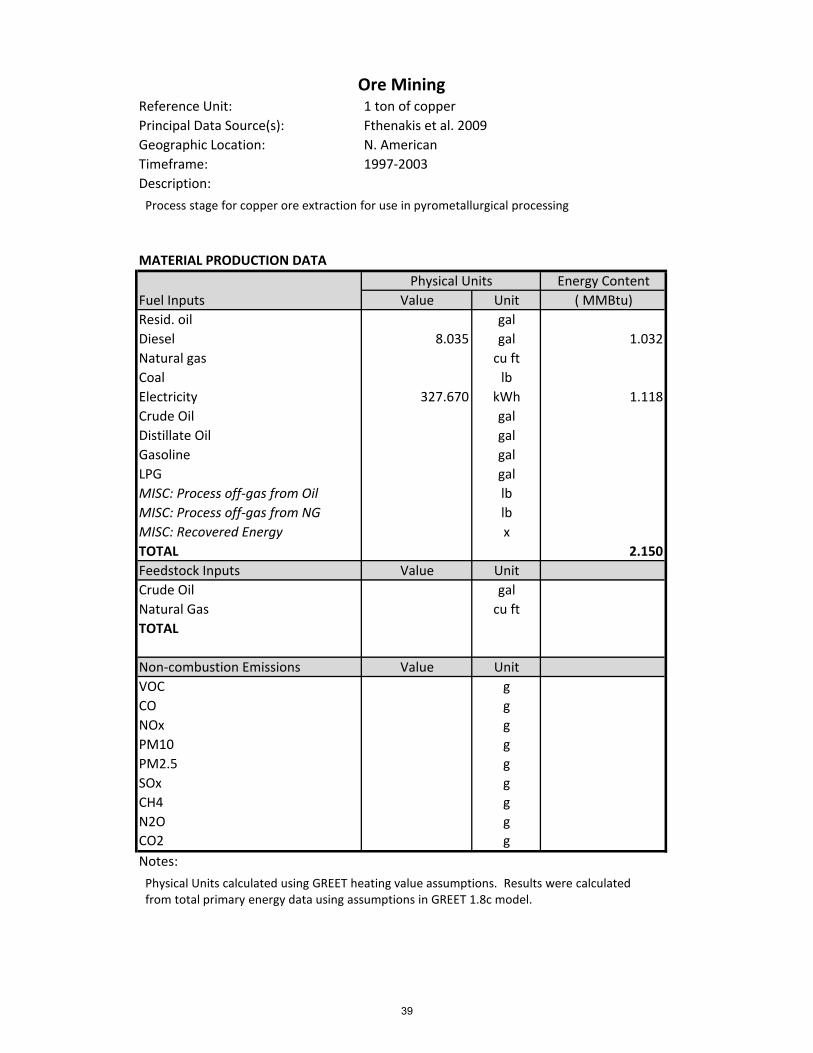
Reference Unit: 1 ton of copperPrincipal Data Source(s): Fthenakis et al. 2009Geographic Location: N. American
Timeframe: 1997‐2003Description:
MATERIAL PRODUCTION DATA
Energy ContentValue Unit ( MMBtu)
Resid. oil gal
Diesel 8.035 gal 1.032
Natural gas cu ftCoal lb
Electricity 327.670 kWh 1.118
Crude Oil gal
Distillate Oil gal
Gasoline gal
LPG gal
MISC: Process off‐gas from Oil lb
MISC: Process off‐gas from NG lb
MISC: Recovered Energy x
TOTAL 2.150
Feedstock Inputs Value Unit
Crude Oil gal
Natural Gas cu ftTOTAL
Non‐combustion Emissions Value Unit
VOC g
CO g
NOx g
PM10 g
PM2.5 g
SOx g
CH4 g
N2O g
CO2 g
Notes:Physical Units calculated using GREET
Ore Mining
Fuel InputsPhysical Units
Process stage for copper ore extraction for use in pyrometallurgical processing
Physical Units calculated using GREET heating value assumptions. Results were calculated from total primary energy data using assumptions in GREET 1.8c model.
39

Reference Unit: 1 ton of copperPrincipal Data Source(s): Fthenakis et al. 2009Geographic Location: N. American
Timeframe: 1997‐2003Description:
MATERIAL PRODUCTION DATA
Energy ContentValue Unit ( MMBtu)
Resid. oil gal
Diesel 10.713 gal 1.376
Natural gas 8749.625 cu ft 8.601
Coal 334.420 lb 3.268
Electricity 1915.607 kWh 6.537
Crude Oil gal
Distillate Oil gal
Gasoline gal
LPG gal
MISC: Process off‐gas from Oil lb
MISC: Process off‐gas from NG lb
MISC: Recovered Energy x
TOTAL 19.782
Feedstock Inputs Value Unit
Crude Oil gal
Natural Gas cu ftTOTAL
Non‐combustion Emissions Value Unit
VOC g
CO g
NOx g
PM10 g
PM2.5 g
SOx g
CH4 g
N2O g
CO2 g
Notes:Physical Units calculated using GREET
Copper Production
Fuel InputsPhysical Units
Includes copper smelting and refining activities.
Physical Units calculated using GREET heating value assumptions. Results were calculated from total primary energy data using assumptions in GREET 1.8c model.
40
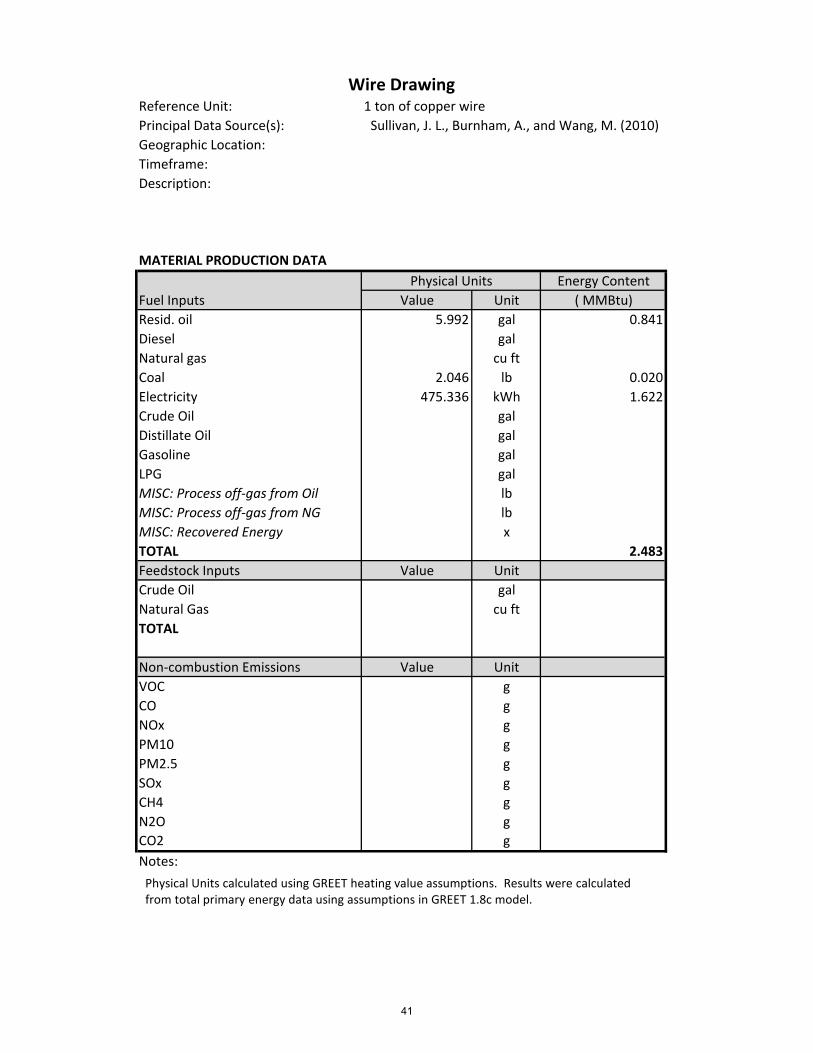
Reference Unit: 1 ton of copper wirePrincipal Data Source(s): Sullivan, J. L., Burnham, A., and Wang, M. (2010) Geographic Location:Timeframe:
Description:
MATERIAL PRODUCTION DATA
Energy ContentValue Unit ( MMBtu)
Resid. oil 5.992 gal 0.841
Diesel gal
Natural gas cu ftCoal 2.046 lb 0.020
Electricity 475.336 kWh 1.622
Crude Oil gal
Distillate Oil gal
Gasoline gal
LPG gal
MISC: Process off‐gas from Oil lb
MISC: Process off‐gas from NG lb
MISC: Recovered Energy x
TOTAL 2.483
Feedstock Inputs Value Unit
Crude Oil gal
Natural Gas cu ftTOTAL
Non‐combustion Emissions Value Unit
VOC g
CO g
NOx g
PM10 g
PM2.5 g
SOx g
CH4 g
N2O g
CO2 g
Notes:Physical Units calculated using GREET
Wire Drawing
Fuel InputsPhysical Units
Physical Units calculated using GREET heating value assumptions. Results were calculated from total primary energy data using assumptions in GREET 1.8c model.
41

Updated Previously
Values in GREETEnergy Use (mmBTU/ton)
Total Energy 43.299 95.706
Fossil fuels 43.299 90.137
Coal 3.334 26.203
Natural gas 36.309 37.620
Petroleum 3.656 26.314
Total Emissions(g/ton)
VOC 475.308 666.630
CO 2010.997 2144.665
NOx 4156.742 9624.947
PM10 1174.039 7493.291
PM2.5 532.643 2860.383
SOx 127210.089 195054.269
CH4 6942.755 12162.939
N2O 57.020 88.318
CO2 2,838,004 7,355,950 CO2 (VOC, CO, CO2) 2,840,283 7,361,398 GHGs 3,030,844 7,691,790 Notes:
Comparison of Copper Data
No Current Industry SourcesUpdated Values include transformation into copper wire, this does not appear to be included in previous GREET
42
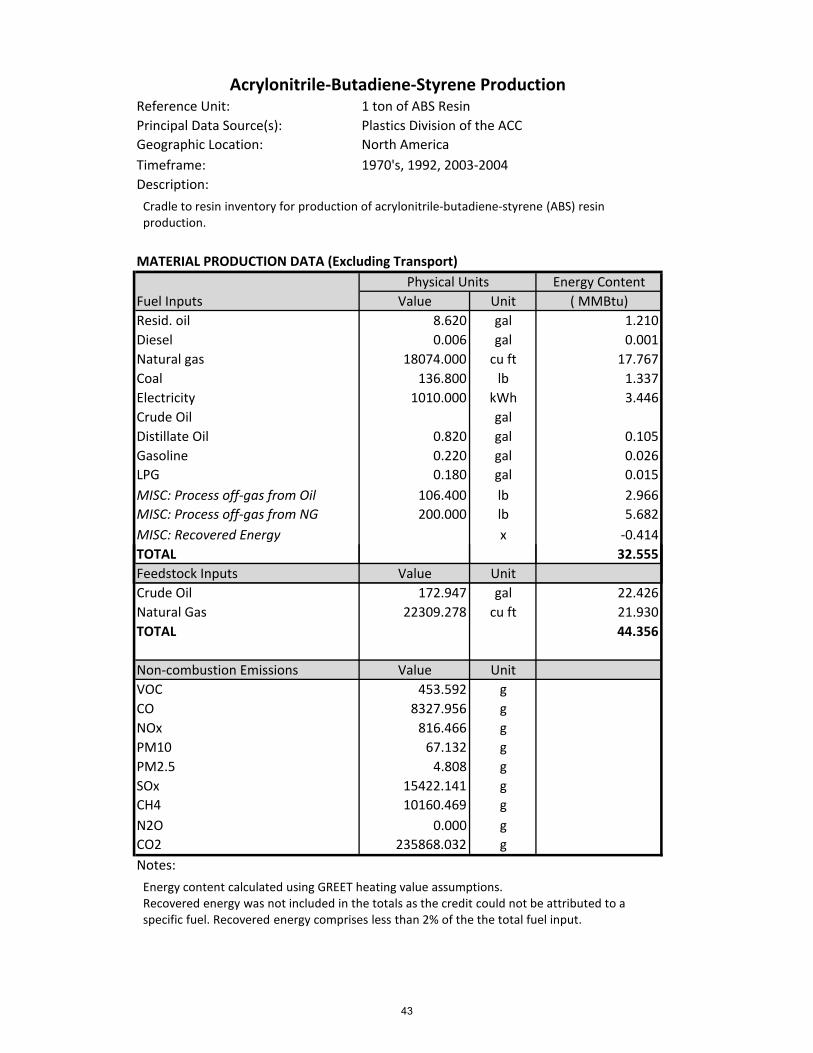
Reference Unit: 1 ton of ABS ResinPrincipal Data Source(s): Plastics Division of the ACCGeographic Location: North America
Timeframe: 1970's, 1992, 2003‐2004Description:
MATERIAL PRODUCTION DATA (Excluding Transport)
Energy ContentValue Unit ( MMBtu)
Resid. oil 8.620 gal 1.210
Diesel 0.006 gal 0.001
Natural gas 18074.000 cu ft 17.767
Coal 136.800 lb 1.337
Electricity 1010.000 kWh 3.446
Crude Oil gal
Distillate Oil 0.820 gal 0.105
Gasoline 0.220 gal 0.026
LPG 0.180 gal 0.015
MISC: Process off‐gas from Oil 106.400 lb 2.966
MISC: Process off‐gas from NG 200.000 lb 5.682
MISC: Recovered Energy x ‐0.414TOTAL 32.555
Acrylonitrile‐Butadiene‐Styrene Production
Fuel InputsPhysical Units
Cradle to resin inventory for production of acrylonitrile‐butadiene‐styrene (ABS) resin production.
Feedstock Inputs Value Unit
Crude Oil 172.947 gal 22.426
Natural Gas 22309.278 cu ft 21.930
TOTAL 44.356
Non‐combustion Emissions Value Unit
VOC 453.592 g
CO 8327.956 g
NOx 816.466 g
PM10 67.132 g
PM2.5 4.808 g
SOx 15422.141 g
CH4 10160.469 g
N2O 0.000 g
CO2 235868.032 g
Notes:Physical Units calculated using GREET Energy content calculated using GREET heating value assumptions. Recovered energy was not included in the totals as the credit could not be attributed to a specific fuel. Recovered energy comprises less than 2% of the the total fuel input.
43

TRANSPORT DATA
Energy ContentTransport Method (Fuel Used) Ton‐miles Value Unit ( MMBtu)
Combination truck (Diesel) 115.8 1.22 gal 0.157
Single Unit (Diesel) 0 0 gal 0.000
Rail (Diesel) 254 0.62 gal 0.080
Barge (Diesel) 828 0.66 gal 0.085
Barge (Resid. Oil) 2.2 gal 0.309
Ocean Freighter (Diesel) 2276 0.44 gal 0.057
Ocean Freighter (Resid. Oil) 3.9 gal 0.547
NG Pipeline (NG) 626 432 cu ft 0.425
Petro Pipeline (Electricity) 446 9.7 kWh 0.033
Residual Oil gal
Diesel gal
Crude Oil gal
Natural Gas cu ftElectricity kWh
TOTAL 1.6915
MATERIAL PRODUCTION DATA (Including Transport)
Energy ContentFuel Inputs Value Unit ( MMBtu)
Physical Units
Acrylonitrile‐Butadiene‐Styrene Production (cont'd)
Physical Units
Resid. oil 14.720 gal 2.066
Diesel 2.946 gal 0.378
Natural gas 18506.000 cu ft 18.191
Coal 136.800 lb 1.337
Electricity 1019.700 kWh 3.479
Crude Oil gal
Distillate Oil 0.820 gal 0.105
Gasoline 0.220 gal 0.026
LPG 0.180 gal 0.015
MISC: Process off‐gas from Oil 106.400 lb 2.966
MISC: Process off‐gas from NG 200.000 lb 5.682
MISC: Recovered Energy x ‐0.414TOTAL 34.246
Notes:
44
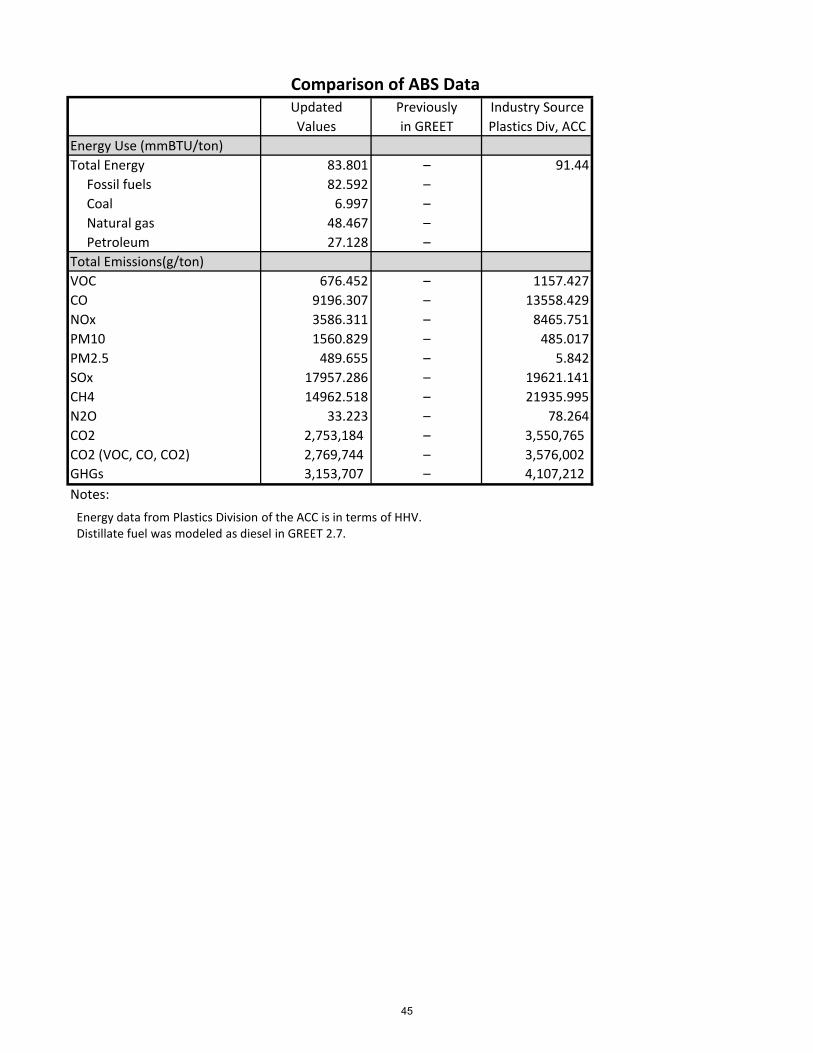
Updated Previously Industry SourceValues in GREET Plastics Div, ACC
Energy Use (mmBTU/ton)
Total Energy 83.801 – 91.44
Fossil fuels 82.592 –
Coal 6.997 –
Natural gas 48.467 –
Petroleum 27.128 –
Total Emissions(g/ton)
VOC 676.452 – 1157.427
CO 9196.307 – 13558.429
NOx 3586.311 – 8465.751
PM10 1560.829 – 485.017
PM2.5 489.655 – 5.842
SOx 17957.286 – 19621.141
CH4 14962.518 – 21935.995
N2O 33.223 – 78.264
CO2 2,753,184 – 3,550,765 CO2 (VOC, CO, CO2) 2,769,744 – 3,576,002 GHGs 3,153,707 – 4,107,212 Notes:
Comparison of ABS Data
Energy data from Plastics Division of the ACC is in terms of HHV.Distillate fuel was modeled as diesel in GREET 2.7.
45
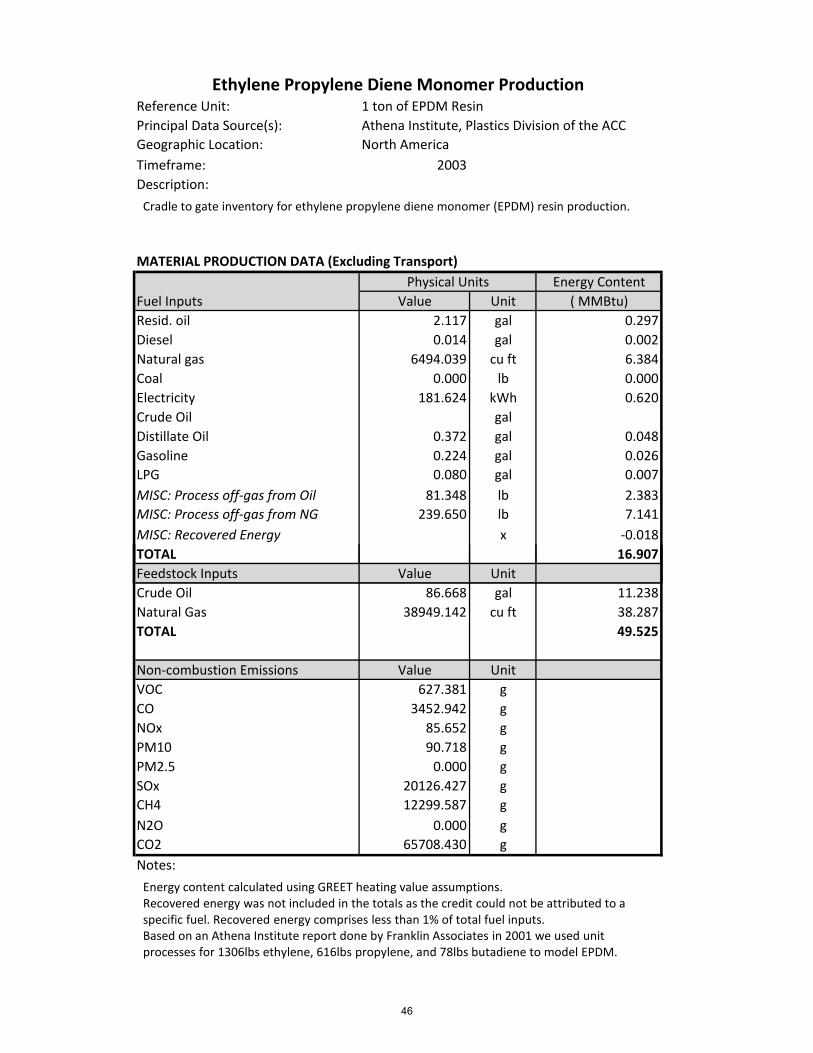
Reference Unit: 1 ton of EPDM ResinPrincipal Data Source(s): Athena Institute, Plastics Division of the ACCGeographic Location: North America
Timeframe: 2003
Description:
MATERIAL PRODUCTION DATA (Excluding Transport)
Energy ContentValue Unit ( MMBtu)
Resid. oil 2.117 gal 0.297
Diesel 0.014 gal 0.002
Natural gas 6494.039 cu ft 6.384
Coal 0.000 lb 0.000
Electricity 181.624 kWh 0.620
Crude Oil gal
Distillate Oil 0.372 gal 0.048
Gasoline 0.224 gal 0.026
LPG 0.080 gal 0.007
MISC: Process off‐gas from Oil 81.348 lb 2.383
MISC: Process off‐gas from NG 239.650 lb 7.141
MISC: Recovered Energy x ‐0.018TOTAL 16.907
Ethylene Propylene Diene Monomer Production
Fuel InputsPhysical Units
Cradle to gate inventory for ethylene propylene diene monomer (EPDM) resin production.
Feedstock Inputs Value Unit
Crude Oil 86.668 gal 11.238
Natural Gas 38949.142 cu ft 38.287
TOTAL 49.525
Non‐combustion Emissions Value Unit
VOC 627.381 g
CO 3452.942 g
NOx 85.652 g
PM10 90.718 g
PM2.5 0.000 g
SOx 20126.427 g
CH4 12299.587 g
N2O 0.000 g
CO2 65708.430 g
Notes:Physical Units calculated using GREET Energy content calculated using GREET heating value assumptions. Recovered energy was not included in the totals as the credit could not be attributed to a specific fuel. Recovered energy comprises less than 1% of total fuel inputs.Based on an Athena Institute report done by Franklin Associates in 2001 we used unit processes for 1306lbs ethylene, 616lbs propylene, and 78lbs butadiene to model EPDM.
46

TRANSPORT DATA
Energy ContentTransport Method (Fuel Used) Ton‐miles Value Unit ( MMBtu)
Combination truck (Diesel) 24.06 1.08 gal 0.139
Single Unit (Diesel) 0 0 gal 0.000
Rail (Diesel) 21.25 0.05 gal 0.007
Barge (Diesel) 42.39 0.03 gal 0.004
Barge (Resid. Oil) 0.12 gal 0.016
Ocean Freighter (Diesel) 870.94 0.17 gal 0.021
Ocean Freighter (Resid. Oil) 1.49 gal 0.209
NG Pipeline (NG) 885.15 610.76 cu ft 0.600
Petro Pipeline (Electricity) 271.09 5.92 kWh 0.020
Residual Oil gal
Diesel gal
Crude Oil gal
Natural Gas cu ftElectricity kWh
TOTAL 1.017
MATERIAL PRODUCTION DATA (Including Transport)
Energy ContentFuel Inputs Value Unit ( MMBtu)
Physical Units
Ethylene Propylene Diene Monomer Production (cont'd)
Physical Units
Resid. oil 3.723 gal 0.523
Diesel 1.344 gal 0.173
Natural gas 7104.796 cu ft 6.984
Coal 0.000 lb 0.000
Electricity 187.539 kWh 0.640
Crude Oil gal
Distillate Oil 0.372 gal 0.048
Gasoline 0.224 gal 0.026
LPG 0.080 gal 0.007
MISC: Process off‐gas from Oil 81.348 lb 2.383
MISC: Process off‐gas from NG 239.650 lb 7.141
MISC: Recovered Energy x ‐0.018TOTAL 17.924
Notes:
47
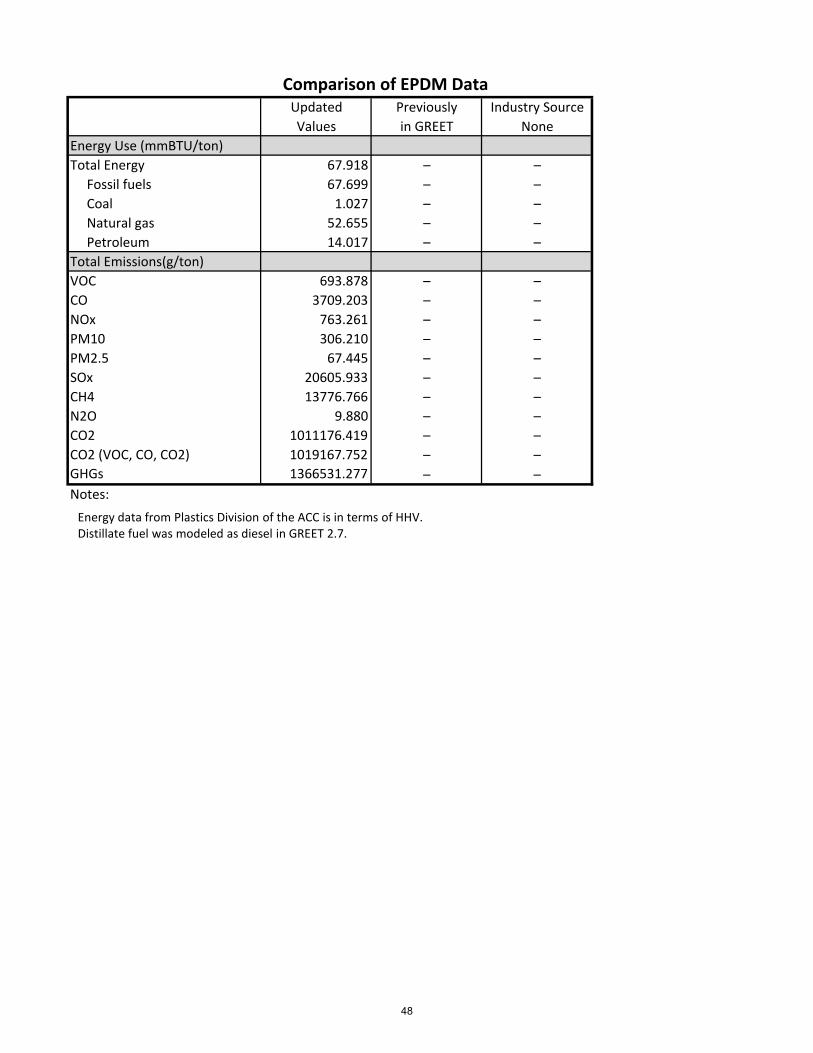
Updated Previously Industry SourceValues in GREET None
Energy Use (mmBTU/ton)
Total Energy 67.918 – –
Fossil fuels 67.699 – –
Coal 1.027 – –
Natural gas 52.655 – –
Petroleum 14.017 – –
Total Emissions(g/ton)
VOC 693.878 – –
CO 3709.203 – –
NOx 763.261 – –
PM10 306.210 – –
PM2.5 67.445 – –
SOx 20605.933 – –
CH4 13776.766 – –
N2O 9.880 – –
CO2 1011176.419 – –
CO2 (VOC, CO, CO2) 1019167.752 – –
GHGs 1366531.277 – –
Notes:
Comparison of EPDM Data
Energy data from Plastics Division of the ACC is in terms of HHV.Distillate fuel was modeled as diesel in GREET 2.7.
48

Reference Unit: 1 ton of Liquid Epoxy ResinPrincipal Data Source(s): PlasticsEurope
Geographic Location: Europe
Timeframe: 1994‐2001Description:
MATERIAL PRODUCTION DATA (Excluding Transport)
Energy ContentValue Unit ( MMBtu)
Resid. oil gal
Diesel gal
Natural gas 43460.573 cu ft 42.722
Coal lb
Electricity 1917.929 kWh 6.544
Crude Oil 72.484 gal 9.399
Distillate Oil gal
Gasoline gal
LPG gal
MISC: Process off‐gas from Oil lb
MISC: Process off‐gas from NG lb
MISC: Recovered Energy x
TOTAL 58.665
Liquid Epoxy Production
Fuel InputsPhysical Units
Cradle to resin inventory for production of liquid epoxy resin.
Feedstock Inputs Value Unit
Crude Oil 96.386 gal 12.498
Natural Gas 21635.529 cu ft 21.268
TOTAL 33.766
Non‐combustion Emissions Value Unit
VOC 7.678 g
CO 356.616 g
NOx 794.395 g
PM10 6175.304 g
PM2.5 g
SOx 596.721 g
CH4 1593.406 g
N2O 0.003 g
CO2 293928.2 g
Notes:Physical Units calculated using GREET Energy content calculated using GREET heating value assumptions.
49

TRANSPORT DATA
Energy ContentTransport Method (Fuel Used) Ton‐miles Value Unit ( MMBtu)
Combination truck (Diesel) gal
Single Unit (Diesel) gal
Rail (Diesel) gal
Barge (Diesel) gal
Barge (Resid. Oil) gal
Ocean Freighter (Diesel) gal
Ocean Freighter (Resid. Oil) gal
NG Pipeline (NG) cu ftPetro Pipeline (Electricity) kWh
Residual Oil gal
Diesel gal
Crude Oil 1.863 gal 0.242
Natural Gas 82.811 cu ft 0.081
Electricity 123.340 kWh 0.421
TOTAL 0.744
MATERIAL PRODUCTION DATA (Including Transport)
Energy ContentFuel Inputs Value Unit ( MMBtu)
Physical Units
Liquid Epoxy Production (cont'd)
Physical Units
Resid. oil gal
Diesel gal
Natural gas 43543.384 cu ft 42.803
Coal lb
Electricity 2041.269 kWh 6.965
Crude Oil 74.347 gal 9.641
Distillate Oil gal
Gasoline gal
LPG gal
MISC: Process off‐gas from Oil lb
MISC: Process off‐gas from NG lb
MISC: Recovered Energy x
TOTAL 59.409
Notes:
Upstream energy included in the European portion of transportation data was removed by applying the delivered fuel energy to total energy ratio for each fuel. This ratio was unique to each data set.
50

Updated Previously Industry Source Industry SourceValues in GREET PlasticsEurope Source #2
Energy Use (mmBTU/ton)
Total Energy 106.283 – 117.885
Fossil fuels 103.974 – 106.534
Coal 10.787 – 10.653
Natural gas 70.596 – 70.292
Petroleum 22.591 – 25.585
Total Emissions(g/ton)
VOC 487.823 – 7.777
CO 2042.538 – 4259.720
NOx 7638.815 – 12169.988
PM10 8529.681 – 7833.753
PM2.5 844.060 –
SOx 8130.174 – 10805.578
CH4 12785.464 – 92198.337
N2O 88.696 – 0.003
CO2 5,222,053 – 5,178,627 CO2 (VOC, CO, CO2) 5,226,783 – 5,185,435 GHGs 5,572,851 – 7,317,902 Notes:
Comparison of Epoxy Data
Energy data from PlasticsEurope is in terms of HHV.Recovered energy (6.994 mmBtu/ton) was incorporated into the natural gas, fossil fuels, and total energy calculations.calculations.
51

Reference Unit: 1 ton of GPPS ResinPrincipal Data Source(s): Plastics Division of the ACCGeographic Location: North America
Timeframe: 1992‐1993, 2002‐2003Description:
MATERIAL PRODUCTION DATA (Excluding Transport)
Energy ContentValue Unit ( MMBtu)
Resid. oil 11.160 gal 1.566
Diesel 0.007 gal 0.001
Natural gas 19752.000 cu ft 19.416
Coal 0.000 lb 0.000
Electricity 462.000 kWh 1.576
Crude Oil gal
Distillate Oil 1.000 gal 0.128
Gasoline 0.220 gal 0.026
LPG 0.200 gal 0.017
MISC: Process off‐gas from Oil 79.800 lb 2.210
MISC: Process off‐gas from NG 158.600 lb 4.538
MISC: Recovered Energy x ‐0.008TOTAL 29.479
General‐Purpose Polystyrene Production
Fuel InputsPhysical Units
Cradle to gate inventory for general‐purpose polystyrene (GPPS) resin production.
Feedstock Inputs Value Unit
Crude Oil 201.536 gal 26.133
Natural Gas 16783.505 cu ft 16.498
TOTAL 42.631
Non‐combustion Emissions Value Unit
VOC 344.730 g
CO 9062.776 g
NOx 390.089 g
PM10 50.802 g
PM2.5 7.076 g
SOx 12337.712 g
CH4 8545.680 g
N2O 0.000 g
CO2 303906.888 g
Notes:Physical Units calculated using GREET Energy content calculated using GREET heating value assumptions. Recovered energy was not included in the totals as the credit could not be attributed to a specific fuel. Recovered energy comprises less than 1% of total fuel inputs.
52

TRANSPORT DATA
Energy ContentTransport Method (Fuel Used) Ton‐miles Value Unit ( MMBtu)
Combination truck (Diesel) 176.8 1.86 gal 0.239
Single Unit (Diesel) 0 0 gal 0.000
Rail (Diesel) 284 0.7 gal 0.090
Barge (Diesel) 850 0.68 gal 0.087
Barge (Resid. Oil) 2.26 gal 0.317
Ocean Freighter (Diesel) 2374 0.46 gal 0.059
Ocean Freighter (Resid. Oil) 4.06 gal 0.570
NG Pipeline (NG) 476 328 cu ft 0.322
Petro Pipeline (Electricity) 488 10.64 kWh 0.036
Residual Oil gal
Diesel gal
Crude Oil gal
Natural Gas cu ftElectricity kWh
TOTAL 1.721
MATERIAL PRODUCTION DATA (Including Transport)
Energy ContentFuel Inputs Value Unit ( MMBtu)
Physical Units
General‐Purpose Polystyrene Production (cont'd)
Physical Units
Resid. oil 17.480 gal 2.453
Diesel 3.707 gal 0.476
Natural gas 20080.000 cu ft 19.739
Coal 0.000 lb 0.000
Electricity 472.640 kWh 1.613
Crude Oil gal
Distillate Oil 1.000 gal 0.128
Gasoline 0.220 gal 0.026
LPG 0.200 gal 0.017
MISC: Process off‐gas from Oil 79.800 lb 2.210
MISC: Process off‐gas from NG 158.600 lb 4.538
MISC: Recovered Energy x ‐0.008TOTAL 31.200
Notes:
53

Updated Previously Industry SourceValues in GREET Plastics Div, ACC
Energy Use (mmBTU/ton)
Total Energy 76.221 – 82.668
Fossil fuels 75.659 –
Coal 2.640 –
Natural gas 42.665 –
Petroleum 30.354 –
Total Emissions(g/ton)
VOC 534.047 – 1058.219
CO 9737.139 – 14219.816
NOx 2598.084 – 6514.660
PM10 672.173 – 286.601
PM2.5 246.378 – 8.598
SOx 13718.710 – 16093.745
CH4 13014.442 – 19290.448
N2O 28.755 – 41.888
CO2 2,288,062 – 2,993,878 CO2 (VOC, CO, CO2) 2,305,028 – 3,019,855 GHGs 2,638,958 – 3,494,327 Notes:
Comparison of GPPS Data
Energy data from Plastics Division of the ACC is in terms of HHV.Distillate fuel was modeled as diesel in GREET 2.7.
54

Reference Unit: 1 ton of HIPS ResinPrincipal Data Source(s): Plastics Division of the ACCGeographic Location: North America
Timeframe: 1970's, 1992‐1993, 2000‐2003Description:
MATERIAL PRODUCTION DATA (Excluding Transport)
Energy ContentValue Unit ( MMBtu)
Resid. oil 11.440 gal 1.606
Diesel 0.007 gal 0.001
Natural gas 19384.000 cu ft 19.054
Coal 0.000 lb 0.000
Electricity 470.000 kWh 1.604
Crude Oil gal
Distillate Oil 0.980 gal 0.126
Gasoline 0.220 gal 0.026
LPG 0.240 gal 0.020
MISC: Process off‐gas from Oil 85.400 lb 2.368
MISC: Process off‐gas from NG 167.800 lb 4.780
MISC: Recovered Energy x ‐0.008TOTAL 29.584
High‐Impact Polystyrene Production
Fuel InputsPhysical Units
Cradle to gate inventory for high‐impact polystyrene (HIPS) resin production.
Feedstock Inputs Value Unit
Crude Oil 200.121 gal 25.950
Natural Gas 17525.773 cu ft 17.228
TOTAL 43.177
Non‐combustion Emissions Value Unit
VOC 362.874 g
CO 9017.416 g
NOx 381.018 g
PM10 62.596 g
PM2.5 6.622 g
SOx 12791.305 g
CH4 8817.836 g
N2O 0.000 g
CO2 288484.747 g
Notes:Physical Units calculated using GREET Energy content calculated using GREET heating value assumptions. Recovered energy was not included in the totals as the credit could not be attributed to a specific fuel. Recovered energy comprises less than 1% of total fuel inputs.
55

TRANSPORT DATA
Energy ContentTransport Method (Fuel Used) Ton‐miles Value Unit ( MMBtu)
Combination truck (Diesel) 176.8 1.86 gal 0.239
Single Unit (Diesel) 0 0 gal 0.000
Rail (Diesel) 284 0.7 gal 0.090
Barge (Diesel) 850 0.68 gal 0.087
Barge (Resid. Oil) 2.26 gal 0.317
Ocean Freighter (Diesel) 2374 0.46 gal 0.059
Ocean Freighter (Resid. Oil) 4.06 gal 0.570
NG Pipeline (NG) 476 328 cu ft 0.322
Petro Pipeline (Electricity) 488 10.64 kWh 0.036
Residual Oil gal
Diesel gal
Crude Oil gal
Natural Gas cu ftElectricity kWh
TOTAL 1.721
MATERIAL PRODUCTION DATA (Including Transport)
Energy ContentFuel Inputs Value Unit ( MMBtu)
Physical Units
High‐Impact Polystyrene Production (cont'd)
Physical Units
Resid. oil 17.760 gal 2.493
Diesel 3.707 gal 0.476
Natural gas 19712.000 cu ft 19.377
Coal 0.000 lb 0.000
Electricity 480.640 kWh 1.640
Crude Oil gal
Distillate Oil 0.980 gal 0.126
Gasoline 0.220 gal 0.026
LPG 0.240 gal 0.020
MISC: Process off‐gas from Oil 85.400 lb 2.368
MISC: Process off‐gas from NG 167.800 lb 4.780
MISC: Recovered Energy x ‐0.008TOTAL 31.305
Notes:
56

Updated Previously Industry SourceValues in GREET Plastics Div, ACC
Energy Use (mmBTU/ton)
Total Energy 76.892 – 83.44
Fossil fuels 76.321 –
Coal 2.683 –
Natural gas 43.271 –
Petroleum 30.368 –
Total Emissions(g/ton)
VOC 549.841 – 1069.242
CO 9669.043 – 14219.816
NOx 2578.898 – 6602.845
PM10 683.432 – 297.624
PM2.5 243.984 – 8.047
SOx 14200.043 – 16644.901
CH4 13223.193 – 19510.910
N2O 28.044 – 41.888
CO2 2,277,184 – 3,013,146 CO2 (VOC, CO, CO2) 2,294,091 – 3,039,158 GHGs 2,633,028 – 3,508,657 Notes:
Comparison of HIPS Data
Energy data from Plastics Division of the ACC is in terms of HHV.Distillate fuel was modeled as diesel in GREET 2.7.
57

Reference Unit: 1 ton of HDPE ResinPrincipal Data Source(s): Plastics Division of the ACCGeographic Location: North America
Timeframe: 2003
Description:
MATERIAL PRODUCTION DATA (Excluding Transport)
Energy ContentValue Unit ( MMBtu)
Resid. oil 3.040 gal 0.427
Diesel 0.019 gal 0.002
Natural gas 9720.000 cu ft 9.555
Coal 0.000 lb 0.000
Electricity 320.000 kWh 1.092
Crude Oil gal
Distillate Oil 0.360 gal 0.046
Gasoline 0.220 gal 0.026
LPG 0.068 gal 0.006
MISC: Process off‐gas from Oil 51.600 lb 1.584
MISC: Process off‐gas from NG 236.000 lb 7.216
MISC: Recovered Energy x ‐0.024TOTAL 19.953
Feedstock Inputs Value Unit
Crude Oil 54.064 gal 7.010
Natural Gas 34845.361 cu ft 34.253
TOTAL 41.263
Non‐combustion Emissions Value Unit
VOC 662.245 g
CO 2685.267 g
NOx 88.904 g
PM10 127.006 g
PM2.5 10.886 g
SOx 21137.404 g
CH4 12791.305 g
N2O 0.000 g
CO2 69762.507 g
Notes:Physical Units calculated using GREET
High‐Density Polyethylene Production
Fuel InputsPhysical Units
Cradle to resin inventory for high‐density polyethylene (HDPE) resin production.
Energy content calculated using GREET heating value assumptions. Recovered energy was not included in the totals as the credit could not be attributed to a specific fuel. Recovered energy comprises less than 1% of total fuel inputs.
58

TRANSPORT DATA
Energy ContentTransport Method (Fuel Used) Ton‐miles Value Unit ( MMBtu)
Combination truck (Diesel) 15.12 0.16 gal 0.020
Single Unit (Diesel) 0 0 gal 0.000
Rail (Diesel) 13.06 0.03 gal 0.004
Barge (Diesel) 31.20 0.03 gal 0.003
Barge (Resid. Oil) 0.09 gal 0.012
Ocean Freighter (Diesel) 640.00 0.12 gal 0.016
Ocean Freighter (Resid. Oil) 1.10 gal 0.154
NG Pipeline (NG) 940.00 648.00 cu ft 0.637
Petro Pipeline (Electricity) 248.00 5.42 kWh 0.018
Residual Oil gal
Diesel gal
Crude Oil gal
Natural Gas cu ftElectricity kWh
TOTAL 0.866
MATERIAL PRODUCTION DATA (Including Transport)
Energy ContentFuel Inputs Value Unit ( MMBtu)
Resid. oil 4.226 gal 0.593
Diesel 0.359 gal 0.046
Natural gas 10368.000 cu ft 10.192
Coal 0.000 lb 0.000
Electricity 325.420 kWh 1.110
Crude Oil gal
Distillate Oil 0.360 gal 0.046
Gasoline 0.220 gal 0.026
LPG 0.068 gal 0.006
MISC: Process off‐gas from Oil 51.600 lb 1.584
MISC: Process off‐gas from NG 236.000 lb 7.216
MISC: Recovered Energy x ‐0.024TOTAL 20.819
Notes:
Physical Units
High‐Density Polyethylene Production (cont'd)
Physical Units
59

Updated Previously Industry SourceValues in GREET Plastics Div, ACC
Energy Use (mmBTU/ton)
Total Energy 63.688 45.977 70.46
Fossil fuels 63.303 43.646
Coal 1.803 10.994
Natural gas 52.263 18.320
Petroleum 9.237 14.332
Total Emissions(g/ton)
VOC 762.237 499.746 1069.242
CO 2970.417 1035.969 4596.638
NOx 1001.694 4725.855 2590.432
PM10 496.474 2622.888 242.508
PM2.5 128.645 965.636 13.228
SOx 21894.170 6344.230 26124.778
CH4 15043.573 5853.654 19510.910
N2O 15.197 41.271 19.842
CO2 1,289,195 3,521,214 1,511,114 CO2 (VOC, CO, CO2) 1,296,238 3,522,388 1,521,801 GHGs 1,676,856 3,681,028 1,999,593 Notes:
Comparison of HDPE Data
Energy data from Plastics Division of the ACC is in terms of HHV.Distillate fuel was modeled as diesel in GREET 2.7.
60

Reference Unit: 1 ton of LDPE ResinPrincipal Data Source(s): Plastics Division of the ACCGeographic Location: North America
Timeframe: 2002‐2003Description:
MATERIAL PRODUCTION DATA (Excluding Transport)
Energy ContentValue Unit ( MMBtu)
Resid. oil 1.960 gal 0.275
Diesel 0.020 gal 0.003
Natural gas 13284.000 cu ft 13.058
Coal 0.000 lb 0.000
Electricity 332.000 kWh 1.133
Crude Oil gal
Distillate Oil 0.380 gal 0.049
Gasoline 0.240 gal 0.028
LPG 0.068 gal 0.006
MISC: Process off‐gas from Oil 52.600 lb 1.614
MISC: Process off‐gas from NG 240.000 lb 7.348
MISC: Recovered Energy x ‐0.366TOTAL 23.238
Low Density Polyethylene Production
Fuel InputsPhysical Units
Cradle to resin inventory of low density polyethylene (LDPE) resin production.
Feedstock Inputs Value Unit
Crude Oil 54.913 gal 7.121
Natural Gas 35505.155 cu ft 34.902
TOTAL 42.022
Non‐combustion Emissions Value Unit
VOC 680.389 g
CO 2685.267 g
NOx 65.317 g
PM10 117.934 g
PM2.5 4.990 g
SOx 21590.997 g
CH4 12972.742 g
N2O 0.907 g
CO2 80104.413 g
Notes:Physical Units calculated using GREET Energy content calculated using GREET heating value assumptions. Recovered energy was not included in the totals as the credit could not be attributed to a specific fuel. Recovered energy comprises less than 2% of total fuel inputs.
61

TRANSPORT DATA
Energy ContentTransport Method (Fuel Used) Ton‐miles Value Unit ( MMBtu)
Combination truck (Diesel) 15.38 0.162 gal 0.021
Single Unit (Diesel) 0 0 gal 0.000
Rail (Diesel) 13.3 0.032 gal 0.004
Barge (Diesel) 31.6 0.026 gal 0.003
Barge (Resid. Oil) 0.084 gal 0.012
Ocean Freighter (Diesel) 652 0.134 gal 0.017
Ocean Freighter (Resid. Oil) 1.14 gal 0.160
NG Pipeline (NG) 956 660 cu ft 0.649
Petro Pipeline (Electricity) 254 5.52 kWh 0.019
Residual Oil gal
Diesel gal
Crude Oil gal
Natural Gas cu ftElectricity kWh
TOTAL 0.885
MATERIAL PRODUCTION DATA (Including Transport)
Energy ContentFuel Inputs Value Unit ( MMBtu)
Physical Units
Low Density Polyethylene Production (cont'd)
Physical Units
Resid. oil 3.184 gal 0.447
Diesel 0.374 gal 0.048
Natural gas 13944.000 cu ft 13.707
Coal 0.000 lb 0.000
Electricity 337.520 kWh 1.152
Crude Oil gal
Distillate Oil 0.380 gal 0.049
Gasoline 0.240 gal 0.028
LPG 0.068 gal 0.006
MISC: Process off‐gas from Oil 52.600 lb 1.614
MISC: Process off‐gas from NG 240.000 lb 7.348
MISC: Recovered Energy x ‐0.366TOTAL 24.398
Notes:
62

Updated Previously Industry SourceValues in GREET Plastics Div, ACC
Energy Use (mmBTU/ton)
Total Energy 68.309 – 75.064
Fossil fuels 67.908 –
Coal 1.877 –
Natural gas 56.795 –
Petroleum 9.237 –
Total Emissions(g/ton)
VOC 806.224 – 1091.288
CO 3055.837 – 4464.361
NOx 1244.186 – 2590.432
PM10 506.331 – 231.485
PM2.5 134.102 – 6.063
SOx 22375.847 – 26565.703
CH4 15913.840 – 20062.066
N2O 20.406 – 22.046
CO2 1,526,400 – 1,564,224 CO2 (VOC, CO, CO2) 1,533,715 – 1,574,769 GHGs 1,937,642 – 2,067,936 Notes:
Comparison of LDPE Data
Energy data from Plastics Division of the ACC is in terms of HHV.Distillate fuel was modeled as diesel in GREET 2.7.
63

Reference Unit: 1 ton of LLDPE ResinPrincipal Data Source(s): Plastics Division of the ACCGeographic Location: North America
Timeframe: 2003
Description:
MATERIAL PRODUCTION DATA (Excluding Transport)
Energy ContentValue Unit ( MMBtu)
Resid. oil 2.420 gal 0.340
Diesel 0.020 gal 0.003
Natural gas 9592.000 cu ft 9.429
Coal 0.000 lb 0.000
Electricity 274.000 kWh 0.935
Crude Oil gal
Distillate Oil 0.360 gal 0.046
Gasoline 0.240 gal 0.028
LPG 0.060 gal 0.005
MISC: Process off‐gas from Oil 52.200 lb 1.600
MISC: Process off‐gas from NG 238.000 lb 7.284
MISC: Recovered Energy x ‐0.024TOTAL 19.669
Linear‐Low Density Polyethylene Production
Fuel InputsPhysical Units
Cradle to resin inventory of linear‐low density polyethylene (LLDPE) production.
Feedstock Inputs Value Unit
Crude Oil 54.347 gal 7.047
Natural Gas 35175.258 cu ft 34.577
TOTAL 41.624
Non‐combustion Emissions Value Unit
VOC 671.317 g
CO 2648.979 g
NOx 90.718 g
PM10 99.790 g
PM2.5 9.072 g
SOx 21409.560 g
CH4 12882.023 g
N2O 15.422 g
CO2 116119.647 g
Notes:Physical Units calculated using GREET Energy content calculated using GREET heating value assumptions. Recovered energy was not included in the totals as the credit could not be attributed to a specific fuel. Recovered energy comprises less than 1% of total fuel inputs.
64
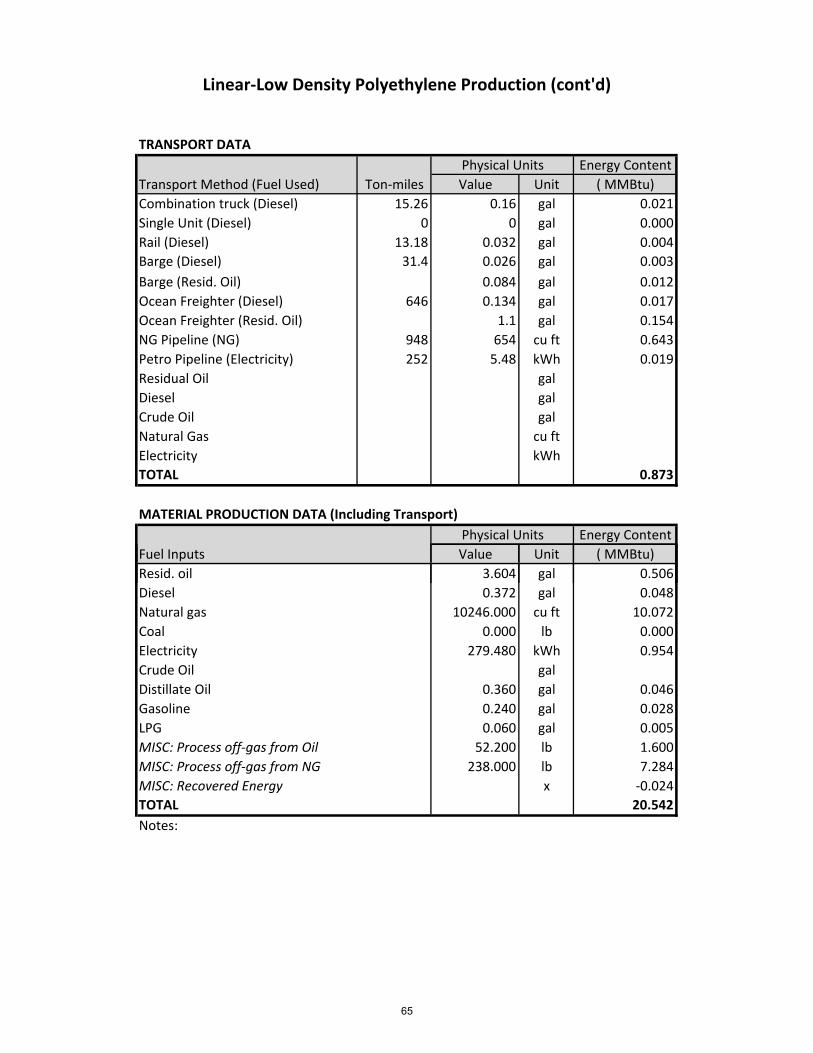
TRANSPORT DATA
Energy ContentTransport Method (Fuel Used) Ton‐miles Value Unit ( MMBtu)
Combination truck (Diesel) 15.26 0.16 gal 0.021
Single Unit (Diesel) 0 0 gal 0.000
Rail (Diesel) 13.18 0.032 gal 0.004
Barge (Diesel) 31.4 0.026 gal 0.003
Barge (Resid. Oil) 0.084 gal 0.012
Ocean Freighter (Diesel) 646 0.134 gal 0.017
Ocean Freighter (Resid. Oil) 1.1 gal 0.154
NG Pipeline (NG) 948 654 cu ft 0.643
Petro Pipeline (Electricity) 252 5.48 kWh 0.019
Residual Oil gal
Diesel gal
Crude Oil gal
Natural Gas cu ftElectricity kWh
TOTAL 0.873
MATERIAL PRODUCTION DATA (Including Transport)
Energy ContentFuel Inputs Value Unit ( MMBtu)
Physical Units
Linear‐Low Density Polyethylene Production (cont'd)
Physical Units
Resid. oil 3.604 gal 0.506
Diesel 0.372 gal 0.048
Natural gas 10246.000 cu ft 10.072
Coal 0.000 lb 0.000
Electricity 279.480 kWh 0.954
Crude Oil gal
Distillate Oil 0.360 gal 0.046
Gasoline 0.240 gal 0.028
LPG 0.060 gal 0.005
MISC: Process off‐gas from Oil 52.200 lb 1.600
MISC: Process off‐gas from NG 238.000 lb 7.284
MISC: Recovered Energy x ‐0.024TOTAL 20.542
Notes:
65
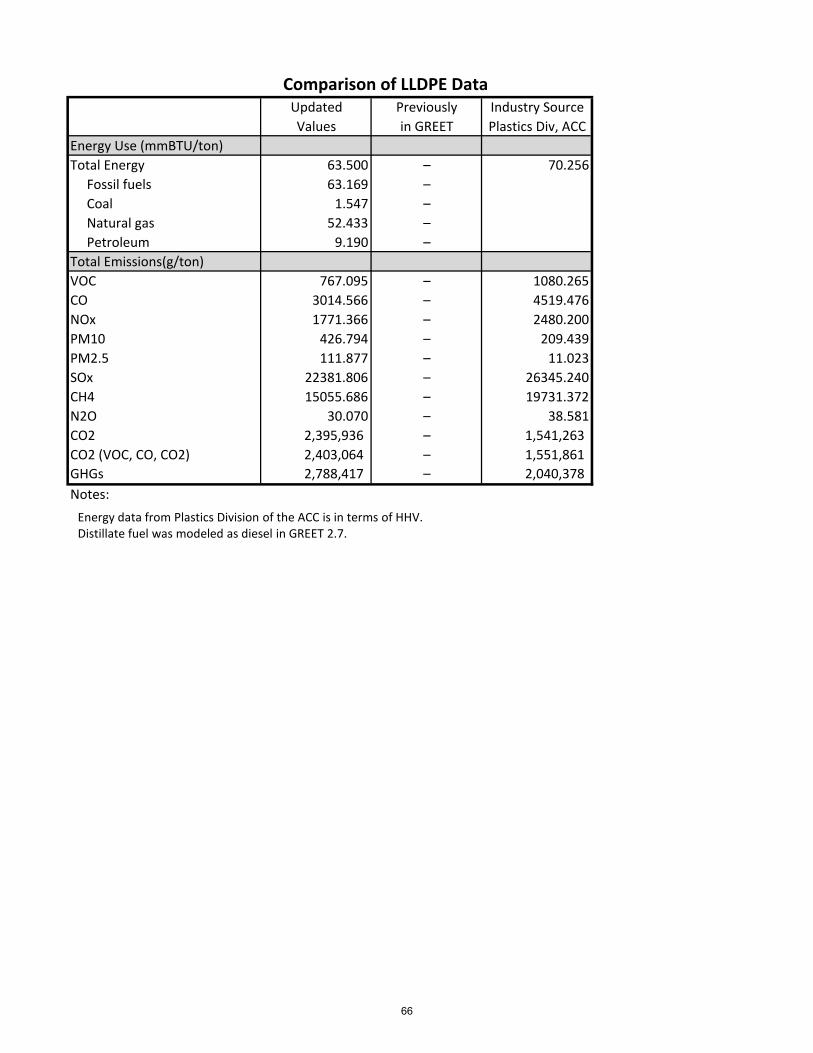
Updated Previously Industry SourceValues in GREET Plastics Div, ACC
Energy Use (mmBTU/ton)
Total Energy 63.500 – 70.256
Fossil fuels 63.169 –
Coal 1.547 –
Natural gas 52.433 –
Petroleum 9.190 –
Total Emissions(g/ton)
VOC 767.095 – 1080.265
CO 3014.566 – 4519.476
NOx 1771.366 – 2480.200
PM10 426.794 – 209.439
PM2.5 111.877 – 11.023
SOx 22381.806 – 26345.240
CH4 15055.686 – 19731.372
N2O 30.070 – 38.581
CO2 2,395,936 – 1,541,263 CO2 (VOC, CO, CO2) 2,403,064 – 1,551,861 GHGs 2,788,417 – 2,040,378 Notes:
Comparison of LLDPE Data
Energy data from Plastics Division of the ACC is in terms of HHV.Distillate fuel was modeled as diesel in GREET 2.7.
66

Reference Unit: 1 ton of Nylon 6 ProductionPrincipal Data Source(s): PlasticsEurope
Geographic Location: Europe
Timeframe: 1994, 1999‐2002, 2007Description:
MATERIAL PRODUCTION DATA (Excluding Transport)
Energy ContentValue Unit ( MMBtu)
Resid. oil gal
Diesel gal
Natural gas 34768.407 cu ft 34.177
Coal lb
Electricity 1163.803 kWh 3.971
Crude Oil 108.571 gal 14.078
Distillate Oil gal
Gasoline gal
LPG gal
MISC: Process off‐gas from Oil lb
MISC: Process off‐gas from NG lb
MISC: Recovered Energy x
TOTAL 52.22678
Nylon 6 Production
Fuel InputsPhysical Units
Cradle to resin inventory for nylon 6 resin production.
Feedstock Inputs Value Unit
Crude Oil 115.138 gal 14.930
Natural Gas 15872.359 cu ft 15.603
TOTAL 30.532
Non‐combustion Emissions Value Unit
VOC 18.435 g
CO 5050.056 g
NOx 7470.088 g
PM10 156.335 g
PM2.5 g
SOx 440.054 g
CH4 2246.827 g
N2O 7809.833 g
CO2 1043225.845 g
Notes:Physical Units calculated using GREET Energy content calculated using GREET heating value assumptions.
67

TRANSPORT DATA
Energy ContentTransport Method (Fuel Used) Ton‐miles Value Unit ( MMBtu)
Combination truck (Diesel) gal
Single Unit (Diesel) gal
Rail (Diesel) gal
Barge (Diesel) gal
Barge (Resid. Oil) gal
Ocean Freighter (Diesel) gal
Ocean Freighter (Resid. Oil) gal
NG Pipeline (NG) cu ftPetro Pipeline (Electricity) kWh
Residual Oil gal
Diesel gal
Crude Oil 4.282 gal 0.555
Natural Gas 110.154 cu ft 0.108
Electricity 98.460 kWh 0.336
TOTAL 0.999
MATERIAL PRODUCTION DATA (Including Transport)
Energy ContentFuel Inputs Value Unit ( MMBtu)
Physical Units
Nylon 6 Production (cont'd)
Physical Units
Resid. oil gal
Diesel gal
Natural gas 34878.561 cu ft 34.286
Coal lb
Electricity 1262.262 kWh 4.307
Crude Oil 112.853 gal 14.634
Distillate Oil gal
Gasoline gal
LPG gal
MISC: Process off‐gas from Oil lb
MISC: Process off‐gas from NG lb
MISC: Recovered Energy x
TOTAL 53.226
Notes:
Upstream energy included in the European portion of transportation data was removed by applying the delivered fuel energy to total energy ratio for each fuel. This ratio was unique to each data set.
68

Updated Previously Industry SourceValues in GREET PlasticsEurope
Energy Use (mmBTU/ton)
Total Energy 92.208 – 103.588
Fossil fuels 90.790 – 95.784
Coal 6.626 – 11.939
Natural gas 54.597 – 50.679
Petroleum 29.566 – 33.165
Total Emissions(g/ton)
VOC 407.128 – 18.481
CO 6528.715 – 8836.469
NOx 14014.264 – 16866.847
PM10 1884.136 – 2640.409
PM2.5 712.631 –
SOx 8489.632 – 15058.231
CH4 11448.642 – 42518.689
N2O 7890.922 – 7809.753
CO2 5,255,372 – 4,954,035 CO2 (VOC, CO, CO2) 5,266,901 – 4,968,166 GHGs 7,904,612 – 8,280,100 Notes:
Comparison of Nylon 6 Data
Energy data from PlasticsEurope is in terms of HHV.Recovered energy (10.151 mmBtu/ton) was incorporated into the natural gas, fossil fuels, and total energy calculations.calculations.
69

Reference Unit: 1 ton of Nylon 66 ResinPrincipal Data Source(s): PlasticsEurope
Geographic Location: Europe
Timeframe: 1996‐2002Description:
MATERIAL PRODUCTION DATA (Excluding Transport)
Energy ContentValue Unit ( MMBtu)
Resid. oil gal
Diesel gal
Natural gas 33284.536 cu ft 32.719
Coal lb
Electricity 2037.778 kWh 6.953
Crude Oil 88.719 gal 11.504
Distillate Oil gal
Gasoline gal
LPG gal
MISC: Process off‐gas from Oil lb
MISC: Process off‐gas from NG lb
MISC: Recovered Energy x
TOTAL 51.176
Nylon 66 Production
Fuel InputsPhysical Units
Cradle to resin inventory for nylon 66 resin production.
Feedstock Inputs Value Unit
Crude Oil 155.636 gal 20.181
Natural Gas 20239.657 cu ft 19.896
TOTAL 40.077
Non‐combustion Emissions Value Unit
VOC 19.612 g
CO 1565.294 g
NOx 1620.850 g
PM10 211.424 g
PM2.5 g
SOx 402.330 g
CH4 2024.299 g
N2O 662.083 g
CO2 835981.451 g
Notes:Physical Units calculated using GREET Energy content calculated using GREET heating value assumptions.
70
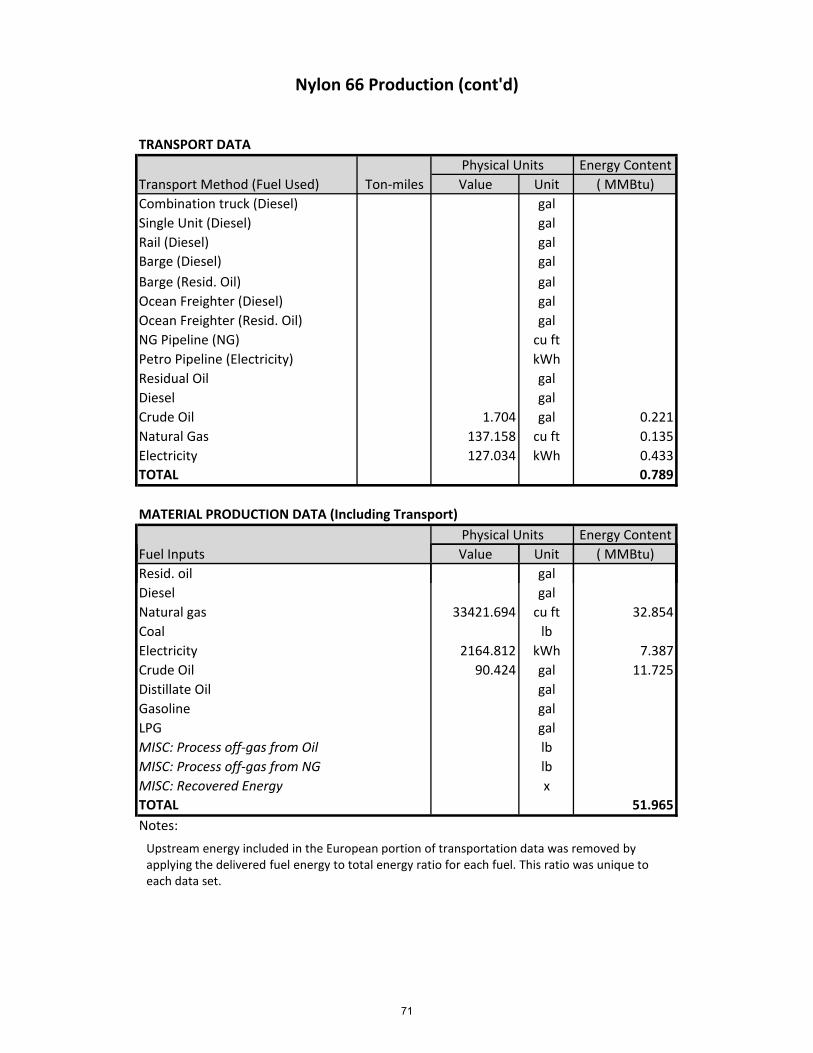
TRANSPORT DATA
Energy ContentTransport Method (Fuel Used) Ton‐miles Value Unit ( MMBtu)
Combination truck (Diesel) gal
Single Unit (Diesel) gal
Rail (Diesel) gal
Barge (Diesel) gal
Barge (Resid. Oil) gal
Ocean Freighter (Diesel) gal
Ocean Freighter (Resid. Oil) gal
NG Pipeline (NG) cu ftPetro Pipeline (Electricity) kWh
Residual Oil gal
Diesel gal
Crude Oil 1.704 gal 0.221
Natural Gas 137.158 cu ft 0.135
Electricity 127.034 kWh 0.433
TOTAL 0.789
MATERIAL PRODUCTION DATA (Including Transport)
Energy ContentFuel Inputs Value Unit ( MMBtu)
Physical Units
Nylon 66 Production (cont'd)
Physical Units
Resid. oil gal
Diesel gal
Natural gas 33421.694 cu ft 32.854
Coal lb
Electricity 2164.812 kWh 7.387
Crude Oil 90.424 gal 11.725
Distillate Oil gal
Gasoline gal
LPG gal
MISC: Process off‐gas from Oil lb
MISC: Process off‐gas from NG lb
MISC: Recovered Energy x
TOTAL 51.965
Notes:
Upstream energy included in the European portion of transportation data was removed by applying the delivered fuel energy to total energy ratio for each fuel. This ratio was unique to each data set.
71

Updated Previously Industry SourceValues in GREET PlasticsEurope
Energy Use (mmBTU/ton)
Total Energy 105.129 – 119.202
Fossil fuels 102.680 – 110.167
Coal 11.440 – 15.903
Natural gas 58.848 – 58.513
Petroleum 32.391 – 35.749
Total Emissions(g/ton)
VOC 442.774 – 19.675
CO 3093.002 – 6637.763
NOx 8186.669 – 12280.543
PM10 2709.107 – 1931.106
PM2.5 880.287 –
SOx 8869.070 – 16161.913
CH4 11554.776 – 44688.010
N2O 744.446 – 668.100
CO2 5,377,578 – 5,934,498 CO2 (VOC, CO, CO2) 5,383,818 – 5,945,131 GHGs 5,894,533 – 7,184,794 Notes:
Comparison of Nylon 66 Data
Energy data from PlasticsEurope is in terms of HHV.Recovered energy (4.248 mmBtu/ton) was incorporated into the natural gas, fossil fuels, and total energy calculations.calculations.
72

Reference Unit: 1 ton of PC ResinPrincipal Data Source(s): PlasticsEurope
Geographic Location: Europe
Timeframe: 1994, 1999‐2002, 2007Description:
MATERIAL PRODUCTION DATA (Excluding Transport)
Energy ContentValue Unit ( MMBtu)
Resid. oil gal
Diesel gal
Natural gas 28412.870 cu ft 27.930
Coal 0.020 lb 0.400
Electricity 1679.339 kWh 5.730
Crude Oil 65.564 gal 8.502
Distillate Oil gal
Gasoline gal
LPG gal
MISC: Process off‐gas from Oil lb
MISC: Process off‐gas from NG lb
MISC: Recovered Energy x
TOTAL 42.562
Polycarbonate Production
Fuel InputsPhysical Units
Cradle to resin inventory for polycarbonate (PC).
Feedstock Inputs Value Unit
Crude Oil 189.568 gal 24.581
Natural Gas 4737.690 cu ft 4.657
TOTAL 29.238
Non‐combustion Emissions Value Unit
VOC g
CO g
NOx g
PM10 g
PM2.5 g
SOx g
CH4 g
N2O g
CO2 g
Notes:Physical Units calculated using GREET Physical Units for fuel inputs calculated using GREET heating value assumptions. Results were calculated from total primary energy data using assumptions in GREET 1.8c model.
Non‐combustion emissions were not reported separately
73

TRANSPORT DATA
Energy ContentTransport Method (Fuel Used) Ton‐miles Value Unit ( MMBtu)
Combination truck (Diesel) gal
Single Unit (Diesel) gal
Rail (Diesel) gal
Barge (Diesel) gal
Barge (Resid. Oil) gal
Ocean Freighter (Diesel) gal
Ocean Freighter (Resid. Oil) gal
NG Pipeline (NG) cu ftPetro Pipeline (Electricity) kWh
Residual Oil gal
Diesel gal
Crude Oil gal
Natural Gas cu ftElectricity kWh
TOTAL
MATERIAL PRODUCTION DATA (Including Transport)
Energy ContentFuel Inputs Value Unit ( MMBtu)
Physical Units
Polycarbonate Production (cont'd)
Physical Units
Resid. oil gal
Diesel gal
Natural gas cu ftCoal lb
Electricity kWh
Crude Oil gal
Distillate Oil gal
Gasoline gal
LPG gal
MISC: Process off‐gas from Oil lb
MISC: Process off‐gas from NG lb
MISC: Recovered Energy x
TOTAL
Notes:
Transport was not calculated for PC as it was estimated to be less than 2% of total energy input.
74

Updated Previously Industry SourceValues in GREET PlasticsEurope
Energy Use (mmBTU/ton)
Total Energy 83.263 – 89.935
Fossil fuels 81.245 – 83.349
Coal 9.827 – 5.890
Natural gas 37.761 – 38.351
Petroleum 33.658 – 36.451
Total Emissions(g/ton)
VOC 355.523 – 2275.052
CO 1284.459 – 1451.496
NOx 5354.616 – 4508.708
PM10 2139.440 – 27.488
PM2.5 746.170 – 90.718
SOx 6676.477 – 3710.386
CH4 8003.297 – 10953.294
N2O 67.393 – 79.288
CO2 3,768,919 – 3,456,374 CO2 (VOC, CO, CO2) 3,772,046 – 3,465,848 GHGs 3,992,211 – 3,746,673 Notes:
Comparison of PC Data
Energy data from PlasticsEurope is in terms of HHV.
75
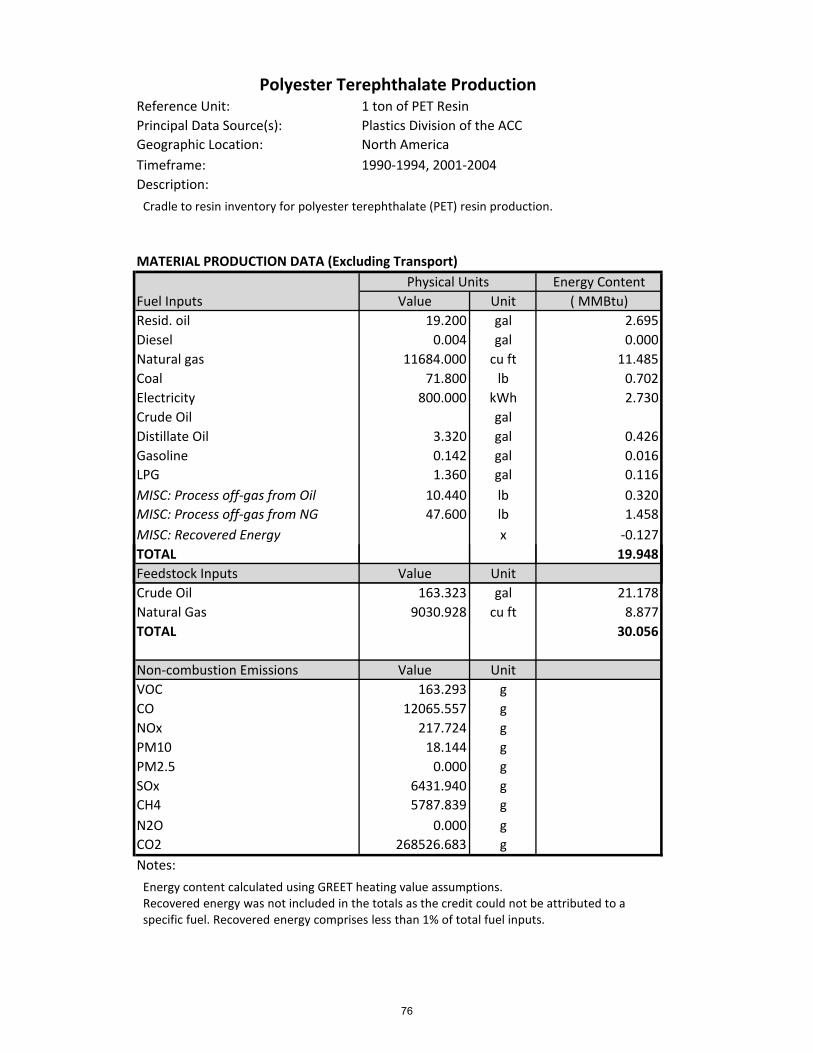
Reference Unit: 1 ton of PET ResinPrincipal Data Source(s): Plastics Division of the ACCGeographic Location: North America
Timeframe: 1990‐1994, 2001‐2004Description:
MATERIAL PRODUCTION DATA (Excluding Transport)
Energy ContentValue Unit ( MMBtu)
Resid. oil 19.200 gal 2.695
Diesel 0.004 gal 0.000
Natural gas 11684.000 cu ft 11.485
Coal 71.800 lb 0.702
Electricity 800.000 kWh 2.730
Crude Oil gal
Distillate Oil 3.320 gal 0.426
Gasoline 0.142 gal 0.016
LPG 1.360 gal 0.116
MISC: Process off‐gas from Oil 10.440 lb 0.320
MISC: Process off‐gas from NG 47.600 lb 1.458
MISC: Recovered Energy x ‐0.127TOTAL 19.948
Polyester Terephthalate Production
Fuel InputsPhysical Units
Cradle to resin inventory for polyester terephthalate (PET) resin production.
Feedstock Inputs Value Unit
Crude Oil 163.323 gal 21.178
Natural Gas 9030.928 cu ft 8.877
TOTAL 30.056
Non‐combustion Emissions Value Unit
VOC 163.293 g
CO 12065.557 g
NOx 217.724 g
PM10 18.144 g
PM2.5 0.000 g
SOx 6431.940 g
CH4 5787.839 g
N2O 0.000 g
CO2 268526.683 g
Notes:Physical Units calculated using GREET Energy content calculated using GREET heating value assumptions. Recovered energy was not included in the totals as the credit could not be attributed to a specific fuel. Recovered energy comprises less than 1% of total fuel inputs.
76

TRANSPORT DATA
Energy ContentTransport Method (Fuel Used) Ton‐miles Value Unit ( MMBtu)
Combination truck (Diesel) 17.7 0.186 gal 0.024
Single Unit (Diesel) 0 0 gal 0.000
Rail (Diesel) 1014 2.52 gal 0.324
Barge (Diesel) 86.2 0.068 gal 0.009
Barge (Resid. Oil) 0.22 gal 0.031
Ocean Freighter (Diesel) 1716 0.32 gal 0.041
Ocean Freighter (Resid. Oil) 2.94 gal 0.413
NG Pipeline (NG) 238 163.8 cu ft 0.161
Petro Pipeline (Electricity) 374 8.14 kWh 0.028
Residual Oil gal
Diesel gal
Crude Oil gal
Natural Gas cu ftElectricity kWh
TOTAL 1.030
MATERIAL PRODUCTION DATA (Including Transport)
Energy ContentFuel Inputs Value Unit ( MMBtu)
Physical Units
Polyester Terephthalate Production (cont'd)
Physical Units
Resid. oil 22.360 gal 3.138
Diesel 3.098 gal 0.398
Natural gas 11847.800 cu ft 11.646
Coal 71.800 lb 0.702
Electricity 808.140 kWh 2.757
Crude Oil gal
Distillate Oil 3.320 gal 0.426
Gasoline 0.142 gal 0.016
LPG 1.360 gal 0.116
MISC: Process off‐gas from Oil 10.440 lb 0.320
MISC: Process off‐gas from NG 47.600 lb 1.458
MISC: Recovered Energy x ‐0.127TOTAL 20.978
Notes:
77

Updated Previously Industry SourceValues in GREET Plastics Div, ACC
Energy Use (mmBTU/ton)
Total Energy 55.563 74.537 60.814
Fossil fuels 54.601 72.927
Coal 5.225 7.892
Natural gas 24.223 16.531
Petroleum 25.153 48.503
Total Emissions(g/ton)
VOC 334.495 676.980 639.341
CO 12667.965 1730.703 18077.905
NOx 2367.272 9429.901 6657.960
PM10 1192.370 3585.871 319.670
PM2.5 404.794 1804.166 0.000
SOx 8673.291 12421.151 9060.999
CH4 9264.640 8101.291 13778.891
N2O 28.895 49.668 52.911
CO2 2,053,513 6,011,201 2,586,243 CO2 (VOC, CO, CO2) 2,074,463 6,013,162 2,617,046 GHGs 2,314,689 6,230,495 2,932,148 Notes:
Comparison of PET Data
Energy data from Plastics Division of the ACC is in terms of HHV.Distillate fuel was modeled as diesel in GREET 2.7.
78

Reference Unit: 1 ton of Polypropylene ResinPrincipal Data Source(s): Plastics Division of the ACCGeographic Location: North America
Timeframe: 2003‐2004Description:
MATERIAL PRODUCTION DATA (Excluding Transport)
Energy ContentValue Unit ( MMBtu)
Resid. oil 4.060 gal 0.570
Diesel 0.004 gal 0.000
Natural gas 7584.000 cu ft 7.455
Coal 0.000 lb 0.000
Electricity 354.000 kWh 1.208
Crude Oil gal
Distillate Oil 0.380 gal 0.049
Gasoline 0.220 gal 0.026
LPG 0.120 gal 0.010
MISC: Process off‐gas from Oil 132.000 lb 3.754
MISC: Process off‐gas from NG 234.000 lb 6.672
MISC: Recovered Energy x ‐0.005TOTAL 19.744
Polypropylene Production
Fuel InputsPhysical Units
Cradle to resin inventory for polypropylene (PP) resin production.
Feedstock Inputs Value Unit
Crude Oil 105.580 gal 13.691
Natural Gas 27134.021 cu ft 26.673
TOTAL 40.363
Non‐combustion Emissions Value Unit
VOC 535.239 g
CO 5252.600 g
NOx 136.078 g
PM10 90.718 g
PM2.5 0.009 g
SOx 17599.384 g
CH4 11158.372 g
N2O 4.082 g
CO2 73754.119 g
Notes:Physical Units calculated using GREET Energy content calculated using GREET heating value assumptions. Recovered energy was not included in the totals as the credit could not be attributed to a specific fuel. Recovered energy comprises less than 1% of total fuel inputs.
79

TRANSPORT DATA
Energy ContentTransport Method (Fuel Used) Ton‐miles Value Unit ( MMBtu)
Combination truck (Diesel) 19.18 0.2 gal 0.026
Single Unit (Diesel) 0 0 gal 0.000
Rail (Diesel) 15 0.038 gal 0.005
Barge (Diesel) 63.2 0.05 gal 0.006
Barge (Resid. Oil) 0.168 gal 0.024
Ocean Freighter (Diesel) 1298 0.24 gal 0.031
Ocean Freighter (Resid. Oil) 2.2 gal 0.309
NG Pipeline (NG) 758 522 cu ft 0.513
Petro Pipeline (Electricity) 304 6.6 kWh 0.023
Residual Oil gal
Diesel gal
Crude Oil gal
Natural Gas cu ftElectricity kWh
TOTAL 0.936
MATERIAL PRODUCTION DATA (Including Transport)
Energy ContentFuel Inputs Value Unit ( MMBtu)
Physical Units
Polypropylene Production (cont'd)
Physical Units
Resid. oil 6.428 gal 0.902
Diesel 0.532 gal 0.068
Natural gas 8106.000 cu ft 7.968
Coal 0.000 lb 0.000
Electricity 360.600 kWh 1.230
Crude Oil gal
Distillate Oil 0.380 gal 0.049
Gasoline 0.220 gal 0.026
LPG 0.120 gal 0.010
MISC: Process off‐gas from Oil 132.000 lb 3.754
MISC: Process off‐gas from NG 234.000 lb 6.672
MISC: Recovered Energy x ‐0.005TOTAL 20.680
Notes:
80
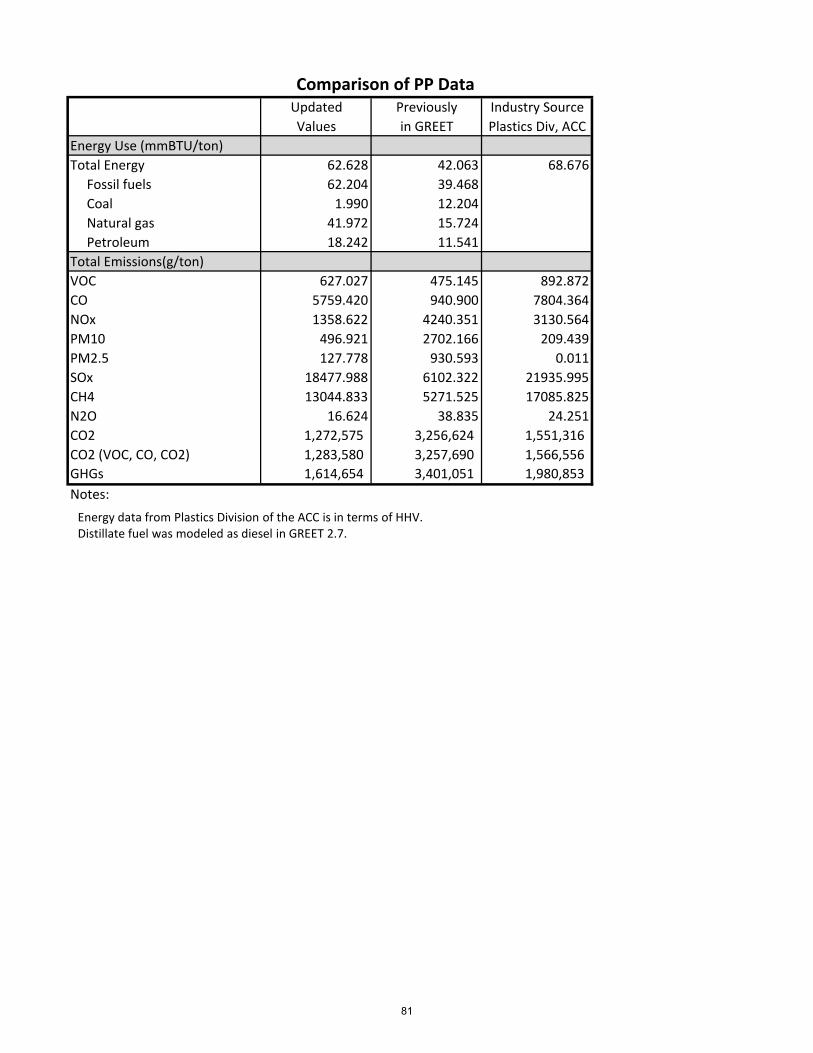
Updated Previously Industry SourceValues in GREET Plastics Div, ACC
Energy Use (mmBTU/ton)
Total Energy 62.628 42.063 68.676
Fossil fuels 62.204 39.468
Coal 1.990 12.204
Natural gas 41.972 15.724
Petroleum 18.242 11.541
Total Emissions(g/ton)
VOC 627.027 475.145 892.872
CO 5759.420 940.900 7804.364
NOx 1358.622 4240.351 3130.564
PM10 496.921 2702.166 209.439
PM2.5 127.778 930.593 0.011
SOx 18477.988 6102.322 21935.995
CH4 13044.833 5271.525 17085.825
N2O 16.624 38.835 24.251
CO2 1,272,575 3,256,624 1,551,316 CO2 (VOC, CO, CO2) 1,283,580 3,257,690 1,566,556 GHGs 1,614,654 3,401,051 1,980,853 Notes:
Comparison of PP Data
Energy data from Plastics Division of the ACC is in terms of HHV.Distillate fuel was modeled as diesel in GREET 2.7.
81

Reference Unit: 1 ton of Flexible Polyurethane FoamPrincipal Data Source(s): Plastics Division of the ACC and PlasticsEuropeGeographic Location: North America and EuropeTimeframe: 1990‐1993, 1996, 2003‐2005Description:
MATERIAL PRODUCTION DATA (Excluding Transport)
Energy ContentValue Unit ( MMBtu)
Resid. oil 22.627 gal 3.176
Diesel 0.214 gal 0.027
Natural gas 18339.139 cu ft 18.027
Coal 79.763 lb 0.780
Electricity 1353.596 kWh 4.618
Crude Oil 0.010 gal 0.001
Distillate Oil 3.881 gal 0.499
Gasoline 0.139 gal 0.016
LPG 0.085 gal 0.007
MISC: Process off‐gas from Oil 65.881 lb 1.879
MISC: Process off‐gas from NG 126.201 lb 3.623
MISC: Recovered Energy x ‐0.309TOTAL 32.655
Flexible Polyurethane Foam Production
Fuel InputsPhysical Units
Inventory of cradle to semi‐finished product for flexible polyurethane (PUR) foam. Data for precursors is North American. Data for foam production is calculated from European data.
Feedstock Inputs Value Unit
Crude Oil 78.328 gal 10.157
Natural Gas 17123.502 cu ft 16.832
TOTAL 26.989
Non‐combustion Emissions Value Unit
VOC 331.150 g
CO 4041.677 g
NOx 257.330 g
PM10 102.216 g
PM2.5 6.753 g
SOx 11026.149 g
CH4 7700.466 g
N2O 0.065 g
CO2 156840.320 g
Notes:Physical Units calculated using GREET heating value assumptions. Results were calculated from total primary energy data using assumptions in GREET 1.8c model.
Energy content calculated using GREET heating value assumptions. Recovered energy was not included in the totals as the credit could not be attributed to a specific fuel. Recovered energy comprises less than 1% of total fuel input. Also excluded was 0.138 mmBtu of biomass energy. The model was constructed as follows: 0.713(N.American Flexible Polyol dataset)+0.285(N.Am. TDI)+[European Full Rigid PUR Foam Production –0.713(Eur Polyol) –0.285(Eur TDI)]
82

TRANSPORT DATA
Energy ContentTransport Method (Fuel Used) Ton‐miles Value Unit ( MMBtu)
Combination truck (Diesel) gal
Single Unit (Diesel) gal
Rail (Diesel) gal
Barge (Diesel) gal
Barge (Resid. Oil) gal
Ocean Freighter (Diesel) gal
Ocean Freighter (Resid. Oil) gal
NG Pipeline (NG) cu ftPetro Pipeline (Electricity) kWh
Residual Oil 2.684 gal 0.377
Diesel 1.837 gal 0.236
Crude Oil 0.000 gal 0.000
Natural Gas 323.403 cu ft 0.318
Electricity 18.384 kWh 0.063
TOTAL 0.993
MATERIAL PRODUCTION DATA (Including Transport)
Energy ContentFuel Inputs Value Unit ( MMBtu)
Physical Units
Flexible Polyurethane Foam Production (cont'd)
Physical Units
Resid. oil 25.310 gal 0.106
Diesel 2.051 gal 0.008
Natural gas 18662.542 cu ft 0.545
Coal 79.763 lb 0.023
Electricity 1371.980 kWh 0.139
Crude Oil 0.010 gal 0.000
Distillate Oil 3.881 gal 0.015
Gasoline 0.139 gal 0.000
LPG 0.085 gal 0.000
MISC: Process off‐gas from Oil 65.881 lb 0.056
MISC: Process off‐gas from NG 126.201 lb 0.108
MISC: Recovered Energy x ‐0.009TOTAL 33.648
Notes:
Upstream energy included in the European portion of transportation data was removed by applying the delivered fuel energy to total energy ratio for each fuel. This ratio was unique to each data set.
83
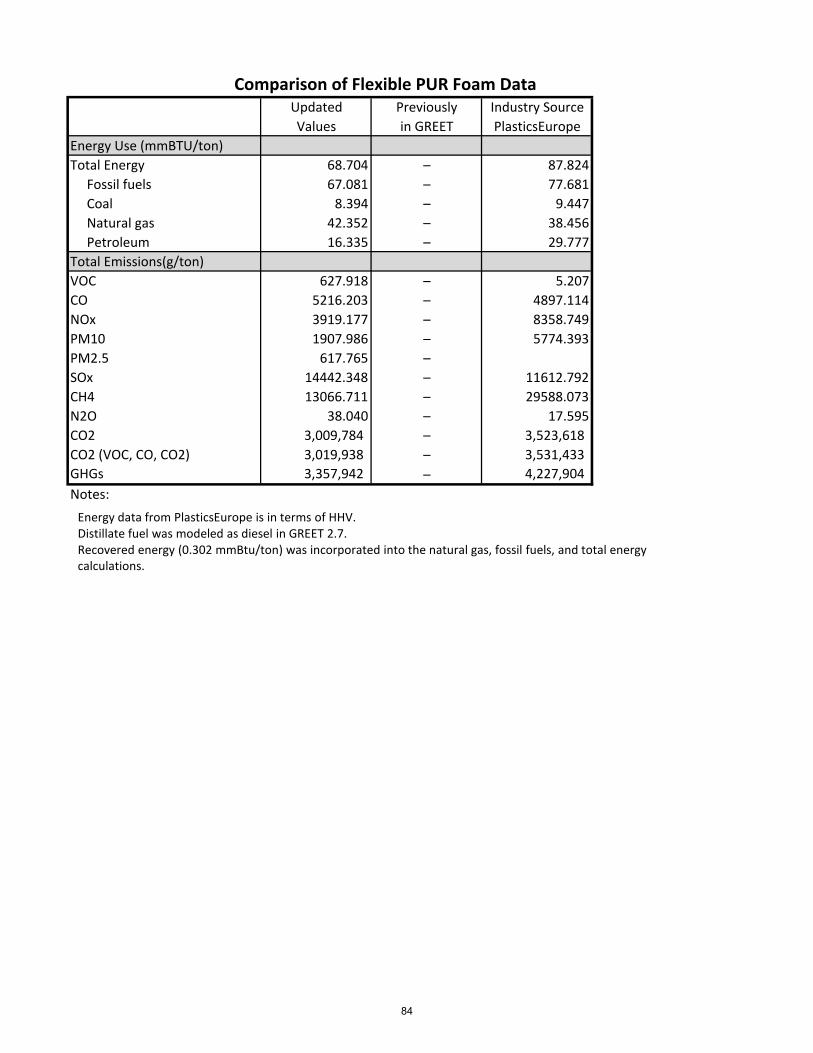
Updated Previously Industry SourceValues in GREET PlasticsEurope
Energy Use (mmBTU/ton)
Total Energy 68.704 – 87.824
Fossil fuels 67.081 – 77.681
Coal 8.394 – 9.447
Natural gas 42.352 – 38.456
Petroleum 16.335 – 29.777
Total Emissions(g/ton)
VOC 627.918 – 5.207
CO 5216.203 – 4897.114
NOx 3919.177 – 8358.749
PM10 1907.986 – 5774.393
PM2.5 617.765 –
SOx 14442.348 – 11612.792
CH4 13066.711 – 29588.073
N2O 38.040 – 17.595
CO2 3,009,784 – 3,523,618 CO2 (VOC, CO, CO2) 3,019,938 – 3,531,433 GHGs 3,357,942 – 4,227,904 Notes:
Comparison of Flexible PUR Foam Data
Energy data from PlasticsEurope is in terms of HHV.Distillate fuel was modeled as diesel in GREET 2.7.Recovered energy (0.302 mmBtu/ton) was incorporated into the natural gas, fossil fuels, and total energy calculations.Recovered energy (0.302 mmBtu/ton) was incorporated into the natural gas, fossil fuels, and total energy calculations.
84

Reference Unit: 1 ton of Rigid Polyurethane FoamPrincipal Data Source(s): Plastics Division of the ACC and PlasticsEuropeGeographic Location: North America and EuropeTimeframe: 1990‐1993, 1996, 2003‐2004, 2007Description:
MATERIAL PRODUCTION DATA (Excluding Transport)
Energy ContentValue Unit ( MMBtu)
Resid. oil 15.840 gal 2.223
Diesel 1.820 gal 0.234
Natural gas 14851.254 cu ft 14.599
Coal 112.400 lb 1.099
Electricity 1206.505 kWh 4.117
Crude Oil 10.582 gal 1.372
Distillate Oil 2.750 gal 0.353
Gasoline 3.164 gal 0.367
LPG 0.083 gal 0.007
MISC: Process off‐gas from Oil 49.200 lb 1.560
MISC: Process off‐gas from NG 92.400 lb 2.594
MISC: Recovered Energy x ‐0.957TOTAL 28.525
Rigid Polyurethane Foam Production
Fuel InputsPhysical Units
Inventory of cradle to semi‐finished product for rigid polyurethane (PUR) foam. Data for precursors is North American. Data for foam production is calculated from European data.
Feedstock Inputs Value Unit
Crude Oil 94.054 gal 12.196
Natural Gas 15726.101 cu ft 15.459
TOTAL 27.655
Non‐combustion Emissions Value Unit
VOC 294.866 g
CO 4566.516 g
NOx 492.382 g
PM10 91.332 g
PM2.5 9.072 g
SOx 9885.861 g
CH4 6446.790 g
N2O 0.000 g
CO2 201689.711 g
Notes:Physical Units calculated using GREET heating value assumptions. Results were calculated from total primary energy data using assumptions in GREET 1.8c model.
Energy content calculated using GREET heating value assumptions.Recovered energy was not included in the totals as the credit could not be attributed to a specific fuel. Recovered energy comprises less than 3.5% of the the total fuel input.The model was constructed as follows: 0.5(N.American Rigid Polyol dataset)+0.5(N.Am. MDI)+[European Full Rigid PUR Foam Production –0.386(Eur Polyol) – 0.616(Eur MDI)]
85

TRANSPORT DATA
Energy ContentTransport Method (Fuel Used) Ton‐miles Value Unit ( MMBtu)
Combination truck (Diesel) gal
Single Unit (Diesel) gal
Rail (Diesel) gal
Barge (Diesel) gal
Barge (Resid. Oil) gal
Ocean Freighter (Diesel) gal
Ocean Freighter (Resid. Oil) gal
NG Pipeline (NG) cu ftPetro Pipeline (Electricity) kWh
Residual Oil 1.767 gal 0.248
Diesel 2.059 gal 0.264
Crude Oil 0.049 gal 0.006
Natural Gas 287.129 cu ft 0.282
Electricity 22.776 kWh 0.078
TOTAL 0.879
MATERIAL PRODUCTION DATA (Including Transport)
Energy ContentFuel Inputs Value Unit ( MMBtu)
Physical Units
Rigid Polyurethane Foam Production (cont'd)
Physical Units
Resid. oil 17.607 gal 2.471
Diesel 49.200 gal 1.560
Natural gas 15138.383 cu ft 14.881
Coal 112.400 lb 1.099
Electricity 1229.281 kWh 4.194
Crude Oil 10.631 gal 1.379
Distillate Oil 2.750 gal 0.353
Gasoline 3.164 gal 0.367
LPG 0.083 gal 0.007
MISC: Process off‐gas from Oil 49.200 lb 1.560
MISC: Process off‐gas from NG 92.400 lb 2.594
MISC: Recovered Energy x ‐0.957TOTAL 29.403
Notes:
Upstream energy included in the European portion of transportation data was removed by applying the delivered fuel energy to total energy ratio for each fuel. This ratio was unique to each data set.
86

Updated Previously Industry SourceValues in GREET PlasticsEurope
Energy Use (mmBTU/ton)
Total Energy 64.253 – 87.260
Fossil fuels 62.804 – 78.748
Coal 7.899 – 9.553
Natural gas 36.054 – 37.473
Petroleum 18.851 – 31.720
Total Emissions(g/ton)
VOC 570.197 – 10.160
CO 5578.136 – 4491.955
NOx 3900.995 – 7437.353
PM10 1839.692 – 3878.925
PM2.5 611.325 –
SOx 13544.816 – 10229.836
CH4 11104.096 – 29397.384
N2O 35.504 – 9.530
CO2 2,681,401 – 3,073,533 CO2 (VOC, CO, CO2) 2,691,944 – 3,080,719 GHGs 2,980,126 – 3,778,080 Notes:
Comparison of Rigid PUR Foam Data
Energy data from PlasticsEurope is in terms of HHV.Distillate fuel was modeled as diesel in GREET 2.7.Recovered energy (2.288 mmBtu/ton) was incorporated into the natural gas, fossil fuels, and total energy calculations.Recovered energy (2.288 mmBtu/ton) was incorporated into the natural gas, fossil fuels, and total energy calculations.
87

Reference Unit: 1 ton of PVC ResinPrincipal Data Source(s): Plastics Division of the ACCGeographic Location: North America
Timeframe: 1989‐1992, 1997‐2000, 2003‐2004Description:
MATERIAL PRODUCTION DATA (Excluding Transport)
Energy ContentValue Unit ( MMBtu)
Resid. oil 0.820 gal 0.115
Diesel 0.009 gal 0.001
Natural gas 15248.000 cu ft 14.989
Coal 44.600 lb 0.436
Electricity 762.000 kWh 2.600
Crude Oil gal
Distillate Oil 1.500 gal 0.193
Gasoline 0.104 gal 0.012
LPG 0.026 gal 0.002
MISC: Process off‐gas from Oil 23.600 lb 0.726
MISC: Process off‐gas from NG 107.800 lb 3.304
MISC: Recovered Energy x ‐0.011TOTAL 22.378
Polyvinyl Chloride Production
Fuel InputsPhysical Units
Cradle to resin inventory for polyvinyl chloride (PVC) resin production.
Feedstock Inputs Value Unit
Crude Oil 24.682 gal 3.201
Natural Gas 16247.423 cu ft 15.971
TOTAL 19.172
Non‐combustion Emissions Value Unit
VOC 308.443 g
CO 1188.412 g
NOx 59.874 g
PM10 53.524 g
PM2.5 0.998 g
SOx 9797.595 g
CH4 5923.916 g
N2O 0.000 g
CO2 83098.122 g
Notes:Physical Units calculated using GREET Energy content calculated using GREET heating value assumptions. Recovered energy was not included in the totals as the credit could not be attributed to a specific fuel. Recovered energy comprises less than 1% of total fuel inputs.
88

TRANSPORT DATA
Energy ContentTransport Method (Fuel Used) Ton‐miles Value Unit ( MMBtu)
Combination truck (Diesel) 37.4 74.8 gal 0.051
Single Unit (Diesel) 0 0 gal 0.000
Rail (Diesel) 264 528 gal 0.085
Barge (Diesel) 15.62 31.24 gal 0.002
Barge (Resid. Oil) 0 gal 0.006
Ocean Freighter (Diesel) 292 584 gal 0.007
Ocean Freighter (Resid. Oil) 0 gal 0.070
NG Pipeline (NG) 440 880 cu ft 0.299
Petro Pipeline (Electricity) 246 492 kWh 0.018
Residual Oil gal
Diesel gal
Crude Oil gal
Natural Gas cu ftElectricity kWh
TOTAL 0.538
MATERIAL PRODUCTION DATA (Including Transport)
Energy ContentFuel Inputs Value Unit ( MMBtu)
Physical Units
Polyvinyl Chloride Production (cont'd)
Physical Units
Resid. oil 1.362 gal 0.191
Diesel 1.137 gal 0.146
Natural gas 15552.000 cu ft 15.288
Coal 44.600 lb 0.436
Electricity 767.360 kWh 2.618
Crude Oil gal
Distillate Oil 1.500 gal 0.193
Gasoline 0.104 gal 0.012
LPG 0.026 gal 0.002
MISC: Process off‐gas from Oil 23.600 lb 0.726
MISC: Process off‐gas from NG 107.800 lb 3.304
MISC: Recovered Energy x ‐0.011TOTAL 22.916
Notes:
89

Updated Previously Industry SourceValues in GREET Plastics Div, ACC
Energy Use (mmBTU/ton)
Total Energy 46.769 – 51.838
Fossil fuels 45.858 –
Coal 4.697 –
Natural gas 36.663 –
Petroleum 4.498 –
Total Emissions(g/ton)
VOC 477.579 – 738.549
CO 1729.824 – 3020.333
NOx 1883.981 – 3626.604
PM10 984.973 – 253.532
PM2.5 291.827 – 1.213
SOx 11382.554 – 12345.887
CH4 9717.414 – 13558.429
N2O 26.551 – 42.990
CO2 1,828,459 – 2,013,151 CO2 (VOC, CO, CO2) 1,832,665 – 2,020,286 GHGs 2,083,513 – 2,354,537 Notes:
Comparison of PVC Data
Energy data from Plastics Division of the ACC is in terms of HHV.Distillate fuel was modeled as diesel in GREET 2.7.
90

Reference Unit: 1 ton of flexible PUR foamPrincipal Data Source(s): PlasticsEurope
Geographic Location: Europe
Timeframe: 1996
Description:
MATERIAL PRODUCTION DATA (Excluding Transport)
Energy ContentValue Unit ( MMBtu)
Resid. oil gal
Diesel gal
Natural gas 22239.073 cu ft 21.861
Coal lb
Electricity 1792.413 kWh 6.116
Crude Oil 89.827 gal 11.648
Distillate Oil gal
Gasoline gal
LPG gal
MISC: Process off‐gas from Oil lb
MISC: Process off‐gas from NG lb
MISC: Recovered Energy x
TOTAL 39.625
Flexible PUR Foam Production
Fuel InputsPhysical Units
Cradle to precursor inventory for flexible PUR foam production.
Feedstock Inputs Value Unit
Crude Oil 110.743 gal 14.360
Natural Gas 12359.352 cu ft 12.149
TOTAL 26.509
Non‐combustion Emissions Value Unit
VOC 5.134 g
CO 1181.716 g
NOx 573.472 g
PM10 4274.781 g
PM2.5 g
SOx 331.669 g
CH4 1702.064 g
N2O 0.058 g
CO2 507331.807 g
Notes:Physical Units calculated using GREET Energy content calculated using GREET heating value assumptions.
91

TRANSPORT DATA
Energy ContentTransport Method (Fuel Used) Ton‐miles Value Unit ( MMBtu)
Combination truck (Diesel) gal
Single Unit (Diesel) gal
Rail (Diesel) gal
Barge (Diesel) gal
Barge (Resid. Oil) gal
Ocean Freighter (Diesel) gal
Ocean Freighter (Resid. Oil) gal
NG Pipeline (NG) cu ftPetro Pipeline (Electricity) kWh
Residual Oil gal
Diesel gal
Crude Oil 1.591 gal 0.206
Natural Gas 82.562 cu ft 0.081
Electricity 103.919 kWh 0.355
TOTAL 0.642
MATERIAL PRODUCTION DATA (Including Transport)
Energy ContentFuel Inputs Value Unit ( MMBtu)
Physical Units
Flexible PUR Foam Production (cont'd)
Physical Units
Resid. oil gal
Diesel gal
Natural gas 22321.635 cu ft 21.942
Coal lb
Electricity 1896.332 kWh 6.471
Crude Oil 91.418 gal 11.854
Distillate Oil gal
Gasoline gal
LPG gal
MISC: Process off‐gas from Oil lb
MISC: Process off‐gas from NG lb
MISC: Recovered Energy x
TOTAL 40.267
Notes:
92

Reference Unit: 1 ton of MDI
Principal Data Source(s): PlasticsEurope
Geographic Location: Europe
Timeframe: 1995
Description:
MATERIAL PRODUCTION DATA (Excluding Transport)
Energy ContentValue Unit ( MMBtu)
Resid. oil gal
Diesel gal
Natural gas 22357.957 cu ft 21.978
Coal lb
Electricity 1157.485 kWh 3.949
Crude Oil 66.53 gal 8.627
Distillate Oil gal
Gasoline gal
LPG gal
MISC: Process off‐gas from Oil lb
MISC: Process off‐gas from NG lb
MISC: Recovered Energy x
TOTAL 34.554
MDI Production (European)
Fuel InputsPhysical Units
Cradle to precursor inventory for MDI production (in Europe).
Feedstock Inputs Value Unit
Crude Oil 100.474 gal 13.028
Natural Gas 14031.319 cu ft 13.793
TOTAL 26.821
Non‐combustion Emissions Value Unit
VOC 13.027 g
CO 778.908 g
NOx 662.888 g
PM10 170.552 g
PM2.5 g
SOx 272.576 g
CH4 2299.202 g
N2O 0.007 g
CO2 360462.196 g
Notes:Physical Units calculated using GREET Energy content calculated using GREET heating value assumptions.
93

TRANSPORT DATA
Energy ContentTransport Method (Fuel Used) Ton‐miles Value Unit ( MMBtu)
Combination truck (Diesel) gal
Single Unit (Diesel) gal
Rail (Diesel) gal
Barge (Diesel) gal
Barge (Resid. Oil) gal
Ocean Freighter (Diesel) gal
Ocean Freighter (Resid. Oil) gal
NG Pipeline (NG) cu ftPetro Pipeline (Electricity) kWh
Residual Oil gal
Diesel gal
Crude Oil 1.264 gal 0.164
Natural Gas 96.206 cu ft 0.095
Electricity 92.495 kWh 0.316
TOTAL 0.574
MATERIAL PRODUCTION DATA (Including Transport)
Energy ContentFuel Inputs Value Unit ( MMBtu)
Physical Units
MDI Production (European) (cont'd)
Physical Units
Resid. oil gal
Diesel gal
Natural gas 22454.164 cu ft 22.072
Coal lb
Electricity 1249.979 kWh 4.265
Crude Oil 67.795 gal 8.791
Distillate Oil gal
Gasoline gal
LPG gal
MISC: Process off‐gas from Oil lb
MISC: Process off‐gas from NG lb
MISC: Recovered Energy x
TOTAL 35.128
Notes:
94

Reference Unit: 1 ton of MDI
Principal Data Source(s): Plastics Division of the ACCGeographic Location: North America
Timeframe: 2003‐2004, 2007Description:
MATERIAL PRODUCTION DATA (Excluding Transport)
Energy ContentValue Unit ( MMBtu)
Resid. oil 5.68 gal 0.797
Diesel 0.00052 gal 0.000
Natural gas 12522 cu ft 12.309
Coal 30.8 lb 0.301
Electricity 586 kWh 1.999
Crude Oil gal
Distillate Oil 1.48 gal 0.190
Gasoline 0.128 gal 0.015
LPG 0.096 gal 0.008
MISC: Process off‐gas from Oil 20.6 lb 0.906
MISC: Process off‐gas from NG 46.4 lb 1.252
MISC: Recovered Energy x ‐1.912TOTAL 17.778
MDI Production
Fuel InputsPhysical Units
Cradle to precursor inventory of MDI production.
Feedstock Inputs Value Unit
Crude Oil 96.239 gal 12.479
Natural Gas 15298.969 cu ft 15.039
TOTAL 27.518
Non‐combustion Emissions Value Unit
VOC 272.155 g
CO 5942.06 g
NOx 498.952 g
PM10 52.617 g
PM2.5 9.072 g
SOx 9344.003 g
CH4 6078.138 g
N2O 0 g
CO2 332,937 g
Notes:Physical Units calculated using GREET Energy content calculated using GREET heating value assumptions. Recovered energy was not included in the totals as the credit could not be attributed to a specific fuel.
95
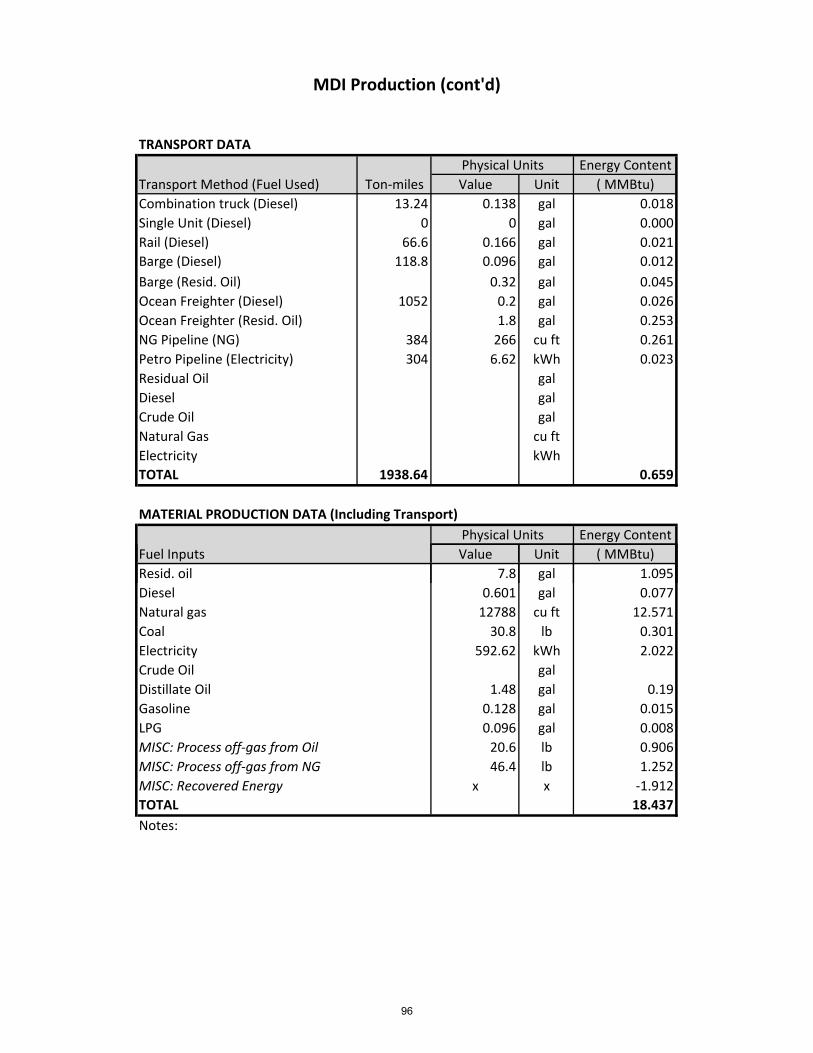
TRANSPORT DATA
Energy ContentTransport Method (Fuel Used) Ton‐miles Value Unit ( MMBtu)
Combination truck (Diesel) 13.24 0.138 gal 0.018
Single Unit (Diesel) 0 0 gal 0.000
Rail (Diesel) 66.6 0.166 gal 0.021
Barge (Diesel) 118.8 0.096 gal 0.012
Barge (Resid. Oil) 0.32 gal 0.045
Ocean Freighter (Diesel) 1052 0.2 gal 0.026
Ocean Freighter (Resid. Oil) 1.8 gal 0.253
NG Pipeline (NG) 384 266 cu ft 0.261
Petro Pipeline (Electricity) 304 6.62 kWh 0.023
Residual Oil gal
Diesel gal
Crude Oil gal
Natural Gas cu ftElectricity kWh
TOTAL 1938.64 0.659
MATERIAL PRODUCTION DATA (Including Transport)
Energy ContentFuel Inputs Value Unit ( MMBtu)
Physical Units
MDI Production (cont'd)
Physical Units
Resid. oil 7.8 gal 1.095
Diesel 0.601 gal 0.077
Natural gas 12788 cu ft 12.571
Coal 30.8 lb 0.301
Electricity 592.62 kWh 2.022
Crude Oil gal
Distillate Oil 1.48 gal 0.19
Gasoline 0.128 gal 0.015
LPG 0.096 gal 0.008
MISC: Process off‐gas from Oil 20.6 lb 0.906
MISC: Process off‐gas from NG 46.4 lb 1.252
MISC: Recovered Energy x x ‐1.912TOTAL 18.437
Notes:
96
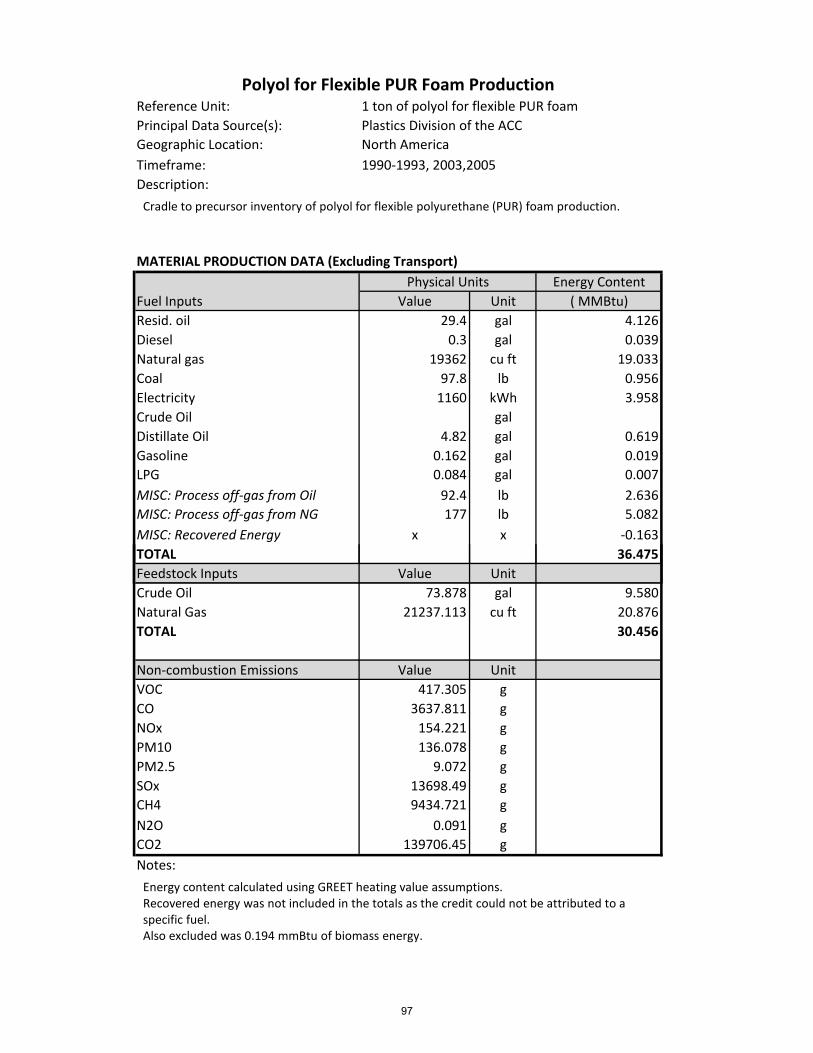
Reference Unit: 1 ton of polyol for flexible PUR foamPrincipal Data Source(s): Plastics Division of the ACCGeographic Location: North America
Timeframe: 1990‐1993, 2003,2005Description:
MATERIAL PRODUCTION DATA (Excluding Transport)
Energy ContentValue Unit ( MMBtu)
Resid. oil 29.4 gal 4.126
Diesel 0.3 gal 0.039
Natural gas 19362 cu ft 19.033
Coal 97.8 lb 0.956
Electricity 1160 kWh 3.958
Crude Oil gal
Distillate Oil 4.82 gal 0.619
Gasoline 0.162 gal 0.019
LPG 0.084 gal 0.007
MISC: Process off‐gas from Oil 92.4 lb 2.636
MISC: Process off‐gas from NG 177 lb 5.082
MISC: Recovered Energy x x ‐0.163TOTAL 36.475
Polyol for Flexible PUR Foam Production
Fuel InputsPhysical Units
Cradle to precursor inventory of polyol for flexible polyurethane (PUR) foam production.
Feedstock Inputs Value Unit
Crude Oil 73.878 gal 9.580
Natural Gas 21237.113 cu ft 20.876
TOTAL 30.456
Non‐combustion Emissions Value Unit
VOC 417.305 g
CO 3637.811 g
NOx 154.221 g
PM10 136.078 g
PM2.5 9.072 g
SOx 13698.49 g
CH4 9434.721 g
N2O 0.091 g
CO2 139706.45 g
Notes:Physical Units calculated using GREET Energy content calculated using GREET heating value assumptions. Recovered energy was not included in the totals as the credit could not be attributed to a specific fuel. Also excluded was 0.194 mmBtu of biomass energy.
97

TRANSPORT DATA
Energy ContentTransport Method (Fuel Used) Ton‐miles Value Unit ( MMBtu)
Combination truck (Diesel) 170 1.78 gal 0.229
Single Unit (Diesel) 1.58 0.036 gal 0.005
Rail (Diesel) 81.6 0.2 gal 0.026
Barge (Diesel) 48.8 0.04 gal 0.005
Barge (Resid. Oil) 0.13 gal 0.018
Ocean Freighter (Diesel) 1114 0.22 gal 0.028
Ocean Freighter (Resid. Oil) 1.9 gal 0.267
NG Pipeline (NG) 590 408 cu ft 0.401
Petro Pipeline (Electricity) 622 13.56 kWh 0.046
Residual Oil gal
Diesel gal
Crude Oil gal
Natural Gas cu ftElectricity kWh
TOTAL 2627.98 1.025
MATERIAL PRODUCTION DATA (Including Transport)
Energy ContentFuel Inputs Value Unit ( MMBtu)
Physical Units
Polyol for Flexible PUR Foam Production (cont'd)
Physical Units
Resid. oil 29.685 gal 4.411
Diesel 0.592 gal 0.331
Natural gas 19770 cu ft 19.434
Coal 97.8 lb 0.956
Electricity 1173.56 kWh 4.004
Crude Oil gal
Distillate Oil 4.82 gal 0.619
Gasoline 0.162 gal 0.019
LPG 0.084 gal 0.007
MISC: Process off‐gas from Oil 92.4 lb 2.636
MISC: Process off‐gas from NG 177 lb 5.082
MISC: Recovered Energy x x ‐0.163TOTAL 37.499
Notes:
98
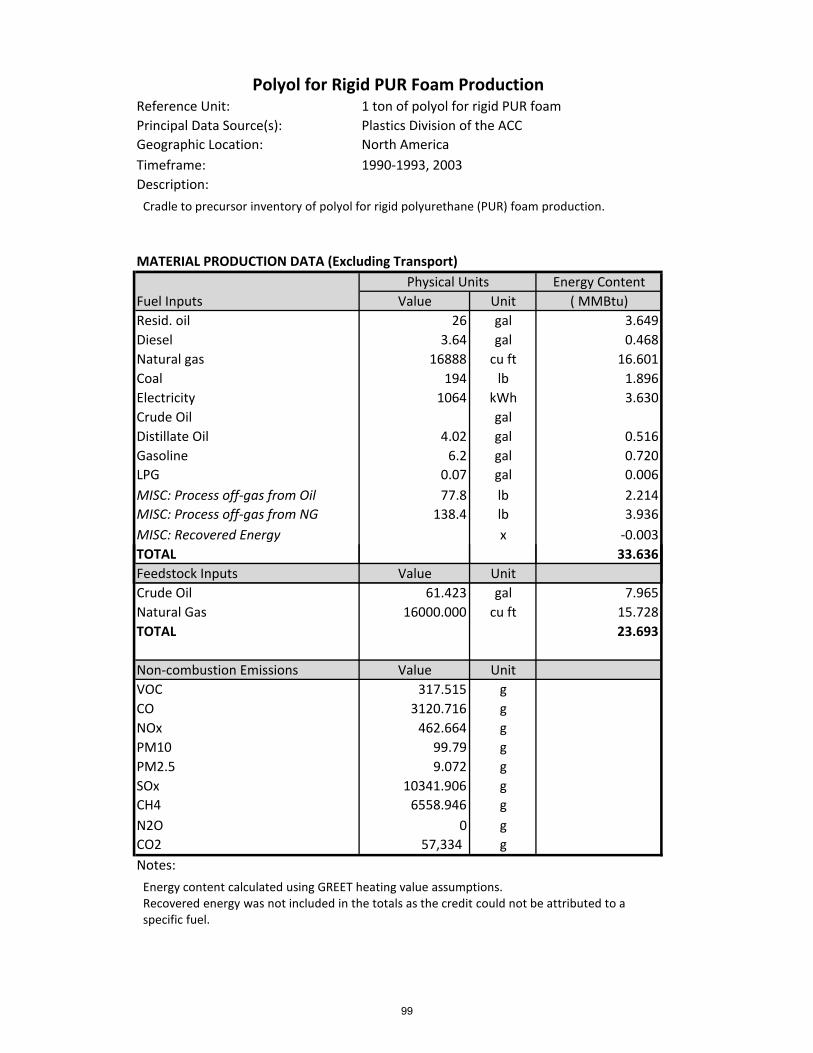
Reference Unit: 1 ton of polyol for rigid PUR foamPrincipal Data Source(s): Plastics Division of the ACCGeographic Location: North America
Timeframe: 1990‐1993, 2003Description:
MATERIAL PRODUCTION DATA (Excluding Transport)
Energy ContentValue Unit ( MMBtu)
Resid. oil 26 gal 3.649
Diesel 3.64 gal 0.468
Natural gas 16888 cu ft 16.601
Coal 194 lb 1.896
Electricity 1064 kWh 3.630
Crude Oil gal
Distillate Oil 4.02 gal 0.516
Gasoline 6.2 gal 0.720
LPG 0.07 gal 0.006
MISC: Process off‐gas from Oil 77.8 lb 2.214
MISC: Process off‐gas from NG 138.4 lb 3.936
MISC: Recovered Energy x ‐0.003TOTAL 33.636
Polyol for Rigid PUR Foam Production
Fuel InputsPhysical Units
Cradle to precursor inventory of polyol for rigid polyurethane (PUR) foam production.
Feedstock Inputs Value Unit
Crude Oil 61.423 gal 7.965
Natural Gas 16000.000 cu ft 15.728
TOTAL 23.693
Non‐combustion Emissions Value Unit
VOC 317.515 g
CO 3120.716 g
NOx 462.664 g
PM10 99.79 g
PM2.5 9.072 g
SOx 10341.906 g
CH4 6558.946 g
N2O 0 g
CO2 57,334 g
Notes:Physical Units calculated using GREET Energy content calculated using GREET heating value assumptions. Recovered energy was not included in the totals as the credit could not be attributed to a specific fuel.
99

TRANSPORT DATA
Energy ContentTransport Method (Fuel Used) Ton‐miles Value Unit ( MMBtu)
Combination truck (Diesel) 300 3.16 gal 0.406
Single Unit (Diesel) 0 0 gal 0.000
Rail (Diesel) 73 0.18 gal 0.023
Barge (Diesel) 42.6 0.034 gal 0.004
Barge (Resid. Oil) 0.114 gal 0.016
Ocean Freighter (Diesel) 756 0.144 gal 0.018
Ocean Freighter (Resid. Oil) 1.3 gal 0.182
NG Pipeline (NG) 448 308 cu ft 0.303
Petro Pipeline (Electricity) 534 11.64 kWh 0.040
Residual Oil gal
Diesel gal
Crude Oil gal
Natural Gas cu ftElectricity kWh
TOTAL 2153.6 0.993
MATERIAL PRODUCTION DATA (Including Transport)
Energy ContentFuel Inputs Value Unit ( MMBtu)
Physical Units
Polyol for Rigid PUR Foam Production (cont'd)
Physical Units
Resid. oil 27.414 gal 3.848
Diesel 7.158 gal 0.919
Natural gas 17196 cu ft 16.904
Coal 194 lb 1.896
Electricity 1075.64 kWh 3.670
Crude Oil gal
Distillate Oil 4.02 gal 0.516
Gasoline 6.2 gal 0.720
LPG 0.07 gal 0.006
MISC: Process off‐gas from Oil 77.8 lb 2.214
MISC: Process off‐gas from NG 138.4 lb 3.936
MISC: Recovered Energy x x ‐0.003TOTAL 34.629
Notes:
100

Reference Unit: 1 ton of polyolPrincipal Data Source(s): PlasticsEurope
Geographic Location: Europe
Timeframe: 2008
Description:
MATERIAL PRODUCTION DATA (Excluding Transport)
Energy ContentValue Unit ( MMBtu)
Resid. oil gal
Diesel gal
Natural gas 17618.776 cu ft 17.319
Coal lb
Electricity 1408.002 kWh 4.804
Crude Oil 93.373 gal 12.108
Distillate Oil gal
Gasoline gal
LPG gal
MISC: Process off‐gas from Oil lb
MISC: Process off‐gas from NG lb
MISC: Recovered Energy x
TOTAL 34.231
Polyol Production (European)
Fuel InputsPhysical Units
Cradle to precursor inventory for polyol production (in Europe).
Feedstock Inputs Value Unit
Crude Oil 118.598 gal 15.379
Natural Gas 12784.881 cu ft 12.568
TOTAL 27.946
Non‐combustion Emissions Value Unit
VOC 5.278 g
CO 397.006 g
NOx 324.585 g
PM10 5566.470 g
PM2.5 g
SOx 375.152 g
CH4 1885.412 g
N2O 0.082 g
CO2 331245.541 g
Notes:Physical Units calculated using GREET Energy content calculated using GREET heating value assumptions.
101

TRANSPORT DATA
Energy ContentTransport Method (Fuel Used) Ton‐miles Value Unit ( MMBtu)
Combination truck (Diesel) gal
Single Unit (Diesel) gal
Rail (Diesel) gal
Barge (Diesel) gal
Barge (Resid. Oil) gal
Ocean Freighter (Diesel) gal
Ocean Freighter (Resid. Oil) gal
NG Pipeline (NG) cu ftPetro Pipeline (Electricity) kWh
Residual Oil gal
Diesel gal
Crude Oil 1.647 gal 0.214
Natural Gas 54.908 cu ft 0.054
Electricity 106.311 kWh 0.363
TOTAL 0.630
MATERIAL PRODUCTION DATA (Including Transport)
Energy ContentFuel Inputs Value Unit ( MMBtu)
Physical Units
Polyol Production (European) (cont'd)
Physical Units
Resid. oil gal
Diesel gal
Natural gas 17673.684 cu ft 17.373
Coal lb
Electricity 1514.313 kWh 5.167
Crude Oil 95.02 gal 12.321
Distillate Oil gal
Gasoline gal
LPG gal
MISC: Process off‐gas from Oil lb
MISC: Process off‐gas from NG lb
MISC: Recovered Energy x
TOTAL 34.862
Notes:
102

Reference Unit: 1 ton of rigid PUR foamPrincipal Data Source(s): PlasticsEurope
Geographic Location: Europe
Timeframe: 1996
Description:
MATERIAL PRODUCTION DATA (Excluding Transport)
Energy ContentValue Unit ( MMBtu)
Resid. oil gal
Diesel gal
Natural gas 20719.603 cu ft 20.367
Coal lb
Electricity 1638.004 kWh 5.589
Crude Oil 87.607 gal 11.36
Distillate Oil gal
Gasoline gal
LPG gal
MISC: Process off‐gas from Oil lb
MISC: Process off‐gas from NG lb
MISC: Recovered Energy x
TOTAL 37.316
Rigid PUR Foam Production
Fuel InputsPhysical Units
Cradle to precursor inventory for rigid PUR foam production.
Feedstock Inputs Value Unit
Crude Oil 122.893 gal 15.936
Natural Gas 13654.873 cu ft 13.423
TOTAL 29.35832894
Non‐combustion Emissions Value Unit
VOC 10.093 g
CO 668.180 g
NOx 545.203 g
PM10 2268.846 g
PM2.5 g
SOx 355.623 g
CH4 2272.326 g
N2O 0.036 g
CO2 356459.765 g
Notes:Physical Units calculated using GREET Energy content calculated using GREET heating value assumptions.
103
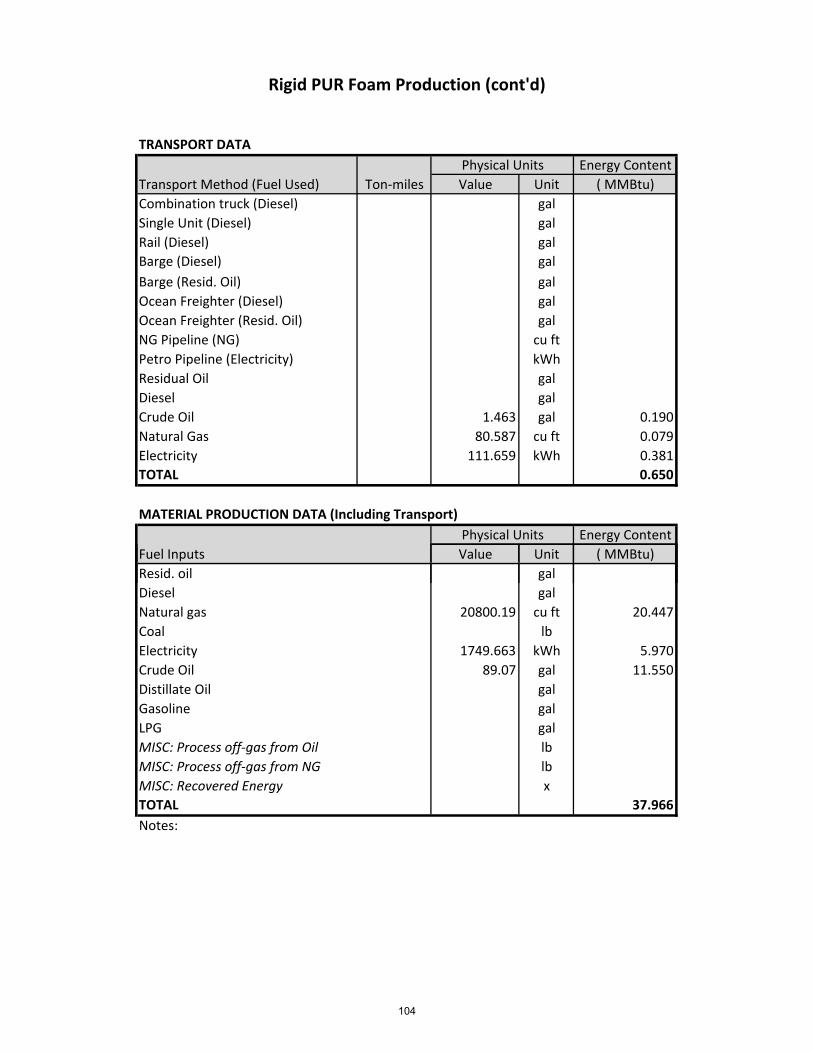
TRANSPORT DATA
Energy ContentTransport Method (Fuel Used) Ton‐miles Value Unit ( MMBtu)
Combination truck (Diesel) gal
Single Unit (Diesel) gal
Rail (Diesel) gal
Barge (Diesel) gal
Barge (Resid. Oil) gal
Ocean Freighter (Diesel) gal
Ocean Freighter (Resid. Oil) gal
NG Pipeline (NG) cu ftPetro Pipeline (Electricity) kWh
Residual Oil gal
Diesel gal
Crude Oil 1.463 gal 0.190
Natural Gas 80.587 cu ft 0.079
Electricity 111.659 kWh 0.381
TOTAL 0.650
MATERIAL PRODUCTION DATA (Including Transport)
Energy ContentFuel Inputs Value Unit ( MMBtu)
Physical Units
Rigid PUR Foam Production (cont'd)
Physical Units
Resid. oil gal
Diesel gal
Natural gas 20800.19 cu ft 20.447
Coal lb
Electricity 1749.663 kWh 5.970
Crude Oil 89.07 gal 11.550
Distillate Oil gal
Gasoline gal
LPG gal
MISC: Process off‐gas from Oil lb
MISC: Process off‐gas from NG lb
MISC: Recovered Energy x
TOTAL 37.966
Notes:
104

Reference Unit: 1 ton of TDIPrincipal Data Source(s): PlasticsEurope
Geographic Location: Europe
Timeframe: 1995
Description:
MATERIAL PRODUCTION DATA (Excluding Transport)
Energy ContentValue Unit ( MMBtu)
Resid. oil gal
Diesel gal
Natural gas 33969.096 cu ft 33.392
Coal lb
Electricity 1443.269 kWh 4.925
Crude Oil 81.552 gal 10.575
Distillate Oil gal
Gasoline gal
LPG gal
MISC: Process off‐gas from Oil lb
MISC: Process off‐gas from NG lb
MISC: Recovered Energy x
TOTAL 48.891
TDI Production (European)
Fuel InputsPhysical Units
Cradle to precursor inventory for TDI production (in Europe).
Feedstock Inputs Value Unit
Crude Oil 91.870 gal 11.913
Natural Gas 11356.930 cu ft 11.164
TOTAL 23.077
Non‐combustion Emissions Value Unit
VOC 4.808 g
CO 3152.981 g
NOx 1200.157 g
PM10 1073.216 g
PM2.5 g
SOx 225.218 g
CH4 1250.505 g
N2O 0.000 g
CO2 789075.565 g
Notes:Physical Units calculated using GREET Energy content calculated using GREET heating value assumptions.
105

TRANSPORT DATA
Energy ContentTransport Method (Fuel Used) Ton‐miles Value Unit ( MMBtu)
Combination truck (Diesel) gal
Single Unit (Diesel) gal
Rail (Diesel) gal
Barge (Diesel) gal
Barge (Resid. Oil) gal
Ocean Freighter (Diesel) gal
Ocean Freighter (Resid. Oil) gal
NG Pipeline (NG) cu ftPetro Pipeline (Electricity) kWh
Residual Oil gal
Diesel gal
Crude Oil 1.462 gal 0.190
Natural Gas 152.294 cu ft 0.150
Electricity 74.483 kWh 0.254
TOTAL 0.593
MATERIAL PRODUCTION DATA (Including Transport)
Energy ContentFuel Inputs Value Unit ( MMBtu)
Physical Units
TDI Production (European) (cont'd)
Physical Units
Resid. oil gal
Diesel gal
Natural gas 34121.39 cu ft 33.541
Coal lb
Electricity 1517.752 kWh 5.179
Crude Oil 83.014 gal 10.764
Distillate Oil gal
Gasoline gal
LPG gal
MISC: Process off‐gas from Oil lb
MISC: Process off‐gas from NG lb
MISC: Recovered Energy x
TOTAL 49.484
Notes:
106

Reference Unit: 1 ton of TDIPrincipal Data Source(s): Plastics Division of the ACCGeographic Location: North America
Timeframe: Early 1990's, 2003Description:
MATERIAL PRODUCTION DATA (Excluding Transport)
Energy ContentValue Unit ( MMBtu)
Resid. oil 5.84 gal 0.820
Diesel 0 gal 0.000
Natural gas 15924 cu ft 15.653
Coal 35.2 lb 0.344
Electricity 524 kWh 1.788
Crude Oil gal
Distillate Oil 1.56 gal 0.200
Gasoline 0.082 gal 0.010
LPG 0.088 gal 0.007
MISC: Process off‐gas from Oil lb
MISC: Process off‐gas from NG lb
MISC: Recovered Energy x ‐0.676TOTAL 18.822
TDI Production
Fuel InputsPhysical Units
Cradle to precursor inventory of TDI production.
Feedstock Inputs Value Unit
Crude Oil 90.012 gal 11.672
Natural Gas 6927.835 cu ft 6.810
TOTAL 18.482
Non‐combustion Emissions Value Unit
VOC 117.934 g
CO 5080.235 g
NOx 517.095 g
PM10 18.144 g
PM2.5 0.998 g
SOx 4417.99 g
CH4 3411.015 g
N2O 0.000 g
CO2 38,465 g
Notes:Physical Units calculated using GREET Energy content calculated using GREET heating value assumptions. Recovered energy was not included in the totals as the credit could not be attributed to a specific fuel.
107

TRANSPORT DATA
Energy ContentTransport Method (Fuel Used) Ton‐miles Value Unit ( MMBtu)
Combination truck (Diesel) 12.66 0.132 gal 0.017
Single Unit (Diesel) 0 0 gal 0.000
Rail (Diesel) 47.2 0.118 gal 0.015
Barge (Diesel) 51.8 0.042 gal 0.005
Barge (Resid. Oil) 0.138 gal 0.019
Ocean Freighter (Diesel) 2452 0.46 gal 0.059
Ocean Freighter (Resid. Oil) 4.2 gal 0.589
NG Pipeline (NG) 165.4 114 cu ft 0.112
Petro Pipeline (Electricity) 294 6.4 kWh 0.022
Residual Oil gal
Diesel gal
Crude Oil gal
Natural Gas cu ftElectricity kWh
TOTAL 3023.06 0.839
MATERIAL PRODUCTION DATA (Including Transport)
Energy ContentFuel Inputs Value Unit ( MMBtu)
Physical Units
TDI Production (cont'd)
Physical Units
Resid. oil 10.178 gal 1.429
Diesel 0.752 gal 0.097
Natural gas 16038 cu ft 15.765
Coal 35.2 lb 0.344
Electricity 530.4 kWh 1.810
Crude Oil gal
Distillate Oil 1.56 gal 0.200
Gasoline 0.082 gal 0.010
LPG 0.088 gal 0.007
MISC: Process off‐gas from Oil lb
MISC: Process off‐gas from NG lb
MISC: Recovered Energy x x ‐0.676TOTAL 19.662
Notes:
108

Reference Unit: 1 ton of Blow Molded HDPE ProductPrincipal Data Source(s): 2005 report from PlasticsEurope by Ian BousteadGeographic Location: Europe
Timeframe:
Description:
MATERIAL PRODUCTION DATA (Excluding Transport)
Energy ContentValue Unit ( MMBtu)
Resid. oil gal
Diesel 0.013 gal 0.002
Natural gas cu ftCoal lb
Electricity 1550.895 kWh 5.292
Crude Oil gal
Distillate Oil 0.007 gal 0.001
Gasoline gal
LPG 0.230 gal 0.019
MISC: Process off‐gas from Oil lb
MISC: Process off‐gas from NG lb
MISC: Recovered Energy x
TOTAL 5.314
Blow Molding HDPE
Fuel InputsPhysical Units
Blow molding HDPE (as bottles).
Feedstock Inputs Value Unit
Crude Oil gal
Natural Gas cu ftTOTAL
Non‐combustion Emissions Value Unit
VOC g
CO g
NOx g
PM10 g
PM2.5 g
SOx g
CH4 g
N2O g
CO2 g
Notes:Physical Units calculated using GREET Energy content calculated using GREET heating value assumptions.
109

Updated Previously
Values in GREETEnergy Use (mmBTU/ton)
Total Energy 13.596 –
Fossil fuels 11.760 – Coal 8.575 – Natural gas 2.834 – Petroleum 0.351 – Total Emissions(g/ton)
VOC 100.454 –
CO 291.882 – NOx 1193.038 – PM10 1520.841 – PM2.5 399.732 –
SOx 2618.289 – CH4 1521.840 – N2O 14.887 – CO2 1,129,300 –
CO2 (VOC, CO, CO2) 1,130,071 – GHGs 1,172,554 –
Notes:
Comparison of Blow Molded HDPE Data
110
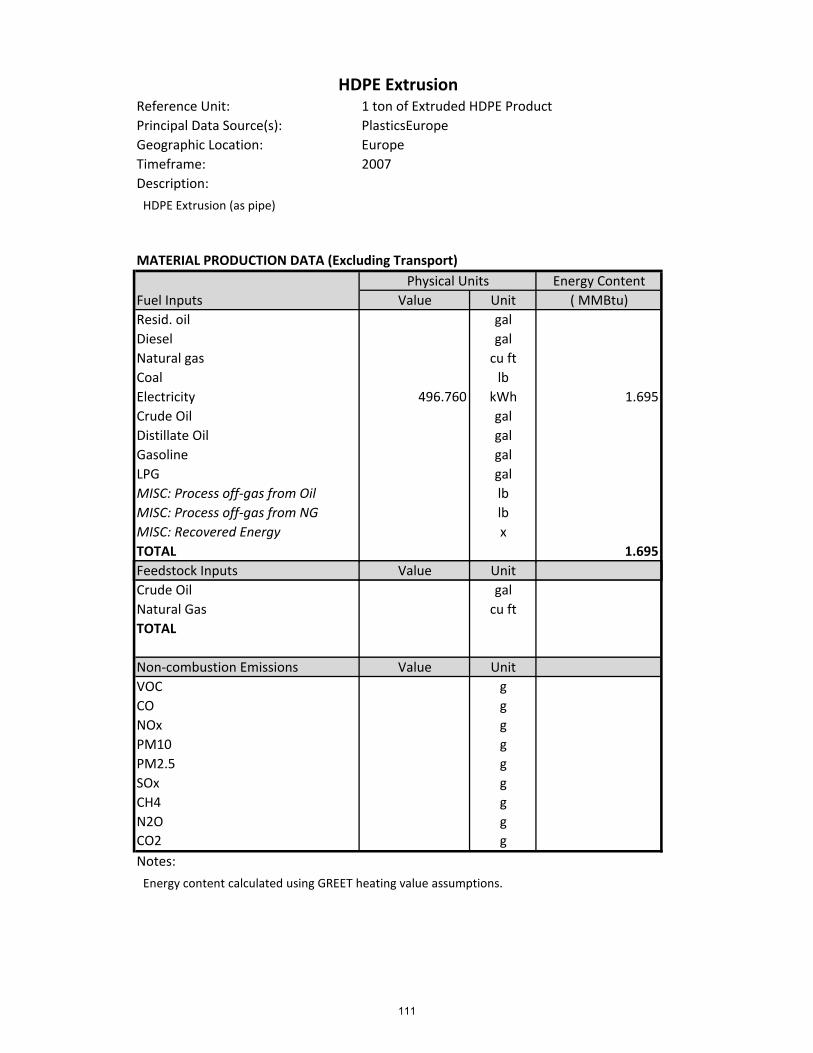
Reference Unit: 1 ton of Extruded HDPE ProductPrincipal Data Source(s): PlasticsEurope
Geographic Location: Europe
Timeframe: 2007
Description:
MATERIAL PRODUCTION DATA (Excluding Transport)
Energy ContentValue Unit ( MMBtu)
Resid. oil gal
Diesel gal
Natural gas cu ftCoal lb
Electricity 496.760 kWh 1.695
Crude Oil gal
Distillate Oil gal
Gasoline gal
LPG gal
MISC: Process off‐gas from Oil lb
MISC: Process off‐gas from NG lb
MISC: Recovered Energy x
TOTAL 1.695
HDPE Extrusion
Fuel InputsPhysical Units
HDPE Extrusion (as pipe)
Feedstock Inputs Value Unit
Crude Oil gal
Natural Gas cu ftTOTAL
Non‐combustion Emissions Value Unit
VOC g
CO g
NOx g
PM10 g
PM2.5 g
SOx g
CH4 g
N2O g
CO2 g
Notes:Physical Units calculated using GREET Energy content calculated using GREET heating value assumptions.
111

Updated Previously
Values in GREETEnergy Use (mmBTU/ton)
Total Energy 4.347 –
Fossil fuels 3.759 –
Coal 2.747 –
Natural gas 0.907 –
Petroleum 0.105 –
Total Emissions(g/ton)
VOC 32.055 –
CO 92.474 –
NOx 380.607 –
PM10 486.988 –
PM2.5 127.943 –
SOx 837.100 –
CH4 486.745 –
N2O 4.760 –
CO2 360,903 –
CO2 (VOC, CO, CO2) 361,148 –
GHGs 374,735 –
Notes:
Comparison of Extruded HDPE Data
112

Reference Unit: 1 ton of Injection Molded HDPE ProductPrincipal Data Source(s): PlasticsEurope
Geographic Location: Europe
Timeframe: 2007
Description:
MATERIAL PRODUCTION DATA (Excluding Transport)
Energy ContentValue Unit ( MMBtu)
Resid. oil gal
Diesel gal
Natural gas cu ftCoal lb
Electricity 1812.734 kWh 6.185
Crude Oil gal
Distillate Oil gal
Gasoline gal
LPG gal
MISC: Process off‐gas from Oil lb
MISC: Process off‐gas from NG lb
MISC: Recovered Energy x
TOTAL 6.185
HDPE Injection Molding
Fuel InputsPhysical Units
Injection molding HDPE resin.
Feedstock Inputs Value Unit
Crude Oil gal
Natural Gas cu ftTOTAL
Non‐combustion Emissions Value Unit
VOC g
CO g
NOx g
PM10 g
PM2.5 g
SOx g
CH4 g
N2O g
CO2 g
Notes:Physical Units calculated using GREET Energy content calculated using GREET heating value assumptions.
113

Updated Previously
Values in GREETEnergy Use (mmBTU/ton)
Total Energy 15.862 –
Fossil fuels 13.715 – Coal 10.022 – Natural gas 3.310 – Petroleum 0.383 – Total Emissions(g/ton)
VOC 116.969 –
CO 337.434 – NOx 1388.821 – PM10 1777.002 – PM2.5 466.858 –
SOx 3054.551 – CH4 1776.118 – N2O 17.368 – CO2 1,316,922 –
CO2 (VOC, CO, CO2) 1,317,817 – GHGs 1,367,395 –
Notes:
Comparison of Injection Molded HDPE Data
114

Reference Unit: 1 ton of Extruded PP ProductPrincipal Data Source(s): PlasticsEurope
Geographic Location: Europe
Timeframe: 2007
Description:
MATERIAL PRODUCTION DATA (Excluding Transport)
Energy ContentValue Unit ( MMBtu)
Resid. oil gal
Diesel gal
Natural gas cu ftCoal lb
Electricity 635.282 kWh 2.168
Crude Oil gal
Distillate Oil gal
Gasoline gal
LPG gal
MISC: Process off‐gas from Oil lb
MISC: Process off‐gas from NG lb
MISC: Recovered Energy x
TOTAL 2.168
Extrusion of PP
Fuel InputsPhysical Units
Extrusion of PP (as pipe).
Feedstock Inputs Value Unit
Crude Oil gal
Natural Gas cu ftTOTAL
Non‐combustion Emissions Value Unit
VOC g
CO g
NOx g
PM10 g
PM2.5 g
SOx g
CH4 g
N2O g
CO2 g
Notes:Physical Units calculated using GREET Energy content calculated using GREET heating value assumptions.
115

Updated Previously
Values in GREETEnergy Use (mmBTU/ton)
Total Energy 5.560 − Fossil fuels 4.808 − Coal 3.513 − Natural gas 1.160 − Petroleum 0.134 −Total Emissions(g/ton)
VOC 41.001 −CO 118.279 −NOx 486.817 −PM10 622.885 −PM2.5 163.646 −SOx 1070.698 −CH4 622.574 −N2O 6.088 −CO2 461,615 −CO2 (VOC, CO, CO2) 461,928 −GHGs 479,307 −Notes:
Comparison of Extruded PP Data
116

Reference Unit: 1 ton of Injection Molded PP ProductPrincipal Data Source(s): PlasticsEurope
Geographic Location: Europe
Timeframe: 2007
Description:
MATERIAL PRODUCTION DATA (Excluding Transport)
Energy ContentValue Unit ( MMBtu)
Resid. oil gal
Diesel gal
Natural gas cu ftCoal lb
Electricity 725.043 kWh 2.474
Crude Oil gal
Distillate Oil gal
Gasoline gal
LPG gal
MISC: Process off‐gas from Oil lb
MISC: Process off‐gas from NG lb
MISC: Recovered Energy x
TOTAL 2.474
PP Injection Molding
Fuel InputsPhysical Units
Injection molding of PP resin.
Feedstock Inputs Value Unit
Crude Oil gal
Natural Gas cu ftTOTAL
Non‐combustion Emissions Value Unit
VOC g
CO g
NOx g
PM10 g
PM2.5 g
SOx g
CH4 g
N2O g
CO2 g
Notes:Physical Units calculated using GREET Energy content calculated using GREET heating value assumptions.
117

Updated Previously
Values in GREETEnergy Use (mmBTU/ton)
Total Energy 6.345 –
Fossil fuels 5.486 – Coal 4.009 – Natural gas 1.324 – Petroleum 0.153 – Total Emissions(g/ton)
VOC 46.788 –
CO 134.974 – NOx 555.529 – PM10 710.801 – PM2.5 186.743 –
SOx 1221.820 – CH4 710.447 – N2O 6.947 – CO2 526,769 –
CO2 (VOC, CO, CO2) 527,127 – GHGs 546,958 –
Notes:
Comparison of Injection Molded PP Data
118

Reference Unit: 1 ton of Calendared PVC ProductPrincipal Data Source(s): PlasticsEurope
Geographic Location: Germany
Timeframe: 2007
Description:
MATERIAL PRODUCTION DATA (Excluding Transport)
Energy ContentValue Unit ( MMBtu)
Resid. oil gal
Diesel gal
Natural gas cu ftCoal lb
Electricity 527.075 kWh 1.798
Crude Oil gal
Distillate Oil gal
Gasoline gal
LPG gal
MISC: Process off‐gas from Oil lb
MISC: Process off‐gas from NG lb
MISC: Recovered Energy x
TOTAL 1.798
PVC Calendaring
Fuel InputsPhysical Units
Calendaring of PVC resin (as film).
Feedstock Inputs Value Unit
Crude Oil gal
Natural Gas cu ftTOTAL
Non‐combustion Emissions Value Unit
VOC g
CO 2.118 g
NOx 0.015 g
PM10 37.909 g
PM2.5 g
SOx 0.015 g
CH4 g
N2O g
CO2 22.727 g
Notes:Physical Units calculated using GREET Energy content calculated using GREET heating value assumptions.Particulates (unspecified size) were included in PM10.
119

Updated Previously
Values in GREETEnergy Use (mmBTU/ton)
Total Energy 4.611 –
Fossil fuels 3.987 – Coal 2.914 – Natural gas 0.962 – Petroleum 0.111 – Total Emissions(g/ton)
VOC 34.003 –
CO 100.211 – NOx 403.750 – PM10 554.489 – PM2.5 135.717 –
SOx 887.983 – CH4 516.323 – N2O 5.049 – CO2 382856.347 –
CO2 (VOC, CO, CO2) 383,120 – GHGs 397,532 –
Notes:
Comparison of Calendared PVC Data
120

Reference Unit: 1 ton of Extruded PVC ProductPrincipal Data Source(s): PlasticsEurope
Geographic Location: Europe
Timeframe: 2007
Description:
MATERIAL PRODUCTION DATA (Excluding Transport)
Energy ContentValue Unit ( MMBtu)
Resid. oil gal
Diesel gal
Natural gas cu ftCoal lb
Electricity 478.742 kWh 1.633
Crude Oil gal
Distillate Oil gal
Gasoline gal
LPG gal
MISC: Process off‐gas from Oil lb
MISC: Process off‐gas from NG lb
MISC: Recovered Energy x
TOTAL 1.633
PVC Extrusion
Fuel InputsPhysical Units
Extrusion of PVC resin (as pipe).
Feedstock Inputs Value Unit
Crude Oil gal
Natural Gas cu ftTOTAL
Non‐combustion Emissions Value Unit
VOC g
CO g
NOx g
PM10 g
PM2.5 g
SOx g
CH4 g
N2O g
CO2 g
Notes:Physical Units calculated using GREET Energy content calculated using GREET heating value assumptions.
121

Updated Previously
Values in GREETEnergy Use (mmBTU/ton)
Total Energy 4.188 –
Fossil fuels 3.621 – Coal 2.646 – Natural gas 0.874 – Petroleum 0.101 – Total Emissions(g/ton)
VOC 30.883 –
CO 89.091 – NOx 366.685 – PM10 469.175 – PM2.5 123.263 –
SOx 806.480 – CH4 468.941 – N2O 4.586 – CO2 347,701.50 –
CO2 (VOC, CO, CO2) 347,937.76 – GHGs 361,027.77 –
Notes:
Comparison of Extruded PVC Data
122

Reference Unit: 1 ton of Injection Molded PVC ProductPrincipal Data Source(s): PlasticsEurope
Geographic Location: Europe
Timeframe: 2007
Description:
MATERIAL PRODUCTION DATA (Excluding Transport)
Energy ContentValue Unit ( MMBtu)
Resid. oil gal
Diesel gal
Natural gas cu ftCoal lb
Electricity 1114.730 kWh 3.803
Crude Oil gal
Distillate Oil gal
Gasoline gal
LPG gal
MISC: Process off‐gas from Oil lb
MISC: Process off‐gas from NG lb
MISC: Recovered Energy x
TOTAL 3.803
PVC Injection Molding
Fuel InputsPhysical Units
Injection molding of PVC resin.
Feedstock Inputs Value Unit
Crude Oil gal
Natural Gas cu ftTOTAL
Non‐combustion Emissions Value Unit
VOC g
CO g
NOx g
PM10 g
PM2.5 g
SOx g
CH4 g
N2O g
CO2 g
Notes:Physical Units calculated using GREET Energy content calculated using GREET heating value assumptions.
123
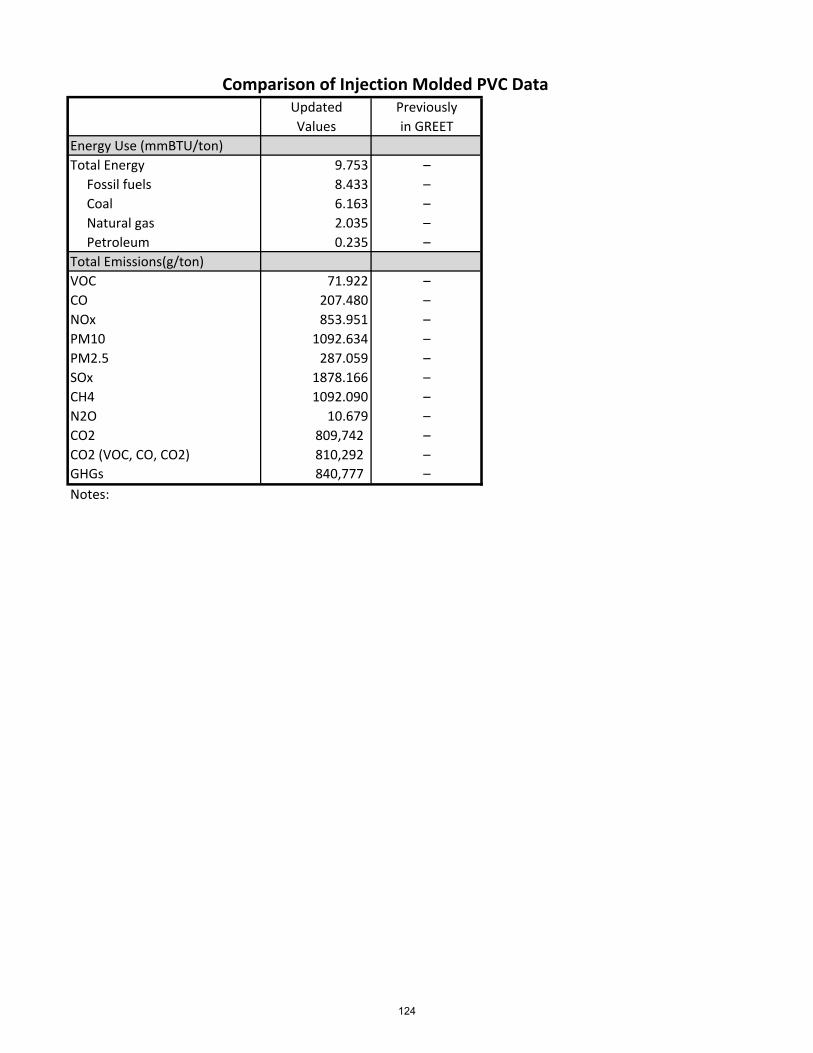
Updated Previously
Values in GREETEnergy Use (mmBTU/ton)
Total Energy 9.753 –
Fossil fuels 8.433 – Coal 6.163 – Natural gas 2.035 – Petroleum 0.235 – Total Emissions(g/ton)
VOC 71.922 –
CO 207.480 – NOx 853.951 – PM10 1092.634 – PM2.5 287.059 –
SOx 1878.166 – CH4 1092.090 – N2O 10.679 – CO2 809,742 –
CO2 (VOC, CO, CO2) 810,292 – GHGs 840,777 –
Notes:
Comparison of Injection Molded PVC Data
124