life opportunities survey (los) wave 2 weighting andy fallows and sangeetha gallagher
TRANSCRIPT

Life Opportunities Survey (LOS)Wave 2 Weighting
Andy Fallows and Sangeetha Gallagher

Overview
• Background
• Design
• W1 Weighting
• Longitudinal W2 Weighting
• Issues with weighting

Background
• Commissioned by DWP
• Follows social model of disability
• Longitudinal survey of population (possible boosts)
• Comparison of how people participate in society

Design
• Cross-sectional survey at W1• People identified as impaired at W1
interviewed face to face at W2• Sub-sample of non-impaired interviewed face
to face at W2, remainder given telephone interview
• If telephone interview identifies respondent as having gained an impairment then get face to face interview
Design
W1 Selected Sample

Design
W1 Respondents
W1 Non-Respondents

Design
Non-Impaired
Impaired

Design
Non-Impaired
Impaired
Comparison
Screening

Design
Non-Impaired
Impaired
Comparison
Screening

Design
Non-Impaired
Impaired
Comparison
Screening
Onset

Design (Complex)
Non-Impaired
Impaired
Comparison
Screening
Onset (Telephone)
Onset (F2F)
Offset

Design (Super Complex)
Non-Impaired
Impaired
Comparison
Screening
Onset (Telephone)
Onset (F2F)
Offset
Household of Comparison
Household of Impaired
Household of Onset (Telephone)

Design (Summary)
Face to Face
Telephone

W1 Weighting
• Follows standard social survey weighting
• Design weight calculated as inverse of probability of selection (taking account of multi-household adjustment)
• Non-response weight based on Output Area Classification

W1 Weighting
• Weights calibrated to Age-Sex and Region totals
• Totals obtained from ONS Demography – Census totals carried forward
• Calibration ensures that weights sum to population totals
15

Longitudinal (W2) Weighting
• Start with W1 final weight
• Create attrition weight by modelling unknown eligibility and response propensities using W1 variables and logistic regression
• Scale weights to make sure correct proportions of ineligibles are observed
• Calibrate back to W1 totals
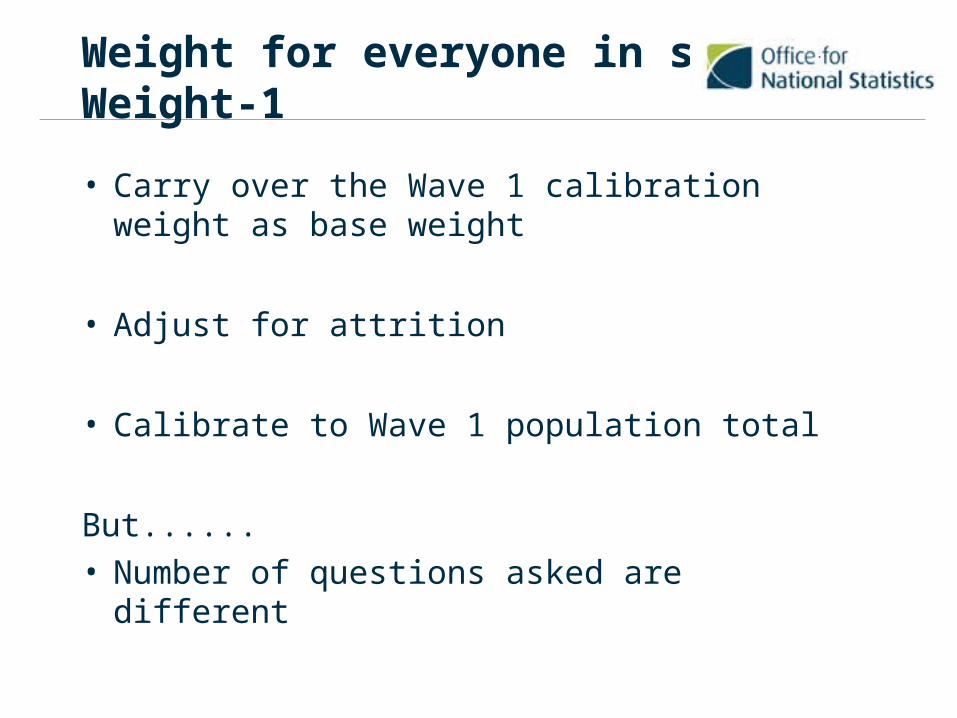
Weight for everyone in surveyWeight-1
• Carry over the Wave 1 calibration weight as base weight
• Adjust for attrition
• Calibrate to Wave 1 population total
But......• Number of questions asked are different

Why the difference
Telephone interview Face to face interview
Screening households
Impaired person households
Control households
Onset person household
How can you compare between Wave 1 and Wave 2 if some questions are not asked in Wave 2?

Solution 1
PopulationPopulation SampleSample
Impaired Impaired including onsets
Not ImpairedControl
Screening
PopulationPopulation SampleSample
Impaired Impaired including onsets
Not Impaired Control
Keep Weight 1
Reweighted

Weighting the not impaired
• Design weight = 1/P(ctrl-hhld)
• Adjust for attrition
• Calibrate to size of wave 1 population of not impaired people = w1 population – sum(weight of w2 impaired)

Design weight for control group
AA
BB
CC
selected
Not selected
selected
Not selected
selected
Not selected
P(ctrl-hhld) = 1 – P(not selected)
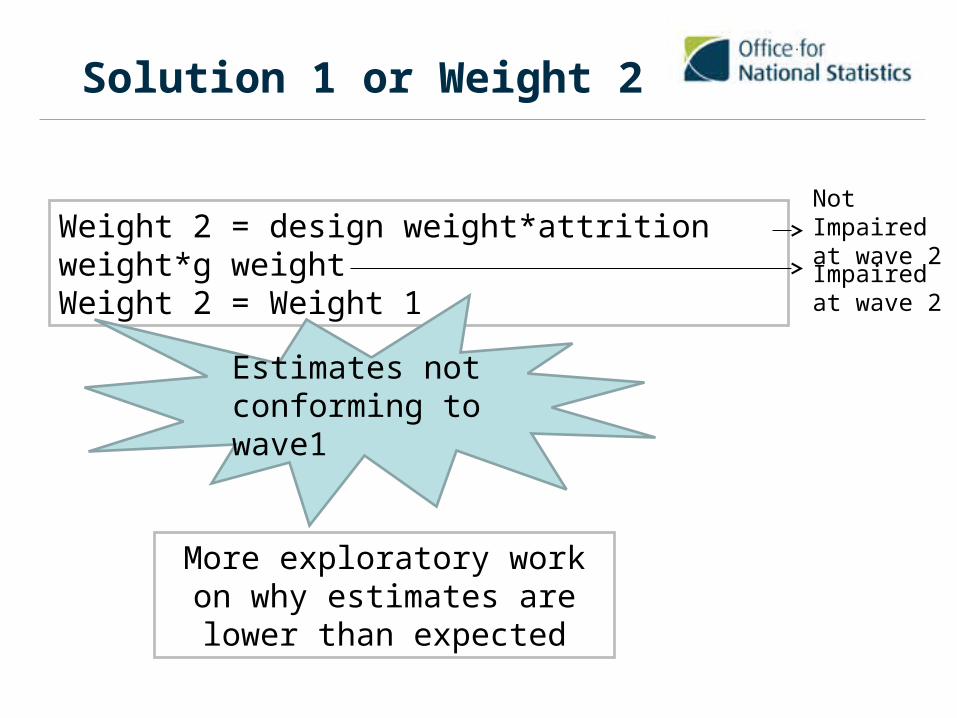
Solution 1 or Weight 2
Weight 2 = design weight*attrition weight*g weightWeight 2 = Weight 1
Estimates not conforming to wave1
More exploratory work on why estimates are lower than
expected
Not Impaired at wave 2
Impaired at wave 2

Findings
Controlgroup
Telephone interview(Screening group)
Onset Not onset
Face to face interview
Onset A B C
Not Onset
D E F
Total A + D B + E C + F
B/(B+E) is biased
A/(A+D) is unbiased
C/(C+F) is unobserved

Solution 2 – Weight 3
• Give weight to people who had only a face to face interview
• Split the people who were interviewed face to face in Wave 2 but were not impaired in Wave 1 into weighting classes
• People who were identified as in onset household through telephone interview shared the weight of those who were in the same weighting class and had only face to face interview

Variables forming weighting classes
25
0
100
200
300
400
500
Age Group
Fre
qu
en
cy
11
-15
16
-30
31
-45
46
-64
65
&a
bo
ve

Continued....
26
0
200
400
600
Impairment types
Fre
qu
en
cy
Sig
ht
He
ari
ng
Lo
ng
-te
rm p
ain
Ch
ron
ic h
ea
lth c
on
diti
on
Sp
ea
kin
g
Mo
bili
ty
De
xte
rity
Bre
ath
ing
Le
arn
ing
Inte
llect
ua
l
Be
ha
vio
ura
l
Me
mo
ry
Me
nta
l he
alth
co
nd
itio
n
Oth
er
imp
air
me
nt

Weight 3
g
g g
2FtF
2 1FtF TU
baseg
ig
base calg g
i i
W
W W
2
2
1
, FtF inflow
Telephone screening inflow
baseg gicontrol
gi calg gi
WW
W

Final weight
• People who were identified as impaired in Wave 1 were weighted as
• People who had a face to face interview in Wave 2 but were not impaired in Wave 1 were weighted as
2 1 2
long cal attr g
kW W W W
2 1 2
long cal attr g
k gW W W W

THANK YOU FOR LISTENINGQUESTIONS?
THANK YOU FOR LISTENINGQUESTIONS?