lifetime reliability-based optimization of post-tensioned
TRANSCRIPT
Engineering Structures 145 (2017) 381–391
Contents lists available at ScienceDirect
Engineering Structures
journal homepage: www.elsevier .com/ locate /engstruct
Lifetime reliability-based optimization of post-tensioned box-girderbridges
http://dx.doi.org/10.1016/j.engstruct.2017.05.0130141-0296/� 2017 The Author(s). Published by Elsevier Ltd.This is an open access article under the CC BY-NC-ND license (http://creativecommons.org/licenses/by-nc-nd/4.0/).
⇑ Corresponding author.E-mail addresses: [email protected] (T. García-Segura), [email protected]
(V. Yepes), [email protected] (D.M. Frangopol), [email protected](D.Y. Yang).
Tatiana García-Segura a,⇑, Víctor Yepes a, Dan M. Frangopol b, David Y. Yang c
a Institute of Concrete Science and Technology (ICITECH), Universitat Politècnica de València, 46022 Valencia, SpainbDepartment of Civil and Environmental Engineering, Engineering Research Center for Advanced Technology for Large Structural Systems (ATLSS Center), Lehigh University,117 ATLSS Dr., Bethlehem, PA 18015-4729, USAcDepartment of Civil and Environmental Engineering, The Hong Kong Polytechnic University, Hung Hom, Hong Kong, China
a r t i c l e i n f o a b s t r a c t
Article history:Received 29 July 2016Revised 7 March 2017Accepted 8 May 2017
Keywords:CorrosionLifetime performanceSustainabilityPost-tensioned concreteBox-girder bridges
This paper presents a lifetime reliability-based approach for the optimization of post-tensioned concretebox-girder bridges under corrosion attack. The proposed approach is illustrated by determining the opti-mal life-cycle cost and CO2 emissions of several initial designs of post-tensioned box-girder bridges withdifferent objectives, i.e. the lowest initial costs, the longest corrosion initiation time, or the maximumsafety. The study was conducted in two steps. Firstly, the Pareto set presents initial designs consideringthe cross-section geometry, the concrete strength, the reinforcing steel and the prestressing steel.Secondly, the maintenance optimization was conducted with the proposed method, aimed at minimizingthe economic, environmental and societal impacts of the bridge while satisfying the reliability target dur-ing its life-span. Effective maintenance is able to extend the service life of the bridge with the minimumcost and CO2 emissions. It is indicated that a durability-conscious initial design is particularly beneficialfor life-cycle performance. Besides, the emphasis on the initial design can also have an effect on the life-cycle performance of bridges. It is found that designs with longer corrosion initiation time are associatedwith lower life-cycle cost, especially when using concrete of higher strength. Findings from the currentpaper also indicate that optimal maintenance strategies are more likely to be those with fewer mainte-nance actions that repair all deteriorating structures simultaneously.� 2017 The Author(s). Published by Elsevier Ltd. This is an open access article under the CC BY-NC-ND
license (http://creativecommons.org/licenses/by-nc-nd/4.0/).
1. Introduction
Sustainable development requires a balance among theeconomic, environmental and societal pillars. In addition,the Brundtland Report proposes a long-term vision to maintainthe resources necessary to provide future needs [1]. This objectivehas been applied to the civil engineering field in different lines ofresearch. Some researches deal with design optimizations aimedto achieve the maximum benefit from the minimum resources[2–5]. Environmental concern has led to the incorporation of CO2
emissions and energy consumptions as important criteria [6–10].Moreover, environmental effects from other industries during thecivil engineering activities have also been studied in order toreduce the total CO2 emissions [11,12]. Other studies focus onthe life-cycle perspective. Sarma and Adeli [13] presented a review
on cost optimization of concrete structures and stated that thefocus of further research should switch from initial cost optimiza-tion to life-cycle cost optimization. This has led to an increasednumber of studies on life-cycle performance of structures[14–17], aiming at optimizing the maintenance cost of structures.Frangopol and Soliman [18] pointed out that maintenance actionsmust be effectively planned throughout the life-cycle of structuresto achieve the maximum possible life-cycle benefits under budgetconstraints.
A major portion of the life-cycle cost of long-span coastalbridges is attributed to the maintenance of corroded components[19]. A maintenance action can delay the damage propagation orreduce the degree of damage, and consequently, extend the servicelife of a deteriorating structure [20]. Neves and Frangopol [21]mentioned that including condition states alone is not enough toreflect the safety and serviceability of a bridge. Thus, both condi-tion and safety levels have been used as objectives in maintenanceoptimization [22–24]. Later, Dong et al. [25] considered the envi-ronmental and societal aspects of maintenance actions. Sabatinoet al. [26] used multi-attribute utility theory to assess various
382 T. García-Segura et al. / Engineering Structures 145 (2017) 381–391
aspects of structural sustainability considering risks associatedwith bridge failure and risk attitudes of decision makers.Penadés-Plà et al. [27] reviewed the sustainable criteria used fordecision-making at each life-cycle phase of a bridge.
The performance of a structure is affected by several uncertain-ties. Among these, uncertainties in load effects, material propertiesand damage occurrence and propagation should be highlighted[28]. Many design codes, including the Eurocode, have adoptedthe partial safety factors to take into account the uncertainties aris-ing from geometry, material properties, load effects, and designmodels. During the planning of maintenance actions, stakeholdersshould also be well aware of the uncertainties involved in thedeterioration process and potential inspections/interventions[17]. A proper consideration of uncertainties can lead to significanteconomic benefits for both initial design and life-cycle perfor-mance [29].
This paper presents a lifetime reliability-based approach for theoptimization of post-tensioned concrete (PTC) box-girder roadbridges through two steps. Firstly, the study relies on a novelmulti-objective optimization technique developed by García-Segura et al. [30] to arrive at a set of optimum initial bridge solu-tions considering initial cost, overall safety factor and corrosioninitiation time, constrained by the requirements of the design code.Secondly, maintenance optimization is conducted with respect to adesign service life of 150 years to determine the optimal mainte-nance actions in terms of maintenance costs and environmentalimpacts. The maintenance actions considered in the study candelay the damage propagation, which in turn extends the bridgeservice life. The economic, environmental and societal impactsare examined. During the maintenance optimization, the societalimpact due to traffic disruptions is associated with either economiccosts or CO2 emissions based on existing studies [25]. The compar-ison of life-cycle cost and CO2 emissions among the initial designsunder consideration provides guidance for designing sustainablePTC box-girder road bridges in a coastal zone.
2. Pareto front of optimal bridge designs
The paper studies the design of a PTC box-girder road bridgelocated in a coastal region. The initial designs under considerationare selected from a set of alternative tradeoff solutions located on aPareto front associated with three objectives: initial cost, overallsafety factor, and corrosion initiation time. The determination ofthese objectives are described in detail in the following sections.Bridge designs are obtained from the following optimizationscheme:
GivenA PTC box-girder road bridge with a width of 11.8 m and three
continuous spans of 35.2, 44 and 35.2 m.GoalFind the optimal bridge design of a PTC box-girder described
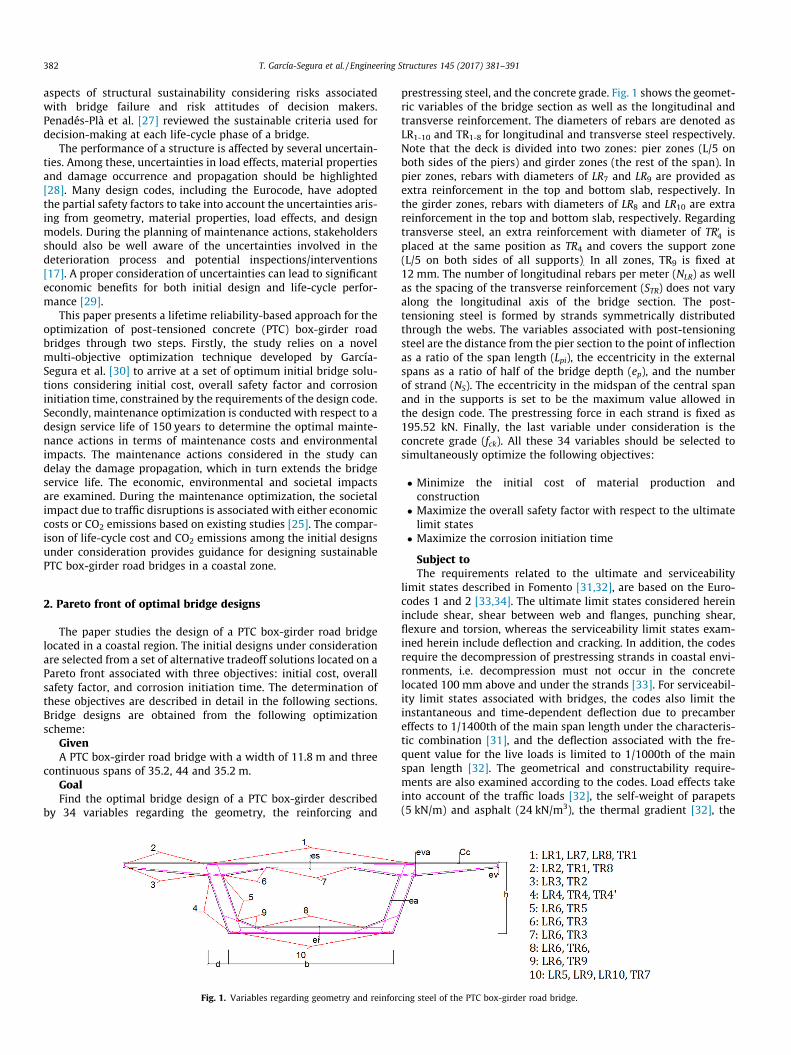
by 34 variables regarding the geometry, the reinforcing and
Fig. 1. Variables regarding geometry and reinfor
prestressing steel, and the concrete grade. Fig. 1 shows the geomet-ric variables of the bridge section as well as the longitudinal andtransverse reinforcement. The diameters of rebars are denoted asLR1-10 and TR1-8 for longitudinal and transverse steel respectively.Note that the deck is divided into two zones: pier zones (L/5 onboth sides of the piers) and girder zones (the rest of the span). Inpier zones, rebars with diameters of LR7 and LR9 are provided asextra reinforcement in the top and bottom slab, respectively. Inthe girder zones, rebars with diameters of LR8 and LR10 are extrareinforcement in the top and bottom slab, respectively. Regardingtransverse steel, an extra reinforcement with diameter of TR0
4 isplaced at the same position as TR4 and covers the support zone(L/5 on both sides of all supports). In all zones, TR9 is fixed at12 mm. The number of longitudinal rebars per meter (NLR) as wellas the spacing of the transverse reinforcement (STR) does not varyalong the longitudinal axis of the bridge section. The post-tensioning steel is formed by strands symmetrically distributedthrough the webs. The variables associated with post-tensioningsteel are the distance from the pier section to the point of inflectionas a ratio of the span length (Lpi), the eccentricity in the externalspans as a ratio of half of the bridge depth (ep), and the numberof strand (NS). The eccentricity in the midspan of the central spanand in the supports is set to be the maximum value allowed inthe design code. The prestressing force in each strand is fixed as195.52 kN. Finally, the last variable under consideration is theconcrete grade (fck). All these 34 variables should be selected tosimultaneously optimize the following objectives:
� Minimize the initial cost of material production andconstruction
� Maximize the overall safety factor with respect to the ultimatelimit states
� Maximize the corrosion initiation time
Subject toThe requirements related to the ultimate and serviceability
limit states described in Fomento [31,32], are based on the Euro-codes 1 and 2 [33,34]. The ultimate limit states considered hereininclude shear, shear between web and flanges, punching shear,flexure and torsion, whereas the serviceability limit states exam-ined herein include deflection and cracking. In addition, the codesrequire the decompression of prestressing strands in coastal envi-ronments, i.e. decompression must not occur in the concretelocated 100 mm above and under the strands [33]. For serviceabil-ity limit states associated with bridges, the codes also limit theinstantaneous and time-dependent deflection due to precambereffects to 1/1400th of the main span length under the characteris-tic combination [31], and the deflection associated with the fre-quent value for the live loads is limited to 1/1000th of the mainspan length [32]. The geometrical and constructability require-ments are also examined according to the codes. Load effects takeinto account of the traffic loads [32], the self-weight of parapets(5 kN/m) and asphalt (24 kN/m3), the thermal gradient [32], the
cing steel of the PTC box-girder road bridge.
Table 2Parameters of the random variables associated with corrosion.
Random variables Probabilistic distributions
Model error (D) Normal (m = 1, COV = 0.2)Co Lognormal (m = 2.95, COV = 0.3)Cr Uniform (0.6–1.2)Model error for icorr Uniform (m = 1, COV = 0.2)Cover Normal (m = cc, COV = 0.25)
Table 3Aggregate-to-cement ratio and water-cement ratio of different concrete grades.
Concrete grade a/c w/c
35 MPa 6.45 0.5440 MPa 6.03 0.545 MPa 5.47 0.4550 MPa 4.66 0.455 MPa 3.92 0.3560 MPa 3.64 0.33
T. García-Segura et al. / Engineering Structures 145 (2017) 381–391 383
prestressing steel effect and the relative settlement of each support(5 mm).
2.1. Objective 1: initial cost
The initial cost (Cini) is obtained according to Eq. (1). Each unitcost (concrete (Cco), reinforcing steel (Crs), prestressing steel (Cps)and formwork (Cf)) is multiplied by the respective measurements(volume of concrete (Vco), the weight of reinforcement steel(Wrs), the weight of prestressing steel (Wps) and the area of theformwork (Af)). The unit costs for the materials are evaluated asthe cost of material production, transport and placement. The costof material production includes the raw material extraction,manufacture and transport. Table 1 summarizes the unit costs usedin the optimization. More details can be found in Garcia-Seguraet al. [6].
Cini ¼ Cco � Vco þ Crs �Wrs þ Cps �Wps þ Cf � Af ð1Þ
70 MPa 3.56 0.3180 MPa 3.55 0.390 MPa 3.52 0.3100 MPa 3.22 0.3 2.2. Objective 2: overall safety factorEq. (2) evaluates the overall safety factor (S) as the minimumcoefficient (cj) of the torsion, flexure, transverse flexure and shearlimit states. The coefficient cj is defined as the ratio of the designvalue of the ultimate resistance to the design value of ultimate loadeffects. For the determination of these design values, partial safetyfactors should be considered as proposed by the codes [31,32].Therefore, a safety coefficient of 1 indicates strict compliance withthe codes.
Sð~xÞ ¼ Minimumcjð~xÞ ð2Þ
2.3. Objective 3: corrosion initiation time
For structures in a coastal environment, the corrosion initiationtime (tcorr) corresponds to the time when the chloride concentra-tion on the surface of reinforcing steel exceeds a critical thresholdvalue (Cr). At time t, the chloride content at a distance x from theconcrete outer surface is calculated based on Fick’s second law(see Eq. (3)).
Cðx; tÞ ¼ Co 1� erfx
2ffiffiffiffiffiffitD
p� �� �
ð3Þ
where D is the apparent diffusion coefficient; Co is the chloride con-centration on the surface. The current study considers the uncer-tainties related to the apparent diffusion coefficient, chlorideconcentration on the surface, concrete cover, and the thresholdvalue of chloride content. The apparent diffusion coefficient reflects
Table 1Unit costs and CO2 emissions.
Unit measurements Cost (€) CO2 emission (kg)
m2 of formwork 33.81 2.08kg of steel (B-500-S) 1.16 3.03kg of prestressing steel (Y1860-S7) 3.40 5.64m3 of concrete 35 MPa 104.57 321.92m3 of concrete 40 MPa 109.33 338.90m3 of concrete 45 MPa 114.10 355.88m3 of concrete 50 MPa 118.87 372.86m3 of concrete 55 MPa 123.64 389.84m3 of concrete 60 MPa 128.41 406.82m3 of concrete 70 MPa 137.95 440.78m3 of concrete 80 MPa 147.49 474.74m3 of concrete 90 MPa 157.02 508.70m3 of concrete 100 MPa 166.56 542.66
the concrete permeability. Eq. (4) is used herein to determine thediffusion coefficient [35,36]:
D ¼ DH2O0:15 � 1þ qcwc
1þ qcwc þ qca
qac
qcwc � 0:85
1þ qcwc
� �3
ð4Þ
where DH20 is the chloride diffusion coefficient in an infinite solu-tion (=1.6 � 10�5 cm2/s for NaCl); qc is the mass density of cement(considered to be 3.16 g/cm3); qa is the mass density of aggregates(considered to be 2.6 g/cm3); a/c is the aggregate-to-cement ratio;and w/c is the water-cement ratio. The values of aggregate-to-cement ratio and water-cement ratio are shown in Table 3 accord-ing to the concrete grades. The parameters of the random variablesassociated with the corrosion initiation are summarized in Table 2[35]. It should be noted that the coefficient of variation of Co isassumed herein as 0.3 due to the reduced variability of the surfacechloride content in a particular bridge compared to a group ofbridges considered in [37]. The mean value of the surface chloridecontent corresponds to a distance of 1000 m from the coast [37].
3. Maintenance optimization
Maintenance optimization seeks sustainable maintenanceactions that maintain the bridge performance requirements duringits life-span. For bridges in coastal zones, deterioration is mainlycaused by chloride-induced steel corrosion. Long-term effects ofprestressing tendons, such as loss of prestress and deflection, areconsidered in the initial design phase. The degradation processdue to chloride-induced corrosion is formulated as a reduction ofthe reinforcing steel area. Consequently, the structural safety isreduced. A lifetimereliability-based approach is used to evaluatethe structural performance and to satisfy the annual reliability tar-get index of 4.7, as proposed in the Eurocode [38]. Maintenanceactions are applied to keep the minimum reliability index abovethe target level during the prescribed service life (150 years). Theoptimization variables define the maintenance schedule in eachcross-section (see Fig. 2). The maintenance optimization considersthe three pillars of sustainability, i.e. economic, environmental andsocietal impacts. The economic impact of maintenance actionsderives from the material and construction costs of maintenanceactions. The environmental impact considers the CO2 emissionsdue to the materials and construction activities. The societalimpact is due to the traffic disruptions during maintenance actions.
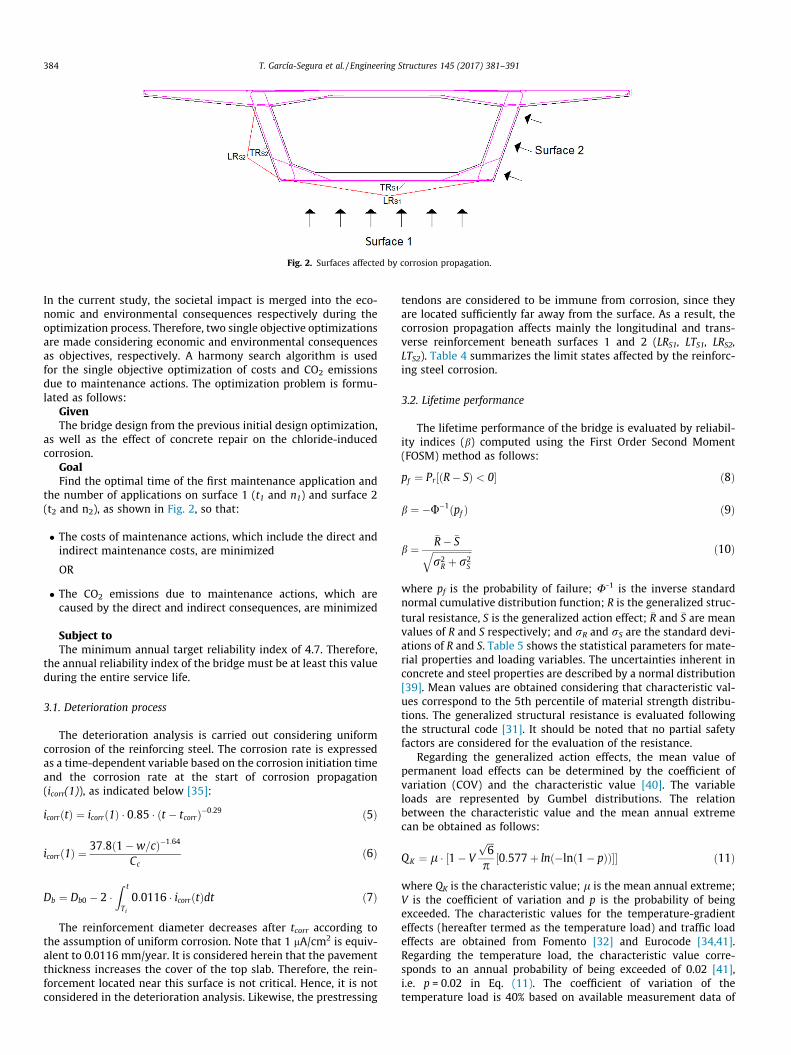
Fig. 2. Surfaces affected by corrosion propagation.
384 T. García-Segura et al. / Engineering Structures 145 (2017) 381–391
In the current study, the societal impact is merged into the eco-nomic and environmental consequences respectively during theoptimization process. Therefore, two single objective optimizationsare made considering economic and environmental consequencesas objectives, respectively. A harmony search algorithm is usedfor the single objective optimization of costs and CO2 emissionsdue to maintenance actions. The optimization problem is formu-lated as follows:
GivenThe bridge design from the previous initial design optimization,
as well as the effect of concrete repair on the chloride-inducedcorrosion.
GoalFind the optimal time of the first maintenance application and
the number of applications on surface 1 (t1 and n1) and surface 2(t2 and n2), as shown in Fig. 2, so that:
� The costs of maintenance actions, which include the direct andindirect maintenance costs, are minimized
OR
� The CO2 emissions due to maintenance actions, which arecaused by the direct and indirect consequences, are minimized
Subject toThe minimum annual target reliability index of 4.7. Therefore,
the annual reliability index of the bridge must be at least this valueduring the entire service life.
3.1. Deterioration process
The deterioration analysis is carried out considering uniformcorrosion of the reinforcing steel. The corrosion rate is expressedas a time-dependent variable based on the corrosion initiation timeand the corrosion rate at the start of corrosion propagation(icorr(1)), as indicated below [35]:
icorrðtÞ ¼ icorrð1Þ � 0:85 � ðt � tcorrÞ�0:29 ð5Þ
icorrð1Þ ¼ 37:8ð1�w=cÞ�1:64
Ccð6Þ
Db ¼ Db0 � 2 �Z t
Ti
0:0116 � icorrðtÞdt ð7Þ
The reinforcement diameter decreases after tcorr according tothe assumption of uniform corrosion. Note that 1 mA/cm2 is equiv-alent to 0.0116 mm/year. It is considered herein that the pavementthickness increases the cover of the top slab. Therefore, the rein-forcement located near this surface is not critical. Hence, it is notconsidered in the deterioration analysis. Likewise, the prestressing
tendons are considered to be immune from corrosion, since theyare located sufficiently far away from the surface. As a result, thecorrosion propagation affects mainly the longitudinal and trans-verse reinforcement beneath surfaces 1 and 2 (LRS1, LTS1, LRS2,LTS2). Table 4 summarizes the limit states affected by the reinforc-ing steel corrosion.
3.2. Lifetime performance
The lifetime performance of the bridge is evaluated by reliabil-ity indices (b) computed using the First Order Second Moment(FOSM) method as follows:
pf ¼ Pr½ðR� SÞ < 0� ð8Þ
b ¼ �U�1ðpf Þ ð9Þ
b ¼�R� �Sffiffiffiffiffiffiffiffiffiffiffiffiffiffiffiffiffir2
R þ r2S
q ð10Þ
where pf is the probability of failure; U-1 is the inverse standardnormal cumulative distribution function; R is the generalized struc-tural resistance, S is the generalized action effect; �R and �S are meanvalues of R and S respectively; and rR and rS are the standard devi-ations of R and S. Table 5 shows the statistical parameters for mate-rial properties and loading variables. The uncertainties inherent inconcrete and steel properties are described by a normal distribution[39]. Mean values are obtained considering that characteristic val-ues correspond to the 5th percentile of material strength distribu-tions. The generalized structural resistance is evaluated followingthe structural code [31]. It should be noted that no partial safetyfactors are considered for the evaluation of the resistance.
Regarding the generalized action effects, the mean value ofpermanent load effects can be determined by the coefficient ofvariation (COV) and the characteristic value [40]. The variableloads are represented by Gumbel distributions. The relationbetween the characteristic value and the mean annual extremecan be obtained as follows:
QK ¼ l � ½1� V
ffiffiffi6
p
p½0:577þ lnð�lnð1� pÞÞ�� ð11Þ
where QK is the characteristic value; l is the mean annual extreme;V is the coefficient of variation and p is the probability of beingexceeded. The characteristic values for the temperature-gradienteffects (hereafter termed as the temperature load) and traffic loadeffects are obtained from Fomento [32] and Eurocode [34,41].Regarding the temperature load, the characteristic value corre-sponds to an annual probability of being exceeded of 0.02 [41],i.e. p = 0.02 in Eq. (11). The coefficient of variation of thetemperature load is 40% based on available measurement data of
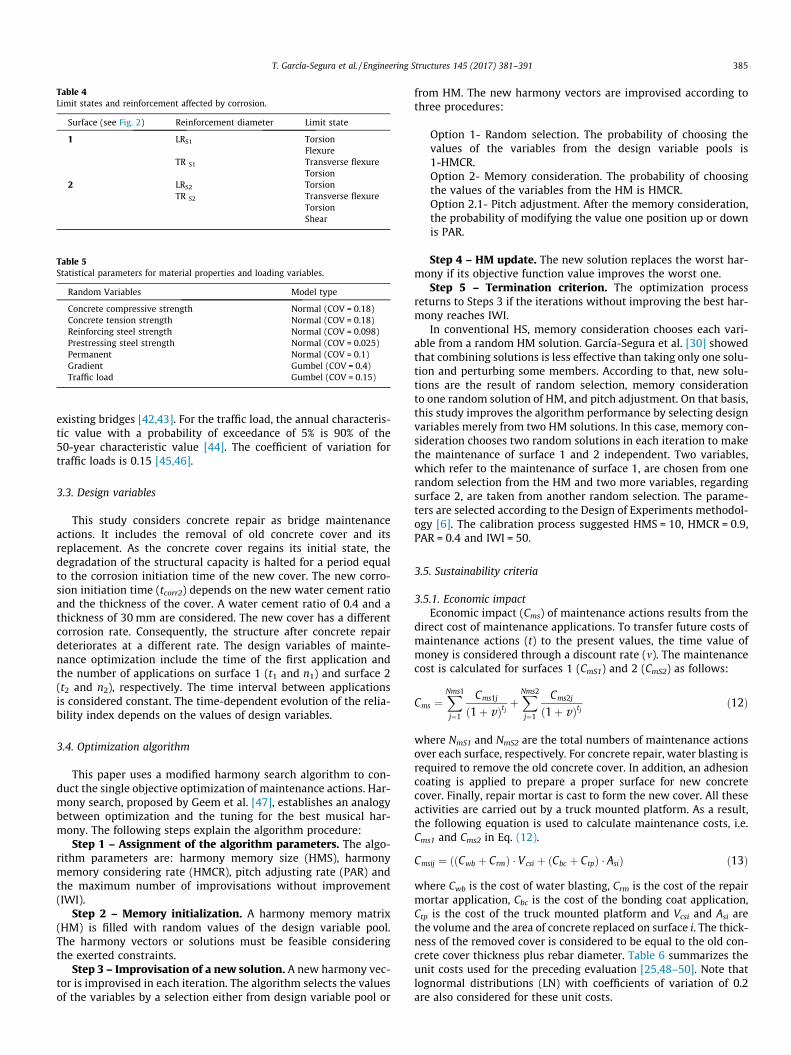
Table 4Limit states and reinforcement affected by corrosion.
Surface (see Fig. 2) Reinforcement diameter Limit state
1 LRS1 TorsionFlexure
TR S1 Transverse flexureTorsion
2 LRS2 TorsionTR S2 Transverse flexure
TorsionShear
Table 5Statistical parameters for material properties and loading variables.
Random Variables Model type
Concrete compressive strength Normal (COV = 0.18)Concrete tension strength Normal (COV = 0.18)Reinforcing steel strength Normal (COV = 0.098)Prestressing steel strength Normal (COV = 0.025)Permanent Normal (COV = 0.1)Gradient Gumbel (COV = 0.4)Traffic load Gumbel (COV = 0.15)
T. García-Segura et al. / Engineering Structures 145 (2017) 381–391 385
existing bridges [42,43]. For the traffic load, the annual characteris-tic value with a probability of exceedance of 5% is 90% of the50-year characteristic value [44]. The coefficient of variation fortraffic loads is 0.15 [45,46].
3.3. Design variables
This study considers concrete repair as bridge maintenanceactions. It includes the removal of old concrete cover and itsreplacement. As the concrete cover regains its initial state, thedegradation of the structural capacity is halted for a period equalto the corrosion initiation time of the new cover. The new corro-sion initiation time (tcorr2) depends on the new water cement ratioand the thickness of the cover. A water cement ratio of 0.4 and athickness of 30 mm are considered. The new cover has a differentcorrosion rate. Consequently, the structure after concrete repairdeteriorates at a different rate. The design variables of mainte-nance optimization include the time of the first application andthe number of applications on surface 1 (t1 and n1) and surface 2(t2 and n2), respectively. The time interval between applicationsis considered constant. The time-dependent evolution of the relia-bility index depends on the values of design variables.
3.4. Optimization algorithm
This paper uses a modified harmony search algorithm to con-duct the single objective optimization of maintenance actions. Har-mony search, proposed by Geem et al. [47], establishes an analogybetween optimization and the tuning for the best musical har-mony. The following steps explain the algorithm procedure:
Step 1 – Assignment of the algorithm parameters. The algo-rithm parameters are: harmony memory size (HMS), harmonymemory considering rate (HMCR), pitch adjusting rate (PAR) andthe maximum number of improvisations without improvement(IWI).
Step 2 – Memory initialization. A harmony memory matrix(HM) is filled with random values of the design variable pool.The harmony vectors or solutions must be feasible consideringthe exerted constraints.
Step 3 – Improvisation of a new solution. A new harmony vec-tor is improvised in each iteration. The algorithm selects the valuesof the variables by a selection either from design variable pool or
from HM. The new harmony vectors are improvised according tothree procedures:
Option 1- Random selection. The probability of choosing thevalues of the variables from the design variable pools is1-HMCR.Option 2- Memory consideration. The probability of choosingthe values of the variables from the HM is HMCR.Option 2.1- Pitch adjustment. After the memory consideration,the probability of modifying the value one position up or downis PAR.
Step 4 – HM update. The new solution replaces the worst har-mony if its objective function value improves the worst one.
Step 5 – Termination criterion. The optimization processreturns to Steps 3 if the iterations without improving the best har-mony reaches IWI.
In conventional HS, memory consideration chooses each vari-able from a random HM solution. García-Segura et al. [30] showedthat combining solutions is less effective than taking only one solu-tion and perturbing some members. According to that, new solu-tions are the result of random selection, memory considerationto one random solution of HM, and pitch adjustment. On that basis,this study improves the algorithm performance by selecting designvariables merely from two HM solutions. In this case, memory con-sideration chooses two random solutions in each iteration to makethe maintenance of surface 1 and 2 independent. Two variables,which refer to the maintenance of surface 1, are chosen from onerandom selection from the HM and two more variables, regardingsurface 2, are taken from another random selection. The parame-ters are selected according to the Design of Experiments methodol-ogy [6]. The calibration process suggested HMS = 10, HMCR = 0.9,PAR = 0.4 and IWI = 50.
3.5. Sustainability criteria
3.5.1. Economic impactEconomic impact (Cms) of maintenance actions results from the
direct cost of maintenance applications. To transfer future costs ofmaintenance actions (t) to the present values, the time value ofmoney is considered through a discount rate (m). The maintenancecost is calculated for surfaces 1 (CmS1) and 2 (CmS2) as follows:
Cms ¼XNms1
j¼1
Cms1j
ð1þ vÞtj þXNms2
j¼1
Cms2j
ð1þ vÞtj ð12Þ
where NmS1 and NmS2 are the total numbers of maintenance actionsover each surface, respectively. For concrete repair, water blasting isrequired to remove the old concrete cover. In addition, an adhesioncoating is applied to prepare a proper surface for new concretecover. Finally, repair mortar is cast to form the new cover. All theseactivities are carried out by a truck mounted platform. As a result,the following equation is used to calculate maintenance costs, i.e.Cms1 and Cms2 in Eq. (12).
Cmsij ¼ ððCwb þ CrmÞ � Vcsi þ ðCbc þ CtpÞ � AsiÞ ð13Þ
where Cwb is the cost of water blasting, Crm is the cost of the repairmortar application, Cbc is the cost of the bonding coat application,Ctp is the cost of the truck mounted platform and Vcsi and Asi arethe volume and the area of concrete replaced on surface i. The thick-ness of the removed cover is considered to be equal to the old con-crete cover thickness plus rebar diameter. Table 6 summarizes theunit costs used for the preceding evaluation [25,48–50]. Note thatlognormal distributions (LN) with coefficients of variation of 0.2are also considered for these unit costs.
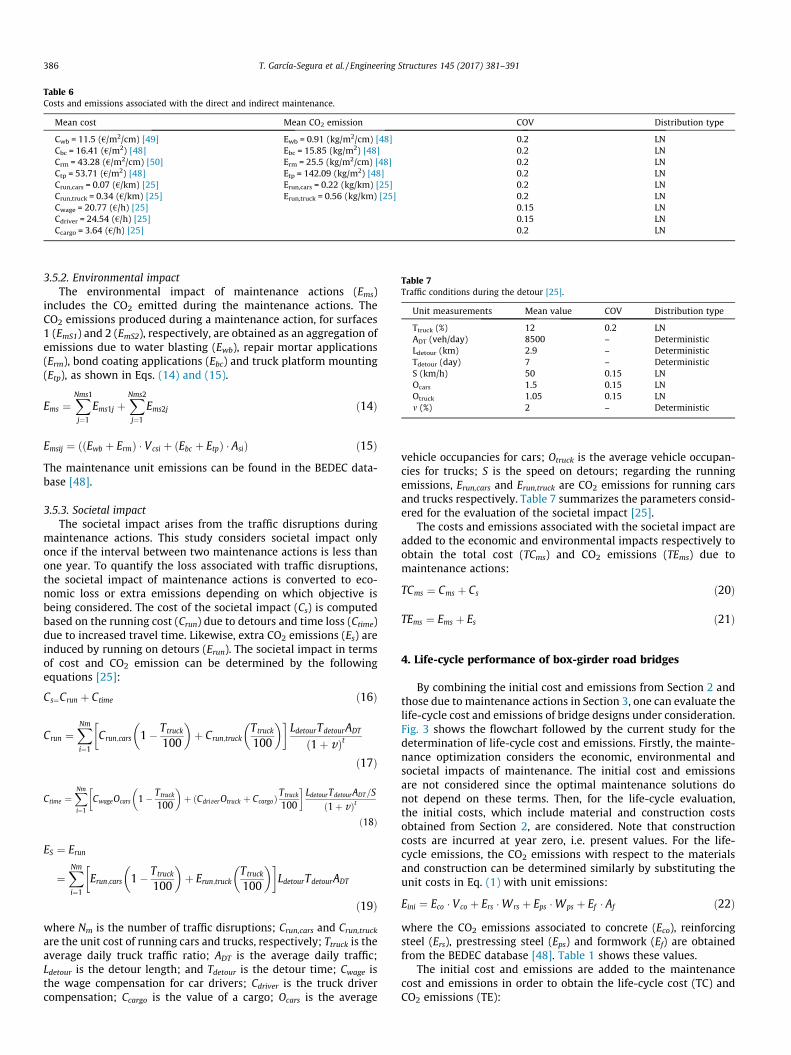
Table 7Traffic conditions during the detour [25].
Unit measurements Mean value COV Distribution type
Ttruck (%) 12 0.2 LNADT (veh/day) 8500 – DeterministicLdetour (km) 2.9 – DeterministicTdetour (day) 7 – DeterministicS (km/h) 50 0.15 LNOcars 1.5 0.15 LNOtruck 1.05 0.15 LNm (%) 2 – Deterministic
Table 6Costs and emissions associated with the direct and indirect maintenance.
Mean cost Mean CO2 emission COV Distribution type
Cwb = 11.5 (€/m2/cm) [49] Ewb = 0.91 (kg/m2/cm) [48] 0.2 LNCbc = 16.41 (€/m2) [48] Ebc = 15.85 (kg/m2) [48] 0.2 LNCrm = 43.28 (€/m2/cm) [50] Erm = 25.5 (kg/m2/cm) [48] 0.2 LNCtp = 53.71 (€/m2) [48] Etp = 142.09 (kg/m2) [48] 0.2 LNCrun,cars = 0.07 (€/km) [25] Erun,cars = 0.22 (kg/km) [25] 0.2 LNCrun,truck = 0.34 (€/km) [25] Erun,truck = 0.56 (kg/km) [25] 0.2 LNCwage = 20.77 (€/h) [25] 0.15 LNCdriver = 24.54 (€/h) [25] 0.15 LNCcargo = 3.64 (€/h) [25] 0.2 LN
386 T. García-Segura et al. / Engineering Structures 145 (2017) 381–391
3.5.2. Environmental impactThe environmental impact of maintenance actions (Ems)
includes the CO2 emitted during the maintenance actions. TheCO2 emissions produced during a maintenance action, for surfaces1 (EmS1) and 2 (EmS2), respectively, are obtained as an aggregation ofemissions due to water blasting (Ewb), repair mortar applications(Erm), bond coating applications (Ebc) and truck platform mounting(Etp), as shown in Eqs. (14) and (15).
Ems ¼XNms1
j¼1
Ems1j þXNms2
j¼1
Ems2j ð14Þ
Emsij ¼ ððEwb þ ErmÞ � Vcsi þ ðEbc þ EtpÞ � AsiÞ ð15ÞThe maintenance unit emissions can be found in the BEDEC data-base [48].
3.5.3. Societal impactThe societal impact arises from the traffic disruptions during
maintenance actions. This study considers societal impact onlyonce if the interval between two maintenance actions is less thanone year. To quantify the loss associated with traffic disruptions,the societal impact of maintenance actions is converted to eco-nomic loss or extra emissions depending on which objective isbeing considered. The cost of the societal impact (Cs) is computedbased on the running cost (Crun) due to detours and time loss (Ctime)due to increased travel time. Likewise, extra CO2 emissions (Es) areinduced by running on detours (Erun). The societal impact in termsof cost and CO2 emission can be determined by the followingequations [25]:
Cs¼Crun þ Ctime ð16Þ
Crun ¼XNmi¼1
Crun;cars 1� Ttruck
100
� �þ Crun;truck
Ttruck
100
� �� �LdetourTdetourADT
ð1þ vÞtð17Þ
Ctime ¼XNmi¼1
CwageOcars 1� Ttruck
100
� �þ ðCdriverOtruck þ CcargoÞ Ttruck
100
� �LdetourTdetourADT=S
ð1þ vÞtð18Þ
ES ¼ Erun
¼XNmi¼1
Erun;cars 1� Ttruck
100
� �þ Erun;truck
Ttruck
100
� �� �LdetourTdetourADT
ð19Þwhere Nm is the number of traffic disruptions; Crun,cars and Crun,truckare the unit cost of running cars and trucks, respectively; Ttruck is theaverage daily truck traffic ratio; ADT is the average daily traffic;Ldetour is the detour length; and Tdetour is the detour time; Cwage isthe wage compensation for car drivers; Cdriver is the truck drivercompensation; Ccargo is the value of a cargo; Ocars is the average
vehicle occupancies for cars; Otruck is the average vehicle occupan-cies for trucks; S is the speed on detours; regarding the runningemissions, Erun,cars and Erun,truck are CO2 emissions for running carsand trucks respectively. Table 7 summarizes the parameters consid-ered for the evaluation of the societal impact [25].
The costs and emissions associated with the societal impact areadded to the economic and environmental impacts respectively toobtain the total cost (TCms) and CO2 emissions (TEms) due tomaintenance actions:
TCms ¼ Cms þ Cs ð20Þ
TEms ¼ Ems þ Es ð21Þ
4. Life-cycle performance of box-girder road bridges
By combining the initial cost and emissions from Section 2 andthose due to maintenance actions in Section 3, one can evaluate thelife-cycle cost and emissions of bridge designs under consideration.Fig. 3 shows the flowchart followed by the current study for thedetermination of life-cycle cost and emissions. Firstly, the mainte-nance optimization considers the economic, environmental andsocietal impacts of maintenance. The initial cost and emissionsare not considered since the optimal maintenance solutions donot depend on these terms. Then, for the life-cycle evaluation,the initial costs, which include material and construction costsobtained from Section 2, are considered. Note that constructioncosts are incurred at year zero, i.e. present values. For the life-cycle emissions, the CO2 emissions with respect to the materialsand construction can be determined similarly by substituting theunit costs in Eq. (1) with unit emissions:
Eini ¼ Eco � Vco þ Ers �Wrs þ Eps �Wps þ Ef � Af ð22Þwhere the CO2 emissions associated to concrete (Eco), reinforcingsteel (Ers), prestressing steel (Eps) and formwork (Ef) are obtainedfrom the BEDEC database [48]. Table 1 shows these values.
The initial cost and emissions are added to the maintenancecost and emissions in order to obtain the life-cycle cost (TC) andCO2 emissions (TE):
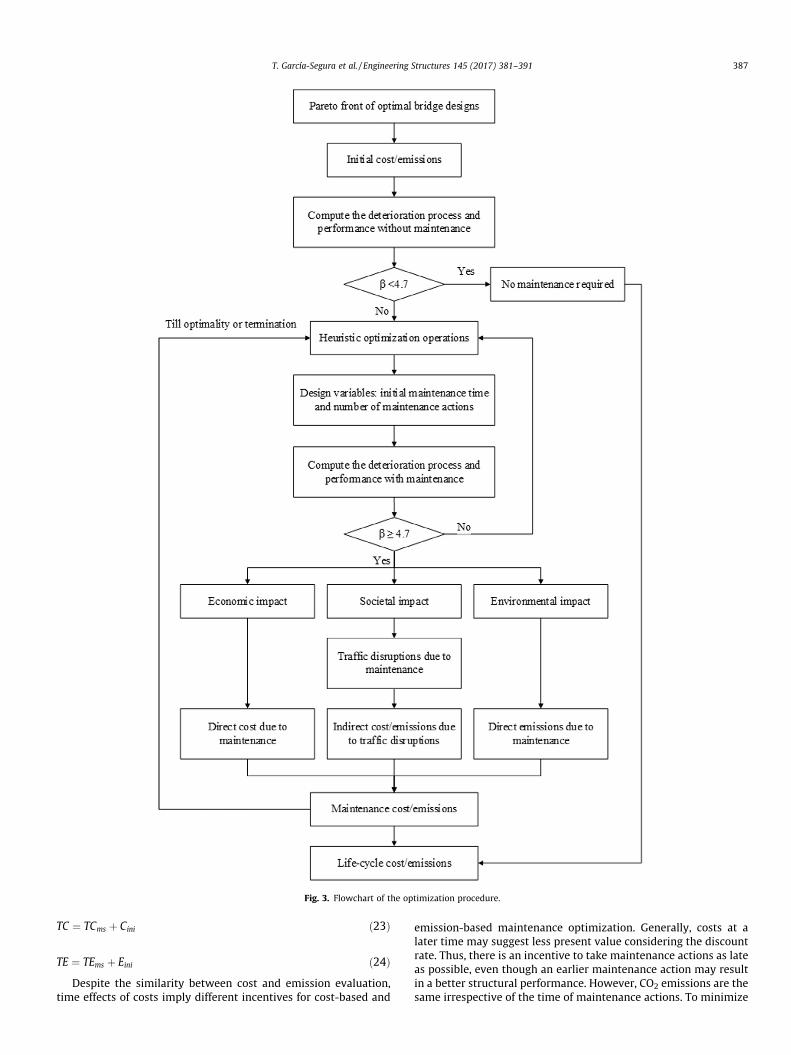
Fig. 3. Flowchart of the optimization procedure.
T. García-Segura et al. / Engineering Structures 145 (2017) 381–391 387
TC ¼ TCms þ Cini ð23Þ
TE ¼ TEms þ Eini ð24ÞDespite the similarity between cost and emission evaluation,
time effects of costs imply different incentives for cost-based and
emission-based maintenance optimization. Generally, costs at alater time may suggest less present value considering the discountrate. Thus, there is an incentive to take maintenance actions as lateas possible, even though an earlier maintenance action may resultin a better structural performance. However, CO2 emissions are thesame irrespective of the time of maintenance actions. To minimize
388 T. García-Segura et al. / Engineering Structures 145 (2017) 381–391
the emissions, the number of maintenance actions should be thesmallest possible. In general, the emission-based optimizationfavors strategies of earlier maintenance actions, while cost-basedoptimization gives incentives to postpone the maintenance actionson both surfaces provided that the postpone does not lead to anincrease of required maintenance actions.
5. Results
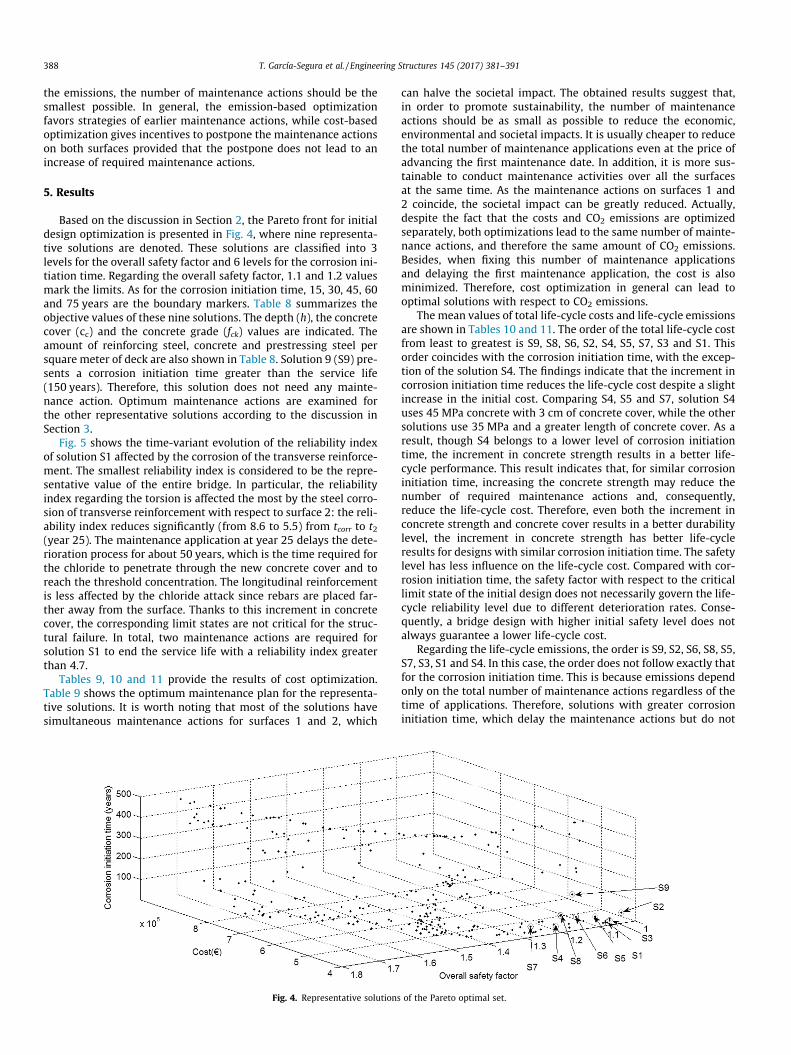
Based on the discussion in Section 2, the Pareto front for initialdesign optimization is presented in Fig. 4, where nine representa-tive solutions are denoted. These solutions are classified into 3levels for the overall safety factor and 6 levels for the corrosion ini-tiation time. Regarding the overall safety factor, 1.1 and 1.2 valuesmark the limits. As for the corrosion initiation time, 15, 30, 45, 60and 75 years are the boundary markers. Table 8 summarizes theobjective values of these nine solutions. The depth (h), the concretecover (cc) and the concrete grade (fck) values are indicated. Theamount of reinforcing steel, concrete and prestressing steel persquare meter of deck are also shown in Table 8. Solution 9 (S9) pre-sents a corrosion initiation time greater than the service life(150 years). Therefore, this solution does not need any mainte-nance action. Optimum maintenance actions are examined forthe other representative solutions according to the discussion inSection 3.
Fig. 5 shows the time-variant evolution of the reliability indexof solution S1 affected by the corrosion of the transverse reinforce-ment. The smallest reliability index is considered to be the repre-sentative value of the entire bridge. In particular, the reliabilityindex regarding the torsion is affected the most by the steel corro-sion of transverse reinforcement with respect to surface 2: the reli-ability index reduces significantly (from 8.6 to 5.5) from tcorr to t2(year 25). The maintenance application at year 25 delays the dete-rioration process for about 50 years, which is the time required forthe chloride to penetrate through the new concrete cover and toreach the threshold concentration. The longitudinal reinforcementis less affected by the chloride attack since rebars are placed far-ther away from the surface. Thanks to this increment in concretecover, the corresponding limit states are not critical for the struc-tural failure. In total, two maintenance actions are required forsolution S1 to end the service life with a reliability index greaterthan 4.7.
Tables 9, 10 and 11 provide the results of cost optimization.Table 9 shows the optimum maintenance plan for the representa-tive solutions. It is worth noting that most of the solutions havesimultaneous maintenance actions for surfaces 1 and 2, which
Fig. 4. Representative solutions
can halve the societal impact. The obtained results suggest that,in order to promote sustainability, the number of maintenanceactions should be as small as possible to reduce the economic,environmental and societal impacts. It is usually cheaper to reducethe total number of maintenance applications even at the price ofadvancing the first maintenance date. In addition, it is more sus-tainable to conduct maintenance activities over all the surfacesat the same time. As the maintenance actions on surfaces 1 and2 coincide, the societal impact can be greatly reduced. Actually,despite the fact that the costs and CO2 emissions are optimizedseparately, both optimizations lead to the same number of mainte-nance actions, and therefore the same amount of CO2 emissions.Besides, when fixing this number of maintenance applicationsand delaying the first maintenance application, the cost is alsominimized. Therefore, cost optimization in general can lead tooptimal solutions with respect to CO2 emissions.
The mean values of total life-cycle costs and life-cycle emissionsare shown in Tables 10 and 11. The order of the total life-cycle costfrom least to greatest is S9, S8, S6, S2, S4, S5, S7, S3 and S1. Thisorder coincides with the corrosion initiation time, with the excep-tion of the solution S4. The findings indicate that the increment incorrosion initiation time reduces the life-cycle cost despite a slightincrease in the initial cost. Comparing S4, S5 and S7, solution S4uses 45 MPa concrete with 3 cm of concrete cover, while the othersolutions use 35 MPa and a greater length of concrete cover. As aresult, though S4 belongs to a lower level of corrosion initiationtime, the increment in concrete strength results in a better life-cycle performance. This result indicates that, for similar corrosioninitiation time, increasing the concrete strength may reduce thenumber of required maintenance actions and, consequently,reduce the life-cycle cost. Therefore, even both the increment inconcrete strength and concrete cover results in a better durabilitylevel, the increment in concrete strength has better life-cycleresults for designs with similar corrosion initiation time. The safetylevel has less influence on the life-cycle cost. Compared with cor-rosion initiation time, the safety factor with respect to the criticallimit state of the initial design does not necessarily govern the life-cycle reliability level due to different deterioration rates. Conse-quently, a bridge design with higher initial safety level does notalways guarantee a lower life-cycle cost.
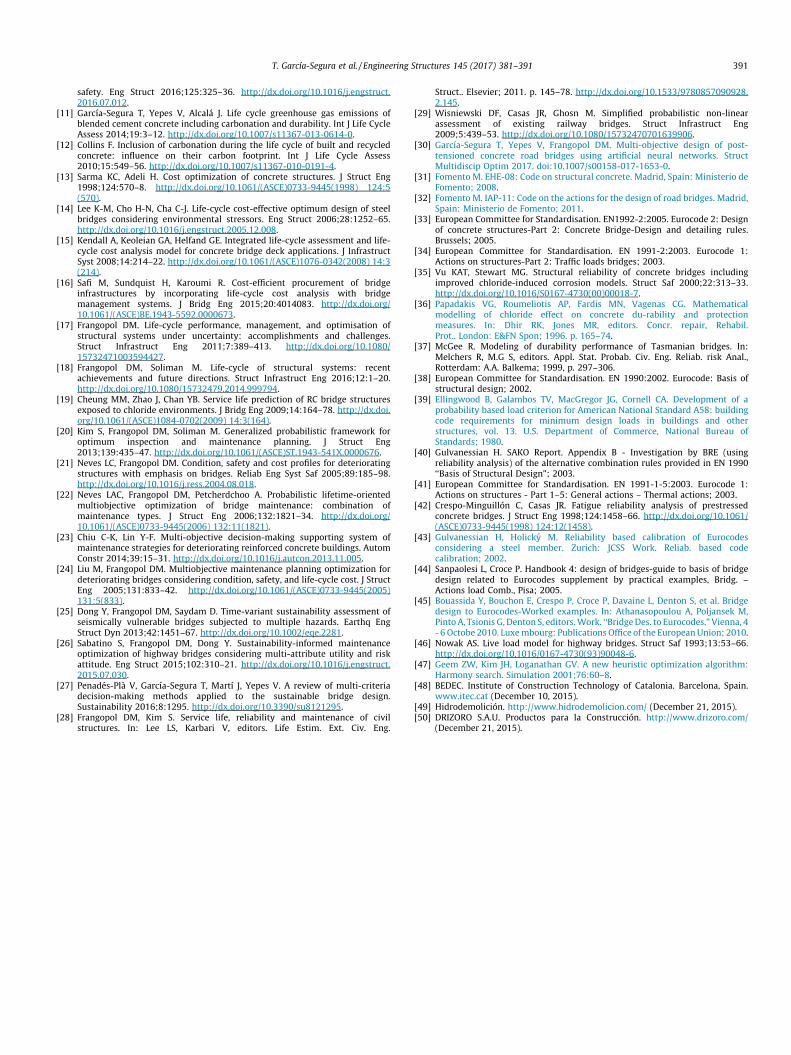
Regarding the life-cycle emissions, the order is S9, S2, S6, S8, S5,S7, S3, S1 and S4. In this case, the order does not follow exactly thatfor the corrosion initiation time. This is because emissions dependonly on the total number of maintenance actions regardless of thetime of applications. Therefore, solutions with greater corrosioninitiation time, which delay the maintenance actions but do not
of the Pareto optimal set.
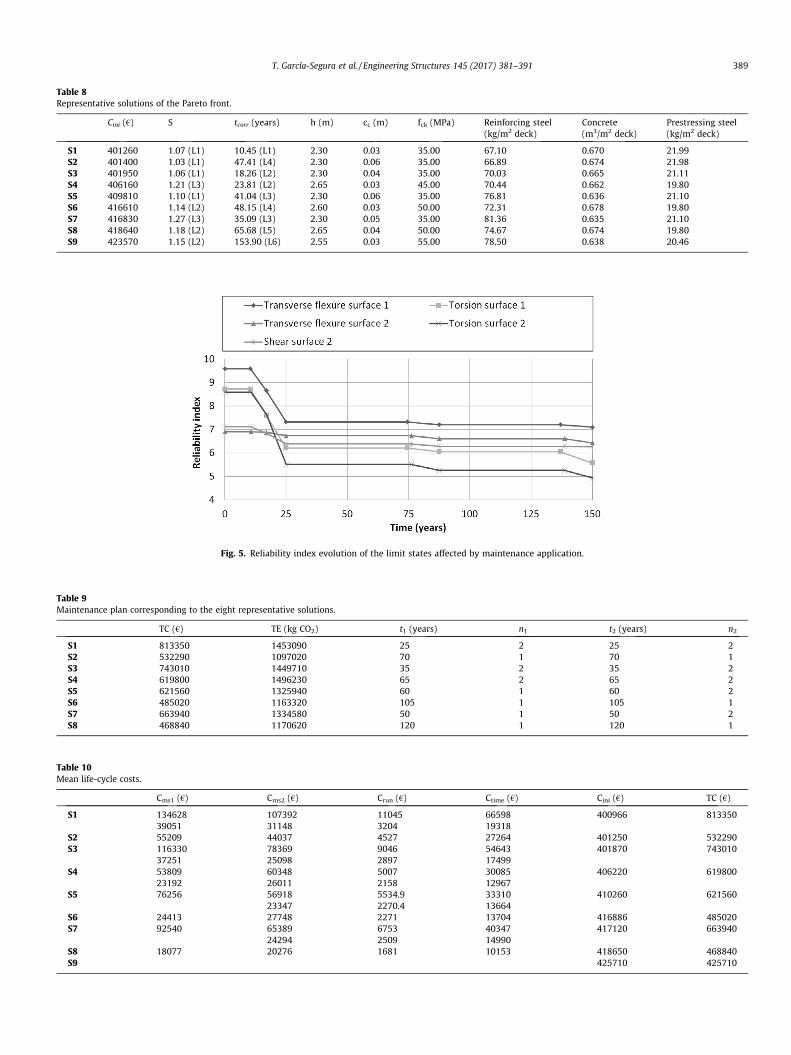
Table 8Representative solutions of the Pareto front.
Cini (€) S tcorr (years) h (m) cc (m) fck (MPa) Reinforcing steel(kg/m2 deck)
Concrete(m3/m2 deck)
Prestressing steel(kg/m2 deck)
S1 401260 1.07 (L1) 10.45 (L1) 2.30 0.03 35.00 67.10 0.670 21.99S2 401400 1.03 (L1) 47.41 (L4) 2.30 0.06 35.00 66.89 0.674 21.98S3 401950 1.06 (L1) 18.26 (L2) 2.30 0.04 35.00 70.03 0.665 21.11S4 406160 1.21 (L3) 23.81 (L2) 2.65 0.03 45.00 70.44 0.662 19.80S5 409810 1.10 (L1) 41.04 (L3) 2.30 0.06 35.00 76.81 0.636 21.10S6 416610 1.14 (L2) 48.15 (L4) 2.60 0.03 50.00 72.31 0.678 19.80S7 416830 1.27 (L3) 35.09 (L3) 2.30 0.05 35.00 81.36 0.635 21.10S8 418640 1.18 (L2) 65.68 (L5) 2.65 0.04 50.00 74.67 0.674 19.80S9 423570 1.15 (L2) 153.90 (L6) 2.55 0.03 55.00 78.50 0.638 20.46
Fig. 5. Reliability index evolution of the limit states affected by maintenance application.
Table 9Maintenance plan corresponding to the eight representative solutions.
TC (€) TE (kg CO2) t1 (years) n1 t2 (years) n2
S1 813350 1453090 25 2 25 2S2 532290 1097020 70 1 70 1S3 743010 1449710 35 2 35 2S4 619800 1496230 65 2 65 2S5 621560 1325940 60 1 60 2S6 485020 1163320 105 1 105 1S7 663940 1334580 50 1 50 2S8 468840 1170620 120 1 120 1
Table 10Mean life-cycle costs.
Cms1 (€) Cms2 (€) Crun (€) Ctime (€) Cini (€) TC (€)
S1 134628 107392 11045 66598 400966 81335039051 31148 3204 19318
S2 55209 44037 4527 27264 401250 532290S3 116330 78369 9046 54643 401870 743010
37251 25098 2897 17499S4 53809 60348 5007 30085 406220 619800
23192 26011 2158 12967S5 76256 56918 5534.9 33310 410260 621560
23347 2270.4 13664S6 24413 27748 2271 13704 416886 485020S7 92540 65389 6753 40347 417120 663940
24294 2509 14990S8 18077 20276 1681 10153 418650 468840S9 425710 425710
T. García-Segura et al. / Engineering Structures 145 (2017) 381–391 389
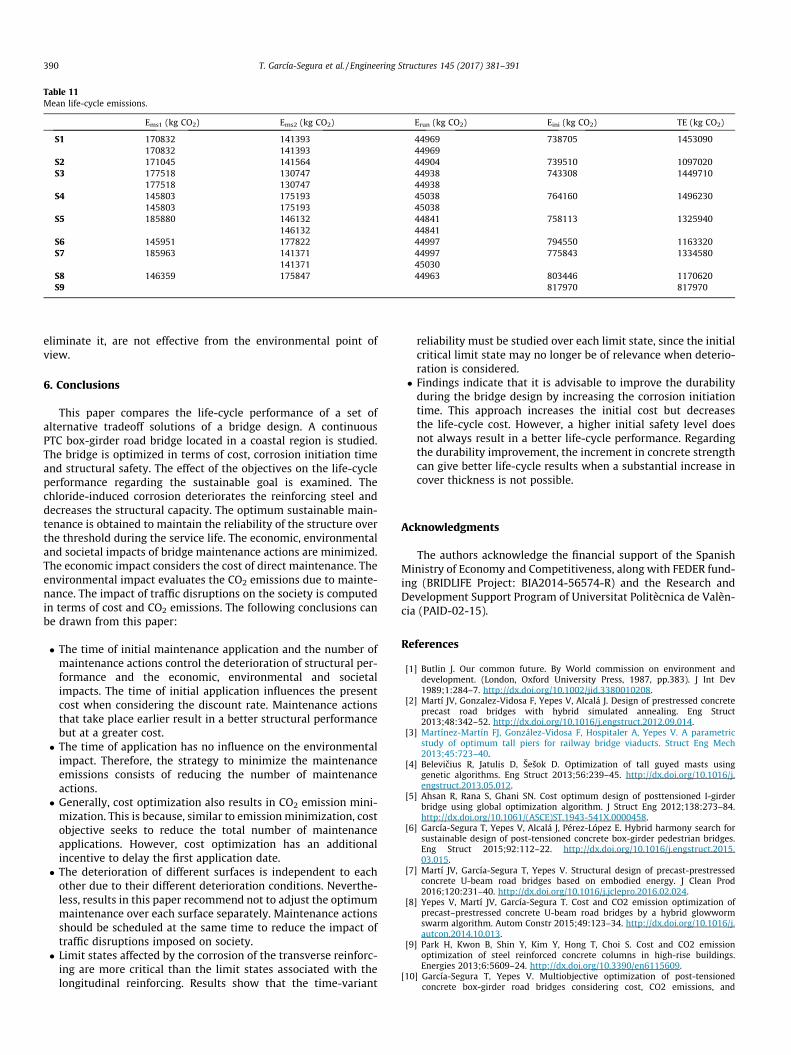
Table 11Mean life-cycle emissions.
Ems1 (kg CO2) Ems2 (kg CO2) Erun (kg CO2) Eini (kg CO2) TE (kg CO2)
S1 170832 141393 44969 738705 1453090170832 141393 44969
S2 171045 141564 44904 739510 1097020S3 177518 130747 44938 743308 1449710
177518 130747 44938S4 145803 175193 45038 764160 1496230
145803 175193 45038S5 185880 146132 44841 758113 1325940
146132 44841S6 145951 177822 44997 794550 1163320S7 185963 141371 44997 775843 1334580
141371 45030S8 146359 175847 44963 803446 1170620S9 817970 817970
390 T. García-Segura et al. / Engineering Structures 145 (2017) 381–391
eliminate it, are not effective from the environmental point ofview.
6. Conclusions
This paper compares the life-cycle performance of a set ofalternative tradeoff solutions of a bridge design. A continuousPTC box-girder road bridge located in a coastal region is studied.The bridge is optimized in terms of cost, corrosion initiation timeand structural safety. The effect of the objectives on the life-cycleperformance regarding the sustainable goal is examined. Thechloride-induced corrosion deteriorates the reinforcing steel anddecreases the structural capacity. The optimum sustainable main-tenance is obtained to maintain the reliability of the structure overthe threshold during the service life. The economic, environmentaland societal impacts of bridge maintenance actions are minimized.The economic impact considers the cost of direct maintenance. Theenvironmental impact evaluates the CO2 emissions due to mainte-nance. The impact of traffic disruptions on the society is computedin terms of cost and CO2 emissions. The following conclusions canbe drawn from this paper:
� The time of initial maintenance application and the number ofmaintenance actions control the deterioration of structural per-formance and the economic, environmental and societalimpacts. The time of initial application influences the presentcost when considering the discount rate. Maintenance actionsthat take place earlier result in a better structural performancebut at a greater cost.
� The time of application has no influence on the environmentalimpact. Therefore, the strategy to minimize the maintenanceemissions consists of reducing the number of maintenanceactions.
� Generally, cost optimization also results in CO2 emission mini-mization. This is because, similar to emission minimization, costobjective seeks to reduce the total number of maintenanceapplications. However, cost optimization has an additionalincentive to delay the first application date.
� The deterioration of different surfaces is independent to eachother due to their different deterioration conditions. Neverthe-less, results in this paper recommend not to adjust the optimummaintenance over each surface separately. Maintenance actionsshould be scheduled at the same time to reduce the impact oftraffic disruptions imposed on society.
� Limit states affected by the corrosion of the transverse reinforc-ing are more critical than the limit states associated with thelongitudinal reinforcing. Results show that the time-variant
reliability must be studied over each limit state, since the initialcritical limit state may no longer be of relevance when deterio-ration is considered.
� Findings indicate that it is advisable to improve the durabilityduring the bridge design by increasing the corrosion initiationtime. This approach increases the initial cost but decreasesthe life-cycle cost. However, a higher initial safety level doesnot always result in a better life-cycle performance. Regardingthe durability improvement, the increment in concrete strengthcan give better life-cycle results when a substantial increase incover thickness is not possible.
Acknowledgments
The authors acknowledge the financial support of the SpanishMinistry of Economy and Competitiveness, along with FEDER fund-ing (BRIDLIFE Project: BIA2014-56574-R) and the Research andDevelopment Support Program of Universitat Politècnica de Valèn-cia (PAID-02-15).
References
[1] Butlin J. Our common future. By World commission on environment anddevelopment. (London, Oxford University Press, 1987, pp.383). J Int Dev1989;1:284–7. http://dx.doi.org/10.1002/jid.3380010208.
[2] Martí JV, Gonzalez-Vidosa F, Yepes V, Alcalá J. Design of prestressed concreteprecast road bridges with hybrid simulated annealing. Eng Struct2013;48:342–52. http://dx.doi.org/10.1016/j.engstruct.2012.09.014.
[3] Martínez-Martín FJ, González-Vidosa F, Hospitaler A, Yepes V. A parametricstudy of optimum tall piers for railway bridge viaducts. Struct Eng Mech2013;45:723–40.
[4] Belevicius R, Jatulis D, Šešok D. Optimization of tall guyed masts usinggenetic algorithms. Eng Struct 2013;56:239–45. http://dx.doi.org/10.1016/j.engstruct.2013.05.012.
[5] Ahsan R, Rana S, Ghani SN. Cost optimum design of posttensioned I-girderbridge using global optimization algorithm. J Struct Eng 2012;138:273–84.http://dx.doi.org/10.1061/(ASCE)ST.1943-541X.0000458.
[6] García-Segura T, Yepes V, Alcalá J, Pérez-López E. Hybrid harmony search forsustainable design of post-tensioned concrete box-girder pedestrian bridges.Eng Struct 2015;92:112–22. http://dx.doi.org/10.1016/j.engstruct.2015.03.015.
[7] Martí JV, García-Segura T, Yepes V. Structural design of precast-prestressedconcrete U-beam road bridges based on embodied energy. J Clean Prod2016;120:231–40. http://dx.doi.org/10.1016/j.jclepro.2016.02.024.
[8] Yepes V, Martí JV, García-Segura T. Cost and CO2 emission optimization ofprecast–prestressed concrete U-beam road bridges by a hybrid glowwormswarm algorithm. Autom Constr 2015;49:123–34. http://dx.doi.org/10.1016/j.autcon.2014.10.013.
[9] Park H, Kwon B, Shin Y, Kim Y, Hong T, Choi S. Cost and CO2 emissionoptimization of steel reinforced concrete columns in high-rise buildings.Energies 2013;6:5609–24. http://dx.doi.org/10.3390/en6115609.
[10] García-Segura T, Yepes V. Multiobjective optimization of post-tensionedconcrete box-girder road bridges considering cost, CO2 emissions, and
T. García-Segura et al. / Engineering Structures 145 (2017) 381–391 391
safety. Eng Struct 2016;125:325–36. http://dx.doi.org/10.1016/j.engstruct.2016.07.012.
[11] García-Segura T, Yepes V, Alcalá J. Life cycle greenhouse gas emissions ofblended cement concrete including carbonation and durability. Int J Life CycleAssess 2014;19:3–12. http://dx.doi.org/10.1007/s11367-013-0614-0.
[12] Collins F. Inclusion of carbonation during the life cycle of built and recycledconcrete: influence on their carbon footprint. Int J Life Cycle Assess2010;15:549–56. http://dx.doi.org/10.1007/s11367-010-0191-4.
[13] Sarma KC, Adeli H. Cost optimization of concrete structures. J Struct Eng1998;124:570–8. http://dx.doi.org/10.1061/(ASCE)0733-9445(1998) 124:5(570).
[14] Lee K-M, Cho H-N, Cha C-J. Life-cycle cost-effective optimum design of steelbridges considering environmental stressors. Eng Struct 2006;28:1252–65.http://dx.doi.org/10.1016/j.engstruct.2005.12.008.
[15] Kendall A, Keoleian GA, Helfand GE. Integrated life-cycle assessment and life-cycle cost analysis model for concrete bridge deck applications. J InfrastructSyst 2008;14:214–22. http://dx.doi.org/10.1061/(ASCE)1076-0342(2008) 14:3(214).
[16] Safi M, Sundquist H, Karoumi R. Cost-efficient procurement of bridgeinfrastructures by incorporating life-cycle cost analysis with bridgemanagement systems. J Bridg Eng 2015;20:4014083. http://dx.doi.org/10.1061/(ASCE)BE.1943-5592.0000673.
[17] Frangopol DM. Life-cycle performance, management, and optimisation ofstructural systems under uncertainty: accomplishments and challenges.Struct Infrastruct Eng 2011;7:389–413. http://dx.doi.org/10.1080/15732471003594427.
[18] Frangopol DM, Soliman M. Life-cycle of structural systems: recentachievements and future directions. Struct Infrastruct Eng 2016;12:1–20.http://dx.doi.org/10.1080/15732479.2014.999794.
[19] Cheung MM, Zhao J, Chan YB. Service life prediction of RC bridge structuresexposed to chloride environments. J Bridg Eng 2009;14:164–78. http://dx.doi.org/10.1061/(ASCE)1084-0702(2009) 14:3(164).
[20] Kim S, Frangopol DM, Soliman M. Generalized probabilistic framework foroptimum inspection and maintenance planning. J Struct Eng2013;139:435–47. http://dx.doi.org/10.1061/(ASCE)ST.1943-541X.0000676.
[21] Neves LC, Frangopol DM. Condition, safety and cost profiles for deterioratingstructures with emphasis on bridges. Reliab Eng Syst Saf 2005;89:185–98.http://dx.doi.org/10.1016/j.ress.2004.08.018.
[22] Neves LAC, Frangopol DM, Petcherdchoo A. Probabilistic lifetime-orientedmultiobjective optimization of bridge maintenance: combination ofmaintenance types. J Struct Eng 2006;132:1821–34. http://dx.doi.org/10.1061/(ASCE)0733-9445(2006) 132:11(1821).
[23] Chiu C-K, Lin Y-F. Multi-objective decision-making supporting system ofmaintenance strategies for deteriorating reinforced concrete buildings. AutomConstr 2014;39:15–31. http://dx.doi.org/10.1016/j.autcon.2013.11.005.
[24] Liu M, Frangopol DM. Multiobjective maintenance planning optimization fordeteriorating bridges considering condition, safety, and life-cycle cost. J StructEng 2005;131:833–42. http://dx.doi.org/10.1061/(ASCE)0733-9445(2005)131:5(833).
[25] Dong Y, Frangopol DM, Saydam D. Time-variant sustainability assessment ofseismically vulnerable bridges subjected to multiple hazards. Earthq EngStruct Dyn 2013;42:1451–67. http://dx.doi.org/10.1002/eqe.2281.
[26] Sabatino S, Frangopol DM, Dong Y. Sustainability-informed maintenanceoptimization of highway bridges considering multi-attribute utility and riskattitude. Eng Struct 2015;102:310–21. http://dx.doi.org/10.1016/j.engstruct.2015.07.030.
[27] Penadés-Plà V, García-Segura T, Martí J, Yepes V. A review of multi-criteriadecision-making methods applied to the sustainable bridge design.Sustainability 2016;8:1295. http://dx.doi.org/10.3390/su8121295.
[28] Frangopol DM, Kim S. Service life, reliability and maintenance of civilstructures. In: Lee LS, Karbari V, editors. Life Estim. Ext. Civ. Eng.
Struct.. Elsevier; 2011. p. 145–78. http://dx.doi.org/10.1533/9780857090928.2.145.
[29] Wisniewski DF, Casas JR, Ghosn M. Simplified probabilistic non-linearassessment of existing railway bridges. Struct Infrastruct Eng2009;5:439–53. http://dx.doi.org/10.1080/15732470701639906.
[30] García-Segura T, Yepes V, Frangopol DM. Multi-objective design of post-tensioned concrete road bridges using artificial neural networks. StructMultidiscip Optim 2017. doi:10.1007/s00158-017-1653-0.
[31] Fomento M. EHE-08: Code on structural concrete. Madrid, Spain: Ministerio deFomento; 2008.
[32] Fomento M. IAP-11: Code on the actions for the design of road bridges. Madrid,Spain: Ministerio de Fomento; 2011.
[33] European Committee for Standardisation. EN1992-2:2005. Eurocode 2: Designof concrete structures-Part 2: Concrete Bridge-Design and detailing rules.Brussels; 2005.
[34] European Committee for Standardisation. EN 1991-2:2003. Eurocode 1:Actions on structures-Part 2: Traffic loads bridges; 2003.
[35] Vu KAT, Stewart MG. Structural reliability of concrete bridges includingimproved chloride-induced corrosion models. Struct Saf 2000;22:313–33.http://dx.doi.org/10.1016/S0167-4730(00)00018-7.
[36] Papadakis VG, Roumeliotis AP, Fardis MN, Vagenas CG. Mathematicalmodelling of chloride effect on concrete du-rability and protectionmeasures. In: Dhir RK, Jones MR, editors. Concr. repair, Rehabil.Prot.. London: E&FN Spon; 1996. p. 165–74.
[37] McGee R. Modeling of durability performance of Tasmanian bridges. In:Melchers R, M.G S, editors. Appl. Stat. Probab. Civ. Eng. Reliab. risk Anal.,Rotterdam: A.A. Balkema; 1999, p. 297–306.
[38] European Committee for Standardisation. EN 1990:2002. Eurocode: Basis ofstructural design; 2002.
[39] Ellingwood B, Galambos TV, MacGregor JG, Cornell CA. Development of aprobability based load criterion for American National Standard A58: buildingcode requirements for minimum design loads in buildings and otherstructures, vol. 13. U.S. Department of Commerce, National Bureau ofStandards; 1980.
[40] Gulvanessian H. SAKO Report. Appendix B - Investigation by BRE (usingreliability analysis) of the alternative combination rules provided in EN 1990‘‘Basis of Structural Design”; 2003.
[41] European Committee for Standardisation. EN 1991-1-5:2003. Eurocode 1:Actions on structures - Part 1–5: General actions – Thermal actions; 2003.
[42] Crespo-Minguillón C, Casas JR. Fatigue reliability analysis of prestressedconcrete bridges. J Struct Eng 1998;124:1458–66. http://dx.doi.org/10.1061/(ASCE)0733-9445(1998) 124:12(1458).
[43] Gulvanessian H, Holicky M. Reliability based calibration of Eurocodesconsidering a steel member. Zurich: JCSS Work. Reliab. based codecalibration; 2002.
[44] Sanpaolesi L, Croce P. Handbook 4: design of bridges-guide to basis of bridgedesign related to Eurocodes supplement by practical examples, Bridg. –Actions load Comb., Pisa; 2005.
[45] Bouassida Y, Bouchon E, Crespo P, Croce P, Davaine L, Denton S, et al. Bridgedesign to Eurocodes-Worked examples. In: Athanasopoulou A, Poljansek M,Pinto A, Tsionis G, Denton S, editors.Work. ‘‘BridgeDes. to Eurocodes,” Vienna, 4- 6 Octobe 2010. Luxembourg: Publications Office of the EuropeanUnion; 2010.
[46] Nowak AS. Live load model for highway bridges. Struct Saf 1993;13:53–66.http://dx.doi.org/10.1016/0167-4730(93)90048-6.
[47] Geem ZW, Kim JH, Loganathan GV. A new heuristic optimization algorithm:Harmony search. Simulation 2001;76:60–8.
[48] BEDEC. Institute of Construction Technology of Catalonia. Barcelona, Spain.www.itec.cat (December 10, 2015).
[49] Hidrodemolición. http://www.hidrodemolicion.com/ (December 21, 2015).[50] DRIZORO S.A.U. Productos para la Construcción. http://www.drizoro.com/
(December 21, 2015).