liftoff model for melcor - sandia.govprod.sandia.gov/techlib/access-control.cgi/2015/156119.pdf ·...
TRANSCRIPT
SANDIA REPORTSAND2015-6119Unlimited ReleasePrinted July 2015
Liftoff Model for MELCOR
Michael F. Young
Prepared bySandia National LaboratoriesAlbuquerque, New Mexico 87185 and Livermore, California 94550
Sandia National Laboratories is a multi-program laboratory managed and operated by Sandia Corporation, a wholly owned subsidiary of Lockheed Martin Corporation, for the U.S. Department of Energy's National Nuclear Security Administration under contract DE-AC04-94AL85000.
Approved for public release; further dissemination unlimited.
Liftoff Model for MELCOR July 2015
2
Issued by Sandia National Laboratories, operated for the United States Department of Energy by Sandia Corporation.
NOTICE: This report was prepared as an account of work sponsored by an agency of the United States Government. Neither the United States Government, nor any agency thereof, nor any of their employees, nor any of their contractors, subcontractors, or their employees, make any warranty, express or implied, or assume any legal liability or responsibility for the accuracy, completeness, or usefulness of any information, apparatus, product, or process disclosed, or represent that its use would not infringe privately owned rights. Reference herein to any specific commercial product, process, or service by trade name, trademark, manufacturer, or otherwise, does not necessarily constitute or imply its endorsement, recommendation, or favoring by the United States Government, any agency thereof, or any of their contractors or subcontractors. The views and opinions expressed herein do not necessarily state or reflect those of the United States Government, any agency thereof, or any of their contractors.
Printed in the United States of America. This report has been reproduced directly from the best available copy.
Available to DOE and DOE contractors from
U.S. Department of Energy
Office of Scientific and Technical Information
P.O. Box 62
Oak Ridge, TN 37831
Telephone: (865) 576-8401
Facsimile: (865) 576-5728
E-Mail: [email protected]
Online ordering: http://www.osti.gov/bridge
Available to the public from
U.S. Department of Commerce
National Technical Information Service
5285 Port Royal Rd.
Springfield, VA 22161
Telephone: (800) 553-6847
Facsimile: (703) 605-6900
E-Mail: [email protected]
Online order: http://www.ntis.gov/help/ordermethods.asp?loc=7-4-0#online
Liftoff Model for MELCOR July 2015
3
SAND2015-6119Unlimited ReleasePrinted July 2015
Liftoff Model for MELCORMichael F. Young
Severe Accident AnalysisSandia National Laboratories
P.O. Box 5800Albuquerque, New Mexico 87185-MS0748
AbstractAerosol particles that deposit on surfaces may be subsequently resuspended by air flowing over the surface. A review of models for this liftoff process is presented and compared to available data. Based on this review, a model that agrees with existing data and is readily computed is presented for incorporation into a system level code such as MELCOR.

Liftoff Model for MELCOR July 2015
4
This page is intentionally blank
Liftoff Model for MELCOR July 2015
5
Contents1. BACKGROUND FOR LIFTOFF MODELS..................................................................9
1.1 MELCOR Approach........................................................................................................92. SUGGESTED MODELS FOR MELCOR....................................................................11
2.1 Force Balance Model .....................................................................................................112.2 Surface Roughness.........................................................................................................122.3 Modified Force Balance Model .....................................................................................132.4 Comparison to STORM Experiments............................................................................15
2.4.1 Calculation of Liftoff Fraction.........................................................................152.4.2 Results..............................................................................................................16
2.5 Comparison to Reeks and Hall Experiments .................................................................172.5.1 Description of Experiment...............................................................................172.5.2 Results..............................................................................................................182.5.3 Discussion of Results.......................................................................................19
2.6 Comparison to Braaten Experiments .............................................................................202.6.1 Results..............................................................................................................20
2.7 Comparison to ORNL Experiments...............................................................................202.7.1 Description of Experiment...............................................................................212.7.1 Results..............................................................................................................21
3. OTHER LIFTOFF MODELS .......................................................................................253.1 Reeks-Hall Model ............................................................................................253.1.1 Derivation ........................................................................................................253.1.2 Discussion........................................................................................................27
3.2 Biasi Model....................................................................................................................273.2.1 Derivation ........................................................................................................273.2.2 Discussion........................................................................................................27
3.3 ECART Model...............................................................................................................294. DISCUSSION OF MODELS........................................................................................315. ADDITIONAL FEATURES NEEDED FOR THE BASIC LIFTOFF MODEL FOR MELCOR.......................................................................................................................................336. REFERENCES..............................................................................................................35
Liftoff Model for MELCOR July 2015
6
Figures
Figure 1. Comparison of force balance model to STORM data. ...................................................16Figure 2. Comparison of model with zinc experiments.................................................................21Figure 3. Comparison of model with iron oxide experiments. ......................................................21Figure 4. Comparison of model with tin oxide experiments. ........................................................22Figure 5. Comparison of model with manganese experiment. ......................................................22
Tables
Table 1. Comparison of modified force balance model and Reeks-Hall data. ..............................18Table 2. Comparison of Braaten with force balance model. .........................................................19
Liftoff Model for MELCOR July 2015
7
Nomenclature
AMMD Aerodynamic Mass Median DiameterDOE Department of EnergyGMD Geometric Mean DiameterGSD Geometric Standard DeviationHTGR High Temperature Gas ReactorNRC Nuclear Regulatory CommissionORNL Oak Ridge National LaboratoryRMS Root Mean SquareSNL Sandia National LaboratoriesSTP Standard Temperature and Pressure

Liftoff Model for MELCOR July 2015
8
This page is intentionally blank
Liftoff Model for MELCOR July 2015
9
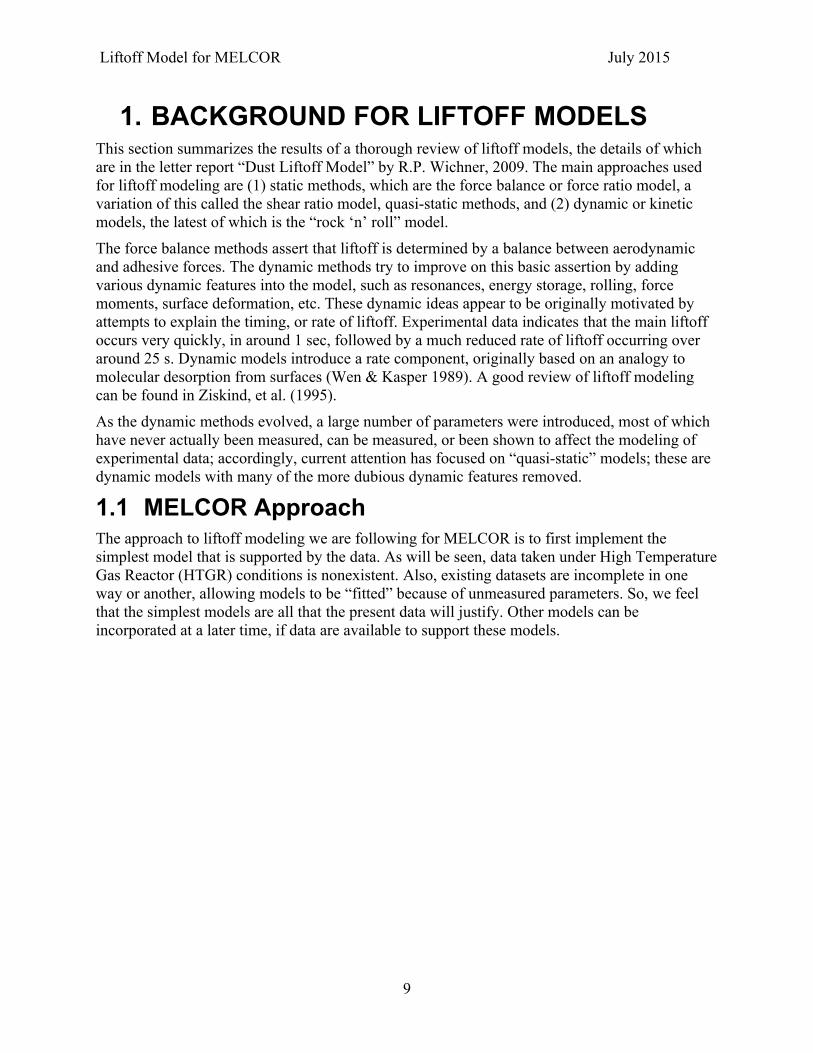
1. BACKGROUND FOR LIFTOFF MODELS This section summarizes the results of a thorough review of liftoff models, the details of which are in the letter report “Dust Liftoff Model” by R.P. Wichner, 2009. The main approaches used for liftoff modeling are (1) static methods, which are the force balance or force ratio model, a variation of this called the shear ratio model, quasi-static methods, and (2) dynamic or kinetic models, the latest of which is the “rock ‘n’ roll” model.The force balance methods assert that liftoff is determined by a balance between aerodynamic and adhesive forces. The dynamic methods try to improve on this basic assertion by adding various dynamic features into the model, such as resonances, energy storage, rolling, force moments, surface deformation, etc. These dynamic ideas appear to be originally motivated by attempts to explain the timing, or rate of liftoff. Experimental data indicates that the main liftoff occurs very quickly, in around 1 sec, followed by a much reduced rate of liftoff occurring over around 25 s. Dynamic models introduce a rate component, originally based on an analogy to molecular desorption from surfaces (Wen & Kasper 1989). A good review of liftoff modeling can be found in Ziskind, et al. (1995).As the dynamic methods evolved, a large number of parameters were introduced, most of which have never actually been measured, can be measured, or been shown to affect the modeling of experimental data; accordingly, current attention has focused on “quasi-static” models; these are dynamic models with many of the more dubious dynamic features removed.
1.1 MELCOR ApproachThe approach to liftoff modeling we are following for MELCOR is to first implement the simplest model that is supported by the data. As will be seen, data taken under High Temperature Gas Reactor (HTGR) conditions is nonexistent. Also, existing datasets are incomplete in one way or another, allowing models to be “fitted” because of unmeasured parameters. So, we feel that the simplest models are all that the present data will justify. Other models can be incorporated at a later time, if data are available to support these models.

Liftoff Model for MELCOR July 2015
10
This page is intentionally blank
Liftoff Model for MELCOR July 2015
11
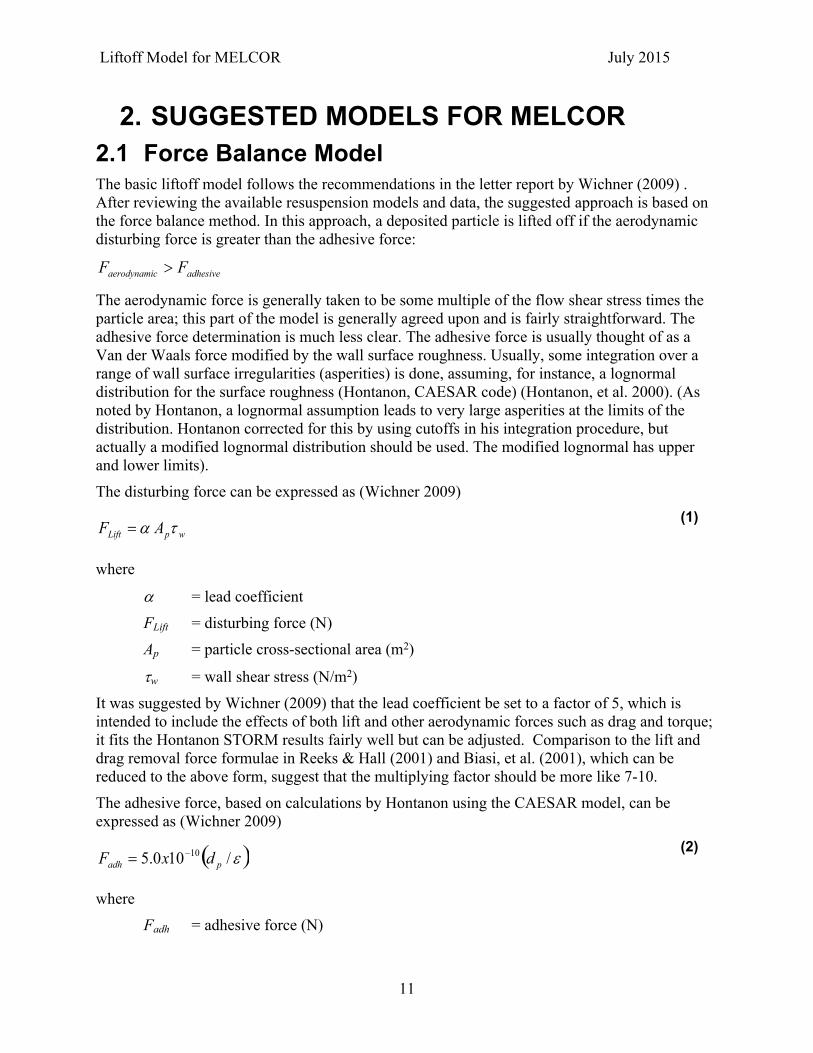
2. SUGGESTED MODELS FOR MELCOR2.1 Force Balance ModelThe basic liftoff model follows the recommendations in the letter report by Wichner (2009) . After reviewing the available resuspension models and data, the suggested approach is based on the force balance method. In this approach, a deposited particle is lifted off if the aerodynamic disturbing force is greater than the adhesive force:
adhesivecaerodynami FF
The aerodynamic force is generally taken to be some multiple of the flow shear stress times the particle area; this part of the model is generally agreed upon and is fairly straightforward. The adhesive force determination is much less clear. The adhesive force is usually thought of as a Van der Waals force modified by the wall surface roughness. Usually, some integration over a range of wall surface irregularities (asperities) is done, assuming, for instance, a lognormal distribution for the surface roughness (Hontanon, CAESAR code) (Hontanon, et al. 2000). (As noted by Hontanon, a lognormal assumption leads to very large asperities at the limits of the distribution. Hontanon corrected for this by using cutoffs in his integration procedure, but actually a modified lognormal distribution should be used. The modified lognormal has upper and lower limits).The disturbing force can be expressed as (Wichner 2009)
wpLift AF (1)
where
= lead coefficientFLift = disturbing force (N)Ap = particle cross-sectional area (m2)
w = wall shear stress (N/m2)It was suggested by Wichner (2009) that the lead coefficient be set to a factor of 5, which is intended to include the effects of both lift and other aerodynamic forces such as drag and torque; it fits the Hontanon STORM results fairly well but can be adjusted. Comparison to the lift and drag removal force formulae in Reeks & Hall (2001) and Biasi, et al. (2001), which can be reduced to the above form, suggest that the multiplying factor should be more like 7-10.The adhesive force, based on calculations by Hontanon using the CAESAR model, can be expressed as (Wichner 2009)
/100.5 10padh dxF
(2)
whereFadh = adhesive force (N)
Liftoff Model for MELCOR July 2015
12
dp = particle diameter (m)
= mean surface roughness (m)This equation is based on Hontanon’s calculations for the STORM experiments (his Fig. 4), and again the lead coefficient can be adjusted. Note that the lead multiplying constant should probably change based on the particle material/wall material combination, although Biasi suggests that this is a secondary effect. The STORM experimental data are for SnO2 particles on steel walls. The surface roughness range examined by Hontanon was 0.5 to 5 m.The force balance model is a static model, so does not give any timing for liftoff. However, experimental results consistently show a large initial liftoff amount completed in under 1 s, followed by some much lower liftoff amount, usually completed in under 25 s. If a rate is desired, experimental results can be used to give a good estimate of the liftoff time; otherwise, instantaneous liftoff is probably a good approximation for use in MELCOR.The above equations can be rearranged to give a minimum diameter for particles that will lift off for a given set of hydrodynamic conditions. Presumably, all particles with a greater diameter will lift off, and this range of particle sizes gives the liftoff fraction, given the deposited particle size distribution. Using eqn (2) for adhesive force and eqn (1) for lift force, we can get
wcrit xd /104 10(3)
The wall shear stress w can be expressed as
2
21 Ufw
wheref = friction factor
= gas density (kg/m3)U = gas velocity (m/s)
In the above equation, the friction factor is calculated using the Blasius formula (Bird, et al. 1960)
25.0Re0791.0
f
where Re is the flow Reynold’s number
DU
Re
and D is the hydraulic diameter (m).
2.2 Surface RoughnessValues for roughness of pipe depend on the manufacturing method and whether or not the surface was polished. Large pipes are usually made of hot-rolled plate with a welded seam;
Liftoff Model for MELCOR July 2015
13
Marks’ ME Handbook (Avallone, et al. 2007) gives probable values for roughness as 12.5-25 m. Smaller pipes made by seamless extrusion are in the 1.8-3.2 m range. Polishing using standard grits can reduce surface roughness down to a minimum of about 0.01 m, which would be a mirror finish.
2.3 Modified Force Balance ModelThe basic force balance model as suggested by Wichner (2009) gives good results when compared to the STORM experiments, which were fairly large, multilayer deposit tests. However, after comparing to small laboratory-scale experiments by Reeks & Hall (2001) and Braaten (1994), it became apparent that the basic lift force eqn (1) was incomplete. These small scale experiments were of monolayer-or-less deposits on a polished plate, using fairly large particles; the adhesive force was measured directly via a centrifuge, and the liftoff experiments were done in small wind tunnel apparatus.The problem is that the aerodynamic disturbing force as given by eqn (1) is much less than the measured normal adhesive force, even with the lead coefficient of 5-10 accounting for drag. The implication, as noted in Ziskind, et al. 1995, is that resuspension is due to another mechanism besides simple lift force. The current thinking is that rolling is the mechanism. Surprisingly, the comparison of the basic force balance model to these experiments in terms of predicting the minimum critical diameter and friction velocity was actually pretty good, even with the above noted discrepancy in the removal force.The removal force derived in Reeks-Hall, based on force couples, gives a total removal force
DLR FarFF
21
(4)
whereFR = removal force (N),
FL = normal lift force (N),
FD = drag force (N),
r = particle radius (m),
a = distance between asperities (m).
The important difference between this expression and eqn (1) is the multiplier on the drag force term, r/a, termed the “geometry factor” in Reeks-Hall.The ratio r/a is given as ~100 in Reeks-Hall, based on centrifuge measurements of the normal and tangential removal forces. This is consistent with 10-30 m particles on a polished surface, since a is related to . The point is that 100 is much greater than 5 as in eqn (1), and in fact multiples the lead coefficient of the drag force. Note that this ratio r/a will be considerably different for a rough pipe wall or multilayer deposit, as in the STORM or Oak Ridge National Laboratory (ORNL) experiments, and will probably be closer to 1 in magnitude for those experiments.
Liftoff Model for MELCOR July 2015
14
The implication of this is that the original force balance model lift force formula is incomplete and should include a term r/a. The formula for the lift force suggested by Reeks-Hall is due to measurements of the lift force in turbulent flow by Reeks & Hall, 2001.
31.2*
2 9.20
ruFL (5)
where
= mean lift force (N)LF
= kinematic viscosity (m2/s)
u* = friction velocity = (m/s). /w
The expression suggested by Reeks-Hall for the mean drag force is due to O’Neill (1968)2*
2 32
ruFD (6)
As shown by Wichner, 2009, the formulae for lift and drag suggested by Reeks-Hall can be recast in the same form as eqn (1), and the new expression for removal force is then
wpp
R A2.104d
33.3F
(7)
where dp/4 has been substituted for r/a, assuming that the asperity distance a is about 2, and the exponent 2.31 in the lift force eqn (5) has been replaced by 2. A short literature review finds examples of lift force correlations with exponents ranging from 1.53 to 2.31; dimensional analysis suggests the value of 2.
Using the value of 5 m for the roughness and noting that the geometric mean diameter in the STORM experiments is 0.434 m, the coefficient in the above expression is 3.8, comparable to the lead coefficient of 5 in the original model lift force, eqn (1).If we neglect the first term in comparison to the second and equate this to the adhesion force, eqn (2), we can again solve for a minimum critical diameter for liftoff, as before:
wcrit
xd
10108
(8)
This can be compared to eqn (3); the important points to note are that there is no dependence on for this approximation, and there is actually a square dependence on dp; this explains the strange result that the original formula with = 5 m was a pretty good match for both the small-scale laboratory data and for the STORM data; was of the same magnitude as dp. The value for the minimum diameter using the full expression in eqn (7) is
Liftoff Model for MELCOR July 2015
15
bx
ba
bad
wcrit
92 10822
wherea = 3.33
b = 10.2
It should be noted that the results for the small-scale laboratory experiments are only applicable for validation of aspects of the liftoff model – it is unlikely that we are going to encounter mirror-polished surfaces under HTGR conditions.
2.4 Comparison to STORM ExperimentsThe force balance model was compared to STORM experiments SR09, SR11, SR12, and SR13 using data from Hontanon (2000), Biasi, et al. (2001), and Bujan, et al. (2010), and shows generally good agreement. The deposited particles were assumed to have a lognormal distribution with the same distribution as that measured for the exit flow during deposition (Bujan, et al. 2010). This gave the GMD (Geometric Mean Diameter) as 0.434 m and the GSD (Geometric Standard Deviation) as 7.1 m. Note that Hontanon (2000) used instead the measured values from the resuspended particles and assumed that the deposit had the same distribution; this is probably wrong.The STORM experimenters did not measure the roughness of the pipe surface in their experiments but suggested that the roughness of the pipe surface should be around 1 m (Hontanon, et al. 2000); this is a value that would be typical of a smooth, somewhat- polished surface; I think that probably the pipe in the STORM experiments was in fact not polished and that a more typical value would be around 5 m. Also, for a multi-layered deposit, the “roughness” seen by a particle in the top layers is probably more like the average particle diameter, here ~1 m. In the comparison of the force balance model to the STORM experiments, the best fit was found when the lead coefficient in eqn (3) for dcrit was lowered to 2x10⁻¹⁰ and a surface roughness of 5 m was used, which implies that the lead coefficient in the lift force, eqn (1), is more like 10 than 5.The velocities used were those given by Biasi, Table 4 (Biasi, et al. 2001), and the Reynolds numbers were calculated with gas properties for N2 using gas temperatures given in Bujan, et al., (2010).
2.4.1 Calculation of Liftoff FractionFor comparison to STORM, we will need the mass fraction, as the experimental measurements are in terms of mass. The deposited particles are assumed to have a lognormal distribution (Friedlander 2000)
2
2
ln2
lnln
inf
ln2g
gp dd
gppd e
dNdn
where
Liftoff Model for MELCOR July 2015
16
nd(dp) = number density for particle of diameter dp
Ninf = Normalization factor = 1dp = particle diameter (m)dg = geometric mean diameter (m)
g = geometric standard deviation (m2)
The third moment of the distribution, the integral from 0 to of dp3 weighted with the lognormal
distribution nd(dp), is related to the volume or mass concentration of the particles:
0
33 )(66 ppd dddn
M
where
= volume concentration, total particle volume per unit volume
M3 = third moment of the distribution
The volume concentration is related to the particle mass concentration by the density of the material in the particles, in this case SnO2.The mass fraction removed or lifted off is then the integral of the lognormal-weighted dp
3 from the critical diameter dcrit, gotten from the force balance model, to infinity, divided by the total concentration:
critdppd
lift
dddnf
3
where flift is the liftoff or removal mass fraction for the given dcrit.2.4.2 Results
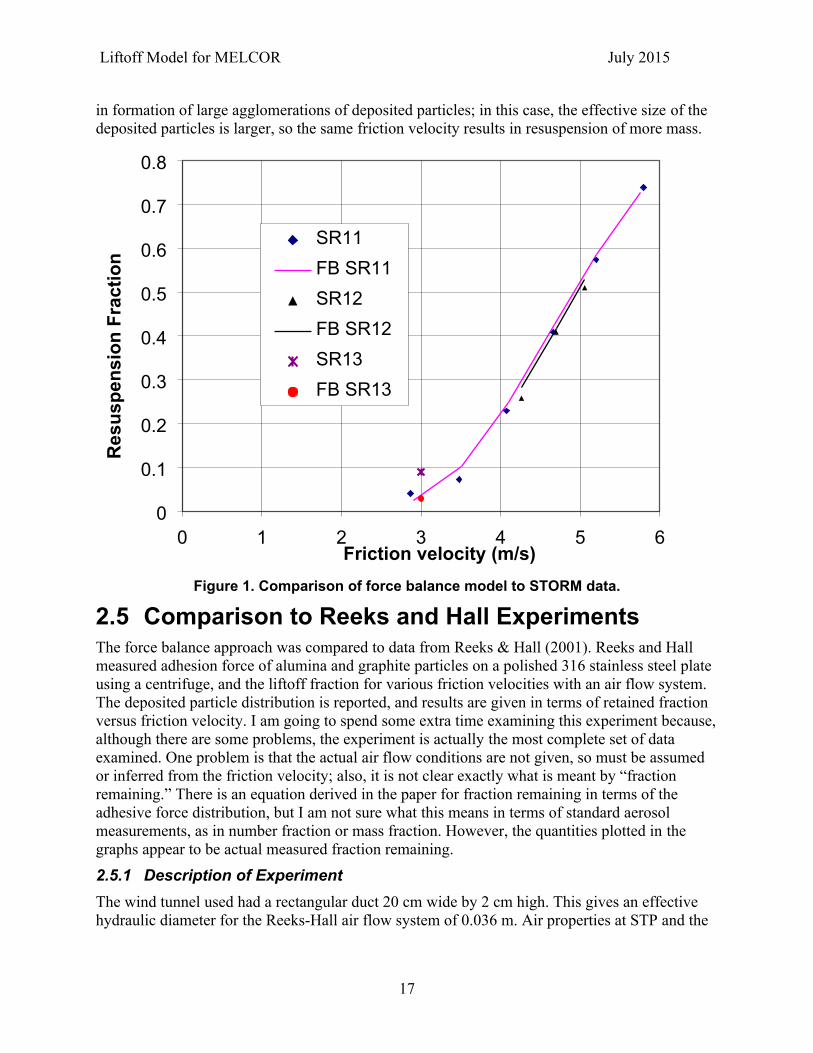
The SR11 and SR12 results agree very well with the force balance model. Results are shown in Figure 1 below. Biasi et al. has a similar plot as his Fig.17; however, the points for test SR12 seem to be misplotted in that paper, as the friction velocity for the points in the plot do not agree with the experimental parameters.The SR09 experimental result does not agree with the liftoff model. However, data from this experiment does not agree with any of the other STORM experiments under similar flow conditions, so something else must be going on in this experiment. The liftoff fraction in SR09 was 30%, whereas similar flow conditions in the other STORM experiments, and the force balance model, indicate that it should be about 1%. One possibility is that, since these are thick dust deposits, that the deposited layer is more prone to surface disturbance by the flow than if it were a monolayer, i.e., the flow kicks up waves in the deposit that can catch the flow. The post-resuspension radiographs from the SR09 report (Dilara, 1998) show remaining deposit patterns in the test section after the resuspension phase that are suggestive of large scale turbulence effects. Another possibility is that this test was done under conditions of high humidity, resulting
Liftoff Model for MELCOR July 2015
17
in formation of large agglomerations of deposited particles; in this case, the effective size of the deposited particles is larger, so the same friction velocity results in resuspension of more mass.
0 1 2 3 4 5 60
0.1
0.2
0.3
0.4
0.5
0.6
0.7
0.8
SR11FB SR11SR12FB SR12SR13FB SR13
Friction velocity (m/s)
Res
uspe
nsio
n Fr
actio
n
Figure 1. Comparison of force balance model to STORM data.
2.5 Comparison to Reeks and Hall ExperimentsThe force balance approach was compared to data from Reeks & Hall (2001). Reeks and Hall measured adhesion force of alumina and graphite particles on a polished 316 stainless steel plate using a centrifuge, and the liftoff fraction for various friction velocities with an air flow system. The deposited particle distribution is reported, and results are given in terms of retained fraction versus friction velocity. I am going to spend some extra time examining this experiment because, although there are some problems, the experiment is actually the most complete set of data examined. One problem is that the actual air flow conditions are not given, so must be assumed or inferred from the friction velocity; also, it is not clear exactly what is meant by “fraction remaining.” There is an equation derived in the paper for fraction remaining in terms of the adhesive force distribution, but I am not sure what this means in terms of standard aerosol measurements, as in number fraction or mass fraction. However, the quantities plotted in the graphs appear to be actual measured fraction remaining.2.5.1 Description of ExperimentThe wind tunnel used had a rectangular duct 20 cm wide by 2 cm high. This gives an effective hydraulic diameter for the Reeks-Hall air flow system of 0.036 m. Air properties at STP and the
Liftoff Model for MELCOR July 2015
18
Blasius formula were then used to get the bulk flow velocity and wall shear stress from the experimental friction velocity.In the Reeks-Hall experiments, the experimental method described measures the fraction removed via an optical particle-counting method, so the model comparison would be to the particle number fraction, rather than to the mass fraction as in the STORM experiments. The number fraction is related to the zeroth moment of the lognormal distribution as
0
critdpd
lift
ddnf
where the denominator 0 is the normalization factor for the zeroth moment given by
.
0
0 pd ddn
2.5.2 ResultsThe friction velocity at the midpoint of the data (the 0.5 fraction remaining point) in the Reeks and Hall experiments can be matched using the modified force balance model with = 0.04 m. This value of was chosen to match the 0.5 removal fraction adhesive force measurements from the centrifuge. The modified force balance model can be rearranged to solve for the wall shear stress at a given diameter:
4
14105 10
dbadx
w
This together with the definition of the friction velocity u* gives u* at the 0.5 fraction diameter.The range of liftoff calculated is much narrower than in the Reeks and Hall paper, covering only the diameter range for the deposited particle distribution. The reason for this is that the basic force balance model does not consider a distribution of liftoff forces or, more importantly, a distribution of adhesive forces, so gives a single adhesive force and removal force for a given particle size. The range of minimum particle diameters versus liftoff force that will remove particles is then the same as the range of actual deposited particle sizes, which in this experiment are basically mono-dispersed.In the Reeks-Hall experiments, there is a fairly wide distribution of adhesive forces measured for the deposited particles, as seen from the plots of remaining fraction versus centrifuge speed. In these experiments, the adhesive force has a wider distribution than the deposited particle distribution, which is basically mono-dispersed; hence, liftoff forces corresponding to particle diameters above and below the actual deposited particle distribution cause some liftoff. This effect is not seen in cases where the deposited particle distribution is wide, as in the STORM experiments.The wide distribution of adhesive force in Reeks-Hall for a given particle size was remarked by Biasi, et al. (2001), and a distribution of adhesive force is seen in other centrifuge and ultrasonic adhesion experiments Mullins, et al. (1992) and Braaton (1994). Usually the 0.5 fraction point is
Liftoff Model for MELCOR July 2015
19
taken as the liftoff force required, as suggested for instance by Mullins, et al. (1992). In the Reeks-Hall paper, it was attempted to match the model to the entire range of liftoff forces. In looking at the actual paper, the rock ‘n’ roll model does not give a very good match to the data. The correlation developed by Biasi, et al. (2001) is actually a better match to the experimental data, and the force balance model also gives a better match to the 0.5 removal fraction, as seen in Table 1.
Table 1. Comparison of modified force balance model and Reeks-Hall data.
Particle type Geometric mean diameter (m)
u* for 0.5 removal-expt avg. of runs (m/s)
u* for 0.5 removal-modified model (m/s)
u* for 0.5 removal-Reeks-Hall (m/s)
10m alumina 12.2 0.862 0.82 1.7
20m alumina 23 0.532 0.56 1.0
Graphite 13 1.32 1.0 3.0
There is also the question of why there is such a wide distribution of adhesive forces in the Reeks-Hall experiments. One possibility is that the wide distribution is a result of the dominance of removal due to rolling particles, resulting from the experimental conditions: fairly large, 10 m and up particles on a polished steel surface. This type of experiment is very sensitive to the alignment of the plate in the centrifuge, as is remarked by Reeks & Hall (2001), and a slight misalignment could cause a large change in the apparent adhesive force, since the tangential force for removal is around 1/100 of the normal force.2.5.3 Discussion of ResultsIf we calculate the actual surface adhesion force with the force balance model using eqn (2) for, say, the 10 m alumina particles, using a 5 m roughness, we get 1.2x10⁻⁹ N; this is much less than the measured adhesive force. The mean normal adhesion force measured using the centrifuge, according to the Reeks-Hall paper, was 4x10⁻⁷ N (theoretical smooth surface JKR value divided by the reduction factor of 37, Tables 3 and 4 in the paper). This data is actually from centrifuge measurements by Reed & Rochowiak (1988). Reeks-Hall indicate that they regard these measurements as more reliable than theirs, feeling that the large variation in their measured force reduction factors was a result of misalignment of the plate in the centrifuge. However, if we use the 0.5 point and the average of the centrifuge data, as also done by Biasi, we get an adhesive force of 1.44x10⁻⁷ N and a reduction factor of 112. To get this value for the adhesive force with eqn (2) for the 10 µm particles (12.2 µm GMD) requires an of 0.04. A comparison of the Biasi correlation to the CAESAR model stated that the Biasi correlation matches the CAESAR-calculated adhesive force at ~ 0.07 m. Reed and Rochowiak measured the surface roughness of the polished steel plate used in their experiments and stated that the “roughness was <0.08 µm”.The other side of the equation is that the removal force at the 0.5 removal point must match the mean adhesive force. The removal force given by eqn (7) equals the average mean adhesive force at u* = 1.15 m/s, using the assumption that the asperity distance is 2 and that is 0.04 µm.
Liftoff Model for MELCOR July 2015
20
If we assume that the asperity distance is more like , then u* = 0.82 m/s. Note that to match the mean adhesive force using a reduction factor of 37, either the roughness must be smaller or the friction velocity must be higher. This is the reason that the Reeks-Hall model removal fraction curve is to the right of the measured wind-tunnel data for the removal fraction: the Reed-Rochowiak reduction factor of 37 was used in the model, rather than the reduction factor from their own experiment.
2.6 Comparison to Braaten ExperimentsThe model was compared to experimental data collected by Braaten (2009). These experiments used fairly large particles deposited on glass plates, and an optical counting method, similar to the Reeks-Hall experiments. Adhesion force measurements were conducted in a centrifuge, and the amount of force necessary to remove the particles from a glass plate determined from the centrifuge speed. Wind tunnel tests were then performed to measure the removal fraction versus friction velocity. As in Reeks-Hall, the fraction of particles lifted off is a statistical process, so both the 0.5 fraction liftoff point and the total liftoff point were reported. However, the size distribution of the particles was not given, so the data on fraction removed versus friction velocity at other than the 0.5 fraction point is of no use in comparing to the force balance model. We also have the problem of assuming a roughness for a glass slide, since this is not measured.The normal adhesive force measured in the centrifuge compared to that calculated with eqn (2) indicates a small value for the surface roughness of the glass slide. A value of ~0.2 m gives fairly good agreement with the measured adhesive force.2.6.1 ResultsThe friction velocity at the 0.5 removal point was compared with the model velocity for the mean diameter of the particles, which in this case were mono-disperse. The best fit was obtained with the lead coefficient for the adhesive force reduced to 1.7x10⁻¹⁰. This gave the results in Table 2.
Table 2. Comparison of Braaten with force balance model.
Particle type Mean diameter (m) u* for 0.5 removal-expt (m/s)
u* for 0.5 removal-modified FB model (m/s)
Lycopodium 28 0.271 0.3
Timothy pollen 34 0.37 0.248
Microballoons 30 0.297 0.28
Glass spheres 20 0.613 0.42
Nickel spheres 18 0.422 0.466
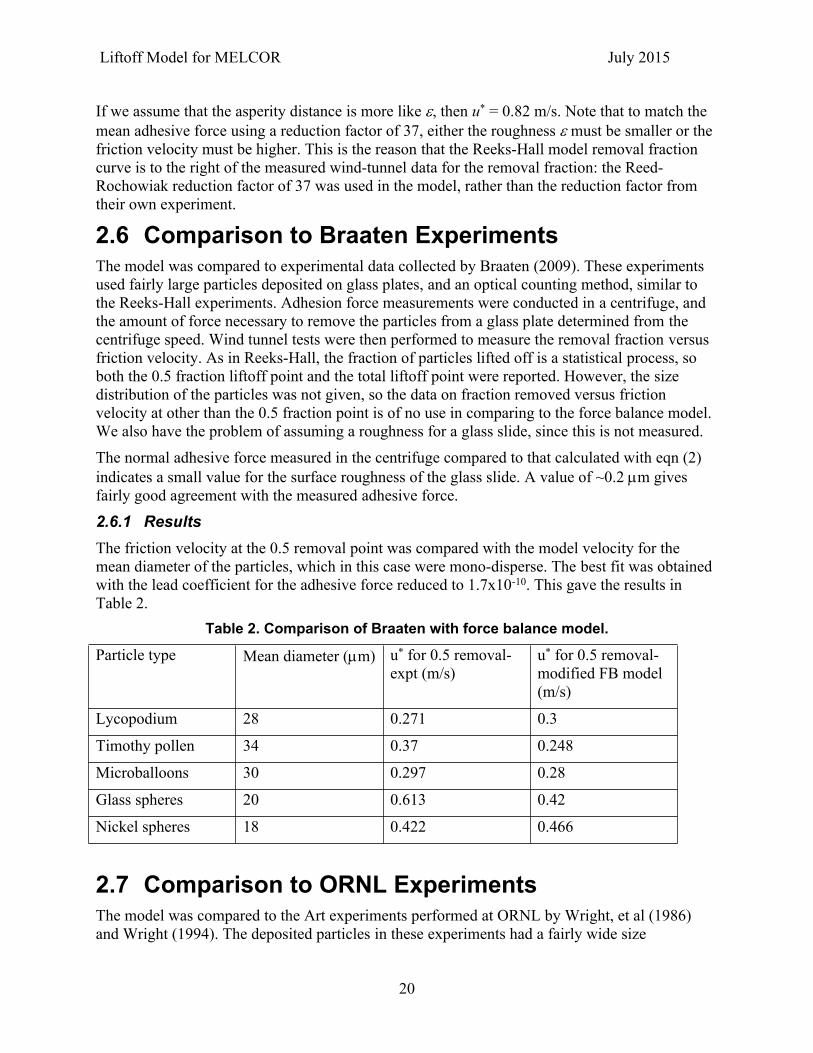
2.7 Comparison to ORNL ExperimentsThe model was compared to the Art experiments performed at ORNL by Wright, et al (1986) and Wright (1994). The deposited particles in these experiments had a fairly wide size
Liftoff Model for MELCOR July 2015
21
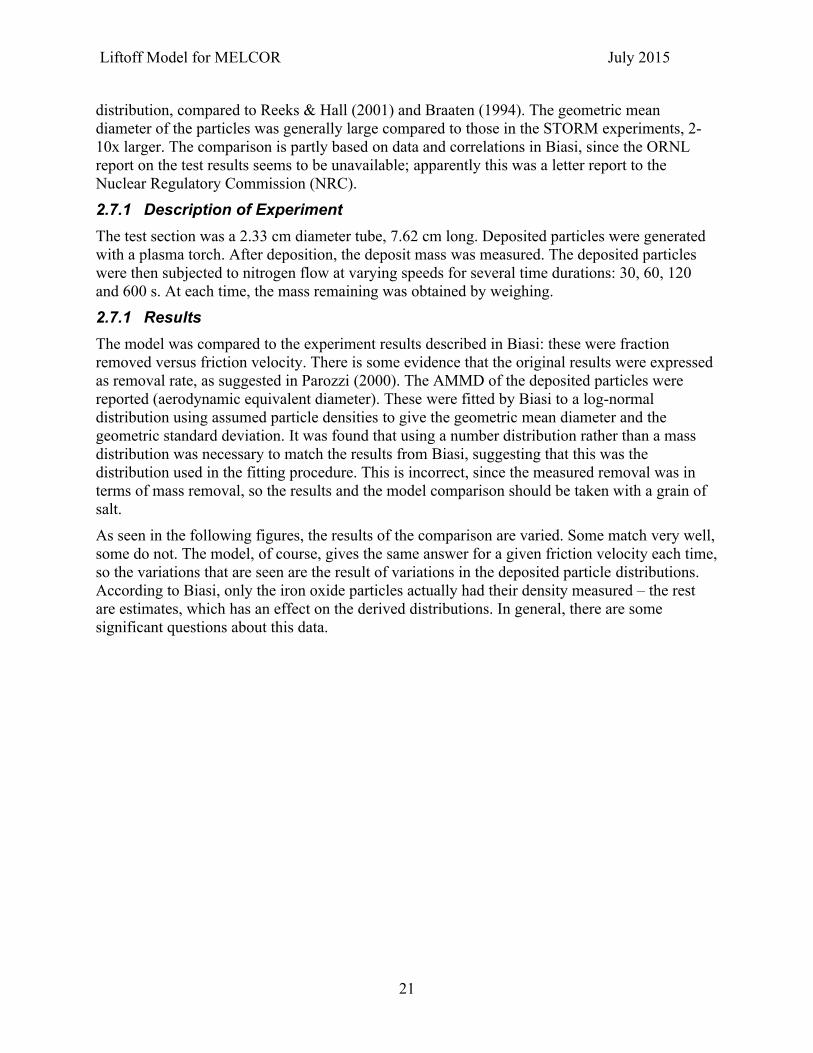
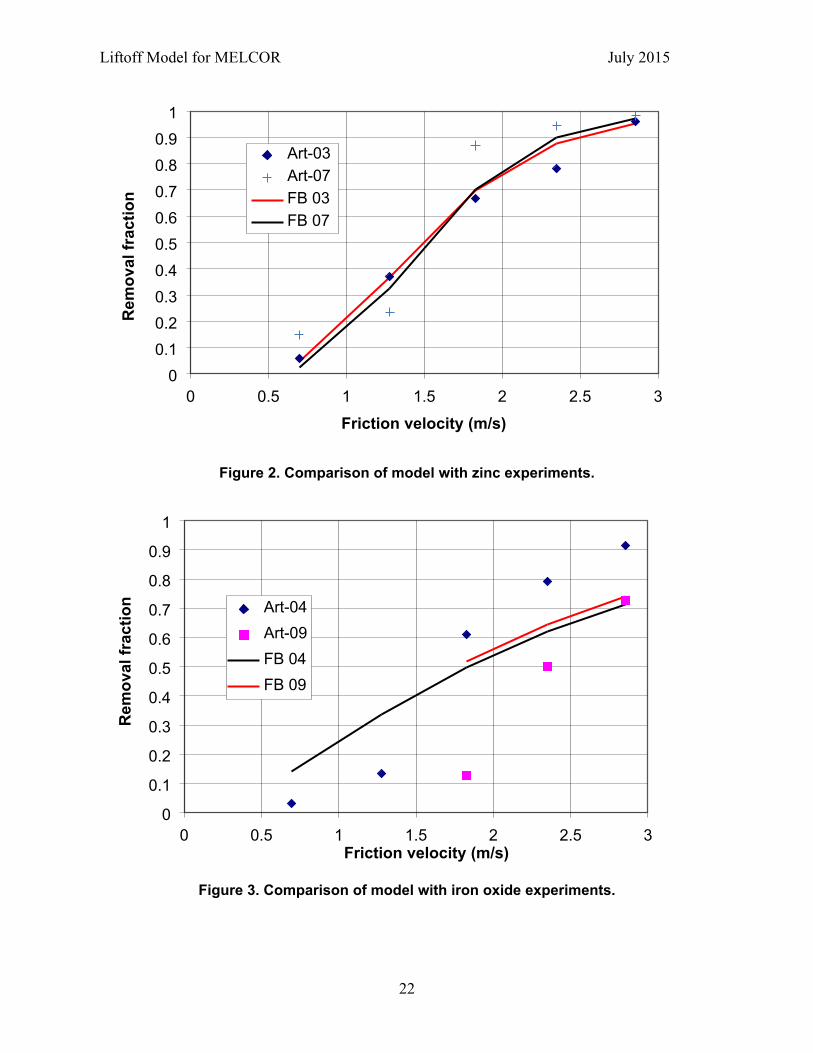
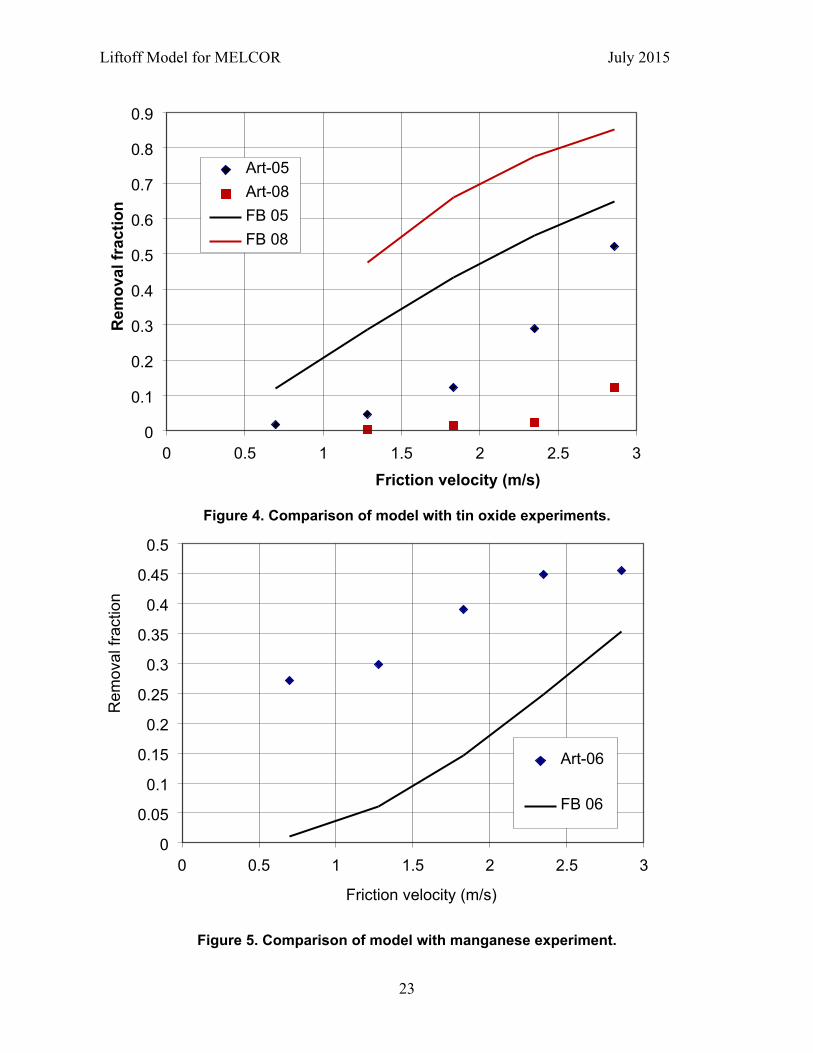
distribution, compared to Reeks & Hall (2001) and Braaten (1994). The geometric mean diameter of the particles was generally large compared to those in the STORM experiments, 2-10x larger. The comparison is partly based on data and correlations in Biasi, since the ORNL report on the test results seems to be unavailable; apparently this was a letter report to the Nuclear Regulatory Commission (NRC).2.7.1 Description of ExperimentThe test section was a 2.33 cm diameter tube, 7.62 cm long. Deposited particles were generated with a plasma torch. After deposition, the deposit mass was measured. The deposited particles were then subjected to nitrogen flow at varying speeds for several time durations: 30, 60, 120 and 600 s. At each time, the mass remaining was obtained by weighing.2.7.1 ResultsThe model was compared to the experiment results described in Biasi: these were fraction removed versus friction velocity. There is some evidence that the original results were expressed as removal rate, as suggested in Parozzi (2000). The AMMD of the deposited particles were reported (aerodynamic equivalent diameter). These were fitted by Biasi to a log-normal distribution using assumed particle densities to give the geometric mean diameter and the geometric standard deviation. It was found that using a number distribution rather than a mass distribution was necessary to match the results from Biasi, suggesting that this was the distribution used in the fitting procedure. This is incorrect, since the measured removal was in terms of mass removal, so the results and the model comparison should be taken with a grain of salt.As seen in the following figures, the results of the comparison are varied. Some match very well, some do not. The model, of course, gives the same answer for a given friction velocity each time, so the variations that are seen are the result of variations in the deposited particle distributions. According to Biasi, only the iron oxide particles actually had their density measured – the rest are estimates, which has an effect on the derived distributions. In general, there are some significant questions about this data.
Liftoff Model for MELCOR July 2015
22
0 0.5 1 1.5 2 2.5 30
0.10.20.30.40.50.60.70.80.9
1
Art-03Art-07FB 03FB 07
Friction velocity (m/s)
Rem
oval
frac
tion
Figure 2. Comparison of model with zinc experiments.
0 0.5 1 1.5 2 2.5 30
0.1
0.2
0.3
0.4
0.5
0.6
0.7
0.8
0.9
1
Art-04Art-09FB 04FB 09
Friction velocity (m/s)
Rem
oval
frac
tion
Figure 3. Comparison of model with iron oxide experiments.
Liftoff Model for MELCOR July 2015
23
0 0.5 1 1.5 2 2.5 30
0.1
0.2
0.3
0.4
0.5
0.6
0.7
0.8
0.9
Art-05Art-08FB 05FB 08
Friction velocity (m/s)
Rem
oval
frac
tion
Figure 4. Comparison of model with tin oxide experiments.
0 0.5 1 1.5 2 2.5 30
0.05
0.1
0.15
0.2
0.25
0.3
0.35
0.4
0.45
0.5
Art-06
FB 06
Friction velocity (m/s)
Rem
oval
frac
tion
Figure 5. Comparison of model with manganese experiment.

Liftoff Model for MELCOR July 2015
24
This page is intentionally blank
Liftoff Model for MELCOR July 2015
25
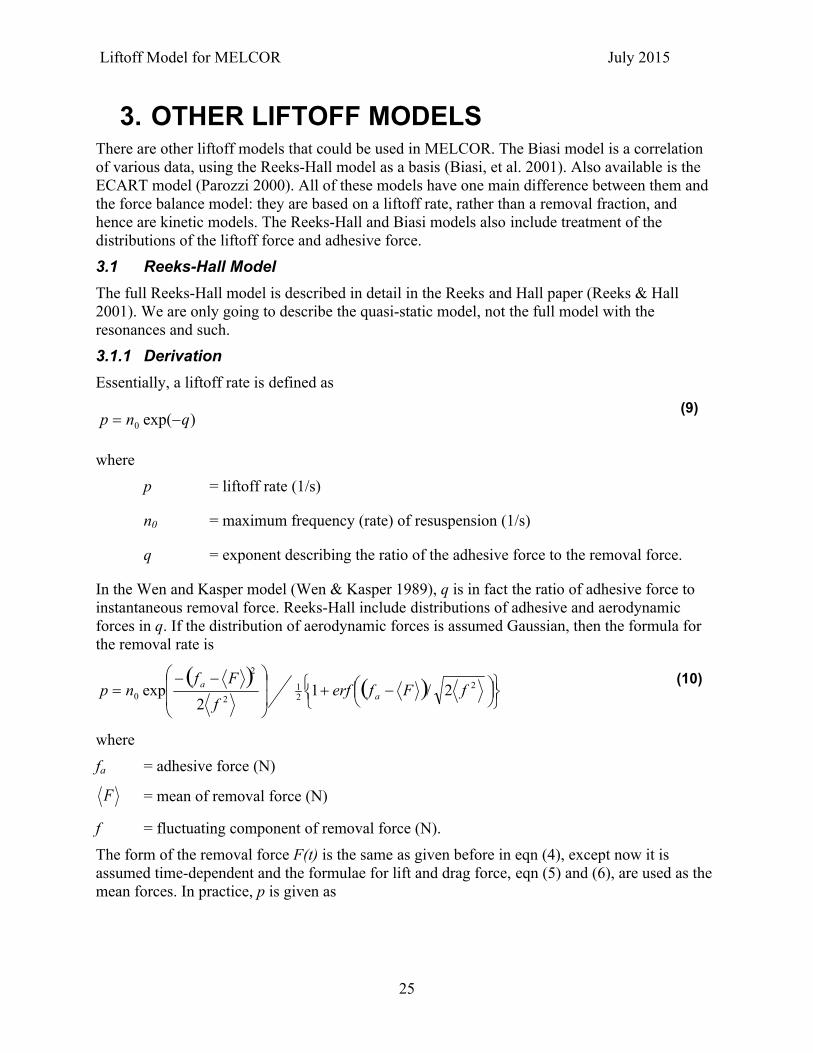
3. OTHER LIFTOFF MODELSThere are other liftoff models that could be used in MELCOR. The Biasi model is a correlation of various data, using the Reeks-Hall model as a basis (Biasi, et al. 2001). Also available is the ECART model (Parozzi 2000). All of these models have one main difference between them and the force balance model: they are based on a liftoff rate, rather than a removal fraction, and hence are kinetic models. The Reeks-Hall and Biasi models also include treatment of the distributions of the liftoff force and adhesive force.3.1 Reeks-Hall ModelThe full Reeks-Hall model is described in detail in the Reeks and Hall paper (Reeks & Hall 2001). We are only going to describe the quasi-static model, not the full model with the resonances and such.3.1.1 DerivationEssentially, a liftoff rate is defined as
)exp(0 qnp (9)
wherep = liftoff rate (1/s)
n0 = maximum frequency (rate) of resuspension (1/s)
q = exponent describing the ratio of the adhesive force to the removal force.
In the Wen and Kasper model (Wen & Kasper 1989), q is in fact the ratio of adhesive force to instantaneous removal force. Reeks-Hall include distributions of adhesive and aerodynamic forces in q. If the distribution of aerodynamic forces is assumed Gaussian, then the formula for the removal rate is
2
21
2
2
0 2/12
exp fFferff
Ffnp a
a (10)
wherefa = adhesive force (N)
= mean of removal force (N)F
f = fluctuating component of removal force (N).The form of the removal force F(t) is the same as given before in eqn (4), except now it is assumed time-dependent and the formulae for lift and drag force, eqn (5) and (6), are used as the mean forces. In practice, p is given as
Liftoff Model for MELCOR July 2015
26
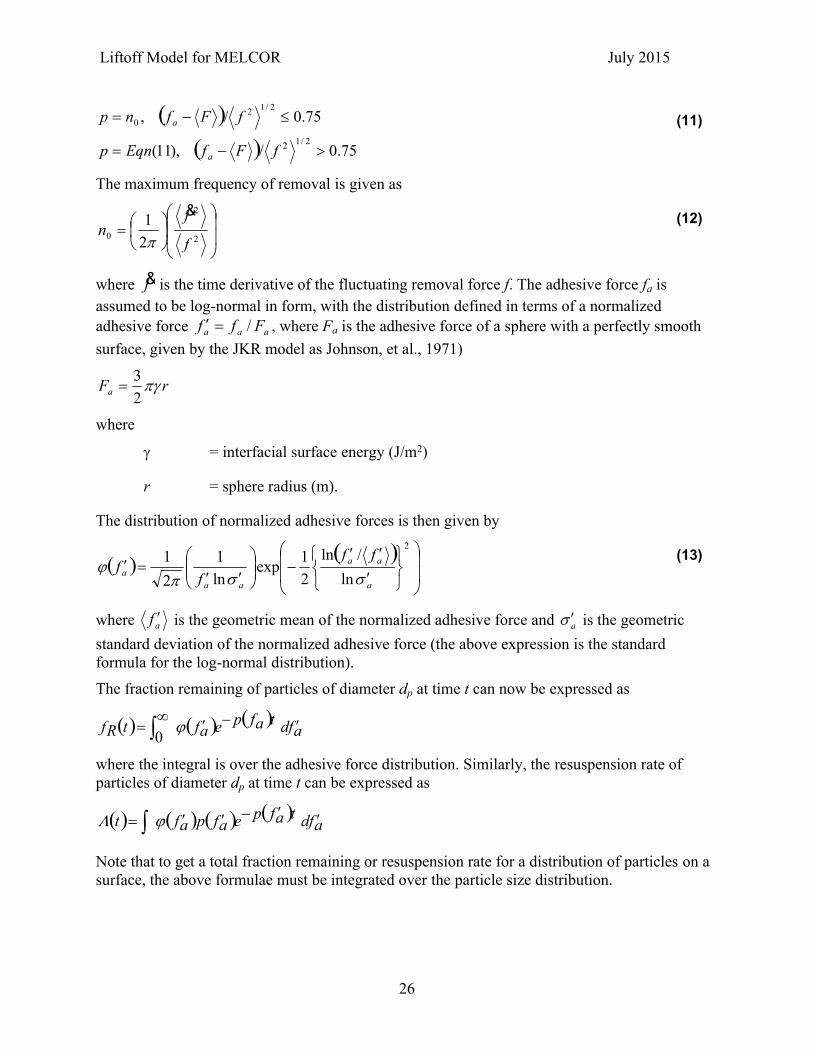
75.0/),11(
75.0/,2/12
2/120
fFfEqnp
fFfnp
a
a (11)
The maximum frequency of removal is given as
2
2
0 21
f
fn
&
(12)
where is the time derivative of the fluctuating removal force f. The adhesive force fa is f&assumed to be log-normal in form, with the distribution defined in terms of a normalized adhesive force , where Fa is the adhesive force of a sphere with a perfectly smooth aaa Fff /surface, given by the JKR model as Johnson, et al., 1971)
rFa 23
where
= interfacial surface energy (J/m2)
r = sphere radius (m).
The distribution of normalized adhesive forces is then given by
2
ln/ln
21exp
ln1
21
a
aa
aaa
fff
f
(13)
where is the geometric mean of the normalized adhesive force and is the geometric af a
standard deviation of the normalized adhesive force (the above expression is the standard formula for the log-normal distribution).The fraction remaining of particles of diameter dp at time t can now be expressed as
afdtafpeaftRf
0
where the integral is over the adhesive force distribution. Similarly, the resuspension rate of particles of diameter dp at time t can be expressed as
afdtafpeafpaft
Note that to get a total fraction remaining or resuspension rate for a distribution of particles on a surface, the above formulae must be integrated over the particle size distribution.
Liftoff Model for MELCOR July 2015
27
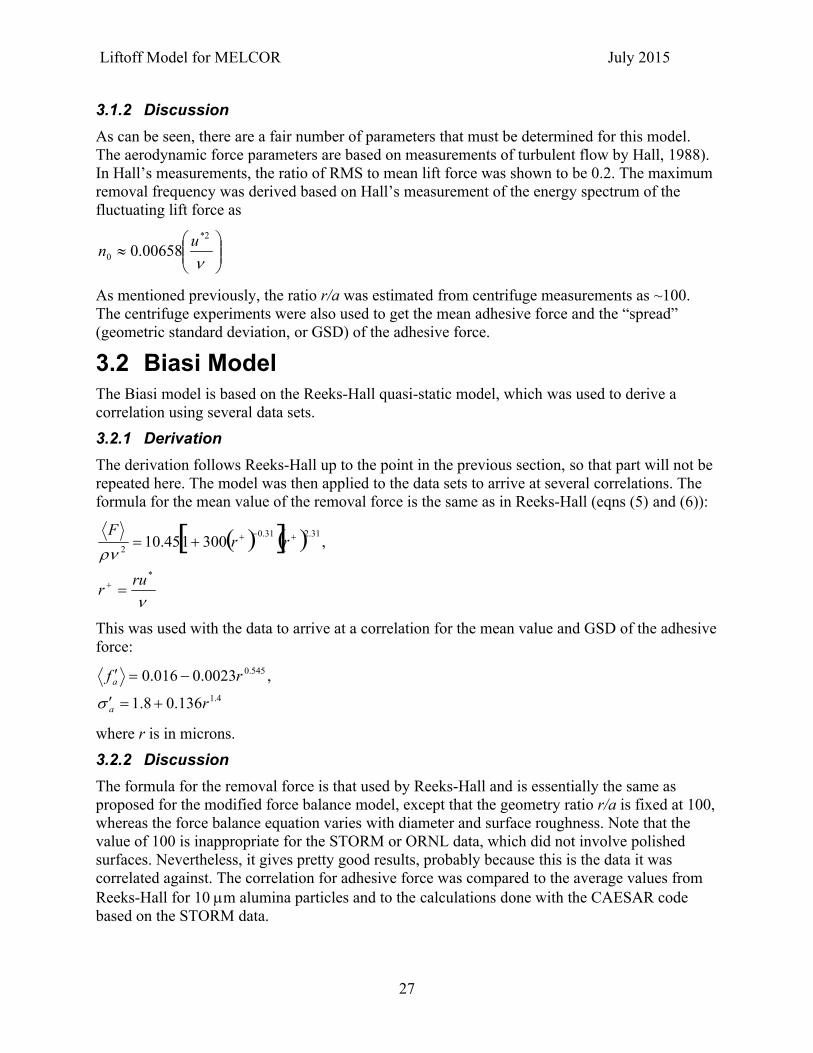
3.1.2 DiscussionAs can be seen, there are a fair number of parameters that must be determined for this model. The aerodynamic force parameters are based on measurements of turbulent flow by Hall, 1988). In Hall’s measurements, the ratio of RMS to mean lift force was shown to be 0.2. The maximum removal frequency was derived based on Hall’s measurement of the energy spectrum of the fluctuating lift force as
2*
0 00658.0 un
As mentioned previously, the ratio r/a was estimated from centrifuge measurements as ~100. The centrifuge experiments were also used to get the mean adhesive force and the “spread” (geometric standard deviation, or GSD) of the adhesive force.
3.2 Biasi ModelThe Biasi model is based on the Reeks-Hall quasi-static model, which was used to derive a correlation using several data sets.3.2.1 DerivationThe derivation follows Reeks-Hall up to the point in the previous section, so that part will not be repeated here. The model was then applied to the data sets to arrive at several correlations. The formula for the mean value of the removal force is the same as in Reeks-Hall (eqns (5) and (6)):
*
31.231.0
2 ,300145.10
rur
rrF
This was used with the data to arrive at a correlation for the mean value and GSD of the adhesive force:
4.1
545.0
136.08.1
,0023.0016.0
r
rf
a
a
where r is in microns.3.2.2 DiscussionThe formula for the removal force is that used by Reeks-Hall and is essentially the same as proposed for the modified force balance model, except that the geometry ratio r/a is fixed at 100, whereas the force balance equation varies with diameter and surface roughness. Note that the value of 100 is inappropriate for the STORM or ORNL data, which did not involve polished surfaces. Nevertheless, it gives pretty good results, probably because this is the data it was correlated against. The correlation for adhesive force was compared to the average values from Reeks-Hall for 10 m alumina particles and to the calculations done with the CAESAR code based on the STORM data.

Liftoff Model for MELCOR July 2015
28
This page is intentionally blank
Liftoff Model for MELCOR July 2015
29
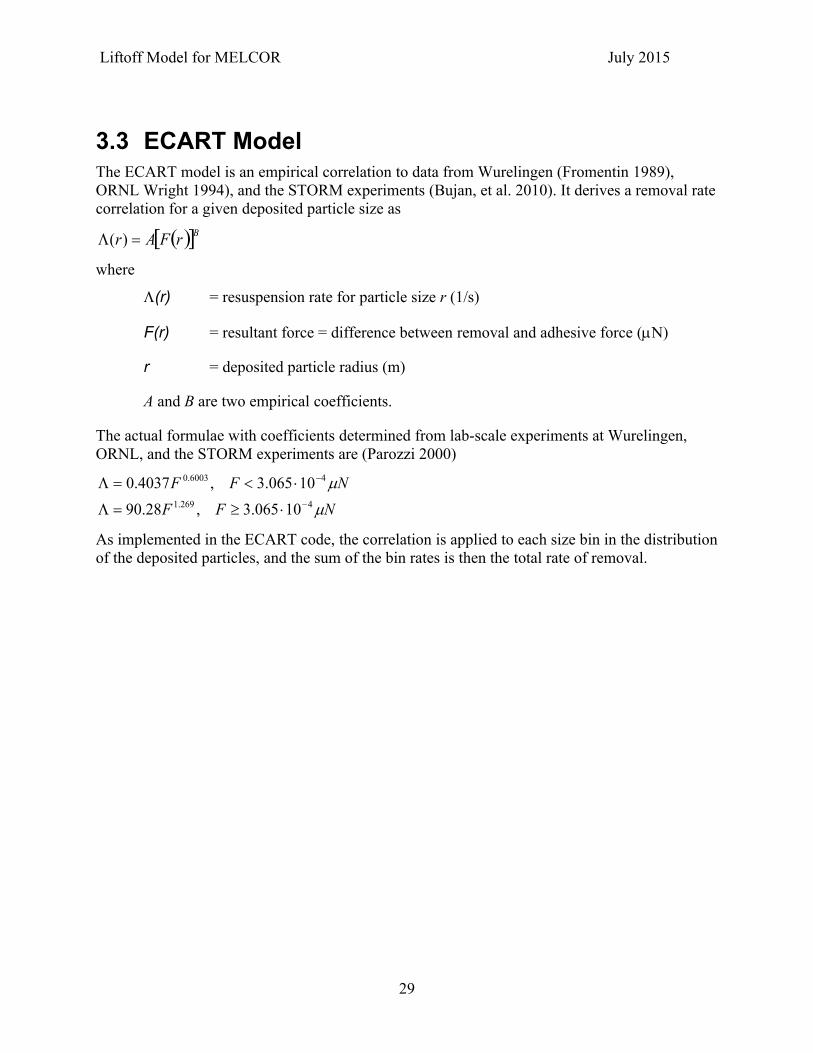
3.3 ECART ModelThe ECART model is an empirical correlation to data from Wurelingen (Fromentin 1989), ORNL Wright 1994), and the STORM experiments (Bujan, et al. 2010). It derives a removal rate correlation for a given deposited particle size as
BrFAr )(
where
(r) = resuspension rate for particle size r (1/s)
F(r) = resultant force = difference between removal and adhesive force (N)
r = deposited particle radius (m)
A and B are two empirical coefficients.
The actual formulae with coefficients determined from lab-scale experiments at Wurelingen, ORNL, and the STORM experiments are (Parozzi 2000)
NFFNFF
4269.1
46003.0
10065.3,28.9010065.3,4037.0
As implemented in the ECART code, the correlation is applied to each size bin in the distribution of the deposited particles, and the sum of the bin rates is then the total rate of removal.

Liftoff Model for MELCOR July 2015
30
This page is intentionally blank
Liftoff Model for MELCOR July 2015
31
4. DISCUSSION OF MODELSThe main point that stands out in the review of data is that the available data does not support a very complicated model. There are enough semi-free parameters in the simple models, and the available data are vague enough, to fit the data with a variety of parameter values, with the fits being more or less the same. The models based on correlations seem to do better, although this is to be expected since they are being compared to the same data they were correlated to. With the basic force balance model, the fraction removed depends heavily on the deposited particle distribution. This can be modified by including the adhesive force distribution, although for real HTGR conditions, these data are unlikely to be known. With the kinetic removal rate models, there is some degree of liftoff in any case if the model incorporates a distribution of removal and adhesive forces. With the ECART model, which uses a liftoff rate, there is some liftoff, dependent on the deposited particle distribution, unless the resultant force is negative for the given size particle; in this regard, it is like the force balance model.

Liftoff Model for MELCOR July 2015
32
This page is intentionally blank
Liftoff Model for MELCOR July 2015
33
5. ADDITIONAL FEATURES NEEDED FOR THE BASIC LIFTOFF MODEL FOR MELCOR
There are some other factors that need to be considered for use in MELCOR. The primary purpose of the liftoff model is for deposited dry aerosols, mostly graphite dust. Other factors that need to be considered are the degree to which the graphite chemisorbs on the metal surface, and the adsorption of fission products on the graphite.The chemisorption of graphite on metal actually refers to the graphite carburizing the metal at higher temperatures. Graphite interacting with the metal surface in this way is not going to be lifted off again under HTGR accident scenarios.The other factor is the adsorption of fission products on graphite. Presumably, fission products adsorbed on the graphite will travel with the graphite during deposition and liftoff, rather than plateout on the metal.

Liftoff Model for MELCOR July 2015
34
This page is intentionally blank
Liftoff Model for MELCOR July 2015
35
6. REFERENCES1. Avallone, EA, et al. 2007, Marks’ Standard Handbook for Mechanical Engineers, 11th Ed.,
McGraw-Hill.
2. Biasi, L, et al. 2001, “Use of a simple model for the interpretation of experimental data on particle resuspension in turbulent flows,” J. Aerosol Sci. 32, p.1175.
3. Bird, R, Stewart, W, Lightfoot, E 1960, Transport Phenomena, John Wiley & Sons.
4. Braaten,DA 1994, “Wind Tunnel Experiments of Large Particle Reentrainment-Deposition and Development of Large Particle Scaling Parameters,” Aerosol Sci. and Tech. 21, p.157.
5. Bujan et al. 2010, “ASTEC V1.3 code SOPHAEROS module validation using the STORM experiments,” Prog. Nucl. Energy Vol.52, Issue 8, p. 777.
6. Dilara, P 1998, “STORM Test SR09,” Quick Look Report, Tech. Note No.I.98.123, JRC-Ispra, Italy.
7. Friedlander, SK 2000, Smoke, Dust, and Haze: Fundamentals of Aerosol Dynamics, 2nd Ed., Oxford University Press.
8. Fromentin 2009, “Particle Resuspension from a Multi-Layer Deposit by Turbulent Flow,” Paul Scherrer Institut report no.38, LACE Report TR-083, Wurelingen (1989).
9. Hall, D 1988, “Measurements of the mean lift force on a particle near a boundary in turbulent flow,” Fluid Mechanics 187, p.451.
10. Hontanon, E, de los Reyes, A, Capitao, JA 2000, “The CAESAR Code for Aerosol Resuspension in Turbulent Pipe Flows. Assessment Against the STORM Experiments,” J. Aerosol Sci. Vol.31, No.9, p.1061.
11. Johnson, KL, Kendall, KL, Roberts, AD 1971, Proc. of the Royal Society of London Series A 324, p.301.
12. Mullins, ME et al. 1992, “Effect of Geometry on Particle Adhesion,” Aerosol Sci., and Tech. 17, p.105.
13. O’Neill, ME 1968, Chemical Engineering Science, 23, p.1293.
14. Parozzi, F 2000, “A fast-running model for physical aerosol resuspension accounting STORM experimental results,” Intl. Mtg. on “Best-Estimate” Methods in Nucl. Installation Safety Analysis, BE-2000, Washington, DC.
15. Reed, JR & Rochowiak, P 1988, “The adhesion of small particles to a surface,” Proc. Second Conf. of the Aerosol Society, Bournemouth, UK, p.229.
Liftoff Model for MELCOR July 2015
36
16. Reeks, MW & Hall, D 2001, “Kinetic models for particle resuspension in turbulent flows: theory and measurement,” J. Aerosol Sci. 32, p.1.
17. Wen, HY & Kasper, G 1989, “On the kinetics of particle reentrainment from surfaces,” J. Aerosol Sci. 20, p.483.
18. Wichner, RP 2009, “Dust Liftoff Model,” letter report.
19. Wright, AL 1994, “Primary System Fission Product Release and Transport,” NUREG/CR-6193, ORNL/TM-12681, Oak Ridge National Laboratory, Oak Ridge, TN.
20. Wright, AL, et al. 1986, “Series-2 Aerosol Resuspension Test.” Data Summary Report, Draft Report NRC FIN no. B0488, ORNL.
21. Ziskind, G, Fichman, M, Gutfinger, C 1995), “Resuspension of particulates from surfaces to turbulent flows-review and analysis,” J. Aerosol Sci. 26, p.613.
Liftoff Model for MELCOR July 2015
37
DISTRIBUTION1 MS0747 F. Gelbard 62231 MS0748 R. O. Gauntt 62321 MS0748 L. L. Humphries 62321 MS0748 M. F. Young 62321 MS1136 S. B. Rodriguez 6221
1 MS0899 Technical Library 9536 (electronic copy)
Liftoff Model for MELCOR July 2015
38