lightweight ceramics for aeroacoustic applications - … · lightweight ceramics for aeroacoustic...
TRANSCRIPT

NASA Contractor Report 201709
Lightweight Ceramics for AeroacousticApplications
H. W. Kwan, G. T. Spamer, and J. Yu
Rohr, Inc., Chula Vista, California
B. Yasukawa
Lockheed Martin Missiles and Space, Sunnyvale, California
Contract NAS 1-20102
July 1997
National Aeronautics and
Space Administration
Langley Research Center
Hampton, Virginia 23681-0001
https://ntrs.nasa.gov/search.jsp?R=19970027373 2018-07-14T22:16:00+00:00Z


ABSTRACT
Rohr, Inc., in cooperation with Lockheed Martin Missiles & Space (LMMS)
Division, has investigated the use of a HTP (High Temperature Performance)
ceramic foam for aeroacoustic applications under NASA Contract NAS1-20102,
Task 4. HTP ceramic foam is a composition of silica and alumina fibers
developed by LMMS. This foam is a lightweight high temperature fibrous bulk
material with small pore size, ultra high porosity, and good strength. It can be
used as a broadband noise absorber at both room and high temperature (up to
1800 °F). The investigation included an acoustic assessment as well as material
development, and environmental & structural evaluations. The results show that
the HTP ceramic foams provide good broadband noise absorbing capability and
adequate strength when incorporating the HTP ceramic foam system into
honeycomb sandwich structure. On the other hand, the material is sensitive to
Skydrol and requires further improvements. Good progress has been made in
the impedance model development. A relationship between HTP foam density,
flow resistance, and tortuosity will be established in the near future. Additional
effort is needed to investigate the coupling effects between face sheet and HTP
foam material.

Section
1.0
2.0
3.0
4.0
5.0
TABLE OF CONTENTS
BACKGROUND
1.1
1.2
1.3
Page
AND PROGRAM OBJECTIVE ........................... I
Background ...................................... 1
Program Objecti ves .............................. 2
Program Approach and Report Organization ........ 2
IDENTIFICATION OF POTENTIAL ACOUSTIC STRUCTURES
APPLICATIONS ............................................... 4
_TERIAL DEVELOPMENT
3.1
3.2
3.3
3.4
eoooooeeoeeeoeteQo.toooooeQeQoooeeeeoee 5
HTP Ceramic Foams ............................... 5
HTP Ceramic Foam Optimization ................... 6
HTP Fluid Contamination Performance ............. 7
Proposed Future Activities ...................... 8
ACOUSTIC PROPERTIES TESTING AND EVALUATION ................. 9
9
ENVIRONMEN_L
5.1
5.2
5.3
Acoustic Impedance Measurement ..................
Acoustic Testing of Downselected MaterialSystems ......................................... 10
Acoustic Impedance Measurements ................. 11
Acoustic Insertion Loss Measurements ............ 11
AND STRUCTURAL TESTS ......................... 14
Environmental Evaluation ........................ 14
Structural Evaluation ........................... 15
Structural Testing of Downselected Materials
Systems ......................................... 16
ii

Se ion
6.0
7.0
8.0
TABLE OF CONTENTS
ACOUSTIC IMPEDANCE MODEL ...................................
6.1
6.2
6.3
6.4
6.5
Model Development Background ....................
Ceramic Foam Impedance Model ....................
Impedance Contribution from the Perforated
Facing Sheet Over the Bulk Material ............. 20
Characteristic Impedance and PropagationConstant Assessment ............................. 22
HTP Foam Impedance Model Verification ........... 23
CONCLUSIONS AND RECOMMENDATIONS ............................ 26
7.1 Conclusions ..................................... 26
7.2 Recommendations ................................. 26
REFERENCES ................................................. 28
Pa e
18
18
19
iii

LIST OF ILLUSTRATIONS
2-1
4.1-1
4.1-2
4.1-3
4.1-4
4.1-5
4.1-6
4.1-7
4.1-8
4.1-9
4.1-10
4.1-11
4.1-12
4.1-13
4.1-14
4.1-15
Lightweight Ceramics for Aeroacoustic ApplicationsProgram Schedule ...........................................
Potential Sound Suppression Systems That Could
Incorporate Bulk Absorber Materials/Structures .............
Rohr Impedance System ......................................
Rohr Impedance Test Apparatus ..............................
Acoustic Impedance Measurement of LMSC HTP-4 Ceramic
Foam for Various Thickness .................................
Acoustic Impedance Measurement of LMSC HTP-4 Ceramic
Foam for Various Thickness .................................
Acoustic Impedance Measurement of LMSC HTP-6 CeramicFoam for Various Thickness .................................
Acoustic Impedance Measurement of LMSC HTP-6 Ceramic
Foam for Various Thickness .................................
Acoustic Impedance Measurement of LMSC HTP-IO CeramicFoam for Various Thickness .................................
Acoustic Impedance Measurement of LMSC HTP-IO CeramicFoam for Various Thickness .................................
Acoustic Impedance Measurement of LMSC HTP-12 Ceram]cFoam for Various Thickness .................................
Acoustic Impedance Measurement of LMSC HTP-12 Ceramlc
Foam for Various Thickness .................................
Acoustic Impedance Measurement of I.MSC HTP-16 Ceramic
Foam for Various Thickness .................................
Acoustic Impedance Measurement of LMSC HTP-16 Ceramic
Foam for Various Thickness .................................
Average Acoustic Impedance of LMSC Material 14360B, 0.75"and 1.50" Thicknesses ......................................
Average Acoustic Impedance of LMSC Material 14360D, 0.75"and 1.50" Thicknesses ......................................
Average Acoustic Impedance of LMSC Material 14360F, 0.75"and 1.50" Thicknesses ......................................
Page
FI
F2
F3
F3
F4
F5
F6
F7
F8
F9
FIO
FII
F12
F13
F14
F15
F16
iv

LIST OF ILLUSTRATIONS
4.1-17
4.1-18
4.1-19
4.1-20
4.1-21
4.1-22
4.1-23
4.1-24
4.1-25
4.2-1
4.2-2
4.2-3
4.2-4
4.2-5
4.2-6
Page
Average Acoustic Impedance of LMSC Material 14360G, 0.75"and 1.50" Thicknesses ...................................... F17
Average Acoustic Impedance of LMSC Material 14360J, 0.75"and 1.50" Thicknesses ...................................... F18
Average Acoustic Impedance of LMSC Material 11093T, 0.5",
1.0", 1.50" and 2.0" Thicknesses ........................... F19
Average Acoustic Impedance of LMSC Material 11095T, 0.5",
1.0", 1.50" and 2.0" Thicknesses ........................... F20
Average Acoustic Impedance of LMSC Material 1109TT, 0.5",
1.0", 1.50" and 2.0" Thicknesses ........................... F21
Average Acoustic Impedance of LMSC Material 11105T, 0.5",
1.0", 1.50" and 2.0" Thicknesses ........................... F22
Average Acoustic Impedance of LMSC Material 11107T, 0.5",
1.0", 1.50" and 2.0" Thicknesses ........................... F23
Average Acoustic Impedance of LMSC Material 13031T, 0.5",1.0", 1.50" and 2.0" Thicknesses ........................... F24
Average Acoustic Impedance of LMSC Material 1438, 0.55"and 1.10" Thicknesses at 145 dB ............................ F25
Average Acoustic Impedance of LMSC Material 1433A, 0.75"and 1.50" Thicknesses at 145 dB ............................ F26
Measured Acoustic Impedance of LMSC HTP-1437Panel Test at 140 dB ....................................... F27
Measured Acoustic Impedance of LMSC HTP-1437Panel Test at 145 dB ....................................... F28
Measured Acoustic Impedance of LMSC HTP-1437Panel Test at 148 dB ....................................... F29
Measured Acoustic Impedance of LMSC HTP-1437
In-Tube Test (1" Foam Only) at 140 dB ...................... F30
Measured Acoustic Impedance of LMSC HTP-1437
In-Tube Test (1" Foam Only) at 145 dB ...................... F31
Measured Acoustic Impedance of LMSC HTP-1437
In-Tube Test (1" Foam Only) at 148 dB ...................... F32

LIST OF ILLUSTRATIONS
Figure
4.2-7
4.2-8
4.2-9
4.2-10
4.2-11
4.2-12
4.2-13
4.2-14
4.2-15
4.2-16
4.2-17
4.2-18
4.2-19
Schematic of Acoustic Air/Noise Flow Duct Facility .........
Acoustic Insertion Loss of LMSC HTP-1437 Foam Filled
Sandwich Structures at Mach 0.0 ............................ F34
Acoustic Insertion Loss of LMSC HTP-1437 Foam Filled
Sandwich Structures at Mach 0.2 ............................ F35
Acoustic Insertion Loss of LMSC HTP-1437 Foam Filled
Sandwich Structures at Mach 0.3 ............................ F36
Acoustic Insertion Loss of LMSC HTP-1437 Foam Filled
Sandwich Structures at Mach 0.4 ............................ F37
Acoustic Insertion Loss of LMSC HTP-1437 Foam Filled
Sandwich Structures at Mach 0.5 ............................ F38
Acoustic Insertion Loss of LMSC HTP-1437 Foam Filled
Sandwich Structures at Mach 0.6 ............................ F39
Comparison of Acoustic Insertion Loss for LMSC Material
1437 Filled Sandwich Structures (1" Thick) and 80-RaylSDOF DynaRohr (0.95" Thick) at Mach Number 0.4 ............. F40
Comparison of Acoustic Insertion Loss for LMSC Material
1437 Filled Sandwich Structures (I" Thick) and 80-RaylSDOF DynaRohr (0.95" Thick) at Mach Number 0.5 ............. F41
Comparison of Acoustic Insertion Loss for LMSC Material
1437 Filled Sandwich Structures (1" Thick) and 80-Rayl
SDOF DynaRohr (0.95" Thick) at Mach Number 0.6 ............. F42
Measured Acoustic Impedance of 80-Rayl SDOF DynaRohrPanel Test at 140 dB ....................................... F43
Measured Acoustic Impedance of 80-Rayl SDOF DynaRohrPanel Test at 145 dB ....................................... F44
Measured Acoustic Impedance of 80-Rayl SDOF DynaRohrPanel Test at 148 dB ....................................... F45
Page
F33
vi

LIST OF ILLUSTRATIONS
Figure
5.2-I
5.2-2
5.2-3
5.2-4
5.2-5
5.2-6
5.2-7
5.2-8
5.2-9
5.2-10
5.3-1
5.3-2
5.3-3
5.3-4
Page
Dynamic Shaker General Test Setup .......................... F46
High Temperature Acoustic Structure Shaker (HCF) Test
Specimen ................................................... F47
Acoustic Impedance of Ceramic Foam Sandwich Structures
Sample #1, Location 1, Prior/Post HCF Test ................. F48
Acoustic Impedance of Ceramc Foam Sandwich Structures
Sample #1, Location 2, Prior/Post HCF Test ................. F49
Acoustic Impedance of Ceramic Foam Sandwich Structures
Sample #2, Location 1, Prior/Post HCF Test ................. F50
Acoustic Impedance of Ceramic Foam Sandwich Structures
Sample #2, Location 2, Prior/Post HCF Test ................. F51
Acoustic Impedance of Ceramic Foam Sandwich Structures
Sample #3, Location I, Prior/Post HCF Test ................. F52
Acoustic Impedance of Ceramic Foam Sandwich Structures
Sample #3, Location 2, Prior/Post HCF Test ................. F53
Acoustic Impedance of Ceramlc Foam Sandwich Structures
Sample #4, Location 1, Prior/Post HCF Test ................. F54
Acoustic Impedance of Ceramic Foam Sandwich Structures
Sample #4, Location 2, Prior/Post HCF Test ................. F55
Acoustic Impedance of LMSC Material 1437 Filled Sandwich
Structures Sample #1, Location 2 (Prior/Post HCF Test)at 140 dB .................................................. F56
Acoustic Impedance of LMSC Material 1437 Filled Sandwich
Structures Sample #1, Location 2 (Prior/Post HCF Test)at 145 dB .................................................. F57
Acoustic Impedance of LMSC Material 1437 Filled Sandwich
Structures Sample #1, Location 2 (Prior/Post HCF Test)at 148 dB .................................................. F58
Acoustic Impedance of LMSC Material 1437 Filled SandwichStructures Sample #2, Location 1 (Prior/Post HCF Test)
at 140 dB .................................................. F59
vii

LIST OF ILLUSTRATIONS
5.3-6
5.3-7
5.3-8
5.3-9
6.3-1
6.3-2
6.5-1
6.5-2
6.5-3
6.5-4
6.5-5
6.5-6
6.5-7
6.5-8
Acoustic Impedance of LMSC Material 1437 Filled Sandwich
Structures Sample #2, Location I (Prior/Post HCF Test)at 145 dB ..................................................
Acoustic Impedance of LMSC Material 1437 Filled Sandwich
Structures Sample #2, Location 1 (Prior/Post HCF Test)at 148 dB ..................................................
Acoustic Impedance of LMSC Material 1437 Filled Sandwich
Structures Sample #3, Location 1 (Prior/Post HCF Test)at 140 dB ..................................................
Acoustic Impedance of LMSC Material 1437 Filled Sandwich
Structures Sample #3, Location I (Prior/Post HCF Test)at 145 dB ..................................................
Acoustic Impedance of LMSC Material 1437 Filled Sandwich
Structures Sample #3, Location 1 (Prior/Post HCF Test)at 148 dB ..................................................
Sound Wave Distortion Diagram ..............................
Correction Function f (6p) .................................
Predicted and Measured Characteristic Impedance HTP FoamID# 11093, 3.3 PCF .........................................
Predicted and Measured Propagation Constant HTP FoamID# 11093, 3.3 PCF .........................................
Predicted and Measured Characteristic Impedance HTP FoamID# 1438, 4.91PCF .........................................
Predicted and Measured Propagation Constant HTP FoamID# 1438, 4.91PCF .........................................
Predicted and Measured Characteristic Impedance HTP Foam
ID# 1433A, 5.36 PCF ........................................
Predicted and Measured Propagation Constant HTP FoamID# 1433A, 5.36 PCF ........................................
Predicted andMeasured Acoustic Impedance HTP FoamID# 11093, 3.3 PCF, and O.5-inch Thick .....................
Predicted and Measured Acoustic Impedance HTP Foam
ID# 1438, 4.91PCF, and O.55-inch Thick ....................
Page
F60
F61
F62
F63
F64
F65
F65
F66
F67
F68
F69
F70
F71
F72
F73
viii

LIST OF ILLUSTRATIONS
6.5-10
6.5-11
6.5-12
6.5-13
6.5-14
6.5-15
6.5-16
6.5-17
Page
Predicted and Measured Acoustic Impedance HTP Foam
ID# 1433A, 5.36 PCF, and O.75-inch Thick ................... F74
Predicted and Measured Acoustic Impedance HTP Foam
ID# 1437, 4.78 PCF, and 1.0-inch Thick ..................... F75
Predicted and Measured Acoustic Impedance HTP Foam
ID# 11007T, 3.94 PCF, and 1.0-inch Thick ................... F76
Characteristic Impedance of LMSC Ceramic FoamHTP-04 PCF ................................................. F77
Propagation Constant of LMSC Ceramic FoamHTP-04 PCF ................................................. F78
Characteristic Impedance of LMSC Ceramic FoamHTP-06 PCF ................................................. F79
Propagation Constant of LMSC Ceramic FoamHTP-06 PCF ................................................. F80
Characteristic Impedance of LMSC Ceramic FoamHTP-IO PCF ................................................. F81
Propagation Constant of LMSC Ceramic FoamHTP-IO PCF ................................................. F82
ix

LIST OF TABLES
Table
1.1-1
5.1-1
5.2-1
5.3-1
6.5-1
6.5-2
6.5-3
Subsonic and Supersonic Commercial Transport Engine
Operational Requirements ............... .................... T1
Material and Acoustic Properties of HTP Ceramic Forms ...... T2
Material and Acoustic Properties of Down Selected HTPCeramic Foams .............................................. T3
Flatwise Tension Strength Test Results - TitaniumSandwich Structure with Ceramic Foam Inserts ............... T4
Titanium Sandwich/Ceramic Foam Insert Specimen DynamicShaker Test Results ........................................ T4
Titanium Sandwich/Ceramic Foam Insert Specimen
(LMSC ID. 1437 with 37% POA Ti Perforate)
Dynamic Shaker Test Results ................................ T5
4 PCF HTP Foam - Characteristic Impedance and WaveNumber ..................................................... T6
6 PCF HTP Foam - Characteristic Impedance and WaveNumber ..................................................... T7
10 PCF HTP Foam - Characteristic In_edance and WaveNumber ..................................................... T8

1.0 BACKGROUND AND PROGRAM OBJECTIVE
1.1 Background
There is a growing need to develop more effective aircraft engine noise
attenuation technology for both subsonic and supersonic aircraft. Over the next
ten - fifteen years a large market will exist for new commercial aircraft. This
market will be fueled by the need to replace an aging fleet with new, more
economical airplanes, a large expansion in Pacific Rim air travel requiring added
capacity and new demand for Western aircraft/engines by Eastern bloc
countries. There will be intense global competition to produce the needed
aircraft and engines. U.S. companies will compete with European manufacturers
enjoying the advantage of government subsidization. Better technology as well
as lower costs are needed for the United States to be successful in this
competition.
One area that could provide the U.S. with a competitive advantage is
aircraft engine noise reduction technology. The need for advanced engine
nacelle acoustic treatment that can provide noise attenuation over a broad
frequency band and operate at high temperatures results from increasingly
stringent regulations being proposed by authorities and from projected acoustic
attenuation requirements for supersonic commercial transports. Improved noise
attenuation is necessary to allow unrestricted airport and fleet growth as well as
the introduction of ultra-large aircraft into the fleet. The types of acoustic
structures that are currently used in areas of jet engines where the temperature
exceeds 350 OF are primarily constructed of perforated metals bonded or braised
to honeycomb support structure. While these structures are capable of
operating at temperatures of up to 1000 OF, their acoustic performance is
effective over a relatively narrow bandwidth. Integration of advanced materials
such as low density ceramics into the acoustic structure could potentially
enhance the acoustic performance and provide a means for the current
generation of high-bypass turbofan engines as well as the new generation of
ultra-high-bypass engines to meet increasingly strict noise regulations.
In addition to increased acoustic performance, new generation engines
designed for supersonic commercial transports require far greater temperature
capability for nozzle, ejector and plug area acoustic treatment. These

temperatures are projected to reach or exceed 2000 OFand must rely on newmaterial concepts since current metallic liners are not capable of operating insuch an environment.
A summary of the requirements for subsonic and supersonic commercial
transport engines is provided in Table 1.1-1. These figures are based on current
FAA requirements and proposed NASA requirements for the High Speed Civil
Transport (HSCT). The current subsonic commercial aircraft fleet as well as
new supersonic transport aircraft will, as a minimum, have to meet Stage 3 noise
criteria. Both the FAA and NASA expect that before the end of this decade,
there will be a doubling of the noise stringency rules imposed for new subsonic
aircraft. Accordingly, they have outlined a rigorous long range program aimed at
developing technology to enable the U.S. aviation industry to meet future noise
requirements with an adequate margin. The goal is to maintain a minimum
community noise impact even as commercial aircraft numbers increase in size.
The U.S. currently possesses a competitive advantage in subsonic
Aeroacoustics technology. Continued development of new advanced nacelle
acoustic treatment will be necessary if we are to maintain that edge.
1.2 Program Objective
The objective of the program is to develop high temperature, lightweight
ceramic acoustic structures that can serve as broad band noise absorbers to
reduce aircraft propulsion system noise. Ceramic systems have been selected
for evaluation because they offer significant weight savings over metallics,
especially at high temperatures and can be produced in forms (foam, etc.) that
provide for effective sound suppression. These systems will be targeted to meet
the performance requirements of future subsonic applications. An added
objective of this effort is to investigate the potential use of these ceramic
materials for supersonic propulsion systems applications.
1.3 Program Approach And Report Organization
The approach used to pursue the objective noted above is outlined in the
schedule shown in Figure 1.3-1. Potential acoustic structures applications for
which bulk absorbers might be suited are identified in Section 2. Ceramic bulk
absorber development activities are provided in Section 3. Acoustic property

and environmental structural tests and evaluation are described in Section 4 & 5
respectively. Model development activities are discussed in Section 6 whileconclusions and recommendations are detailed in Section 7.

2.0 IDENTIFICATION OF POTENTIAL ACOUSTIC STRUCTURES
APPLICATIONS
Applications for which the ceramic foam bulk absorber
materials/structures offer potential include inlet, after fan and exhaust region
acoustic hardware. These areas are shown pictorially in Figure 2-1. For the
inlet region, ceramics would be incorporated for turbofan applications only if a
weight saving could be demonstrated since this is not a high temperature area.
Inlet treatment as well as aft end acoustic structure, which is provided on the fan
cowl, core cowl and thrust reverser are presently characterized by either
Helmholtz resonators or perforate plate type liners. A liner using a porous
ceramic bulk absorber would offer advantages of being lightweight and providing
effective acoustic performance in high temperature environments.
The exhaust system also offers opportunities for weight savings and noise
reduction through the use of ceramic foam materials. Presently some engines
employ exhaust systems with mixer nozzles to increase the effectiveness of
mixing the hot core exhaust with the fan stream and thus reducing exhaust
noise. Another method for noise reduction is to include a perforate plate liner in
the exhaust nozzle. Because of the high temperatures involved, the nozzles and
acoustic treatment are typically constructed from Inconel and are quite heavy.
Use of a porous ceramic foam coupled with some of the newer high temperature
titaniums (e. g. TI 1100, titanium aluminides, etc.) or a ceramic matrix composite
sandwich construction instead of the current approaches offers potential noise
and weight benefits.
4

3.0 MATERIAL DEVELOPMENT
3.1 HTP Ceramic Foams
The performance requirements described in Section 1 provide the basis
for modifying and improving manufacturing processes for low density ceramic
foams to achieve high porosity and tortuosity that enchance efficient broad band
acoustic absorption. The material used in this study is a composition of silica
and alumina fibers called "High Thermal Performance" (HTP) that was
developed by Lockheed Martin Missiles and Space (LMMS). Integrated
acoustic treatment panel structures using this material must pay particular
attention to microstructure variability effects, material sonic fatigue survivability
and acoustic property retention from operational effects such as fluid wicking
and structural flexing.
LMMS has produced standard HTP foams that range in density from 6 to
16 Ibs/ft3 (pcf) or 96 to 256 kg/m 3 to support various high temperature
applications (themal insulation for F-117, B-2 bomber; antennas; radomes; lens;
and acoustics). Recently, lower density foams ranging from 3 to 4 pcf (48 to 64
kg/m3)were also developed (LMMS internal funding) to provide lightweight and
broad band acoustic liner applications for the AST and HSCT programs.
Candidate systems (Table 3-1) investigated to date cover the array of rayl
values of interest for the AST inlet and after fan as well as hypersonic nozzle
liner applications. It should be noted that these low density (3 to 4 pc'f) foams
have much lower structural strength than previously developed HTP foams
which may limit their utility for certain applications.
The goal in producing the lower density foams was to concentrate on
tailoring the pore size and increasing porosity of current foams to maximize
acoustic performance. The decrease in structural strength in the lower density
foams is the result of expanding pore size and increasing foam porosity to
greater than 96%. A number of processing parameters can be varied such as
fiber type and composition, blending ratios, casting pressures and as-fabricated
density for increasing the mechanical strength of the ceramic foams while
retaining nearly the same acoustic performance; rayl ranges, pore size, and
porosity. Optimization of the ceramic foam for successful assembly into an
5

acoustic structural panel must be defined to meet minimum compression
strength requirements.
3.2 HTP Ceramic Foam Optimization
An assembly threshold for pressing the ceramic foam into the titanium
honeycomb sandwich panel was observed. Ceramic foams of less than 4 pcf
density, having compression moduli of less than 400 psi, have shown a
propensity to crush rather than be cut by the honeycomb core during panel
assembly. This is contrary to higher density (greater than 4 pcf) and higher flow
resistance ceramic foams where the honeycomb edges easily sliced the foam
allowing successful core compression and panel assembly integration. When
hand squeezing these (< 4 pcf) foams; the material exhibited a spongy feel,
springing back as it was released rather than retaining the rigid feel exhibited in
higher (> 4 pcf) density foams.
Based on a limited experience base, the spongy characteristic occurs
when the ceramic foam is less than 4 pcf and the acoustic properties are less
than 60 rayls/cm. Under these conditions the foam median pore sizes range
from about 95 to 120 microns, porosity is greater than 96%, and the fiber volume
concentration is estimated to be 2 to 4 times less than for densities greater than
4 pcf (with high rayl values). The number of fibers and distance between fused
fiber joints is greater, hence the larger equivalent pore sizes. The total spectrum
of pore sizes for any foam varies from around 300 microns down to 0.1 microns
with the median pore size reported in Table 3-1 for a given density. Pore size is
determined using a mercury porosimeter which measures the amount of mercury
infilrated in a 3-D porous structure under a given pressure. The instrument
calculates the equalivent pore size and pore size distribution in the material
using a cylinder shape as the standard geometric volume. The non uniformity of
the ceramic foam microstructure and torturous path within the bulk contributes to
the materials excellent broad band sound absorption characteristics.
Continued development is required at the lower foam densities (less than
4 pcf), especially where flow resistance properties of less than 60 raylslcm are
required for the inlet applications. Two approaches have been identified for
enhancing the foams structural strength and rigidity to survive the assembly
operations: 1) the density can be raised to increase the number of fused fiber
6

joints and larger fiber diameters are used to retain the large pore size and low
rayl values, and 2) alter the current fiber composition and processing parameters
to maintain density while enhancing more uniform fiber fusion. The goal is to
achieve a narrower range of pore sizes to enhance bulk foam uniformity and
strength. In addition, other reinforcing thin loose weave ceramic cloths can be
impregnated during foam fabrication to enhance structural integrity and extend
sonic fatigue survivability.
3.3 HTP Fluid Contamination Performance
Environmental contamination from various fluids (discussed in Section
5.1), is a major concern for use of ceramic foams as a bulk absorber in acoustic
structural applications. The fluid contamination problem can be addressed at
two levels; 1) from a material resistance standpoint, and 2) during acoustic panel
design. Fluid resistance materials or coatings can be applied into the foam or as
a surface coating to alter the foam's surface wetting characteristics to minimize
fluid absorption. In addition, thin surface layers that repel both water and
organic liquids can be integrated over the foam to prevent liquid penetration into
the foam. Excess fluid absorption must be evaluated to determine whether the
any absorbed fluid will create an operational problem. Since the ceramic foam
pore structure is open cell with a greater than 96% porosity, the ability of fluids
to evaporate or be wicked from the bulk to the surface should easily be
accomplished during warm ups.
Further studies are required to investigate the heat of vaporization
temperatures for the liquids of concern and the ability of these materials to
escape the ceramic foam during engine warm ups or operation. Studies to
evaluate ceramic foam heating and depth of heating are required to understand
the liquid evaporation effects. In addition, studies to assess the effects of
temperature cycling of the ceramic foam with both water and organic liquids
must be performed. Approaches to prevent liquid absorption into the foam must
be addressed by the methods described above. To that end, any acoustical
panel designs that minimize the amount of fluids absorbed into the ceramic foam
filled honeycomb must be investigated. Implementation of a combination of
metal screens and a foam surface treatment may be sufficient protection against
fluids absorption.
'7

3.4 Conclusions and Recommendations
Based on the test results to date, the data indicate that further material
optimization is required to allow for ease of ceramic foam integration into thetitanium core. Approaches designed to improve the structural strength in lowflow resistance materials are listed section 3.2. It is recommended that a fluids
environmental contamination program be initiated immediately to address
concerns and issues with fluid absorption for inlet applications. The approaches
for tailoring the ceramic foams to improve their survivability in the fluid
environment are listed in section 3.3. Since there is a good possibility that the
acoustic properties will be altered with the application of fluid resistant coatings,
it is also recommended that the fluids environment task be initiated prior to the
foam material optimization work. Based on the modifications necessary to solve
the fluids problem, a new assessment to optimize the foam structural properties
can be performed at that time.
$

4.0 ACOUSTIC PROPERTIES TESTING AND EVALUATION
4.1 Acoustic Impedance Measurement
A two-microphone impedance measuring system was used to conduct all
acoustic impedance measurements. The apparatus and methods used are in
compliance with the ASTM E1050-90 measurement standards (Reference 8). A
block diagram of the Rohr acoustic impedance measuring system standard is
shown in Figure 4.1-1.
The sensitivities of the pressure transducers for the acoustic impedance
measuring system was calibrated in accordance with Rohr Report No. RHR 89-
191 (Reference 9). The amplitude and phase calibration for the two-microphone
impedance system transducers were performed in accordance with the method
described in the ASTM E1050-90 impedance measurement standard (Reference
8). The performance of the acoustic impedance measuring system was checked
prior to any testing by evaluating known reference samples. The reference
samples included a 5% POA perforate plate and an empty cavity termination.
The root mean square (rms) deviation of the acoustic impedance of the
reference samples over the measurement frequency range was evaluated before
each series of tests.
A test sample is installed at one end of the impedance tube as a
termination as shown in Figure 4.1-2 (a) and (b). Using a random noise
excitation, the normal specific acoustic impedance of the test sample is
determined from two pressure measurements alonq the wall of the impedance
tub.___ee.The frequency for this test ranges from 800 to 6000 Hz. Overall sound
pressure levels (OASPL) of up to 160 dB can be achieved at the face of the test
sample. The characteristics of this pressure spectrum will be documented for
use in the corresponding acoustic impedance predictions. For each test sample,
three sound pressure levels were used. The measured acoustic impedance data
is presented in 120 Hz bandwidth narrow band form. Data files containing this
information presented in 120 Hz bandwidth narrow band form are available on
3.5" diskette in ASCII format.
As part of a previous Rohr - LMMS Joint Program effort, the acoustic
impedance of several HTP systems (HTP-4, HTP-6, HTP-10, HTP-12, and HTP-
9

16), that spanned a wide range of densities (3-16 pcf), were assessed (see
Table 3-1). Figures 4.1-3 through 4.1-12 show acoustic impedance test resultsfor HTP materials with various densities and thicknesses. For current fan and
nozzle acoustic treatment applications under NASA AST and HSCT programs
(i.e., NASA Contract NAS3-26618 - Task 49 - ADP liner design, and NASA
Contract NASA-I-20102 Task 13 - HSCT nozzle treatment), the optimum liner
impedance ranges from 1 to 2.5 pC (characteristic impedance - air density times
sound speed) for acoustic resistance and -1.5 to 0 pc for acoustic reactance at
design frequencies. The data shows that HTP materials with densities less than
6 pcf fall within the optimum impedance window for these applications over a
very broad band frequency range.
Nineteen (19) more material samples (6" by 6") (ID.: 14360B, 14360D,
14360F, 14360G, 14360J, 11093T, 11093B, 11095T, 11095B, 11097T, 11097B,
11105T, 11105B, 11107T, 11107B, 13031T, 13031B, 1438, and 1433A)were
received from LMMS to support impedance testing used for material down
selection. These materials have a density less than 6 pcf with a wide range of
DC flow resistance properties (as shown in Table 3-1). Acoustic impedance
measurements were performed on all of the 6" x 6" samples (in-tube test).
Single, double, triple, and four layer thick (0.5, 0.75, 1.0, 1.5, and 2.0 inch) test
specimens were assembled for each material sample. Figures 4.1-13 through
4.1-25 show test results of averaged acoustic impedance values for all test
specimens. Some test samples were assessed at a single sound pressure level,
since early test results showed an insignificant effect of this parameter. Based
on these impedance test results, the HTP-5 system (such as the 1438 and
1433A samples in Figures 4.1-24 and 4.1-25) is the most promising material for
inlet applications whereas the 11095, 11097, and 11105 samples (Figures 4.1-
19, 4.1-20, and 4.1-21 ) have desirable characteristics for bypass duct treatment.
For supersonic vehicle and subsonic nozzle applications, additional noise
signature information is required for down selection, however, it is anticipated
that one of the 8-10 pcf systems would be satisfactory. Table 4.1-1 lists down
selected HTP systems for future program evaluation.
4.2 Acoustic Testing of Downselected Material Systems
As discussed in Section 4.1, three systems were down selected for a
scale-up validation. Material and acoustic properties of these three systems are
10

shown in Table 4.1-1. Panels were fabricated in support of panel impedance,
flow duct insertion loss measurement, and high cycle fatigue testing to evaluate
the three down selected material were conducted. The 4 pcf system was initially
identified for use in the inlet region, with a lower density system (3 pcf) to be
used for the bypass duct (see Table 4.1-1). However, insertion of the lower
system (3 pcf) into the titanium sandwich panels was extremely difficult (the
material was very spongy). Thus, only the 4 pcf system was used to fabricate an
acoustic panel for the inlet and the bypass duct application.
4.2.1 Acoustic Impedance Measurements
The panel configuration is shown in Figure 5.2-2. The POA of the Ti
perforate face sheet was 37%. Acoustic impedance panel testing was
conducted on two (2) 5.5" x 24" flow duct panels. Also, acoustic impedance in-
tube testing was performed on a 1" ceramic foam sample (LMMS ID 1437).
Figures 4.2-1 through 4.2-6 show test results of averaged acoustic impedance
values for the panel test and in-tube test (1" foam only). The test results indicate
that acoustic impedance of bulk material structures are affected by the face
sheet parameters and the differences in panel test and in-tube test boundary
conditions (i.e. sound energy through the in-tube test is constrained whereas
sound energy through the panel test is not). In the future, a correlation between
acoustic impedance and face sheet parameters (such as POA, hole diameter,
and plate thickness) needs to be investigated in order to produce an optimum
acoustic liner design (References 5 & 6).
4.2.2 Acoustic Insertion Loss Measurements
The Rohr air/noise flow duct facility was used to measure the acoustic
insertion loss of the test samples. Figure 4.2-7 shows a schematic of the flow
duct facility. The test section of the duct is rectangular, with a cross section of 5
by 6 inches, and is connected by aerodynamic transition ducts to two
reverberant rooms on either end of the duct. The method used for measuring
the acoustic insertion loss compares the sound pressure levels (SPL) in the
upstream and downstream reverberate rooms at different air flow velocities.
First, hard walls are mounted at the test section, and the SPL differences (i.e.,
attenuation IL(H), between the upstream and downstream rooms) is measured at
different air flow velocities. This set of data is used as a baseline. After
11

replacing the hard walls with the test samples, the same procedure is followed,
and the attenuation, IL(S), is measured. Finally, the acoustic insertion loss of
the test samples is calculated by taking the difference of the two readings: IL(S)
-IL(H).
Measurement frequencies range from 1000 to 6000 Hz. Overall sound
pressure levels of up to 152 dB can be achieved at the upstream reverberant
room. For each test sample, five different air flow velocities between 0.2 and 0.6
Mach number were used. The measured acoustic insertion loss data is
presented in one-third octave bandwidth form. Data files containing this
information presented in one-third octave frequency form are available on 3.5"
diskette in ASCII format.
The Rohr air/noise flow duct facility is operated in the 'exhaust' mode, i.e.,
the air flow direction is the same as the noise propagated direction, not in the
'inlet' mode (the air flow direction is opposite to the noise propagated direction).
It is also noted that this facility is optimally designed for an acoustic liner with 1
pc acoustic resistance and -0.5 pc acoustic reactance.
Figures 4.2-8 through 4.2-13 show acoustic insertion loss test results for
a 4.78 pcf ceramic foam (LMMS HTP ID. 1437) filled sandwich structure. A
single degree of freedom (SDOF) DynaRohr liner is a common acoustic liner
used in aircraft; and an 80 rayl single layer DynaRohr panel (0.95" core depth)
was used as a reference to evaluate the acoustic performance of the foam filled
sandwich structure. Comparison of the acoustic insertion loss of the ceramic
foam filled sandwich structure and the 80-rayl SDOF DynaRohr structure at
Mach numbers 0.4, 0.5, and 0.6 is shown in Figures 4.2-14 through 4.2-16.
The test results indicate that the acoustic insertion loss of the 80-rayl
SDOF DynaRohr is better than the ceramic foam filled sandwich structure in the
frequency range from 1,250 Hz to 3,150 Hz. The measured acoustic impedance
(panel test) of the 80-rayl SDOF DynaRohr at different SPLs is shown in Figures
4.2-17 through 4.2-19. Comparing Figures 4.2-1 and 4.2-17 show that the
acoustic reactance of the 80-rayl SDOF DynaRohr reaches an optimal value (
-0.5 pc) between 2,000 Hz and 3,000 Hz and the ceramic foam (LMMS HTP-
1437) filled sandwich structure reaches its optimal value (-0.5 pc) between
5,000 Hz and 6,000 Hz. This may be the cause of the decrease in the acoustic
t2

insertion loss for LMMS HTP-1437 system. Also, as mentioned in Section 4.2,
the lower density system (--3 pcf) was chosen to be used for the bypass duct
liner. Figure 4.1-20 shows the acoustic impedance of LMMS HTP-11097 (3.65
pcf) and the acoustic reactance reaches its optimal value (-0.5 pc) between
2,000 Hz and 5,000 Hz. However, due to difficulties associated with inserting
the lower HTP system (--3 pcf) into the titanium sandwich panels, this lower
system (-3 pcf) cannot be considered for the bypass duct application now. A
new fabrication method should be investigated to complete the acoustic insertion
loss studies.
It should be noted that the ceramic foam filled sandwich structure was
designed and fabricated solely to study the basic acoustic properties of the
ceramic foam materials and not for liner optimization. Modification of perforate
face sheet and core should improve the acoustic performance of ceramic foam
filled sandwich structures (see Section 6.3).
13

5.0 ENVIRONMENTAL AND STRUCTURAL TESTS
Environmental and structural testing performed, either as part of the
previous Rohr - LMMS joint efforts or this program are described in the following
sections.
5.1 Environmental Evaluation
Several environmental concems exist regarding the use of ceramic foam
as a bulk absorber in acoustic structures applications. These include
contamination of the large fillet region of sandwich structures constructed using
standard Liquid Interface Diffusion (LID) bonding methods and susceptability of
the foam to exposure to fluids, such as Skydrol.
in order to assess the potential for joint contamination due to the use of
the ceramic bulk absorber in acoustic structure applications, four (4) 3" x 6" x
0.75" thick ceramic foam filled honeycomb titanium panels were fabricated.
Since it has not been determined yet whether protective coatings for the ceramic
foam are necessary, half of the panels contained colloidal alumina coated
ceramic foam and half contained uncoated ceramic foam to investigate bonding
effects of the foam to the face sheet due to the presence of the protective
coating. The face sheet material was Ti-6AI-4V with Ti-3AI-2.5V core (318 inch
cell size). One face sheet was solid, the other was perforated with a 20 percent
open area (POA). The ceramic foam was HTP-5.4. Standard LID bonding
methods and parameters were used to bond all panels. After fabrication, all four
panels were sectioned to 3" x 3" sizes and tested for flatwise tension strength.
The results are shown in Table 5.1-1 with the uncoated samples being superior.
Metallurgical evaluation was performed on both coated and uncoated
samples to assess potential joint contamination. Energy Dispersive
Spectroscopy (EDS) analysis was performed on the LID braze fillet regions.
Evidence of voiding (high levels of porosity) was apparent on the coated
samples, whereas no voiding was observed on the uncoated samples. Micro
hardness indentations around a typical fillet were also assessed with calculated
values in the normal range for both coated and uncoated samples. Based on
the above, it was concluded that future efforts involving titanium bonded
14

sandwich/ceramic foam specimens/structures should use uncoated ceramic
foam.
Skydrol exposure testing was also performed. Samples were exposed to
Skydrol 500-B4 per MIL-4-5606 (20 hours at 1200F), which is considered to be a
very conservative test, and to a misting (four times per day - 2 minutes each
time) for ten days. Significant weight pickup (120% increase) was incurred from
the 20 hour/hot Skydrol soaking and the specimens sustained some loss of
stiffness. The misting test produced far less weight pickup (15% increase) and
the foam retained its stiffness characteristics. However weight pickup due to
exposure to fluids, including moisture, and sensitivity to Skydrol were identified
as issues that must be resolved before this material can be used in aeroacoustic
applications.
5.2 Structural Evaluation
Since the ceramic foam is encapsulated in the honeycomb sandwich
structure and is not a load carrying member, durability of the foam in a hot
dynamic environment is considered the key structural issue for the foam. To
address this issue, High Cycle Fatigue (HCF) testing was performed at both
ambient and elevated temperatures (1000OF). This temperature was used since
it represents the capability limit of the Rohr shaker system and since it is close to
the maximum value experienced by AST component applications. All specimens
were tested using an Inconel duckbill assembly to grip the specimen at one end.
The duckbill was attached directly to the head of an electrodynamic shaker to
provide vibratory loading of the cantilever test specimens. Specimens were
instrumented with strain gages at the duckbill gripline to measure uniaxial
bending stresses along the gripline edge. The specimens were also
instrumented with a tip accelerometer to monitor resonant frequency and tip
displacement response. An accelerometer was attached to the shaker head to
measure input loading to the specimen. Figure 5.2-1 shows the test setup and
Figure 5.2-2 shows the test specimen details.
Random vibration tests were conducted according to the procedure
described in Rohr Engineering Test Standard (RETS) 128D-90013, Method 10-
85, "High Cycle Random Fatigue Test", with some slight procedural
modifications. An outline of the testing sequence is described below:.
15

Sine Sweep: The initial phase of testing consisted of a low level (0.5 G peak)
sine sweep test from 20 - 1,000 Hz. This determined the resonant
frequency corresponding to the maximum response with the first
cantilever mode of the specimen. This resonant frequency was the center
frequency used for the random loading phase of testing.
Random Vibration: A 113 octave band random signal, centered at the specimen
resonant frequency, was used to excite the specimen for the random
vibration screening tests. The strain gauge output signals were
monitored during the test using a spectrum analyzer to generate strain
frequency response spectra. The input loading of each test specimen
was adjusted to generate a specified test strain level. A strain level of
300 ,//8 was used for all tests. This value was assigned based on
titanium perforate face sheet fatigue capabilities. Testing was performed
for 106 cycles or until failure occurred which was defined as a 20% drop in
natural frequency (indicating a major loss of stiffness), or visible evidence
of damage to the part (cracking, etc.). Test results are shown in Table
5.2-1. No significant frequency drop was evidenced in any of the tests. It
should be noted that for sandwich specimens, dynamic shaker testing
causes deflections that exceed those that would normally be expected in
a sonic environment (thus, this represents a conservative test when
compared with anticipated service excursions). This has been confirmed
through previous dynamic shaker/progressive wave tube sonic tests
conducted at Rohr on other ceramic foam specimens.
Figures 5.2-3 through 5.2-10 show test results of the measured acoustic
impedance for each test location prior to and after HCF tests at three SPLs.
These test results indicate that the acoustic impedance of the specimens did not
change significantly after HCF testing at room temperature or at high
temperature. Changes in acoustic resistance were minimal, whereas slight
differences were observed in the acoustic reactance, probably due to a
measurement error.
5.3 Structural Testing of Downselected Materials Systems
Three high cycle fatigue (HCF) test specimens were fabricated using the
downselected 4.78 pcf LMMS 1437 material (titanium sandwich structure) and
16

the same configuration as the flow duct test panel. The same test proceduredescribed in Section 5.2 was used to test these specimens. Test results are
provided in Table 5.3-1 along with acoustic impedance test results (prior to and
after HCF testing) in Figures 5.3-1 through 5.3-9. No significant frequency dropwas evidenced in any of HCF tests nor did the acoustic impedance of the
specimens change significantly due to HCF testing at room temperature or at
high temperature.
17

6.0 ACOUSTIC IMPEDANCE MODEL
6.1 Model Development Background
A key element in the optimization of acoustic treatment for specific
applications is establishment of an acoustic impedance math model for
predicting acoustic performance. This math model is typically highly dependent
upon material type. Acoustic bulk absorbers can be made from flexible fibrous
blankets (i.e., Kevlar 29), rigid reticulated foam (i.e., carbon foam) or fibrous
foams (i.e., HTP ceramic foam). The Rohr bulk impedance model developed to
predict the impedance characteristics of these materials is primarily based on
theory derived from D. J. Sides, and K. A. Attenborough (References 1 & 2).
Math models derived from A. Hersh (Reference 3), L. L. Beranek (Reference 4),
and U. S. Shirahatti (Reference 5) were also used for specific options such as
data comparison, flow resistance calculation and structure factor estimation.
Moreover, since the bulk material is in close contact with a perforated facing
sheet, the U. Ingard math model (Reference 6) was used to estimate the
acoustic contribution from the facing sheet.
If the sound wave propagation in the air is expressed as P= • °'t_'), the
basic equation for a bulk liner with a porous face sheet and solid back skin can
be expressed as follows:
z(f)/pc =R +j X =Zo/pC+ /pc (1)
Zb = -j Z= cot(k, d) (2)
where,
P is the sound pressure
f is the frequency.
(o is the angular frequency (=2= f)
k is the wave number (=2= flc)
Z(t)/pc is a complex number representing the normalized bulk liner impedance.
R is the normalized acoustic resistance.
j is the unit of imaginary number = _/-1.
]8

X is the normalized acoustic reactance.
Z o/pc is the normalized porous face sheet impedance over the bulk material.
Zb/pc is the normalized bulk material impedance.
p is the air density and c is the sound speed.
pc is defined as the characteristic impedance for air (unit: cgs Rayl).
7_.=is defined as the characteristic impedance for a given bulk material.
ka is the bulk material propagation constant (complex number).
d is the bulk thickness in inches or cm.
Section 6.2 details the math model used to calculate HTP ceramic foam
impedance. Section 6.3 describes acoustic impedance contributions from the
perforated sheet that is in close contact with the bulk material. Section 6.4
addresses the method used to determine the bulk material characteristic
impedance and complex propagation constant. Section 6.5 provides a
comparison between predicted and measured impedance results.
6.2 Ceramic Foam Impedance Model
At Rohr two math models are used to predict the acoustic impedance of
bulk absorbers. The choice of math model is primarily dependent on bulk
absorber type.
For both reticulated and fibrous ceramic foams, the complex propagation
constant, kb, and the characteristic impedance, Z=, are based on Attenborough's
Model (Reference 2) and can be described as follows:
kb=q k [F(p) /G(p)] o.5
Zc = (op_/ kb
where,
/J = (l/n) (8 p q2 S o.))0.5/(#R,_)
F(/J) = 1+ [2( _,- 1)/(Ej/JV-j)] (T(_ /j V-j)
G (p) = l-[2/(p Cj )] T(/JV-j)
(3)
(4)
(5)
(6)
(7)
19

T(,u'_.j ) =Jl(t_¢j ) / Jo(p't/-j ) (8)
T(_pCj ) =Jl(_pCj ) / J.(_ p'I/-.j ) (9)
p_ =p (q/_ G (I_) (10)
and,
q is the tortuosity factor (q 2 1).
k is the air propagation constant ( or wave number = 2 _ f/c) in real number.
n is the dynamic shape factor ( 0.5_<n _<1).
S is the steady flow shape factor (S = 2 - n).
o) is the angular frequency ( = 2 _ f).
# is the bulk porosity.
Re is the steady flow resistance per unit (Rayl/cm).
Y is the specific heat ratio (_1.4 for air).
_: is the square root of Prandtls number (_ 1 ).
Jo and ,/1 are circular Bessel functions of the zero and first order, respectively.
For a given air characteristic impedance, pc, and rigid bulk material
thickness, d, the ceramic foam normalized impedance, ZJpc, can be calculated
by substituting Equations (3) and (4) into Equation (2).
For flexible fibrous bulk materials, the D. J. Sides model (Reference 1) is
normally used. This model can also be used for rigid fibrous foams such as
HTP, but involves more complicated equations and input parameters (i.e.,
Poisson's ratio and Young's modulus of the fibers) than the Attenborough model
for calculating the complex propagation constant, ka, and characteristic
impedance, Z©. In this report, the Attenborough model is the only math model
used to compare predicted impedance data with measured results.
6.3 Impedance Contribution From The Perforated Facing Sheet Over the
Bulk Material
Ingard (Reference 6) has reported that the effect of the perforate face
sheet really depends on whether the facing is in close contact with the backing
2O

bulk material or whether a small gap exists between the two. Figure 6.3-1
illustrates how the perforated facing distorts the flow in the contact area. This
ordinarily does not extend further than about one perforation diameter from the
facing.
If the distorted part of the flow is confined to the bulk material, the facing
causes a reactance as well as a resistive contribution to the total impedance.
Ingard explained that this effect is due to the near field (higher mode) losses in
the bulk material around the perforations.
The equations used for the perforated facing contribution can be expressed asfollows:
Zo /pC = Ro /pC . j Xo /pC
Ro/pc =Sp R, /pc
X,/pc = k [(t/#p) + f(#p) (1. St) Sp]
where,
Ro/pc is the normalized porous face sheet acoustic resistance.
Xo/pc is the normalized porous face sheet mass reactance.
Sp is the perforate plate hole spacing.
f(Sp) is the correction function as defined in Figure 6.3-2.
t is the perforate facing sheet thickness.
& is the perforate plate open area ratio.
Sris the bulk material structure factor
(11)
(12)
(13)
For a single degree of freedom (SDOF) bulk liner, the bulk material is in
close contact with the perforate face sheet plate liner. The total acoustic
impedance, Z(0, is the combination of bulk material impedance, Zb and face
sheet impedance over the bulk material, 7..o(See Equation (1)).
21

6.4 Characteristic Impedance and Propagation Constant Assessment
The complex propagation constant, kb, and the characteristic impedance,
7_.=,of the bulk material can be determined from normal incident impedance tube
test data as described in Section 4.
For example, rewriting Equation (2) for two test specimens of different
thickness, d_ and d2, from the same bulk material type yields:
Z. --j Z= cot(kb d,) (14)
Zb, = -j Zc cot(kb dz) (15)
Equations (14) and (15) can be reconstructed to yield:
Zb, / Zb, = cot(kb d,)/ cot(kb d=) (16)
Since df and d2 are known and Zbf and Zba are measured impedance data, a
numeric process, such as the Newton-Raphson method, can be used to solve for
kb at each measured frequency. Two common problems exist in the use of such
a numeric process. The first is the starting value (initial guess) selection. The
second is that the solution may not converge during the process. Both problems
were experienced in attempting to determine k, for the HTP bulk material,
especially for the samples with limited property data. To help resolve this
problem, test specimens can be constructed such that the value of d_ is equal to
one half of the value of dz, thus simplifying Equation (16) as follows:
Let Zb_2 = Zb_/Zhz, and substitute d_= (1/2) d2 into Equation (16), yielding
Z.,_ = cot(kb(1/2) d_)/ cot(k, d2)
= [sin(k. d2)/cos(k, d2)]/tan(kb(1/2) d_) _ (17)
From Reference 7 (Handbook of Mathematical Functions), it is shown that
tan(k, (1/2) dz) =sin(k, dz)/[1 + cos(k, d2)] (la)
Substituting Equation (18) into Equation (17) and eliminating sin(k b d2) yields
22

Z,,,, = [1 + cos(k,, / cos(k,,dz) (19)
Equation (19) can be further reduced:
cos(k,,d,) = 1/ -1) or
(k, dz) = Arccos[I/ ('Z,,, - 1)] (2O)
Applying Inverse Circular Function ArccosZ from Reference 7 yields an exact
solution for (kb (/2). The propagation constant, kb, and characteristic impedance,
7_=, can then be calculated from Equation (15) at each frequency. Since a
computer solution only provides the principal mode value for the ArccosZ
function, it is import to carefully examine the results and adjust the solution to
higher mode value if necessary. The best way to verify the solution is to
substitute calculated kb and 7_<values into Equation (14). If the calculated Zht
value is equal to the measured Zb+ value within the round-off error range
(accuracy up to second decimal number), then the solution is correct.
6.5 HTP Foam Impedance Model Verification
The impedance model verification is based on room temperature data and
ignores the non-linear factor effect due to sound pressure change. High
temperature turbulence and the non-linear factor can affect bulk material
impedance characteristics, but the change may not be significant for HTP foam
used for AST applications. Future studies which would involve more test data
and modeling techniques to assess the impact of these two factors should be
considered.
Additionally, no data was obtained for in-tube impedance measurements
of the HTP foam with a perforate face sheet. This was due to the fact that the
existing sample holder can not hold the HTP foam specimen with a perforate
face sheet at the proper position. A special adapter ring is required for this
evaluation. Therefore, the effect of facing sheet will not be evaluated in this
report, but should be included in future study.
Figure 6.5-1 through 6.5-6 provide a comparison between predictions and
data measurements of the Characteristic Impedance and Propagation Constant
23

for three different HTP foams (11093, 1438, and 1433A defined in Table 3-1).
Attenborough's math model (Section 6.2) was used to generate the predictions.
The math model described in Section 6.4 and the impedance measurement
results found in Section 4 (see Figures 4.1-18, 4.1-24, and 4.1-25) were used to
determine the measured characteristic impedance and propagation constant
data. The quality of the measured data for the 3.3 pcf system is high for both the
characteristic impedance and the propagation constant throughout the frequency
range. This is attributed to the fact that reasonable differences exist (no
overlap) between the various sets (thickness based) of impedance data.
Execllent agreement exists between the predictions and measurement data
when the values of the Tortuosity Factor, q, and the Dynamic Shape Factor, n,
are 1.095 (q2 =1.2) and 0.91 respectively.
For the higher density HTP foams, measured impedance data at two
different thicknesses overlap exists above certain frequencies (e.g., greater than
4,500 Hz for the 4.91 pcf foam (Figure 4.1-24) and greater than 3,000 Hz for the
5.36 pcf system (Figure 4.1-25)), resulting in calculation difficulties and
anomalies in the generated propagation constant values (Figures 6.5-4 & 6.5-6).
However, it does not affect the results of the characteristic impedance
calculation because at the overlap region the values of characteristic impedance
are equal to the measured impedance data. In future studies, ceramic foam
thicknesses should be selected that provide sufficient differences in data sets,
reducing calculation difficulties and the resultant anomalies. When compared
with math model predictions, fair agreement is observed when the abnormal
measured propagation constant data (derived from impedance measured data
using two different foam thicknesses) in the high frequency range are excluded.
For the 4.91 pcf foam sample, the values of Tortuosity Factor and the Dynamic
Shape Factor, are the same as the 3.3 pcf foam sample. It shows predictions of
the characteristic impedance to be slightly less than the measured data for the
resistance curve at all frequencies and the reactance curve at frequencies below
3000 Hz. Several attempts were made to adjust the Tortuosity Factor and
Dynamic Shape Factor but no improvement in the correlation was observed.
This could be the result of poor sample quality. For the 5.36 pcf foam sample,
the values of 1.342 (q= =1.8) and 0.75 were used for the Tortuosity Factor, and
the Dynamic Shape Factor respectively. These values provide the best fit
between predicted and measured results for both characteristic impedance and
24

propagation constant. No relationship has been found between foam density,
flow resistance, tortuosity, and dynamic shape. Further efforts are required toestablish this relationship.
Figures 6.5-7, 6.5-8, and 6.5-9 show the comparison between impedance
predictions and measurements using the bulk material samples discussed in
previous Section 6.5-1. Good agreement is shown for the 3.3 and 5.36 pcf
samples. For the 4.91 pcf sample, the impedance is slightly under predicted.
However, excellent agreement exists between the predicted and measured
impedance data in a similar sample (113#1437, 4.78 pcf) which is shown in Figure
6.5-10.
The sound pressure effect is not significant at sound pressure levels
below 148 dB. Figure 6.5-11 provides a comparison between predicted data
and measured impedance data for the 3.94 pcf sample (ID # 11107T). The
measured data include the sound pressure levels at 140 dB, 145 dB, and 148
dB. It is demonstrated that the impedance data to be insensitive to the sound
pressure effects. Figures 6.5-11 also shows an unexpected upturns at the up-
end of the high frequency range. No particular explanation has been explored
but the instrumentation limits and measurement errors are probably the reasons
for this unexpected upturns.
The data obtained from the previous Rohr/LMMS joint program on
ceramic systems development were also reported in Section 4.1. The calculated
characteristic impedance and propagation constants are shown in Tables 6.5-1
through 6.5-3 and Figures 6.5-12 through 6-17 for HTP-4 (4.3 pcf), HTP-6 (7.2
pcf), and HTP-10 (8.2 pcf) ceramic foam samples. Material properties are
shown for these systems in Table 3-1. Since the DC flow resistance data are not
available for these samples, no predictions have been made. Of note is that the
impedance values of the HTP systems do not degrade at high frequencies
indicating that this material offers good potential for both inlet and aft fan tone
treatment.
25

7.0 CONCLUSIONS AND RECOMMENDATIONS
7.1 Conclusions
A study has been undertaken to evaluate the acoustic, environmental,
and structural properties of HTP ceramic foam systems and to validate their sub-
scale structure integration capability. The following conclusions can be drawn
from this study.
• The lightweight HTP ceramic foam system (3 to 5 pcf) provides good
broadband bulk absorber capability for use in linear liner applications based
on acoustic impedance evaluation (i.e., resistance target of 1.0 to 2.5 pc and
reactance target of -1.5 to 0.0 pc ).
An approach for incorporating the HTP ceramic foam system into acoustic
sandwich structure was demonstrated for foams with densities in excess of 4
pcf. Adequate structural integrity was exhibited under room and hot
temperature load environments (dynamic shaker tests).
• Based on acoustic impedance testing, 4 - 5 pcf HTP material provides the
best balance of broadband performance, structural integrity and minimum
weight impact for AST applications. However, a 3 pcf HTP material system is
desired since it would be lightweight and provide better acoustic
characteristics for optimum acoustic liner design. A major issue with such a
lightweight system is structural durability. It is anticipated that a denser
system (-10 pcf) would be required for hypersonic applications.
• A Rohr-developed math model for the HTP material system has been
demonstrated to accurately predict acoustic impedance characteristics.
Currently environmental effects, specifically moisture pickup and sensitivity to
Skydrol, limit the use of the HTP system in AST aeroacoustic applications on
a production basis due to weight pickup and the effect fluids have on
acoustic performance.
7.2 Recommendations
Based on the results of this study the following recommendations are
made.
26

Additional effort is needed to further optimize the use of ceramic foam filledacoustic structures. This includes examination of the effect of face sheet
parameters (plate thickness, hole diameter, spacing, POA, etc.) on acoustic
performance. High temperature impedance testing is also required for
optimization as well as sound pressure effects on NLF. Efforts to obtain this
data should be pursued.
Airflow duct acoustic insertion loss studies, including low density specimen
fabrication and prediction of HTP ceramic liner attenuation in the duct, should
be completed.
A relationship between HTP foam density, flow resistance, tortuosity, and
dynamic shape should be established to finalize the impedance math model.
Recent discussions with NASA, Pratt & Whitney and General Electric
personnel involved in the High Speed Research Enabling Propulsion
Materials (EPM) program indicate that a density of 8- 10 pcf would be
optimum for hypersonic nozzle applications. Further study is required to
assess the acoustic characteristics of these high density systems.
It is imperative that all environmental issues (Skydrol sensitivity, moisture
pickup, etc.) be resolved before HTP materials can be used for AST
aeroacoustic applications. LMMS is evaluating manufacturing processes and
after-process additions to address these issues. Additionally, based on EPM
community testing of HTP material of unknowm pedigree, one area of
concern for hypersonic applications is the susceptibility to freeze-thaw
cycling. LMMS has been informed of this situation and is attempting to
understand the mechanisms that will reduce the effect of freeze-thaw cycling
on the HTP materials to EPM-acceptable levels.
While several technical issues exist that must be overcome, this class of
material systems do offer great promise as broadband bulk absorbers and
should be evaluated in engine rig test environments should those
opportunities arise for further verification of their utility.
27

8.0 REFERENCES
. "Application of a Generalized Acoustic Propagation Theory to Fibrous
Absorbents", by D. J. Sides, K. Attenborough, and K. A_ Mulholland, Journal
of Sound and Vibration, Vol. 19 (1), pp. 49-64, 1971.
. "Acoustic Characteristics of Rigid Fibrous Absorbents and Granular
Materials", by K. Attenborough, J. Acoust. Soc. Am. Vol. 73 (3), pp. 785-799,
1983.
3. "Acoustic Behavior of a Fibrous Bulk Material", by A. S. Hersh and B.
Walker, AIAA 5th Aeroacoustics Conference, 790599, 1979.
4. "Acoustic Impedance of Porous Materials", by L. L. Beranek, J. Acoust. Soc.
Am. Vol. 13, pp. 248-260, 1942.
. "Acoustic Characterization of Porous Ceramic Tiles", by U. S. Shrirahatti and
M. L. Munjal, Noise Control Engineering Journal, Vol. 28 (1), pp. 26-32,
1987.
6. "Perforated Facing and Sound Absorption", by U. Ingard, J. Acoust. Soc.
Am. Vol. 26 (2), pp. 151-154, 1954.
° "Handbook of Mathematical Functions With Formulas, Graphs, and
Mathematical Tables", Edited by M. Abramowitz and I. A. Stegun, National
Bureau of Standards, Applied Mathematics Series - 55, 1964.
° ASTM Measurement Standard No. E1050-90, "Standard Test Method for
Impedance and Absorption of Acoustical Materials Using a Tube, Two
Microphones, and a Digital Frequency Analysis System", 1990.
9. Rohr Report, RHR 89-191, "Calibration System Used in the Engineering
Test Laboratories", March, 1989.
28

I,LI.-i
ILl-r-(JU)
n-
OEr_
(4ZO
.J
<{U)fJ
(n
O0
0rrI,LI
n-OLL
(n
EILl(JF--I-
(J
A
U}
0E <]
zU)
_o <1II
° <] <]
ld
<,<{
Z
<
<_
m
I,LI
3:m
.-I
_m
I.LIrr"
D
IL
>.
:)
<{
4)
E
p-(J
°_
U_
o°_°° ._
"1- _-
E0
>
(4m
t--
i4)E
0-
.9
O c-O 0
_.-
|
°_
e_
o
o'_
m _m I-"
e-
o_
_ W
I.-
o
I--i
0
o E
{0 O_ "--
> :;Q.,: E ®
t_
o ___r_ _ - o
E
0
___EO
F1

Existing Turbofan NacelleFuture Turbofan Nacelle I
Future Super-sonic Nozzle & Ejecto I
Figure 2-1 Potential Sound Suppression Systems that could
Incorporate Ceramic Bulk Absorber Material/Structures
F2

,,W "_: I|
1. 3 crn impedance tube.
2. Kulite pressure transducer.
3. Microphone pre-amplifiers.
4. Dual channel signal analyzer.
5. Computer.
6. Graphics plotter.7. Printer
8. Bandpass filter.
9. Power amplifier.
10. High power compression driver.
Figure 4.1-1 Schematic of the Rohr acoustic impedance system
l
_ ONE LAYI_ II_IPt.E
J
(b) Panel Test
m Gla_'r
llltl! l
_/L___!I] _-'==]I
! f]
I
Figure 4.1-2 Rohr Impedance Test Apparatus
F3

I
OQ
C_ _ CD
0 ¢_ Q
I[ IL U
.F'z_U Ca 'Ca
B_qbi) _e.1 i_<.a
W_WMm_
0
0
0
I I I
F4

I
_n
0
r._
°1
_
j, :o S '
I
r_._DNV(I._cII41I
_o o o
0000_
II II II It II IIO_+XO_
i
r_
#i :II -
|°_
I I
0t'-
0
0
0
0
_D
0
Z
00
0
I
F5

I
L._
_._0
E-,0_
: = =
0 0 0
w_w_w_
II II II II Ii II o
O_+XO_ 00
""
M@ - oo
) _ I ".
N " "' I°_r3
I
0
_I:)hlV(I_IdI41I fl_IZI'IVI_INOlq
F8

i
0
[/"_c/'_
.<
Ii
4_
/
_l) "1°
'if ° $-
|.,
! '
- ....,
°°
]
Z',,,-
nn_m_m_4) q,) _ 4,,) (1,) 4,)
II li II li It II
O<I+XO_>
c_z _ c_Z _ _DI I I
oo
t,-
oo0
000
Z
o00
000
0
F7

0
I
0
_Z
Zo
_o
_-.4r. )
r._
0
%
/
t "m :
?
Bi
A%
!
: I!
: _'
(:/. .
i r "__ "
_Z = "
o c3 c3
_ggg
a Z a _ a t,rnC_m_W
U I! II II I! II
O<i+X 01>
{3
o
0
0
t_
0
Z;
O'
000e,]
0
b,.I
{DI I
_IONV(I_IeINI (I_IZIT_N_ION
I
F8

I,,.=.4
0
I I i
_IDlqV(I.'gdI'{I(I_IZI'IVBI}IOIq
F9

I
E-.
L_
O
_Z
LP
I
r-T-q
LP
I
,
i
!
4
i ]im
®
: \
Illt,|l_ll
"111
|1
II
8
. 2
I i
>
"II
I,
f
_: I|II
_:I_'¢
%
B_
i
IDB
z.
|
_P
if| _ |,iI J_, ,,Ill _''' ''I
O o
V
no _ o_ =in_ _
II II il II II II
O<_+XOl>
,
,i
!
.!iII
'. I i
q, i
"i
I
I
ii_llll,, i,,llllll
I I I
._DlqV(I_Id_I (I_IZI_VI_I_ION
I",.
ID
0
" Z
_Ct0or_
00
g_
0
0
FIO

Io
I I I
._IDNV(I_IcII_II(151ZI_IVI41_IONI
Fll

0
Io
I I I
_I3b/V(I_IcII_I (I_IZl_IVI41_IOb/
F12

I
E-
C_
0
L)
C_
I
/ .P
°° •
_+
/
//
_D
It II II
_ _.:_,_
m_m_m_
D X_< II II It If II II
_;_ O<_+XOl:> ,
I ! I
_DNVfl_IdI_I fl_IZI_IVN_ION
0t'-
o00¢D
000
t_
_9Z
0"
000¢xl
0
0
0
F13

=
0_ A A _
|l II I! II I! II il II II II II II
o ._
U
N _
e
<_-
' I-"• =
_,.-:
LL cO
I I
_t31qV(I_I(:II_I (I_tZYIVI_I_tOIq
F14

=
Z',-
A _ _ A _
co 0 <::}+X <>I::>_ _ _ _ I_ E)
• J jr E,t, J _ ' 8
o ,,., ._ _
o _
g_ a
U_-= ,,_ _ o _ ,_
, I-"o =
,_o
.0") ELL C_
HDl_IV(IHcII_I EHZYIVI_IHOI_I
F15

<,-
, I-
,,_-0
°_
!.!_
I I
_IDNV(151cUAII(I_ZI_IV_t:IONI
o
F16

L
°_ fJ
LL
51DNIV(151cII4II(151ZI_IVI41HON
F17

=U0
c5
OE)CO
m
C0imL_
(D,.l-a
(J00
.J
O
U
c0"O(D
EN
(.1gm
..l.a
00<
0_(/)tO (I)i.. (/)(I)
(D
0t-.. Z
, t--
_ •
.__ e"
,,o
0 _
II II II |l III II !1 II II II II II
O _ + X O I:>_ _ _ e} lit I:l::l
E_C3
b-
°°. (3
I ! °| Lo
• /e r- [_
e-_ L
_ e
•_ 4_.._ __. n, _ L_
° i_'.,." ==_0
II )1 1
- _ oo
II
I
H2_IV(IXcIlaI(IHZYIVI_IH01_
I
F18

It')
O90")0
m
0
0O9
q..
0
00r-
Em
0.m
0 (/)0 •<_-• 0o_'_co_I,,,,.
O=>0<e,i
I
L--
0")0.D
(])0r-
O_
0
0.1
(/)
0
0<
I 1
_t3_(I_tcII_II (I_[ZIqVI_I_IOlq
F19

II
ID •
U_x--
F20

I,Dd
I-"I',.-0'_0
m
c_ol
s._
rOO0
,--I
0
rOe--
"0
Em
o_
-'-' I/)
0 In0
1._._
>0
0 e-
!
am
U. ','-
II II II I1-11 U II II II II II II II II 11 II II U 11 II II II II II0 <:1-1-X 0 I>_ _,¢,_ I:llmI_1_O 0 n II 0 _-I- X 0 I>
I
HDl_IV(IHcIIaI (IHZYIVI_IHOIxI
F21

E
mtII
!
o _
00 0
|
I
_T--t_._
_0
LL. '_--
I
0l'..
g0t,D
g
000
g
I
F2_

.. .. . ,..
. Z__=__=_= _
d _° ° ° ° '_ ° ° _ ° ° ° "
II II II II II II U II II I1 II II II il II |1 II II II II II I| II II
,.+++ I +++,_ 0o
CN tOl
-0
.i
la. _-"
o
I i
5131q_(I_I&I_II (I[_ZlqVI_I%IOlq
F23

L_
.m
IJ._-
F24
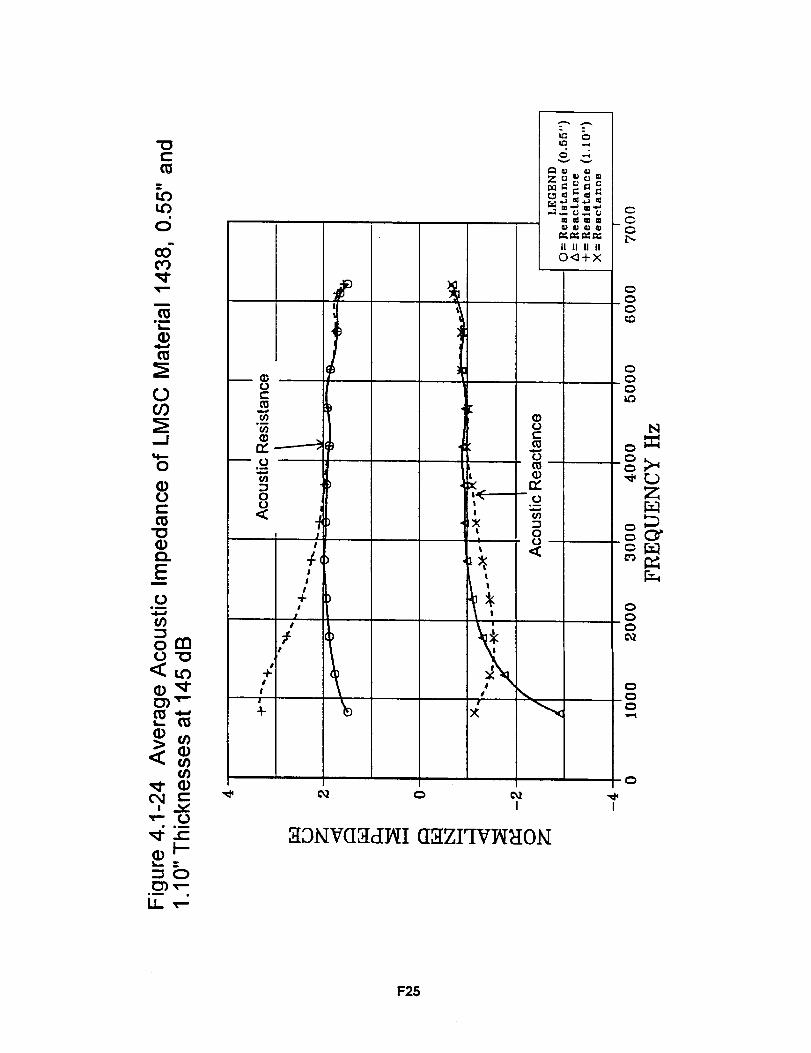
I
_DiqV(151dI_l(I_IZl_IVI_}IOlq
I
F25

_Z
I u U II u I
8 I
o ______
_o 8 _
_ _tDNV(I_tcIt_II (I_IZYIVI_I_tON
tl
F26

o
I I I I
0
F27

I
L_U_
0
Z
r_.<
I
r_
/
) •
) !
m.'_.°w,,l _
II II o
0_ oo
o
o
N
ooo
ooo
o
I I I I
_:_NV(I_d_{I O.gZI_WIAI_ION
F28

l"-
I
(.9U_
0
_._0Z
Q)
0_-_
r_
I
/
u
I I I
HDNV(I_IdI_II (I_IZI2_CI_I_ION
oO
OOo
O
.OO
N
z
000
00C3
.0
I
F29

o0
I
F.._o
I
,/
1 I.|
\
g
m W
II II 0
O_ 00
00C3t_
00_3
o
I I I I
000
b,1
Z
XDl_IV(I.gdl4II (IxzrI¥I_I_IOkI
F30

L_I
C_
cO
Gr.1._ 0L_mc_
II II 0
0<3 00
C_00
C_C_
Z
CY
000
O
I I I I
XDNV(IStclIttI a_izI'IVI_tZIolq
F31

I
e_I
r.r-I
() 'l 0_ °o
0
I I I I
F32

COMPRF._SED AIR
SizeJ of reverbe_mt room: _'= 74"x 7_. NOISE SOUItCZ
Figure 4.2-7 Schematic of Acoustic Air/Noise Flow Duct Facility
F33

0
I
r..)_r._
z_
z_
8_
I
r_(HP) SS0_I NOI,T.tI_ISlqI
L)
F34

o
p..¢O
I
m
[/3
z_zU3C_
O_I
O/
J/-
\
O _ _ O O
(_p) SSO'I NOIJ_H,WSNI
x,,
II
=:
Z
O"
o
o
F35

O
I
E-,
Z_
T_)Zw.w._E-,_
,..l
IC_
I
\
O O O O OL6 _ _ o _6
(E{P)SSO_I N01.1._I.",ISNI
1
,dr
h-,rjZ
O"F._
o
o

.<0
O3
I
r....)_
OQ
o_z_O_
z_
OQ_
I
r-_
r._,h
J
/f
(ffP) SSO_I hIOI.I._I_SNI
v_
N
Z
F37

O
--4
I_U
[..)CD
[n=:
Q_Z oo==
z_OZ
OO_
O_
I
-4[z.]
J
k
SS01 NOI.I._I._SNI
0Z
F38

0
I
O_
IC_
/
J
(HP) SSO'I NOI&H._SI_II
V
oZ
F39

cO 0
T.. ¢..-i--
a
olm__tf)_DO_
_d
¢.-Oo
_cu
..df/)
.o
_0D
¢...
e_
U),._
o Z-0
Ox---
_,=
00.c$
0,.C2
&_z
_D t_
II II
I.I_LL _
I
_0
il IIO_
\ \I
dF
",C"J
(liP) SSO'I I_OI_LH_ISb_I
>.,0Z
CF
F40

°_T_ e-
l'-
(DO')
e-(Do00n,"
,_,I e->,,
,-.-a,.9.0,,
(/)oD._j0O
,.-_,O
o_ lh,,.
e-o _
o_
_ 0o-_0
O,r--V
0o,--_
C4 e-
ID
L/_ tJ_ _
o
,,..]noII IIo_
?
\_-, F
ho.._
(ffp) SSO"INOI.I.N_[SNI
Z
(2:
F41

O0 U.:... t-
(DO)_d
O-c: 0COn,'
L_
LL._0oD
_0
r-
U r-°_
0 Uml
U..C:<_i--
ll .w
I.I.LI_ _
_o
II IIo_
._.o
(HP)SSO] NOIJ_H.TSNI
v
_J
_42

0
,..q
I0
0
Z
E-I i-1
_or._t_
.<r._
!c,q
/\
I
XDlXlV(IStclItlI (IStZI"IVlhI_IOhI
II IIO<
0
Q0
0
Ou')
N
Z
O00
0
I
F43

0
OO
I
¢0
0
Z
I==,1
I
%.
(p
t
/
l/t3hV¢(I_cll4II
\
I
(I_IZI_IV_I01_
Z_._
II II0<
0
I"-
000
0
N
Z
C_
I
F44

0
p-]
I0c0
0
Z
E-_,-1
_z
r._
c_
I¢q
\
\
I
51DhlV(ISIcIIhlIGSIZI_IVIAI}IOI_I
II IIO<3
00
0
0O
Z
000
o
I
F45

F4_

0_4
J
U')
e-_ U'Jz z
u _-_w . o_,,
l'T)l.l.I__J_LLI l_...JF_"_--q "_ >" '--qI_
U')
e'r_ I.L.. ,_
0
F47

_k o_+xo_°_II I! il II II !i II II II 11 II
.o_ _, __---_ __ -_
o,, < _Or
m _u
0 0_ °_
!e4,-"
1,03
,...,I
I I
_t:]hlV(IStcU4II(I_tZYIVIAIHON
F48

I I i _ _
0 0 0 _ _
_ _ _ 0 0 0
o_ _ __0
_ °_
0 oo--
00
,_.._!
(I)
1 I
,73_qV(I_IcII_l (I_TZI_IVI_HOIq
F49

)...,
1,,..
e-o
"oe-
CO
EtO0
LI.
C)
Et_I,..
G) .w.,
w-i--OU_
c) "r"
"1_ 0
Eo"" °_____..
c) Q-mm
0 0._
00
LO--!!
(b
u. oO
o(..
(/)o_
m I/)I!.)
n,
.IL)--
CI)
ou
II
I!II
I I I _ __ _ I 1 I
II II II II II II II II II II II 11
t
I I
_{3NVflH_I_I(IHZI_IV_HON
F50

I I I _ __ I_ I I I
_-_W I,,, _ 0 0 0
F,,_lCJ _ _J 0 'c,J f,,)
•,,w w., _ _ ._ F.,j._ _ .,., {j .,,.w f,J
"_ --_"m_ 11 11 11 11 11 11 11 11 11 il 11 11
°il
r_
o,, _ o__0o-r- _
o a- _
0 0
<*..00
I I I
XDIXlV(IIHclIaII(IXZI_IVBIHON
F51

:3
0:3I,,-
cO
0
"C3
_9
"r
,,o0 n, >
E Cn
!-- c_
',-- l-OLL i
o"r"I= I
"_ 0¢)nc,J .._Eo_ "_" 1oil
09 ._-.-
0 0
<,-, lg00
I
e_m"
Q)
ID0e-
0
oo<
I
_DlqV(151_II_l (ISIZIqVI_HOIq
0
ooe..,D
o
Z
ooo
r_
0
I
F52

0 0
<*.,00
oO.-JI
(1)
5.=.
.___
i I
_I31qV(IZ_IIql (IHZI_IVIAIHON
o
F53

tO
C_
CD
__ -_ r
° ° Is.=. 0
G}_I"01.I_<DOo-r"
"0 0
EoL_
o O-
¢.--0 0
o_
C_
!
I..=,
!
J
il II I1 II U l! II |! II li II
i i
F54

0 e-0 0
00 0,_....J ,_
I
0
L_
I I
0
F55

_._ a t t t
._DNIV(I_dI_/Ifl_ZIT¢/41}IOI_I
F_

_T,_
T,,.E.._
_,<
r.¢2_
r,_['-'
r._'<
¥ #
I:
I I I
_DNIVflS_dI_I (I_IZI_IVI_I}IONI
0
II II II II
O<i+X
o00
000
000
0o0
0
0
I
Z
F57

I,-,-,I
D"J I:_
._r_
0_
I ,-.-,
Ill
II II II IIO_+X
!
I I I
._:}bIV(I_cIP_I (I_tZI_IVKHOIq
0
o
o
N
000N
Z
,¢20
0
I
F58

_T_
F._
Z_r._
0_
L_I-','4
_T_
I
i,' I
l::l""
II II II IIO_+X
I I I
XDlqV(I_tcI_I flXZI"IVI4IZIONI
0_0
0
000t_
000
N
0C30N
000
Z
CF
0
I
F59

F60

o
i oc_
Z0
I I t t
XDI_V(IXcIHI (IXZI"IVI_I_IOhI
F61

m
Z
c_
w_z
%t
n
I
I
I
I
!
I
i
!
t
il II II li
O_+X
I
XDklV(IXcllttI aXZI'IVI_I}:IO_
o_0
0l"-
F62

_ °
._IDNVfl_tdI4II (I_IZI'IVI4I_IOhI
F63

Or,.)
l"- [=._
Z
cO
¢
ell _ 0
_ I11Ill I_III II II II
O_-FX
I I I I
_IONV(I,_dIAII (I_IZI2"VIAINON
O_O
0r_
0
_D
00
bl
o I:i:I
r_Z
C_
00
000
0
F64

Figure 6.3-1 Sound Wave Distortion Diagram
(Repmcluced from Reference 6)
', =-..:. I1:/_ .,_ _--_._._
_:__, . _ _,r-P I " **
:_.._..+_.-_. "-_,--,-'
I--_--i
_.,,_'_._.._',_, I",_;-_._ I
r
(dSnistheperforateI_lateholes_acin._;d isthebulkthickness
(a)Nofacingsheet
(b)Smallgapbetweenperforatedfacingandbulkmaterial
(c)Nogapbetweenperforatedfacingandbulkmaterial
4.5
4.0
3.5
3.0
2.5
2.0
1.5
1.0
0.5
0.0
Figure 6.3-2 Function f(Sp)
(Reproduced from Reference 6)
\
%
0.0 0.1 1.0
@
F65

Z<C
l,,,=,i
I
c.c3
I I I
_I31_IV(I_cI_l (I51ZI_iVt_I_Olq
F66

U_
r_
Q
I I I
HDI_I }IS_d &NVZghIOD NTOI&VOVdO_Id
F67

! !
F68

I I I
HDlqI Hgd JANIV.I.SIq03 lqOI.l.VDVdO_Id
F69

Z
I,,-,I
I,--4
[-,
I,,--4
[-,[..)_
l,--,,i
!Li'D
l-,,-I
i:::i
II
I I I
:iIDlXIV(I,Td_.tI (IXZIq_VI_I_IO_
0
l"..
o
O
00o
0
z
oo0
oo
o
FrO

E-Z
U3ZO
_ _='
.<
IU_
_d
_ o
II II o
Q! ©
|
)
II o
I I
HDlqI HHcI J_hIVJ_ghIOD lqOIiVDVdOHd
o
N
_DZ
ooo(xl
c
o
I
F71

I I I
F72

I !
F-/3

ol,-I
[.t.1"_l
le-ug._
II Ii 0
0 •
0
5IDNV(I_IcII_I (I_ZITCI41HON
F74

_.,.4
_z,.:
o_
I I
_DI_/V(I_IdP/I (I_ZITVI_I_IOIq
F/5

_T_
°o
I I I
XDNV(I_dlal (IXZI_IV_}:ION
F78

Z
_9
L)
L)
ILr__D
k-.i
_T_
CEU .....-_
I. I
<_
J <_
<1
8<
|1,1111|1 .,l|llll, lJ|l|lll, 11161111| Illll,lll
O O O O O O
© _ _ c;I
II II
O<1
i|l)ll.,
o
I I
HDhIV(I_IdtgI (IHZI'IVI4i_IOlq
o
b-
z0
g_
o
¢4
0
,0
,,4
0
_o
F77

0
0 o
0
.<
0
ILO
rl,,tl:l, ,,llll,Sl
\
|,lll|,ll
//
/IJI,,4W,I
/
o
m_
II li
O<J
rr
<1
/<3
//
0 0 _ 0 0
I I
!.0
0
0.0
0
o_
:o_--_g_:_
0
0.O
0
0
0.0
0_Jl
0
.0
I
HDhlI _I,';i'cI £1qV£SlqOD NOI£VOVclO_Id
F78

o
L_
L_CJ[/]
0
OQ
E_L)
[J
I
CD
_T_0
--!8/<
/f
<]
,1
]
<]
<]
/,1
<_
<_
ell,,Jll,
8<
,|ll,ll,|
II ItO<
ill,,_,g,
I I I
_3b/V(I_IcIPII (I_tZI'IVIAI_IOIq
!CD
O
z
O
OO@4
O
_=_
o
CD
F79

L_
09
0
Z
Z _0 o
Z=0
0
I
o
¢,o
HOlqI
It II
O_
J/
H_d .I.blV.I.ghIO3hIOI.I.VDVdOHd
0
0o
0
00o
Z
0
000
c3
0oo
C3
o
FSO

O
[J)-,--i
L_
L_0Q
O
OQ).--4
L_
m
E)
ILr_CD
L_
\?
n G) - I_
° l
8<
O
JJ/
O
CD
\/
<]
/<]
\<]
_z_
O
z
II IIO<]
8<
C_
O.O
OC_
o
__
oc_
-C_C_C_
O
,5-O
O
O
C_
O C_ O O O
c_ c_ c_ _ ,6I I I
XDNV(IXcII_/I fl_IZI_IV_I_ION
F81

<0
C_
r_
0
Z
0
I
r_
8
\3
o
<
I///
//
//
,,,,|,,,, ,i,,0,,,i
<<
II II
I I I
H3NI H_d ,.LNV£SNO3 NOI£VDVdO_td
0
oso
o
c;0
tO
0
000ifJ
os
:o_:_os
o
0.0o¢xl
0
0
'.-"l
o
o
F82

Table 1.1-1. Subsonicand SupersonicCommercialTransportEngineOpera_onalRequirements
Subsonic ApplicationsOperating Conditions
Max. Temperature Usage
Mach Number
Overall Sound Pressure
Projected Life
Noise
Exhaust Gas Components
1,100 OF
0.6
160 dB
> 50,000 houm
FAR 36 Stage 3 by year 2000
CO x, Ox, NO x, Na (oxides),
CI, S Unburned Fuel
Supersonic Applications
_>2,000 OF
0.8 - 2.4
165 dB
• 18,000 houm
FAR 36 Stage 31no boom
over populated areas
Unbumed Fuel, Hydraulic
Fluids
T1

@)
E
oU.
EL_
D.
"I-
0
°_
Q.oD.i.)
°_
ou
r"
L_
o _-
E _'-" >
I 0 I _o_0 oo_c_ _©: I I I I , I I IC'_I_I I._I._}I.l'_l.I'J1.01.0(,')0•}
, , I , ___&& I , I I I I
(#)
odddddddddddd dddodd

I.I.
E
8O.I--I-
.oIZ.
8
I
L_
,,itI!
I--
m_ E
o
8_- m
o
_c m
o
m _a
_ °_ _
_ V
i
0
I I
I I
I I
;_..-
o _
CN GO
e,i e,i
o o
II1
T3

%'4

U
Et_
=>,
G)a.o_
I-<0n
o34:::oB
m
(D
m
Et_0
14.
.u_EL_
ot-U
"10Ct_
(D
E°_
Ct_
l.-
.qf-,!
03
G)..Q
I-
(DU. IL._ 14.
_'* 0 0 0U)Z Z Z
I.-
(/)
U
0
dz
A
W
EID
A
N"I"
O"
:i,-
UQ3 ,_- t_l ,ql.
CO
T5

Table 6.5-1
Characteri sti cCase No. = i
HTP-4 FOAM(4.3 PCF")
Impedance ZO and Complex wave number CalculationAir RhoC = 41.35 thl= 0.30 th2= 0.60
Freq. Impedance #! Impedance #2 C-Impedance Wave Numbers
824.0 1.10 -6.39 1.24 -2.81 2.89 -1.37 1.36 -0.82
944.0 1.03 -5.60 1.36 -2.35 2.97 -1.42 1.59 -0.941064.0 1.07 -4.88 1.41 -1,98 2.85 -1.32 1.71 -I.021184.0 1.05 -4.28 1.45 -1.59 2.73 -1.29 1.85 -1.121304.0 0.99 -3.81 1.49 -1.50 2.60 -1.31 1.97 -1.241424.0 0.92 -3.43 1.53 -1.36 2.49 -1.34 2.11 -1.351544.0 0.91 -3.14 1.59 -1.25 2.42 -1.35 2.23 -1.45
1664.0 0.93 -2.92 1.65 -1.15 2.40 -1.33 2.35 -1.521784.0 0.98 -2.72 1.71 -I.06 2.37 -1.27 2.4_ -1.59
1904.0 1.02 -2.52 1.75 -0.97 2.33 -1.21 2.53 -1.662024.0 1.04 -2.33 1.77 -0.91 2.27 -1.17 2.63 -1.742144.0 1.02 -2.15 1.79 -0.87 2.20 -1.15 1.73 -1.832264.0 1,00 -1.99 1.79 -0.84 2.12 -1.14 2.84 -1.912384.0 0.99 -1.86 1.81 -0.83 2,06 -1.14 2.95 -2.002504.0 0.99 -1.76 1.84 -0.83 2.03 -I.14 3.07 -2.062624.0 1.00 -1.57 !.88 -0.82 2.03 -1.13 3.17 -2.!22744.0 1.03 -1.59 1.92 -0.79 2.03 -1.10 3.27 -2.152864.0 1.06 -!.49 1.94 -0.76 2.01 -!.05 3.36 -2.222984.0 1.07 -!.40 1.93 -0.73 1.97 -I.01 3.45 -2.283104.0 1.05 -!.30 i.90 -0.73 i.9i -0.98 3.55 -2.343224.0 1.03 -1.21 !.87 -0.74 1.85 -0.97 3.67 -2.403344.0 1.01 -1.15 1.85 -0.77 1.79 -0.97 3.79 -2.47
3464.0 1.01 -!.11 1.85 -0.81 1.77 -0.99 3.90 -2.523584.0 1.03 -!.08 !.88 -0.8¢ 1.78 -i.00 4.00 -2.563704.0 1.08 -i.05 !.93 -0.84 1.82 -0.99 4.07 -2.60
3824.0 1.14 -i.01 1.98 -0.80 1.88 -0.94 4.12 -2.64
394_.0 1.19 -0.95 2.01 -0.75 1.90 -0.88 4.19 -2.694064.0 !.22 -0.86 2.00 -0.69 1.90 -0.80 4.27 -2.754184.0 1.21 -0.79 1.94 -0.66 1.84 -0.75 4.36 -2.83_304.0 1.17 -0.74 1.87 -0.69 1.75 -0.75 4.49 -2.884424.0 1.14 -0.71 !.8! -0.75 1.70 -0.78 4.63 -2.904544.0 1.12 -0.7! 1.77 -0.83 1.66 -0.84 4.78 -2.924664.0 1.13 -0.72 !.76 -0.9! 1.65 -0.90 4.91 -2.94
4784.0 1.16 -0.72 !.78 -0.97 1.67 -0.94 5.05 -2.954904.0 1.22 -0.69 !.82 -0.98 1.72 -0.93 5.15 -2.99502_.0 1.26 -0.63 1.86 -0.93 1.76 =0.88 5.23 -3.005144.0 !.29 -0.54 1.86 -0.84 1.77 -0.79 5.33 -3.025264.0 1.27 -0.45 1.81 -0.76 1.73 -0.70 5.42 -3.035384.0 !.22 -0._2 !.72 -0.73 1.65 -0.67 5.5! -3.04
_m0.,0 1 18 -0.42 _.64 -0.76 1.58 -0.69 5.59 -_ n55624.0 1.18 -0.46 i.60 -0.82 1.55 -0.75 5.66 -3.07
5744.0 1.22 -0.49 1.62 -O._O 1.58 -0.82 5.7_ -3.08
_86a 0 1 31 -0 "_ _ 70 -0.92 1.67 -0.84 5.82 -3.!2
5984.0 1.42 -0.42 !.8! -0.88 i.78 -0.78 5.93 -3.1$6104.0 1.48 -0.29 !.88 -0.72 1.84 -0.54 6.07 -3.296224.0 !.42 -0.!3 !.74 -0.57 1.74 -0.49 6.30 -3.i5
Impedance |i = measured impedance at a foam thickness of 0.3 inch
Impedance |2 = measured impedance at a foam thickness of 0.6 inch
C- impedance and Wave Number = calculated characteristic impedance and propagation
constan_ (per inch) based on the values of impedance |i and |2.
T6

Table 6.5-2
Charact eri sti cCase No. = i
HTP-6 FOAM(7.2 PCF)
Impedance ZO and Complex wave number CalculationAir RhoC = 4!.35 thl= 0.31 th2= 0.62
Freq. Impedance #I
824.0 1.39 -5.77944.0 1.41 -5.03
1064.0 1.43 -4.291184.0 1.40 -3.751304,0 1.38 -3.331424.0 1.36 -3.001544.0 1.39 -2.741664.0 1.45 -2.531784.0 1.52 -2.331904.0 1.58 -2.142024.0 1.62 -1.972144.0 1.63 -1.832264.0 1.63 -1.712384.0 1.64 -1,622504.0 1.67 -1.562624.0 1.71 -!.492744.0 1.76 -1.412864.0 1.80 -l.3a2984.0 1.8! -!.273104.0 1.80 -!.2!3224.0 1.77 -1.!83344.0 1.75 -1.!63464.0 1.76 -1.173584.0 1.81 -1.!83704.0 1.88 -i.163824.0 1.97 -1.113944.0 2.03 -1.044064.0 2.06 -0.954184.0 2.05 -0.894304.0 1.99 -0.904424.0 1.93 -0.954544.0 1.91 -!.034664.0 1.90 -!.124784.0 1.94 -1.!94904.0 2.01 -!.205024.0 2.09 -!.155144.0 2.!2 -!.055254.0 2.09 -0.945384.0 2.01 -0.8S5504.0 !.93 -0.925624.0 i.88 -0.9%5744.0 !.92 -!.075864.0 2.02 -!.!!5984.0 2.17 -i.056!04.0 2.29 -0.866224.0 2.28 -0.65
Impedance
Impedance
Impedance #2 C-Impedance Wave Numbers
2.22 -i.98 a..23 -I.79 2.0"3 -I.06
2.46 -1.56 4.20 -1.78 2.26 -i.i62.61 -1.24 4.02 -1.70 2.45 -1.282.76 -1.03 3.87 -I .69 2.65 -i .392.91 -0.93 3.73 -1.71 2.84 -i .493.05 -0.9! 3.61 -I .75 3.02 -i .583.20 -0.92 3.54 -1.76 3.18 -i.683.34 -0.92 3.52 -1.74 3.33 -1.753.45 -0.91 3.49 -1.68 3.46 -!.823.52 -0.91 3.45 -1.62 3.59 -1.903.53 -0.96 3.38 -1.57 3.71 -1.973.49 -!.05 3.27 -1.57 3.83 -2.063.44 -1.17 3.16 -1.58 3.96 -2.153.39 -I .29 3.08 -1.61 4.08 -2.233.35 -! .39 3.03 -1.64 4.20 -2.303.35 -1.47 3.01 -1.64 4.32 -2.363.34 -1.49 3.01 -1.6! 4.4! -2.413.31 -1.49 2.99 -I .57 4.50 -2.463.22 -!-48 2.93 -1.53 4.57 -2.533. !0 -!.48 2.84 -!.50 4.65 -2.592.96 -1.53 2.73 -1-51 4.7¢ -2.862.83 -!.59 2.82 -1.54 4.84 -2.732.73 -1.66 2.55 -!.59 4.93 -2-8!2.70 -1.69 2.55 -1.61 5.00 -2-902.73 -!.68 2.59 -1.60 5.06 -2.972.79 -I.58 2.67 -1.51 5.06 -3.052.83 -1.47 2.72 -!.40 5.10 -3.122.82 -1.33 2.71 -1.27 5.10 -3.192.73 -!.25 2.64 -!.20 5-17 -3.282.60 -!.25 2.53 -i.20 5.20 -3.382.46 -!.33 2.40 -1.28 5.28 -3.472.34 -!.44 2.30 -!.39 5.4! -3.562.27 -:'......56 2.24 _1.50 5 52 _R 6,_2.26 -i.65 2.24 -!.59 5.62 -3.702.30 -1.67 2.29 -!.62 5.70 -3.762.38 -I.60 2.37 -1.55 5.72 -3.822.43 -!.45 2.42 -!.40 5.69 -3.882.38 -!.29 2.37 -!.25 5.66 -4.002.2B -!.!8 2.27 -1.!5 5.60 -_.i32.i8 -!.!8 2.17 -!.15 5.58 -4.222.09 -_.23 2.09 1.21 5.62 " "_2.09 _I q0 2.09 -; 29 _.66 ' _':2 18 ; "_I 2.18 -1.30 _ 5= : "_2.31 -!.20 2.31 -!.19 5.63 -5.252.38 -0.90 2.38 -0.90 5.22 -5.272.25 -0.58 2.25 -0.58 11.80 -6.77
#i = measured impedance at a foam thickness of 0.31 inch
#2 m measured impedance at a foam thickness of 0.62 inch
C- impedance and Wave Number m calculated characteristic impedance and propagation
constant (per inch] based on the values of impedance |i and |2.
T7

Table 6.5-3
HTP-10 FOAM (8.2 PCF)
Characteristic Impedance ZO and Complex wave number CalculationCase No. = 1 Air RhoC = 40.97 thi = 0.43 th2= 0.87
Freq. Impedance #i impedance #2 C-Impedance Wave Numbers
824.0 1.52 -3.95 2.89 -0.91 4.19 -i.62 1.g0 -0.94944.0 1.70 -3,40 3.23 -0.66 4.18 -1.51 2.07 -1.04
1064.0 1.82 -2.91 3.49 -0.55 4.09 -1.43 2.22 -!.151184.0 1.85 -2.51 3.66 -0.60 3.93 -1.44 2.38 -1.261304.0 1.89 -2.20 3.75 -0.72 3.78 -1.44 2.52 -1:381424.0 1.93 -1.97 3.82 -0.88 3.69 -1,46 2.67 -1.48
1544.0 1.99 -1.79 3.85 -1.02 3.62 -1.48 2.80 -!.571664.0 2.07 -1.63 3.85 -!.12 3.58 -1.46 2.92 -1.661784.0 2.14 -1.48 3.83 -!.17 3.54 -1.42 3.03 -1.741904.0 2.19 -1.35 3.75 -I.21 3:47 -1.37 3.12 -1.832024.0 2.21 -1.25 3.63 -1.28 3-38 -1.36 3.22 -1.922144.0 2.21 -1.19 3.47 -1.36 3.25 -1.39 3.33 -2.002264.0 2.Zi -1.15 3.31 -1.44 3.13 -1.43 3.43 -2.102384.0 2.22 -I. !4 3.18 -i .52 3.03 -I .47 3.53 -2.192504.0 2.25 -1.16 3.10 -i.59 2.98 -1.53 3.62 -2.272624.0 2.31 -1.16 3.06 -!.62 2.96 -!.55 3.69 -2.372744.0 2.37 -!.16 3.03 -!.61 2.96 -1.55 3.75 -2.462864.0 2.41 -1.14 3.02 -1.58 2.96 -1.53 3.80 -2,522984.0 2.43 -1.10 2.96 -1.54 2.92 -1.49 3.88 -2.603104.0 2.44 -1.08 2.91 -1.50 2.87 -1.45 3.92 -2.693224.0 2.44 -1.09 2.85 -!.51 2.83 -1.46 3.97 -2.753344.0 2.43 -!.14 2.78 -1.55 2.76 -1.51 4.04 -2.853464.0 2.42 -1.20 2.72 -1.60 2.71 -1.55 4.06 -2.923584.0 2.47 -1.25 2.73 -1.62 2.72 -!.59 4.12 -3.023704.0 2.54 -1.2_ 2.77 -1.58 2.76 -1.55 4.14 -3.!6
3824.0 Z.65 -1.18 2.87 -1.49 2.86 -1.47 4.17 -3.243944.0 2.73 -1.04 2.93 -1.31 2.93 -1.30 4.2! -3.364064,0 2.73 -0.91 2.97 -1.15 2.96 -1.14 4.13 -3.364184.0 2.69 -0.80 2.88 -t.04 2.88 -1.02 4.23 -3.454304.0 2.60 -0.79 2.80 -1.00 2.80 -0.99 4.16 -3.49
4424.0 2.53 -0.88 2.66 -1.08 2.66 -1.07 4.28 -3.674544.0 2.45 -!.02 2.57 -!.22 2.57 -1.21 4.3! -3.664664.0 2.39 -1.16 2.49 -!.38 2.49 -1.37 4137 -3.674784.0 2.37 -!.30 2.45 -!.51 2.45 -!.50 4.4! -3.734904.0 2.39 -!.37 2.47 -!.57 2.47 -!.56 4.35 -3.855024.0 2.44 -1.34 2.52 -I.55 2.53 -1.54 4.37 -3.805144.0 2.48 -i.23 2.58 -!._2 2.58 -1.41 4.3! -3._25264.0 2.45 -!.08 2.57 -i.24 2.57 -I.Z4 4.18 -3.8!5384.0 2.34 -0.98 2.47 -1.13 2.47 -!.!2 4.!2 -3.835504.0 2.22 -0.97 2.35 -i.!i 2.34 -l.!O 4.03 -3.835624.0 2.11 -1.06 2.24 -!..17 2.23 -!.i7 3.88 -3._05744.0 2.06 -!.!7 Z.19 -!.29 2.!8 -1.28 i.88 -3.9!5864.0 2.!1 -1.27 2.24 -!.39 2.24 -!.38 3.8Z -3.945984.0 2.25 -i.30 Z._0 -i.40 2.39 -!.39 3.75 -4.026!04.0 2.46 -!,!7 2.60 -!.27 2.50 -!.27 3.51 -'4.0¢62Z4.0 2.58 -0.94 2.74 -!.0! 2.73 -!.01 3.70 -4.03
Impedance #i = measured impedance at a foam thickness of 0.43 inch
Impedance |2 = measured impedance at a foam thickness of 0.87 inch
C- impedance and Wave Number = calculated characteristic impedance and propagation
constant (per inch) based on the values of impedance |i and |2.
T8


REPORT DOCUMENTATION PAGE FormApprovedOMBNo. 0704-0188
PulPit reporting burden tot _is collection of informalion is estimated 1oavorage 1 hour per re=k_on=e, inc4udingthe time for reviewing instructmn=, searching e_istmg ,_U= sources.gat;_mng anti maintaining the data needed, and coml_ and reviewing the collection of info_nation. Semi comments regarding this burden eotirnste or any o_lNir aspect ofcollention of mfomlation, including suggestions for reducing this bu_len, to Washingto_ Headclulrters _. Directorate lot Information Otoeratlons and F_. 1215 Jeffemon DsvisHighway. Suite 1204. Arlington, VA 22202..4302. and to the Offme of Management and Budget, Paperwod( Reduction Project (0704-0188), Washington. DC 20503.
1. AGENCY USE ONLY (Leave blank) 2. REPORT DATE
July 19974. TITLE AND SUBTITLE
Lightweight Ceramics for Aeroacoustic Applications
6. AUTHOR(S)
H. W. Kwan, G. T. Spamer, J. Yu, and B. Yasukawa
7. PERFORMINGORGANIZATIONNAME(S)ANDADDRESS(ES)
Rohr, Inc.; Chula Vista, California and
Lockheed Martin Missiles and Space; Sunnyvale, California
g. SPONSORING/ MONITORINGAGENCYNAME(S)ANDADDRESS(ES)
National Aeronautics and Space Administration
Langley Research CenterHampton, VA 23681-0001
3. REPORTTYPE AND DATES COVERED
Contractor Report5. FUNDING NUMBERS
C NAS1-20102TA 4WU 538-03-12-02
8. PERFORMING ORGANIZATION
REPORT NUMBER
10. SPONSORING/MONITORING
AGENCY REPORT NUMBER
NASA CR-201709
11. SUPPLEMENTARY NOTES
Langley Technical Monitor: Tony L. Parrott; Final ReportKwan, Spamer, Yu: Rohr, Inc.; Yasukawa: Lockheed Martin
12a. DISTRIBUTION/AVAILABILITY STATEMENT
Unclassified - Unlimited
Subject Category 71
12b. DISTRIBUTION CODE
13. ABSTRACT (Maximum 200 words)
Rohr, Inc., in cooperation with Lockheed Martin Missiles and Space (LMMS) Division, has investigated the useof a HTP (High Temperature Performance) ceramic foam for aeroacoustic applications under NASA Contract
NAS1-20102, Task 4. HTP ceramic foam is a composition of silica and alumina fibers developed by LMMS.This foam is a lightweight high-temperature fibrous bulk material with small pore size, ultra high porosity, and
good strength. It can be used as a broadband noise absorber at both room and high temperature (up to1800 °F). The investigation included an acoustic assessment as well as material development, and
environmental and structural evaluations. The results show that the HTP ceramic foam provides goodbroadband noise absorbing capability and adequate strength when incorporating the HTP ceramic foam systeminto a honeycomb sandwich structure. On the other hand, the material is sensitive to Skydrol and requiresfurther improvements. Good progress has been made in the impedance model development. A relationship
between HTP foam density, flow resistance, and tortuosity will be established in the near future. Additional effortis needed to investigate the coupling effects between face sheet and HTP foam material.
14. SUBJECT TERMS
acoustic treatment; engine noise suppression; high-temperature bulk liner;lightweight ceramic foam
17. SECURITY CLASSIFICATIONOF REPORT
Unclassified
!18. SECURITY CLASSIFICATION
OF THIS PAGE
Unclassified
19. SECURITY CLASSIFICATIONOF ABSTRACT
NSN 7540-01-280-5500
15. NUMBER OF PAGES
130
16. PRICE CODE
A07
20. LIMITATION OF ABSTRACT
Standard Form 298 (Rev. 2-89)Prilscri0ed by ANSI S,IO Z39.18296-I0_