l'ile kinetics of copper etching in ferric...
TRANSCRIPT

p
'l'IlE KINETICS OF COPPER ETCHING IN FERRIC CHLORIDE -I-IYDROCHLORiC ACID SOLUTIONS
Christine Bryce
Department of Chemical Engineering McGiII University
Montreal
March 1992
A Thesis submitted to the Faculty of Graduate Studies and Research in partial fulfillment cl.' the requirements of
the degree of Master of Engineering
© Christine Bryce 1992

ABSTRACT
The killctic" of copper etching were studied ming a ferric chloride
hydlOchloric aCld etchant in a ~tlrred-tank reactor. At a constant add molarity of
ahollt (U~4 and Feel) concentrations varying From 0 to J M, the cteh rate was found
10 rcach a .llaXimUIll at about 2 M FeCI3. The use of a ferric nitrate-nitric acid
~oluti()n Ylcldcd ~il11ilar re~ult~ hut suhstantially reduced etch rates.
Sincc the nitrate ion i~ essentially non-complexing with the ferric ion, the
pre~ellcc of chloro c()mplexc~ of the ferric ion in FeCI3-HCI elchant solutions was
inve~tigatcd. The FcCI2 t and FeCI10 complex ions were found to con~titute the
majority of fefric ~pccies al ail concentration~, and their respective enhancing and
inhihiting cffcct~ incorporated into Cl rate equation:
r=A
whcrc Illi i~ the molality of ~pecies i. The rate constant, A, was fou ml to fit an
Arrhcllill~ plot for a tcmpcraturc range of 30-50 0 C.
Expcrimenb performed with etchants containing both the chloride and nitrate
i()n~ ~h()wcd ctch ratc~ increa~ing uniformly a~ the chloride fraction of total anion
inclca~cd. The Fe ('[2 + complcx continues to exhibit an enhancing effeet in these
~()Iuli()n .... , hut al the conditions chosen the concentration of FeCI} U remain~ constant.
The FeCI:? t , !1owever, appear~ to inhibit the eteh rate.

1
-.
1\
Rl~SUM(:
La cinétique de l'attaque chimique du cuivre a été étudiéè avcc lInl' ~llllltl()ll
de chlorure ferrique et acide chlorhydrique dan~ un réactl:lIr l'Ol1~tall1l1lèllt agitt'
Avec une concentration d'acide fixée à cnviron O.~4 l'vI ct de" COI1l'èlltl at iOIl" dt,
Feel3 qUI ont varié entre 0 ct J M, la vitc""c d'attaqllt~ atteint 1I1l l11a\1111I111I \'CI" 2
M Feel3. L'emploi d'une ~olutiol1 a d0l11lt1 des résultats "lll1ilam.'''', ll1;m Ic~ \'itt'~~t'"
d'attaque ont été réduits considérablcment.
Puisque l'ion nitrate ne forme pa~ d'e~pèces complexc" t'Il !\ollit ion awc 1'1011
ferrique, la présence d'espèces cOl11plexc!\ forll1éc~ dan" Ic~ ~()llItl()Jl<, dl' "e( ï \ l't' I< ï
a été examinée. Le~ iOTl~ complcxe~ qui con~titllcnt la plllp:l1 t d'c"pccc" pOlll la
gamme de conccntration~ de FcCI 1 ~()nt FeCI2 -1 ct FcCI,IJ, ct leur" ,ùle" "ont
d'améliorer et inhiber la vite~se d'attaque, re~pectlvcmcnt. llllc l'ljuatloll acte
proposée qui contient ce~, deux rffets sur la vitc~se d'attaquc:
r ==- A 1 + 0, 2 5mr'd'1~'
où ml représente la molarité de l'espèce i.
De~ expériences ont été faites avec des solutioll" contcnant Ic ... dCllx :llllon ... ,
chlorure et nitrate. L'augmentation de la fraction chlorure a été acc()llIpagnée pai
une augmentation de la vite~~e d'attaq~le. L'IOn complexe FcCl ~! contlnlle'
d'améliorer la vite~~e, mais la concentration de FcCl,o re"te c..,..,entieilclllelll la l1ll'JIle
pour les condition!:l ch obies. Il ~emble que FeCI2+ e..,t l'c~pct:C qui Inhihe la vite!-...,e
d'attaque dans ces soIlItion~.
111
ACKNOWLEDG EMENTS
f would like 10 take the opportunity to express my thanks to many people who helped IllC throughollt thi~ projcct:
_ Dr. D. Hcrk, my thc~i~ ~upervi~or, for his inspiring guidance and enthusiastic ~upport.
- .lean DUlllont for hi~ help in a~~emb)ing the necessary material.
_ Thc machinc ~hop pcr~onncl for constructing and modifying the necessary cqlllpmcnt.
- Mike Saloniuk for the invaluable hackground mformation, technical advice, and fric!Hbhip.
_ Wcndy Ln, Katya Marc, David Mulligan, and Iain Gilchrist for their fricnd"hip.
- The Fond... pour la Formation de Chercheurs et l'Aide à la Recherche (Fe AR) and the Dcpartment of Chemical Engineering, for financial a~~i~tanœ
- My family for e'1dle~~ encouragement, with a special note of thanks to my mol hc r for t hc word proce~sing tutorials.
- Ând ('~pecially 10 my fiancé, Mark Weber, for his generous help, impiratiûn, and companion~hip.

f 1\
l'ABI.E OF C'Ot\lTI\TS
Chapter 1 INTRODUCTION
1.1 Etchillg 1.2 Coppcr Etching hy Fcrrir Chloride 1.3 Complcx Formation in the FcCI,-IICI-112() ~y~tel1l
Chapter 2 OBJECTIVE
Chapter 3 L1TERATURE REVIEW \()
Chapter 4
Chapter 5
3.1 The Etching Bchaviour of Fcrri<: Chloritk 10 3.2 Complex Formation Betwcen the Fernc alld ('11101 ide 1011' 14
3.2.1 Evaluation of Complex D1Qrrhutiol1 14 3.2.2 Principal Complex Spccic<., ForJllcd 111 the l·e(·1 rll( ï
Sy~tel11 IfI
EXPERIMENTAL PROCEDURES AND CAl ('UI.ATH )NS
4.1 Experimental Apparatus 4.2 Solution Prcp~ration and Ca\culaul)Jl of i\l()lality 4.3 Copper Tîle Preparation 4.4 Etching Expcriment Procedure
RESULTS AND DISCUSSION
IX
5.1 Data Analysb 2'i 5.2 Experimental Result~ 2h
5.2.1 Effeet of Temperature on Eteh Rate 2l> 5.2.2 Etchîng Expcriments with \ïtratc-c()l~tainillg
Etchant~ 35 5.3 Complex Species Distribution in Etchillg ~()lllti()l1'" 3()
5.3.1 Method of Ca\culating Specle~ Di"tnhutiol1 3() 5.3.2 Spccie~ CaIculations and Rate RCl,ulh: Eflcet (JI
Temperature 41 5.3.3 Specie~ CaIculation~ and Rate ){c"ult,,: I.:t'feet 01
ChloridcjNitrate Ratio 47
Chapter 6 CONCLUSIONS
1

(,hapter 7 REfERENCES
v
Page
54
Appendix A TABULATED EXPERIMENTAL RESULTS 56
Appcndix B STATISTICS 59
Appcndix (' FORTRAN PROGRAMS fOR SPECIES CALCULATIONS 64

Figure 1.1 Figure 1.2 Figure 3.1
Figure 3.2
Figure 4.1 Figure 4.2 Figure 4.3 Figure 5.1 Figure 5.2 Figure 5.3 Figure 5.4 Figure 5.5 Figure 5.6 Figure 5.7 Figure 5.8 Figure 5.9 Figure 5.10 Figure 5.11 Figure 5.12 Figure 5.13 Figure 5.14 Figure 5.15
Basie ~tep~ in the metallization proce" ... Ideal eteh profilc~ Variation of eteh rate of eopper with telnperatull' and concentratIOn aeconling to Duftek and Arm"-lrong Variation of l'teh rate of steel with temperaturc and concentration aeeording to Maynard et al Experimental apparatll~ Specifie gravit y of feCl,-I-ICI-11 20 ~olllti()l1'"
SpecIfie gravit y of fe(NOJ),-IIN(),-II~() ... lllllt!Il(l' Calelllation of l'teh rate for a typical CXpl'flll1CllI Compari~()n of eteh ratl'~ ohtail1ed f rom difTl..'n:llt 1 caClol' Effeet of concentration on l'tell rate al JO"e Effeet of concentratIon 0/1 cteh rate at JO" (' and Sil ( Effeet of tcmperature on l'teh rate 111 the IrIlL'ar le~I()11 Arrheniu ... plot for rate e()n~tal1t h. Cr)f11pari~on of chloritll' and nitrate a ... etchallh Eteh rate variation with R Algorithm to obtain ~pl'eil'~ dbtriblltion Effeet of ~peeic~ dIstribution 011 l'teh rate at :;0' (' Effeet of speeie~ di"tribllti{)!1 on cteh rate at -tu (' Effect of ~pecie.., di~triblltion on eteh rate at 51) (' Fitting of cteh rate data to rate cxprc" ... iol1 Arrhenius plot for rate eon!ltant J\ Effeet of ~pecie~ dbtriblltion and R 011 l'tell rate
,'1
\2
\3 Il)
2\ ))
1

Table 5./ Table 5.2 Table 5.3
Table AI Table A2 Table AJ Table A4 Table AS Table 13.1 Tahle B.2
LIST OF TABLES
Rate Constant!! for Linear Region Stahility Comtant Data Compari ... on of Re ... ult!! to Mode! for Nitrate-containing Etchan .... Etch Rate vs Concentration at T=30°C Etch Rate v., Concentration at T=40°C Etch Rate V~ Concentration al T = 50 ° C Etch Rate Re~lllt~ for Fe(N03)3-HNO-, Etchant Etch Rate Reslllt~ for Mixed Ch!oridejNitrate Experil11ent~ Stati~tical Data for a Typical Experiment Analy~i~ of Vanance Table
VII
31 39
51 56 57 57 5~
5~
60 61

LI ETCHING
CIIAPTFR 1
INTRODl :("Ui.t~
Etching i~ the removal of material l'rom thL' ,urfan.' 01 a "'(11 Id, lI~lIally hv
chemical mean~. ln the pa~t, etching wa' linllted III IhL' appllCatiOIl (If an aClt!lc
~()Iution to a metal, as for example in the m:lnufaclu;L' 01 pholocIlglav1I1g platc ... 01
in art. lIowever, the proce~~ ha~ devcloped to incllldc ,-:'IllIC(lIHluctor Illatclial ... a..,
weil a~ metals and even "dry" etchant~ wllich are u'..:d for pld ... m:l or reactlw IOIl
etching.
In ail ~tcp' in the manufacture of I11lclOl'leclrtllllc C()llIl)()Jll'l1t .... ctchlllg 1 ... ail
important proce~~, Beforc ctching a IlIm, thl' I.lrclilt pdlll'Ill 1 ... !llll1lt'd Ily
photolithography as outlined for the metalli/atio!l Pf()(l''''''' in J Igurc 1.1 l'I1 ... t. a th1l1
metal film i~ depo~ited on the ~llb~trate alld c(lvl'r ni hy a polylllcr 1 dm whicil i ...
photo~el1~itive as weil a~ re~ic.;tant to the clchant. :l!1d tllll.., terrned the photon.·..,I.,1
When thi!>. film b expo~ed tn a circuit pattern LInder Ill..: approprrate waveiengill. Ihe
re~ist not required to protect the pattern may c:I'II: he dl,..,olved :lway, 'Ihe
component is then ready for the etching procc.,." 111 \\ f1lch Ihe clchant rell1()vc", ail 01
the metalleft unprotected and, once the rcmainillg /\:"1 ... 1 l' reJllowd, leave, only the
desired circuit pattern on the ~uh~tratc,
Figure 1.2 ~how!>. the tho cxtrclllc!>. 01 ohtainahk etell profile!'>, ani..,()tropic, III
complete agreement with the houndary e~tabli~hed h~ the rc~i ... t cdge; and i!>.otropic,
which features a curved boundary greatly unocrcllttlllg the rC"I~t. In thc fabrication

~
III J
o J
a 1
~
de position of metal film on substrate
deposition of polymer (photol·esist)
exposure to pattern and removal of unwanted resist
etching of unwanted metal and resist removal
Figure 1.1 Basic steps in the metallization pro cess
..
N

"
. . ' ...... " .' • • t •••••
'.' .' .... .. ..... : ."... .. '.'
ANISOTROPie
4 MASK ~
... FiLM ..
-SUBSTRATE ----
Figure 1.2 Ideal etch profiles
......
ISOTROP le
'..-J

1
1.
1 4
of a component mvolving complex patterns of microscopie size, resi~t undercut will
compromise its dimensional integrity and render the device unusable.
The glohal rate of the etching reaction in any direction is influenced by both
the kinctic~ and the ma~~ tran~fcr of the sy~tem. The isotropie profile is obtained
whcn the normal and latcral etch rates are comparable in magnitude fOT the system,
while it i ... the rate of etching normal to the surface which enhance~ the desired
ani~otropic etch profile. The key to optimizing the etch profile, therefore, i~ to
undcrstand the kinetics of the reaction and to transfer this knowledge into the design
of an appropriate ctch 1 eactor.
1.2 COPPER BTCHING EY FERRIC CHLORIDE
Metal etching is the final major step in the chemical processing of such
computer componcnts, as ~emiconductor devices or printed circuit board~. Copper
b commonly llsed in the fabrication of printed circuit board.."l. Although many
rtchants. both alkaline and acidic. may be used to etch this metaI. the FeC),çHCI-
1120 ~y~tem ha ... remained one of the most popular due to its high tolerance for
db~()lved copper and low cost (Duffek and Armstrong, 1980). Others, such as cupric
chloridc and alkaline ammonia etchants, have gained widespread use due to
incrca~cd intere~t in etchant regeneration and to their greater suitability for the
contil1l1ou~ process. being le~s corrosive. Ferric chIo ride is, however. a highly
vcr~atilc ctchant. l1~eflll not only for copper and its alloys but for nickel-iron alloys
and ~tccb,. Hydrochloric acid is present in the solution ta prevent the precipitation
,
1 of in5!oluble Fe(OH)3'
The etching of copper hy ferric ehloride appears to he an o\.idation-redll~tioll
reaction:
2Fe3+ (aq) + Cu (s) -- 2Fe2
< (aq) + Cu 2 ' (aq) ( 1. 1 )
The kinetics of the etching reaction are not weil undcrstood. ;\.., will hl' propmed
in this thesis, the various chloro complexe" of the ferric ion may abo take palt ill the
etching reaction. In view of the rnany application~ of coppeT l'telling, a~ weil a.., the
diverse etch reactor~ designed for the proce~~, an llndcl~tandillg of tl1C~C klnl'ti~.., 1<.,
of considerable interest. The first ~tep towards the goal of de"igning alld IllOtlclllllg
an eteh reactor for the production of anisotropie etch pl ofile" i~, t hCTt:fol e, 10 obtai Il
the intrinsic kinetics of copper etching with no heat or ll1a~'" tran"fcr limltat (011". i l'.,
under reaction rate control.
1.3 COMPLEX FORMATION IN THE f-cCI,-HCI:lhO SYSTl~M
As mentioned ubove, it i~ possible that the chi oro c()l11plexc~ 01 tlle lei II/.: iOIl
play a role in copper etching. 80th Saubc"tre (1959) and Maynard ct al. (19H4) note
that changes in the complex specie~ distribution with changi ng ctchant concentration
and, in the case of Saube!o.tre, with increa"ing eteh bath exhall~tion could affect the
eteh rate of coppeT.
The ferric ion is weil known to form complexes in !o.olution with the chloride
IOn:

6
( 1.2)
(1.3 )
(1.4)
(1.5)
These complexes are more correctly referred to as hydrated species, e.g.,
Fc(H20)(j3+, FeCJ(H20)l+, etc., but for simplicity the associated water mo]ecule~
will he omitted.
ln solution chcmistry involving complex ions, the equilibrium constant of a
complexation reaction is termed a stability constant. Thus, for the reaction betweea
metal ion M and ligand L (omitting ion charges for simplicity)
M + L ~ ML (1.6)
thcre cxists a stabiIity constant, K 0:
(1.7)
A complex ion containing more than one ligand, MLn' must form stepwise (Hartley
et al, 1980) (I".j thus there is a stability constant for each step.

-
For the overall complexation reaction
M + nL .. ML n
there exists an overal1 stability constant:
._ KOKo KO 1 2·" n
7
(UO
(1 10)
The stability constants shown thus far arc ratios of ~pccic~ activillC" and al C
further c1assified as thermodynamic stahility COJ1stant~. lIowevcr, "incc activitic" al C
difficult to measure in comparison to concentratÎoJ1!o., the ... toichiolllctric ~tability
constants have also been defined:
K = [ML] [M][L]
( 1. 1 1)
(1.12)
Since the activity coefficient i~, hy definition, the paramctcr rclatillg activity and
concentration, the relationship bctween stoichiometric and thcrrnodynamic ~tability
constant is easily determined:
l
l ,~ ..
P: = a ML YML [ML
II]
A n =
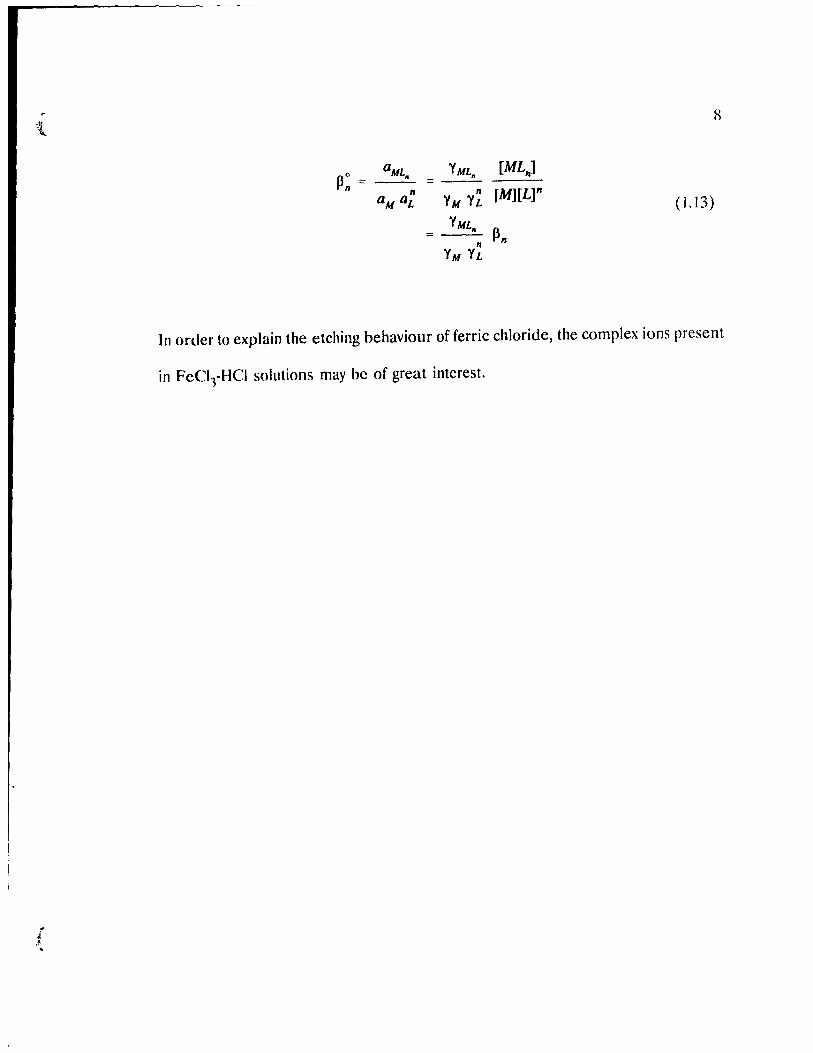
Il Il [M][L]" aM aL YM YL (l.I3)
YML ~n "
Il
YM YL
ln order to explain the etching behaviour of ferric chloride, the complex ions present
in FeCI'rHCI solutions may be of great interest.

CIIAPTER 2
OBJECTIVE
The objective of this project b to determine the kinetÏl'!'. of COppCI ctcllll1!, hv
ferric chloride-hydrochloric acid solutions in a batch !'Itirrcd-tanJ.. IcaclOI. In oldcl
to fulfil this aim, the following steps must he llndcrtakcn:
- design reactor and a!'l~emble equipmcnt
- obtain etch rate values and determine factOl!ol affccrÎng them
- formulate rate equarÎon
As a part of this investigation, the effect of the dl~trÎbllti()n (lI chlOlo l·oll1plc\co., in
solution on the etch rate will he examined.

1 CHAPTER 3
UTERATURE REVIEW
3.] TI lE ETCHING BEHAVIOUR OF FERRIC C!-lLORIDE
JO
A~ mcntioncu above, ferric chloride is not the only etchant uscu for copper
ctching. Alkalinc ammollia etchants are popular duc tn their suitability for
continuolls operation (Duffck and Armstrong, 1980). A~ well, they exhibit minimum
undcrcut and a high capacity for dissolved copper. However, numerou:-. problems are
assoeiatcd with thi~ type of etchant, such as waste treatmenl proble111~ due 10
sludging, re~iduc!-' left on the metal, and high cost. Cupric chloride b another etchant
which adapts weil tn continuolls operation and rnay be regellerateu. but careful
control of tempe rature anu etchant composition is required 10 maintain :m acceptable
eteh rate. Pcr~lIlfatc etcilant~ and chromic-sulphuric aciu ~ys,tel11s have both declined
in popularity due 10 low ctch rates and copper tokrance, a~ weil as solution
dccompmition in the former case and pollution restrictions in the latter.
i\lthough ferric chloride is widely used as an etchant, little ha" been publbhed
concerning ib etching kinetics. Habu and Yoshihiro (1982) have investigated the
mass transfcr for a stirred-tank system, deriving a parameter which relates the
dissolution rate of copper to mas~ transfer propcrties su ch as the diffusion coefficient
of the ferric ion and the diffusion boundary layer thickne.ss, bu! such finding~ have
little hcaring on the present ~tudy where mass trailsfer lirnitati()n~ are diminated.
In an overview of many copper etchants, Duffek and Armstrong (1980) have

1 Il
outlincd several fcalures of ferric chloride etching ~(lllltion~. '1 hcy 1'l.'l'OIllI1H.'lHl
adding hydrochloric acid up to 5% in ortler 10 "upprc~~ the precipitation (lI' krr il'
hydroxide and abo to cnhancc the etch rate a" the :l1110ll'lt of di ... "olvcd l'Oppl'I
increases. The use of agitation b recommended, a" i" aeratlon in order to prolllote
reoxidation of the ferrou!o. ion.
The measure of ctch rate used hy Duffek and Ann .... trung in their ~tlldy i" tlle
relative etching time (Figure J.l), an awkward L1nlt ~IIlCC It i~ dl'pcndcnt (Hl tl1l_'
am ou nt of copper etched. The optimum ~()Iution conccntr<ltl()n i~ tirai wllich yle/d~
the ~horte~t ctch time, i.e., a 30% ~olLltion al mO/l1 tcmper<ltllrc and J'i%
composition at 70°C. As it J~ implied that no J J( '1 i .... prc~l'nl. thc~c nlllllhcr~
correspond to a molality range of 2.64 - 3.22 mol/ h.g. The condition ... 01 the l'trhing
system, sllch a~ agitation and acratioll, are Ilot h.nown.
Duffek and Armstrong propolle a tw()-~tep oxidatiull IHOCl''' .... I()I (hl' ctdllllg
reaction which agreel., \Vith the ove rail reaction 01 cquati(lll 1.1:
FeC/3 + Cu -+ FeC12 - CuC! (J 1)
FeCl~ + CuCi - fèCl2 - CuCl2 D.2)
This hypothe~js is corroborated by Saubestrc (19::;9) w!1o .... t: "tudy of coppcr ctc!1ing
centres on ~ollitjon exhaustion by dissolveù coppèr The mcchanil.,l11 docl., Ilol takc
into account the chloro complexation of the ferne Ion, whlch i~ weil h.1l0WIl lo occur
as conceded by Sauhe~tre.
In a related work, Maynard et al. (1984) ~tudicd the ferric chlondc ctching of

12
4r------------------------------------
z -~
3 .. -w ~ 50-55°C t-
0 (f24-131°F) C)
z / J: 2 ~ / w w > -~ -1 W a::
SPECIFie GRAVITY AT 20-25°C, oSE 20 25 30 35 384042 45
0 10 20 30 40 50
FeCl:3 ,% IN ORIGINAL SOLUTION
Figure 3.1 Variation of etch rate of copper with temperature and concentration, according to Duffek and Armstrong

r
U LU 1/)
>(
'"
10
{ e u
UJ ..... <C Ir
6
4
2
o
Figure 3.2
13
• - BD 0 [J. G C ~. - -0 1 OLe, C
bO 0 mG c ... .1 - 50 \ or[, c ~ . 40 " [J: G c
j]t.GRE~S BA'.W::'
Variation of etch rate of steel with tempclatufc and concentration, according to Maynard et al.

(
14
low carbon steeb and report an incrta!le in etch rate with temperature (Figure 3.2).
As for Duffek and Arm~trong, the etch rate decreases with increa~ing etchant
concentration, hut no direct comparison of etchant composition may he made since
the degree Baumé ~cale, u~ed by Maynard et al. a!l a measure of concentration, relies
011 specifie gravitje~ and thercfort; the molality of the solution is not known.
The reactiol1 apparatus of Maynard et al. ('onsists of a stirred-tank reactor
similar in de~ign to that u~,ed in the present study, but the ~tirring speed is
maintained at 100 rpm, a spced in~ufficient to eliminate mass transfer limitation~ at
low concentrations as shown ,in the paper. Indeed, Maynard et al. sugge~t that the
e~ch rate~ at low Baumé are tral1sport-limited, 'nit at higher concentrations the rate
becorne~ indcpendent of the stirring spced and a region i~ reached where the rate i~
lirnited hy sorne proces~ at the surface, e.g., ad~orption, de!'orption, or the aetllal
rcaction at the <.urfacc. This argument appears weak !'ince at low concentrations a
low reaction rate, and thu~ kinetic control, would l:c expected.
Both Maynard et al. and Sauhestre suggest that ferric chloride solution~ show
lInu~ual etching hehaviollf due to the changing di~tribution of chloro complexe!' of
the ferric ion that accompanie;; changes in solution concentration. Their findings and
those of other~ will he presented in a later section.
3.2 COMPLEX FORMATION BETWEEN THE FERRIC AND CULOB.JDE IONS
3.2.1 Evaluation of Complex Distribution
1 n order to determine the extent of complexation for a given set of solution
1 1'\
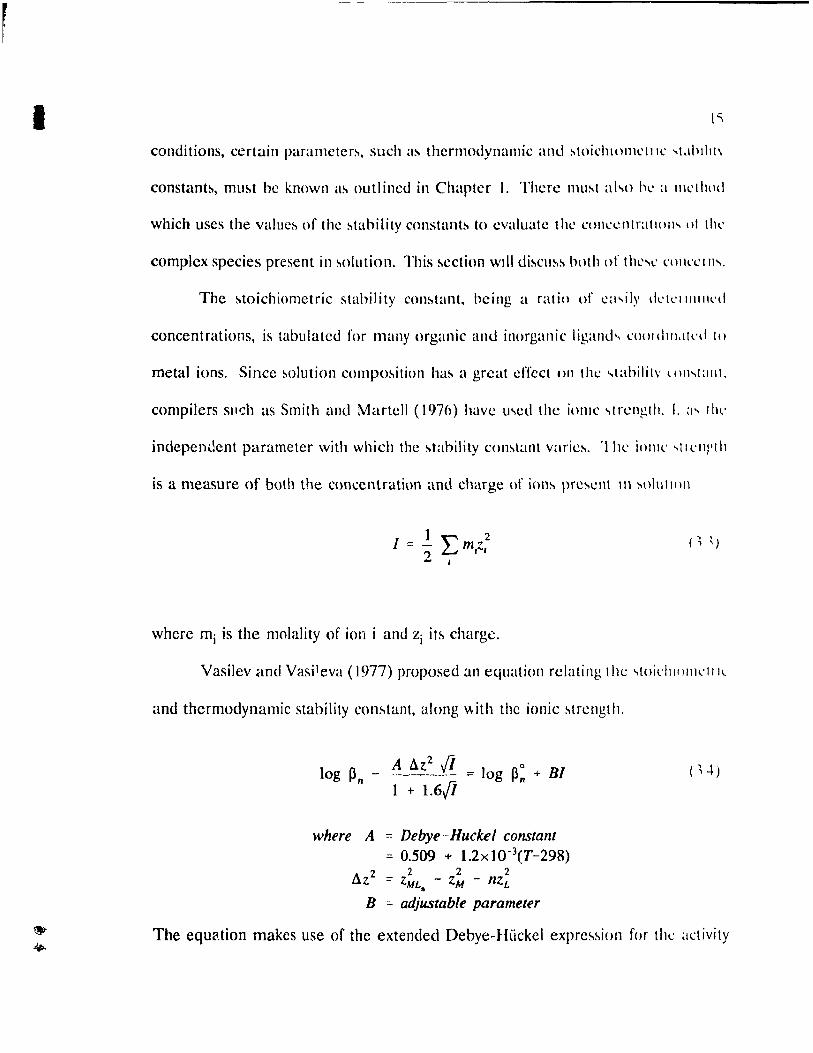
conditions, certain paramctcr~. such a~ thermodynamic and ~toid110llll'IIIC ..,t,II)IIII\
constant~, mu~t he known a~ outlined in Chaptcr 1. There mll~t a!"o hl' a 1Ilt'IIHld
which uses the vall1c~ of the ~tahility constant~ to evaluate th~ conccntrallOlh lit tilt'
complcx spccies present in ~ollition, This ~cction will di~cll~~ hoth of the"t' I.'Olll'CIII".
The ~toichiometric stahility con~tant. being a ratio of e~l .... ily dl'lL'lllIllll'd
concentrations, is tabulated for rnany organic and inorganic ligand .... COI Il dlll,lll'd Itl
metal ions, Since ~olution cOl11po~ition ha~ a grcat effeet 011 the ... tahilil\' «ln .... I:1111.
compilers sllch as Smith and Martell (1976) have lI .... ed thc ionlc .... trcll,l'.lll. 1. :1" 11lL'
indepenJent parameter with which the ~tability comtant varie~. "hl' i01111' "tll'I1)'lll
is a measure of both the concentration and charge of ion~ prc~ent 111 ~\lI\l111l1\
where mi is the moJality of ion i and zi it~ charge,
Vasilev and Vasi1eva (1977) proposed an equation rclating the QoÎr1J11)11H.'llll
and thermodynamic stability con~tant. along \\ith the ionic ~trcllgtl1.
log Pn - A 6:[.2.fi = log P: + BI 1 + 1.6fi
where A = Debye-Huckel constant = 0.509 + 1.2xlO-3(T-298)
2 2 2 2 L1z = ZMl_. - ZM - nZL
B = adjustable parameter
The equé:l.tion makes use of the extended Debye-Hückel expre~~i()n for th~ actiyity

16
coefficieri t. U"ing tahlilatcd values of {3n at a known I, Vasilev and Va~ileva's
rr.cthot! IIlvolve" fltting a ~traight line to the plot of the left-hand ~ide of equation 3.4
vs I and cvaluating log (3no and B from the intercept and ~Iopc, respectively. This
method take~ advantage of the a"sumption that activity coefficient~ approach a value
of 1 at an ionic ... trength d()~c to zero and hyequation 1.13, the thermodynamic and
~toichi()l11ctric ... tahIiity col1"tant ... are equal.
Having eva\uatcd the rcquired stabi\ity constants, the equilibrium ratios are
known and, hy !-.ome fmm of 1111merical ~olution, the concentrations of electrolyte
~ollltion~ may he evaluated. Jam,z (1984) has proposed a method w.ing eqllations
~imilar 10 tho ... e of Va ... ilev and Va~ileva in order to caJculate the ~pecies distribution
in solLltion~ of mctal chloridcs where the metal ion has a charge of 2+. His
algorithm may only be applicd to system~ containing no other complexing ions.
3.2.2 Principal Complex Specie~ Formed in the FeCI3-HCI System
A~ stated in Chaptcr 1, the ferric ion is commonly assumed to form complex
i()n~ containillg IIp to four a~~ociated chloride ion. AIthough anionic complexes of
higher order have been rcported, Sauhe~tre (1959) ~tates that they are only formed
in significant quantitie~ in solutions of very high Hel concentration (> 6M). The
FeCI4- ion ibclf prove~ 10 he negligihle in the range of concentration~ te~ted hy hoth
Sauhestre and Kimura ct al. (19X4), although Marston and Bush (1972) determine
it to he the principal sp\.!cies in ~olutions of ferric chloride concentration greater than
4 M.

1 17
At FeCI3 concentrations up to about J M, Mar~ton and BlI~h 1 inti 1 hl'
predominant species to he the neutr al FeCI~() complex. Kirlllll a cl al. (!lIX-l)
corroborate this resuIt with systems containing FeCI1, FeCI2, CuC '1 2, C 'uC ï. llC 'l, and
NaCl in water; for their solutions of varying composition, the trIehlorn C(ll11ple, il.,
predominant for the ferric ion at high ionic strength. The Feel ~ 1 ion appc:lI.., ln
make up most of the remainder. Saubestre considers only FcCI 2 t and Fd 1" 1 III lm
calculations, making comparison with the other source~ impm~ihle: the dicl1lo\() iOIl
is predominant in his result~.
Combining the conclusions of Kimura et al. and Man.ton and Bu ... ll. il \\'ould
appear that at very low ionic ~trength the uncomplexed Fe ~ 1 and I·e< '1.' 1 iOIll.,
predominate, to be replaced by the FeCI2 + and FeCl)o complexe ... IIp ln J--l \1 IT( ï \'
after which FeCI4- is the major species.
The ferric ion aiso forms complexes with the hydroxide IOIl, leadlllg tn the
aforementioned danger of precipitation of ferrie hydroxide. 11()\l,'cver, tlte lm\' pli
of acidic ferric chloride solutions greatly minimize~ the formation ()f "li ch C( llllpll'\l''''
Saubestre's equilibrium calculations yield ncgligible hydroxo complex C()llccnlr atiom,
as do those of Kimura et al. for any relatively conccntrated ~()luti()n (i.e., ('()11lP()1ll'lll
concentrations greater than 0.01 mol/kg). Baes and Me~mer (1976), in <,tudylllg the
hydrolysis behaviour of many cations, place the thre~hold of fcrric ion hydroly ... j<, at
a pH of 1, which is higher than that of mnst fcrric chloride etchanh. '1 he ... oluIIOll ...
considered in this study will he con~idered to contain negligibly ... mall quantitie<, (Jj
hydroxo complexes.

18
CHAPTER 4
EXPERIMENTAL PROCEDURES AND CALCULATIONS
4.1 EXPERIMENTAL APPARATUS
The equipment llsed for the etching experiments is shown in Figure 4.1. The
batch rcactor i~ made of acrylic plastic in order ta resist corrosion by ferric chloride
and acid; it~ diameter measure~ about 14 cm and its height about 30 cm. When the
etchant is pOlllcd into the vessel, it rcaches a height of 9.5 cm. The reactor i~
slIspended in a constant temperature bath equipped \Vith a cooling coi1. The
temperature imide the reactor is measured with a mercury thermometer and
maintained to within one degree Celsius of the desired reaction temperature.
Constant stirring is ~upplied bya motor-driven impeller (diameter 6 cm) maintained
at a specd of about 1500 rpm to eIiminate mass transfer limitations, as recommended
by Safoniuk (1988).
To carry out the etching experiment, the copper tiles are supported in a
handheld PVC clamp which is then immersed in the agitated solution.
4.2 SOLUTION PREPARATION AND CALCULATION OF MOLALITY
The ferric chloride-hydrochloric acid solutions are prepared using
concentrated hydrochloric acid and anhydrous ferric chloride (reagent grade,
purchased from Anachemia). 70 mL of concentrated hydrochloric acid were used in
each solution, resulting in an acid molarity of about 0.84 mol/L. The amount of

, . ....
constant temperature bath
reactor~
copper tile
etchant
Figure 4.1 Experimental Apparatus
--.:;

( 20
ferrie chloride weighed out for the experiment is that required to produce the desired
molarity in a 1 L volumetrie flask. The moisture content of ferrie ehloride was found
to he negligihle by eomparing its weight before and after drying in an oven at 110 c C.
The ferrie ehloride is dissolved in a water-acid solution, and the mixture is cooled to
the reaction temperature before topping to exactly one litre. A specific gravit y
measurement of the etchant is made at the reaction tempe rature in order to calculate
the solution molality. While in the preparation of the etchant it is easier to consider
its concentration in terms of molarity, i.e., moles solute/litre solution (M). most
theoretical calculations require its molality, or moles solute/kg solvent (m). The
molality may be calculated if the solution density (assumed to iJe in kgjm3) is used
to find the mass of the solve nt, as se en in the denominator of equation 4.1.
= ------mol FeCl3
(4.1)
or, ~implifying:
(4.2)
Specific gravit y rneasurements have been made throughout experimentation
and for both etchant types, FeCI3-HCI-H20 and Fe(N03h-HN03-H20, a straight
line has been obtained for the plot of specifie gravit y vs solution molarity (Figures
4.2 and 4.3). Theoretical calculations are therefore possible over the entire range of

~ )
1.20 i »>
ME T - 300 e s.g. - 1.018 + 0.1184 M
AT... 400 e :::n 1. 15
-+J
s.g. = 1.0J2 + 0.1200 M
c T - 600 e tP' ~ S.9. = 1.0OB + 0.1219 M
... L Cl o 1.10 -.... o ~
Ul t.CS
1.00~'--------------L-------------~--------------~-J 0.0 0.5 1.0 1.5
Solution molarlty. mol/L
Figure 4.2 Speciftc gravit y of FeCI3-HCI-H20 solutions
, .
t--.J

( 22
~--------------------------------------,M
rn
-.J !::: 0 .....
" .... ;::s -
N 0 0 rn
E 0 N
• :t: ::n 1 ....
0 .tJ Z X L :t:
C 1 .... .-,.,
10 0 10 0 Z 0 E "-"
• ~ 0 C c.....
0 0
+ 0 ;>. - .... .tJ ....
8 :J ~ 1-< bO
0 (.) • t.:: u- (J) ..... 0 8. o 1 ("J VJ
• ('r)
1 CI ~ • ..... ~ 6h ..... ~
ID ,. M N - 0° • • • • • • - - - - - -
Ri 1 ADJ 6 OIJloedS
'J

•
concentration. Ail experimental results are presented with respect tn ~ol11tion
molalities in order to reduce confusion.
For the ferric nitrate-nitric acid system, the preparation procedure wa ...
identical except for the volume required of acid due to diffcrenccs in 111()1~\1 itie~ of
concentrated Hel and HN03. Approximately 53 mL of nitric acid wa~ ll~l'd in (Hlkl
to maintain constant acid molarity in aU etching expenment~.
Once prepared, the etchant is transferred to the rcactor, ~upported in thL'
bath, and stirred continuously until the reaction temperature has rcached ~tcady
state.
4.3 COPPER TILE PREPARATION
The copper tiles used are rectangular in cross-section with a ~1II face area of
at least 4 cm2. At purchase the copper plate is eatalogued as 99.9% pure und h.1S
mm thick. Five sides of each tiIe are coated with an elch re~ist, ERF-20, and the
exposed face is ground to an ev{!n surface before its area i~ mea!->ur~d. In thl' cour~e
of the approximately 30 experiments carried out on each sel of tilc~, the ~urfaœ
areas are me J.sured regularly.
For each experiment, sixte en tiles are chosen and in~pected for !->pOlty re~i~t
eoverage. Any patehes are repainted and the resist cured at 110 0 C. The cxpŒed
face is then ground to 600 gril. The tiles are dried in an oven al 11O"C, ami cookd
in a desiccator to eliminate moisture. Constant weight is important hccuu<..,e the
weight difference observed in the tile before and after etching is the key parame 1er

24
in calculating the etch rate.
4.4 ETCHING EXPERIMENT PROCEDURE
As mentioned ahove, each tile is immersed in the etchant by securing it in the
clamp and holding it in place, its exposed face perpendicular to the flow. There are
three replicates for a total of five immersion times: 45, 60, 75, 90, and 120 s. The
sixteenth tile is reserved as a spare in the case of a malfunction.
Once the immersion time has elapsed, the tile is plunged into a bath of
distilled water in order to quench the reaction and rinsed thoroughly. The distilled
water hath is repJaced about four times during the experiment to minimize any
accumulation of etchants. After ail of the tiles have beel, immersed, they are again
dried and cooled hefore determining their weight. As it is weighed, each tile is
examined for poor resist coverage and discounted if that sample would yield an
inaccurate result.

f f
1 25
CHAPTER 5
RESULTS AND DISCUSSION
This chapter will present the results of the kinetic experiment~ underta"cn in
this project. The calculation of the etclt rate and the statistical analy!'>i!'> 01 t Iw data
will be described in arder to first give an understanding of the rC~lIlt~ tu follow.
Then the dependence of the etch rate on concentration and tcmpcratlll t' will he
discussed, outlining the rationale for the ~uhseqllent investigation (lI the elrhing
beltaviour of copper in nitrate-containing etcilants. Finally, the mcthod of cakulalillg
the distribution of chlora complexes in etchant solutions will hc prc!'>clltcd amI il!'.
effect on the etch rate will be incorporated into a rate equatiol1 propo!'.cd rOt the
system.
5.1 DATA ANALYSIS
Once the weight difference for each tile is calculated, it i~ dividcd hy it~
surface are a in order to normalize the reslllt~. Thl. line of be!o!t fit for the plot of
weight difference/surface area vs immersion time then give~ the ctch rate rOt lhal
experiment. As seen in Figure 5.1 for a typical experiment, a straight lille i~ normally
obtained.
For each experiment, a series of stati~tica) calculatiom based on the Illcthod
of Himmelblall (1980) is carried out. The first-order model is proven to fil the data
to a 95% confidence level, and a 95% confidence interval for the ctch rate j~

26
calculated. For instance, the data in Figure 5.1 yield an etch rate of 0.277 mg/ cm2.s,
with a 95% confidence interval between 0.267 and 0.287, or ± 4%. A~ weIl, the y
intercept for the model i!\ tested for its equality to zero, since at an immersion time
of zero there should be no weight difference. Examples of these stati~tical
calculations may he found in Appendix B.
Although no replicate~ for the following re~ults are shown, the etch rates
obtained with the prcviously de~cribed system were compared to those obtained with
an earlier ver~i()n of the batch stirred-tank reactor (Bryce, 1989). The faet that the
results are ~imilar in the two cases, as seen in Figure 5.2, indicates the reliability of
the experimental methods.
5.2 EXPERIMENTAL RESULTS
5.2.1 Effect of Temperature on Etch Rate
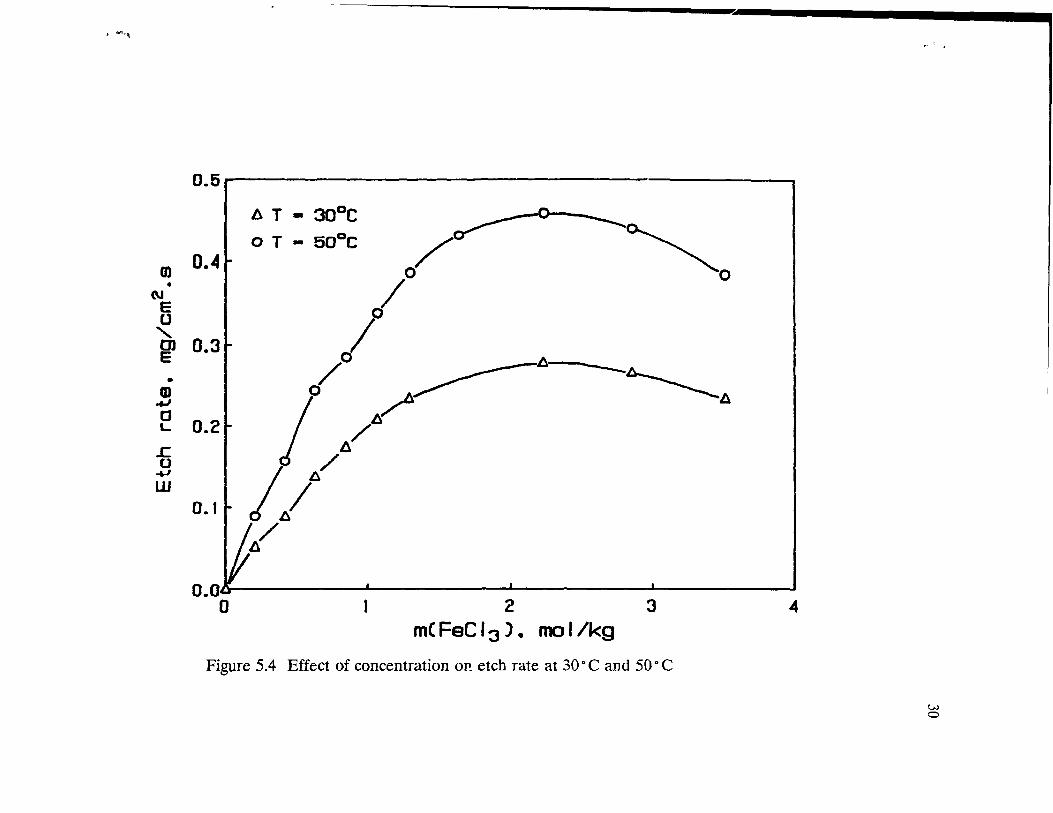
Figu res 5.3 and 5.4 show the variation of the etch rate with ferric chloride
concentration up to 3 mol/kg for 30 0 C and 50 0 C, respectively. In both cases the
etch rate CUTVe is linear at concentrations lower th an about 0.8 mol/kg. The results
are unllsual, however, since the rate increases at low etchant concentration until it
reache!! a maximum at about 2 mol/kg and decreases thereafter.
To ascertain the effect of temperature in the Iinear region, etch rates at 30,
40, and 50 0 C were compared for a concentration range up ta 1.2 mol/kg. The limit
of first order kinetics appears ta be approximately O.R mol/kg; accordingly, rate
constants for each temperature were ca1clllated from the slope of the line of best fit

H
N E
~ ~ •
0 CD L-a CD
8 't-"-~ CD
....... CD 0 c CD "-CD 't-.... "'D
+1 .r:. Cl -t.D =-
40 T - 30°C [FeCI 3 J - 2 mol/L
30
Il
/! 20 V
./ 10
1 ~slope - etch rate - 0.277 mg/cm 2 .e
0 0 50 100
Immersion tlme. e
Figure 5.1 Calculation of etch rate for a typical expenment
150
~
t.J -...J

.. -~
m •
N E u "-Cl E
• m +1 c L-
.c a -tJ w
O.3r.-------------------------------------------------------
0.2
0.1
~ presen t study · 19a9 resul ts
.Ll;
•.. / .. Il
il !
1 .a
Il •
... ' ..•. -~ ......... '. ".
........... ~ . .
O.OA~--------~~----------·~----------~----------~ o 2
mCFeCI 3 ). mol/kg 3
Figure 5.2 Comparison of etch rates obtained from different reactors
4
~,
N oc

M
Cl ::i. U ........ ..
0
~ cr, ..... Ç"j
V .... • d
N ....
1""'\ .c (") V .... - '1)
U t:: Q) 0
U- t:: '-' 0 .-E ....
:-j
<l .... .....
~ t:: '1) V t::
~ 0 V
' ......
~~ 0 .... V V
' ...... ' ...... ~
<.1~ r-r: 1(,
V .... ;::l
00 Cl)
M N w: • • • • 0 0 0 0
S· ~wo/6w ·SlOJ 40 13
,.. 1-\i.'1,,\
O.5r~----------------------------------------------~
b T - :looe
m 0.4'-•
N E U
/o~ ~ /0 0
o T - 50°1:
"-8l 0.3
i /0 eO.2 ;0 /~ ~ /~ ~
-<J /l!. l!.
W 0.1 !/" /~ ~
O.Oon----L-.. -----:-~ 2
mCFeCI 3 ). mol/kg 3
Figure 5.4 Effect of concentration on etch rate at 30 0 C and 50 0 C
4
w CI

1 31
shown in Figure 5.5. Table 5.1 shows the values of the rate constant~ in the lilH.'al
region.
Table 5.1 Rate Constants for Linear Region
T k
mg Cu.kg HzO oC cm 2 CU.s.mol FeCI.\
30 0.205
40 0.311
50 0.337
Although its derivation is hased on the a~liumption that the reaCl!OIl 1..,
elementary, the Arrhenius h:w,
E
k = Ae RT (5.1 )

..
m •
t\I E u "-Cl E
• m ~
0 L
..c 0 ~
w
0.3 1
Il T - 30DC
C T - 40Q C
o T CI soDe 0.2
0.1
O.06~-------L--------~--------~------~~------~ 0.0 0.2 0.4 0.6 0.8 1.0
mCFeCI 3 ). mol/kg
Figure 5.5 Effeet of ternperature on etch rate in the linear region
...
Vl N

1 is commonly used to describe the change of the rate constant with lCl11pewture fOI
any reaction with or without a complex mechanism (Smith, 19SI). 'l'hl' Atrhl.'nlll~
plot of the data shown in Tahle 5.1 is given in Figure 5.6. Since a ~lraight lillc i:-. Ilot
ohtained, it appears that the etching reaction does not conform 10 a ~il1lpk,
elementary mechanism.
Reaction rates increase with increasing tempcrature~. Sincc Illa~~ tl :tnskl
coefficients are not sensitive to temperaturc, amI since the rate ('on~lant apl,eal:-' 10
approach a constant value at higher temperature~ a~ ~h()wl1 in Figure "i.h, the
possibility of a mass transfer limitation must be inve..,tigated The..,t Il r IlIg :-.pecd
chosen should have eliminated this prohlem, hut one expcrimcnt \Va" r el'caled al
50 ° C and 0.6 M with a stirring speed of 2000 rpm a~ a verification, and Ihe t'teh raIe
thus determined was proven to he stati~tically eqllal to Ihat obtained al 15()() rplll.
AIso, the solubility of ferric chloride ranges from 4.6 mollI, al O"C tn 33.0 11101/1, :11
lOO°C; therefore, solution saturation cannot he a factor in the declillc of the ratl'.
The possibility of a dissolved copper buildup affccting the clch r ale al 11Igh
FeCl3 concentrations was previously ruled out (Bryce, 19::-:9) hy illltially adding
copper in the form of cllpric chloride in molaritie.., up to 1 M lo the etchanl al1<1
observing stati~tically equal etch rates tn that u~ing the rcglliar ctchallt. The
concentration of dissolved copper never excceu!o. 1 M hcc<lll!o.e frc"hly prcpar ed
etchant is used for each experiment and the maximum conccntration of copper at the
end of an experiment is about 0.01 M.

r~",,\
.Y
-1.00r·----------------------------------------------------------
-1.25
T - 500 e
~ T - 400 C
c -1.50 • T = 300 e
-1.75
-2.00 l'--___ -'-___ ----J~ ___ ..J.._ ___ ___L ___ ___'
O.CIm 0.0031 0.0032 0.0033 0.0034 0.00J5 1 /T. K -,
Figure 5.6 Arrhenius plot for rate constant k
..
(;) ~

) ' , '
5.2.2 Etching Experiments With Nitrate-containing Etchants
Subsequent experiments in this project focllsed on explaining the lInll~lIal
effeet of etehant concentration on the etch rate. Since aqucous fcrric chloridc i~ weil
known to exhibit ion complexation, the determination of the chloridl' ~pCcil'" in
solution was undertaken.
To examine the effect of chloro complex formation, the etching of coppel in
a solution containing no chloride ion was performed. Ferric nitrate, Fc(NO,h, :Ind
nitric acid were chosen becall~e the nitrate ion ~hows little complcxing activity \Vith
the ferric ion. A series of experiments wa~ run with cqual acid mol:!r ity alld al
varying ferric nitrate concentrations, the resulb of which are ~h()wn III FlgUl e '5.7.
The sllbstantia)ly decreased etch rates ohtained indicate the major IOle 01 the
chloride ion in copper etching. The etch rate appears to dccrea ... c with il1crea~illg
ferric nitrate concentration, although the decrea..,e i~ negligihlc in compal i~()11 to Ihe
resllIts for the ferric chloride-hydrochloric acid system.
Two intermediate points were chosen at 30 0 C tn determinc the change in the
etch rate with varying ratios of the two anions pre~ent, the chloridc and nitrate ion ....
The independent parame ter, R, is defined a~
(5.2)
With t::onstant acid molarity at approximately O.R4 mol/L and a comtallt ferne IOIl
concentration of 1 mol/L, the etch rate increase~ llniformly as R reachc~ 1 (Figure
5.8). Since in solutions with the sole anion being the chloride ion the rate t:vt:l1tually

1
(
36
decrea~es, the presence of chloride does not only enhance copper etching; the
chloridc ~pccics dbtrihution must vary in the concentration range of interest to cause
the ctch rate hchaviour observed.
5.3 COMPLEX SPECIES DISTRIBUTION IN ETCHING SOLUTIONS
5.3.1 Mcthod of CaIculating Species Distribution
The mcthod of Jan!lz (1984) was adapted ta calculate the species distribution
III FeCI3-1-ICI-H20 and Fe-Cl-N03-H-H20 solutions. It may be noted here that,
according to Bacs and Messmer (1976), the hydrolysis of Fe3+ is negligihle at a pH
le!o,s than 1, and Ml for the present !lystem (pH < 0.1), no hydrolysis complex species
werc considcrcd.
Stability constant~ for the calculations were available at 25 0 C from Smith and
Martcll (1<)76), Sillen and Martell (1964), F*A*C*T (a computer program which
cnables the liser to calculate equilibrium comtants, among other functions), and
Kimura et al. (1984). An average value wa~ taken where more than one was
availahlc. 1'0 extend the calculations to 30, 40 and 50 a C, the standard enthalpies of
the complcxation reactions were found in Helgewn (1969). Smith and Martell
supplied valuc~ corresponding to varying ionic strengths for only the FeCl2t complex,
but as !3no barcly changed over the ionic strength range «5%), little error is
cxpcctcd in neglecting this dependence for higher-order complexes. The stability
constant equatioIls and AH values are shown in Table 5.2.

i; ~
0.3
1:>. FeCI 3 -HCI 1:>._
• FeC N03 )3 -HN03
T = 30°C ---... m . ~ ru Il
~ 0.2 /
1:>.
~ / ~ !~ ~ 0.1 r / .------.... ~ / --w / ---t~· •
• 0.0 IV"
0 2 3 meFe). ma I/kg
FIgure 5.7 Comparison of chloride and nItrate as etchants
4
•
.~
--.l

38
~~-------------------------------------~ ~ -CD
• o
co • c
f" • o
CD • o
~~~------~--------~--------~------~ q c 8° • • • • • o o 0 0 o
s-zwo/6w ·e+DJ 40+3
--
1
n
1
2
3
4
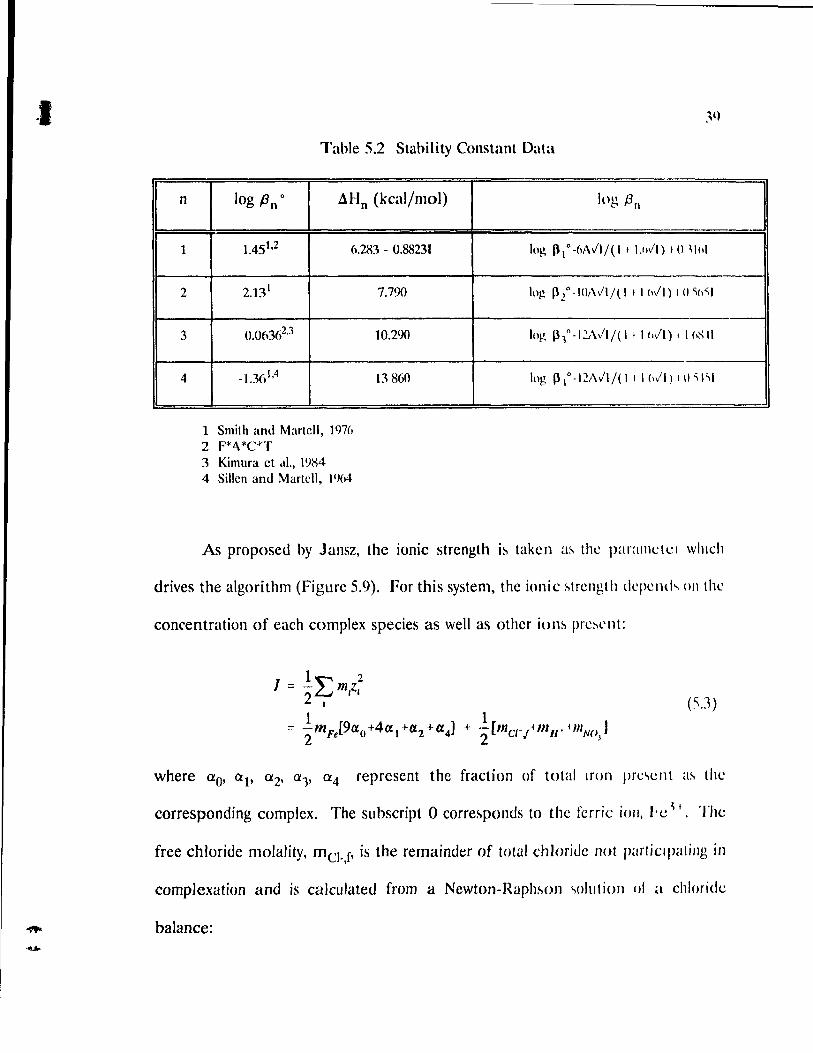
Table 5.2 Stability Constant Data
[ log /3 0 °
1
~Ho (kcaljmol)
1.451,2 6.283 - 0.88231
2.131
0.06362.3
-1.361,4
l Smith and Marlcll, 11)76 2 F*I\*C-I"T 3 Kimura el .JI., 1984 4 Sillen and Marlcll, 1%4
7.790
10.290
BS60
1
log /3 11
lo~ 1l 1o-6AJI/(11 1.1>/1) 1 Il \1111
lo~ P 2 ° -lOr\/I/( 1 1 1 hll) 1 () '.(l'il
-l()~ Il., 0 -12'\ /1/ (1 1 1 hll) 1 1 hS Il
log IltO-12A/I/( 111 hll) 1 () 'i1"1
As proposed by Jansz, the ionic strength i~ takcn a~ thè parallldcl wlllch
drives the algorithm (Figure 5.9). For this system, the ionic ~trel1gth dl.'pcnd .... 011 thl'
concentration of each complex species as weIl as other iom prc~l'nt:
(SJ)
where aO' al' a2' a" 0:4 represent the fraction of total mm prc,ent a~ thl'
corresponding complex. The subscript 0 corre~ponds to the fcrric ion, f'c) 1. The
free chloride molality, mel-,f' is the remainder of total chloridc not particlpaling in
complexation and is caIculated from a Newton-Raph~on ,o)ution of a chloride
balance:
1

J
calculate (3n = f(l, T)
fi Newton-Raphson to get meC (free)
fi
calculate distribution of chloride species based on
(3n and mC1- (free),
ŒO + al + Œ 2 + Œ3 + Œ4 = 1
calcula te 1 = f(mFeC1; m Hel' ai)
1
N
[ FINAL RESULT 1
Figure 5.9 Algorithm to obtain species distribution
40
1 41
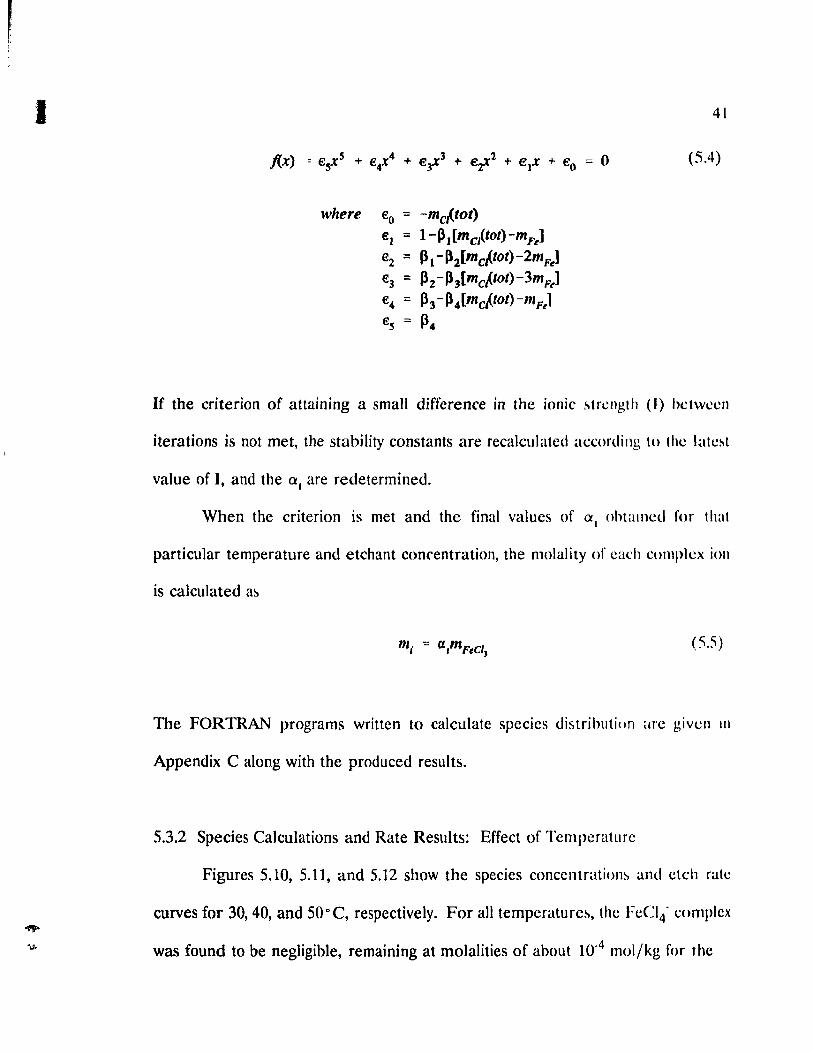
(S.4)
where € = 0 -mcf..tot)
€J = I-PJ[mCJ(tot)-mFe]
€2 = pl-p2[mcttot)-2mFJ €3 = p2-p3[mcttot)-3mF .. ]
€, ::::: P3 -P4[mcttot)-"'Fe1 €s ::::: P4
If the criterion of attaining a small difference in the ionic ~trcngth (1) hetwccn
iterations is not met, the stability constants are recalculated according to the latc~t
value of 1. and the al are redetermined.
When the criterion is met and the final values of al ohlalllcd for that
particular temperature and etchant concentration, the molality of cath cOJl1plex ion
is ca1culated a~
(5.5)
The FORTRAN programs written to calculate species distribution arc glven III
Appendix C along with the produeed results.
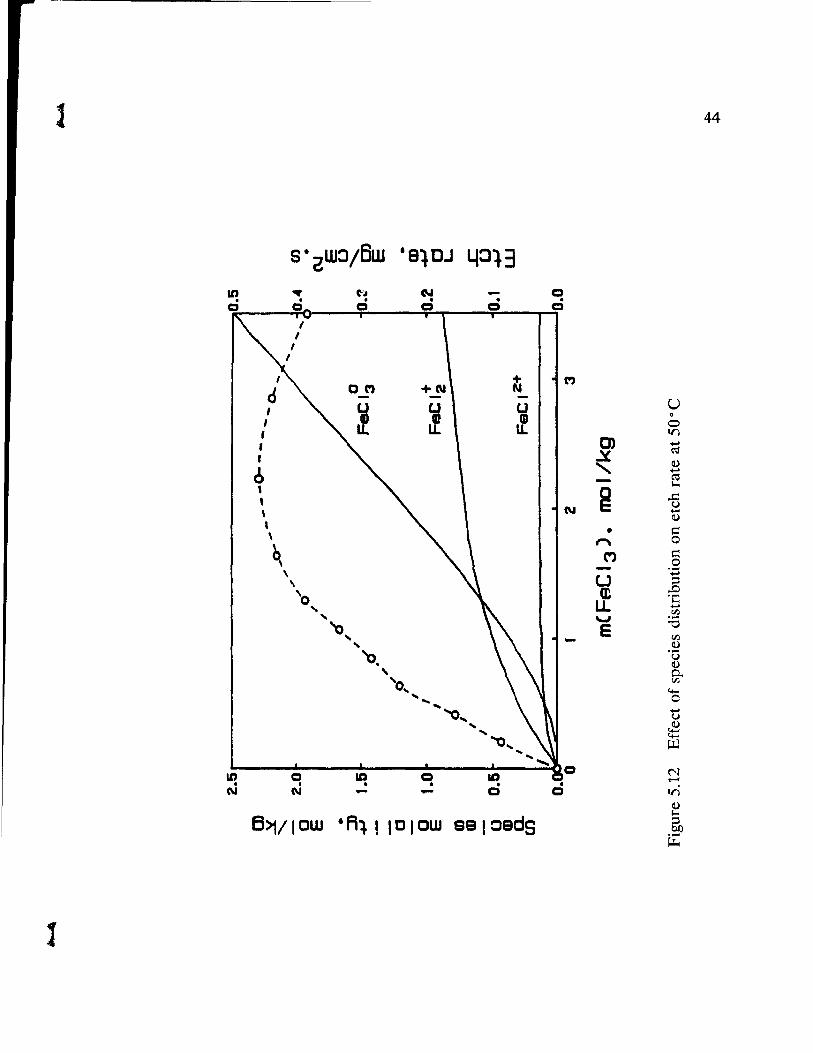
5.3.2 Species Calculations and Rate Results: Effeet of Temperature
Figures 5.10, 5.11, and 5.12 show the species concentration~ and etch rate
curves for 30,40, and 50° C, respectively. For al! temperature~, the FeCI4" complcx
was found to be negligible, remaining at molalities of about 10-4 mol/kg for the

....... r' "
2.5
Cl ".". ... /l-- ....... __ :::L ,'" '4..,
" " ... 2.0
, ",1 m a ,Ji' • E ,
iO.2 N
If E •
1.5~ , u
:JJ , "-.+J " Cl , E
C ,
t • m a 1.0 1 + +J E 1 FeClz C
1 0.1 L..
m i CD . .c ,
0.6 , U
0 If -+J CD 1 FeCI Z+
W a. 1
en ~~ Fe' 10.0 o. ~ 0 Z 3
meFeCl 3 ) • mol/kg
Figure 5.10 Effect of species distribution on etch rate at 30°C
i!3

43
S·ZW:l/ÔW 'a~Oj 4:1l3 N - Q
• • • Q a aS 1
~ •
1 1 -, u
4 Il
LL te \ • U
\ + u
\ n. 0 \ -t
b u. 0) ......
.::i. ('j ,
8 \ ........ Il) ......
\ · ro \ - l-.
\ ~ ..c: \ v ..... a Il)
\ • r:: , le \ 1"""\ 0 , 0 c: CI M .... 0
'a - "C U ~
"- Q) ..0 .... oc:
.... ~ u.. .....
.... If)
.... • .....,
"0 .... C) E 'no
IF, Il)
.... "C , Il)
.... 0.. .... le
rfJ
.... ...... 'c, 0 0
Q ..... v Il) ....... .......
U..l
8 ...... CD ,.-. CID ID ... ("') N . 0 .-• • • • • • • 0
C) C) Q a C) 0 Q 0 0 Ir, Il) l-.
EI>1/IOW -Al! 101 ow saloeds ~ CIJ
li:
"~
l 44
+N (tj fi')
- U , U u If If
0 , 0 , V) , CD .... :::J. c..s
1 Il)
0 "- .... c..s 1-0 ,
~ , ..c u \ N .....
Il) , • ~ \ n 0
0, (") ~ 0
\ - '';::: , U ;:::l
'0 en .0 .-U. 1-0 , ....
Vl , '-' :.a '0, e Vl , Il)
'o. C:) Il) , 0..
'0 .. v;
"'"'" ... 0 ... ... ..... '0 ... u , Il) ... :t:: '0 .. Pol ... ... .....
Q \0 0 ID Ct ID N . • • • • • -N N - - 0 C V)
Il)
B>1/IOW 'Al! ID IOW SSIOsdS 1-0 ;:::l b.Q
~
l

1 45
entire range and therefore is not shown. The Fe 1+ ion, c()n~idcrcd in cqllatioll 1.1
to be the reacting species, is a minor component of the solution and bCCOll1l'"
negligibly small at 50· C.
The main complexes, FeCl2 + and FeCl3o, account for over SOCJ(i or the total
Iron concentration in aIl cases, a trend even more pronounccd \Vith illcrca~illg
temperature. This mirrors the results obtained by Kimllra et al. (19X4) al a l'CI rtC
chloride concentration of 3 M. At low etchant molality the rate appeal ~ 10 have a
direct relation with FeCl2 + molality; then a!-. that complcx near~ l'Ol1~talll
concentrations, the strong increase of FeCI30 corrc~poJ1d:-, to the dccrca~e III clch
rate.
The respective enhancing and inhibiting effecb of the dichloro and trichloro
complexes were incorporated into a rate equation. In order to lIctel mIlle ail
expression relating the etch rate to the concentration~ of the!.c Iwo ll1~L1or "'pCCIC~,
several equations of the form
r = (S.ü) B + CmFeC~
were fitted to the data. The parameter B was includcd in order to obtain a hcllO
fit than with a direct ratio? i.e., B = O. Fixing B = 1 facilitated the arrivaI at the
optimum C value, wtl~~h was 0.27 for 30· C, 0.25 for 40 ù C, and 0.22 for SO" ( '.
Taking an avera~e of 0.25 for aIl three temperature~, the data fitted qUilC weil a!-.
seen in Figure 5.13. The intercept of each tine was statistically proven to equal zero,
and the following rate expressions were obtained:

~ '\
0.5 1
Il T - 30°C
ID Oo4r o T = 40°C
o T - 50°C • N B 0.3 "-m E • 0.2 m
+1 C 1-
.I: 0.1 u
+1 W
0.0
-0.1~'--------------~------~------~------~------~ 0.0 0.1 0.2 0.3 0.4 0 0.5
m(FeCI~)/[1+0.25 m(FeCI~)] 0.8
Figu:'e 5.13 Fitting of etch rate data to rate expression
""~
~ 0"1

1 47
r = 0.5239 (.S.X)
(S.l))
mFect; r = 0.8474 ---~-
1 + O.25mFtCI~
The coefficient, A, in each equation may now he con~idcrcd thc latc cOIl:-.tallt
and its Arrhenius dependence tested (Figure 5.14). The data fit a ~tralght tillc Illon.'
satisfactorily than did the Iinear region rate con!-.tant, k.
With these rate equations, it is now sufficient to know the T1lolaltty nI h.:{ ï \
in an etchant solution with a hydrochtoric acid molarity of ahout O.X4 III 01 dn 10
determine the e~·~h rate. From the figures relating ~pccic~ distributioll to krrtl'
chloride molality (Figures 5.10,5.11, and 5.12), or from the algorithm dc"crihl'd III
Section 5.3.1, the concentrations of the FeCI2 + and FeCl\() ion" l'ail r .. :adily be
obtained. Then the etch rate can be calculated from equation~ 5.6, 5 7, or S.X, lI"lIlg
the appropriate rate constant.
5.3.3 Species Distribution and Rate Results: Effect of ChloridejNitratc Ratio
For the mixed chloridejnitrate experiments, the ~pccie" dl ... tr ihutioll wa"
r determined and is shown, with corresponding etch rate vallle~, in Figure .s.15. Duc
to the presence of the nitrate ion and the low iron concentration lI ... ed for the ... e

/1'-'':""
0.0 i <
-0.1
-0.2
-0.3
a: C -0.4
-0.5
-0.6
-0.7
o.mm 0.0031
Ea - 20.0 kJ/mol
A - 1.50 x 10³
0.0032 0.0033 0.0034 1/1. K- 1
Figure 5.14 Arrhenius plot for rate constant A
O.oo:Ji
,.. "\
~ 00

~ l
Cl :::t.
" a E
• :J) 0.75
+1
Cl
o 0.50 E m m (] 0.25 m a.
U)
[Fel - 1 M
T - 30ac
.,. ... ,--,'" ,'" ,'"
a FeCI 3
,'" ... ' ,,'
" ,'"
,,<:1'" "
, , , ,
FeCI+ 2
,'iO.20
m •
N 0.15 E (]
........
~ JO.IO rD
+1 [] L.
I:. o.œ 0 +1 W
0.00 1e-::::::E::::::::::::::_.L..-----'-_--'--_~:=::==::i=:=z=:=:=JJO.oo 0.0 0.1 0.2 0.3 0.4 0.5 0.6 0.7 0.8 o.g 1.0
R
Figure 5.15 Effect of species distribution and R on etch rate
•
.. ,c
~

{ ,.
50
experiment~, the species distribution is very different from that for pure chloride
etchants (Figures 5.10, 5.11, and 5.12). The ferric ion, assumed to constitute 100%
of iron specie~ for R = 0, appears to be the species responsible for copper etching at
low R, but i~ again seen to be a minor contributor as R increases and chloro
complexes hecome ~ignificant.
In Figures 5.10,5.11, and 5.12, the dichloro and trichloro species were the only
specie~ pre~ent in ~ignificant amounts, and the etch rate appeared to he respectively
enhanced anù inhihited by the two complexes. However, in Figure 5.15 the FeC130
ion rcmain~ con!o.tant for R above 0.4, minimizing its role in affecting the rate.
In~tead, the FeCI2+ complex appears to inhibit the etch rate, for the rate increases
liUle at low R, when the concentratiol1 of this species is increa~ing, while at high R
the greatcr increase in etch rate corresponds to the decrease in FeCI2+
concentration. Sincc in experiments with ferric chloride-hydrochloric etchants, the
concentration of thi!o. complex is constant throughout. this is the first indication that
it al~() may he an inhibiting factor on the etch rate. The enhancement effect of the
FeCI2 + ion i~ ~till apparent in mixed chloride/nitrate etchants, as the rate does
increa~c mmt rapidly when it is at its highest concentrations, i.e., at high R.
Table 5.3 !o.hows a comparison of the etch rate~ obtained with mixed
chloridcfnitrate etchants to the rate values predicted hy the expression proposed for
FcClr HCI-H20 systems at 30 0 C. The moùel fits the data only at high R, when the
nitrate ion concentration is considerably lower than that of the chloride ion.
However, the model proposed for only chloride-containing etchants assume~ that the

r 1 SI
rate is zero when no FeCl2 + is present; experiments pcrformed with Sollitioll~
containing only hydrochloric acid (no ferric chloride) confirm this assumption a~ ~ccn
in Figures 5.3 and 5.4. In nitrate solutions the ferric ion is pre~cnt whcn IlO Fe('l2 t
is formed, and sorne etching does occur.
Table 5.3 Cornparison of ResuIts to Model for Nitrate-c.mtaining Etchant~
m(C/) m(FcC12 +) m(FcCI3O) r (mOlkl) r (npt)
m(Cl)+m(N03) mol/kg mol/kg
1 mg/cm- ~
1 1Il~/ 1I11- ...
0 0 0 () (joInt
0.220 0.126 0371 o OW4 t1.11 ~
0.783 0.334 0.376 n.H)!) () Ih7
1 0.456 0.384 O.21S Il 201 -

52
CHAPTER 6
CONCLUSIONS
The etch rate of copper does not increase uniformly with concentration in
ferric chloride-hydrochloric acid etchants. While the etching reaction appears to
follow fir~t-ordcr kinetic!' at low FeCI3 concentrations «0.8 M), the rate constants
ohtaincd at tcmperatures of 30, 40, and 50°C do not follow the Arrhenius equation.
At ahout 2 M FeCI], the etch rate reaches a maximum and decreases
thereafter. It!'l dependcnce on concentration has been explained by the chloro
complexes of the ferric ion present in solution and their respective variations with
Fee!3 concentration. The predominant species in the concentration range of interest
arc FeCI2 ~ and FeCI,o, and the following rate equation has been propmed:
m FeCI; r =A ---~- 6.1
1 + O.25mFtCl~
The I1CW rate con!-.tant, A, does follow Arrhenius kinetics for the temperature range
inve~tigated.
The suhstitution of nitrate, in the form of ferric nitrate and nitric acid, for
('hloride in the etchant results in substantially reduced etch rates, since the ferric ion
is unahle to form the chi oro complexes which enhance the reaction. The etch rate
increases uniformly with the fraction of total anion concentration made up by
chloride, and appears to be most influenced by the concentrations of FeCI2+ and

1
1
FeCI2 + when the total iron concentration is l M.
The etch rate results obtained in this stlldy arc free of l11a~~ tntnsfcl
limitations and it is recommended that these vallle~ be lIsed as a guidelinc in the
design of etch reactors.
If further research into copper etching with a batch stirrcd-tank rcaclor l!'>
pursued, it is recommended that the effects of the followi ng paramctcrs hl'
investigated:
- acid concentration and the subsequent change~ in ~pecic~ di!>tnhulion
- aeration
- dissolved copper in solution (further experimentatiol1)

(
( ....
54
CHAPTER 7
REFERENCES
Baes, C.F. and R.E. Me!o.mer, The Hydrolysis of Cations, John Wiley and Sons, Inc., New York (1976).
Bryce, C., "The Wct Etching of Copper by Ferrie Chloride", Research project report, McGiIl Univcr!o.ity, 1989.
Duffek, E.F. and E. Armstrong, "Etching", in Handbook of Circuits Manufacturing, MeGraw-Bill. Inc., New York (1980), pp. 8-20 - 8-25.
I-Iahu, S., and Y. Yoshihiro, "Studies of Copper Etehing in Ferrie Chloride Solutions", Inti. Eng. Chcm. Proce~" Des. Dev., 2.1,511-514 (1982).
Hartley, F.R., e. Burge~l." and R.M. Alcock, Solution Equilihria, Halsted Press, New York (1980), pp. 15-31.
Ilelgc~on, ILe., "Thermodynamies of Hydrothermal Systems at Elevated Tempcraturc!o. and Pre~~ures", Am. 1. Sei., 2()7, 729-804 (1969).
Ilimlllciblau, D.M., Process Analysis by Statistieal Methods, University of Texas, Austin ( ] (80).
JanS7. J.J.c., "Thermodynamics of Aqueou~ Chloride Solutions: Calculation of Ionie Activitics and Distribution Data for Chlorocomplexes", TMS Paper Selection A84-1, The Mctallurgical Society of AIME (1984).
Kimura, R.T., P.A. Haunschild, and K.C. Liddell, "A Mathematieal Model for Caleulation of Equilibrium Solution Speciation~ for the FeCI3-FeCI2-CuC12-CuCl-1IC'I-NaCI-1I20 Sy~tcl11 at 25°C", Met. Trans. B, 15B, 213-219 (1984).
M~mton, A.L., and S.F. Bush, "Raman Spectral Investigation of the Complex Species of Ferrie Chloridc in Concentrated Aqueous Solution", App!. Spectros., 26, 579-584 (1972).

1 Maynard, R.B., J.J. Moscony, and M.H. Saundcr~, "Ferric ChiO! iùe Etching of l.ow
Carbon Steels", RCA Review, 45, 73-89 (1984).
Safoniuk, M., "Copper Etching", Research project report, McGill Univcr!'lity. 19XR
Saubestre, E.B., "Copper Etching in Ferric Chloride", Inl!. Eng. ('hem .. 51. 2~~-29() (1959).
Sillen, L.G., and A.R. MarteH, Stability Constant!'! of Metal-Ioll C0Il112Jcx_~'-". Spcclal Publication no. 17, The Chemical Society, Lonùon (1964). pp. 2XO-2X 1.
Smith, J.M., Chemical Engineering Kinetics, 3rd cd .• McGraw-Hill, Ine., Ncw Yorl" (1981), pp. 44-47.
Smith, R.M., and A.E. MarteH, Critical Stability Con .... lallts. vol. 4, Pit: 11 LI III PiC ......... Ncw York (1976), p. 106.
Vasilev, V.P., and V.N. Vasileva, "Most Probable Stahility C()I1""allt~ (lI Coordlnallon Compounds", Russ. 1. Inorg. Che m., 22, 633-636 ( 1977).

56
APPENDIX A
TABULATED EXPERIMENTAL RESULTS
l..tble A.I Etch Rate vs Concentration at T=30°C
m(FcCI3), mol/kg Etch rate, mg/cm2.s
0 0
0.204 0.0504
0.413 0.0877
0.625 0.135
0.840 0.173
1.061 0.207
1.284 0.233
2.223 0.277
2.849 0.263
3.507 0.232

1 Tahle A.2 Etch Rate vs Concentration at T = 40°C
m(FeCI3), mol/kg Etch rate, mg/ CI11:.~
0 0
0.206 O,()6I'N
0.415 O.l':q
0.628 0.207
0.H44 O.~()()
1.065 O.JO( )
1.290 (U41
1.518 0.34 'i
Tahle A.3 Etch Rate v~ Concentration at T = 50°C
1 m(FeeI3), mol/kg
1 Etch rate, mg/cI112." ~
() 0
0.206 O.Ok7)
0.416 O.l)() -
0.630 0.242
0.H46 O.2k4 --1.067 0.33)
1.293 O.3Xh
2.231 0.45:-;
2.H52 O.44()
3.503 O.3X3

f 58
Table A.4 Etch Rate ResuIts for Fe(N03h-HN03 Etchant
1 m(Fe(N03h), mol/kg Etch rate, mg/cm2.s
0.207 0.0287
0.530 0.0643
1.105 0.0994
1.732 0.120
2.415 0.112
3.164 0.0949
Table A.5 Etch Rate Results for Mixed Chloride/Nitrate Experiments
Il m(FeCI ) 1 m(Fe(N03h) m(HCl) m(HN03) Etch rate li 3 mgjcm2.s mol/kg mol/kg mol/kg mol/kg
1
1.067
1
-
1
-
1
0.885
1
0.167
1 - 1.095 0.927 - 0.113
(

1 APPENDIX B
STATISTICS
The statistical calculations typically performed for cach cxpcrimcnt will he
shown here for the same results depicted in Figure S.l. The modcl fit ln the data
in each case is a first-order model of the form:
/30' and /31 are the first-order coefficients and are approximatcd by bo' and hl'
respectively, as calculated below. A 95% confidence intcrval i ... detcrmÎIl<..:d fOI cach
coefficient.

f 60
Table B.l Statistical Data for a Typical Experiment
x. y.. y. (Xr X)2 Yi (Xi-X) y'0 1 IJ 1 1
(time) (normalized mg/cm2
(predicted ~ weight by model
difference ) mg/cm2
below)
0 0 0 4225 0 0.078 0 0
45 12.23 12.24 400 -244.80 12.53 12.49 12.00
60 ]8.19 17.44 25 -87.20 16.69 17.14 16.99
75 20.66 20.72 100 207.20 20.84 20.71 20.79
90 26.56 24.71 625 617.75 24.9lJ 24.71 22.87
120 33.16 33.31 3025 1832.05 33.29 33.33 33.43
1 Slll1l over i
1 108.42
1 8400
1 2325.00
1 -
1
1
b = Ep,Y; = 3(10~.42) = 18.07 o Ep, 18
hl = Ep,Y,(X, -X) = EPi(X,-Xf
3(2325.00) = 0.2768 3(8400)
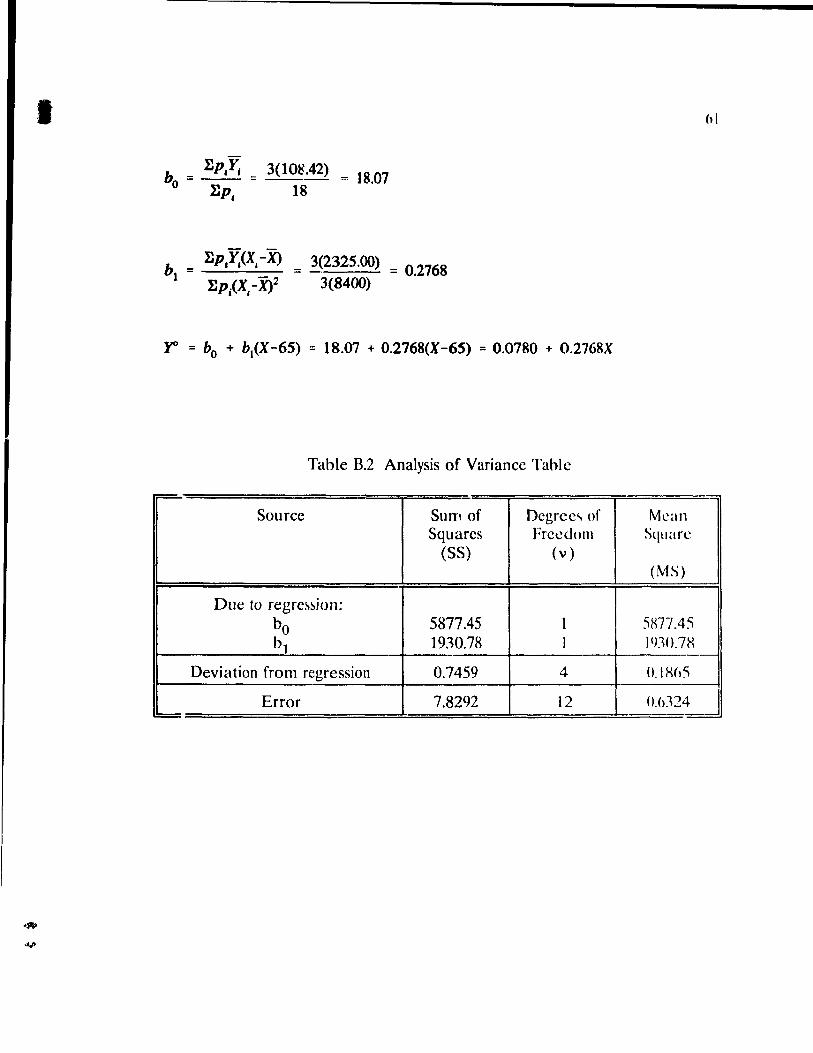
r = bo + b\(X -65) = 18.07 + 0.2768(X -65) = 0.0780 + O.2768X
Table B.2 Analysis of Variance Tahle
Source Sum of Degree" of Squares Frceuol11
(SS) (v)
Due to regre~~ion: bo 5877.45 1 b1 19JO.78 1
-Deviation from regression 0.7459 4
Error 7.8292 12 =
hl
Mean Square
(MS)
)X77.4:) Il)]O.7X
Il. 1 X(IS
(),(IJ24 '"=

Test of Fit
a ::: 005
S'tatlStic MS, == 0.1865 == 0.2859 MS
t 0.6524
critical value::: F09S (4,12) ::: 3.2592 > statistic
accept Ho model fits
Poolcd Variance:
2 2 SS, + SSt s-- .. S
Y, P Vr + V t
0.7459 + 7.8292 ::: 0.5359 4 + 12
SI'" s- [_1_ + "0 YI EPi
Xi l = 0.5359 [J... + 652
1 Y.p,(X,_X)2 18 3(8400)
:- 0.1196
Sv, S or --~
bl Ep,(X, _X)2 =---0.5359 = 2.127xlO-s
3(8400)
62

1 95% Confidence Interval for~' and BI
for a = 0.05 t0975 (16) = 2.120
Sb,to9n = (0.1196)%(2.120) = 0.7332 o
Sb t0975 = (2.127xlO-5)1h(2,120) = 0.00978 1
1 .. -0.6552 ~ Po < 0.8112
0.2670 ~ PI < 0.2866
Test that intercept = Bo' = 0
a = 0.05
.. 1 b~ 1 0.0780 0 2255 statzstlc = -- = = . Sb' (0.1196)1h
o
critical value = to 975 (16) == 2.120 > statistic
accept Ho 1 Po == 0
l

c
\
(
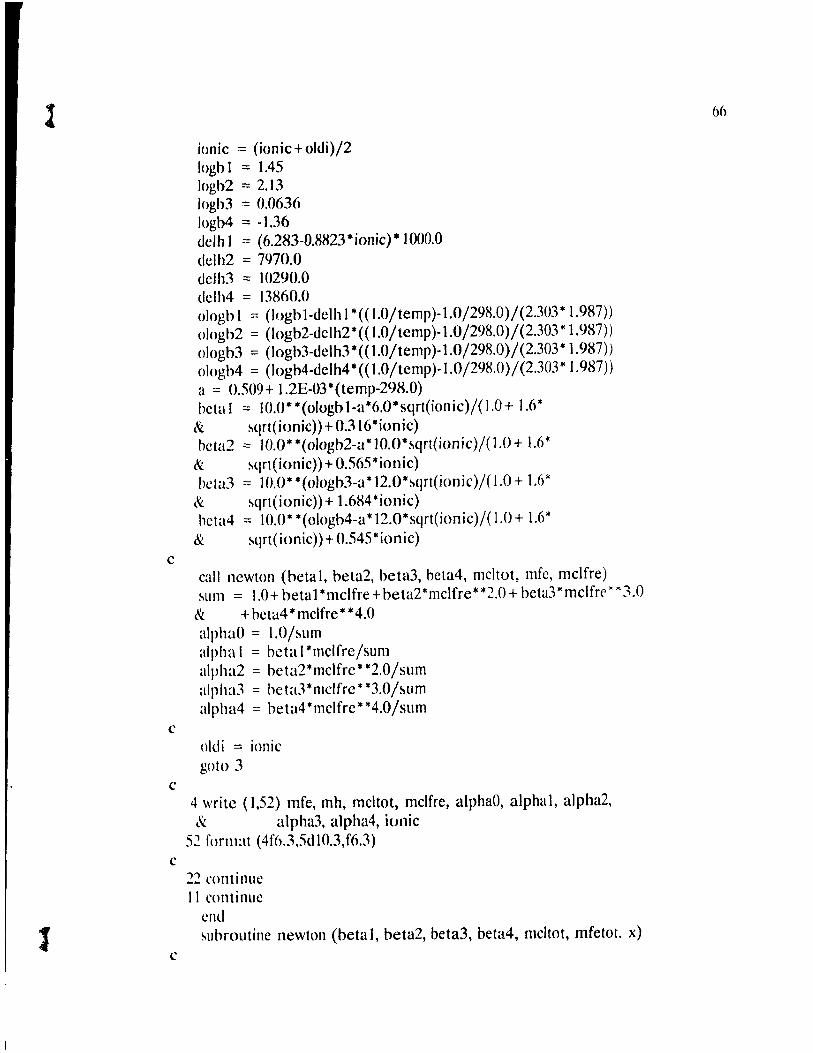
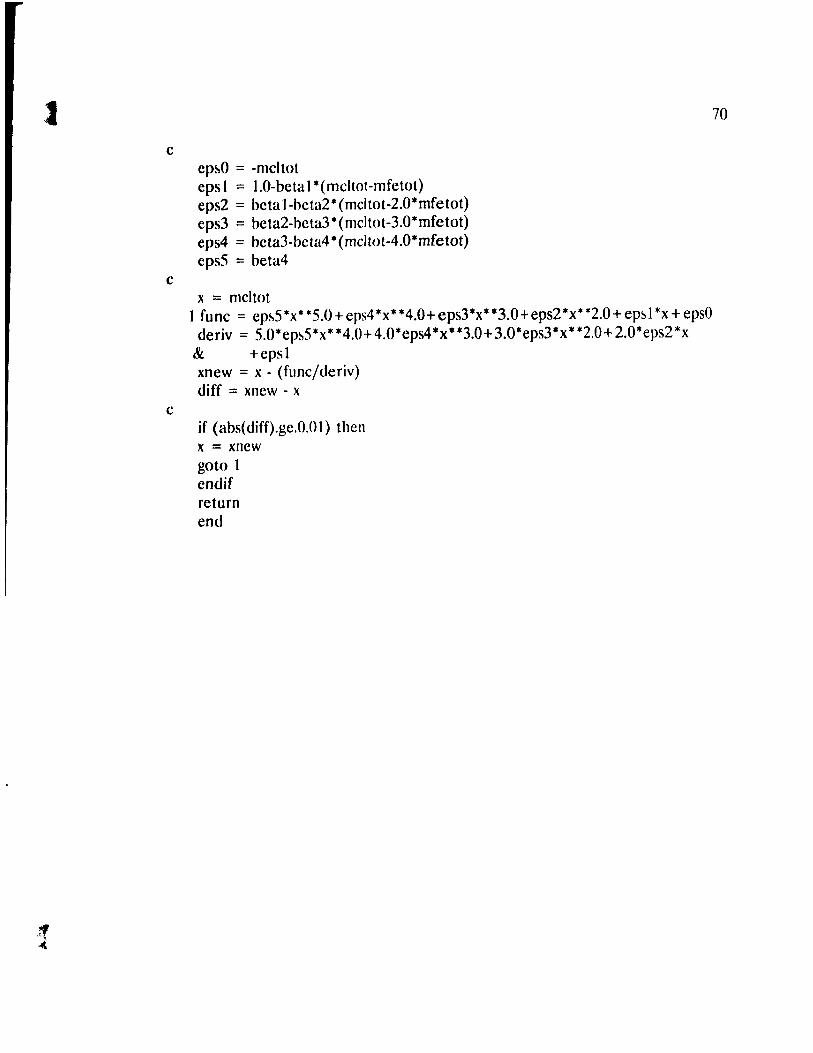
APPENDIX C
FORTRAN PROGRAMS FOR SPECIES CALCULATIONS
One ha~c program was written to handle the numerical solutions involved for the
~pccic~ calculations. A slight variation was u~ed to make the calculutions
incorporating the pre~ence of nitrate in solution. The following may he found in this
appcndix:
_ FORTRAN program for ferrie chloridejhydrochloric acid sol utiOfl'i
- modificd FORTRAN program for chloride/nitrate solution~
- data files for hoth programs
- output files for hoth programs

1 h:'
1
c program for calculating wmplcx di~trihution c
c
c
real*R temp, mcltot, mclfre, mfc. mh, alphaO, alpha 1. alpha~, & alpha3. alpha4, heta 1. hcta2, beta3, bcta4, IOl1ll" a, "li Ill,
& olùi, ùelhl. ùclh2, ùelh3, dclh4. logbl, logh2, logh3, & logh4. ologb l, ologb2, ologh3, ologh4
integer ntemp, npt, i, j
open (l, file = \pccre~.dat') open (2, file = 'data.ùat') write (1.50)
50 format CComplcx Specics Distribution,!) reaù (2,1000) ntemp
1000 format (i3) c
c
c
c
c
c
ùo II i = l,ntcmp,1 1 reaù (2.100) temp, npt
writc (l,ISO) tcmp 100 format (f6.I,i3) 150 format (/ /,T = ',f6.I:K')
writc (1.51) 51 format ('mFcC13 mllel mCltot mCltrcc afl
&a3 a4 Il)
ùo 22 j = 1,npt.1 2 read (2,200) mfe, mh
200 format (2fRA) rnc\tot = 3*mfe + mh
mc\fre = mcltot alphaO = 1.0 alphal = 0.0 alpha2 = 0.0 alpha3 = 0.0 alpha4 = 0.0 oldi = 0.0
al a.2
3 ionic = O.5*rnfe*(9.0*alphaOt4.0*alphal+alplla2talpha4) & +O.5*(rnh+mclfre) diff = oldi - ionÎC if (abs(diff).1e.O.05) goto 4
l
c
c
c
c
c
ionic == (ionic+oldi)/2 logh 1 == 1.45 logb2 == 2.13 logb3 == 0.0636 logb4 == -1.36 oelh) == (6.283-0.8823*ionic)* 1000.0 dclh2 == 7970.0 dclh3 == J0290.0 dclh4 == 13860.0 ologh 1 = (Ioghl-delh 1 *« 1.0jtemp)-1.0/298.0)/(2.303* 1.987») ologh2 = (logh2-delh2*« 1.0jtemp)-1.0/298.0)j(2.303* 1.987)) ologh3 = (logb3-dclh3*« l.Ojtemp)-1.0/298.0)j(2.303* 1.987)) ologh4 = (logb4-delh4*«1.0jtemp)-1.0/298.0)j(2.303* 1.987») a = 0.509+ 1.2E-03*(temp-298.0) bctal == 1O.0**(ologhl-a*6.0*sqrt(ionic)/(1.0+ 1.6*
& ~qrt(ionic» + 0.316*ionic) hcta2 == 1O'()* *( ologh2-a * 1O.0*~qrt(ionic)j( 1.0 + 1.6*
& ~qrt(ionic»+O.565*ionic) beta3 == JO.O* * (ologh3-a * 12.0*~qrt(ionic)/( 1.0 + 1.6*
& ~qrt(ionic»+ 1.684*ionic) hcta4 == 1O.0**(ologh4-a*12.0*sqrt(ionic)j(1.0+ 1.6*
& ~qrt(ionic»+O.545*ionic)
cali newton (beta l, beta2, beta3, beta4, mcltot, mfe, mclfrc) ~lIm = 1.0+ beta 1 *mclfrc + beta2*mclfre**2.0 + beta3* rnclfrr' x 3.0
& + beta4*rnclfre**4.0 alphaO == 1.0hum alpha 1 == beta 1 *mclfrejsum alpha2 == beta2*mclfre**2.0jsum alpha3 == beta3*mclfre**3.0j~um alpha4 == beta4*mclfre**4.0jsum
oldi = ionic goto 3
4 write (1.52) mfc, mh, rncltot, rnclfre, alphaO, alphal, alpha2. & alpha3. alpha4, jonic
52 forl11~lt (4[6.3.5d 1O.3,f63)
22 continue II continue
end ~llbroutine newton (betaJ, beta2, beta3, beta4, mcltot, mfetot. x)
66

1
e
e
e
l
real*8 epsO, eps l, epQ, eps3, eps4, eps5, x, fune, den\', beta l, & beta2, heta3, heta4, rncltot, mfetot, xnew
epsO = -rncltot epsl = 1.0-hetal * (rneltot-rnfetot) eps2 = heta I-heta2*( mcltot-2.0* mfetot) eps3 = heta2-heta3*(meltot-3.0*mfetot) eps4 = heta3-heta4*(mcltot-4.0*mfetot) ep~5 = heta4
x = rncltot
h7
1 fune = ep~5*x**5.0+eps4*x**4.0+eps3*x**3.0+cpQ·x**2.()+cp~1 *;\ 1 cpsO deriv = 5.O*ep~5 *x**4.0+ 4.0*eps4*x* *3.0+ 3,()*eps3*;\ **2.0+ 2.()*cp<~"x
& +epsl xnew = x - (fllncjderiv) diff = xnew - x
if (ahs(diff).ge.O.Ol) then x = xne\v goto 1 endif retllrn end

1 c c nitrate ver~i()n of ~pccic~ calculations c
c
c
c
c
c
c
real*S temp, mcItot, mclfre, mfe, mh, alphaO, alphal, alpha2, & alpha3, alpha4, beta 1, heta2, heta3, beta4, ionic, a, sum, & oldi, delh 1, delh2, delh3, delh4, logbl, logb2, logb3, & logb4, ologb J, ologh2, ologb3, ologb4, mno3
integer npt, j
open (1, file='llitre~.dat') open (2, file = 'nitdat.oat') write (1,50)
50 format CSpccies Di~tributioll in Nitrate-containing Solutions' /) write (J,ISO)
150 format CT = 303 K'/)
reao (2, J 00) npt 100 format (i3)
do 22 j = 1 ,npt, 1 2 reao (2,200) mfe, mh, mchot, mno3
200 format (4f6.3) write (l,51) mfc, mh, rnno3, mcltot
51 format (/ /,mFc = ',f5.3,' mH = ',f5.3,' & ,f5.3/ /) write (l,52)
52 format ('mClfree aO al a2 & 1'/)
mclfre = mcltot alphaO = 1.0 alphal = 0.0 alpha2 = 0.0 alpha3 = 0.0 alpha4 = 0.0 oloi = 0.0 tcmp = 303.0
mN03 = ',f5.3,' mCI = '
a3 a4
3 ionic = 0.5*mfe*(9.0*alphaO+4.0*alphal + alpha2 + alph(4) & + O.5*(mh + mclfre + mn(3) diff = oldi - ionic if (ahs(diff).Ie.0.05) goto 4
Îonic = (ionic + oldi)/2
68

c
c
('
c
c
logbl = 1.45 logh2 = 2.13 logb3 = 0.0636 logb4 = -1.36 delhl = (6.283-0.RR23*ionic)* 1000.0 delh2 = 7970.0 delh3 = 10290.0 delh4 = 13860.0 ologh 1 = (10gb l-d(.'lh 1 *« 1.0jtemp )-1.0j29R.O)j(2.303* I.lIH7» ologb2 = (logb2-dclh2*« 1.Ojtemp )-1.0j29R.O)j(2.303* 1.9H7) ologb3 = (logb3-delh3*« 1.0jtemp )-1.0j29R.O)j(2.303* I.Wn» ologb4 = (logb4-dclh4*« l.Ojtemp)-1.0j29R.O)j(2.303* 1.9H7» a = 0.509+ 1.2E-03*(tcmp-29H,O) betal = 1O.O**(ologhl-a*(d)*~qrt(i(lnic)j( 1.0+ 1.6*
& ~qrt(ionic) + 0.316'" Ionie) beta2 = 10.0* *(ologh2-a* lO,()*~qrt(ionic)j( \.0+ I.h*
& ~qrt(ionic»+0.565*lonic)
beta3 = 1 O.()* *( ologh3-a '" 12.0*~qrt( ionic )/( \.0 + I.h * & ~qrt(ionic»)+ l.M{-+'" Ionie) bcta4 = IO.O**(o}ogh-+-a'" 12.0*~qrt(i()nic)/( \.0+ 1.6*
& ~qrt( iOllic» + Oj-+:, ~ lOI1le)
cali newton (heta 1. bcta2. hcta3, het,t4, mdtot. mk, mcll fl')
su m = I.() + bcta l '" mclfre + bcta2 * mclf re * * 2J>+ bcta3* md 1 rc" ~ 3 .11
& +beta-+"rncllrc**-+.O alphaO = I.Ohulll alpha 1 = oeta 1 *mclfrcj",urn alpha2 = hcta2"'mclfrc**2.(Jj~1l1ll alpha3 = bcta3*rnclfre*"'30hlllll alpha4 = heta-+*mclfre**4 Ohlllll
oldi = ionic goto 3
4 write (l,53) mclfre, alphaO, alpha 1, alphaZ, & alpha3, alpha4. ionic
53 format (f6.3,5d 10.3,1'6.2)
22 continue end subroutine newton (beta l, beta2, heta3, bcta4, mcltot, mktot, X)
real *R ep~O, ep~ l, ep~2, cp..,3, ep~4, ep~5, x, fune, dcriv, beta l, & beta2, beta3, beta4, mcltot, mfetot, xncw
e
c
c
ep~O = -rncltot eps1 = 1.0-betal *(mcltot-mfetot) eps2 = betal-beta2*(rncltot-2.0*rnfetot) eps3 = beta2-beta3*(rncltot-3.0*rnfetot) eps4 = bcta3-bcta4*(rncItot-4.0*rnfetot) eps) = beta4
x = rncItot 1 fune = ep~5*x**5.0+ eps4*x**4.0+eps3*x**3.0+eps2*x**2.0+ep~1 *x + epsO
deriv = 5.0*ep!ol5*x* *4.0+4.0*eps4*x**3.0+ 3.0*eps3*x* *2.0+ 2.0*eps2*x & +epsl xnew = x - (funcjderiv) diff = xnew - x
if (abs( diff).ge.O.O 1) then x = xnew gota 1 endif return end
70

1 Data file for FeCI3-HCI etchant calculations
3 303.0 12 0.0101 0.8590 0.0508 0.8600 0.1020 0.8620 0.2040 0.8660 0.4130 0.8740 0.6250 0.8820 0.8400 0.8890 1.0610 0.8980 1.2840 0.9060 2.2230 0.9410 2.8490 0.9650 3.5070 0.9900
313.0 10 0.0102 0.8640 0.0511 0.8650 0.1020 0.8670 0.2060 0.8710 0.4150 0.8780 0.6280 0.8860 0.8440 0.8940 1.0650 0.9020 1.2900 0.9100 1.5180 0.9190
323.0 14 0.0102 0.8670 0.0513 0.8690 0.1030 0.8710 0.2060 0.8740 0.4160 0.8810 0.5220 0.8850 0.6300 0.8890 0.8460 0.8960 1.0670 0.9040 1.2930 0.9120 1.6360 0.9240 2.2310 0.9450 2.8520 0.9660 3.5030 0.9890
71

Data file for chloridejnitrate calculations
9 1.0960.921 0.737 3.473 1.095 0.927 0.927 3.285 1.091 0.916 1.2562.931 1.0860.912 1.667 2.501 1.081 0.908 2.075 2.075 1.0770.905 2.481 1.654 1.072 0.901 2.882 1.235 1.067 0.885 3.201 0.885 1.064 0.894 3.676 0.408
72

1 Complex Species Oistribution
T = 30J.OK
mFcCt3 mUCt rnCt,l mCt,f aO al a2 aJ ,,·t
0.010 0.859 0.889 O.lP5 0.1040+00 0.3920+ 000.481)1)+000 147D-O) () 5ll1'\D-()·1 () xx:! 0.0510.860 1.0120.9460.9140-010.3750+00 O.5I3D+OO n.IIJ7D-O) () hl{3))-O-1 () '175 0.1020.8621.l681.0150.793D-OI O.356D+000536D+0002XClD-Ol (}SOID-04 I07S 0.2040.8661.478 1.1580.5930-01 O.31<iO+OO 05nO+OO o 52SD-OI 0 t07D-()~ \ 25.1 0.413 0.8742113 1.3660.3470-01 0.2430+00 05,~ID+OO 0 14ID+(I() 0 1-l..JJ)-ll' 15011 0.6250.8822.757 1.520 () 2340-01 0 19:i0+()() 0.555D+()O O.226D+()() 0 )(J(jD-()~ 1 (JHC, 0.8400.8893.409 1.635 O.170D-()! 0 16004 O(J O.516D+{lO 0 307D+()(} 0 17CJ()-()\ 1 XI:! 1.06108984.0811.73201280-01 OD4D+000475D+00037<JD+()O() t79()-()\ 1'>12 1.2840.9064758 180:1 0 1020-01 O.1150+{)O 0 4 ~1)I)+OO () 437D+()() () I77D-()~ L')I)() 2.223 0.941 7610 2.000 04990-02 O.690D-() 1 03210 -1- 00 (J.fJ{J5 D + (J() () 1 )CJ()-lH 2 11)·( 2.8490.9659.5122.103 (U65D-02 0 550D-O! 0 278D+OO () ()(1~D+(j0 () \--lX!)-\), 22()\ 3.507 0.99011.511 2.1% 02740-02 04450-01 O.243D + (JO lI.7 lOI) + (J() () I-lOD-1n 237·1
T = 313.0K rn pcCl3 m llCl m CI,! mCl,f aO al a2 a3 ,,·1
0.010 0.864 0.895 0880 0.7960-01 0.381 D + 00 05220 + 00 0 17cJD-() 1 () Xl XI)-() 1 () X)-\(l
0.051 0.865 1.0180.9490.7000-01 0.3ô2D+OO 0.545D+00 () 2320-01 li (nCd)·!)·1 () ()7,1 0.1020.867 1.173 1 014 06110-01 () 341 D+ 000 5fJ4D+ 00 () 32XD-ll 1 () 1 !3J)-{) \ 1 ()1l7 0.2060.8711.489 11460.463D-Ol 0.3010+00 o 594D+0(J (J5HC,I)-OI Il 147J)-!n 1:!~7 0.41508782.123 1.3570.2690-01 0.226D+OO O.5%D+O() () 150D+{)() () 1()'iD·!n 1,171) 0.628 0.886 2 770 1 507 0 1840-01 0.1 HOD + 00 () 5()() 1) + 00 () 234)) + (J(J (l.'~2J J)-(J \ 1 (J'i 1 0.8440.8943.426 1.(\200.1330-010.1470+00 0525D+00 0 114D+()() 02,S/)-(H I77K 1.0650.9024.097 1.7150 1010-01 () I22D+OO 0.482D+OO 0 3K5D+()() () 2V)\)-1lJ, 1 K7') 1.2900.910 4.780 1.7850.8060-02 0.105D+00 0.445D+()() 0.44.2Dt(J() O.217J)·!H 1 ()52 1.518 0.919 5.473 1.852 0.()560-02 09070-01 0.4110 + 00 () 4<J2D + O() () 234D-1i \ .2 () IX
7"' .'
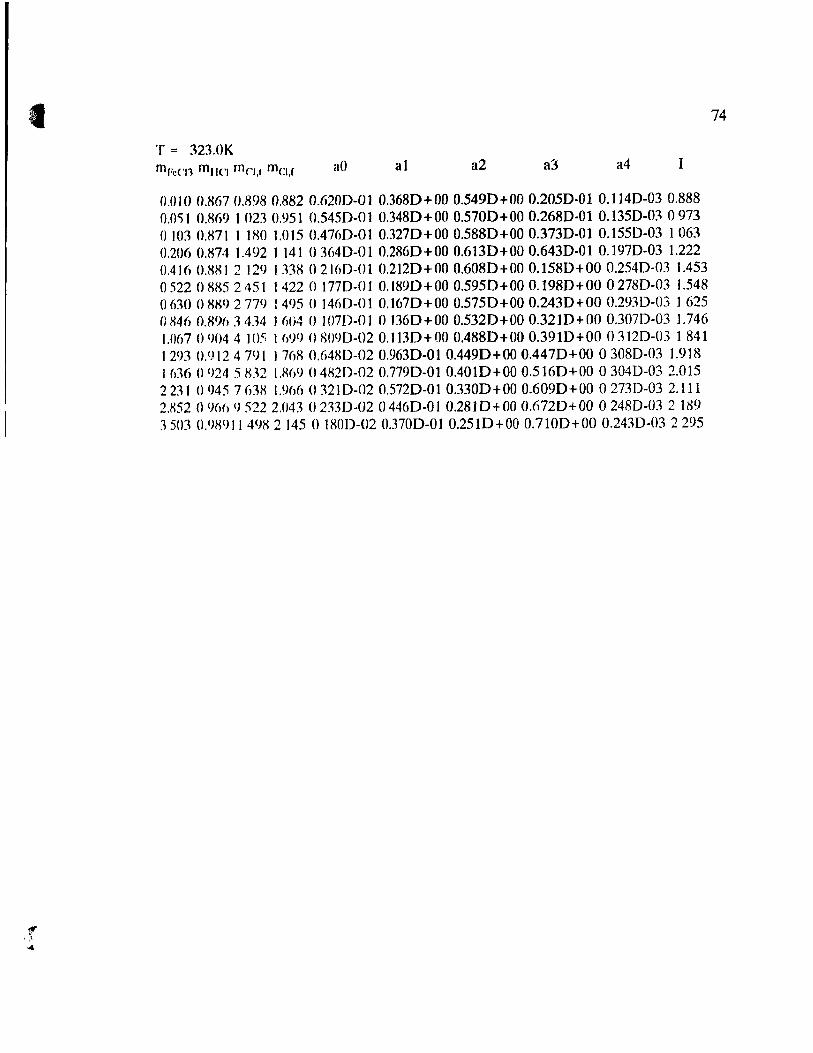
, T = 323.0K m FcCI1 m"C1 ffiCJ,\ ffiCl,f aO al a2 a3 a4 l
0J)10 0.867 O.H98 0.882 O.620D-OJ 0.3680+000.5490+00 0.205D-Ol 0.1140-030.888 O.OSl 0.869 10230.951 0.545D-01 0.3480+000.5700+000.2680-010.1350-030973 01030.871 1 180 1.015 0.4760-0J 0.3270+000.5880+000.3730-01 0.1550-03 1063 0.2060.874 1.492 1141 03640-01 0.2860+000.6130+000.6430-01 0.1970-03 1.222 0.4160.8812 121) 11380 216D-01 0,2120+000.6080+000.1580+00 0.254D-03 1.453 () 52208852451 14220 1770-0J 0.1890+00 0.595D+00 0.1980+0002780-03 1.548 () 630(8892771) 1495 () 1460-01 0.1670+000.5750+000.2430+000.2930-03 1 625 o H46 0.8% 3434 1 ()()4 () I07D-O] 01360+000.5320+000.3210+000.3070-03 1.746 1.067 0 9()4 4 JO) 1 hl)<) 01\090-02 0.1130+ 00 0.488D+ 00 0.3910+00 03120-03 1 841 12930.91247()1 17680.6480-020.9630-010.4490+00 0.447D+00 03080-03 1.918 1636 0 ()24 5 tU2 UW) () 4820-020.7790-01 0.4010+00 0.516D+00 03040-03 2.015 2231 09457 (d8 1.%60 321D-02 0.5720-01 0.3300+000.6090+0002730-03 2.111 2.8520 C)()() C) 522 2JJ43 02330-02 () 4460-01 0.2810+000.6720+000 248D-03 2 189 350) 0.989114982 145 0 180D-02 03700-01 0.2510+000.7100+00 0.2430-03 2295
74

1 Species Oistrihution in Nitrate-containing Solutions
T = 303 K
mFe = 1.096 mH = 0.92 1 mN03 = 3473 mCI = 0.737 mClfree aO al a2 a3 a4 0.0220.3730+000.2250+000.3930-01 (U630+00 0 185D-01{ 4.511
mFe = 1 095 mH = 0.927 mN03 = 3.285 mCI =- 0927 mClfree aO al a2 a3 a4 0029 0 3420 + 00 0.242D + 00 0.503D-O 1 0 3()()D + 00 0.427D-()1{ 4 1fl
mFe = 1091 mH = 0916 mN03 = 2.931 mCI = 1.256 mClfree aO a 1 a2 a3 a4 0.0450.3000+000.2690+000.7280-01 0 358D+OO 0.1521)-07 4.05
mFe:: 1.086 mH = 0.912 mN03 = 2.501 mCI == J.(,()7
mClfree aO al a2 il3 .14 0.081 02420+000 300D+OO 0 11fiD+00 () 3420+000 1{{)()D-07 1 (,)
mFe = 1.081 mH == (J.908 mN03 = 2.075 mel == 2 {)75 mClfree aO al a2 a3 ,,4 1 01950.1400+000.3010+000 2()<)0+OO 03500+00 () H79D-OlJ 1 ()1
mFe = 1.077 mH == 0.905 mN03 = 1.654 mCI == 2.481 mClfree aO al a2 a3 a4 0.4120.7500-01 0.265D+OO OJI0D+OO o 34<)[) + 00 0.6I1D-05 251
)
mFe = 1 072 mH == 0.901 mN03 = 1.235 mCI == 2.882 mClfree aO al a2 a3 a4 0.707 0.4240-01 0.221 D + 00 03850 + 00 0.3520 + 00 O.2:10J)-04 2.1 1
mFe = 1 067 mH == 0885 mN03 == O.H85 mel = 3.201 mClfree aO li 1 a2 a3 a4 0.9670.2960-01 0.1940+0004270+00 O.350D+OO 0.4H7D-04 2 15
mFe = Ul64 rnH '= (HN4 mN03 == 040& mCI = 3676 mClfree aO al a2 a3 a4 1.3680.]830-01 0 158D+00 O.4fiOD+OO 0 3fi4D+OO O.J07D-03 2.00
75