lineage of orig in in rhabdomyosarcoma informs
TRANSCRIPT

Lineage of origin in rhabdomyosarcomainforms pharmacological response
The Harvard community has made thisarticle openly available. Please share howthis access benefits you. Your story matters
Citation Abraham, J., Y. Nunez-Alvarez, S. Hettmer, E. Carrio, H.-I. H.Chen, K. Nishijo, E. T. Huang, et al. 2014. “Lineage of Originin Rhabdomyosarcoma Informs Pharmacological Response.”Genes & Development 28 (14) (July 15): 1578–1591. doi:10.1101/gad.238733.114.
Published Version doi:10.1101/gad.238733.114
Citable link http://nrs.harvard.edu/urn-3:HUL.InstRepos:25200507
Terms of Use This article was downloaded from Harvard University’s DASHrepository, and is made available under the terms and conditionsapplicable to Other Posted Material, as set forth at http://nrs.harvard.edu/urn-3:HUL.InstRepos:dash.current.terms-of-use#LAA

Lineage of origin in rhabdomyosarcomainforms pharmacological response
Jinu Abraham,1 Yaiza Nunez-Alvarez,2 Simone Hettmer,3,4 Elvira Carrio,2 Hung-I Harry Chen,5
Koichi Nishijo,5 Elaine T. Huang,1 Suresh I. Prajapati,5 Robert L. Walker,6 Sean Davis,6
Jennifer Rebeles,5 Hunter Wiebush,5 Amanda T. McCleish,5 Sheila T. Hampton,5
Christopher R.R. Bjornson,7 Andrew S. Brack,7 Amy J. Wagers,3 Thomas A. Rando,7
Mario R. Capecchi,8 Frank C. Marini,9 Benjamin R. Ehler,10 Lee Ann Zarzabal,10 Martin W. Goros,10
Joel E. Michalek,10 Paul S. Meltzer,6 David M. Langenau,11 Robin D. LeGallo,12 Atiya Mansoor,13
Yidong Chen,5,10 Monica Suelves,2 Brian P. Rubin,14 and Charles Keller1,15
1Pediatric Cancer Biology Program, Pape Family Pediatric Research Institute, Department of Pediatrics, Oregon Healthand Science University, Portland, Oregon 97239, USA; 2Institute of Predictive and Personalized Medicine of Cancer (IMPPC),Germans Trias i Pujol Health Sciences Research Institute (IGTP), 08916 Badalona, Barcelona, Spain; 3Howard Hughes MedicalInstitute, Department of Stem Cell and Regenerative Biology, Harvard University, Harvard Stem Cell Institute, Joslin DiabetesCenter, Cambridge, Massachusetts 02138, USA; 4Department of Pediatric Oncology, Dana Farber Cancer Institute, Divisionof Pediatric Hematology/Oncology, Children’s Hospital, Boston, Massachusetts 02115, USA; 5Greehey Children’s CancerResearch Institute, University of Texas Health Science Center, San Antonio, Texas 78229, USA; 6Oncogenomics Section,Pediatric Oncology Branch, Advanced Technology Center, National Cancer Institute, Gaithersburg, Maryland 20877, USA;7Department of Neurology, Department of Neurological Sciences, Glenn Laboratories for the Biology of Aging, StanfordUniversity, Palo Alto, California 94304, USA; 8Department of Human Genetics, University of Utah, Salt Lake City, Utah 84112,USA; 9Institute for Regenerative Medicine, Wake Forest School of Medicine, Winston-Salem, North Carolina 27157, USA;10Department of Epidemiology and Biostatistics, University of Texas Health Science Center, San Antonio, Texas 78229, USA;11Department of Pathology, Center for Cancer Research, Massachusetts General Hospital, Charlestown, Massachusetts 02129,USA; 12Department of Pathology, University of Virginia, Charlottesville, Virginia 22903, USA; 13Department of Pathology, OregonHealth and Science University, Portland, Oregon 97239, USA; 14Department of Anatomic Pathology, Department of MolecularGenetics, Taussig Cancer Center, Lerner Research Institute, Cleveland Clinic Foundation, Cleveland, Ohio 44195, USA
Lineage or cell of origin of cancers is often unknown and thus is not a consideration in therapeutic approaches.Alveolar rhabdomyosarcoma (aRMS) is an aggressive childhood cancer for which the cell of origin remainsdebated. We used conditional genetic mouse models of aRMS to activate the pathognomonic Pax3:Foxo1 fusiononcogene and inactivate p53 in several stages of prenatal and postnatal muscle development. We reveal thatlineage of origin significantly influences tumor histomorphology and sensitivity to targeted therapeutics.Furthermore, we uncovered differential transcriptional regulation of the Pax3:Foxo1 locus by tumor lineage oforigin, which led us to identify the histone deacetylase inhibitor entinostat as a pharmacological agent for thepotential conversion of Pax3:Foxo1-positive aRMS to a state akin to fusion-negative RMS through directtranscriptional suppression of Pax3:Foxo1.
[Keywords: alveolar rhabdomyosarcoma; Pax3:Foxo1; sarcoma; satellite cell; myoblast; histone]
Supplemental material is available for this article.
Received January 22, 2014; revised version accepted June 3, 2014.
Rhabdomyosarcoma is an aggressive solid tumor for whichthe cell lineage of origin of alveolar rhabdomyosarcoma(aRMS) remains debated (Tiffin et al. 2003; Charytonowiczet al. 2009; Hettmer and Wagers 2010; Hettmer et al. 2011).Whereas the adult pleomorphic subtype is felt to originate
from muscle stem cells (satellite cells) (Hettmer et al.2011; Blum et al. 2013), the embryonal subtype has beenattributed to arise more often from myoblasts than up-stream myogenic progenitors (i.e., satellite cells), the latterof which are more prone to transform into undifferentiatedpleomorphic sarcomas (UPSs) having relatively little myo-differentiation potential (Rubin et al. 2011). Even more
� 2014 Abraham et al. This article, published in Genes & Development,is available under a Creative Commons License (Attribution 4.0 In-ternational), as described at http://creativecommons.org/licenses/by/4.0.
15Corresponding author:E-mail [email protected] is online at http://www.genesdev.org/cgi/doi/10.1101/gad.238733.114.Freely available online through the Genes & Development Open Accessoption.
1578 GENES & DEVELOPMENT 28:1578–1591 Published by Cold Spring Harbor Laboratory Press; ISSN 0890-9369/14; www.genesdev.org
Cold Spring Harbor Laboratory Press on January 30, 2015 - Published by genesdev.cshlp.orgDownloaded from

intriguing are possible nonmyogenic cells of origin ofembryonal rhabdomyosarcoma (eRMS) from the adipo-genic lineage (Hatley et al. 2012; Kikuchi and Keller 2012).For the alveolar subtype that is often incurable whenmetastatic (Malempati and Hawkins 2012; Hawkinset al. 2013), we previously suggested Myf6-expressing(differentiating) cells of the myogenic lineage as the cellof origin (Keller et al. 2004a,b). These studies had usedconditional mouse models triggering in the Myf6Crelineage the pathognomonic Pax3:Foxo1 chimeric onco-gene, which is commonly found in the human disease asa result of a t(2;13) translocation (Arndt and Crist 1999).Nevertheless, we and others have reconsidered whethermesenchymal stem cells or satellite cells could be analternate cell of origin (Ren et al. 2008; Charytonowiczet al. 2009; Hettmer and Wagers 2010), and thus weperformed the studies described here.
An interesting aspect of the search for cell of origin is thatwe uncovered a differential susceptibility of the Pax3:Foxo1locus to be transcribed based on the cell lineage originallytransformed. This finding may have translational signifi-cance in that the related Pax7 locus in myogenic progenitorsis a classic example of a bivalent epigenetic locus (Mozzettaet al. 2011), with different transcriptional activation statesdepending on degree of myodifferentiation, and thus is poten-tially amenable to pharmacological intervention. Transcrip-tion factors have not typically been considered approachabletherapeutic targets, but if transcription of Pax3:Foxo1 itselfcould be inhibited, then the implicit conversion of fusion-positive aRMS to fusion-negative RMS would have greatappeal, given the substantial difference in outcomes betweenthese two clinical groups in retrospective studies (Sorensenet al. 2002; Missiaglia et al. 2012).
Results
The p53 pathway is frequently aberrant in aRMS
We and others have commonly used p53 inactivation inmouse models of aRMS (Keller et al. 2004a), yet theclinical relevance of p53 deregulation at the geneticand/or functional pathway levels is debated (Takahashiet al. 2004; Ognjanovic et al. 2012). To address this issue,we used metagene analysis to test whether p53 functionalinactivation was a clinically relevant cooperative initiat-ing mutation in aRMS (Supplemental Fig. S1A). Using ourpreviously described metagene analysis and S-scoremethod (Rubin et al. 2011), we analyzed a global geneexpression data set (Supplemental Tables 1, 2) of 62PAX3:FOXO1+ and 24 PAX7:FOXO1+ human aRMS tumorsfor aberrant signaling of the rhabdomyosarcoma-associatedp53 pathway. We found that 85% of PAX3:FOXO1+ tumorsexhibited a gene expression signature consistent with the‘‘p53 off’’ state. Similarly, 75% of PAX7:FOXO1 tumors alsohad a p53 off state. Thus, the p53 off state was a commonsignature in human samples.
Pax3:Foxo1 leads to forms of sarcoma for satellite cellsdifferent from any other myogenic lineage
Having established a prominent role for p53 pathwayinactivation and Pax3:Foxo1 activation as driver events
in the genesis of aRMS, we generated mouse models(Keller et al. 2004a) to mimic these initiating driverevents through targeting to specific muscle cell types infetal and postnatal development (Fig. 1A). Tumors oc-curred in embryonic muscle lineages (MCre for hypaxialPax3) and embryonic and fetal muscle lineages (Myf6Crefor Myf6) as well as the postnatal satellite cell lineage(Pax7CreER) (Fig. 1B,C). For the latter, tamoxifen wasadministered at 30 d of age (adolescence). The Myf5Crelineage was embryonic-lethal (usually resulting in exen-cephaly) (data not shown) in all litters except for oneanimal (U24014) that later went on to develop a tumor ofthe lower extremity at 74 d of age. The most susceptiblelineages were fetal myogenic progenitors and postnatalsatellite cells but not Myf5- or Myf6-expressing postnatalcommitted myogenic progenitors: Of 18 Myf5CreER,Pax3:Foxo1,p53 mice given tamoxifen at 30 d of life(P30 [postnatal day 30]) and observed 43–510 d (median,395), only one developed at age 401 d a tumor that wasdiagnosed as aRMS solid variant of the cranial muscle(Supplemental Fig. S1B–D). Similarly, from eight Myf6CreER,Pax3:Foxo1, p53 mice given tamoxifen at P30 and observed232–505 d (median, 396), no mice developed tumors. Post-natal lineage tracing of the postnatal Myf6CreER lineageshowed marking of myofibers as well as Pax7+ sublami-nar satellite cells (Supplemental Fig. S2), a postnatalresult complementing a report that embryonic Myf6Cremight prime Pax7+ satellite cells (Sambasivan et al. 2013).However, despite a recent report showing that Myf6Cre isactive in early embryonic muscle progenitors that canbecome satellite cells (Sambasivan et al. 2013), otherevidence for the Myf6Cre fetal myoblast population beinga more common cell of origin for Pax3:Foxo1+ aRMS thana postnatal satellite cell includes (1) the absence oftumors from Myf6CreER, Pax3:Foxo1, p53 mice in whichMyf6+ satellite cells can activate Pax3:Foxo1, (2) theabsence of aRMS tumors from Pax7CreER, Pax3:Foxo1,p53 mice in which the Pax7+ satellite cell population atlarge can activate Pax3:Foxo1, and (3) the absence ofaRMS tumors from Myf5CreER, Pax3:Foxo1, p53 micewhose nonquiescent satellite cells can activate Pax3:Foxo1 (Biressi et al. 2013).
To address the reported possibility that nonmyogenic,marrow-derived cells might give rise to aRMS—at leastwhen Pax3:Foxo1 is driven by a nonnative promoter (Renet al. 2008)—we first examined cells of the bone marrowcompartment for the presence of cells derived froma Myf6Cre or Pax3CreKI (Pax3) (Engleka et al. 2005)ontogeny using eYFP (Keller et al. 2004a) and RFP(Vintersten et al. 2004) reporters, respectively. This line-age tracing was done without introducing Pax3:Foxo1 orp53 mutations. Neither the Pax3 nor the Myf6 lineagewas represented in the bone marrow compartment in>0.4% of mesenchymal or hematopoietic cells (Supple-mental Fig. S1E,F), and thus this line of experimentationwas discontinued.
At the histological level, the embryonic MCre (hypax-ial Pax3Cre) and fetal Myf6Cre lineages led to aRMShistology (Fig. 1D). The single animal that survived pastbirth for the Myf5Cre lineage (U24014) also developed
Alveolar rhabdomyosarcoma cell of origin
GENES & DEVELOPMENT 1579
Cold Spring Harbor Laboratory Press on January 30, 2015 - Published by genesdev.cshlp.orgDownloaded from
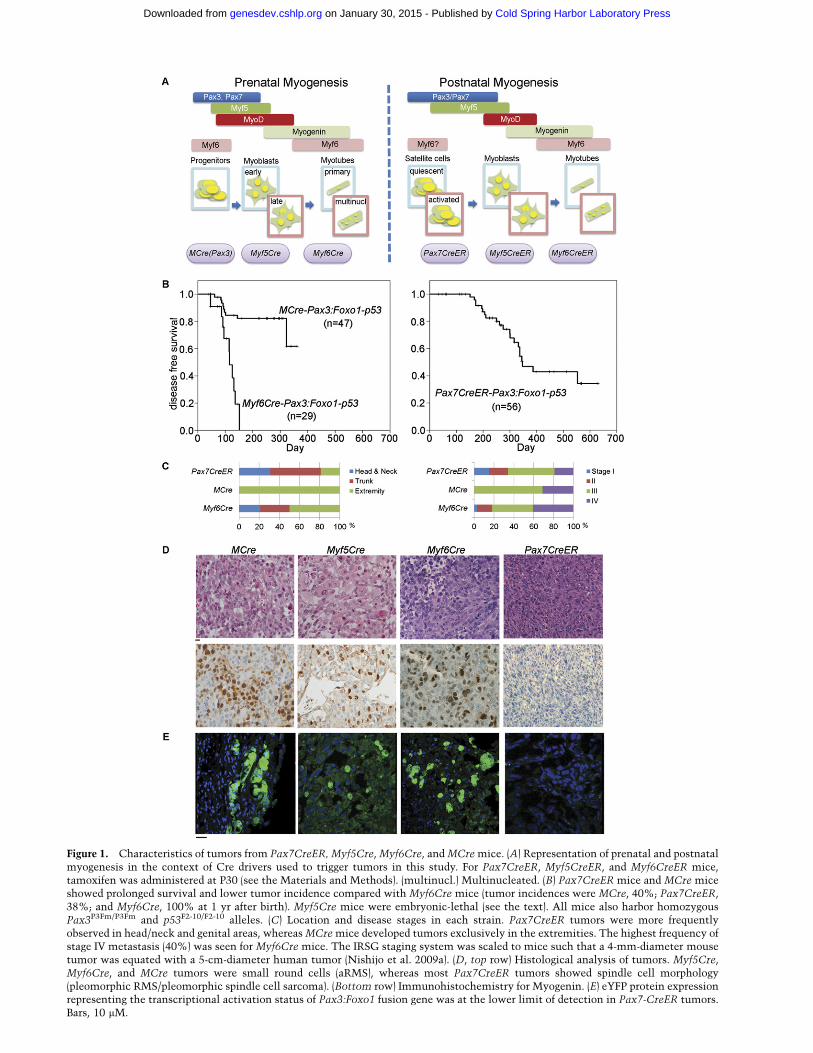
Figure 1. Characteristics of tumors from Pax7CreER, Myf5Cre, Myf6Cre, and MCre mice. (A) Representation of prenatal and postnatalmyogenesis in the context of Cre drivers used to trigger tumors in this study. For Pax7CreER, Myf5CreER, and Myf6CreER mice,tamoxifen was administered at P30 (see the Materials and Methods). (multinucl.) Multinucleated. (B) Pax7CreER mice and MCre miceshowed prolonged survival and lower tumor incidence compared with Myf6Cre mice (tumor incidences were MCre, 40%; Pax7CreER,38%; and Myf6Cre, 100% at 1 yr after birth). Myf5Cre mice were embryonic-lethal (see the text). All mice also harbor homozygousPax3P3Fm/P3Fm and p53F2-10/F2-10 alleles. (C) Location and disease stages in each strain. Pax7CreER tumors were more frequentlyobserved in head/neck and genital areas, whereas MCre mice developed tumors exclusively in the extremities. The highest frequency ofstage IV metastasis (40%) was seen for Myf6Cre mice. The IRSG staging system was scaled to mice such that a 4-mm-diameter mousetumor was equated with a 5-cm-diameter human tumor (Nishijo et al. 2009a). (D, top row) Histological analysis of tumors. Myf5Cre,Myf6Cre, and MCre tumors were small round cells (aRMS), whereas most Pax7CreER tumors showed spindle cell morphology(pleomorphic RMS/pleomorphic spindle cell sarcoma). (Bottom row) Immunohistochemistry for Myogenin. (E) eYFP protein expressionrepresenting the transcriptional activation status of Pax3:Foxo1 fusion gene was at the lower limit of detection in Pax7-CreER tumors.Bars, 10 mM.
Cold Spring Harbor Laboratory Press on January 30, 2015 - Published by genesdev.cshlp.orgDownloaded from

aRMS with numerous rhabdoid-type rhabdomyoblastsand diffuse anaplasia (Fig. 1D). In contrast, the Pax7CreERpostnatal satellite cell lineage led to tumors diagnosed aspleomorphic RMS/pleomorphic spindle cell sarcoma byhistological and immunohistochemical criteria (Fig. 1D).Surprisingly, the eYFP marker of Pax3:Foxo1 was expressedonly weakly in Pax7CreER-derived tumors compared withthe other tumors (Fig. 1E). Correspondingly, Pax3:Foxo1expression by RT–PCR was variable and generally low inPax7CreER tumors compared with mice bearing thePax3:Foxo1 conditional alleles and other Cre drivers(Fig. 2A).
To begin exploring the potential causes of the lowPax3:Foxo1 expression from Pax7CreER,Pax3,p53 tu-mors, we evaluated the Cre/LoxP recombination effi-ciency at the Pax3 locus. By genotyping tumors, Pax3locus recombination frequency was found to be lower intumors of Pax7CreER-expressing satellite cell origin thanMyf6Cre-expressing prenatal (presumably myoblast) ori-gin. Generally Pax7CreER tumors had only one Pax3conditional knock-in allele, P3Fm, converted to theactive Pax3:Foxo1 form, P3Fa (Fig. 2B; see the Discus-sion). In contrast, recombination for the p53 locus byPax7CreER in tumors was uniformly complete for bothp53 alleles. Furthermore, the lower Pax3 recombinationfrequency alone would not account for the difference inhistology because Pax3 (P3Fa/WT) tumors from theMyf6Cre lineage presented with an aRMS histology, nota pleomorphic histology (Fig. 2C; Supplemental Table 3).By quantitative analysis, the mean florescence intensityof eYFP in primary tumor cell cultures derived fromPax7CreER,Pax3(P3Fm/P3Fa) tumors was rarely abovethe level of C2C12-negative control cells except in rareinstances (Fig. 2D; see the Discussion). On the otherhand, mean fluorescence intensity of eYFP in primary cellcultures derived from a Myf6Cre,Pax3(P3Fa/P3Fa) tumorwas twofold to threefold higher than control C2C12 cells(Fig. 2D). RT–PCR studies also showed higher levels ofPax3:Foxo1 mRNA levels in murine primary tumor cellcultures derived from Myf6Cre,Pax3(P3Fa/P3Fa) tumors(Fig. 2E, green) compared with primary tumor cell cul-tures from Pax7CreER,Pax3(P3Fa/P3Fa) tumors (U31425and U28285) (Fig. 2E). Altogether, these results suggestthat inherently less transcription occurs from the Pax3locus in Pax7CreER-derived tumors and decrease theprobability that aRMS arises from Pax7+ postnatal satel-lite cells.
Tumors arising from non-Pax7CreER cell of originauthentically recapitulate human aRMS
To further evaluate the lineages that might give rise toaRMS, we compared expression of validated markers ofPax:Foxo1+ aRMS and eRMS (Wachtel et al. 2006). Myf6Cremyoblast-derived mouse tumors expressed significantlyhigher levels of the Pax3:Foxo1-specific aRMS markerTcfap2b, whereas Pax7CreER satellite cell-derived tumorsexpressed reciprocally higher levels of the eRMS-specificmarker Fbn2 (Fig. 3A). We then turned to principal compo-nent analysis (PCA) to compare Pax3:Foxo1-bearing tumors
with those in the eRMS–UPS spectrum (Rubin et al. 2011).Results showed that Pax7CreER satellite cell-derived tu-mors were highly similar to eRMS/UPS tumor models thatwe previously reported (Fig. 3B; Rubin et al. 2011). Incontrast, all Pax3:Foxo1-bearing tumors histologically con-sistent with aRMS from the MCre (Pax3), Myf5Cre, andMyf6Cre lineages formed an independent outgroup (Fig. 3B).Thus, the Pax7CreER postnatal satellite cell lineage did notappear to be poised for giving rise to aRMS when thePax3:Foxo1 oncogene at the Pax3 locus is triggered; instead,cells of Pax7CreER satellite cell lineage had a tendency togive a spindle cell-like tumor phenotype. We next hypoth-esized that lineage-specific drug sensitivity could be bestinterrogated by an ontogeny series that would includePax7CreER tumors for which Cre-mediated recombinationor transformation occurred after the satellite cell state.From Figure 3B, we expected an intermediate state to berare, but from the Pax3:Foxo1 data in Figure 2E (i.e.,samples U28285, U31423, and U29416), we expected atleast some instances to exist. To identify a potential ontog-eny series, we first sought to find model primary cellcultures best representing Pax3:Foxo1-harboring satellitecell (Pax7CreER lineage)-derived tumors versus Pax3:Foxo1-harboring myoblast (Myf6Cre lineage)-derived tu-mors. Comparison of gene expression for these two tumortypes is given in Supplemental Table 4. The Pax7CreERlineage was associated with expression of Cav1, Dcn, andCxcl12, whereas the Myf6Cre lineage was associated withexpression of Sct, Stc1, and Ryr3 (Supplemental Table 4).We choose five primary cell cultures—i.e., U29415,U31425, U28285, U31423, and U29416—of Pax7CreERlineage and U20325, U23674, and U21459 of Myf6Crelineage to test the expression of Cav1, Dcn, Cxcl12, Sct,Stc1, and Ryr3 by RT–PCR. These studies showed aninteresting gradient pattern in which the expression ofmarkers associated with Pax7CreER lineage was highestin U29415 cells followed by U31425 or U28285 and lowerexpression in Myf6Cre lineage primary cell culturesU20325, U23674, and U21459. Conversely, the expressionof markers associated with Myf6Cre lineage showed a re-verse gradient pattern where the highest expression wasobserved in U21459/U23674, followed by U29416 orU20325, U31423, U28285, U31425, and U29415 cells(Supplemental Fig. S3A). These results suggested thatU31425, U28285, U31423, and U29416 represent the ‘‘in-termediate’’ myodifferentiation and transformation betweenU29415 (Pax7CreER) and U23674/U21459 (Myf6Cre) (Sup-plemental Fig. S3A). Having this ontogeny series in hand, wesought to test the therapeutic significance of the differencein cell of origin by subjecting the ontogeny series of primarycell cultures to cell cycle-specific inhibitors that we rea-soned from the literature (Jahn et al. 1994; De Falco and DeLuca 2006) may have differential sensitivity to cells ofincreasing myodifferentiation. The four cell cultures didindeed have differential sensitivities to the Cdk-2, Cdk-8,and Cdk-9 inhibitor SNS-032 and the Cdk-4/6 inhibitorPD0332991 (Fig. 3C,D). The primary tumor cell cultureU23674 (Myf6Cre myoblast origin) was found to be themost sensitive to SNS-032 and PD0332991 compared withthe other three primary tumor cell cultures (Pax7CreER
Alveolar rhabdomyosarcoma cell of origin
GENES & DEVELOPMENT 1581
Cold Spring Harbor Laboratory Press on January 30, 2015 - Published by genesdev.cshlp.orgDownloaded from

satellite cell lineage), suggesting that the cell of origin ofthe sarcoma might play a role in deciding the treatmentstrategy for patients. Similar results were observed for theFGFR1–4 inhibitor, LY287445, and Wee1 inhibitor, MK-1775, whereby Myf6Cre lineage-derived U23674 was
found to be the most sensitive to these two drugscompared with intermediate ontogeny cultures U29416and U31423 and Pax7CreER satellite cell lineage-derivedU29415 (Supplemental Fig. S3C,D). Interestingly, whenPax3:Foxo1 was stably knocked down in U23674 cells
Figure 2. Recombination status of Pax3 allele differs by cell of origin. (A) Relative expression of Pax3:Foxo1 in mouse tumor tissue. (B)Genotyping for Pax3:Foxo1 and p53 recombination by cell of origin (Cre driver). Satellite cell-derived (Pax7CreER) primary tumor cellcultures showed reduced efficiency in the recombination of Pax3:Foxo1 knock-in allele locus compared with myoblast-derived primarytumor cell cultures (Myf6Cre). However, p53 locus conditional alleles were uniformly inactivated in all tumors irrespective of Credriver. (C) Representative H&E staining of tumors with Cre driver and Pax3 locus genotypes as noted. All tumors had homozygousconditional p53 deletion. Myf6Cre lineage tumors with heterozygous or homozygous activation of Pax3:Foxo1 showed small round cellhistology consistent with aRMS. In contrast, Pax7CreER tumors with heterozygous or homozygous activation of Pax3:Foxo1 exhibitedpleomorphic spindle cell appearances, similar to tumors with only p53 inactivation—neither of which appearance is consistent withaRMS. (D) Flow cytometry of eYFP for Pax7CreER- and Myf6Cre-derived primary tumor cell cultures. The mean florescence intensitywas lower in Pax7CreER rhabdomyosarcoma cells, although select tumors of the Pax7CreER lineage (e.g., U31423 and U29416) moreresembled Myf6Cre in eYFP expression (see the Results). (E) Quantitative RT–PCR (qRT–PCR) studies showing higher levels ofPax3:Foxo1 mRNA levels in Myf6Cre-derived primary tumor cell cultures (U23674 and U57844) compared with Pax7CreER-derivedprimary tumor cell cultures (U29415, U31425, and U31423). Statistically significant difference in Pax3:Foxo1 expression was observedbetween Myf6Cre- and Pax7CreER-derived primary tumor cell cultures with one activated Pax3:Foxo1(P3Fa) allele (U57844 andU29415) versus primary tumor cultures with two activated Pax3:Foxo1 alleles (U23674 and U31425).
Abraham et al.
1582 GENES & DEVELOPMENT
Cold Spring Harbor Laboratory Press on January 30, 2015 - Published by genesdev.cshlp.orgDownloaded from

(U23674 ShY08), there was no difference in their sensi-tivity to either SNS-032 (Fig. 3E) or PD0332991 (Fig. 3F)compared with the control cells (U23674 ShC01), furthersupporting that differential drug sensitivity was due to lineageof origin (i.e., epigenetic memory) and not Pax3:Foxo1expression level.
The Pax7 and Pax3:Foxo1 loci are epigeneticallyregulated (differential effects of epigenetic modifierson Pax3:Foxo1 and Pax7 expression dependingon the tumor cell of origin)
We next reasoned that if tumor initiation and tumorphenotype is epigenetically determined, then the tumor
phenotype can be epigenetically modified by pharmaco-logical agents. The Pax7 locus in activated satellite cellshas a bivalent chromatin domain with the presence ofboth positive (H3K4me3) and negative (H3K27me3) his-tone marks (Mozzetta et al. 2011), and we hypothesizedthat the Pax3 locus may be similar. To gain insight intothe epigenetic regulation of the Pax3:Foxo1 locus, weexamined active (H3K4me3 and H3K9Ac) and repressive(H3K27me3 and H3K9me3) histone modification marksby chromatin immunoprecipitation (ChIP) in tumor cellsrepresenting both Pax7CreER (U29415 and U31425) andMyf6Cre (U23674 and U21459) lineages of origin. For thisstudy, we analyzed two genomic regions upstream (�193:�285) of and downstream (+593: +462) from the transcrip-
Figure 3. Pax3:Foxo1 and aRMS-specific markerexpression in Pax3:Foxo1 tumors. (A) For tumorsbearing conditional Pax3:Foxo1 alleles, expression ofaRMS-specific classifier Tcfap2b was significantlyincreased in Myf6Cre-derived tumors (M6-P3F-p53)and comparatively lower in Pax7CreER-derived tu-mors (P7er-P3F-p53); conversely, expression of eRMS-specific marker Fibrillin2 (Fbn2) was increased inPax7CreER-derived, Pax3:Foxo1-bearing tumors andcomparable with the level of Fbn2 from eRMS de-rived from satellite cells (P7er-Ptch1-p53) or myo-blasts (M6-p53). (B) PCA showing the non-satellitecell-derived, Pax3:Foxo1-bearing tumors as an out-group and Pax7CreER-derived, Pax3:Foxo1-bearingtumors grouping with spindle cell sarcoma/eRMStumors bearing Ptch1 and p53 mutations. (C,D) Cellviability assay showing differential drug response ofprimary tumor cell cultures along the continuum ofsatellite cell-derived (Pax7CreER) origin versus myo-blast-derived (Myf6Cre). (C) For the Cdk-2, Cdk-7,and Cdk-9 inhibitor SNS-032, the IC50 values were0.24 mM for U23674, 0.83 mM for U29415, 1.79 mMfor U31423, and 2.61 mM for U29415. (D) For theCdk-4,-6 inhibitor PD0332991, the IC50 values were2.69 mM for U23674, 3.61 mM for U29415, 4.77 mM forU31423, and 8.15 mM for U29415. (E,F) Cell viabilityassay showing no difference in the response ofU23674 ShY08 cells (Pax3:Foxo1 stable knockdowncells) to SNS-032 (E) and PD0332991 (F) comparedwith the control knockdown cells, U23674 ShC01.For SNS-032, the IC50 values were 0.1305 mM forShC01 cells and 0.1730 mM for ShY08 cells. In thecase of PD0332991, the IC50 values were 6.90 mM forShC01 cells and 6.88 mM for ShY08 cells. (s.c.)Satellite cell origin; (m.b.) myoblast origin.
Alveolar rhabdomyosarcoma cell of origin
GENES & DEVELOPMENT 1583
Cold Spring Harbor Laboratory Press on January 30, 2015 - Published by genesdev.cshlp.orgDownloaded from

tional start site (TSS) of the Pax3 locus. At the level ofhistone marks, we observed a different chromatin state ofthe Pax3:Foxo1 locus in primary tumor cell cultures withdifferent lineages of origin. As shown in SupplementalFigure S4, higher levels of both H3K4me3 and H3K9Acactive chromatin marks are observed in U23674 andU21459 cells compared with U29415 and U31425 tumorcells, correlating with high versus low Pax3:Foxo1 ex-pression, respectively. Also high levels of repressivehistone marks H3K27me3 and H3K9me3 were observedin U29415 and U31425 cells compared with U23674 andU21459 cells. Altogether, these data suggest that theobserved differences in Pax3:Foxo1 mRNA levels couldbe explained by a different chromatin state in these locidepending on the tumor lineage of origin. From the RT–PCR studies described above, U29415 was selected asa representative Pax7CreER lineage tumor culture, andU23674 was selected as a representative Myf6Cre lineagetumor culture.
To determine whether the Pax locus could be pharma-cologically modified, we first treated murine primarytumor cell cultures U23674 and U29415 with varyingdoses of 5-Aza 29deoxycytidine (DNA methyltransferaseinhibitor) or SAHA and entinostat (histone deacetylase[HDAC] inhibitors) to determine a sublethal dose atwhich cells could be treated to study the effects of thesedrugs on expression of Pax3:Foxo1 and Pax7 (Supplemen-tal Fig. S5). Cells were treated with drugs for 72 h, afterwhich an MTS assay was performed to assess viability.Based on these studies, U23674 cells were treated with3 mM 5-Aza-29deoxycytidine, 2 mM entinostat, or 0.75 mMSAHA for 24 h, after which RNA was extracted, and theexpression of Pax3:Foxo1 and Pax7 was examined by RT–PCR. For U23674 tumor cells of the Myf6Cre myoblastlineage, a decrease in both Pax7 and Pax3:Foxo1 mRNAlevels upon treatment with all of the drugs was observed,but the effect was more pronounced for HDAC inhibitors(Fig. 4A). Interestingly, U29415 tumor cells of Pax7CreERsatellite cell lineage showed a paradoxical increase inmRNA levels of Pax7 and Pax3:Foxo1 when treated with20 mM 5-Aza-29deoxycytidine, 15 mM entinostat, and5 mM SAHA (Fig. 4A). As expected, the rare tumor cul-tures downstream from U29415 behaved similarly tothe Myf6Cre tumor cultures (Supplemental Fig. S6). Wenext determined epigenetic marks of Pax3:Foxo1 by per-forming ChIP and examining the active histone marksH3K4me3 and H3K9Ac along with the repressive marksH3K27me3 and H3K9me3 previously examined in Sup-plemental Figure S4. However, examination of thesespecific chromatin marks did not explain the change inPax3:Foxo1 transcript levels, implying that other re-gions may be the targets of chromatin remodeling forentinostat.
Previous studies in mdx mice treated with a TNF-aantibody reported increased levels of Pax7 mRNA insatellite cells derived from myofibers (Palacios et al.2010). TNF-a has been shown to activate p38a kinase,which leads to interaction between YY1 and PRC2(polycomb-repressive complex 2) via threonine phosphor-ylation of EZH2. These proteins together form a repres-
sive complex at the Pax7 promoter and thus regulate theexpression of Pax7 (Palacios et al. 2010). To investigatewhether TNF-a can regulate the expression of Pax7 inU23674 and U29415 tumor cells, cultures were treatedwith 10 ng/mL recombinant TNF-a for 24 h. RT–PCR datashowed a reduction in mRNA levels of Pax7 in bothU23674 and U29415 cells. TNF-a also reduced Pax3:Foxo1levels in both cell cultures (Fig. 4A). We next examinedthe levels of Pax3:Foxo1 at the protein level. By immu-noblotting, concomitant reduction in Pax3:Foxo1 levelsin U23674 cells treated with 2 mM entinostat for 24 h wasobserved (Fig. 4B). This effect was seen across species forhuman aRMS cell lines Rh30 (24 h of treatment) andRh41 (24 h of treatment) (Fig. 4C,D). When murine andhuman tumor cultures were treated with 2 mM entinostatfor 72 h, a pronounced reduction in Pax3:Foxo1 proteinlevels was observed (Fig. 4E,F). These results showed inprinciple that Pax3:Foxo1 and Pax7 transcription andprotein levels can be modified pharmacologically. Toinvestigate whether the reduction in Pax3:Foxo1 proteinlevels upon entinostat treatment is mediated by changesin post-translational stability attributable to direct HDAC–Pax3:Foxo1 interactions, we treated human and murineaRMS cultures (Rh41 for 24 h and U23674 for 72 h) with 2mM entinostat alone or in combination with MG132(proteasome inhibitor). No increase in Pax3:Foxo1 pro-tein level was observed when cells were treated witha combination of entinostat and MG132 compared withcells treated with entinostat alone (Fig. 4G,H). Thisresult suggests that the reduction in Pax3:Foxo1 levelsobserved upon entinostat treatment is mediated at thetranscriptional (or post-transcriptional) level and not atthe post-translational level. Other studies from ourlaboratory have shown that expression of Pax3:Foxo1is G2 cell cycle phase-dependent (Kikuchi et al. 2014).To investigate whether the reduction in Pax3:Foxo1expression caused by entinostat treatment is cell cy-cle-dependent, we performed a series of studies suggest-ing that this was not necessarily the case (SupplementalFig. S7).
Entinostat slows tumor growth in vivo
We next tested the anti-tumor efficacy of entinostat in anorthotopic allograft model of rhabdomyosarcoma gener-ated by injecting U23674 cells into the cardiotoxin-preinjured gastrocnemius muscle in the right leg ofSCID-hairless (SHO-Prkdcscid Hrhr) mice. Once the tu-mors reached 0.25 cm3, the mice were treated with a dailydose of 10 mg/kg entinostat by intraperitoneal injection,with 0.25 mg/kg actinomycin D by intraperitoneal in-jection on day 1 of treatment, a combination of entinostatand actinomycin D, or vehicle (DMSO) (Fig. 5A,B).Actinomycin D is one of the commonly used chemother-apeutic agents for treating rhabdomyosarcoma. The tu-mors in the entinostat cohort grew significantly slowerthan either vehicle- or actinomycin D-treated mice (P =0.03). Mice treated with a combination of entinostat andactinomycin D had a significantly slower rate of tumorgrowth, and their tumors took more time to reach 1 cm3
Abraham et al.
1584 GENES & DEVELOPMENT
Cold Spring Harbor Laboratory Press on January 30, 2015 - Published by genesdev.cshlp.orgDownloaded from

Figure 4. Pharmacologically modified epigenetic regulation of Pax3:Foxo1. (A) RT–PCR assays showing relative expression ofPax3:Foxo1 and Pax7 in representative satellite cell-derived U29415 and myoblast-derived U23674 murine primary tumor cell culturesupon treatment with DMSO, 5-Aza-29deoxycytidine (Aza), SAHA, entinostat (Ent), serum-free medium (SFM), and the cytokine TNF-a(10 ng/mL in serum-free medium) for 24 h. The U29415 primary tumor cell culture (satellite cell origin) showed an increase in Pax7 andPax3:Foxo1 expression upon treatment with 5-Aza-29deoxycytidine, SAHA, and entinostat for 24 h, whereas the U23674 primarytumor cell culture (myoblast origin) showed a decrease in the mRNA levels of Pax7 and Pax3:Foxo1 upon treatment. However,treatment with TNF-a showed a reduction in the expression of Pax7 and Pax3:Foxo1 in both U29415 and U23674 cells. (B) Immunoblotshowing reduction in Pax3:Foxo1 levels upon treatment with 2 mM entinostat (Ent) and also with 3 mM 5-Aza-29deoxycytidine (Aza) for24 h in U23674 cells. (C) Reduction in Pax3:Foxo1 level upon treatment with 2 mM entinostat (Ent) for 24 h in Rh30 cells. (D) Westernblot showing reduction in Pax3:Foxo1 levels upon treatment with 2 mM entinostat (Ent) for 24 h in Rh41 cells. (E) Immunoblot showingsignificant reduction in Pax3:Foxo1 levels upon treatment with 2 mM entinostat (Ent) for 72 h in U23674 cells (left panel) and thegraphical representation (right panel). (F) Immunoblot showing a significant reduction in Pax3:Foxo1 level upon treatment with 2 mMentinostat (Ent) for 72 h in Rh30 cells (left panel) and the graphical representation for this blot (right panel). (G) Western blots showingno increase in Pax3:Foxo1 levels in Rh41 cells when they were treated with a combination of the proteasome inhibitor MG132 (0.1 mM,0.5 mM, and 1 mM) and 2 mM entinostat for 24 h compared with cells treated with entinostat alone. Expression of Noxa was observedwhen cells were treated with a combination of MG132 and entinostat in Rh41 cells. (H) Western blot showing no increase inPax3:Foxo1 levels in U23674 cells even when these cells were treated with a combination of 200 nM MG132 and 2 mM entinostat for 72 hcompared with cells treated with 2 mM entinostat alone. Noxa could not be detected even after treating the cells with a combination ofMG132 and entinostat for 72 h.
Alveolar rhabdomyosarcoma cell of origin
GENES & DEVELOPMENT 1585
Cold Spring Harbor Laboratory Press on January 30, 2015 - Published by genesdev.cshlp.orgDownloaded from

in size compared with vehicle-treated or actinomycinD alone-treated mice (P < 0.001) (Fig. 5 A,B). However,after 5 d of treatment with entinostat, the mice showedsymptoms of drug toxicity (>10% loss of body weight),and hence no treatment was administered on day 6, andthe subsequent daily dose of entinostat was reduced to5 mg/kg.
Discussion
In our studies, we sought to refine experimentally therange of possibilities for the cell of origin of Pax3:Foxo1+
rhabdomyosarcoma. Parenthetically, however, the cell oforigin for Pax7:Foxo1+ aRMS is in no way addressed inthis study. Surprisingly, in our experiments, the fetalmyoblast (Myf6 lineage) appears most susceptible toformation of metastatic aRMS. In contrast, muscle stemcells (satellite cells) appear least poised to give rise torhabdomyosarcoma—at least from adolescence onward.With regard to tumor initiation, our data suggest that thePax3 chromatin structure may be closed (and relativelyinaccessible to events like Cre/LoxP DNA recombina-tion) and show that transcription from the Pax3 locus isinactive in tumor cells of this satellite cell lineage.However, this low transcriptional activity could be re-versed by pharmacological epigenetic modifiers. Evenmore importantly, Pax3:Foxo1 can be reduced at themRNA and protein level in myoblast-derived tumors bythe same pharmacological epigenetic modifiers. Theimplication that cell of origin can influence pharmaco-logical response is interesting, if not provocative. Weconcede, however, that common drug sensitivities arelikely also found between tumors of different origins andthat while some cell biological properties that may betransmitted from the cell of origin, as many or more may
be the result of convergent, facultative phenotypes fortumor cell growth—even if rhabdomyosarcomas arisefrom different cell lineages.
What is remarkable is that a prenatal (Myf6Cre) lineageof origin should, in our comparison, be most capable offorming aRMS (at least in the context of p53 loss offunction). Rhabdomyosarcoma is a disease that has asteady incidence throughout childhood (aRMS contrastsdramatically with eRMS, the latter of which peaks withtoddler and adolescent growth spurts) (Ognjanovic et al.2009). Suggestion of Myf6+ prenatal or postnatal myo-genic cells, possibly a terminally differentiating subpop-ulation, as an aRMS cell of origin was first reported by ourgroup (Keller et al. 2004a,b) and later complemented by invitro studies of human postnatal myoblasts transformedby PAX3:FOXO1 and other cooperative initiating muta-tions (Naini et al. 2008). Congenital fusion-positive aRMSis rarely reported, and congenital aRMS is generallyfusion-negative (Godambe and Rawal 2000; Grundy et al.2001; Sueters et al. 2005), although the PAX3:FOXO1translocation has been detected in rare neonatal instances(Rodriguez-Galindo et al. 2001). What might account forthe delay? One explanation might be an accumulation ofother genetic changes (mutations), but epigenetic changesduring childhood and adolescent growth and developmentmight also have a role to play. In fact, epigenetic abnor-malities are very common in human cancers—and, incontrast to genetic mutations, these epigenetic changesare potentially reversible.
Can cells other than those of skeletal muscle lineagesgive rise to aRMS? We are increasingly intrigued by thispossibility, although the question needs to be addressedwith prudence. A mesenchymal stem cell origin foraRMS has been suggested (Charytonowicz et al. 2009;Hettmer and Wagers 2010). In support of this possibility,
Figure 5. Anti-tumor activity of entinostat in an orthotopic allograft mouse mouse model of rhabdomyosarcoma. (A) Tumor-bearingmice were treated with entinostat (dotted black line; n = 9; 10 mg/kg daily by intraperitoneal route), actinomycin D (black line; n = 8;0.25 mg/kg on day 1 of treatment by intraperitoneal route), entinostat + actinomycin D (gray line; n = 8), and DMSO (dotted gray line;n = 7). The graphs shows mean tumor size 6 SE by treatment and time. Tumor size increased monotonically with time after treatmentwith actinomycin D, DMSO, and entinostat and exhibited a downward trend after day 8 for the treatment group with actinomycin D +
entinostat. The black arrows indicate the days on which entinostat- or entinostat + actinomycin D-treated mice were sacrificed for10%–15% body weight loss. (B) Kaplan-Meier survival curves for tumor-bearing mice treated with entinostat daily, actinomycin D onday 1, entinostat + actinomycin D, and vehicle (DMSO), with endpoint measurement being the number of days taken for the tumor toreach 1 cm3 in size. A null hypothesis that the treatment-specific survival curves are equal was tested using a log-rank test andconcluded that the four curves are significantly different (P < 0.001).
Abraham et al.
1586 GENES & DEVELOPMENT
Cold Spring Harbor Laboratory Press on January 30, 2015 - Published by genesdev.cshlp.orgDownloaded from

clinical cases of metastatic tumors without primarytumors have been reported for t(1;13) PAX7:FOXO1aRMS (Lisboa et al. 2008) and t(2;13) PAX3:FOXO1 aRMS(Sandberg et al. 2001; Lisboa et al. 2008). An experimentalstudy by Ren et al. (2008) tested the possibility thatconstitutively expressed (ectopic) Pax3:Foxo1 could cre-ate aRMS, but this study did not place Pax3:Foxo1 underthe authentic control of the Pax3 promoter, which, inlight of our studies of a very small (0.4%) bone marrowcompartment cell population that had ever expressedPax3, makes the probability of aRMS arising from mes-enchymal stem cells very low. However, a nonmarrowmesenchymal stem cell of origin remains possible.
An interesting alternative cell of origin for aRMS is thepericyte or mesangioblast. Vascular mimicry in rhabdo-myosarcoma suggests a plasticity that may (or may not)have carried over from an angioblast origin (Sun et al.2004). An interesting case of primary rhabdomyosarcomaof the pulmonary artery was also recently reported(Suman et al. 2013). Experimentally, Lagha et al. (2009)reported that in the mouse embryonic dermamyotome,the ratio of Pax3 to Foxc2 balances fate between myo-genic and vascular cell fates but that Pax3:Foxo1 sup-presses Foxc2. This latter result suggests that, in thesusceptible cell, an angiogenic precursor might be con-verted to a myogenic state, a result that has been shownexperimentally for embryonic aortic mesangioblasts(Messina et al. 2009). The link between vascular pre-cursors and the Pax3 lineage does not come as a surprisegiven the known role of Pax3 in the migration of cardiacneural crest during embryogenesis (Conway et al. 1997).In a provocative study, Goupille et al. (2011) have shownthat smooth muscle cells of arteries express Pax3 and areable to contribute to skeletal muscle fiber formation viain vitro coculture conditions and following cell–cellfusion. This plasticity lends itself to the possibility thatmesangioblasts or even smooth muscle cells can trans-form into myogenic phenotype cancers (rhabdomyosar-comas) under select conditions.
Our results raise a potentially important clinical im-plication by suggesting that PAX3:FOXO1 levels vary bycell of origin, even adjusting for recombination frequency;thus, PAX3:FOXO1 RT–PCR alone may be less sensitivethan cytogenetics or FISH to detect the PAX3:FOXO1rearrangements. Could some MFH or UPS cases be in facta spindle cell variant of aRMS, arising from satellite cells?Pathologists might consider addressing this possibility incases of pediatric and adolescent undifferentiated sarco-mas and consider FISH for PAX3:FOXO1 in atypicalcases.
Translationally, our data suggest a mechanism bywhich fusion-positive aRMS might be epigeneticallyreprogrammed into fusion-negative RMS using the adultphase II HDAC inhibitor entinostat. Transcription factorswere once considered undruggable, but our approachcomplements other experimental demonstrations forEWS:FLI1 in pediatric Ewing’s sarcoma (Barber-Rotenberget al. 2012) and MLL-associated pediatric leukemias(Chen et al. 2013). While additional preclinical studiesremain to be done, it is exciting to consider that entinostat
might reduce PAX3:FOXO1 levels sufficiently to convertfusion-positive RMS with a poor prognosis to a biolog-ical state akin to fusion-negative RMS, which portendsa significantly better prognosis even when metastatic(Sorensen et al. 2002; Missiaglia et al. 2012).
Materials and methods
Microarray analysis for S scores and PCA
Human microarray data sets were previously published (Wachtelet al. 2004; Lae et al. 2007; Davicioni et al. 2009). Patientdemographics are presented in Supplemental Table 1, A andB. Metagene and S-score analyses were conducted as previouslydescribed (Rubin et al. 2011). For mouse tumors, gene expressionanalysis was performed using Illumina’s Mouse Ref 8 Beadchipversion 1 (Illumina, Inc.). These data sets have been deposited inGene Expression Omnibus as accession entry GSE22520 and arealso described in Supplemental Table 1C. Rank invariant nor-malization was performed on the log2 transformed expressionvalue. Afterward, we applied PCA to all mouse tissue sampleswith the 19,070 probes (selected with the criterion of averagelog2 intensity >5.5 and standard deviation >0.1) and then plottedin three-dimensional space for visualization (Fig. 4B). Similarmicroarray data analysis and the PCA methods were previouslydescribed (Rubin et al. 2011). All bioinformatics tasks wereperformed with MATLAB/Bioinformatics Toolbox (MathWorks,Inc.) unless otherwise noted.
We downloaded the public domain data sets for fusion-negative RMS reported by Davicioni et al. (2006) from https://array.nci.nih.gov/caarray/project/details.actionproject.experiment.publicIdentifier=trich-00099 as well as aRMS rhabdomyosar-coma data sets from previously published reports (Wachtelet al. 2004; Lae et al. 2007). These fusion-negative RMS andaRMS data sets were designated as the test samples, whereasnormal skeletal muscle samples reported by Bakay et al. (2002)were used as the control group. We also downloaded signature-specific data sets as described below. All of the studies wereperformed on an Affymetrix U133A array platform (Affymetrix).Sample IDs used are given in Supplemental Tables 1 and 2.Control samples of each examination are the eRMS samplesderived from Rubin et al. (2011). We selected 10 high positive, 10low positive, and 10 negative control samples for each examina-tion, whereas gene-wise t-tests were performed between the 20positive controls and normal skeletal muscle in order to apply toS score. S score is a subtype scoring method to quantify eachsample’s consistency. By using the S score, we can unambigu-ously identify sample status and the amplitude of pathways orbiological processes that gene signatures have depicted. Thedetailed S-score method has been previously described (Rubinet al. 2011).
We used previously established gene lists (Rubin et al. 2011) toexamine whether human fusion-negative RMS and aRMS tu-mors had evidence of p53 loss of function, Shh gain of function,pRb loss of function, or Ras activation. Gene signatures of p53loss of function were derived from gene expression data sets inbreast cancer (Miller et al. 2005). We also downloaded data setsfor medulloblastoma samples known to exhibit a Shh gain-of-function signature (Thompson et al. 2006). We took homologgenes from Rb1 wild-type and homozygous Rb1-deleted fusion-negative mouse sarcomas to be pRb loss-of-function gene signa-ture (Rubin et al. 2011). For Ras activation, we used gene lists forthe activated Ras signature of zebrafish eRMS (Langenau et al.2007). The details of obtaining gene signature of each case havebeen previously described (Rubin et al. 2011).
Alveolar rhabdomyosarcoma cell of origin
GENES & DEVELOPMENT 1587
Cold Spring Harbor Laboratory Press on January 30, 2015 - Published by genesdev.cshlp.orgDownloaded from

Mice
All animal procedures were conducted in accordance with theGuidelines for the Care and Use of Laboratory Animals and wereapproved by the Institutional Animal Care and Use Committee(IACUC) at the University of Texas Health Science Center at SanAntonio or Oregon Health and Science University. The Myf6Cre,Myf5Cre, Pax7Cre, MCre, Pax7CreER, Pax3:Foxo1, LUSEAP,LacZ reporter (Rosa26tm1Sor), Pax3-Cre (Pax3CreKI), and condi-tional p53 mouse lines and corresponding genotyping protocolshave been described previously (Soriano 1999; Marino et al. 2000;Jonkers et al. 2001; Keller et al. 2004a; Brown et al. 2005; Nishijoet al. 2009a,b). Myf5CreER have been reported (Biressi et al.2013), and Myf6CreER mice will be reported in detail elsewherebut are also described in Supplemental Figure S2. For Pax7CreER,Myf5CreER, and Myf6CreER mice, tamoxifen was administeredat P30 as previously reported (Keller et al. 2004a). Tumor-pronemice were visually inspected every 2 d for tumors because of thefulminant onset in these models. Genotyping protocols forPax3:Foxo1 and p53 were performed as described (Keller et al.2004a).
Mouse primary tumor cell cultures
Mouse primary tumor cell cultures were generated from mousetumors as described previously (Abraham et al. 2011).
Survival analysis and statistical methods
Kaplan-Meier survival analysis of the mice was performed withthe endpoint being the development of tumors (i.e., disease-freesurvival). Survival plots were created using the survival packagein R. Relative expression of Pax3:Foxo1 values were comparedusing the Mann-Whitney test (Fig. 2A). The log-rank test (Fig.3A) was used to determine the statistical significance (P < 0.05)using Systat12 software (Systat Software, Inc.). The expression ofPax7 and Pax3:Foxo1 compared with corresponding referencegroups was done using the Mann-Whitney test with the Hochbergcorrection for multiple testing (Fig. 4A). Statistical analyses wereperformed using R 3.0.1 (The R Foundation for Statistical Com-puting, http://www.r-project.org).
RNA isolation and quantitative RT–PCR (qRT–PCR)
RNA isolation and RT–PCR from mouse tumors were performedas previously described (Nishijo et al. 2009a; Rubin et al. 2011).Probe sets for mouse samples were Gapdh-Mm99999915_g1,Fbn2_Mm00515742_m1, and Tcfap2b_Mm00493468_m1. Sta-tistical analysis was performed by Kruskal-Wallis test withTukey’s multiple testing correction. For drug treatment studies,the myoblast-derived primary tumor cell culture U23674 wastreated with either 750 nM SAHA, 3 mM 5-Aza-29deoxycytidine,or 2 mM entinostat, and the satellite cell-derived primary tumorcell culture U29415 was treated with either 5 mM SAHA, 20 mM5-Aza-29deoxycytidine, or 15 mM entinostat for 24 h. After drugtreatment, total RNA was isolated, and cDNA was synthesizedas described above. The expression of Pax3:Foxo1 and Pax7 wasdetermined by qRT–PCR using TaqMan primers and probes(mouse Pax7-Mm00834032_m1) on a StepOnePlus real-timePCR system from Applied Biosystems.
Histology, immunohistochemistry, and immunochemistry
For MyoD, Myogenin, and Desmin immunohistochemistry,staining was performed as previously described (Rubin et al.2011). Immunofluorescence for GFP has also been described
previously (Nishijo et al. 2009a). For immunocytochemistry,murine rhabdomyosarcoma primary tumor cell cultures (U23674)and human rhabdomyosarcoma cell lines (Rh41) were culturedin an eight-well CultureSlide (BD Falcon). The cells were washedwith PBS, fixed with 4% paraformaldehyde, permeabilized with0.25% Triton X-100, and incubated with the antibody overnightat 4°C. The primary antibodies used were mouse anti-Pax3 (R&DSystems), rabbit anti-phospho CDC2-Y15, and rabbit anti-phospho Histone H3 (Cell signaling Technology). After incu-bation, the cells were washed with PBS and incubated withfluorescein isothiocyanate-conjugated anti-mouse and anti-rabbitIgG (Invitrogen) for 1 h. The cells were then examined by usinga Zeiss LSM700 confocal microscope and Zen 2010 imagingsoftware (Carl Zeiss).
Flow cytometry and cell cycle analysis
eYFP expression in mouse rhabdomyosarcoma cells and bonemarrow aspirates was assessed by flow cytometry. Cells werestained with propidium iodide at 20 mg/mL for dead cellelimination, followed by analysis on a FACScan cytometer(Becton Dickinson). For cell cycle analysis, primary mousetumor cell cultures were harvested, washed with PBS, and fixedin cold 70% ethanol for 20 min. After fixation, the cells werewashed with PBS and then incubated with RNase A and 20 mg/mLpropidium iodide. The cells were then analyzed by using anInflux flow cytometer (Becton Dickinson) and FlowJo software(Tree star, Inc.).
Western blotting
Procedures have been described previously (Abraham et al.2011). The following primary antibodies were used: goat anti-FKHR (catalog no. sc-9808, Santa Cruz Biotechnology) to de-tect Pax3:Foxo1 and mouse anti-Noxa (catalog no. ab13654,Abcam).
Drug sensitivity assays
Murine rhabdomyosarcoma primary tumor cell cultures wereplated in a 96-well plate at 2500 per well. After 24 h, the cells wereincubated with varying concentrations of entinostat (Selleckchem),SAHA (LC Laboratories), and 5-Aza-29deoxycytidine (Sigma-Aldrich) for 3 d. The cytotoxic effect of the drugs was thenassessed by using CellTiter 96 AQueous One cell proliferationassay (MTS) and a BioTek Synergy 2 plate reader (BioTek).
Stable knockdown of Pax3:Foxo1
Murine primary tumor cell cultures with stable knockdown ofPax3:Foxo1 were generated as described earlier (Kikuchi et al.2014).
In vivo studies with entinostat
Orthotopic allograft mouse models of rhabdomyosarcoma weregenerated as described earlier (Aslam et al. 2014). Once thetumors reached 0.25 cm3, the mice were treated with eitherentinostat (LC Laboratories) at a daily dose of 10 mg/kg byintraperitoneal injection, actinomycin D (Sigma-Aldrich) at 0.25mg/kg on day 1 by intraperitoneal injection, a combination ofentinostat and actinomycin D, or vehicle (DMSO). Once thetumors reached 1.5 cm3 or the mice became sick (10%–15% lossof body weight) due to drug toxicity, the mice were euthanized.After 5 d of treatment with entinostat, the mice showed signs ofdrug toxicity (loss of body weight), so the treatment was halted
Abraham et al.
1588 GENES & DEVELOPMENT
Cold Spring Harbor Laboratory Press on January 30, 2015 - Published by genesdev.cshlp.orgDownloaded from

for a day and then continued with 5 mg/kg daily dose (half theinitial dose). All of the drug studies in mice were performed afterreceiving approval from the IACUC at Oregon Health andScience University.
Statistical analysis for in vivo studies with entinostat
A repeated measures linear mixed effects model with a com-pound symmetric autocorrelation assumption to contrast treat-ments pairwise on day 7 with regard to tumor size was used. Day7 was chosen for analysis because this was the last day withnearly complete data (actinomycin D, n = 7; actinomycin D +
entinostat, n = 8; DMSO, n = 7; entinostat, n = 9). The tumor sizedata were log transformed prior to analysis and corrected the P-values for multiple comparisons using the Tukey method.
Acknowledgments
We thank Rishi Rikhi and Noah Berlow for assistance with dataanalysis. This work was sponsored by training awards to K.N. andJ.A. from the Scott Carter Foundation; support from Ministerio deCiencia e Innovacion (MICINN) (SAF2009-08128/SAF2012-37427)to M.S.; and National Cancer Institute awards 5R01CA133229 toC.K., 1R01CA154923 to D.M.L., and R01 AR062185 to T.A.R.Y.N.-A. is a FPU fellow (Ministerio de Educacion, Cultura yDeporte), E.C. is a FPI fellow (MICINN), and A.T.M. wassupported by National Institute of General Medical Sciences(NIGMS) MARC-U*STAR GM 07717 and NIGMS MBRS-RISEGM 60655. The Developmental Studies Hybridoma Bank wasdeveloped under the auspices of the Eunice Kennedy ShriverNational Institute of Child Health (NICHD) and is maintainedby the University of Iowa, Iowa City, IA.
References
Abraham J, Prajapati SI, Nishijo K, Schaffer BS, Taniguchi E,Kilcoyne A, McCleish AT, Nelon LD, Giles FG, EfstratiadisA, et al. 2011. Evasion mechanisms to Igf1r inhibition inrhabdomyosarcoma. Mol Cancer Ther 10: 697–707.
Arndt CA, Crist WM. 1999. Common musculoskeletal tumorsof childhood and adolescence. N Engl J Med 341: 342–352.
Aslam MI, Abraham J, Mansoor A, Druker BJ, Tyner JW, Keller C.2014. PDGFRb reverses EphB4 signaling in alveolar rhabdo-myosarcoma. Proc Natl Acad Sci 111: 6383–6388.
Bakay M, Chen YW, Borup R, Zhao P, Nagaraju K, Hoffman EP.2002. Sources of variability and effect of experimentalapproach on expression profiling data interpretation. BMC
Bioinformatics 3: 4.Barber-Rotenberg JS, Selvanathan SP, Kong Y, Erkizan HV,
Snyder TM, Hong SP, Kobs CL, South NL, Summer S,Monroe PJ, et al. 2012. Single enantiomer of YK-4-279 dem-onstrates specificity in targeting the oncogene EWS-FLI1.Oncotarget 3: 172–182.
Biressi S, Bjornson CR, Carlig PM, Nishijo K, Keller C, Rando TA.2013. Myf5 expression during fetal myogenesis defines thedevelopmental progenitors of adult satellite cells. Dev Biol379: 195–207.
Blum JM, Ano L, Li Z, Van Mater D, Bennett BD, Sachdeva M,Lagutina I, Zhang M, Mito JK, Dodd LG, et al. 2013. Distinctand overlapping sarcoma subtypes initiated from musclestem and progenitor cells. Cell Reports 5: 933–940.
Brown CB, Engleka KA, Wenning J, Min Lu M, Epstein JA.2005. Identification of a hypaxial somite enhancer elementregulating Pax3 expression in migrating myoblasts and
characterization of hypaxial muscle Cre transgenic mice.Genesis 41: 202–209.
Charytonowicz E, Cordon-Cardo C, Matushansky I, Ziman M.2009. Alveolar rhabdomyosarcoma: is the cell of origina mesenchymal stem cell? Cancer Lett 279: 126–136.
Chen L, Deshpande AJ, Banka D, Bernt KM, Dias S, Buske C,Olhava EJ, Daigle SR, Richon VM, Pollock RM et al. 2013.Abrogation of MLL-AF10 and CALM-AF10-mediated trans-formation through genetic inactivation or pharmacologicalinhibition of the H3K79 methyltransferase Dot1l. Leukemia
27: 813–822.Conway SJ, Henderson DJ, Copp AJ. 1997. Pax3 is required for
cardiac neural crest migration in the mouse: evidence fromthe splotch (Sp2H) mutant. Development 124: 505–514.
Davicioni E, Finckenstein FG, Shahbazian V, Buckley JD, TricheTJ, Anderson MJ. 2006. Identification of a PAX–FKHR geneexpression signature that defines molecular classes and de-termines the prognosis of alveolar rhabdomyosarcomas.Cancer Res 66: 6936–6946.
Davicioni E, Anderson MJ, Finckenstein FG, Lynch JC, QualmanSJ, Shimada H, Schofield DE, Buckley JD, Meyer WH, SorensenPH, et al. 2009. Molecular classification of rhabdomyosarcoma–genotypic and phenotypic determinants of diagnosis: a reportfrom the Children’s Oncology Group. Am J Pathol 174: 550–564.
De Falco M, De Luca A. 2006. Involvement of cdks and cyclinsin muscle differentiation. Eur J Histochem 50: 19–23.
Engleka KA, Gitler AD, Zhang M, Zhou DD, High FA, EpsteinJA. 2005. Insertion of Cre into the Pax3 locus creates a newallele of Splotch and identifies unexpected Pax3 derivatives.Dev Biol 280: 396–406.
Godambe SV, Rawal J. 2000. Blueberry muffin rash as a pre-sentation of alveolar cell rhabdomyosarcoma in a neonate.Acta Paediatr 89: 115–117.
Goupille O, Pallafacchina G, Relaix F, Conway SJ, Cumano A,Robert B, Montarras D, Buckingham M. 2011. Characteriza-tion of Pax3-expressing cells from adult blood vessels. J Cell
Sci 124: 3980–3988.Grundy R, Anderson J, Gaze M, Gerrard M, Glaser A, Gordon A,
Malone M, Pritchard-Jones K, Michalski A. 2001. Congenitalalveolar rhabdomyosarcoma: clinical and molecular distinc-tion from alveolar rhabdomyosarcoma in older children.Cancer 91: 606–612.
Hatley ME, Tang W, Garcia MR, Finkelstein D, Millay DP, Liu N,Graff J, Galindo RL, Olson EN. 2012. A mouse model ofrhabdomyosarcoma originating from the adipocyte lineage.Cancer Cell 22: 536–546.
Hawkins DS, Spunt SL, Skapek SX. 2013. Children’s OncologyGroup’s 2013 blueprint for research: soft tissue sarcomas.Pediatr Blood Cancer 60: 1001–1008.
Hettmer S, Wagers AJ. 2010. Muscling in: uncovering the originsof rhabdomyosarcoma. Nat Med 16: 171–173.
Hettmer S, Liu J, Miller CM, Lindsay MC, Sparks CA, GuertinDA, Bronson RT, Langenau DM, Wagers AJ. 2011. Sarcomasinduced in discrete subsets of prospectively isolated skeletalmuscle cells. Proc Natl Acad Sci 108: 20002–20007.
Jahn L, Sadoshima J, Izumo S. 1994. Cyclins and cyclin-dependentkinases are differentially regulated during terminal differenti-ation of C2C12 muscle cells. Exp Cell Res 212: 297–307.
Jonkers J, Meuwissen R, van der Gulden H, Peterse H, van derValk M, Berns A. 2001. Synergistic tumor suppressor activityof BRCA2 and p53 in a conditional mouse model for breastcancer. Nat Genet 29: 418–425.
Keller C, Arenkiel BR, Coffin CM, El-Bardeesy N, DePinho RA,Capecchi MR. 2004a. Alveolar rhabdomyosarcomas in con-ditional Pax3:Fkhr mice: cooperativity of Ink4a/ARF andTrp53 loss of function. Genes Dev 18: 2614–2626.
Alveolar rhabdomyosarcoma cell of origin
GENES & DEVELOPMENT 1589
Cold Spring Harbor Laboratory Press on January 30, 2015 - Published by genesdev.cshlp.orgDownloaded from

Keller C, Hansen MS, Coffin CM, Capecchi MR. 2004b.Pax3:Fkhr interferes with embryonic Pax3 and Pax7 func-tion: implications for alveolar rhabdomyosarcoma cell oforigin. Genes Dev 18: 2608–2613.
Kikuchi K, Keller C. 2012. The not-so-skinny on muscle cancer.Cancer Cell 22: 421–422.
Kikuchi K, Hettmer S, Aslam MI, Michalek JE, Laub W, WilkyBA, Loeb DM, Rubin BP, Wagers AJ, Keller C. 2014. Cell-cycle dependent expression of a translocation-mediatedfusion oncogene mediates checkpoint adaptation in rhabdo-myosarcoma. PLoS Genet 10: e1004107.
Lae M, Ahn EH, Mercado GE, Chuai S, Edgar M, Pawel BR,Olshen A, Barr FG, Ladanyi M. 2007. Global gene expressionprofiling of PAX–FKHR fusion-positive alveolar and PAX–FKHR fusion-negative embryonal rhabdomyosarcomas.J Pathol 212: 143–151.
Lagha M, Brunelli S, Messina G, Cumano A, Kume T, Relaix F,Buckingham ME. 2009. Pax3:Foxc2 reciprocal repression inthe somite modulates muscular versus vascular cell fatechoice in multipotent progenitors. Dev Cell 17: 892–899.
Langenau DM, Keefe MD, Storer NY, Guyon JR, Kutok JL, Le X,Goessling W, Neuberg DS, Kunkel LM, Zon LI. 2007. Effectsof RAS on the genesis of embryonal rhabdomyosarcoma.Genes Dev 21: 1382–1395.
Lisboa S, Cerveira N, Vieira J, Torres L, Ferreira AM, Afonso M,Norton L, Henrique R, Teixeira MR. 2008. Genetic diagnosisof alveolar rhabdomyosarcoma in the bone marrow ofa patient without evidence of primary tumor. Pediatr BloodCancer 51: 554–557.
Malempati S, Hawkins DS. 2012. Rhabdomyosarcoma: reviewof the Children’s Oncology Group (COG) Soft-Tissue Sar-coma Committee experience and rationale for current COGstudies. Pediatr Blood Cancer 59: 5–10.
Marino S, Vooijs M, van Der Gulden H, Jonkers J, Berns A. 2000.Induction of medulloblastomas in p53-null mutant mice bysomatic inactivation of Rb in the external granular layercells of the cerebellum. Genes Dev 14: 994–1004.
Messina G, Sirabella D, Monteverde S, Galvez BG, TonlorenziR, Schnapp E, De Angelis L, Brunelli S, Relaix F, BuckinghamM, et al. 2009. Skeletal muscle differentiation of embryonicmesoangioblasts requires pax3 activity. Stem Cells 27: 157–164.
Miller LD, Smeds J, George J, Vega VB, Vergara L, Ploner A,Pawitan Y, Hall P, Klaar S, Liu ET, et al. 2005. An expressionsignature for p53 status in human breast cancer predictsmutation status, transcriptional effects, and patient survival.Proc Natl Acad Sci 102: 13550–13555.
Missiaglia E, Williamson D, Chisholm J, Wirapati P, Pierron G,Petel F, Concordet JP, Thway K, Oberlin O, Pritchard-JonesK, et al. 2012. PAX3/FOXO1 fusion gene status is the keyprognostic molecular marker in rhabdomyosarcoma andsignificantly improves current risk stratification. J Clin
Oncol 30: 1670–1677.Mozzetta C, Consalvi S, Saccone V, Forcales SV, Puri PL,
Palacios D. 2011. Selective control of Pax7 expression byTNF-activated p38a/polycomb repressive complex 2 (PRC2)signaling during muscle satellite cell differentiation. CellCycle 10: 191–198.
Naini S, Etheridge KT, Adam SJ, Qualman SJ, Bentley RC,Counter CM, Linardic CM. 2008. Defining the cooperativegenetic changes that temporally drive alveolar rhabdomyo-sarcoma. Cancer Res 68: 9583–9588.
Nishijo K, Chen QR, Zhang L, McCleish AT, Rodriguez A, ChoMJ, Prajapati SI, Gelfond JA, Chisholm GB, Michalek JE,et al. 2009a. Credentialing a preclinical mouse model ofalveolar rhabdomyosarcoma. Cancer Res 69: 2902–2911.
Nishijo K, Hosoyama T, Bjornson CR, Schaffer BS, Prajapati SI,Bahadur AN, Hansen MS, Blandford MC, McCleish AT,Rubin BP, et al. 2009b. Biomarker system for studyingmuscle, stem cells, and cancer in vivo. FASEB J 23: 2681–2690.
Ognjanovic S, Linabery AM, Charbonneau B, Ross JA. 2009.Trends in childhood rhabdomyosarcoma incidence and sur-vival in the United States, 1975–2005. Cancer 115: 4218–4226.
Ognjanovic S, Martel G, Manivel C, Olivier M, Langer E,Hainaut P. 2012. Low prevalence of TP53 mutations andMDM2 amplifications in pediatric rhabdomyosarcoma. Sar-
coma 2012: 492086.Palacios D, Mozzetta C, Consalvi S, Caretti G, Saccone V,
Proserpio V, Marquez VE, Valente S, Mai A, Forcales SV,et al. 2010. TNF/p38a/polycomb signaling to Pax7 locus insatellite cells links inflammation to the epigenetic control ofmuscle regeneration. Cell Stem Cell 7: 455–469.
Ren YX, Finckenstein FG, Abdueva DA, Shahbazian V, Chung B,Weinberg KI, Triche TJ, Shimada H, Anderson MJ. 2008.Mouse mesenchymal stem cells expressing PAX–FKHR formalveolar rhabdomyosarcomas by cooperating with secondarymutations. Cancer Res 68: 6587–6597.
Rodriguez-Galindo C, Hill DA, Onyekwere O, Pin N, Rao BN,Hoffer FA, Kun LE, Pappo AS, Santana VM. 2001. Neonatalalveolar rhabdomyosarcoma with skin and brain metastases.Cancer 92: 1613–1620.
Rubin BP, Nishijo K, Chen HI, Yi X, Schuetze DP, Pal R,Prajapati SI, Abraham J, Arenkiel BR, Chen QR, et al. 2011.Evidence for an unanticipated relationship between undif-ferentiated pleomorphic sarcoma and embryonal rhabdo-myosarcoma. Cancer Cell 19: 177–191.
Sambasivan R, Comai G, Le Roux I, Gomes D, Konge J, DumasG, Cimper C, Tajbakhsh S. 2013. Embryonic founders ofadult muscle stem cells are primed by the determinationgene Mrf4. Dev Biol 381: 241–255.
Sandberg AA, Stone JF, Czarnecki L, Cohen JD. 2001. Hemato-logic masquerade of rhabdomyosarcoma. Am J Hematol 68:51–57.
Sorensen PH, Lynch JC, Qualman SJ, Tirabosco R, Lim JF,Maurer HM, Bridge JA, Crist WM, Triche TJ, Barr FG.2002. PAX3–FKHR and PAX7–FKHR gene fusions are prog-nostic indicators in alveolar rhabdomyosarcoma: a reportfrom the Children’s Oncology Group. J Clin Oncol 20: 2672–2679.
Soriano P. 1999. Generalized lacZ expression with the ROSA26Cre reporter strain. Nat Genet 21: 70–71.
Sueters M, Peek AM, Ball LM, Hogendoorn PC, Scherjon SA,de Keizer RJ, Schalij-Delfos NE. 2005. Prenatal detectionof orbital rhabdomyosarcoma. Arch Ophthalmol 123:276–279.
Suman KS, Sharma P, Singh H, Bal C, Kumar R. 2013. Primaryrhabdomyosarcoma of pulmonary artery: 18F-FDG PET/CTfor detecting recurrence in a rare tumor. Clin Nucl Med 38:e155–e156.
Sun B, Zhang S, Zhao X, Zhang W, Hao X. 2004. Vasculogenicmimicry is associated with poor survival in patients withmesothelial sarcomas and alveolar rhabdomyosarcomas. Int J
Oncol 25: 1609–1614.Takahashi Y, Oda Y, Kawaguchi K, Tamiya S, Yamamoto H,
Suita S, Tsuneyoshi M. 2004. Altered expression and molec-ular abnormalities of cell-cycle-regulatory proteins in rhab-domyosarcoma. Mod pathol 17: 660–669.
Thompson MC, Fuller C, Hogg TL, Dalton J, Finkelstein D, LauCC, Chintagumpala M, Adesina A, Ashley DM, Kellie SJ,et al. 2006. Genomics identifies medulloblastoma subgroups
Abraham et al.
1590 GENES & DEVELOPMENT
Cold Spring Harbor Laboratory Press on January 30, 2015 - Published by genesdev.cshlp.orgDownloaded from

that are enriched for specific genetic alterations. J Clin Oncol
24: 1924–1931.Tiffin N, Williams RD, Shipley J, Pritchard-Jones K. 2003. PAX7
expression in embryonal rhabdomyosarcoma suggests anorigin in muscle satellite cells. Br J Cancer 89: 327–332.
Vintersten K, Monetti C, Gertsenstein M, Zhang P, Laszlo L,Biechele S, Nagy A. 2004. Mouse in red: red fluorescentprotein expression in mouse ES cells, embryos, and adultanimals. Genesis 40: 241–246.
Wachtel M, Dettling M, Koscielniak E, Stegmaier S, Treuner J,Simon-Klingenstein K, Buhlmann P, Niggli FK, SchaferBW. 2004. Gene expression signatures identify rhabdo-myosarcoma subtypes and detect a novel t(2;2)(q35;p23)translocation fusing PAX3 to NCOA1. Cancer Res 64:5539–5545.
Wachtel M, Runge T, Leuschner I, Stegmaier S, Koscielniak E,Treuner J, Odermatt B, Behnke S, Niggli FK, Schafer BW.2006. Subtype and prognostic classification of rhabdomyo-sarcoma by immunohistochemistry. J Clin Oncol 24: 816–822.
Alveolar rhabdomyosarcoma cell of origin
GENES & DEVELOPMENT 1591
Cold Spring Harbor Laboratory Press on January 30, 2015 - Published by genesdev.cshlp.orgDownloaded from

10.1101/gad.238733.114Access the most recent version at doi: 2014 28: 1578-1591 Genes Dev.
Jinu Abraham, Yaiza Nuñez-Álvarez, Simone Hettmer, et al. responseLineage of origin in rhabdomyosarcoma informs pharmacological
Material
Supplemental
http://genesdev.cshlp.org/content/suppl/2014/07/16/28.14.1578.DC1.html
References
http://genesdev.cshlp.org/content/28/14/1578.full.html#ref-list-1
This article cites 60 articles, 20 of which can be accessed free at:
Open Access
Open Access option.Genes & DevelopmentFreely available online through the
License
Commons Creative
.http://creativecommons.org/licenses/by/4.0License (Attribution 4.0 International), as described at
, is available under a Creative CommonsGenes & DevelopmentThis article, published in
ServiceEmail Alerting
click here.right corner of the article orReceive free email alerts when new articles cite this article - sign up in the box at the top
http://genesdev.cshlp.org/subscriptionsgo to: Genes & Development To subscribe to
© 2014 Abraham et al.; Published by Cold Spring Harbor Laboratory Press
Cold Spring Harbor Laboratory Press on January 30, 2015 - Published by genesdev.cshlp.orgDownloaded from