lineage-specific biology revealed by a finished … · lineage-specific biology revealed by a...
TRANSCRIPT
Lineage-Specific Biology Revealed by a Finished GenomeAssembly of the MouseDeanna M. Church1.*, Leo Goodstadt2.*, LaDeana W. Hillier3, Michael C. Zody4,5, Steve Goldstein6,
Xinwe She7, Carol J. Bult8, Richa Agarwala1, Joshua L. Cherry1, Michael DiCuccio1, Wratko Hlavina1, Yuri
Kapustin1, Peter Meric1, Donna Maglott1, Zoe Birtle2, Ana C. Marques2, Tina Graves3, Shiguo Zhou6,
Brian Teague6, Konstantinos Potamousis6, Christopher Churas6, Michael Place9, Jill Herschleb6, Ron
Runnheim6, Daniel Forrest6, James Amos-Landgraf10, David C. Schwartz6, Ze Cheng7, Kerstin Lindblad-
Toh4,5*, Evan E. Eichler7*, Chris P. Ponting2*, The Mouse Genome Sequencing Consortium"
1 National Center for Biotechnology Information, Bethesda, Maryland, United States of America, 2 MRC Functional Genomics Unit, Department of Physiology, Anatomy
and Genetics, University of Oxford, Oxford, United Kingdom, 3 The Genome Center at Washington University, St. Louis, Missouri, United States of America, 4 The Broad
Institute of MIT and Harvard, Cambridge, Massachusetts, United States of America, 5 Department of Medical Biochemistry and Microbiology, Uppsala University, Uppsala,
Sweden, 6 Laboratory for Molecular and Computational Genomics, University of Wisconsin-Madison, Madison, Wisconsin, United States of America, 7 Department of
Genome Sciences and Howard Hughes Medical Institute, University of Washington, Seattle, Washington, United States of America, 8 The Jackson Laboratory, Bar Harbor,
Maine, United States of America, 9 Waisman Center, University of Wisconsin-Madison, Madison, Wisconsin, United States of America, 10 McArdle Laboratory for Cancer
Research, University of Wisconsin School of Medicine and Public Health, Madison, Wisconsin, United States of America
Abstract
The mouse (Mus musculus) is the premier animal model for understanding human disease and development. Here we showthat a comprehensive understanding of mouse biology is only possible with the availability of a finished, high-qualitygenome assembly. The finished clone-based assembly of the mouse strain C57BL/6J reported here has over 175,000 fewergaps and over 139 Mb more of novel sequence, compared with the earlier MGSCv3 draft genome assembly. In acomprehensive analysis of this revised genome sequence, we are now able to define 20,210 protein-coding genes, over athousand more than predicted in the human genome (19,042 genes). In addition, we identified 439 long, non–protein-coding RNAs with evidence for transcribed orthologs in human. We analyzed the complex and repetitive landscape of 267Mb of sequence that was missing or misassembled in the previously published assembly, and we provide insights into thereasons for its resistance to sequencing and assembly by whole-genome shotgun approaches. Duplicated regions withinnewly assembled sequence tend to be of more recent ancestry than duplicates in the published draft, correcting our initialunderstanding of recent evolution on the mouse lineage. These duplicates appear to be largely composed of sequenceregions containing transposable elements and duplicated protein-coding genes; of these, some may be fixed in the mousepopulation, but at least 40% of segmentally duplicated sequences are copy number variable even among laboratory mousestrains. Mouse lineage-specific regions contain 3,767 genes drawn mainly from rapidly-changing gene families associatedwith reproductive functions. The finished mouse genome assembly, therefore, greatly improves our understanding ofrodent-specific biology and allows the delineation of ancestral biological functions that are shared with human from derivedfunctions that are not.
Citation: Church DM, Goodstadt L, Hillier LW, Zody MC, Goldstein S, et al. (2009) Lineage-Specific Biology Revealed by a Finished Genome Assembly of theMouse. PLoS Biol 7(5): e1000112. doi:10.1371/journal.pbio.1000112
Academic Editor: Richard J. Roberts, New England Biolabs, United States of America
Received December 19, 2008; Accepted April 3, 2009; Published May 26, 2009
This is an open-access article distributed under the terms of the Creative Commons Public Domain declaration which stipulates that, once placed in the publicdomain, this work may be freely reproduced, distributed, transmitted, modified, built upon, or otherwise used by anyone for any lawful purpose.
Funding: DMC, RA, JC, MD, DM, WH, YK, and the National Institutes of Health Intramural Sequencing Center were supported by the Intramural Research Programof the NIH. CPP, ZB, and LG were supported by the UK Medical Research Council. ACM was supported by the Swiss National Science Foundation. EEE, XS, and ZCwere supported in part by National Institutes of Health grant HG002385. EEE is an investigator of the Howard Hughes Medical Institute. The Genome Center atWashington University, The Human Genome Sequencing Center at the Baylor College of Medicine, and The Broad Institute of Harvard and MIT are supported bygenome sequencing grants from National Human Genome Research Institute. Chromosomes 2, 4, 11 and X were completed with funding from the WellcomeTrust. The funders had no role in study design, data collection and analysis, decision to publish, or preparation of the manuscript.
Competing Interests: The authors have declared that no competing interests exist.
Abbreviations: EST, expressed sequence tag; ncRNA, noncoding RNA; SSR, simple sequence repeat; TPF, tiling path file; VR, vomeronasal receptors; WGSA,Whole Genome Sequence and Assembly.
* E-mail: [email protected] (DMC); [email protected] (LG); [email protected] (KL-T); [email protected] (EEE); [email protected] (CPP)
. These authors contributed equally to this work.
" Membership of The Mouse Genome Sequencing Consortium is provided in the Acknowledgments.
Introduction
The mouse (Mus musculus) occupies a singular position in
genetics and genomics. It is both the premier animal model for
human disease and development and the mammalian genome
against which human DNA, genes, and genomes are most
frequently compared. Despite approximately 90 million years of
independent evolution [1], the laboratory mouse remains an
PLoS Biology | www.plosbiology.org 1 May 2009 | Volume 7 | Issue 5 | e1000112
excellent model for many human phenotypes and thus is critical to
the study of human disease and mammalian development. Its
small size and rapid breeding cycle are of immense practical
utility, and the mature mouse genetics system, with hundreds of
inbred lines, allows phenotypic consequences of sequence variation
to be inferred [2].
Given the critical role of the mouse as a model organism, it is
particularly important to separate shared ancestral characteristics
that have been conserved in the mouse and human since their
divergence from derived characteristics that are unique to either
lineage. Mouse and human genes whose coding sequences have
scarcely changed since the last common ancestor and that have
remained unduplicated in each lineage are the most likely to have
retained their ancestral functions. In contrast, genes that have
duplicated along the rodent lineage may contribute to derived
traits that are less relevant to human biology, and are thus less
appropriate models of human physiology and disease.
Genomic duplication and divergence is a primary source of
functional innovation [3]. Recent gene duplicates are highly
sequence-similar and are expected to be embedded within
segmentally duplicated regions of the genome (defined as DNA
segments greater than 1 kb showing .90% sequence identity [4]).
Approximately 40% (50 Mb) of segmentally duplicated sequences
are known to be copy number variable among laboratory strains
[5], whereas the remainder appears to have been fixed, either by
genetic drift or by positive selection when the duplicated genes
provide a selective advantage [6,7]. Past episodes of positive
selection upon codon substitutions can be inferred from evolu-
tionary analyses of segmentally duplicated and lineage-specific
genes [8–10].
In late 2002, we published a draft mouse genome assembly,
referred to as the MGSCv3, of a single, inbred strain (C57BL/6J,
or ‘‘B6’’) [11]. This publication marked a watershed in
mammalian genetics and genomics, as it allowed the first genomic
comparisons between mouse and human. It also represented the
first publicly funded mammalian genome project using Whole
Genome Sequence and Assembly (WGSA). This approach, or
variations of it, has since been the primary method for producing
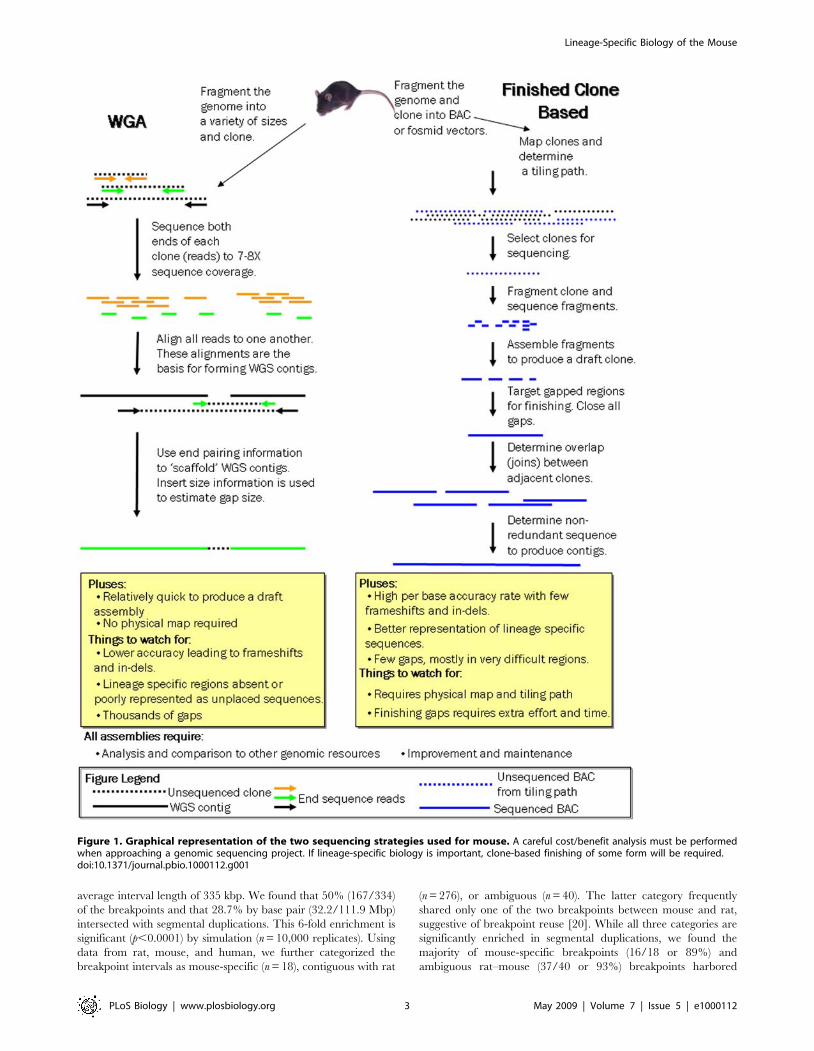
most mammalian genomes [12–16] (Figure 1).
Despite the great utility of the initial MGSCv3 assembly, the
draft genome contained over 176,000 gaps and included entire
regions whose positions and/or orientations in the assembly now
appear to have been in error. The most serious issue to the use of
the MGSCv3 is its almost complete lack of highly sequence-similar
and recently segmentally duplicated regions [17,18]. It was our
principal concern that missing segmental duplication-rich regions
of the draft assembly might harbour large numbers of rapidly
evolving genes whose identification might illuminate mouse-
specific biology. Only by accounting for these missing genes could
we obtain a comprehensive understanding of the biology that
distinguishes these two species. Given this, it has been a goal of the
international consortium to produce a mouse genome assembly of
coverage and quality comparable to that of the human genome
described in 2004 [19]. Although it was anticipated that the effort
and expense required for producing such an assembly via a clone-
based approach would be substantial, this would be justified by the
increased fidelity, and thus utility, of the higher quality genome
assembly to the biomedical research community.
Here we report the completion of this effort and present a high-
quality, largely finished clone-based genome assembly of the
C57BL/6J strain of mouse, here referred to as Build 36. This new
assembly includes 267 Mb of sequence (Protocol S1) that was
either missing or misassembled, much of which consists of
repetitive and segmentally duplicated sequence (4.94% of the
genome). Over 175,000 gaps in MGSCv3 have been closed, and
genome-wide continuity has improved accordingly, with scaffold
N50 lengths (the scaffold length in which at least half of the bases
of the assembly reside) increasing from 17 Mb to 40 Mb.
The availability of finished sequence for human, and now
mouse, enables more-complete surveys of protein-coding genes in
both species. We now estimate that mouse and human reference
genomes contain 20,210 and 19,042 protein-coding genes,
respectively. The number of mouse genes had been missing or
substantially disrupted in the previous MGSCv3 assembly is 2,185.
The majority of these arise from rodent lineage-specific duplica-
tions, often (61%) embedded within segmentally duplicated
regions that were recalcitrant to WGSA. Many of these mouse-
specific genes may contribute to rodent-specific functions and,
with their inclusion in the assembly, are now available for further
investigation.
Results
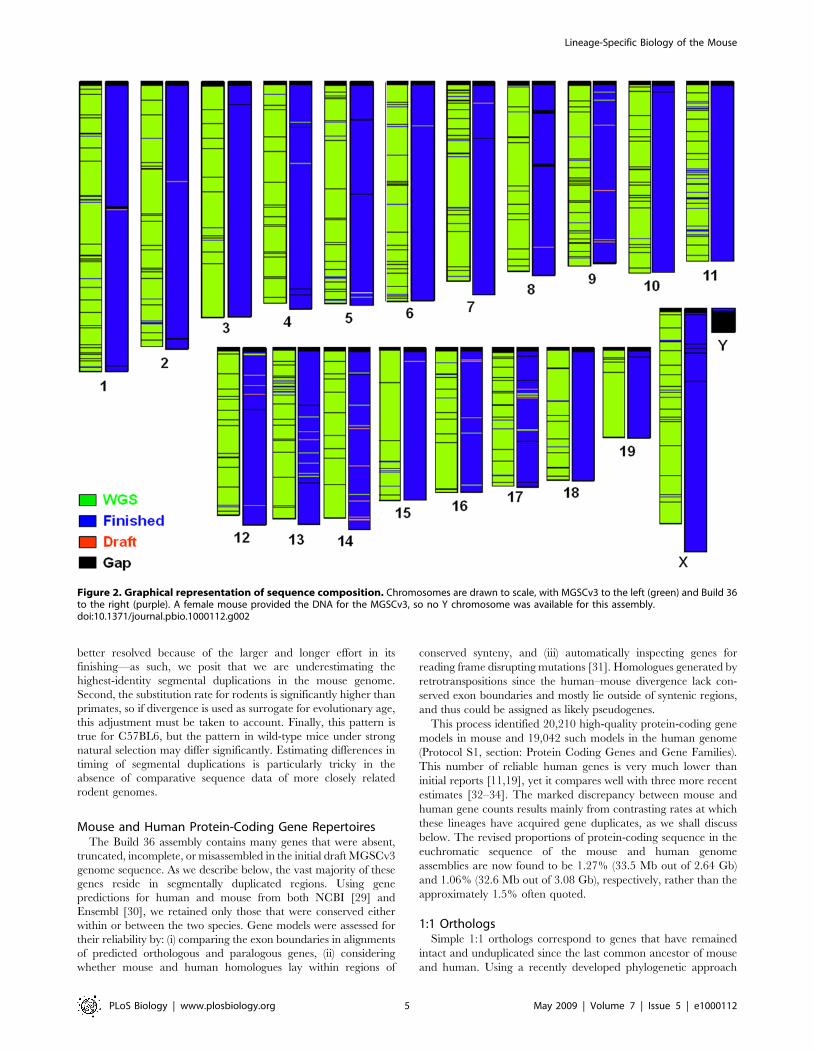
Build 36 AssemblyThe mouse genome assembly (Build 36; Box 1) shows marked
improvements over the MGSCv3 (Table 1) (Tables S1, S2, S3, S4,
S5 and S6 in Protocol S1), with an increased amount of ordered
and oriented sequence placed on a chromosome (2.58 Gb in the
MGSCv3 versus 2.64 Gb in Build 36) and increased base level
accuracy due to the addition of clone-based finished sequence
(Figure 2) (Table S3a–S3c in Protocol S1). Scaffold continuity, as
measured by the N50, is also dramatically improved, with an N50
of 40.3 Mb in Build 36 compared to an N50 of 17.8 Mb in the
MGSCv3. In addition, the number of gaps in Build 36 is reduced
by over 140-fold when compared to the MGSCv3 (Table 1)
(Tables S4 and S5 in Protocol S1). Evidence (Box 1) indicates that
Build 36 is a high-quality assembly that covers .99% of the
C57BL/6J genome (assuming a 2.66-Gb genome size; see Protocol
S1). Although many of the problematic regions identified in these
analyses have been corrected in a subsequent Build 37 (the current
public build, see Box 1 and Protocol S1), a few regions remain
under review and will be addressed in forthcoming assemblies.
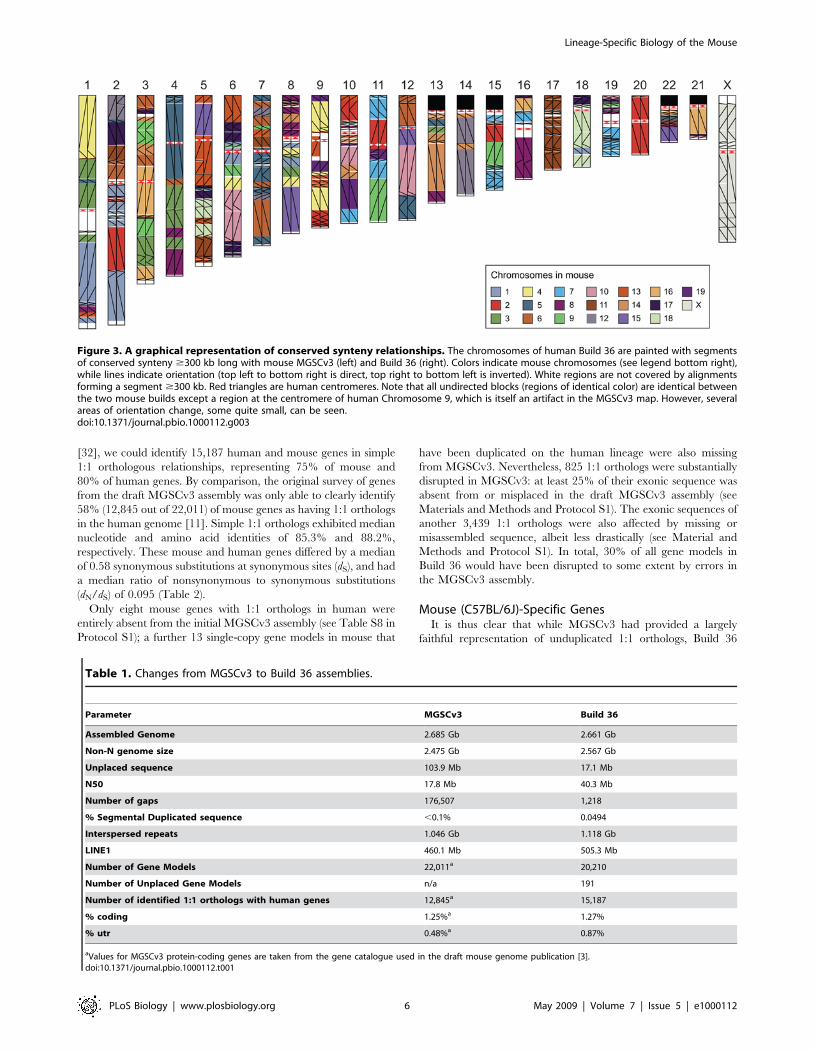
Improvements to the assembly are evident at a fine scale in the
spanning of previous gaps and inclusion of locally duplicated
sequences. However, at a larger scale, the genome structure
remains basically unchanged from MGSCv3, and conserved
syntenic relationships to human inferred from the two assemblies
have remained essentially unaltered (Figure 3).
We identified a total of 334 chromosomal breakpoint intervals
between human and mouse and refined the breakpoints to an
Author Summary
The availability of an accurate genome sequence providesthe bedrock upon which modern biomedical research isbased. Here we describe a high-quality assembly, Build 36,of the mouse genome. This assembly was put together byaligning overlapping individual clones representing partsof the genome, and it provides a more complete picturethan previous assemblies, because it adds much rodent-specific sequence that was previously unavailable. Theaddition of these sequences provides insight into both thegenomic architecture and the gene complement of themouse. In particular, it highlights recent gene duplicationsand the expansion of certain gene families during rodentevolution. An improved understanding of the mousegenome and thus mouse biology will enhance the utilityof the mouse as a model for human disease.
Lineage-Specific Biology of the Mouse
PLoS Biology | www.plosbiology.org 2 May 2009 | Volume 7 | Issue 5 | e1000112
average interval length of 335 kbp. We found that 50% (167/334)
of the breakpoints and that 28.7% by base pair (32.2/111.9 Mbp)
intersected with segmental duplications. This 6-fold enrichment is
significant (p,0.0001) by simulation (n = 10,000 replicates). Using
data from rat, mouse, and human, we further categorized the
breakpoint intervals as mouse-specific (n = 18), contiguous with rat
(n = 276), or ambiguous (n = 40). The latter category frequently
shared only one of the two breakpoints between mouse and rat,
suggestive of breakpoint reuse [20]. While all three categories are
significantly enriched in segmental duplications, we found the
majority of mouse-specific breakpoints (16/18 or 89%) and
ambiguous rat–mouse (37/40 or 93%) breakpoints harbored
Figure 1. Graphical representation of the two sequencing strategies used for mouse. A careful cost/benefit analysis must be performedwhen approaching a genomic sequencing project. If lineage-specific biology is important, clone-based finishing of some form will be required.doi:10.1371/journal.pbio.1000112.g001
Lineage-Specific Biology of the Mouse
PLoS Biology | www.plosbiology.org 3 May 2009 | Volume 7 | Issue 5 | e1000112
segmental duplications. These data strongly support the now
longstanding observation that chromosomal rearrangements
preferentially associate with regions enriched with duplicated
sequences [18,21–23].
Newly Assembled Genomic DNA Consists Mostly ofLineage-Specific Sequence
The revised Build 36 assembly contains 139 Mb of sequence
that could not be aligned against, and thus appears to have been
absent from, the previous MGSCv3 draft assembly. 108 Mb (77%)
of this sequence consists of 119,000 repetitive elements (Table S7
in Protocol S1); this was expected because highly sequence-similar
repetitive sequences are particularly difficult to resolve using
WGSA [24,25]. One-third (45.2 Mb; 33%) of this newly
incorporated repetitive sequence is derived from the most
abundant mouse repeat, LINE1. These newly identified LINE1
copies have, on average, a markedly lower divergence from the
consensus (mean 4.5%, as reported by RepeatMasker) than those
that align completely to the previous MGSCv3 sequence (mean
9.4%). Hence they tend to have been inserted more recently in the
mouse lineage. Insertions of LINE1s are clearly ongoing because
they are known to be responsible for 10–15% of deleterious
mutations [26,27].
Eighty percent of sequence added or corrected in the mouse
genome assembly consists of segmentally duplicated regions or
interspersed repeats. Most of these have now been ordered and
oriented on a chromosome (Figure 4 and Protocol S1). The large
amount (126 Mb; 4.94%) of segmentally duplicated sequence in the
mouse genome was unexpected, because the initial MGSCv3
assembly contained virtually no (,0.1%) such sequence [4], and
what was there in MGSCv3 resided in a large pool of unplaced
sequences. When evaluating the segmental duplication content of
Build 36, we used an assembly-independent approach [17] to
validate 85–91% of long ($10 kb) and highly similar (94–99%)
duplications. Nevertheless, some virtually identical (.99%) duplica-
tions remained as artefacts in the assembly, because these exhibited
slightly lower rates of validation (82%), and further work will be
required to resolve them. Of critical importance, with the addition of
the new data in Build 36, segmental duplications in the mouse thus
are now seen to occupy a similar proportion of the genome as they
do in human. However, they are overwhelmingly intrachromosom-
al, with a high prevalence of tandem duplication, whereas human
segmental duplications are often interchromosomal [17].
This is partially addressed in [5], but we elaborate further.
When one compares the divergence of segmental duplications
between the mouse (Build 36) and human genome assemblies
(Build 36), there are some notable differences. For example, the
majority of human intrachromosomal segmental duplications
show high sequence identity (98.5–99.5% with a mode at 99%
sequence identity). In contrast, the pairwise sequence identity
distribution for mouse segmental duplications shows a much more
bell-shaped distribution with a clear mode around 95%. These
findings are consistent with a burst of intrachromosomal segmental
duplications in the human–great ape lineage as recently discussed
[28], and indicate that perhaps intrachromosomal segmental
duplications have a more ancient origin in the mouse. There are,
however, some important caveats. First, it is likely that high-
identity duplications in the human genome assembly have been
Box 1. Assembly Production and Quality Assurance
The mouse genome assembly (Build 36) was producedlargely as described previously [19] but with some variationsin methodology and standards (Protocol S1). The availabilityof a high-quality WGS assembly was essential in providing aframework for the clone-based assembly. Nevertheless, over7% of the bases found in the finished clone sequences failedto align to the MGSCv3. Unaligned sequence contributedfrom approximately 4% for Chromosome 11 to 18% for the Xchromosome (Protocol S1: Alignments)). Tables S1, S2, S3, S4and S5 in Protocol S1 provide assembly statistics, stratifiedby chromosome, for both Build 36 and the subsequent Build37, which was produced after the analysis performed here.While this analysis led to improvements in Build 37, thechanges in this build are not expected to drastically alter theconclusions of the analysis presented in this manuscript. Themain differences between Build 36 and Build 37 are theincorporation of an additional 8.3 Mb of sequence onto theassembled chromosomes and 44.7 Mb of sequence asunplaced sequence. During the course of analyzing Build36, a number of scaffolds that were unplaced in the MGSCv3were found to contain sequences not represented in Build36. In all cases, these sequences contained protein-codinggenes. While many of these can be associated with achromosome, the exact order and orientation is unknown.However, because of the missing gene sequences, wethought it was important to release Build 37 with thesesequences included. Work is ongoing to both place thesesequences in the correct location on the chromosome and toidentify clone-based sequences to represent them. Althoughstatistics are provided for the Y chromosome, analysis of thischromosome will not be discussed here, because it remains aseparate project that will be described at a later date.
However, the authors have generously provided thescientific community with data prior to publication (J. Alfoldi,personal communication).To assess the accuracy of Build 36, the genome assembly wascompared to several independent sources of data includinga linkage map [81], a radiation hybrid map [82], andsequences (genomic and transcript based) not used togenerate the assembly [83]. In all cases, the discrepancy ratewas very low, indicating that Build 36 is a high-quality andhigh-coverage genome assembly (Protocol S1). This projectwas the first to use an optical map to assess the assemblyand to disambiguate problematic regions. We assembled agenome-wide SwaI restriction map of the C57BL/6J mousegenome using single-molecule ordered restriction mapsobtained from the optical mapping system [84–86]. Thisoptical map showed 99% concordance with the restrictionendonuclease digest pattern predicted by the genomeassembly. We identified 423 discordant sites which weremanually evaluated; in 95 cases, the optical map was judgedto be correct, in 220 cases the sequence as determined to becorrect and the remaining 108 cases were ambiguous(Protocol S1). The optical map provided critical data forclone placement in several repetitive regions, such as thebeta-defensin region on mouse chromosome 8 (Figure S66in Protocol S1), as well as providing evidence for clone orderin regions where there was little other information, such assome pericentromeric regions. In addition, the optical mapcovers roughly two-thirds of the 103 unspanned gaps inBuild 36 (Protocol S1: Comparison of Optical Map to Build 36(pdf)) and will be used in future builds to provide moreaccurate gap estimates.
Lineage-Specific Biology of the Mouse
PLoS Biology | www.plosbiology.org 4 May 2009 | Volume 7 | Issue 5 | e1000112
better resolved because of the larger and longer effort in its
finishing—as such, we posit that we are underestimating the
highest-identity segmental duplications in the mouse genome.
Second, the substitution rate for rodents is significantly higher than
primates, so if divergence is used as surrogate for evolutionary age,
this adjustment must be taken to account. Finally, this pattern is
true for C57BL6, but the pattern in wild-type mice under strong
natural selection may differ significantly. Estimating differences in
timing of segmental duplications is particularly tricky in the
absence of comparative sequence data of more closely related
rodent genomes.
Mouse and Human Protein-Coding Gene RepertoiresThe Build 36 assembly contains many genes that were absent,
truncated, incomplete, or misassembled in the initial draft MGSCv3
genome sequence. As we describe below, the vast majority of these
genes reside in segmentally duplicated regions. Using gene
predictions for human and mouse from both NCBI [29] and
Ensembl [30], we retained only those that were conserved either
within or between the two species. Gene models were assessed for
their reliability by: (i) comparing the exon boundaries in alignments
of predicted orthologous and paralogous genes, (ii) considering
whether mouse and human homologues lay within regions of
conserved synteny, and (iii) automatically inspecting genes for
reading frame disrupting mutations [31]. Homologues generated by
retrotranspositions since the human–mouse divergence lack con-
served exon boundaries and mostly lie outside of syntenic regions,
and thus could be assigned as likely pseudogenes.
This process identified 20,210 high-quality protein-coding gene
models in mouse and 19,042 such models in the human genome
(Protocol S1, section: Protein Coding Genes and Gene Families).
This number of reliable human genes is very much lower than
initial reports [11,19], yet it compares well with three more recent
estimates [32–34]. The marked discrepancy between mouse and
human gene counts results mainly from contrasting rates at which
these lineages have acquired gene duplicates, as we shall discuss
below. The revised proportions of protein-coding sequence in the
euchromatic sequence of the mouse and human genome
assemblies are now found to be 1.27% (33.5 Mb out of 2.64 Gb)
and 1.06% (32.6 Mb out of 3.08 Gb), respectively, rather than the
approximately 1.5% often quoted.
1:1 OrthologsSimple 1:1 orthologs correspond to genes that have remained
intact and unduplicated since the last common ancestor of mouse
and human. Using a recently developed phylogenetic approach
Figure 2. Graphical representation of sequence composition. Chromosomes are drawn to scale, with MGSCv3 to the left (green) and Build 36to the right (purple). A female mouse provided the DNA for the MGSCv3, so no Y chromosome was available for this assembly.doi:10.1371/journal.pbio.1000112.g002
Lineage-Specific Biology of the Mouse
PLoS Biology | www.plosbiology.org 5 May 2009 | Volume 7 | Issue 5 | e1000112
[32], we could identify 15,187 human and mouse genes in simple
1:1 orthologous relationships, representing 75% of mouse and
80% of human genes. By comparison, the original survey of genes
from the draft MGSCv3 assembly was only able to clearly identify
58% (12,845 out of 22,011) of mouse genes as having 1:1 orthologs
in the human genome [11]. Simple 1:1 orthologs exhibited median
nucleotide and amino acid identities of 85.3% and 88.2%,
respectively. These mouse and human genes differed by a median
of 0.58 synonymous substitutions at synonymous sites (dS), and had
a median ratio of nonsynonymous to synonymous substitutions
(dN/dS) of 0.095 (Table 2).
Only eight mouse genes with 1:1 orthologs in human were
entirely absent from the initial MGSCv3 assembly (see Table S8 in
Protocol S1); a further 13 single-copy gene models in mouse that
have been duplicated on the human lineage were also missing
from MGSCv3. Nevertheless, 825 1:1 orthologs were substantially
disrupted in MGSCv3: at least 25% of their exonic sequence was
absent from or misplaced in the draft MGSCv3 assembly (see
Materials and Methods and Protocol S1). The exonic sequences of
another 3,439 1:1 orthologs were also affected by missing or
misassembled sequence, albeit less drastically (see Material and
Methods and Protocol S1). In total, 30% of all gene models in
Build 36 would have been disrupted to some extent by errors in
the MGSCv3 assembly.
Mouse (C57BL/6J)-Specific GenesIt is thus clear that while MGSCv3 had provided a largely
faithful representation of unduplicated 1:1 orthologs, Build 36
Figure 3. A graphical representation of conserved synteny relationships. The chromosomes of human Build 36 are painted with segmentsof conserved synteny $300 kb long with mouse MGSCv3 (left) and Build 36 (right). Colors indicate mouse chromosomes (see legend bottom right),while lines indicate orientation (top left to bottom right is direct, top right to bottom left is inverted). White regions are not covered by alignmentsforming a segment $300 kb. Red triangles are human centromeres. Note that all undirected blocks (regions of identical color) are identical betweenthe two mouse builds except a region at the centromere of human Chromosome 9, which is itself an artifact in the MGSCv3 map. However, severalareas of orientation change, some quite small, can be seen.doi:10.1371/journal.pbio.1000112.g003
Table 1. Changes from MGSCv3 to Build 36 assemblies.
Parameter MGSCv3 Build 36
Assembled Genome 2.685 Gb 2.661 Gb
Non-N genome size 2.475 Gb 2.567 Gb
Unplaced sequence 103.9 Mb 17.1 Mb
N50 17.8 Mb 40.3 Mb
Number of gaps 176,507 1,218
% Segmental Duplicated sequence ,0.1% 0.0494
Interspersed repeats 1.046 Gb 1.118 Gb
LINE1 460.1 Mb 505.3 Mb
Number of Gene Models 22,011a 20,210
Number of Unplaced Gene Models n/a 191
Number of identified 1:1 orthologs with human genes 12,845a 15,187
% coding 1.25%a 1.27%
% utr 0.48%a 0.87%
aValues for MGSCv3 protein-coding genes are taken from the gene catalogue used in the draft mouse genome publication [3].doi:10.1371/journal.pbio.1000112.t001
Lineage-Specific Biology of the Mouse
PLoS Biology | www.plosbiology.org 6 May 2009 | Volume 7 | Issue 5 | e1000112
Lineage-Specific Biology of the Mouse
PLoS Biology | www.plosbiology.org 7 May 2009 | Volume 7 | Issue 5 | e1000112
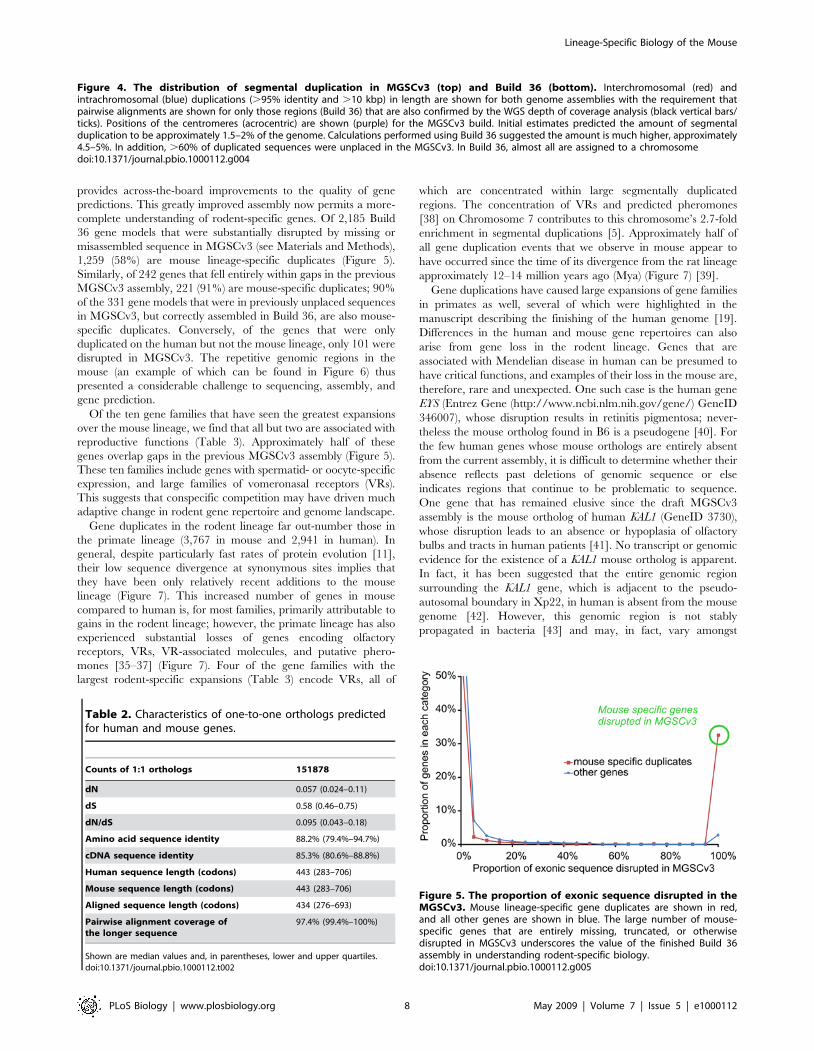
provides across-the-board improvements to the quality of gene
predictions. This greatly improved assembly now permits a more-
complete understanding of rodent-specific genes. Of 2,185 Build
36 gene models that were substantially disrupted by missing or
misassembled sequence in MGSCv3 (see Materials and Methods),
1,259 (58%) are mouse lineage-specific duplicates (Figure 5).
Similarly, of 242 genes that fell entirely within gaps in the previous
MGSCv3 assembly, 221 (91%) are mouse-specific duplicates; 90%
of the 331 gene models that were in previously unplaced sequences
in MGSCv3, but correctly assembled in Build 36, are also mouse-
specific duplicates. Conversely, of the genes that were only
duplicated on the human but not the mouse lineage, only 101 were
disrupted in MGSCv3. The repetitive genomic regions in the
mouse (an example of which can be found in Figure 6) thus
presented a considerable challenge to sequencing, assembly, and
gene prediction.
Of the ten gene families that have seen the greatest expansions
over the mouse lineage, we find that all but two are associated with
reproductive functions (Table 3). Approximately half of these
genes overlap gaps in the previous MGSCv3 assembly (Figure 5).
These ten families include genes with spermatid- or oocyte-specific
expression, and large families of vomeronasal receptors (VRs).
This suggests that conspecific competition may have driven much
adaptive change in rodent gene repertoire and genome landscape.
Gene duplicates in the rodent lineage far out-number those in
the primate lineage (3,767 in mouse and 2,941 in human). In
general, despite particularly fast rates of protein evolution [11],
their low sequence divergence at synonymous sites implies that
they have been only relatively recent additions to the mouse
lineage (Figure 7). This increased number of genes in mouse
compared to human is, for most families, primarily attributable to
gains in the rodent lineage; however, the primate lineage has also
experienced substantial losses of genes encoding olfactory
receptors, VRs, VR-associated molecules, and putative phero-
mones [35–37] (Figure 7). Four of the gene families with the
largest rodent-specific expansions (Table 3) encode VRs, all of
which are concentrated within large segmentally duplicated
regions. The concentration of VRs and predicted pheromones
[38] on Chromosome 7 contributes to this chromosome’s 2.7-fold
enrichment in segmental duplications [5]. Approximately half of
all gene duplication events that we observe in mouse appear to
have occurred since the time of its divergence from the rat lineage
approximately 12–14 million years ago (Mya) (Figure 7) [39].
Gene duplications have caused large expansions of gene families
in primates as well, several of which were highlighted in the
manuscript describing the finishing of the human genome [19].
Differences in the human and mouse gene repertoires can also
arise from gene loss in the rodent lineage. Genes that are
associated with Mendelian disease in human can be presumed to
have critical functions, and examples of their loss in the mouse are,
therefore, rare and unexpected. One such case is the human gene
EYS (Entrez Gene (http://www.ncbi.nlm.nih.gov/gene/) GeneID
346007), whose disruption results in retinitis pigmentosa; never-
theless the mouse ortholog found in B6 is a pseudogene [40]. For
the few human genes whose mouse orthologs are entirely absent
from the current assembly, it is difficult to determine whether their
absence reflects past deletions of genomic sequence or else
indicates regions that continue to be problematic to sequence.
One gene that has remained elusive since the draft MGSCv3
assembly is the mouse ortholog of human KAL1 (GeneID 3730),
whose disruption leads to an absence or hypoplasia of olfactory
bulbs and tracts in human patients [41]. No transcript or genomic
evidence for the existence of a KAL1 mouse ortholog is apparent.
In fact, it has been suggested that the entire genomic region
surrounding the KAL1 gene, which is adjacent to the pseudo-
autosomal boundary in Xp22, in human is absent from the mouse
genome [42]. However, this genomic region is not stably
propagated in bacteria [43] and may, in fact, vary amongst
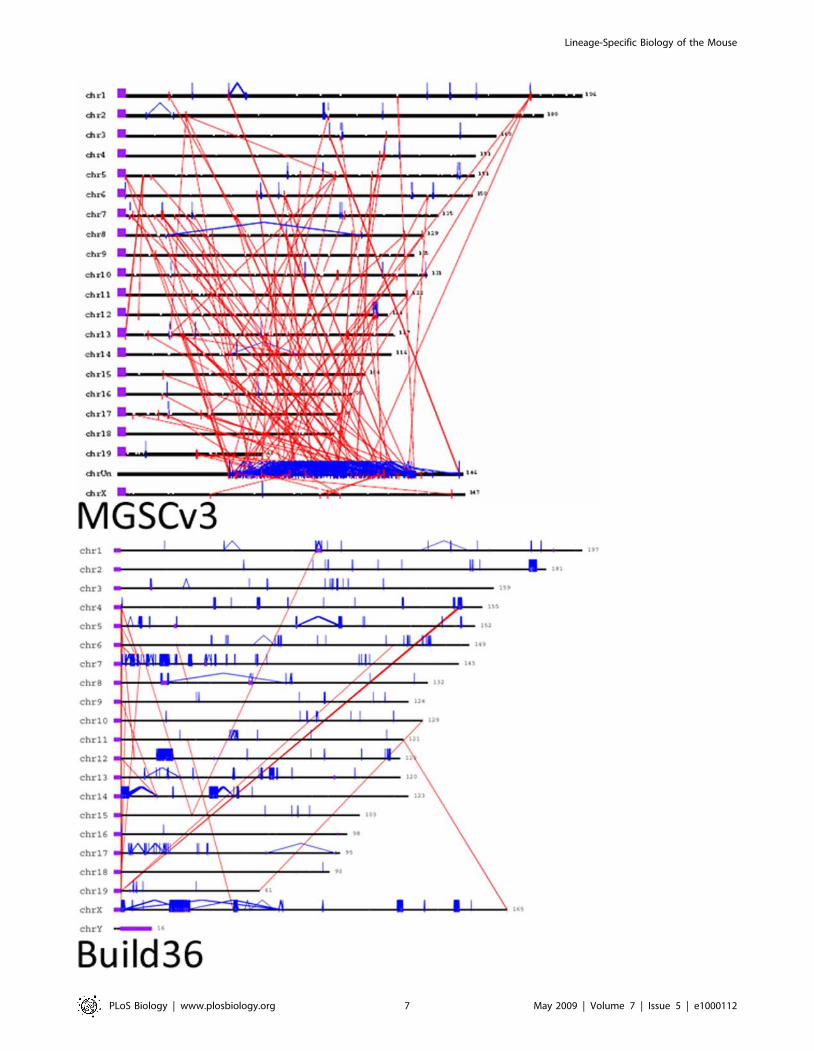
Figure 4. The distribution of segmental duplication in MGSCv3 (top) and Build 36 (bottom). Interchromosomal (red) andintrachromosomal (blue) duplications (.95% identity and .10 kbp) in length are shown for both genome assemblies with the requirement thatpairwise alignments are shown for only those regions (Build 36) that are also confirmed by the WGS depth of coverage analysis (black vertical bars/ticks). Positions of the centromeres (acrocentric) are shown (purple) for the MGSCv3 build. Initial estimates predicted the amount of segmentalduplication to be approximately 1.5–2% of the genome. Calculations performed using Build 36 suggested the amount is much higher, approximately4.5–5%. In addition, .60% of duplicated sequences were unplaced in the MGSCv3. In Build 36, almost all are assigned to a chromosomedoi:10.1371/journal.pbio.1000112.g004
Table 2. Characteristics of one-to-one orthologs predictedfor human and mouse genes.
Counts of 1:1 orthologs 151878
dN 0.057 (0.024–0.11)
dS 0.58 (0.46–0.75)
dN/dS 0.095 (0.043–0.18)
Amino acid sequence identity 88.2% (79.4%–94.7%)
cDNA sequence identity 85.3% (80.6%–88.8%)
Human sequence length (codons) 443 (283–706)
Mouse sequence length (codons) 443 (283–706)
Aligned sequence length (codons) 434 (276–693)
Pairwise alignment coverage ofthe longer sequence
97.4% (99.4%–100%)
Shown are median values and, in parentheses, lower and upper quartiles.doi:10.1371/journal.pbio.1000112.t002
Figure 5. The proportion of exonic sequence disrupted in theMGSCv3. Mouse lineage-specific gene duplicates are shown in red,and all other genes are shown in blue. The large number of mouse-specific genes that are entirely missing, truncated, or otherwisedisrupted in MGSCv3 underscores the value of the finished Build 36assembly in understanding rodent-specific biology.doi:10.1371/journal.pbio.1000112.g005
Lineage-Specific Biology of the Mouse
PLoS Biology | www.plosbiology.org 8 May 2009 | Volume 7 | Issue 5 | e1000112
strains [44]. Evidence of mouse orthologs for some genes in this
genomic region does exist within transcript sequences that are
derived from strains other than C57BL/6J [45–46].Completing
the catalogue of mouse genes and pseudogenes and understanding
their homology relationship with human genes requires additional
sequence from more than a single strain.
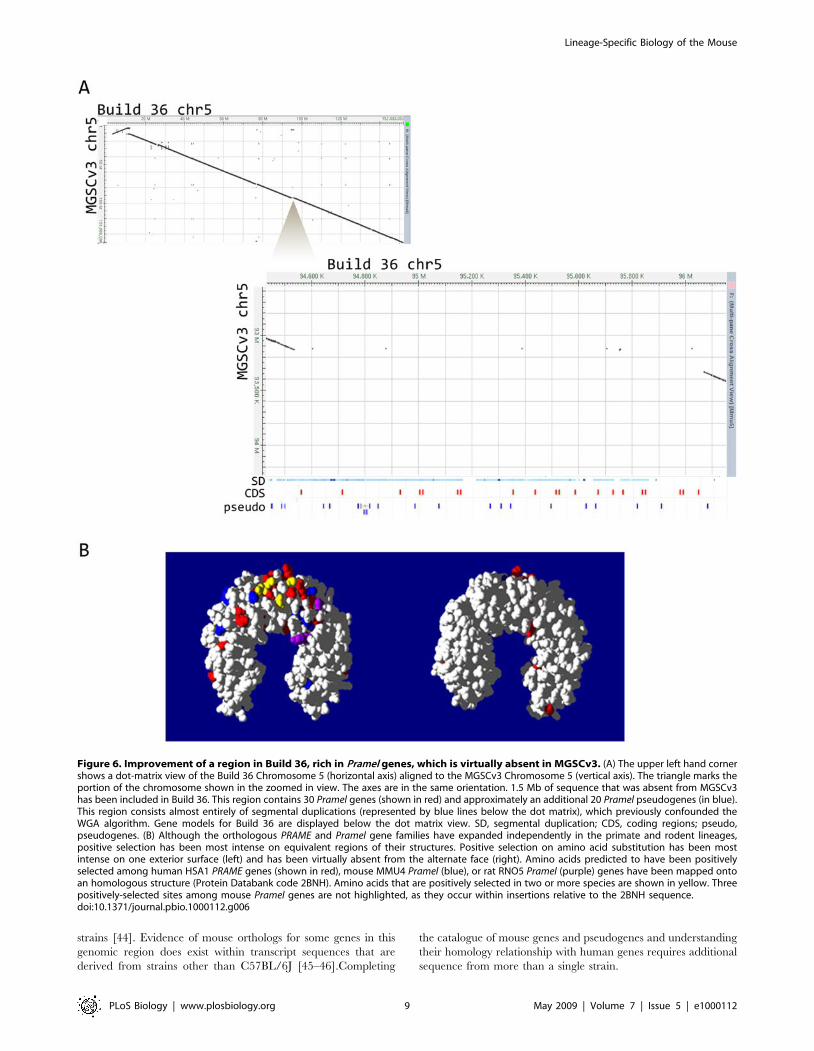
Figure 6. Improvement of a region in Build 36, rich in Pramel genes, which is virtually absent in MGSCv3. (A) The upper left hand cornershows a dot-matrix view of the Build 36 Chromosome 5 (horizontal axis) aligned to the MGSCv3 Chromosome 5 (vertical axis). The triangle marks theportion of the chromosome shown in the zoomed in view. The axes are in the same orientation. 1.5 Mb of sequence that was absent from MGSCv3has been included in Build 36. This region contains 30 Pramel genes (shown in red) and approximately an additional 20 Pramel pseudogenes (in blue).This region consists almost entirely of segmental duplications (represented by blue lines below the dot matrix), which previously confounded theWGA algorithm. Gene models for Build 36 are displayed below the dot matrix view. SD, segmental duplication; CDS, coding regions; pseudo,pseudogenes. (B) Although the orthologous PRAME and Pramel gene families have expanded independently in the primate and rodent lineages,positive selection has been most intense on equivalent regions of their structures. Positive selection on amino acid substitution has been mostintense on one exterior surface (left) and has been virtually absent from the alternate face (right). Amino acids predicted to have been positivelyselected among human HSA1 PRAME genes (shown in red), mouse MMU4 Pramel (blue), or rat RNO5 Pramel (purple) genes have been mapped ontoan homologous structure (Protein Databank code 2BNH). Amino acids that are positively selected in two or more species are shown in yellow. Threepositively-selected sites among mouse Pramel genes are not highlighted, as they occur within insertions relative to the 2BNH sequence.doi:10.1371/journal.pbio.1000112.g006
Lineage-Specific Biology of the Mouse
PLoS Biology | www.plosbiology.org 9 May 2009 | Volume 7 | Issue 5 | e1000112
More rarely, a mouse gene may lack an apparent human
ortholog simply because rapid evolution renders any similarity in
their sequences undetectable. This is the case with human
AU022751 (Mouse Genome Informatics (MGI; http://www.
informatics.jax.org/) ID: 2147968; GeneID 102991) and mouse
EG624310 (MGI: 3644796 ; GeneID 624310) that lie in conserved
synteny on their X chromosomes: they are orthologous, yet show
only residual and nonsignificant sequence similarity in database
searches. The mouse genome contains a further ten mouse
paralogs of EG624310 (MGI: 3644796 ; GeneID 624310) on a
separate region of chromosome X that was largely absent from
MGSCv3. AU022751 (MGI: 2147968; GeneID 102991) is of
unknown function, but its mouse orthologs appear, from the
expression profile of expressed sequence tags (ESTs), to be
expressed frequently in oocytes and exhibit evidence for positive
selection on amino acid substitutions (unpublished data). This
demonstrates how apparently lineage-specific gene families can
emerge by unusually rapid sequence divergence, driven in part by
positive selection, over only tens of millions of years, and is a
prominent example of the novel biology that can be discovered
using a high quality mouse genome assembly.
Mouse Gene Family Expansions and ReproductionThe largest rodent-specific expansions have occurred among
sperm-associated glutamate (E)-rich (Speer) genes on Chromosomes
5 and 14. Most Speer genes appear to have roles in spermatogenesis
[47,48] but some Speer-homologous genes, termed a-takusans, are
expressed in the mouse brain and regulate synaptic activity [49].
Speer/a-takusan genes are absent from nonrodent genomes
because they arose via a partial gene duplication of Dlg5
(MGI: 1918478; GeneID 71228) [47], followed by multiple
duplications and sequence diversification, early in the rodent
lineage. Many (24) of these Speer homologues were absent from
or disrupted in the MGSCv3 because of earlier assembly
problems associated with their repetitive nature. Assembly gaps
remain within Build 36 Chromosome 14, hinting at yet more
undiscovered Speer genes.
Members of the preferentially expressed antigen of melanoma
(PRAME) gene family made up the third largest gene family with
mouse specific expansions. All 90 mouse Prame-like (Pramel) genes
were the result of duplications after the divergence of the rodent
and primate lineages [8], and the majority of these were also
incomplete in MGSCv3 (Figure 6). In primates, this family has also
seen much independent expansion, and it is highly divergent in
copy number both between species and within the human
population [8,16]. In rodents, Pramel gene duplications occurred
not only locally, in cis, but also by translocation of a single Pramel
gene from the ancestral Chromosome 4 to Chromosome 5, with
additional cis-duplications there subsequently. A further segmental
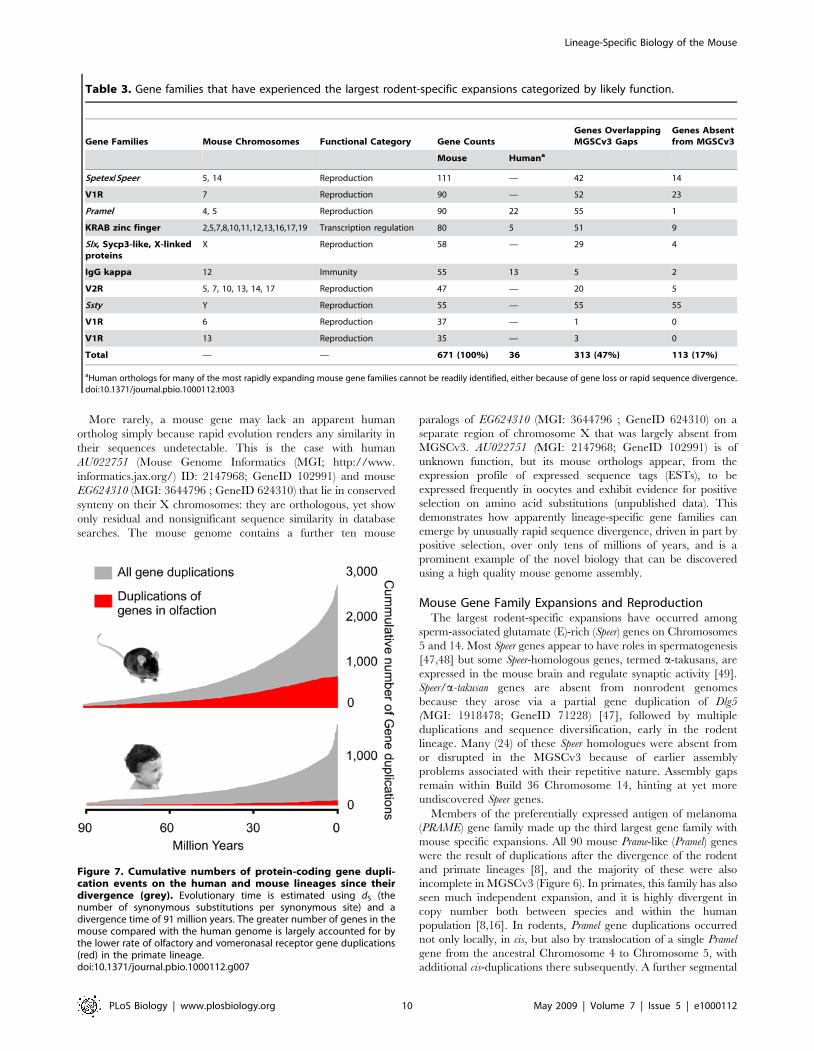
Table 3. Gene families that have experienced the largest rodent-specific expansions categorized by likely function.
Gene Families Mouse Chromosomes Functional Category Gene CountsGenes OverlappingMGSCv3 Gaps
Genes Absentfrom MGSCv3
Mouse Humana
Spetex/Speer 5, 14 Reproduction 111 — 42 14
V1R 7 Reproduction 90 — 52 23
Pramel 4, 5 Reproduction 90 22 55 1
KRAB zinc finger 2,5,7,8,10,11,12,13,16,17,19 Transcription regulation 80 5 51 9
Slx, Sycp3-like, X-linkedproteins
X Reproduction 58 — 29 4
IgG kappa 12 Immunity 55 13 5 2
V2R 5, 7, 10, 13, 14, 17 Reproduction 47 — 20 5
Ssty Y Reproduction 55 — 55 55
V1R 6 Reproduction 37 — 1 0
V1R 13 Reproduction 35 — 3 0
Total — — 671 (100%) 36 313 (47%) 113 (17%)
aHuman orthologs for many of the most rapidly expanding mouse gene families cannot be readily identified, either because of gene loss or rapid sequence divergence.doi:10.1371/journal.pbio.1000112.t003
Figure 7. Cumulative numbers of protein-coding gene dupli-cation events on the human and mouse lineages since theirdivergence (grey). Evolutionary time is estimated using dS (thenumber of synonymous substitutions per synonymous site) and adivergence time of 91 million years. The greater number of genes in themouse compared with the human genome is largely accounted for bythe lower rate of olfactory and vomeronasal receptor gene duplications(red) in the primate lineage.doi:10.1371/journal.pbio.1000112.g007
Lineage-Specific Biology of the Mouse
PLoS Biology | www.plosbiology.org 10 May 2009 | Volume 7 | Issue 5 | e1000112
duplication, absent in the rat, seeded continued expansion of this
gene family within chromosome 5 (Figure S1 in Protocol S1).
There is abundant evidence for past episodes of positive selection
within rodent Pramel and primate PRAME genes (Figure 6) [8].
Little is known of the functions of mouse Pramel genes, except that
they are often expressed in oocytes, in early embryos, and in
spermatogonia [50].This expression profile suggests that they
might perform important mitotic roles in rapidly dividing cells.
Extensive duplications within two further gene families have
been restricted to X and Y chromosomes (Table 3). These families
derived originally from ancestral autosomal paralogs: Sycp3 (MGI:
109542; GeneID 20962) on Chromosome 10 [51], and Spin1
(MGI: 109242; GeneID 20729) on Chromosome 13 [52]. Sycp3
(MGI: 109542; GeneID 20962 ) gave rise to Slx (MGI: 99543;
GeneID 664829) and Sly (MGI: 382301; GeneID 382301) genes
on the X and Y chromosomes, respectively. The Spin1 homologues
on the sex chromosomes, including EG546176 (MGI: 3645924;
GeneID 546176) and Ssty1 (MGI: 1314663; GeneID 20611),
appear to have arisen through retro-transposition and subsequent
duplication. Nevertheless, the maintenance of open reading frames
over the long evolutionary distances separating the divergent X
and Y copies suggest that protein coding potential has been
maintained for many of these genes. The expression of both gene
families is specific to spermatids [53,54]. Translocation to the sex
chromosomes and subsequent widespread duplications may reflect
advantages when these genes are hemizygous in males [55] or
when gender conflict affects the sex ratio of mouse progeny [56].
Multiple copies of these genes may act to avoid X inactivation [57]
or help to compensate for lack of recombination on the Y
chromosome [58].
We found that many genes in the four families described
above—namely Speer, Pramel, Slx/Sly, and EG546176/Ssty1—have
experienced extensive positive selection upon amino acid substi-
tutions (unpublished data), suggesting that duplication events were
themselves fixed preferentially in ancestral mouse populations.
The preponderance among rodent-lineage specific genes of those
with reproductive function provides an indication of the
prominent role of conspecific competition in shaping the mouse
gene repertoire and hence its biology [59]. Despite their large
number and the important roles that they have played in the
emergence of the laboratory mouse, these genes are poorly
represented among current gene catalogues. This is because they
are generally found as multiple tandem copies in segmentally
duplicated genomic regions, accompanied by significant numbers
of gene fragments and pseudogenes. Only now, with the
availability of a high-quality finished mouse genome, can the
crucial roles of these rapidly evolving genomic regions in
determining lineage-specific biology be fully appreciated.
Mouse Non–Protein-Coding RNA GenesThe transcribed and functional portion of the mouse genome
consists of noncoding as well as protein-coding genes. Hundreds of
microRNA loci, for example, have been detected within recent
mouse genome assemblies [60]. In addition, thousands of long
noncoding RNAs (ncRNAs) have been detected from full-length
mouse cDNA libraries [61,62]. The contribution of these long
ncRNAs to mouse biology, however, remains a matter of extensive
debate. Evolutionary studies have yet to contribute to this debate
by distinguishing long ncRNAs that have single human orthologs
from others that have duplicated, or else emerged de novo, on the
mouse lineage.
Evidence for conserved transcription is apparent for only a small
proportion of long mouse ncRNA sequences, in contrast to
protein-coding genes. Of 3,051 well-documented mouse long
ncRNA sequences [63], only half (1,538 of 3,051; 50.4%) can be
mapped to the human genome assembly using cross-species
genomic alignments. This proportion is slightly higher than the
fraction (39%) of all mouse nucleotides that have been aligned to
the human genome assembly. Of these 1,538 mapped sequences,
only 439 (14% of 3,051) have EST or cDNA evidence for
orthologous transcription in human. Although most mouse long
ncRNAs lack evidence of human expression, the minority with
conserved expression represents a statistically significant (p,1023)
9.5-fold enrichment over what is expected from random genome
sampling. These 439 ncRNAs have a median length of 1,920 bp
and are significantly less likely to contain annotated repetitive
sequence (13% of nucleotides overlap mouse repeats) than either
random intergenic regions ( 45%, p-value,0.001) or their
nonconserved counterparts (25%, p-value,0.001). These mouse
ncRNAs should now be prioritized for further experimental
scrutiny. The remaining mouse long ncRNAs that appear to lack
human orthologs may represent rodent-specific biology, transcrip-
tional noise, or transcribed noncoding sequence that remains, as
yet, unidentified in humans.
Mouse Strain-Specific Genomic SequenceRodent lineage-specific sequence includes regions that are copy
number variable among laboratory mouse strains. Indeed, many of
the largest rodent-specific gene families are known to be copy
number variable among mouse strains [5] including Slx, V1R, and
V2R family genes. We used read pair data to identify larger scale
structural events in Build 36. Read pairs from nine non-B6 strains
identified 2,573 sequence differences where B6 contains an insertion
relative to the other strains, at least 263 of which appear to be at
least 10 Kb in size. Notably, 604 events were identified that define
potential deletions in B6 relative to other strains, including deletions
to the pseudo-autosomal region of the X chromosome. These
deletions would represent sequence present in the mouse population
but absent from the reference genome. In contrast, using C57BL/6J
read pairs as a negative control, we observed only 96 possible
insertion events, 42 possible deletion events, and 67 possible
inversion events (Table S9a and S9b in Protocol S1). Clearly, to
move towards a comprehensive catalogue of CNVs, and indeed all
variation including quiet mutations [64], in Mus musculus, sequenc-
ing of additional mouse strains will be required.
Discussion
The mouse genome assembly (Build 36) is now of high fidelity
and completeness, and its quality is comparable to, or perhaps
better than, that of the reference human genome assembly. The
finished mouse genome adds over 6% additional euchromatic
sequence, much of it repetitive, but includes 1,259 mouse-specific
genes that were missing or grossly misassembled in the draft.
Improvements to the assembly should enhance many coordinated
initiatives that are exploiting the utility of the laboratory mouse for
understanding human biology and disease processes. For example,
an international effort to establish baseline phenotypic measure-
ments on the 40 most commonly used strains has provided a much
needed platform upon which more complex phenotypes can be
assessed [65]. Several large-scale studies have produced hundreds
of models of human disease using chemical mutagenesis or
random insertional mutagenesis [66]. Other projects are underway
with the goal of producing a targeted mutation in every gene in the
mouse genome [67]. As the primary organizational framework for
all of these projects, it is essential that the annotated mouse
genome reference sequence is as complete and accurate as
possible.
Lineage-Specific Biology of the Mouse
PLoS Biology | www.plosbiology.org 11 May 2009 | Volume 7 | Issue 5 | e1000112
Sequencing StrategiesThe original MGSCv3 mouse draft assembly proved compar-
atively cheap and easy to produce. A large number of other
vertebrate genomes have been sequenced to similarly deep
coverage, either as aids to model organism biology or to improve
our understanding of the human genome. The cost to take a
genome to an equivalent finished state is typically at least four
times the cost of generating the draft assemblies using traditional
Sanger sequencing. Nonetheless, it is clear from our analysis of the
finished mouse genome assembly that draft WGSAs will always
poorly reflect lineage-specific biology. This conclusion is also
supported by analysis of both the dog [14,68] and rhesus macaque
genomes [16,28]. Whereas they provide a sufficient framework for
understanding the majority of the genome that lies outside of
lineage-specific regions, recent, rapidly evolving parts of the
genome are greatly underrepresented due to the collapse of
segmental duplications and evolutionarily young repeat sequences.
Finished genome sequence has proved essential to understanding
the full range of biology for both the human [17] and the mouse
genome, and will no doubt prove similarly informative for other
vertebrate species.
Using next-generation sequencing technology, the cost of
generating several-fold coverage of a genome drops several orders
of magnitude; however, especially for large genomes; it is still not
possible to generate a de novo assembly from the collection of such
reads. While it is likely that de novo assembly of large genomes
using next generation sequencing technologies will be achieved
relatively soon, it is unlikely that these assemblies will represent
these complex, lineage-specific regions any better than WGSAs
generated using traditional Sanger technology. We have seen little
evidence from next-generation sequence assemblies of genome or
clones that segmental duplications can be adequately resolved with
methods other than capillary sequencing of clones. For example,
we recently completed an analysis with 96 clones, which contained
structural variants and segmental duplications and, not surpris-
ingly, those regions that remained unresolved (by 454 sequence
data) were enriched in segmental duplications and large common
repeats (Eichler EE, Kidd JM, Fulton RS, Chen L, Graves T, et al.
unpublished data). Cost-effectiveness should not be the primary
consideration for these regions. Studies of human disease and
phenotypes in other organisms show conclusively that the content,
copy, and structure are important. Short-read, next-generation
sequencing technology, while a significant advance, will not
comprehensively capture all of this complex sequence structure.
Obtaining large insert clones for these regions is the key, but we
need third-generation technology with longer-read lengths to
assemble these complex regions accurately. Long-read technology
developments [69] hold promise in this regard. A targeted clone-
based approach to sequencing may thus be especially well justified
for representative species on the lineage leading to human,
comprising our closest primate lineages as well as other simians.
This is because many of the critical changes that underlie
biological innovations in primate lineages are likely to reside in
precisely the rapidly evolving, segmentally duplicated regions that
have proved so illuminating for the mouse. Coding and noncoding
gene gains and losses in each lineage, and changes to their
regulatory sequence, may allow us to elucidate the pressures that
have shaped different regions of the human genome over recent
evolutionary history. Changes in the repertoire of immune genes,
for example, would help to explain the contrasting susceptibilities
of primates to different pathogens and auto-immune diseases [70],
while much of human reproductive biology and placental
development, so distinct from those of rodents, may be understood
in the context of changes in reproductive strategy among primates
[71]. Other laboratory models, such as the rat, or species that lie at
key branch points in the evolutionary tree leading to humans, or
representatives of important lineages outside the eutherian
mammals, such as marsupials, birds, and fish, may be similarly
justified in having a finished genome sequence.
Comprehensive Gene ListsThe greatest improvements to the mouse assembly have been to
regions that are replete with rodent lineage-specific duplicated
sequence. Segmental duplications that were previously found at
negligible levels now constitute almost 5% of the genome. Many of
these duplications harbour multiple rodent-specific genes that
show a strong bias towards reproductive function. This suggests a
role for either adaptive forces or clonal selection in shaping the
mouse genome. The availability of these mouse genes now allows
their experimental investigation.
The comparison of two finished mammalian genomes has
enabled the revision of comprehensive and reliable human and
mouse protein-coding gene catalogues. The 75% of mouse genes
that are in 1:1 orthologous relationships with human genes are the
most likely to have maintained ancestral function in both species,
and are, therefore, most appropriately targeted as disease models.
Phenotype data, mainly from knockouts, are already available for
over 5,000 of these 15,187 genes [72]. Other genes exist in
multiple copies in the B6 genome or are polymorphic among
mouse strains, and these will be more difficult to study on a gene-
by-gene basis. While variation among strains suggests that some of
these lineage-specific genes are not essential to development, many
of these differences may contribute to phenotypic variation seen
among laboratory strains. Understanding rodent-specific innova-
tions is, therefore, critical when investigating human physiology or
disease using the mouse as a model organism.
The shortcomings of the initial draft assembly are readily
apparent now that a more-complete genome assembly is available.
Undoubtedly these have led to incomplete or inaccurate
understanding of some aspects of mouse biology. The availability
of high quality genome sequence for the mouse will lead the way in
dismissing some commonly held misconceptions and, more
importantly, in revealing many previously hidden secrets of mouse
biology.
Supplemental material and data for this paper including
validated protein-coding and noncoding gene models can be
found at: http://www.ncbi.nlm.nih.gov/genome/guide/mouse/
Build36_Publication_Supplement).
Materials and Methods
Sequence Generation and Assembly ProductionClone-based sequence production. Ninety-six percent of
the clone-based sequence was derived from four centres, The
Genome Center at Washington University in St. Louis, The
Wellcome Trust Sanger Institute, The Broad Institute of Harvard
and MIT, and The Genome Center at the Baylor College of
Medicine (Figure S6 in Protocol S1). DNA for the BAC, fosmid,
and Whole Genome libraries was obtained from The Jackson
Laboratories. Information on BAC library construction (libraries
RP23, RP24, CH25, and CH36) can be found at BacPac
Resources [73]. Clone sequences were obtained as previously
described [19] with two exceptions. The availability of B6 WGS
reads allowed the centres to sequence clones to a moderate level of
coverage and then ‘‘steal’’ reads to increase the coverage.
Remaining gaps were then finished as described previously [19].
Additionally, the requirements for finishing simple sequence
repeats (SSRs) in full were changed to account for the increased
Lineage-Specific Biology of the Mouse
PLoS Biology | www.plosbiology.org 12 May 2009 | Volume 7 | Issue 5 | e1000112
levels of SSRs in the mouse genome. Additional information
concerning centre-specific protocols for clone assembly processes
can be found in the Protocol S1: Assembly Production.
Clone sequence quality assurance. To ensure that base
level quality of the assembled clones was high, we performed a
quality assurance exercise. Each sequencing centre provided the
assessing centre with the clone-based shotgun traces they had
produced. The assessing centre then used their internal protocols
to steal reads and assemble the final insert sequences. The two
sequences were then aligned, and all differences were manually
assessed by an independent third party. Differences found within
SSRs were not counted as true differences. The overall base level
error rate was determined to be 1 error per 50,000 bp, well below
the accepted finishing standard of 1 error in 10,000 bp (Table S6
in Protocol S1).
Tiling path production. The genome assembly is driven by
a tiling path file (TPF). This provides information concerning
clone (component) order as well as the location and
characterization of gaps. Two methods were used to obtain
clone order: alignment of clone end sequences to the MGSCv3
and clone order as obtained by the mouse fingerprint map [74].
All TPFs were stored and evaluated in a single system. Alignments
between adjacent clones were produced using a script utilizing a
combination of BLAST and a banded Needleman-Wunsch
algorithm (Cherry J, unpublished data; Protocol S1: Tiling Path
Production). Alignments having greater than 99.6% identity, no
gap greater than 25 bp, and a complete dovetail alignment were
‘‘passed’’. While it is expected that all clones should have an
alignment of 100% identity with no gaps, in practice this rarely
happens due to the difficulty of finishing SSRs. Clones not passing
the above criteria were manually assessed. In some cases, manual
adjustment of the alignment could produce an acceptable overlap
and in other cases, a ‘‘certificate’’ was submitted to provide
additional external evidence that the join was acceptable. For
more information on join quality information Table S7 in Protocol
S1.
Production of Build 36. Using the alignments above, AGP
files were generated using a program called contig_build (Cherry J,
unpublished data). This algorithm takes a tiling path and a set of
alignments and generates a contig sequence. It checks for internal
consistency with respect to clone order on the TPF and the
provided alignments. The generated switch points were selected
based on the component overlaps. In a few cases, switch points
were manually edited to exclude contaminant sequence or
misassembled sequence in one of the components.
To ensure inclusion of as much sequence as possible, the above
assembled contigs were compared to the MGSCv3 and a
combined assembly was generated essentially as previously
described [75]. In this case, the MGSCv3 was used as a TPF for
reconciliation of alignment conflicts. All regions where WGS
sequence was incorporated were manually assessed and the most
conservative path that minimized gaps was chosen. While the vast
majority of sequence in Build 36 is finished (HTGS phase 3
sequence), there was a small amount of draft and WGS sequence
included (Table S3a and S3b in Protocol S1). Inclusion of this
sequence was necessary as some regions of the genome were
recalcitrant to propagation in BAC vectors (Figure S9 in Protocol
S1).
Genome AnalysisProduction of conserved synteny map. This was produced
essentially as described previously [11].
Repeat analysis. Both Build 36 and the MGSCv3 were
analyzed using RepeatMasker version open-3.1.3 with the
following parameters: -w –s –no_is –cutoff 255 –frag 20000 –gff
–species mouse [76].
Segmental duplication analysis. This was produced as
described previously [5].
Variation. Mouse sequence reads were obtained from the
NCBI Trace Archive; quality clipped, and repeat masked using
WindowMasker [77]. Reads were then aligned to either assemble
using BLAST (version 2.2.18) (-W 28 –e 0.0001 –m8 –UT –Fm –
RT –nT) [78]. Only the highest scoring alignments were retained
and the highest scoring alignment had to be at least 10% larger
than the second-highest alignment score. After the top scoring
alignment region had been identified, the region was padded by 20
kb on either side and the read was realigned using cross-match (P.
Green, unpublished data). For an alignment difference to be
scored as a variation, we required a unique alignment in the
genome and confirmation by more than one trace that had been
sequenced in a different sequencing tray. Additional information
can be found in Protocol S1: Copy Number Variation.
In order to identify variation based on mate pair violations, the
BLAST alignments described above were sorted by best hit. The
top scoring hits for either end that were within 200 kb of each
other were retained for further analysis. If multiple locations for a
clone could be identified, the clone was not kept for the final
analysis. We defined a placed read pair as ‘‘satisfied’’ if the
calculated insert size was within three standard deviations of the
mean. Additional information can be found in Protocol S1: Copy
Number Variation.
Gene catalogue construction. Mouse and human gene
models identified using either the Ensembl pipeline (release 43) or
the NCBI pipeline (mouse Build36 v1 and human Build 36 v3)
were obtained. Comparison of genomic coordinates allowed for
the reconciliation of these two sets into a single gene catalogue
(Protocol S1: Protein-Coding Genes and Gene Families).
The reconciled gene lists were quality assessed based on their
predicted orthologous relationships as previously described [32]
and on the conservation of exonic boundaries in the case of multi-
exonic genes.
To determine genes that are missing from the MGSCv3, the
Build 36 and the MGSCv3 assemblies were aligned to each other
using BLAST [78]. The alignments were trimmed to maximize
alignment scores and to retain reciprocal best hits. An additional
step allowed alignments that are of high quality, but not
reciprocal, to be included in order to capture regions that are
duplicated in one assembly, but not in the other (Y. Kapustin,
unpublished data). CDS features on Build 36 were then
propagated through the alignments onto the MGSv3 (J. Cherry,
unpublished data) to obtain coordinates on the MGSCv3. Exonic
coordinates from the union of NCBI and Ensembl transcripts for
each gene were mapped through alignments from Build 36 onto
MGSCv3 (J. Cherry, unpublished data). Exonic regions that
abutted, or were wholly contained within, one another were
merged before mapping, as were MGSCv3 aligned regions that
overlapped.
We have chosen not to compare the current and initial draft
mouse gene catalogues, because gene annotations have benefitted
from the many improvements in the availability of transcriptional
evidence, gene prediction algorithms, and the heuristics used to
evaluate these data. Instead, we determined the extent to which
the initial MGSCv3 assembly could have supported the current
mouse gene catalogue. We were thus interested in identifying
disrupted Build 36 gene models whose corresponding MGSCv3
sequence was (i) not previously placed on chromosome scaffolds;
(ii) previously dispersed among two or more different chromo-
somes, and/or were placed on both strands of a single
Lineage-Specific Biology of the Mouse
PLoS Biology | www.plosbiology.org 13 May 2009 | Volume 7 | Issue 5 | e1000112
chromosome; (iii) interdigitated, on the same strand, with sequence
corresponding with an unrelated gene model; and (iv) entirely
absent from this early assembly. We describe any such gene model
as being ‘‘unmatched’’ in MGSCv3. These four unmatched
criteria were applied in order. The remaining ‘‘matched’’ Build 36
gene models are contiguous and their exons do not overlap with
other gene models on the same strand in both Build 36 and
MGSCv3 assemblies. With few (65) exceptions, these gene models
are placed on the same chromosome and strand in both
assemblies.
For each Build 36 gene model, we then tabulated its exonic
regions according to these four unmatched criteria. This allowed
us to estimate the proportion of Build 36 exonic nucleotides that
could have been predicted correctly in the early MGSCv3
assembly. Build 36 gene models were deemed to be ‘‘substantially
disrupted’’ (see Main Text: Mouse and Human Protein Coding
Gene Repetoires) in MGSCv3 if greater than 25% of its exonic
sequence falls into any of these four categories.
Links to our gene catalogues and further details of these analyses
can be found in Protocol S1 (Assembly Comparison and Analysis:
Protein Coding Genes and Gene Families).
Identifying ancestral and derived ncRNAs. We looked for
evidence of human transcription for a set of known, mouse long
ncRNAs [63] using human ESTs and RNA sequences from
GenBank. The coordinates of all human ESTs and RNAs
available from GenBank that mapped uniquely to regions
outside of known protein-coding genes in the human genome
(Ensembl v50; 384,861 sequences) were mapped onto the mouse
Build 36 assembly using the human–mouse genome alignment
data and the LiftOver tool from University of California Santa
Cruz [79]. We used default parameters and set the minimum ratio
of mapped nucleotides to 0.2, which was appropriate for the
human–mouse divergence. Of 145,321 sequences that map to the
mouse assembly, only those found outside of known protein-
coding genes in the mouse genome were considered for further
analysis (96,367 human ESTs or RNAs). To identify candidate
ancestral noncoding transcripts, we selected mouse ncRNAs from
the previously described set of 3,051 mouse long noncoding genes
that overlapped by one or more nucleotides these mapped human
intergenic ESTs and RNAs. The statistical significance of this
overlap was determined using a genome-wide association
procedure that accounts for G+C-content and chromosomal
biases [63]. The statistical significance for the overlap between
mouse non-coding RNAs and the annotated mouse repeat-derived
sequence [80] were determined similarly, using mouse intergenic
sequence as the null model. The significance of the increased
fraction of overlapping sequence between repetitive elements and
conserved over nonconserved mouse ncRNAs was determined
using a Fisher’s exact test.
Supporting Information
Protocol S1 Supporting figures, tables, and text. All supporting
information can be found at the following Website: http://www.
ncbi.nlm.nih.gov/projects/genome/guide/mouse/Build36_Publi-
cation_Supplement/.
Found at: doi:10.1371/journal.pbio.1000112.s001 (0.04 MB
DOC)
Acknowledgments
The authors would like to thank the extended staff of all of the genome
centres involved in this project. Without their hard work and dedication,
this project would not have been possible.
The Mouse Genome Sequencing Consortium consists of the following
members, displayed with their affiliations:
At the Human Genome Sequencing Center, Baylor College of
Medicine, Houston, Texas, United States of America; and Department
of Molecular and Human Genetics, Baylor College of Medicine, Houston,
Texas, United States of America: Donna M. Muzny, Shannon Dugan-
Rocha, Yan Ding, Steven E. Scherer, Christian J. Buhay, Andrew Cree,
Judith Hernandez, Michael Holder, Jennifer Hume, Laronda R. Jackson,
Christie Kovar, Sandra L. Lee, Lora R. Lewis, Michael L. Metzker, Lynne
V. Narareth, Aniko Sabo, Erica Sodergren, and Richard A. Gibbs.
At The Broad Institute of MIT and Harvard, Cambridge, Massachu-
setts, United States of America: Michael C. Zody, Michael FitzGerald,
April Cook, David B. Jaffe, Manuel Garber, Andrew R. Zimmer, Mono
Pirun, Lyndsey Russell, Ted Sharpe, Michael Kamal-Kabir Chaturvedi,
Jane Wilkinson, Kurt LaButti, Xiaoping Yang, Daniel Bessette, Nicole R.
Allen, Cindy Nguyen, Thu Nguyen, Chelsea Dunbar, Rakela Lubonja,
Charles Matthews, Xiaohong Liu, Mostafa Benamara, Tamrat Negash,
Tashi Lokyitsang, Karin Decktor, Bruno Piqani, Glen Munson, Pema
Tenzin, Sabrina Stone, Pendexter Macdonald, Harindra Arachchi, Amr
Abouelleil, Annie Lui, Margaret Priest, Gary Gearin, Adam Brown, Lynne
Aftuck, Terrance Shea, Sean Sykes, Aaron Berlin, Jeff Chu, Kathleen
Dooley, Daniel Hagopian, Jennifer Hall, Nabil Hafez, Cherylyn L Smith,
Peter Olandt, Karen Miller, Vijay Ventkataraman, Anthony Rachupka,
Lester Dorris, III, Laura Ayotte, Richard Mabbitt, Jeffrey Erickson,
Andrea Horn, Peter An, Jerome W. Naylor, Sampath Settipalli, The Broad
Institute Genome Sequencing Platform, Broad Institute Genome Assembly
Team, Eric S. Lander, and Kerstin Lindblad-Toh.
At The Genome Center at Washington University, St. Louis, Missouri,
United States of America: Richard K. Wilson, Tina A. Graves, Robert S.
Fulton, Susan M. Rock, LaDeana W. Hillier, Asif T. Chinwalla, Kelly
Bernard, Laura P. Courtney, Catrina Fronick, Lucinda L. Fulton, Michelle
O’Laughlin, Colin L. Kremitzki, Patrick J. Minx, Joanne O. Nelson,
Kyriena L. Schatzkamer, Cynthia Strong, Aye M. Wollam, George M.
Weinstock, and Shiaw-Pyng Yang.
At The Wellcome Trust Sanger Institute, Hinxton, Cambridge, United
Kingdom: Jane Rogers, Darren Grafham, Sean Humphray, Christine
Nicholson, Christine Bird, Andrew J. Brown, John Burton, Chris Clee,
Adrienne Hunt, Matt C. Jones, Christine Lloyd, Lucy Matthews, Karen
Mclaren, Stuart Mclaren, Kirsten McLay, Sophie A Palmer, Robert
Plumb, Ratna Shownkeen, Sarah Sims, Mike A Quail, Siobhan L.
Whitehead, and David L. Willey.
Other sequence producers include the following:
At the University of Oklahoma Advanced Center for Genome
Technology, Norman, Oklahoma, United States of America: Stephane
Deschamps, Steven Kenton, Lin Song, Trang Do, and Bruce Roe.
At the National Institutes of Health Intramural Sequencing Center and
Genome Technology Branch, National Human Genome Research
Institute, National Institutes of Health, Bethesda, Maryland, United States
of America: NISC Comparative Sequencing Program, Gerard G.
Bouffard, Robert W. Blakesley, and Eric D. Green.
At the Harvard Medical School Partners Healthcare Center for Genetics
and Genomics, Boston, Massachusetts, United States of America: Raju
Kucherlapati, George Grills, Li Li, and Kate T. Montgomery.
At the Lita Annenberg Hazen Genome Sequencing Center, Cold Spring
Harbor Laboratory, Cold Spring Harbor, New York, United States of
America: Melissa Kramer, Lori Speigel, and W. Richard McCombie.
At the Joint Genome Institute, US Department of Energy, Walnut
Creek, California: Susan Lucas, Astrid Terry, Laurie Gordon, and Lisa
Stubbs.
At Lawrence Livermore National Laboratory, Livermore, California,
United States of America: Laurie Gordon, and Lisa Stubbs. Lisa Stubbs’
current address is: Institute for Genomic Biology, University of Illinois,
Urbana, Illinois, United States of America.
At the Medical Research Council Harwell, Mammalian Genetics Unit,
Oxfordshire, United Kingdom: Paul Denny, Steve D. M. Brown, and
Anne-Marie Mallon.
At the Medical Research Council Rosalind Franklin Centre for
Genomics Research, Hinxton Genome Campus, United Kingdom: R.
Duncan Campbell and Marc R. M. Botherby.
At the Medical Research Council Human Genetics Unit, Edinburgh,
United Kingdom: Ian J. Jackson.
At Agencourt Bioscience Corp, Beverly, Massachusetts, United States of
America: Marc J. Rubenfield, Andrea M. Rogosin, and Douglas R. Smith.
Lineage-Specific Biology of the Mouse
PLoS Biology | www.plosbiology.org 14 May 2009 | Volume 7 | Issue 5 | e1000112
Author Contributions
The author(s) have made the following declarations about their
contributions: Conceived and designed the experiments: DMC LG DCS
KLT CPP. Performed the experiments: DMC LG LWH MZ SG XS CJB
RA JLC MD WH YK PM DM ZB ACM TG SZ BT KP CC MP JH RR
DF JAL ZC TMGSC. Analyzed the data: DMC LG LWH MZ SG XS
CJB DCS ZC EEE CPP. Contributed reagents/materials/analysis tools:
DMC LG. Wrote the paper: DMC LG LWH MZ KLT EEE CPP.
References
1. Murphy WJ, Pringle TH, Crider TA, Springer MS, Miller W (2007) Using
genomic data to unravel the root of the placental mammal phylogeny. Genome
Res 17: 413–421.
2. Rossant J, McKerlie C (2001) Mouse-based phenogenomics for modelling
human disease. Trends Mol Med 7: 502–507.
3. Ohno S (1970) Evolution by gene duplication. New York: Springer-Verlag.
4. Bailey JA, Gu Z, Clark RA, Reinert K, Samonte RV, et al. (2002) Recent
segmental duplications in the human genome. Science 297: 1003–1007.
5. She X, Cheng Z, Zollner S, Church DM, Eichler EE (2008) Mouse segmental
duplication and copy number variation. Nat Genet. 40: 909–914. doi:10.1038/
ng.172.
6. Nguyen D, Webber C, Hehir-Kwa J, Pfundt R, Veltman J, et al. (2008) Reduced
purifying selection prevails over positive selection in human copy number
variant evolution. Genome Res 18: 1711–1723. doi:10.1101/gr.077289.108.
7. Bailey JA, Eichler EE (2006) Primate segmental duplications: crucibles of
evolution, diversity and disease. Nat Rev Genet 7: 552–564. doi:10.1038/
nrg1895.
8. Birtle Z, Goodstadt L, Ponting C (2005) Duplication and positive selection
among hominin-specific PRAME genes. BMC Genomics 6: 120.
9. Laukaitis CM, Heger A, Blakley TD, Munclinger P, Ponting CP, et al. (2008)
Rapid bursts of androgen-binding protein (Abp) gene duplication occurred
independently in diverse mammals. BMC Evol. Biol 8: 46. doi: 10.1186/1471-
2148-8-46.
10. Jackson M, Watt AJ, Gautier P, Gilchrist D, Driehaus J, et al. (2006) A murine
specific expansion of the Rhox cluster involved in embryonic stem cell biology
is under natural selection. BMC Genomics 7: 212. doi:10.1186/1471-2148-8-46.
11. Waterston RH, Lindblad-Toh K, Birney E, Rogers J, Abril JF, et al. (2002)
Initial sequencing and comparative analysis of the mouse genome. Nature 420:
520–562.
12. Gibbs RA, Weinstock GM, Metzker ML, Muzny DM, Sodergren EJ, et al.
(2004) Genome sequence of the Brown Norway rat yields insights into
mammalian evolution. Nature 428: 493–521.
13. Initial sequence of the chimpanzee genome and comparison with the human
genome (2005) Nature 437: 69–87.
14. Lindblad-Toh K, Wade CM, Mikkelsen TS, Karlsson EK, Jaffe DB, et al. (2005)
Genome sequence, comparative analysis and haplotype structure of the domestic
dog. Nature 438: 803–819.
15. Mikkelsen TS, Wakefield MJ, Aken B, Amemiya CT, Chang JL, et al. (2007)
Genome of the marsupial Monodelphis domestica reveals innovation in non-
coding sequences. Nature 447: 167–177.
16. Gibbs RA, Rogers J, Katze MG, Bumgarner R, Weinstock GM, et al. (2007)
Evolutionary and biomedical insights from the rhesus macaque genome. Science
316: 222–234.
17. She X, Jiang Z, Clark RA, Liu G, Cheng Z, et al. (2004) Shotgun sequence
assembly and recent segmental duplications within the human genome. Nature
431: 927–930.
18. Bailey JA, Church DM, Ventura M, Rocchi M, Eichler EE (2004) Analysis of
segmental duplications and genome assembly in the mouse. Genome Res 14:
789–801.
19. International Human Genome Sequencing Consortium (2004) Finishing the
euchromatic sequence of the human genome. Nature 431: 931–945.
20. Pevzner P, Tesler G (2003) Human and mouse genomic sequences reveal
extensive breakpoint reuse in mammalian evolution. Proc Natl Acad Sci U S A
100: 7672–7677. doi:10.1073/pnas.1330369100.
21. Armengol L, Pujana MA, Cheung J, Scherer SW, Estivill X (2003) Enrichment
of segmental duplications in regions of breaks of synteny between the human and
mouse genomes suggest their involvement in evolutionary rearrangements. Hum
Mol Genet 12: 2201–2208. doi:10.1093/hmg/ddg223.
22. Chittenden L, Lu X, Cacheiro NLA, Cain KT, Generoso W, et al. (2002) A new
mouse model for autosomal recessive polycystic kidney disease. Genomics 79:
499–504. doi:10.1006/geno.2002.6731.
23. Murphy WJ, Agarwala R, Schaffer AA, Stephens R, Smith C, et al. (2005) A
rhesus macaque radiation hybrid map and comparative analysis with the human
genome. Genomics 86: 383–295. doi:10.1016/j.ygeno.2005.05.013.
24. She X, Jiang Z, Clark RA, Liu G, Cheng Z, et al. (2004) Shotgun sequence
assembly and recent segmental duplications within the human genome. Nature
431: 927–930. doi:10.1038/nature03062.
25. Venter JC, Adams MD, Myers EW, Li PW, Mural RJ, et al. (2001) The
sequence of the human genome. Science 291: 1304–1351.
26. Maksakova IA, Romanish MT, Gagnier L, Dunn CA, van de Lagemaat LN, et
al. (2006) Retroviral elements and their hosts: insertional mutagenesis in the
mouse germ line. PLoS Genet 2: e2. doi:10.1371/journal.pgen.0020002.
27. Whitelaw E, Martin DI (2001) Retrotransposons as epigenetic mediators of
phenotypic variation in mammals. Nat Genet 27: 361–365. doi:10.1038/86850.
28. Marques-Bonet T, Kidd JM, Ventura M, Graves TA, Cheng Z, et al. (2009) Aburst of segmental duplications in the genome of the African great ape ancestor.
Nature 457: 877–481. doi:10.1038/nature07744.
29. National Center for Biotechnology Information. NCBI Annotation Information.Available: http://www.ncbi.nlm.nih.gov/projects/genome/guide/build.shtml.
Accessed 24 February 2009.
30. Ensembl. Gene Annotation. Available: http://www.ensembl.org/info/docs/genebuild/index.html. Accessed 24 February 2009.
31. Huang H, Winter EE, Wang H, Weinstock KG, Xing H, et al. (2004)
Evolutionary conservation and selection of human disease gene orthologs in therat and mouse genomes. Genome Biol 5: R47.
32. Goodstadt L, Ponting CP (2006) Phylogenetic reconstruction of orthology,
paralogy, and conserved synteny for dog and human. PLoS Comput Biol 2:e133. doi:10.1371/journal.pcbi.0020133.
33. Goodstadt L, Heger A, Webber C, Ponting CP (2007) An analysis of the gene
complement of a marsupial, Monodelphis domestica: evolution of lineage-specific genes and giant chromosomes. Genome Res 17: 969–981.
34. Clamp M, Fry B, Kamal M, Xie X, Cuff J, et al. (2007) Distinguishing protein-
coding and noncoding genes in the human genome. Proc Natl Acad Sci U S A104: 19428–19433. doi:10.1073/pnas.0709013104.
35. Rouquier S, Blancher A, Giorgi D (2000) The olfactory receptor gene repertoire
in primates and mouse: evidence for reduction of the functional fraction inprimates. Proc Natl Acad Sci U S A 97: 2870–2874.
36. Young JM, Kambere M, Trask BJ, Lane RP (2005) Divergent V1R repertoires
in five species: Amplification in rodents, decimation in primates, and asurprisingly small repertoire in dogs. Genome Res 15: 231–240.
37. Liman ER, Innan H (2003) Relaxed selective pressure on an essential
component of pheromone transduction in primate evolution. Proc Natl AcadSci U S A 100: 3328–3332.
38. Emes RD, Riley MC, Laukaitis CM, Goodstadt L, Karn RC, et al. (2004)
Comparative evolutionary genomics of androgen-binding protein genes.Genome Res 14: 1516–1529.
39. Jacobs LL, Downs WR (1994) The evolution of murine rodents in Asia. Nat Sci
Museum Monographs 8: 149–156.
40. Abd El-Aziz MM, Barragan I, O’Driscoll CA, Goodstadt L, Prigmore E, et al.(2008) EYS, encoding an ortholog of Drosophila spacemaker, is mutated in
autosomal recessive retinitis pigmentosa. Nat Genet. 40: 1285–1287.
41. Soderlund D, Canto P, Mendez JP (2002) Identification of three novel mutationsin the KAL1 gene in patients with Kallmann syndrome. J Clin Endocrinol
Metab 87: 2589–2592.
42. Ross MT, Grafham DV, Coffey AJ, Scherer S, McLay K, et al. (2005) The DNAsequence of the human X chromosome. Nature 434: 325–337.
43. Perry J, Palmer S, Gabriel A, Ashworth A (2001) A short pseudoautosomal
region in laboratory mice. Genome Res 11: 1826–1832.
44. Kipling D, Wilson HE, Thomson EJ, Lee M, Perry J, et al. (1996) Structuralvariation of the pseudoautosomal region between and within inbred mouse
strains. Proc Natl Acad Sci U S A 93: 171–175.
45. Bolliger MF, Pei J, Maxeiner S, Boucard AA, Grishin NV, et al. (2008)Unusually rapid evolution of Neuroligin-4 in mice. Proc Natl Acad Sci U S A
105: 6421–6426. doi:10.1073/pnas.0801383105.
46. Salido EC, Li XM, Yen PH, Martin N, Mohandas TK, et al. (1996) Cloning andexpression of the mouse pseudoautosomal steroid sulphatase gene (Sts). Nat
Genet 13: 83–86. doi:10.1038/ng0596-83.
47. Spiess A, Walther N, Muller N, Balvers M, Hansis C, et al. (2003) SPEER–a newfamily of testis-specific genes from the mouse. Biol Reprod 68: 2044–2054.
48. Iida H, Ichinose J, Kaneko T, Mori T, Shibata Y (2004) Complementary DNA
cloning of rat spetex-1, a spermatid-expressing gene-1, encoding a 63 kDacytoplasmic protein of elongate spermatids. Mol Reprod Dev 68: 385–393.
49. Tu S, Shin Y, Zago WM, States BA, Eroshkin A, et al. (2007) Takusan: a large
gene family that regulates synaptic activity. Neuron 55: 69–85.
50. Dade S, Callebaut I, Mermillod P, Monget P (2003) Identification of a newexpanding family of genes characterized by atypical LRR domains. Localization
of a cluster preferentially expressed in oocyte. FEBS Lett 555: 533–538.
51. Lammers JHM, Offenberg HH, Van Aalderen M, Vink ACG, Dietrich AJJ, etal. (1994) : The gene encoding a major component of synaptonemal complexes
of rat is related to X-linked lymphocyte-regulated genes. Mol Cell Biol; 14:1137–1146.
52. Oh B, Hwang SY, Solter D, Knowles BB (1997) : Spindlin, a major maternal
transcript expressed in the mouse during the transition from oocyte to embryo.Development, 124: 493–503.
53. Reynard LN, Turner JM, Cocquet J, Mahadevaiah SK, Toure A, et al. (2007) :
Expression analysis of the mouse multi-copy X-linked gene Xlr-related, meiosis-regulated (Xmr), reveals that Xmr encodes a spermatid-expressed cytoplasmic
protein, SLX/XMR. Biol Reprod, 77: 329–35. doi: 10.1095/biolre-
prod.107.061101.
Lineage-Specific Biology of the Mouse
PLoS Biology | www.plosbiology.org 15 May 2009 | Volume 7 | Issue 5 | e1000112
54. Toure A, Grigoriev V, Mahadevaiah SK, Rattigan A, Ojarikre OA, et al. (2004)
: A protein encoded by a member of the multicopy Ssty gene family located onthe long arm of the mouse Y chromosome is expressed during sperm
development. Genomics 83: 140–147. doi:10.1016/S0888-7543(03)00216-7.
55. Charlesworth B, Coyne JA, Barton (1987) : The Relative Rates of Evolution ofSex Chromosomes and Autosomes. N. Am. Nat. 130: 113–146. doi: 10.1086/
284701.56. Ellis PJI, Clemente EJ, Ball P, Toure A, Ferguson L, et al. (2005) Deletions on
mouse Yq lead to upregulation of multiple X- and Y-linked transcripts in
spermatids. Hum Mol Genet 14: 2705–2715. doi:10.1093/hmg/ddi304.57. Mueller JL, Mahadevaiah SK, Park PJ, Warburton PE, Page DC, et al. (2008) :
The mouse X chromosome is enriched for multicopytestis genes showingpostmeiotic expression. Nat Genet. 40: 794–799. doi:10.1038/ng.126.
58. Skaletsky H, Kuroda-Kawaguchi T, Minx PJ, Cordum HS, Hillier L, et al.(2003) The male-specific region of the human Y chromosome is a mosaic of
discrete sequence classes. Nature 423: 825–837.
59. Emes RD, Goodstadt L, Winter EE, Ponting CP (2003) Comparison of thegenomes of human and mouse lays the foundation of genome zoology. Hum
Mol Genet 12: 701–709.60. Griffiths-Jones S, Saini HK, van Dongen S, Enright AJ (2008) miRBase: tools for
microRNA genomics. Nucleic Acids Res 36: D154–8. doi:10.1093/nar/
gkm952.61. Okazaki Y, Furuno M, Kasukawa T, Adachi J, Bono H, et al. (2002) Analysis of
the mouse transcriptome based on functional annotation of 60,770 full-lengthcDNAs. Nature 420: 563–573. doi:10.1038/nature01266.
62. Carninci P, Kasukawa T, Katayama S, Gough J, Frith MC, et al. (2005) Thetranscriptional landscape of the mammalian genome. Science 309: 1559–1563.
63. Ponjavic J, Ponting CP, Lunter G (2007) Functionality or transcriptional noise?
Evidence for selection within long noncoding RNAs. Genome Res 17: 556–565.doi:10.1101/gr.6036807.
64. Stevens JC, Banks GT, Festing MFW, Fisher EMC (2007) Quiet mutations ininbred strains of mice. Trends Mol Med 13: 512–519. doi:10.1016/
j.molmed.2007.10.001.
65. Grubb SC, Maddatu TP, Bult CJ, Bogue MA (2009) Mouse phenome database.Nucleic Acids Res 37: D720–30. doi:10.1093/nar/gkn778.
66. Justice MJ (2000) Capitalizing on large-scale mouse mutagenesis screens. NatRev Genet 1: 109–115.
67. Collins FS, Finnell RH, Rossant J, Wurst W (2007) A new partner for theinternational knockout mouse consortium. Cell 129: 235.
68. Nicholas TJ, Cheng Z, Ventura M, Mealey K, Eichler EE, et al. (2009) The
genomic architecture of segmental duplications and associated copy numbervariants in dogs. Genome Res 19: 491–799.
69. Eid J, Fehr A, Gray J, Luong K, Lyle J, et al. (2009) Real-time DNA sequencing
from single polymerase molecules. Science 323: 133–138. doi:10.1126/
science.1162986.
70. Varki A, Altheide TK (2005) Comparing the human and chimpanzee genomes:
searching for needles in a haystack. Genome Res 15: 1746–1758. doi:10.1101/
gr.3737405.
71. Martin RD (2003) Human reproduction: a comparative background for medical
hypotheses. J Reprod Immunol 59: 111–135.
72. Knockout Mouse Project (KOMP) ::Home. Available: http://www.knock-
outmouse.org/. Accessed 24 February 2009.
73. BAC Clones distribution center - BACPAC Resources Center. Available:
http://bacpac.chori.org/. Accessed 24 February 2009.
74. Gregory SG, Sekhon M, Schein J, Zhao S, Osoegawa K, et al. (2002) A physical
map of the mouse genome. Nature 418: 743–750.
75. Aluru S (2005) Handbook of computational molecular biology. 1st ed. Boca
Raton (Florida): Chapman & Hall/CRC.
76. RepeatMasker Home Page. Available: http://www.repeatmasker.org/. Ac-
cessed 24 February 2009.
77. Morgulis A, Gertz EM, Schaffer AA, Agarwala R (2006) WindowMasker:
window-based masker for sequenced genomes. Bioinformatics 22: 134–141.
78. Altschul SF, Gish W, Miller W, Myers EW, Lipman DJ (1990) Basic local
alignment search tool. J Mol Biol 215: 403–410. doi:10.1006/jmbi.1990.9999.
79. Lift Genome Annotations. Available: http://genome.ucsc.edu/cgi-bin/hgLift-
Over. Accessed 24 February 2009.
80. ftp://hgdownload.cse.ucsc.edu/apache/htdocs/goldenPath/mm8/database/
Accessed 24 February 2009.
81. Dietrich WF, Miller J, Steen R, Merchant MA, Damron-Boles D, et al. (1996) A
comprehensive genetic map of the mouse genome. Nature 380: 149–152.
82. Hudson TJ, Church DM, Greenaway S, Nguyen H, Cook A, et al. (2001) A
radiation hybrid map of mouse genes. Nat Genet 29: 201–205.
83. Pruitt KD, Tatusova T, Maglott DR (2007) NCBI reference sequences (RefSeq):
a curated non-redundant sequence database of genomes, transcripts and
proteins. Nucleic Acids Res 35: D61–5.
84. Dimalanta ET, Lim A, Runnheim R, Lamers C, Churas C, et al. (2004) A
microfluidic system for large DNA molecule arrays. Anal Chem 76: 5293–5301.
doi:10.1021/ac0496401.
85. Zhou S, Bechner MC, Place M, Churas CP, Pape L, et al. (2007) Validation of
rice genome sequence by optical mapping. BMC Genomics 8: 278. doi:10.1186/
1471-2164-8-278.
86. Valouev A, Li L, Liu Y, Schwartz DC, Yang Y, et al. (2006) Alignment of optical
maps. J Comput Biol 13: 442–462. doi:10.1089/cmb.2006.13.442.
Lineage-Specific Biology of the Mouse
PLoS Biology | www.plosbiology.org 16 May 2009 | Volume 7 | Issue 5 | e1000112