linearity of coriolis mass flowmeters - vsl · 3! march 26, 2014 5 mass flow w/coriolis flowmeters...
TRANSCRIPT
1!
Linearity of Coriolis Mass Flowmeters Dean Standiford Director Global Calibration Quality
March 26, 2014 2
Overview !! Purpose:
–! To answer the customer’s question, “How do I know the output from my Coriolis flow meter is valid beyond the calibrated mass flow range?”
!! Scope: –! High Capacity Coriolis flow meters
•! 6”, 8”, 10” •! >25% of maximum flow range •! Based on water calibration
2!
March 26, 2014 3
Summary Coriolis flowmeters are inherently linear devices. Each Coriolis flowmeter has a unique mass flow calibration constant (flow calibration factor, FCF), that when determined correctly, is valid for the entire operating mass flow range.
March 26, 2014 4
Agenda !! Coriolis mass flow equation
!! Calibration processes
!! Mass Flow Linearity Results
!! Validating the Calibration
!! Conclusion

3!
March 26, 2014 5
Mass Flow w/Coriolis Flowmeters !! Basic Measurement Measuring tubes are forced to oscillate producing a sine wave. At zero flow, the two tubes vibrate in phase with each other. When flow is introduced, the Coriolis forces cause the tubes to twist resulting in a phase shift. The time difference between the sine waves is measured and is directly proportional to mass flow rate.
!"#$%
&'()$(%*"+,-..%/"01)2+$#$3(%
43)$(%*"+,-..%/"01)2+$#$3(%
!"#$%"&#
!"#$% !"#$%&"''$($)*$%
+,-.$-%/"*01''%&"23.4*$#$)-%
5).$-%/"*01''%&"23.4*$#$)-%
!"#$%&'()%
March 26, 2014 6
Coriolis Mass Flow Equation !! Mathematical Derivation Force:
(1) Coriolis Force, named for Gustav Coriolis
(2)
Because the direction of the flow changes between the inlet and outlet tube, the direction of the force changes.
As the tube vibrates about axis “o”, an oscillation moment develops:
(3)
Since: , combine equations (2) & (3)
or (4)
!"#$%&""#'()""#!
!"#$%&'(""#)*""#+!
! " #$%%%&'$ ( #)%%%%&')!
!"###$ % !&####$'(')" % )&!
! " #$%& " #&'#()**%+*%,! ! " #$%&''()'(!
4!
March 26, 2014 7
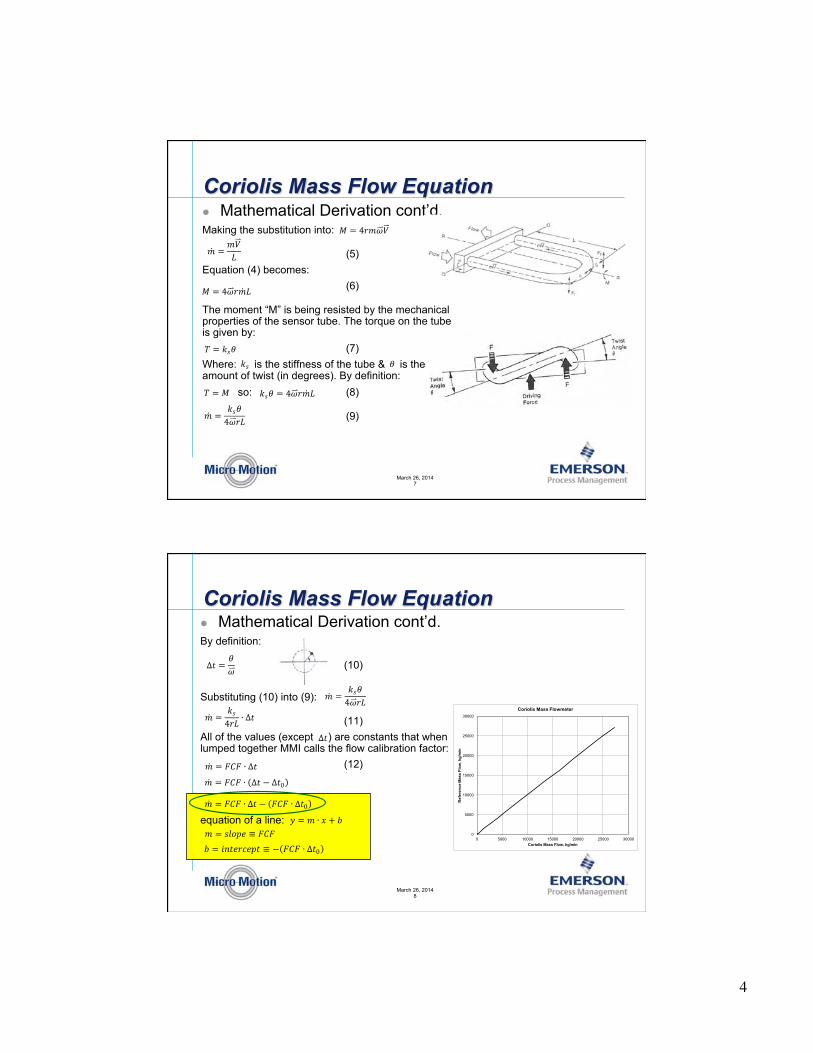
Coriolis Mass Flow Equation !! Mathematical Derivation cont’d. Making the substitution into:
(5) Equation (4) becomes:
(6)
The moment “M” is being resisted by the mechanical properties of the sensor tube. The torque on the tube is given by:
(7) Where: is the stiffness of the tube & is the amount of twist (in degrees). By definition: so: (8)
(9)
!" #!$%&'
!
! " #$%%&'() *!
! " #$%!!" ! !!
! " #! !"# $ %&''()*+ ,!
!" #$%&'())*+,
!
! " #$%&''()'(!
March 26, 2014 8
Coriolis Mass Flow Equation !! Mathematical Derivation cont’d. By definition:
(10) Substituting (10) into (9):
(11) All of the values (except ) are constants that when lumped together MMI calls the flow calibration factor:
(12)
equation of a line:
!" #$%&&'!
!" #$%&'(
) *+!
!" # $%$ & '(!
! " # $ % & '!
!"!
!" # $%$ & '() * ()+,!
0
5000
10000
15000
20000
25000
30000
0 5000 10000 15000 20000 25000 30000
Ref
eren
ce M
ass
Flow
, kg/
min
Coriolis Mass Flow, kg/min
Coriolis Mass Flowmeter
!" # $%$ & '( ) *$%$ & '(+,!
! " #$%&' ( )*)!
!" #$%&'())*+,
!
! " #$%&'(&)% * +,-.- / 0%12!

5!
March 26, 2014 9
Calibration Processes !! Calibration operation that, under specified conditions, in a first step, establishes a relation between the quantity values with measurement uncertainties provided by measurement standards and corresponding indications with associated measurement uncertainties and, in a second step, uses this information to establish a relation for obtaining a measurement result from an indication.
NOTE 1 A calibration may be expressed by a statement, calibration function, calibration diagram, calibration curve, or calibration table. In some cases, it may consist of an additive or multiplicative correction of the indication with associated measurement uncertainty.
NOTE 2 Calibration should not be confused with adjustment of a measuring system, often
mistakenly called “self-calibration”, nor with verification of calibration VIM – International vocabulary of metrology, Basic and general concepts and terms (JCGM 200:2008)
March 26, 2014 10
Calibration Processes !! calibration - The comparison of measuring
equipment of unknown measurement uncertainty to a reference standard of known measurement uncertainty to determine an estimate of the error. –! Such as: comparing the reading of a flow meter to a calibrated
reference to determine the estimate of error (step 1), which can then be used to adjust the flow meter output if required (step 2).
!! verification - Evidence by calibration that specified requirements have been met. –! A decision made by analyzing the calibration data.
6!
March 26, 2014 11
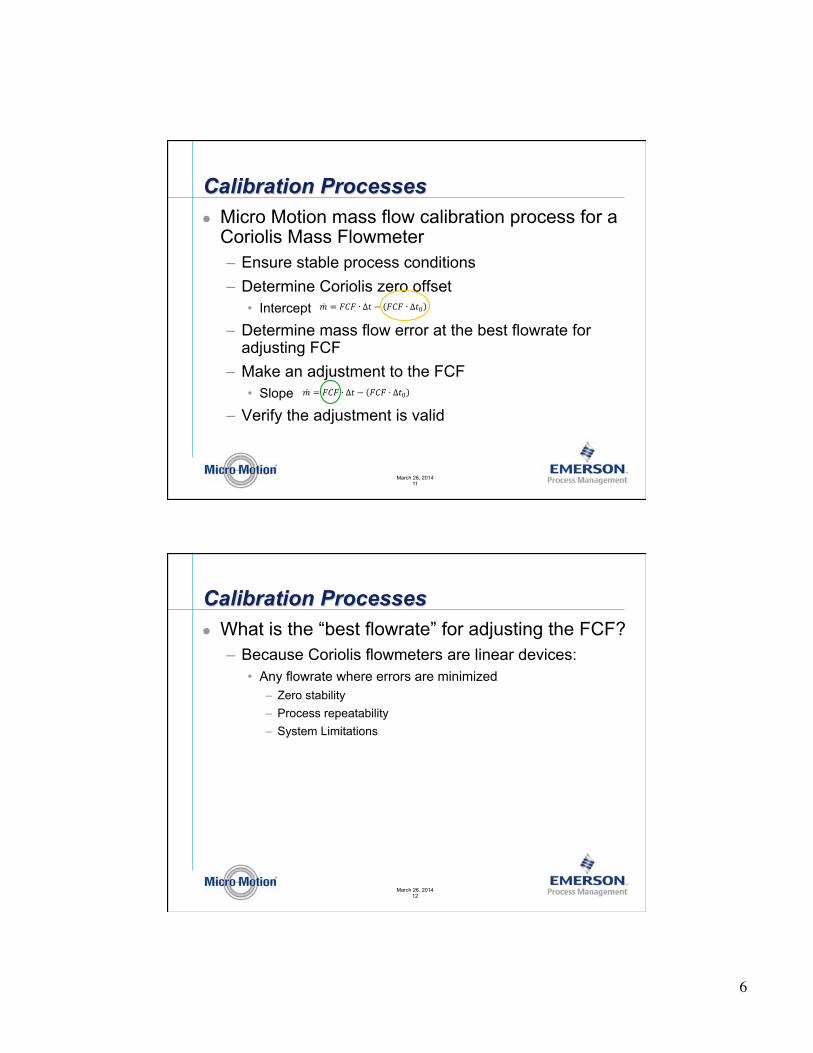
Calibration Processes !! Micro Motion mass flow calibration process for a
Coriolis Mass Flowmeter –! Ensure stable process conditions –! Determine Coriolis zero offset
•! Intercept
–! Determine mass flow error at the best flowrate for adjusting FCF
–! Make an adjustment to the FCF •! Slope
–! Verify the adjustment is valid
!" # $%$ & '( ) *$%$ & '(+,!
!" # $%$ & '( ) *$%$ & '(+,!
March 26, 2014 12
Calibration Processes !! What is the “best flowrate” for adjusting the FCF?
–! Because Coriolis flowmeters are linear devices: •! Any flowrate where errors are minimized
–! Zero stability –! Process repeatability –! System Limitations
7!
March 26, 2014 13
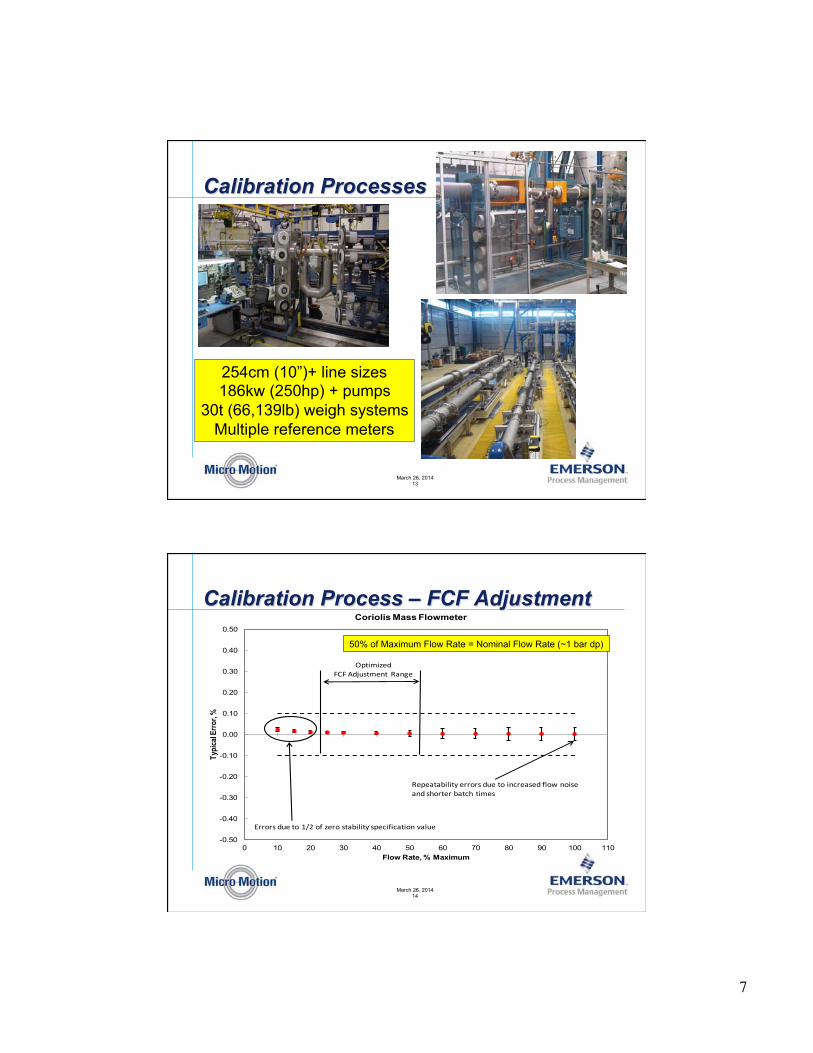
Calibration Processes
254cm (10”)+ line sizes 186kw (250hp) + pumps
30t (66,139lb) weigh systems Multiple reference meters
March 26, 2014 14
Calibration Process – FCF Adjustment
-0.50
-0.40
-0.30
-0.20
-0.10
0.00
0.10
0.20
0.30
0.40
0.50
0 10 20 30 40 50 60 70 80 90 100 110
Typi
cal E
rror,
%
Flow Rate, % Maximum
Coriolis Mass Flowmeter
!"#"$%$&'('%)*"++,+-*./"*%,*'01+"$-".*2(,3*0,'-"$0.*-4,+%"+*&$%14*%'5"-
6++,+- ./"*%,*789*,2*:"+,*-%$&'('%)*-#"1'2'1$%',0*;$(/"
<#%'5':".=>= ?.@/-%5"0%* !$0A"
50% of Maximum Flow Rate = Nominal Flow Rate (~1 bar dp)
8!
March 26, 2014 15
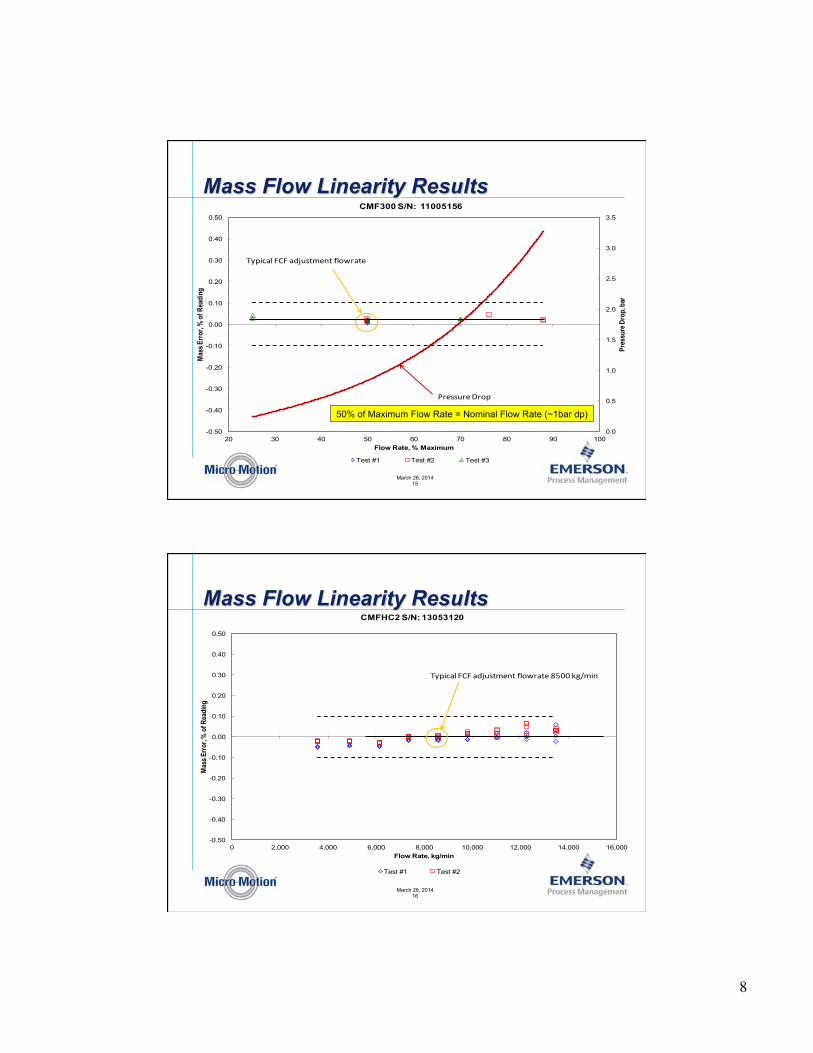
Mass Flow Linearity Results
0.0
0.5
1.0
1.5
2.0
2.5
3.0
3.5
-0.50
-0.40
-0.30
-0.20
-0.10
0.00
0.10
0.20
0.30
0.40
0.50
20 30 40 50 60 70 80 90 100
Pres
sure
Dro
p, ba
r
Mas
s Erro
r, %
of R
eadi
ng
Flow Rate, % Maximum
CMF300 S/N: 11005156
Test #1 Test #2 Test #3
!"#$%&'()*)(&+,-./012/(3'456&/1(
761..-61(864#
50% of Maximum Flow Rate = Nominal Flow Rate (~1bar dp)
March 26, 2014 16
Mass Flow Linearity Results
-0.50
-0.40
-0.30
-0.20
-0.10
0.00
0.10
0.20
0.30
0.40
0.50
0 2,000 4,000 6,000 8,000 10,000 12,000 14,000 16,000
Mas
s Erro
r, %
of R
eadi
ng
Flow Rate, kg/min
CMFHC2 S/N: 13053120
Test #1 Test #2
!"#$%&'()*)(&+,-./012/(3'456&/1(7899(:;<0$2

9!
March 26, 2014 17
Mass Flow Linearity Results
-0.50
-0.40
-0.30
-0.20
-0.10
0.00
0.10
0.20
0.30
0.40
0.50
0 2000 4000 6000 8000 10000 12000 14000 16000 18000 20000
Mas
s Erro
r, %
of R
eadi
ng
Mass Flow Rate, kg/min
CMFHC3 S/N: 12074130
USA Netherlands China
Typical FCF adjustment flowrate = 12,000 kg/min
March 26, 2014 18
Mass Flow Linearity Results
-0.50
-0.40
-0.30
-0.20
-0.10
0.00
0.10
0.20
0.30
0.40
0.50
0 5000 10000 15000 20000 25000 30000
Mas
s Erro
r, %
of R
eadi
ng
Flow Rate, kg/min
CMFHC4 S/N: 12074922
USA China Test #1 China Test #2
Typical FCF adjustment flowrate = 12,000 kg/min
10!
March 26, 2014 19
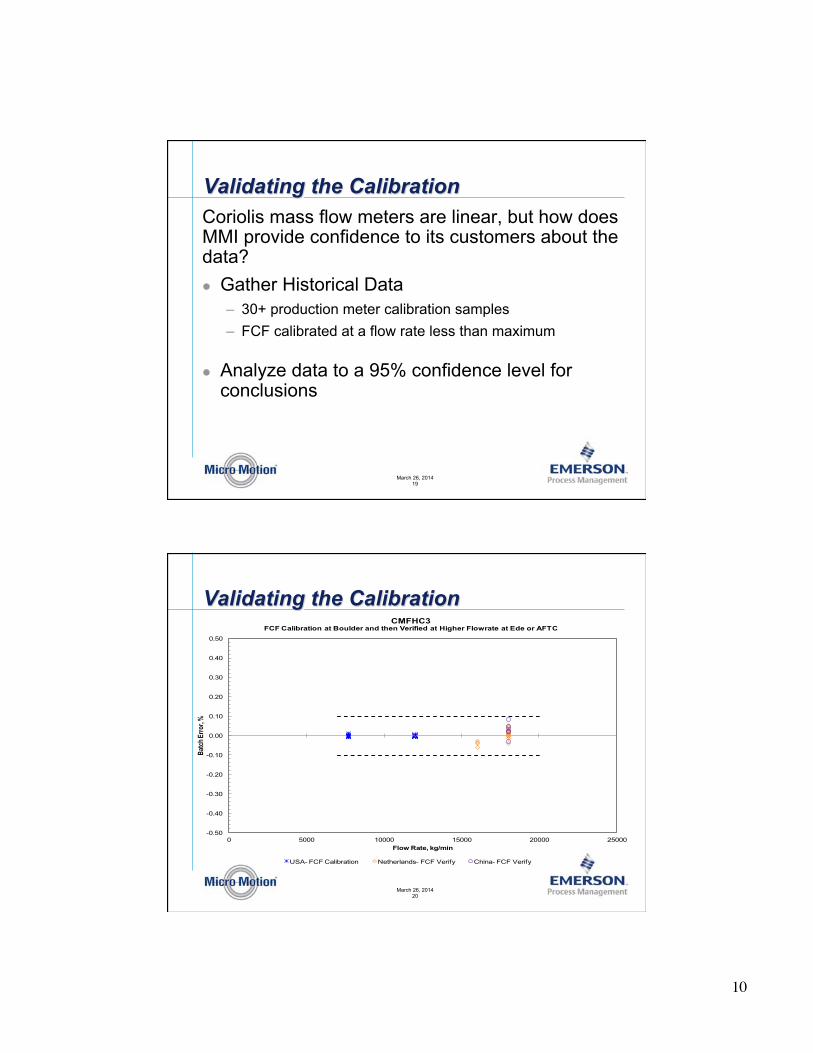
Validating the Calibration Coriolis mass flow meters are linear, but how does MMI provide confidence to its customers about the data? !! Gather Historical Data
–! 30+ production meter calibration samples –! FCF calibrated at a flow rate less than maximum
!! Analyze data to a 95% confidence level for conclusions
March 26, 2014 20
Validating the Calibration
-0.50
-0.40
-0.30
-0.20
-0.10
0.00
0.10
0.20
0.30
0.40
0.50
0 5000 10000 15000 20000 25000
Batch
Erro
r, %
Flow Rate, kg/min
CMFHC3FCF Calibration at Boulder and then Verified at Higher Flowrate at Ede or AFTC
USA- FCF Calibration Netherlands- FCF Verify China- FCF Verify
11!
March 26, 2014 21
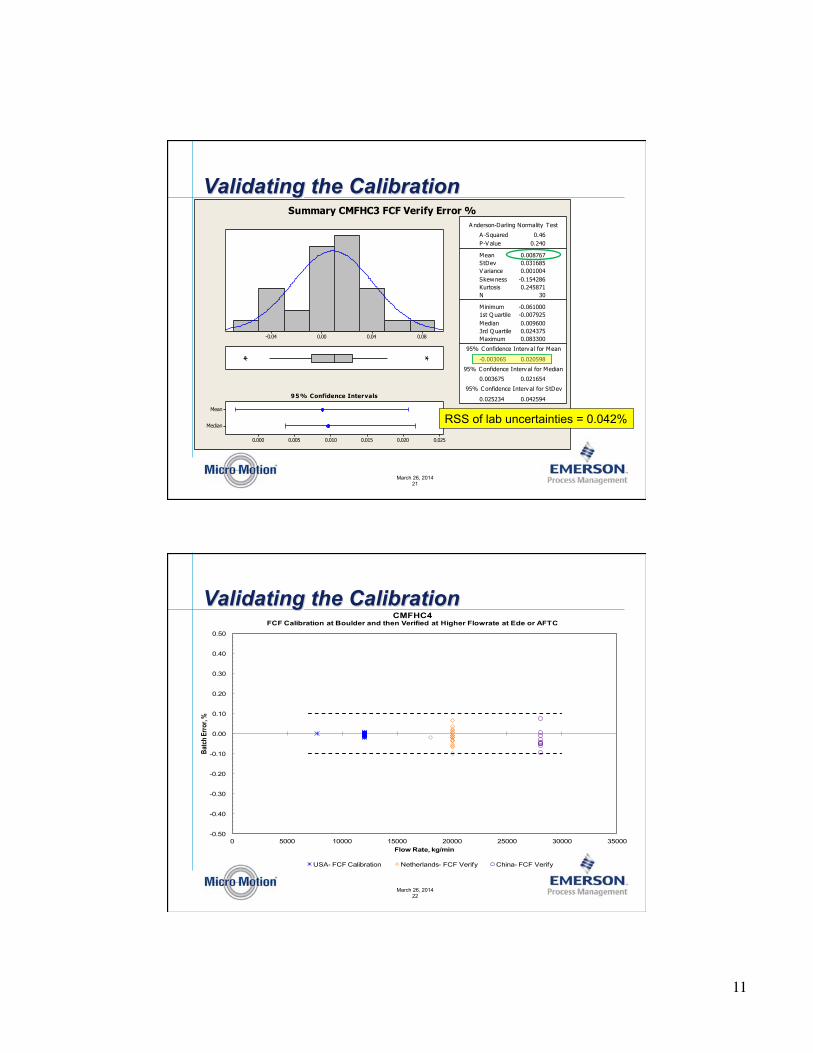
Validating the Calibration
0.080.040.00-0.04
Median
Mean
0.0250.0200.0150.0100.0050.000
1st Q uartile -0.007925Median 0.0096003rd Q uartile 0.024375Maximum 0.083300
-0.003065 0.020598
0.003675 0.021654
0.025234 0.042594
A -Squared 0.46P-V alue 0.240
Mean 0.008767StDev 0.031685V ariance 0.001004Skewness -0.154286Kurtosis 0.245871N 30
Minimum -0.061000
A nderson-Darling Normality Test
95% C onfidence Interv al for Mean
95% C onfidence Interv al for Median
95% C onfidence Interv al for StDev95% Confidence Intervals
Summary CMFHC3 FCF Verify Error %
RSS of lab uncertainties = 0.042%
March 26, 2014 22
Validating the Calibration
-0.50
-0.40
-0.30
-0.20
-0.10
0.00
0.10
0.20
0.30
0.40
0.50
0 5000 10000 15000 20000 25000 30000 35000
Batc
h Erro
r, %
Flow Rate, kg/min
CMFHC4FCF Calibration at Boulder and then Verified at Higher Flowrate at Ede or AFTC
USA- FCF Calibration Netherlands- FCF Verify China- FCF Verify
12!
March 26, 2014 23
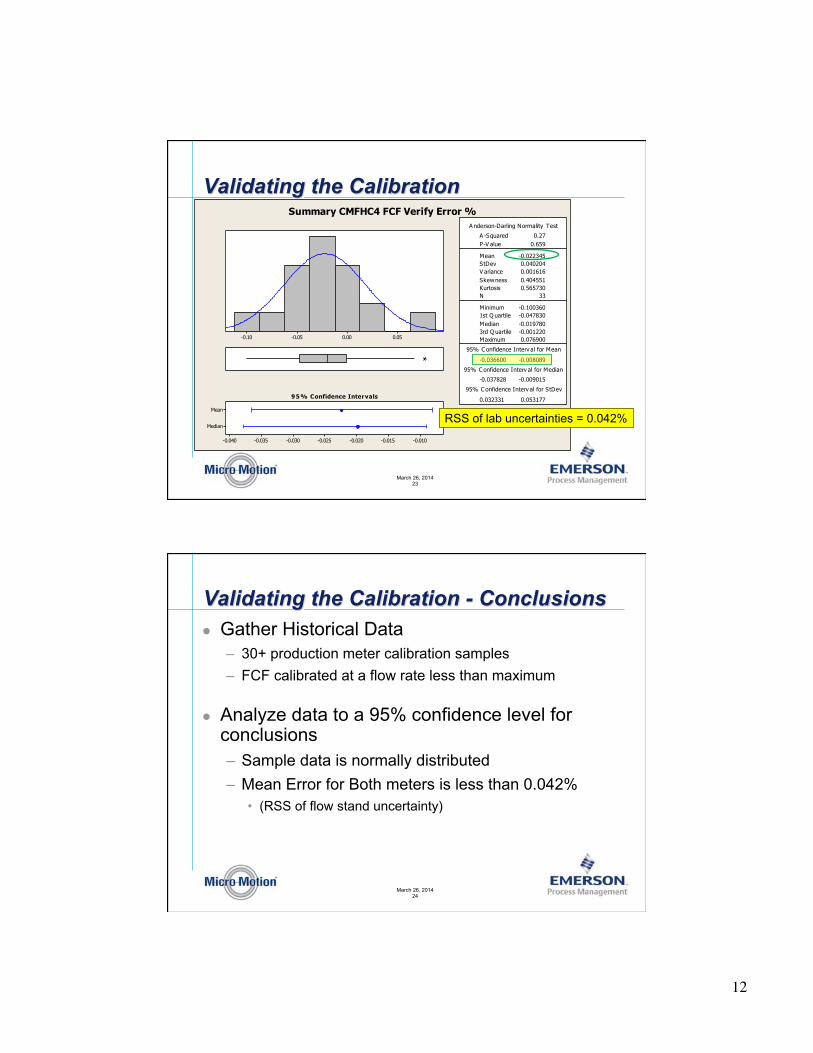
Validating the Calibration
0.050.00-0.05-0.10
Median
Mean
-0.010-0.015-0.020-0.025-0.030-0.035-0.040
1st Q uartile -0.047830Median -0.0197803rd Q uartile -0.001220Maximum 0.076900
-0.036600 -0.008089
-0.037828 -0.009015
0.032331 0.053177
A -Squared 0.27P-V alue 0.659
Mean -0.022345StDev 0.040204V ariance 0.001616Skewness 0.404551Kurtosis 0.565730N 33
Minimum -0.100360
A nderson-Darling Normality Test
95% C onfidence Interv al for Mean
95% C onfidence Interv al for Median
95% C onfidence Interv al for StDev95% Confidence Intervals
Summary CMFHC4 FCF Verify Error %
RSS of lab uncertainties = 0.042%
March 26, 2014 24
Validating the Calibration - Conclusions !! Gather Historical Data
–! 30+ production meter calibration samples –! FCF calibrated at a flow rate less than maximum
!! Analyze data to a 95% confidence level for conclusions –! Sample data is normally distributed –! Mean Error for Both meters is less than 0.042%
•! (RSS of flow stand uncertainty)
13!
March 26, 2014 25
Conclusion Coriolis flowmeters are inherently linear devices. Each Coriolis flowmeter has a unique mass flow calibration constant (flow calibration factor, FCF), that when determined correctly, is valid for the entire operating mass flow range.
Mass Flow Error is within the meter specification when FCF is calibrated at less than maximum flow rate.