link-11 fault isolation -
TRANSCRIPT

CHAPTER 5
LINK-11 FAULT ISOLATION
INTRODUCTION
A communications network, such as the Link-11 system, can be very complexwhen the goal is to maintain high-quality communications with all units in the net.Distance, atmospheric anomalies, corrosion, and even the time of day can affect thequality of Link-11 communications. The Link-11 technician has many tools toenable him to pinpoint problems. However, oftentimes the technician maymisunderstand such tools, forget them, or not have the knowledge to use themeffectively.
Problems occurring with Link-11 communications are best approached by meansof the team concept. A typical link team is usually composed of a team leader, anET, a FC, an OS, and an RM. The team leader is usually a senior ET and could bethe electronics material officer (EMO) or combat systems maintenance officer.
After completing this chapter, you should be able to:
Describe the procedures required for running single stationProgrammed Operational and Functional Appraisal (POFA) on theDTS.
State the circuits verified by the successful completion of single stationPOFA.
Describe the procedures for running multi-station Link-n POFA.
Describe the components of the LMS-11.
Describe the information presented in each of the LMS-11 displaymodes.
Recognize common Link-n problems as displayed on the LMS-11.
LINK-11 MYTHS AND FACTS
When a Link-11 problem occurs, usually the link troubleshooting team is calledto the combat direction center. Here they can meet with the operator, talk to otherships in the link, and analyze the displays on the LMS-11. Through these initialsteps, the team can determine several things, such as whether the problem is local orif the entire net is experiencing problems. Because of the complexity of linkequipment, a variety of methods were used over the years to solve link problems. Ifa particular action worked once, it was often assumed that it would work in allinstances. Over the years, this led to a type of folklore or mythology on howtechnicians were to troubleshoot the link. Senior link techs would pass these myths
5 - 1

on to junior link techs and the mythology developed a life of its own. In thefollowing paragraphs, we examine some of these myths and seek to clarify the realproblems that led to the evolution of them.
Myth: Changing the NCS Will Always Solve Net Problems!
Changing the NCS may solve net problems, but only if the current NCS iscausing the problem. What is the problem? If data is not being received from a unitbecause the current NCS has entered the PU number incorrectly, shifting NCSfunctions to a station with the PU data entered correctly will solve the problem.However, it would be easier if the current NCS were simply to enter the correct PUnumbers.
When the current NCS is using a radio set with poor receiver sensitivity and ispolling on top of picket responses effectively jamming the entire net, changing theNCS is imperative. Also, if several units are not recognizing their interrogationsbecause NCS is out of range or in an RF propagation shadow, changing to a unit ina better location should improve net communications.
Myth: Changing Frequency Always Solves Net Problems!
Here again is a myth that has some basis of fact. Changing frequency is a time-consuming process. When all the procedures are not carefully followed, thenchanging the frequency induces additional problems into the net. This mythdeveloped because improperly set switch positions and patch panel configurationswere often set to the proper position during the frequency changing process. Whenthe problem is connectivity on the current frequency, the proper action is to find abetter frequency.
Myth: More Power Improves Link Performance!
This is a myth. On the transmit side, the idea behind the myth is that keeping thelink HF transmitter tuned to maximum output power will result in maximum areacoverage. In fact, constantly outputting maximum power can lead to seriousRFI/EMI problems (on the ship doing so) and will not significantly increase thesignal propagation range.
The idea behind the myth on the receive side is that by keeping the HF receiveraudio output control maximized, receive quality improves. In fact, maximizing theaudio output saturates most data terminal sets. Saturation generally occurs in theDTS at around 3 dBm. Signal inputs above this level actually increase receive dataerrors.
Myth: Dummy PUs Improve Link Quality!
A dummy PU is an address insert into the polling sequence by the NCS for whichthere is no live unit. Dummy PUs cause the net cycle time to increase and netefficiency to decrease. The idea that the NCS must use dummy PUs for the link to
5-2

operate properly is not generally true. It may be true only in infrequent, isolatedcases. Studies have shown that in the old NTDS system (CP-642 computer and theAN/USQ-36 DTS), a dummy PU entered between a live PU and own address wasrequired for NCS data to be output at each NCS report opportunity. Since theCP-642 computer and the AN/USQ-36 DTS have virtually disappeared, dummy PUsshould not be used.
Myth: Radio Silence Reduces Net Cycle Time!
The effect Radio Silence has on net cycle time depends on a number of factors.As you saw in the last chapter, if a PU does not respond to a call up in 15 frames, thePU is interrogated again. After another 15 frames, if the PU still does not respond,then NCS polls the next PU. If the PU that goes to Radio Silence was sendingreports that exceeded 38 frames, then net cycle time would be reduced by the PUgoing to Radio Silence. Effective net management would be to eliminate the PUnumber of the unit that has to go into Radio Silence until that unit is able to reenterthe net.
As you can see, there are several misconceptions on the proper way to manageand troubleshoot the Link-11 system. In this chapter, we concentrate on the toolsavailable to the technician to aid in the isolation of link problems.
LINK-11 PROGRAMMED OPERATIONALAND FUNCTIONAL APPRAISAL (POFA)
Two types of POFAs are used in the Link-11system. These are the single station POFA, used tocheck components of the Link-11 on board a singlestation, and the multi-station POFA, used to check theconnectivity of several units.
SINGLE STATION POFA
The single station POFA is an end-around test thattransfers canned data from the computer through thecrypto device and the data terminal. The singlestation POFA can also be run through the radio set tocheck out part of the audio communications pathfurther.
POFA Setup
The POFA is a special program that is loaded intothe computer. It is very important that you follow theinstruction manual when attempting to run the POFA.The POFA is designed to run in full-duplex mode.Normal link operations use the half-duplex mode.“Full duplex” means the system is configured to
transmit and receive data at the same time. In theDTS, this is accomplished by the transmit audio beingfed directly into the receive input. Also, if the DTS isoperating in full-duplex mode, the rest of the system,especially the crypto device, must be in full duplex.On the KG-40, full duplex is accomplished when thefront panel switch is turned to the POFA TESTposition.
Analyzing Single Station POFA
When a single station POFA is completed, aprintout of the results is produced. To analyze thisprintout properly, the technician must understand
Figure 5-1.—Single station POFA configurations.
5-3

what equipment is being tested. The configuration inwhich the POFA was run determines some of theequipment being tested. The POFA can be run in twoconfigurations, as shown in figure 5-1.
In the full configuration, the single station POFAwill test the following areas:
CDS compute r I /O channe l in te r rup trecognition and acceptance
Security device I/O path
Data terminal transmit and receive registers,multiplex and demultiplex, and transmit andreceive sequence operations
Switchboard integrity
DTS-to-radio and radio-to-DTS audio path
Capability of the HF radio set to develop andaccept sidebands (both transmit and receive).
By studying the above list, you can see that mostnormal link operations are tested during a singlestation POFA. Certain functions, however, are notchecked by running a single station POFA. The DTSuses the transmit timing as the reference for the entiretest; therefore, the receive timing circuitry is notchecked. Also, certain other functions, such asDoppler correction, are not checked.
The printout generated at the end of a singlestation POFA lists interrupt status, illegal interrupts,parity, and bit-by-bit word errors. A single stationPOFA should always produce a totally error-freeprintout. However, when a printout with errors isreceived, the technician needs to be able to analyzethe error package effectively.
The interrupts, for example, must occur in thefollowing sequence:
Prepare to transmit
Prepare to receive
End of receive
If you receive interrupts in any other order, such astwo consecutive prepare to transmit interrupts or anend of receive before the prepare to receive, an errorcondition exists.
The parity should always equal zero. As youlearned in the previous chapter, the parity, or errordetection status bits, indicates an error has beendetected in the received data. When errors aredetected, they are listed in the bit-by-bit section of theprintout.
Even if the printout indicates a few random biterrors, this condition should not be ignored. Randombit errors can be caused by several areas in the system,including the CDS computer, the data switchboard, orthe DTS. You can narrow down to the exact areacausing the problem by running the POFA in severalconfigurations. Changing computers and cryptodevices can aid you in determining the malfunction.
Because of the unique function of the cryptodevice, a single broken line in the switchboard couldcause all the bits to be randomly picked up orrandomly dropped. When the broken wire is on theencrypted side of the switchboard, the crypto devicereads the state of that line during the decryption cycleand the entire decryption cycle is changed.
MULTI-STATION POFA
The multi-station POFA is a test of the Link-11system that involves more than one platform.Because this POFA most closely represents normallink operations, more equipment is tested. The multi-station POFA is run in the Roll Call mode using a setof known data words. Figure 5-2 shows the data flowfor a multi-station POFA. A designated unit transmitsa block of 230 data words that are received by theother platforms involved in the multi-station POFA.The receiving computer(s) compare(s) the data againstthe known pattern, count(s) the words in error, andsend(s) this count back to the original ship. Thistransmission is known as the error status report.Ideally, the multi-station POFA should run error-free.
5 - 4
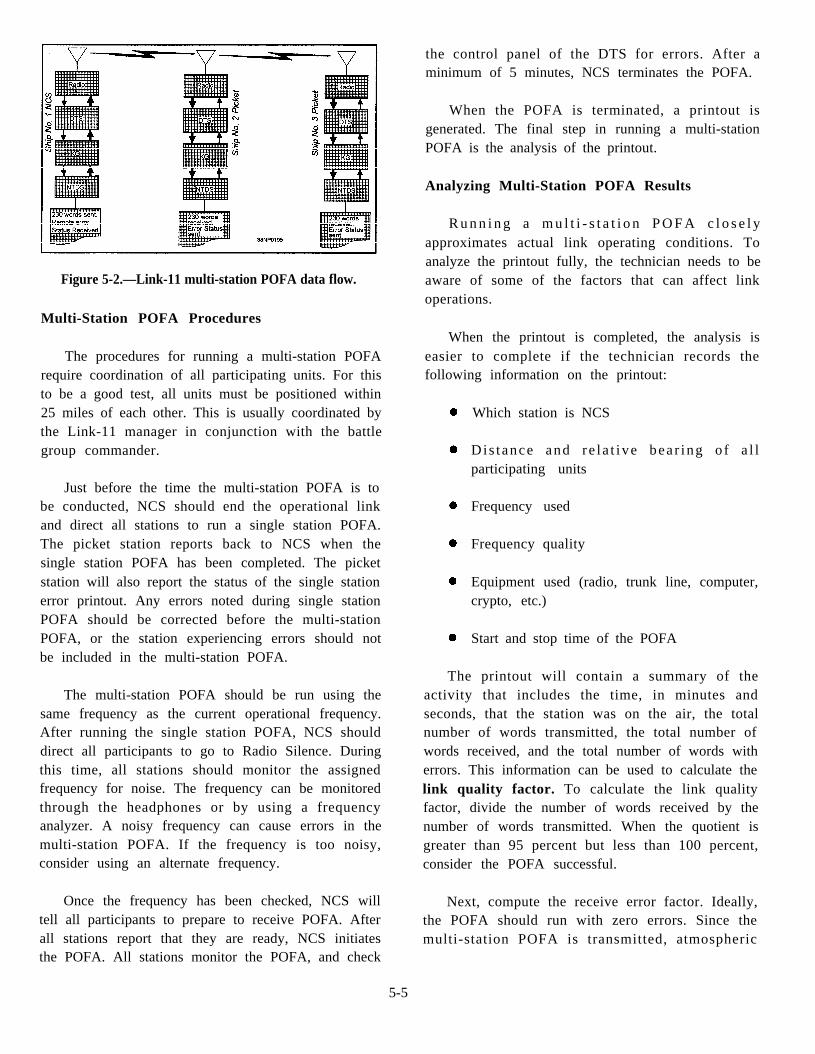
Figure 5-2.—Link-11 multi-station POFA data flow.
Multi-Station POFA Procedures
The procedures for running a multi-station POFArequire coordination of all participating units. For thisto be a good test, all units must be positioned within25 miles of each other. This is usually coordinated bythe Link-11 manager in conjunction with the battlegroup commander.
Just before the time the multi-station POFA is tobe conducted, NCS should end the operational linkand direct all stations to run a single station POFA.The picket station reports back to NCS when thesingle station POFA has been completed. The picketstation will also report the status of the single stationerror printout. Any errors noted during single stationPOFA should be corrected before the multi-stationPOFA, or the station experiencing errors should notbe included in the multi-station POFA.
The multi-station POFA should be run using thesame frequency as the current operational frequency.After running the single station POFA, NCS shoulddirect all participants to go to Radio Silence. Duringthis time, all stations should monitor the assignedfrequency for noise. The frequency can be monitoredthrough the headphones or by using a frequencyanalyzer. A noisy frequency can cause errors in themulti-station POFA. If the frequency is too noisy,consider using an alternate frequency.
Once the frequency has been checked, NCS willtell all participants to prepare to receive POFA. Afterall stations report that they are ready, NCS initiatesthe POFA. All stations monitor the POFA, and check
the control panel of the DTS for errors. After aminimum of 5 minutes, NCS terminates the POFA.
When the POFA is terminated, a printout isgenerated. The final step in running a multi-stationPOFA is the analysis of the printout.
Analyzing Multi-Station POFA Results
R u n n i n g a m u l t i - s t a t i o n P O F A c l o s e l yapproximates actual link operating conditions. Toanalyze the printout fully, the technician needs to beaware of some of the factors that can affect linkoperations.
When the printout is completed, the analysis iseasier to complete if the technician records thefollowing information on the printout:
Which station is NCS
Dis tance and re la t ive bea r ing o f a l lparticipating units
Frequency used
Frequency quality
Equipment used (radio, trunk line, computer,crypto, etc.)
Start and stop time of the POFA
The printout will contain a summary of theactivity that includes the time, in minutes andseconds, that the station was on the air, the totalnumber of words transmitted, the total number ofwords received, and the total number of words witherrors. This information can be used to calculate thelink quality factor. To calculate the link qualityfactor, divide the number of words received by thenumber of words transmitted. When the quotient isgreater than 95 percent but less than 100 percent,consider the POFA successful.
Next, compute the receive error factor. Ideally,the POFA should run with zero errors. Since themulti-station POFA is transmitted, atmospheric
5-5
interference, ship’s position, antenna location, andEMI are just a few of the things that can induce errorsin a radio signal. Determine the receive error factorby dividing the number of words with errors by thenumber of words received. When the receive errorfactor is less than 1 percent, consider the POFAsuccessful.
When the printout indicates that data was receivedfrom an unrecognized station (UNREC STA), thetechnician should check the number of wordsreceived. The multi-station POFA transmit bufferconsists of 230 words. One buffer of 230 words froman unrecognized station is acceptable and generallydoes not indicate a problem. More than one buffermay indicate a problem, but multiple buffers from anUNREC STA can also be caused by interference onthe frequency.
The printout will also indicate the parity status ofthe words received in error. During the POFA, sincethe computer knows the contents of the received datablock, it performs a parity check on all receivedwords. These parity checks are compared with theparity status received from the DTS. The printoutindicates these parity checks. The heading PARITYSTATUS OF ERROR WORDS lists the number oferror words detected by the DTS and the parity (1, 2,o r 3 ) . T h e h e a d i n g P A R I T Y S T A T U S O FCORRECT WORDS indicates the computer paritycheck of words received as correct from the DTS.When an error is detected, the number of words inerror for each of the three parity status conditions arelisted here. The final part of the printout indicates theremote station reports. These reports are sent by otherstations as part of the data transferred during thePOFA.
Since a multi-station POFA is subject to varioustypes of interference, both natural and man-made,several attempts may be required for you to achieveacceptable results. Shifting NCS and repositioningthe ships are just two of the actions that couldcontribute to achieving a successful multi-stationPOFA.
THE LINK-11 MONITORINGSYSTEM (LMS-11)
“The link is down” is a statement that can strikefear into even the most seasoned technician. As wehave seen, the operation and maintenance of a high-quality link can be affected by many factors. Foryears, operators and technicians commonly blamedeach other for poor link operations. Some typicalLink-11 problems are as follows:
Participating units (PUs) not responding tocall-ups
Garbled data
The link goes completely dead, normaloperation ceases
Inability to establish a net
Excessive net cycle time
When such a problem occurred, the Link-11technician would run a single station POFA anddeclare that the DTS was sound and it must be theother ship, a poor frequency, or an operator error. Theoperator would blame the frequency or NCS. Otherunits would say the problem was another platformjamming the entire net. Typical strategies used tos o l v e l i n k p r o b l e m s u s u a l l y b e g a n w i t h arecommendation to change frequency. When thisstrategy failed to solve the problem, the next step wasto change NCS. If the problem still existed, then NCSwould eliminate PUs from the net, one at a time untilthe problem unit was identified. All of these actionstook time and were hit-and-miss techniques. Thistendency of trial-and-error troubleshooting andpointing fingers defined the need for a reliable visualsystem of monitoring the Link-11 network.
This need was filled with the development of theLink Moni to r ing Sys tem, AN/TSQ-162(V)1 ,commonly called the LMS-11. The LMS-11 providesan operator or a technician with a real-time visualdisplay of the Link-11 network while it is operating.
The LMS-11 is capable of measuring anddisplaying link signal data for the network as a whole,
5 - 6

as well as for individual units. It can be used forperiodic equipment checks or for continuousmonitoring to determine the condition of all membersof the net.
LMS-11 SYSTEM CONFIGURATION
T h e L M S - 1 1 c o n s i s t s o f t h r e e g r o u p sequipment: a data processing group (DPG), acontrol/display group (CDG), and an accessory group(AG). The LMS-11 is shown in figure 5-3.
The LMS-11 is designed to be portable, and theequipment is installed in three carrying cases. Theequipment cases that house the electronic units of theDPG and CDG provide isolation from shock andvibration. The CDG is designed to be mounted on theD P G c a s e s . F o u r l a t c h e s f a s t e n t h e t w ounits together and provide a desk height, self-contained workstation. The system printer, which ispart of the accessory group, is mounted on the top ofthe CDG equipment case. When the LMS-11 isinstalled, the accessory group case provides storagefor the DPG and CDG equipment case covers. TheLMS-11 is normally located near the data terminal set,but it may be installed anywhere near a 600-ohmLink-11 audio signal.
Data Processing Group
The equipment required for the LMS-11 toreceive, sample, and process Link-11 audio signals iscontained in the data processing group. The DPG alsoprovides power control and distribution to the CDGand accessories. The DPG consists of the followingequipment:
The control processing unit
The audio interface unit
The dual 3.5-inch floppy disk drive unit
T h e p o w e r c o n t r o l u n i t
CONTROL PROCESSING UNIT. — T h econtrol processing unit consists of the HP9920U
Figure 5-3.—The LMS-11.
computer with an additional 2 MB of ram andassociated circuit card assemblies (CCA). Thesecircuit cards include the following:
Color output CCA
Composite Video CCA
Data communications interface
HP interface bus (HP-IB)
Analog-to-digital converter assembly
Fast Fourier Transform (FFT) processor
The color output CCA and the composite video CCAprovide the necessary signals to drive the colormonitor. The data communications interface providesan RS-232C asynchronous serial interface for thecolor printer. The HPIB is used to interface thesystem keyboard and the dual disk drives to the computer.
5-7

Figure 5-4.—The LMS-11 keyboard.
The analog-to-digital converter converts theLink-11 audio signal into a digital signal for use bythe LMS-11. This digital signal is then transferred tothe computer where the FFT converts it to a frequencydomain. The Fast Fourier Transform consists of acomplex mathematical formula used to determine thephase shift of a signal.
AUDIO INTERFACE UNIT. —The audiointerface unit connects the upper sideband (USB) andlower sideband (LSB) audio signals from an HF radioor the USB from a UHF radio to the LMS-11. Theaudio signals are input to the analog-to-digitalconverter of the control processing unit. The audiointerface unit does not add a load to the audio signal.
DUAL 3.5-INCH FLOPPY DISK DRIVEUNIT. —The dual 3.5-inch floppy drive unit is usedto load the LMS-11 programs and to record Link-11data. The disk drives use 788 Kbyte, double-sided,double-density disks.
POWER CONTROL UNIT. —The powercontrol unit provides the control, distribution, andconditioning of the 115 VAC input power.
Control/Display Group (CDG)
The CDG consists of a color graphics monitor anda keyboard. The monitor displays operator-entereddata and system operation. The keyboard provides theoperator interface with the LMS-11.
COLOR DISPLAY MONITOR. —The colordisplay monitor is capable of displaying bothcomposite and RGB video. The computer generatescomposite video during the start-up and testing of theLMS-11. The RGB input with an external sync isused for displaying graphics during normal LMS-11operations. The monitor is also equipped with aspeaker and audio input to provide the operator withthe capability of monitoring the Link-11 audio signal.
KEYBOARD. —The keyboard is mounted on atray under the monitor. Under the tray, there is a
5-8

storage slot for the LMS-11 technical manual. Thefunctional keys on the keyboard are color-coded tofacilitate operator selections and entries. The LMS-11keyboard is shown in figure 5-4.
Many of the keys on the LMS-11 keyboard are notused and the software does not recognize these keys.The actual functions of the keys are covered later inthis chapter.
Accessory Group (AG)
The accessory group contains a color graphicsprinter and spare parts and supplies for the LMS-11.The shipping container is also used to store the DPGand CDG container covers when the printer isremoved and mounted on the LMS-11. The colorgraphics printer is used to provide hard-copy printoutsof the display screen on plain paper or cleartransparency material.
LMS-11 OPERATION AND DISPLAYS
The LMS-11 provides real-time monitoring ofLink-11 operations. Problems with the net can beeasily detected in real time and you can determine thecause of the problems by evaluating the differentdisplays. When the cause is determined, the operatoror technician can take corrective action.
System Initialization
When the LMS-11 is turned on following thecorrect power-up sequence, the computer runs a groupof self-tests and it then boots the disk in drive 0.When the booting is complete, the LMS-11 monitordisplays the following message: “ B O O T I N GCOMPLETE, SWITCH TO RGB.” At this time,the operator should depress the RGB button on themonitor. The Initialization display is the first screendisplayed after the software is loaded. The operatorcan also recall the Initialization display by pressingthe INIT button of the keyboard. The Initializationdisplay screen is shown in figure 5-5.
During the initialization process, the operator isrequired to enter the following Link-11 operatingparameters:
DATE and TIME.
PRINTER. Selects which printer, if any, isbeing used with the LMS-11.
NET-MODE. Selects the Link-11 mode: NetSync, Net Test, Roll Call, Broadcast, or ShortBroadcast. The default is Roll Call.
DATA RATE. Selects whether the link isoperating in the fast or slow data rate.
FREQ-CORR. Enables or disables Dopplercorrection.
CALL-TIMEOUT. Allows the operator tospecify the number of frames for the missedcall timeout. Normal link operations is 15frames but is increased to 127 frames forsatellite link operations.
When all the required data is entered, the operatorshould select the desired mode of operation for theLMS-11. The five on-line modes are as follows:LINK MONITOR, NET, PU, SPECTRUM, andCARRIER SUPPRESSION.
Each mode has a unique display screen. Alldisplay screens consist of the following three parts:the header, the link signal or information area, and thestatus display. The header is at the top of the screena n d i n d i c a t e s t h e m o d e b e i n g d i s p l a y e d .information area is the middle section of the display,and the status display is at the bottom of the screen.The status display is the same for all on-line modes.
Link Monitor Mode
The link monitor mode display reflects linkactivity in real time. This display allows the operatoror technician to monitor link operations and detectproblems as they occur. To select the link monitormode, the operator presses the function key labeledLM. The link monitor mode display is shown infigure 5-6.
5-9

Figure 5-5.—The LMS-11 Initialization display screen.
The top lines of the link monitor display screen report ends with the interrogation of the next PU incontain the header information. The LMS-11 mode isin the top center. The link mode is centered just underthe LMS-11 mode. In figure 5-6, this is RC FAST.This means the link is in Roll Call mode, fast datarate. The right side of the header displays the date andtime. The left side of the header information allowsthe operator to enter the NCS address and thesideband to monitor. The LMS-11 uses the address 77 as a default for NCS. However, recall fromchapter 2, that 77 is an illegal address and would notbe used in an active link. Since NCS never sends aninterrogation to itself, the LMS-11 uses this address todesignate NCS.
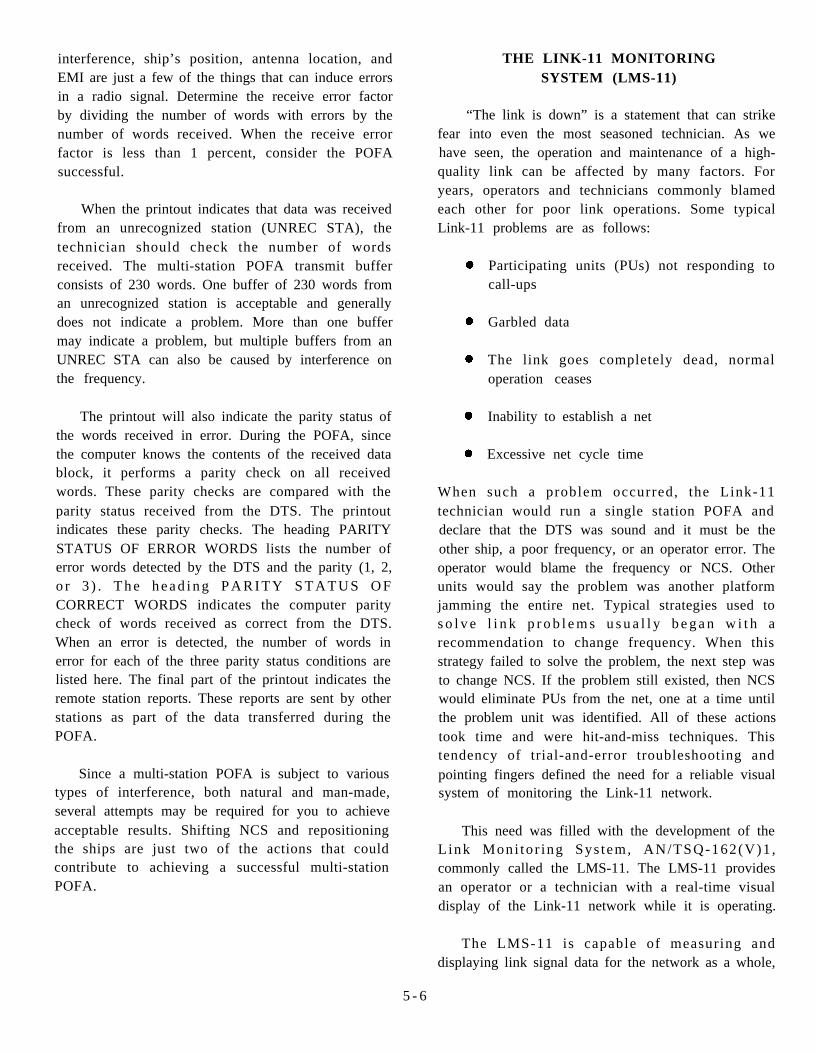
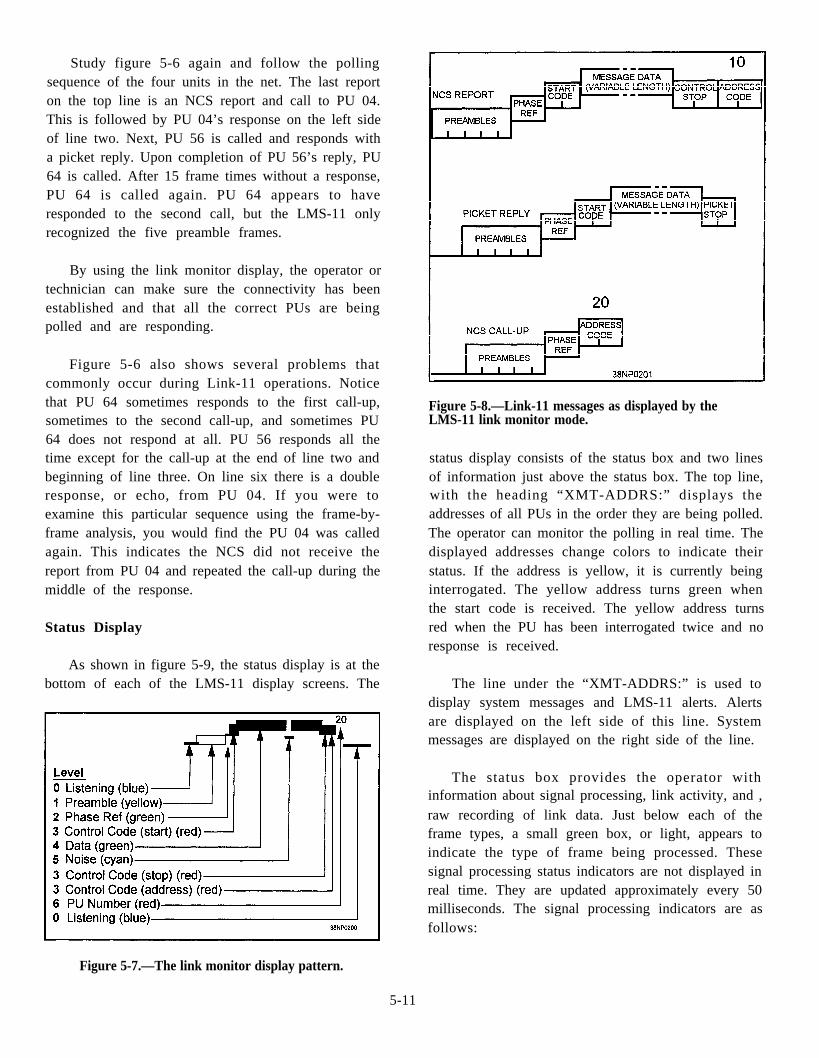
The display sweeps from left to right and from topto bottom. The display is color-coded and uses astair-step pattern that is easy to understand. Thedisplay of a single NCS report and the meaning of thecolors and levels is shown in figure 5-7. Figure 5-8shows how the different messages appear on theLMS-11 link monitor screen. Note that the NCS
the polling sequence.
Figure 5-6.—The link monitor display screen.
5-10
Study figure 5-6 again and follow the pollingsequence of the four units in the net. The last reporton the top line is an NCS report and call to PU 04.This is followed by PU 04’s response on the left sideof line two. Next, PU 56 is called and responds witha picket reply. Upon completion of PU 56’s reply, PU64 is called. After 15 frame times without a response,PU 64 is called again. PU 64 appears to haveresponded to the second call, but the LMS-11 onlyrecognized the five preamble frames.
By using the link monitor display, the operator ortechnician can make sure the connectivity has beenestablished and that all the correct PUs are beingpolled and are responding.
Figure 5-6 also shows several problems thatcommonly occur during Link-11 operations. Noticethat PU 64 sometimes responds to the first call-up,sometimes to the second call-up, and sometimes PU64 does not respond at all. PU 56 responds all thetime except for the call-up at the end of line two andbeginning of line three. On line six there is a doubleresponse, or echo, from PU 04. If you were toexamine this particular sequence using the frame-by-frame analysis, you would find the PU 04 was calledagain. This indicates the NCS did not receive thereport from PU 04 and repeated the call-up during themiddle of the response.
Figure 5-8.—Link-11 messages as displayed by theLMS-11 link monitor mode.
Status Display
As shown in figure 5-9, the status display is at thebottom of each of the LMS-11 display screens. The
status display consists of the status box and two linesof information just above the status box. The top line,with the heading “XMT-ADDRS:” displays theaddresses of all PUs in the order they are being polled.The operator can monitor the polling in real time. Thedisplayed addresses change colors to indicate theirstatus. If the address is yellow, it is currently beinginterrogated. The yellow address turns green whenthe start code is received. The yellow address turnsred when the PU has been interrogated twice and noresponse is received.
The line under the “XMT-ADDRS:” is used todisplay system messages and LMS-11 alerts. Alertsare displayed on the left side of this line. Systemmessages are displayed on the right side of the line.
The status box provides the operator withinformation about signal processing, link activity, and ,raw recording of link data. Just below each of theframe types, a small green box, or light, appears toindicate the type of frame being processed. Thesesignal processing status indicators are not displayed inreal time. They are updated approximately every 50milliseconds. The signal processing indicators are asfollows:
Figure 5-7.—The link monitor display pattern.
5-11

Figure 5-9.—The LMS-11 Status display.
LMS —Should always be green.
LSN —Indicates that the LMS-11 is listeningfor the link audio.
PRE —Indicates that a preamble has beendetected.
PHA —Indicates that a phase reference framehas been detected.
CC1 —Indicates the first frame of a controlcode.
CC2 —Indicates the second frame of a controlcode.
EOT —Indicates that the LMS-11 has detectedthe end of transmission.
NOIS —Indicates that the received data framedid not pass the data quality test.
DATA —Indicates that the LMS-11 hasdetected a data frame that has passed thequality test. Note that the control codes andphase reference frames are also data frames.
REC —Shows the status of the raw recordfunction of the LMS-11. The indicator will begreen when the recording is turned on and redwhen the recording is stopped.
The last two fields of the status box indicate theperformance of the net. The “%DATA:” field will befollowed by a number representing the percentage ofnet cycle time message data is transmitted with noerrors. The “NCT:” displays the net cycle time inseconds. Net cycle time is the time required for one
completed polling of the net. It can be measured fromcontrol stop to control stop from NCS, or the operatorcan specify a PU as the reference for net cycle time.The operator can also specify the number of cycles touse to determine net cycle time. The operator makesthese entries using the summarize parameter in theNET DISPLAY mode.
Net Display
The Net Display mode is activated when theoperator presses the NET key on the keyboard. TheNet Display mode presents the following two separatetypes of information: a Net Summary (summarizemode) or a PU History (history mode). In the NetSummary mode, the Net Display presents a summaryof quantitative information about the performance ofup to 21 PUs. In the PU History mode, the LMS-11displays data for a selected PU. The most recent 21transmissions of the specified PU will be displayedwhile in the PU History mode.
The Net Display mode is only available when thelink is in the Roll Call mode. Figure 5-10 shows ascreen for the Net Display in the Summarize modeand figure 5-11 shows the screen for a PU Historymode.
After the operator enters the Net Display mode,there are four operator entries that can affect theinformation and how it is displayed. These are NCS,PU, SIDEBAND, and SUMMARIZE. All of theentries are displayed as part of the header of the NetDisplay screen. The NCS, PU, and SIDEBANDfields are on the left side of the screen, and theSUMMARIZE field is on the right side of the screenjust below the date and time fields.
5 - 1 2

Figure 5-10.—The LMS-11 Net Display in Summarize Mode.
NCS. —The NCS field allows the operator todesignate the PU number of the NCS. When anumber is not entered in this field, the default addressof 77 is used. It will also be used as the PU number inthe polling display of the status area and in the PUfield of the Net Display.
PU. —The PU field is used by the operator todesignate the PU whose recurring transmission is usedto define a cycle. The PU field works with theSUMMARIZE field.
SIDEBAND. —The SIDEBAND field allows theoperator to designate which sideband (USB, LSB, orDIV) is used for the information displayed.
SUMMARIZE. —The SUMMARIZE fieldenables the operator to designate the number of cyclesover which the summary is computed. A “cycle” isdefined as the recurring transmission from thedesignated PU. The data is tabulated after the
specified number of transmissions are received fromthe designated PU or after 200 transmissions arereceived by any station, whichever occurs first. TheSUMMARIZE field is also used to enable the PUHistory mode. The PU History mode is entered whenthe operator enters a zero in the summary field. Whenthe PU History mode is enabled by the operator, theword HISTORY is added to the Net Display title.The PU History mode display updates one line of dataimmediately after the specified PU has completed itstransmission.
The information displayed by the Net Displaymode is described in the following paragraphs.
PU. —The PU number. The first number listed isthe NCS, which has a default number of 77, or theaddress entered in the NCS field. The rest of the PUsare listed in numerical order.
5-13

Figure 5-11.—The LMS-11 Net Display in PU History Mode.
SIG PWR. —The total signal strength of the 16tones, measured in dBm. A value of -51 indicates thatno signal was received.
SNR. —The signal-to-noise ratio, as measured indB. The SNR is calculated as the average power inthe data tones divided by the average power in thenoise tones. The LMS-11 can measure a SNR of near34 dB. A number preface by the greater than symbol“>” indicates that the average power in the noise toneswas below the measurable threshold. In this case, thenumber represents the data tone signal strength only.An SNR value of 30 or higher is considered excellent.An SNR value of less than 10 is unusable.
FRAME CNT. —A count of all data framesreceived over the specified number of cycles. Dataframes include the phase reference frame and controlcode frames in each message. A value that isfollowed by a “?” and color-coded yellow is displayedif the frame count of a picket station average is lessthan or equal to six frames. The two start code
frames, the phase reference frame, the crypto frame,and the two stop code frames would account for thesix frames. Therefore, if a picket unit transmits six orless frames, no actual message data is being receivedand may indicate a problem with the computer or DTSof the unit. A yellow color-coded value followed bythe “?” is added for an NCS when the number offrames is equal to or less than eight. The twoadditional frames account for the next station addressat the end of an NCS report.
PERCENTAGE THROUGH. —The %THRUcolumn is a number that indicates the percentage ofmessage data that is received error-free. thepercentage is found by comparing the number oferror-free message data frames with the total number of message data frames received.
CF. —This is a percentage of control code failures.A PU with strong signals that never misses a call willhave a 0 % code failure. A PU that never answers,such as a dummy PU, will have a 100 % code failure.
5 - 1 4

Figure 5-12.—The LMS-11 PU Display mode.
Values between 1 and 100 could be due to noise or PHASE ERR M. —This is the mean, or average,
weak equipment or an equipment malfunction.
BER. —This is the bit error rate measured as thenumber of bit errors per 1,000. Bit errors increase asthe signal-to-noise ratio decreases. A bit error ratethat exceeds a theoretical value for a given SNR isindicated by displaying both the BER and SNR inyellow.
REL 605. —This column indicates the relativepower of the 605-Hz tone with respect to the averagepower of the 15 data tones, measured in dB. It shouldbe +6 dB.
VAR DATA. —This is the variation of power inthe data tones in dB. The relative power of each ofthe data tones, with respect to the average power ofthe data tones, is determined. The variation is thedifference between the maximum and the minimum.Under ideal conditions, the variation is zero. TheTADIL A specification for maximum variation is 1.5dB.
phase error of the data tones. The intelligence-i sstored in the data tones by use of the phase differencesthat are odd multiples of 45 degrees. If the phasedifference of a data frame is 50 degrees when theexpected difference is 45 degrees, the error would be5 degrees. The phase errors for each tone are addedup, and after the specified number of cycles, the sumfor each tone is divided by the number of frames toobtain the mean phase error for each tone. The meanphase error for all 15 tones is then summed anddivided by 15 to obtain the value displayed.
PHASE ERROR SD. —This is the standarddeviation of the phase error in all 15 tones.
RFE/DS. —This is the radio frequency error, orDoppler shift, measured in Hertz. If the Dopplercor rec t ion was enab led dur ing the LMS-11initialization, the value is color-coded green. If theDoppler correction is turned off, this value is color-coded cyan.
NCT. —This is the net cycle time, as measuredfrom phase reference frame to-phase reference frame,
5-15

of the reporting unit. Note that this measure of netcycle time is different from that used in other NCTcalculations.
PU Display
The PU display shows detailed information aboutthe signal received from the specified PU. The PUdisplay can operate in broadcast, short broadcast, andRoll Call modes. In Broadcast and Short Broadcast,the display is updated after every transmission. InRoll Call mode, the display is updated after thespecified number of net cycles or 200 transmissions,whichever occurs first. When the net cycles are set tozero, the display updates immediately after thedesignated PU has transmitted. The PU display isshown in figure 5-12.
The PU display is activated when the operatorpresses the PU function key on the keyboard. Theinformation in the PU display is presented in two bargraphs with additional amplifying information justunder the bar graphs. In the PU display header, theoperator enters the address of NCS (or 77), theaddress of the unit to be evaluated, the sideband to beevaluated (USB, LSB, or DIV), and the number ofcycles to summarize for the display. The followingparagraphs describe the information presented in thePU display.
RELATIVE POWER (dB). —This bar graphdisplays the relative power in each of the Link-11tones. The relative power is calculated with respect tothe average of the data tones. The expected valuesshould be +6 dB for the 605-Hz tone (tone 5) and 0dB for the data tones. The TADIL A specificationsallow for a difference of 1.5 dB between themaximum and minimum power levels of the datatones. A noisy signal may cause the power levels ofthe data tones to deviate considerably from thestandard. The bar graph for relative power is alsocolor coded. When the relative power of a data toneis ±1 dB, the bar is green. If the power level is in therange of +1 to +2 dB or –1 to –2 dB, the bar will beyellow. The bar is red if the power level is greaterthan +2 dB or less than -2 dB. The length of the barsplotted on the graph is rounded off to the nearest 1/2dB.
PHASE ERROR (DEGREES). —The phaseerror (degrees) bar graph shows the mean and thestandard deviation of the Link-11 tones. The standarddeviation of a tone is plotted by a color bar on thegraph. The size of the color bars is plotted to thenearest whole degree of deviation. The meandeviation of the tone is indicated by a small whiteline, usually in the center of the standard deviationcolor bar. The mean phase error should fall between+45 degrees and -45 degrees. If the data is bad, themean phase error is set to -45 degrees and thestandard deviation is set to 90 degrees. This causesthe bar to be drawn across both quadrants of thegraph.
The standard deviation is represented by a color-coded bar for each tone. A green bar is displayed ifthe s tandard deviat ion is within 10 degrees.Deviations between 10 degrees and 20 degrees arerepresented by a yellow bar, and deviations greaterthan 20 degrees are red. The standard deviation mustbe a positive value that is less than 45 degrees. If thestandard deviation is out of range for a given tone, thedata is bad. This condition is indicated by theLMS-11 by setting the mean deviation to 45 degreesand the standard deviation to 90 degrees. As with themean deviation phase error, this causes the bar to bepainted in both quadrants of the graph.
Some causes o f phase e r ro r s a re no i se ,simultaneous transmissions, poor framing, and errorsin Doppler correction due to noise on the preamble.For example, a picket unit transmitting Net Syncduring Roll Call will cause an error condition. Theexpected value of the mean deviation is 0 degreeswith a standard deviation of ±5 degrees. If only onetone has a mean value that is greatly different from theother tones, it may be an indication of a frequencyerror on that tone.
SIGNAL POWER. —The signal power is part ofthe amplifying information under the two bar graphs.The signal power is the total signal strength in the 16tones. It is measured in dBm. If no signal is received,the default value of -51 dBm is listed.
SNR. —This is the signal-to-noise ratio. It ismeasured in dB and calculated as the ratio of the
5-16

average power in the data tones to the average powerin the noise tones. If the SNR value is preceded bythe symbol “>,” it indicates that the average power inthe noise tones is below the measurable threshold andthe actual SNR is greater than the value indicated.The maximum value that the LMS-11 can measure isabout 34 dB. An SNR that is greater than 30 dB isexcellent. If the SNR is less than 10 dB, the data isunusable.
BER. —This is the bit error rate per thousand.The incidence of bit errors increases as the signal-to-noise ratio decreases.
MISSED CODES PERCENTAGE. —This is apercentage of each type of code that is missed. Thenumber of codes (start, stop, and address call-ups)missed and received is tabulated and the percentage ofeach type missed is calculated.
FRAMES. —This is the total number of dataframes received, including the phase reference andcontrol code frames.
CS. —This field displays the carrier suppressionvalue of the upper and lower sidebands as a ratio ofthe power in the 605-Hz to the power of the carrierfrequency. The value display is measured in dB.
RFE/DS. —The radio frequency error or Dopplershift of the received signal in Hertz. The display iscolor-coded cyan if frequency correction was disabledduring LMS-11 initialization.
Spectrum Display
The spectrum display graphically shows the powerlevels of all the Link-11 tones and the noise tones thatare the odd harmonics of 55 Hertz. The spectrumdisplay screen is shown in figure 5-13. The x-axis ofthe bar graph is numbered from 1 to 30 to represent 30tones. Tone 05 is the 605-Hz Doppler tone. Tones 8through 21 and tone 26 are the data tones. Theremaining tones are not used by the Link-11 systembut are sampled and displayed to give the operator anindication of the noise level.
The y-axis of the bar graph displays the relativepower of each tone in dB. The highest value of thescale is 0 dB and decreases to -40 dB. The tone withthe greatest amount of power is set to 0 dB on thescale. This should be the 605-Hz tone. Theremaining tones are measured relative to the tone withthe greatest power. A single blue line is drawnhorizontally across the screen at the -6 dB level.Ideally, all data tones should extend up to this line.
The 605-Hz tone and the data tones are displayedby solid green vertical lines. If the power of a datatone is greater than -6 dB with respect to the 605-Hztone, the area above the -6 dB line is indicated by anopen yellow bar on top of the green bar. If the powerlevel of a data tone is below the -6 dB threshold, anopen yellow bar is used to fill in the remainingdistance. This allows the operator to view the effectsof the noise. The power of the noise tones is alsoindicated by open yellow bars.
To enter the spectrum display, depress the SPECTkey on the keyboard. Several options are available tothe operator by entering data into the header fields ofthe spectrum display. The operator may designate theaddress of the NCS. The default address is 77. Theoperator can also select a particular sideband (USB,LSB, or DIV) for display. By using the RESTRICTfield, the operator can restrict the display to only dataframes or only preamble frames, or choose norestrictions. The PU field allows the operator todesignate a particular PU for display. If 00 is enteredinto the PU field, then the data display is continuouslyupdated with samples from the entire net.
Carrier Suppression Display
The carrier suppression display measures howsuccessfully the carrier frequency is suppressed. Thecarrier suppression measurements can only be madeduring Net Sync. To measure the carrier suppression,the radio must be off-tuned by -500 Hz for the uppersideband and +500 Hz for the lower sideband. Thisoff-tuning allows the program to measure andcompare the relative power of the carrier frequencyand the 605-Hz tone of the preamble.
5-17

Figure 5-13.—The Spectrum Display screen of the LMS-11.
RECOGNIZING LINK-11 NET PROBLEMS
The LMS-11 is very useful in evaluating Link-11net quality. As you have seen, the various on-linemodes can help you determine various problems.These include a station that is consistently missingcall-ups, poor signal-to-noise ratio, and low powerfrom a unit. Some common Link-11 problems and theLMS-11 display are covered in the next fewparagraphs.
Figure 5-14 shows an example of how a PU notresponding to call-ups would appear on the LMS-11operating in the Link Monitor mode. When a PU doesnot respond to a call-up, the reason may be that theincorrect PU number was entered at the NCS or at theDTS of the unit. It can also be caused by a poorreceiver at the PU, causing the PU to not receive itscall-up. A third problem could be a weak transmitterat the PU, causing the NCS to not receive the responseand therefore, repelling the PU.
Figure 5-14.—A PU not responding to NCS call-up.
Figure 5-15 shows the display that appears whena PU is responding to NCS call-ups, but the reportcontains no data. Causes of this problem could be theKG-40 has an alarm, the CDS program is down, or theproblem is in the CDS computer to DTS patching.
Figure 5-15.—A PU responding with no data.
When NCS fails to receive a stop code from a PU,it causes a stoppage of the net, as shown in figure5-16. If this condition occurs repeatedly and can betraced to a single PU, the NCS should delete the PUuntil the stop code problem in the DTS is corrected.
5-18

Figure 5-16.—A net stoppage caused by NCS not receivinga stop code.
Figure 5-17 shows several PUs not responding tocall-ups. Some of the causes for this condition couldbe the following: NCS having an incorrect PUaddress entered in the DTS, low transmitter power outfrom NCS, an excessively noisy frequency, or weakPU receivers.
Figure 5-17.—Several PUs not responding to NCS call-ups.
The LMS-11 also has several off-line modes thatallow you to save data onto a disk and analyze thedata in detail. The off-line modes include a frame-by-frame display to analyze each frame of a transmission.This allows you to analyze the data of a particular PUand shows the status of each bit position. Rememberthat when you are doing a frame-by-frame analysis,the data has not been decrypted.
More information on all modes of the LMS-11 canbe found the System Operation and MaintenanceInstructions, Organization Level, Link MonitorSystem AN/TSQ-162(V)1, EE-190-AB-OMI-010/TSQ-162(V)1.
5-19
